Embed Size (px)
Citation preview

EPILEPSY SEIZURE DETECTION
USING WAVELET SUPPORT VECTOR
MACHINE CLASSIFIER
Prabhpreet Kaur Bhatia Anurag Sharma
[email protected] [email protected]
Abstract:
Epilepsy is a perilous neurological disease covering about 4-5% of total population of the world. Its main
characteristics are seizures which occur due to certain disturbance in brain function. During epileptic
seizures the patient is unaware of their physical as well as mental condition and hence physical injury
may occur. Proper health care must be provided to the patients and this can be achieved only if the
seizures are detected correctly in time. In this dissertation work, a system is designed using wavelet
decomposition method and different training algorithms to train the neural network for classification of
the EEG signals. The system was tested and compared with Support Vector Machine (SVM) classifier.
The system accuracy comes out to be 99.97%.
Keywords: Electroencephalogram, Epilepsy, Wavelet Transform, Energy Distribution, Neural Network.
1. INTRODUCTION
After stroke, epilepsy is the second most common neurological disorder affecting approximately 4-5% of the
world’s population [1], [2], [3]. Epilepsy is a neurological anarchy manifest by impulsive intermittent episodes
of sensory commotion. Persistent, uncontrolled, spastic seizure activities are the main characteristics of epilepsy.
It is the result of a sudden disturbance of brain function and These are mainly result of certain unwanted and
asynchronous firing in cerebral neurons.
The medical condition of epilepsy is as old as human existence [3]. There have been many strategies to detect
such firing or seizure activities in the brain. Electro-Encephalo-Gram (EEG) is the most common technique for
detection of these electrical activities [18]. It is a non-invasive technique used to acquire electrical impulses
travelling through scalp. Although there are certain techniques for continuous detection of these seizures such as
Epilepsy Monitoring Unit (EMU), electro cardio graph, accelerometry and electro dermal systems but these are
very costly and time consuming method and hence not much preferred.
Even though anti-epileptic drugs have been helped many patients but roughly one-third of them are
unresponsive to those too [4]. So, researchers and doctors came together to find such a elucidation which can
1

help both doctors and patients to perceive as well as help to envisage seizures even before they occur. This can
be done on an account of the brain areas involved during seizures.
EEG is one of the most common means used for detection of these seizures in humans. EEG is very informative
and easy to access clinical tool to evaluate human brain activities. Though time domain recognition is also
possible for EEG analysis but it is inadequate which results in the intercession of some automation and
computer techniques for this purpose.
Many applications have been developed regarding analyses and classification of electrical activities of the brain.
The working models or applications involve various complex methods such as signals acquirement, pre-
processing of that acquired signal, decomposition of the EEG signal and then the classification of the extracted
features. Many models are in existence for detection of seizures.
Leach et.al.[5] used three different protocols for acquisition of EEG signals: r-EEG, after sleep deprivation
EEG, and after oral temazepam and concluded that sleep deprived EEG is much suitable in case of seizures. The
author concluded that sleep deprived EEG have better sensitivity and it is better than those of r-EEG and DI-
EEG. Shoeb et.al.,[6] used wavelet decomposition method with support vector machine as a classifier and
spatial distribution method is also used in their model. Their system detected 131 out of 139 EEG signals but
also declared 17 false detections. Rosso et.al.[7] proposed a system which used wavelet energy and wavelet
entropy for the analysis of EEG using classifiers based on Shannon and Trellis code tree. The authors also
reviewed that quantifiers based on wavelet decomposition tools and also self organized rate is triggered by
epileptic focus.
Srinivasan et.al.[8] proposed a model using Elman network, recurrent neural network. The network used both
time and frequency domain features of EEG signals and it was concluded that result obtained by this network
with single input were much higher than that using multiple inputs. Srinivasan et.al. [9] designed a system that
used approximate entropy as an input feature and neural network classifier is used for classification purpose.
Zandi et.al.[10] designed a wavelet based system which used moving window analysis. G.Chen [11] used dual
tree complex wavelet-fourier features. The author demonstrated an EEG seizure detection method by using the
dual-tree complex wavelet fourier features. EEG database from the University of Bonn was used to test the
system.
Shoeb et.al. [12] proposed a system that used machine learning approach for patient specific classifier that
detect onset of epileptic seizures. Omerhodzic et.al.[17] proposed an algorithm for classification of EEG signal
based on. DWT used with the MRA is applied to decompose EEG signal at resolution levels of the components
of the EEG signal then feed forward neural network is used for classification according to the percentage
distribution of energy features and their results shows that the proposed classifier has the capability to recognize
and classify EEG signals correctly.
This paper is an extension of [17] and also presents a novel approach for classification of EEG signals of
epileptic and healthy subjects. The decomposition of EEG signals has been done with the help of debauches five
decomposition technique (db5) and dissimilar parameters such as energy distribution, current gradient are
2

detected. The support artificial neural network has been used for classification of signals with different training
algorithms and their regression and overall accuracy is compared accordingly.
This paper is organized as follow. The brief introduction and related literature survey has be covered in Section
I. Section II of the paper includes the proposed methodology. The simulation setup and results are given in
Section III. In Section IV, conclusion of the paper is given.
1.1 EEG Signals:
EEG signal acquisition is the most important and most informative tool used these days due to its advantages
over other acquisition techniques [13]. The electrical activities of the cerebral neurons spread throughout the
head. These electrical signals also reach the scalp and can be easily detected by electroencephalogram (EEG) by
placing the electrodes over the scalp in 10-20 International system of electrodes placement recognized all over
the world. The EEG shows patterns of normal or abnormal brain electrical activity. Some anomalous patterns
may occur with a number of unlike conditions.
EEG signals can be categorized into different frequency bands according to their frequency such as alpha (α),
beta (β), gamma (γ), delta (δ) and theta (θ). Table I gives a brief description of these frequency bands [14].
1.2 International 10-20 System
This system of electrode placement is a recognized system which describes the location of electrodes to be
placed over the scalp for the acquisition of the EEG signals. Figure 1 depicts the different points for the location
of the electrodes. The numeric ‘10’ and ‘20’ are written which means the electrodes must be placed either 10-
20% of the total front-back or right-left distance of the human skull.
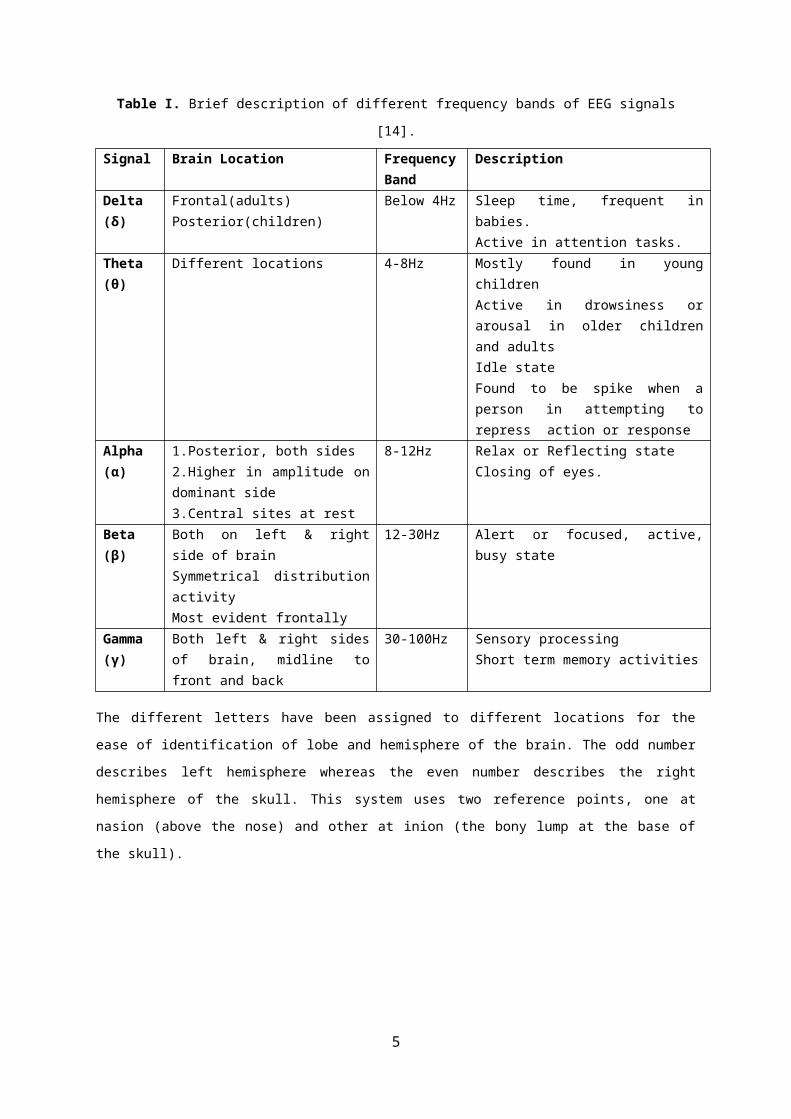
Table I. Brief description of different frequency bands of EEG signals [14].
Signal Brain Location Frequency Band
Description
Delta (δ) Frontal(adults)Posterior(children)
Below 4Hz Sleep time, frequent in babies.Active in attention tasks.
Theta (θ) Different locations 4-8Hz Mostly found in young childrenActive in drowsiness or arousal in older children and adultsIdle stateFound to be spike when a person in attempting to repress action or response
Alpha (α) 1.Posterior, both sides2.Higher in amplitude on dominant side3.Central sites at rest
8-12Hz Relax or Reflecting stateClosing of eyes.
Beta (β) Both on left & right side of brainSymmetrical distribution activityMost evident frontally
12-30Hz Alert or focused, active, busy state
Gamma (γ)
Both left & right sides of brain, midline to front and back
30-100Hz Sensory processingShort term memory activities
The different letters have been assigned to different locations for the ease of identification of lobe and
hemisphere of the brain. The odd number describes left hemisphere whereas the even number describes the right
3

hemisphere of the skull. This system uses two reference points, one at nasion (above the nose) and other at inion
(the bony lump at the base of the skull).
Figure 1. International 10-20 system for electrode placement over scalp.
1.3 Wavelet Transform
The decomposition of the signals can be done with different decomposition techniques according to the type of
the signal, stationary or non-stationary signal. If the signal does not vary much with respect to time that is if the
signal seems to be ideal over long period of the time then it is said to be stationary signal and if it varies with
respect to time it is referred as non-stationary signal [15]. For stationary signals Fourier transform is the
generalized technique being used for decomposition. But it is not suitable for signals like EEG signals as it is a
non-stationary signal. EEG signals contain a number of non-stationary characteristics. Its decomposition can be
done using wavelet decomposition method. Figure 2 views the wavelet decomposition tree of EEG signal. The
signals are passed through low-pass and high-pass filters for decomposition and the filter outputs are decimated
by the factor of two to obtain approximated (A1) and detailed (D1) coefficients. Further, approximated
coefficients are sent to next stage for repetition of the procedure and it is carried out repeatedly till the signal is
decomposed at desired level.
Figure 2. Wavelet Decomposition Tree [15].
4
In wavelet transform, decomposition is done on the basis of time-scale as well as frequency-scale and further
compression of the signal is also done. Wavelet transform uses a mother wavelet to derive its different sets of
wavelet functions.
1.3.1 Wavelet Families
There exist different wavelet families, daubechies (db), coiflets (coif), symlets (sym), biorthogonal (bior), which
are described briefly in Table II.
Table II. Different wavelet familiesWavelet Families Wavelets
Daubechies db1 or haar, db2,db3……db45
Coiflets coif1, coif2, coif3, coif4, coif5
Symlets sym2, sym3, sym4,…….sym45
Biorthogonal 'bior1.1', 'bior1.3', 'bior1.5' 'bior2.2', 'bior2.4', 'bior2.6',
'bior2.8' 'bior3.1', 'bior3.3', 'bior3.5', 'bior3.7' 'bior3.9'
The decomposition matrices L and H are given as:
LN/2,N= [ l(1) l (0) …l(3) l (2) l(1)
0 l(L−1) …
0l(0)l(0)]
HN/2,N= [h(1) h(0) …h(3) h(2) h(1)
0 h(H−1) …
0h(0)h(0)]
Also the initial signal ‘x’ is decomposed into two sequences h = Hx and l = Lx after passing it through high-pass
and low-pass filters respectively and hence their components are saved in h and l respectively. Then the
coefficients are chosen which are used as feature vectors.
1.4 Energy Distribution
Energy distribution (EDi) of the decomposed EEG signals is identified using Parseval’s Theorem. The theorem
states that energy of the deformed signal can also be partitioned at different resolution levels, i.e.,
EDi = ∑j=1
N
|Dij|2, i=1,2 ,…., l ………. (i)
EAl = ∑j=1
N
|A lj|2
………. (ii)
where l is the level of decomposition of the signal [17] and ED i represents the energy distribution of the detailed
coefficients at different decomposition levels and EAl represents the energy distribution of approximated
coefficients.
5

1.5 Artificial Neural Networks
Artificial neural network is a mathematical tool that mimics some functional aspects of a biological neuron
network. It consists of groups of interconnected artificial neurons. The low-level executions of cerebral neurons
are replicated by cells and their networks depicting exact functioning synthetically is done using artificial neural
networks.
The different neural networks have different learning algorithms and architectures. They also vary
fundamentally in the way they learn or work. The most frequently used training algorithm in classification is
back propagation algorithm which uses supervised learning technique. The main aim of this algorithm is to
reduce errors and train the network continuously until it learns the data. One iteration of this algorithm can be
written as XK+1 = XK αK gk, where XK is a vector of current weights and biases, gK is current gradient and αK is
learning rate of the network.
1.6 Support Vector Machine
It is another technique used for classification and regression. SVM was first heard in 1992, introduced by Boser,
Guyon, and Vapnik in COLT-92 [18]. SVMs are a set of related supervised learning methods used for
classification and regression. They belong to a family of generalized linear classifiers. It mainly uses machine
learning theory to maximize the accuracy of predicting the result by avoiding the over-fitting of the data.
SVM selects the hyper planes that maximize the margin, i.e. the distance between the nearest training samples
and the hyper planes [20]. The basis of SVM is to map data into a high dimensional space and fins a separating
hyper-plane with the maximal margin according to Cover’s theorem on the separablity of patterns. SVM has
been used to classify feature vectors for binary [21] and multiclass problems [22]. It has also been successfully
used in a large number of synchronous HMIs. Such a classifier is regarded as a linear classifier, since it uses one
or several hyper planes. Nevertheless, it is also possible to create a SVM with non-linear decision boundary by
means of a kernel function K(x,y). Non-linear SVM leads to a more flexible decision boundary in data space
which may increase classification accuracy. For example figure 3 shows two groups of data and separating
hyper planes that are lines in a two dimensional space. There are many linear classifiers that correctly classify
the two groups of data such as l1, l2 and l3.
6

EEG ACQUISITION OF HEALTHY & EPILETIC SUBJECTS
PRE-PROCESSING/DE-NOISING OF SIGNALS
FEATURE EXTRACTION USING WAVELET TRANSFORM
ENERGY DISTRIBUTION OF DECOMPOSED SIGNALS
CLASSIFICATION USING DIFFERENT ANN
Figure 3. Support Vector Machine
2. METHODOLOGY
The algorithm block diagram for the proposed system is shown in figure 4. It is divided into three main stages:
acquisition stage, feature extraction stage and the classification stage.
In data acquisition stage, the brain electrical impulses are detected by placing electrodes on scalp. The head box
used in acquisition may also perform noise reduction; the pre-processing stage prepares the signals in a suitable
type of signal so that it can be further processed in desired form. The feature extraction stage maps the pre-
processed signals onto a vector which contains effectual and discriminant features. The last stage, i.e., the
classification stage uses the feature vectors and arrange them in different classes as per desired by the system.
Figure 4. Algorithm for the proposed system
3. METHODS
3.1 Participants
30 healthy subjects and 30 epileptic patients participated in this study. The ethical statement was taken before
acquiring the signals. Their vision was normal or corrected to normal vision. The age ranged from 21 years to 28
years, with a mean of 23.65 years. No one of them was naive to the BCI equipment and paradigm. EEG was
recorded in relaxed state continuously for 4 minutes. Each session contains 20 trials. Subjects were required to
maintain full visual concentration
3.2 Apparatus
RMS EEG-32 Super Spec system was used to extract EEG signals of different subject. The system ensures high
resolution, authentic data acquisition through its software and head-box. This system includes the head-box, the
adapter, the connecting cables, the electrodes and PC as shown in figure 6.
The head-box is used for connecting electrodes from the scalp to the hardware unit. The signal generated is
amplified and then sent to adapter box for signal conditioning. The digital signal generated is then displayed on
Super Spec software designed for EEG signals.
7

EEG Acquisition Pre-Processing Feature Extraction Energy Distribution
ClassificationUSERUSER
Figure 5. Block diagram of the proposed system.
The head box minimizes noise pickups. The total integration of analog and digital processing in compact head
box gives excellent signal to noise ratio. It can acquire simultaneously 32 channel raw data and also checks true
AC impedance online. The brain mapping colour coding can also be done with the head box as per international
standard.
Figure 6. Experimental Setup for EEG Acquisition.
4. RESULTS AND DISCUSSION
Wavelet transform uses a mother wavelet to derive its different sets of wavelet functions. This system used db5.
Figure 7 shows the decomposition of EEG signals of normal patients whereas figure 8 shows decomposition of
epileptic EEG signal. In this figure detail coefficients are represented as D1, D2, D3, D4, D5 and the
approximated coefficient is represented as A5.
The energy distribution for each set of input signals i.e. for epilepsy patients and for healthy subjects are shown
in figure 8 and figure 9 respectively. It can easily be recognized that the energy distribution of normal/healthy
subjects in D3 and D4 (beta, alpha) are approximately equal and its total value is around 30% and that of
epilepsy patients is approximately 50%.
8
SUBJECT
HEADBOX
ELECTRODES
PC
ADAPTER

Figure 7. Decomposition of EEG signals of normal patients.
The energy distribution of D5 (theta) of normal patients is approximately 20% and that of epilepsy patients is
above 40%. It can also be seen that A5 (delta) energy distribution of epilepsy patients is less as compared to that
of normal patients. Table III shows the average values of detailed energy coefficients and approximated energy
coefficients for both healthy as well as epilepsy subjects.
Table III. Average energy distribution of decomposed and approximated coefficients.
Average energy Distribution of Normal Subjects Average energy Distribution of Epilepsy Subjects
EA5 47.68686 EA5 63.84576
ED1 0.11135 ED1 0.166008
ED2 4.025968 ED2 1.484796
ED3 17.19991 ED3 9.093766
ED4 20.48524 ED4 11.16387
ED5 10.49068 ED5 8.854353
9

Figure 8. Decomposition of EEG signals of epileptic patients.
These energy distribution percentages can easily be used as classifier inputs for classification of these EEG
signals. Six dimensional feature sets for training and testing data were constructed based on these energy
distribution percentages.
The total size of training or that of testing data is 6 X 300. These vector inputs are applied to the neural network
as input vectors. We used different training algorithms to test our neural networks such as Levenberg-Marquardt
Algorithm, Bayesian Regularization Algorithm and One Step Secant Algorithm.
Figure 9. Energy Distribution of Decomposed Signals for Epilepsy Patients.
Figure 10. Energy Distribution of Decomposed Signals for Healthy Subjects.
4.1 Results with different training algorithms
10

The system design and parameters used while testing input vectors with Levenberg-Marquardt Algorithm are
given in Table VI. The overall regression or accuracy of the system when feed forward algorithm used is 93.9%.
The training, testing and the overall regression is shown in figure 11.
Table IV. Training Parameters of Feed Forward Back Propagation Algorithm.
Architecture Parameters
Number of Layers 3
Number of Neurons on layers INPUT: 6, HIDDEN: 5, OUTPUT: 1
Initial Weights and Biases Random
Learning Rule Levenberg-Marquardt Algorithm
Mean-Squared Error 1e-01
Figure 11. Regression Plot of the system using Levenberg-Marquardt Algorithm.
5. CONCLUSION
Epilepsy is a perilous neurological disease covering about 4-5% of total population of the world. Its main
characteristics are seizures which occur due to certain disturbance in brain function. EEG is the technique used
in this paper to acquire the brain signals of both epileptic and healthy persons. As EEG signals are non-
stationary signals so wavelet decomposition technique is preferred to decompose these signals and the energy
distribution of decomposed signals are considered for the classification of EEG signals. For classification, the
neural network system was tested with different training algorithms such as Levenberg-Marquardt Algorithm.
The results showed that when Levenberg-Marquardt training algorithm was used the accuracy comes out to be
93.9% which is better than other training algorithms. Further, the same inputs were applied to support vector
machine classifier and the results obtained were 99.97%.
REFERENCES
11

[1] Labat R. Traité akkadien de diagnostics et pronostics médicaux. Paris/ Leiden: Académie Internationale
d’Histoire des Sciences/Brill; pp. 80–1, 188–99, 1951.
[2] Longrigg J. , “Epilepsy in ancient Greek medicine: the vital step”, Epilepsy & Behavior Journal, pp 12–21,
2000.
[3] E. Magiorkinis, K. Sidiropoulou, and A. Diamantis, “Hallmarks in the history of epilepsy: Epilepsy in
antiquity,” Epilepsy Behav., Vol. 17, No. 1, pp. 103–108, 2010.
[4] S.Garg, R.Narvey, “Denoising and Feature Extraction of EEG Signal Using Wavelet Transform”,
International Jouranl of Engineering, Science & Technology, Vol. 5, pp: 1249-1253, 2013.
[5] J. Leach, L.Stephen, C. Selveta, M.Brodie, “Which EEG for Epilepsy? The relative usefullness of different
EEG protocols in patients with possible epilepsy.”, International Neuro Neurosurg Psychiatry, pp 1040-1042,
2006.
[6] A. Shoeb, H. Edwards, J. Connolly, B. Bourgeois, S. Ted Treves, and J. Guttag, “Patient-specific seizure
onset detection,” Epilepsy Behav., vol. 5, no. 4, pp. 483–498, 2004.
[7] O. a. Rosso, M. T. Martin, a. Figliola, K. Keller, and a. Plastino, “EEG analysis using wavelet-based
information tools,” J. Neurosci. Methods, vol. 153, no. 2, pp. 163–182, 2006.
[8] V. Srinivasan, C. Eswaran, and A. N. Sriraam, “Artificial neural network based epileptic detection using
time-domain and frequency-domain features,” J. Med. Syst., vol. 29, no. 6, pp. 647–660, 2005.
[9] V. Srinivasan, C. Eswaran, and N. Sriraam, “Approximate entropy-based epileptic EEG detection using
artificial neural networks,” IEEE Trans. Inf. Technol. Biomed., vol. 11, no. 3, pp. 288–295, 2007.
[10] A. S. Zandi, G. a Dumont, M. Javidan, R. Tafreshi, B. a MacLeod, C. R. Ries, and E. Puil, “A novel
wavelet-based index to detect epileptic seizures using scalp EEG signals.,” Conf. Proc. IEEE Eng. Med. Biol.
Soc., vol. 2008, no. 2, pp. 919–922, 2008.
[11] G. Chen, “Automatic EEG seizure detection using dual-tree complex wavelet-Fourier features,” Expert
Syst. Appl., vol. 41, no. 5, pp. 2391–2394, 2014.
[12] A. Shoeb and J. Guttag, “Application of Machine Learning To Epileptic Seizure Detection,” Proc. 27th Int.
Conf. Mach. Learn., pp. 975–982, 2010.
[13] P. Bhatia and A. Sharma, “Different Techniques for Extracting Brain Signals for Human Machine Interface
, a Review,” Australian Journal of Information Technology and Communication, Vol. II, No. II, pp. 31–34,
2015.
[14] S.Garg, R.Narvey, “Denoising and Feature Extraction of EEG Signal Using Wavelet Transform”,
International Jouranl of Engineering, Science & Technology, Vol. 5, pp: 1249-1253, 2013.
[15] G. Kaushik, H. P. Sinha, and L. Dewan, “Biomedical Signals Analysis by Dwt Signal Denoising with
Neural Networks,” vol. 3, no. 1, pp. 1–18, 2013.
[16] I. Omerhodzic, S. Avdakovic, A. Nuhanovic, K. Dizdarevic. "Energy distribution of EEG signals: EEG
signal wavelet-neural network classifier." arXiv preprint arXiv:1307.7897, 2013.
[17] P. K. Bhatia, A. Sharma, H. Kumar, “A Comparative Approach to Feature Extraction Techniques for
Human Computer Data Acquisition Pre-Processing Feature Control Interference.”, 4th International Conference
on Wireless Networks and Embedded Systems : An approach to Clean and Sustainable Technology(WECON-
2015), 2015.
12

[18] M. Sharanreddy, “Brain Tumor Epilepsy Seizure Identification using Multi- Wavelet Transform , Neural
Network and Clinical Diagnosis Data,” Vol. 67, No. 2, pp. 10–17, 2013
13