Embed Size (px)
Citation preview
Do White In-Group Processes Matter, Too? White Racial Identity and Support for Black Political Candidates
Gregory A. PetrowUniversity of Nebraska Omaha
John TransueUniversity of Illinois Springfield
Timothy VercellottiWestern New England University
Keywords: vote choice, white racial identity, prejudice, racial resentment, Barack Obama, race and elections
Scholars find that negative evaluations of blacks lead whites to vote against black political candidates. However, can an in-group psychological process have the same effect? We consider white racial identity to be a strong candidate for such a process. We argue that the mere presence of a black candidate cues the identity, reducing support for these candidates among whites. We test this hypothesis on vote choice in seven instances. Five of them involve simple vote choice models: the 2008 and 2012 Presidential elections, and three elections in 2010: The Massachusetts Gubernatorial election, black candidates for the U.S. House, and black candidates for the U.S. Senate. The other two are tests of the notion that white racial identity reduced President Obama’s approval, thus reducing support for all Democratic Congressional candidates in the 2010 Midterm and 2012 Congressional elections. We find support for these notions in all seven cases, across these seven elections, using four different survey research datasets, and four different measures of white identity. Comparisons with other presidential elections show that white identity did not significantly affect mono-racial elections. Furthermore, we find the white identity and racial resentment results to be very similar in terms of their robustness and apparent effect sizes. This indicates in-group evaluations, and those that focus on out-groups, operate independently of one another.
1

2
Whether or not race-related feelings and beliefs cost black candidates the
votes of whites in U.S. elections is a very important question for political behavior
scholars. Most blacks are the descendants of slaves, and the legacy of slavery
continues, as blacks suffer in comparison to whites in most of the ways the two
racial groups can be compared (see Kinder and Dale-Riddle 2012 for a summary).
A political avenue by which blacks may redress this inequality is by electing other
blacks to office; that is, if the white majority will elect them. Of significant
concern is that most of the progress blacks have made since the 1960s in holding
public office has been in majority-minority contexts. While blacks are 12% of the
U.S. population, they only hold 2% of all elected offices (e.g. Kinder and Dale-
Riddle 2012).
The academic study of white racial prejudice and voting is expanding
quickly. This literature can be divided into two eras: the pre-Obama era, and the
post-Obama era. Before the election of President Obama, there were relatively
few studies of this question, and they tended to yield mixed results. Some
scholars found that whites were not reluctant to vote for black candidates
(Bullock 2000, Citrin, Green and Sears 1990, Highton 2004, Voss and Lublin
2001), while others found they were reluctant (Bullock and Dunn 1999, Gay 1997,
Reeves 1997, Terkildsen 1993). The election of President Obama has generated
more interest in this question. Most scholars find that he did lose support among
whites due to racial factors, or racial prejudice (Tesler and Sears 2010; Highton
2011; Jackman and Vavreck 2010; Lewis-Beck, Tien and Nadeau 2010, Pasek et
al. 2009; Piston 2010; Redlawsk, Tolbert and Franko 2010; Schaffner 2011; and,
3

Stephens-Davidowitz 2011). Only a few scholars do not reject the null hypothesis
(e.g. Martinez and Craig 2010).
In these studies what motivates white voters to oppose black candidates is
either negative attitudes toward the outgroup, or negative out-group evaluations
compared to positive in-group evaluations (such as Piston (2010) finding that
when whites hold more positive attitudes toward whites relative to blacks, they
voted against Obama). The focus on negative attitudes means that there has been
less scholarly work on in-group processes. We pose the question – can an in-
group identification produce the same result? Do whites oppose black
candidates, simply because they favor their own group?
Social identity theorists argue that the power of group identity stems from
individuals extending their sense of self to include others (e.g. Brewer and
Gardner 1996; Tajfel 1982). Consequently, this sense of “we-ness” leads
individuals to benefit the self by favoring their in-groups. White racial identity is
a strong candidate for such an in-group factor. White racial identity is a social
identity. Social identity is the sense we have that there are others like us, with
whom we share a collective fortune, because of a common group membership
(e.g. Brewer 2007, Brewer and Gardner 1996; Conover 1984; Huddy 2013).
There has been only one previous study of the relationship between white
racial identity and vote choice. In her dissertation, Ashley Jardina (2014) finds
that white racial identity leads whites to vote against President Barack Obama in
2012. However, we expand the analysis to the 2008 election, and we also test to
see how white identity may matter in the mono-racial elections between 1984 and
4

2000. Our analysis includes variation in what we claim activates white racial
identity: a black candidate running against a white one.
How White Racial Identities come to be Politically Consequential
Most group and social identities are politically inconsequential –they do not
affect political attitudes or behaviors. Racial identity can only affect vote choice if
it becomes politically consequential. How does a group identity become
politically consequential? The first condition for individuals is that group
identifiers must belong to the group they identify with (Conover 1984, 1988).
Second, a substantial share of the group identifiers must identify with the group
strongly.1 This is caused by a variety of factors.2 Those with strong identities
perceive greater threat to their group (Huddy 2013). Threat can be in the form of
perceived economic or symbolic interests. These interests are usually threatened
in the form of losses – a group is losing compared to where it used to be, or is
losing in comparison to other groups. These “loses” can be symbolic, or economic
(Huddy 2013). These threat attitudes are concentrated among the people who
1 This leads to, among other things, perceived shared fate with the group, with
people believing that the experiences of other group members also affect them.
2 For example, people who belong to high-status groups tend to have stronger
group identities because the group identity increases self-esteem. Huddy (2013,
39) applies social identity theory to politics and writes, “There is evidence that
ethnic identity is more strongly developed among members of objectively
identified, higher status groups and among individuals who perceive their group
as holding higher societal status.”
5
strongly identify with their group. Some experiments show that when identity is
cued, the common fate perception increases (Huddy 2013). Third, the group
needs to be a social one – that is, a group that is generally salient to the society
(e.g. race or gender, as opposed to belonging to something like a bowling league).
Finally, among the stronger identifiers, the identity has political meaning.
Referring to these criteria, the major racial and ethnic groups (e.g. whites,
blacks and Latinos) are widely salient in society. The result is that those with
certain skin complexions will be regarded as “white,” leading some people to self-
identify with the racial group. But race is not only socially salient -- it is
politically salient as well. It is widely known that most racial minorities vote with
the Democratic Party and most whites vote with the Republican Party. This is an
indicator of a political system that is generally racialized, such that the majority
of whites endorse one set of interests, while the majority of minorities endorse a
competing set of interests.
Compared to the other racial and ethnic groups, whites claim the greatest
perceived social status (Sidanius and Pratto 1999). Social identity theory predicts
that this creates a powerful incentive for many whites to identify strongly with
their group. People are more likely to identify with groups that the society
values, because doing so increases people’s sense of self-esteem. No racial group
in the U.S. is as valued as whites, with many even equating “white” and
“American” as equivalent (Devos and Banaji 2005; Theiss-Morse 2009).
Strong identities lead people to be on the look-out for threats to their group
(e.g. Huddy 2013). As alluded to earlier, the threats can be in the form of
6

economic or even perceived cultural challenges. Therefore, strongly identifying
whites will perceive racial threat from blacks because of the contentious racial
history. The history of race in the U.S., and especially the legacy of slavery, leads
to blacks serving as whites’ competitive out-group (e.g. Ignatiev 1995; Key 1949;
Roediger 2007; Tocqueville 1841). Indeed, policies that benefit blacks are seen
by whites as hurting whites (Kinder and Sanders 1996). Electing African
Americans to public office can be seen as a threat to whites because public
officials make decisions regarding how to distribute public goods. In addition,
electing blacks to public office is a sign that stigma against them is decreasing,
creating a relative sense of the loss of white cultural advantage.
The theoretical conceptualizations of white racial identity are varied. In
psychology, many models regard them as existing in various stages or phases
(e.g. Helms 1990). All of the models conceive of identity strength varying from
weak to strong, but separating the different identity types are the meanings that
the individuals ascribe to their racial group memberships. For example, while
some white identifiers may recognize their racial group’s privileged position (thus
holding liberal racial views), others may believe that whites compete against
racial minorities on an uneven playing field which is pitched against them (Goren
and Plaut 2012).
Setting these different views of identity aside, scholars find that in general,
whites with stronger racial identities hold more racially conservative attitudes
(e.g. anti-black affect and feelings).3 However, while these studies generally
3 The studies we cite in this paragraph go well beyond simply correlating white
7

reach this conclusion, the vast majority of them are conducted using convenience
samples, limiting their generalizability to any populations (Arriola and Cole 2001;
Branscombe, Schmitt and Schiffhauer 2007; Carter 1990; Carter, Helms and Juby
2004; Chow, Lowery and Knowles 2008; Croll 2007; Goren and Plaut 2012: Helms
1990; Knowles, Lowery, Schulman and Schaumberg 2013; Knowles and Lowery
2012; Knowles, Lowery, Unzueta, Knowles and Goff 2006; Levin, Sidanius,
Rabinowitz and Federico 1998; Lowery, Chow and Unzueta 2014; Lowery,
Knowles and Unzueta 2007; Lowery, Chow, Knowles and Unzueta 2012; Mack et
al. 2002; Morrison, Plaut and Ybarra 2010; Pope-Davis and Ottavi 1994). A few
are conducted using random samples (Citrin and Sears 2014; Hutchings et al.
2011; Levin and Sidanius 1999; Sears and Henry 2005; Sears and Savalei 2006).
These particular studies produce mixed evidence in support of white identity
affecting racial attitudes.
Other scholars find even less evidence that white racial identity influences
contemporary American politics. Because whites are the dominant racial group,
and most whites live in racially segregated, majority-white settings, white racial
racial identity with racial attitudes. The social psychology studies, in particular,
carefully consider the links between white racial identity and a wide array of
attitudes and feelings that are hypothesized to be related to it. Using
experiments, scholars establish the causal role of white racial identity and how it
relates to attitudes regarding collective fate, racial affect, and even white
privilege. White racial identity constitutes a collective psychological construct
independent of, though causally related to, attitudes toward racial out-groups.
8

meaning may be “hidden” (Doane 2005). Scholars find that most whites do not
rank their racial identities as being important to their sense of self (Jaret and
Reitzes 1999). Wong and Cho (2005) find limited effects for white identity on
racial policy preferences. Citrin, Green, and Sears (1990, 76) show that the
presence of a black candidate is not sufficient to activate all aspects of group
conflict. Instead, “…the personal attributes of the black candidate and the
electoral context do condition the reaction of white voters.” There is only one
previous test of the relationship between white racial identity and vote choice
(Jardina 2014).
Activating White Racial Identity
White racial identity may be salient in two ways. The first is a kind of
chronic salience, whereby it always affects whites’ political behaviors in elections
involving the major two party candidates. In this way it would operate like party
identification or ideology – it generally affects vote choice, regardless of the
contextual aspects of elections. However, theories of social identity emphasize
how the cueing or priming of identity is important (see Huddy 2013 for a
thorough review of the literature). In other words, the identity may not be
chronically salient, but only salient when it is cued or primed by something in the
environment. When the identity is cued or activated, the associated attitudes and
feelings become salient and affect behaviors and attitudes. In other words, group
identity is dynamic because its salience and meaning vary depending upon
people’s environments. White racial identity may only affect white political
behavior in some elections, but not others.
9

Political scientists have long considered that black elected officials can cue
racial thinking for whites (e.g. Hajnal 2001, Bobo and Gilliam 1990, Gay 2001,
Reeves 1997). Cueing an identity can activate a reflex to differentiate the self
from the out-group. There are two aspects to this differentiation: notions of how
the individual is similar to the in-group and different from the out-group (e.g.
Brewer and Gardner 1996). A salient identity makes the aspects of the self that
an individual shares with group members the most cognitively accessible, with
individuals also comparing their personal and group characteristics to out-groups
to bolster their positive in-group evaluations (Brewer and Gardner 1996; Tajfel
1982). As blacks increasingly compete for and are elected to positions as chief
executives, in particular, such elections may serve as the strongest politicized
racial cues because the elections are high-stimulus in nature. Electing the first
black President of the United States may be the most potent politicized racial cue
of all – so potent, in fact, as to constitute its own kind of racial conditioning of the
political system.
In addition to the cue provided by the skin color of black politicians, when
those politicians run for election or re-election, their campaigns often result in
more racial campaign messages, which serve as a kind of double-cue of racial
thinking (Levy et al. 2010; McIlwain and Caliendo 2011). Remembering that
identity has different meanings depending on specific cues and contexts, black
candidates and black elected officials will cue the explicitly political meanings of
individuals’ white racial identities. These candidates and elected officials
represent the explicitly political agendas of these groups, as well as potent
10

symbols of group status. Electing a black candidate is an implicit step in raising
the status of the group. As evidence of this cueing, Petrow (2010) finds that
whites who endorse white identity are more likely to vote in Congressional
districts with black candidates than in other Congressional districts. Also, Kinder
and Dale-Riddle (2012) argue that a black candidate sends a cue that is so simple
and so clear that its effect on elections is inevitable.
Partisan and ideological associations with white racial identity are
important components of the explicitly political meanings to the white electorate.
Since the passage of the civil rights agenda in the 1960s, the political parties’
positions on race have become distinct to Americans (Carmines and Stimson
1981; 1986; Green, Palmquist and Schickler 2002). This distinction has
transformed the Republican Party into the home for many whites who hold anti-
black attitudes and affect (Valentino and Sears 2005). This leads to the prediction
that black Democrats will cue more of a sense of racial threat than white
Democrats, or even black Republicans, because white voters could believe that
black Democrats are the greatest threat to white interests. Some scholars (Edsall
and Edsall 1992; Ellis and Stimson 2012; Kellstedt 2003; Carmines and Stimson
1989) claim that the degree to which white Americans see the Democratic Party
as favoring blacks over whites means that the Democratic Party has been
racialized. Based on the existing literature, we test three hypotheses about the
effect of white identity on vote choice in elections.
H0: Null. Past investigations and theorizing have found no effect of white
identification on vote choice, approval, and/or similar attitudinal variables.
11

The null hypothesis simply states that the strength of white identity does
not affect vote choice or presidential approval under any conditions.
H1: Racialization of the Democratic Party. Identifying more strongly with
whites will diminish support for Democratic presidential and Congressional
candidates on average.
H2: Candidate activation. When a white candidate runs against an African-
American, white identity influences whites' vote choice.
We proffer one additional hypothesis. Scholars find that Presidential
approval affects voting for Congress (e.g. Campbell 1993). We hypothesize that
white identity will reduce voting for President Obama, and the same logic leads us
to expect that the factor will reduce his approval evaluations. We thus predict
that white identity will lower his approval evaluations, and thus indirectly reduce
support for Congressional Democrats across the country.
H3: Indirect racialization. White identity reduces President Obama’s
approval, thus indirectly reducing support for Democratic candidates in
Congressional elections.
DATA AND METHODS
We test our hypotheses in five electoral contests: the 2008 and 2012
Presidential elections, the 2010 and 2012 Congressional elections, and the 2010
Massachusetts Gubernatorial election.4 For the 2008 election we analyze data
from the Cooperative Congressional Election Study (CCES; Ansolabehere 2008),
4 Our analyses are limited because the ANES in 2004 and 2008 lacked measures
of white identity.
12
for the 2010 and 2012 elections we use data from the American National Election
Study (ANES), and for the Massachusetts Gubernatorial election we use data from
the Massachusetts Statewide Survey (MSS) conducted by the Western New
England University Polling Institute. In 2008 Barack Obama ran for President as
the first black major party candidate in American history, and in 2012 he ran for
re-election. In 2010, Deval Patrick ran for re-election as governor of
Massachusetts after completing a term as the first black governor elected in that
state. In 2010, three African Americans ran for U.S. Senate seats in the general
election, all as Democrats: Kendrick Meek in Florida, Alvin Greene in South
Carolina, and Mike Thurmond in Georgia (they all lost). In addition, 41 blacks ran
for the U.S. House and were elected as voting members (two additional members
were non-voting delegates, and all but two voting members were Democrats;
Dade 2011). Finally, Barack Obama served as President during the 2010 and
2012 Congressional elections, leading us to believe that white identity could
affect his Presidential approval. Since Presidential approval is a powerful
determinant of Congressional voting in midterm Congressional elections (Tufte
1975), we test for the indirect effect of white identity impacting President
Obama’s approval and indirectly affecting congressional vote choice, thus
racializing Congressional election outcomes in the U.S. in 2010 and 2012 on
average.
In Appendix A we report the question wording for our respective measures
of white racial identity (both the exact question wordings and resulting
histograms), as well as methodological details for the surveys. Theory predicts
13

that in addition to vote choice, our measures of white identity should predict
related constructs. We estimate bi-variate relationships with these constructs in
the spirit of demonstrating this construct validity. Specifically, theory predicts
that white identity correlates with: Positive white stereotypes over blacks, feeling
less close to blacks, having warmer feelings for whites, and colder feelings for
blacks and Latinos. The ANES and CCES datasets also include some other
constructs that should correlate with white identity as well, and so we include
them in the analyses too (unfortunately, the MSS data lack the measures we need
to test for construct validity). We find that for these two datasets the measures of
white identity meet the criteria of construct validity, and we report the results of
the tests in Appendix B.
RESULTS
Vote Choice Models
We hypothesize that white identity directly costs black candidates votes,
and also, that it does so in Congressional elections by reducing Presidential
approval. We begin with the vote choice models. All analyses include only the
white respondents. We employ sample weights and clustered standard errors in
all models.5 We begin by reviewing results for the relationships between white
identity and Presidential vote choice. The null hypothesis predicts that white
5 Each table describes what levels of aggregation the standard errors are adjusted
for. For all models, the tolerance test produced statistics of .2 and above for all
independent variables, indicating little multicollinearity threat. For a further
discussion of the methodological details, see Appendix A.
14

identity will never lead whites to vote against Democrats for President, hypothesis
one predicts white identity will always lead whites to oppose Democrats for
President, and hypothesis two predicts it will when the Democrats run a black
candidate for President. To review the results we turn to Table 1. As with this
and all subsequent tables, we report only the most analytically important
coefficients here, and the complete tables in Appendix C.
15

Table 1. White Racial Identity among Whites and Democratic Presidential Vote Choice in 1984 thru 2000 and 2008 thru 2012: Logistic Regressions
1984 1988 1992 1996 2000 2008 2012Mondale v.
ReaganDukakis v. GHW Bush
Clinton v. GHW Bush
Clinton v. Dole
Gore v. GW Bush
Obama v. McCain
Obama v. Romney
White Identity -.04 (.19)
-.08 (.21)
.10 (.25)
-.16 (.32)
-.13 (.34)
-.55* (.26)
-.16** (.06)
Racial controlsRacial Resentment
Not available
-.07* (.03)
-.36* (.17)
Not available
-.28 (.32)
-.69* (.30)
-.45** (.17)
Intercept 4.96** (.96)
2.48* (1.01)
5.61** (1.49)
.49 (1.44)
4.24* (1.84)
10.89** (2.69)
5.37** (1.32)
Pseudo-R2 .51 .47 .56 .58 .61 .78 .71N 1024 994 930 587 764 526 2478Bivariate White Identity coefficient
-.02(.13)
-.29* (.14)
-.04 (.17)
-.45**(.14)
-.25(.19)
-.21*(.08)
-.09** (.03)
*p<.05, **p<.01See Appendix C for full coefficient reportAll dependent variables coded as 2 party vote1984 to 2000: Analysis of American National Election Study data. The white identity measure is the dichotomous “Feel close to Whites” measure.2008: Cooperative Congressional Election Study Data. See Appendix A for white identity wording.2012: American National Election Study data. See Appendix A for white identity wording.1984 standard errors clustered on counties; 1988 and 1992 on census tracts; 1996 and 2000 counties; 2008 and 2012 Congressional DistrictsStarting with 1992, all models employ sample weightsControl variables in all models: Party identification, ideological identification, economic evaluations, gender, education, income, age, church attendance, and region (Deep South) Control variables in all models but 2008: Egalitarianism and limited government.Control variables in 2008 only: Support withdrawing from Iraq and a carbon tax.Control variable in 2012 only: Oppose Health Care Reform Act
16

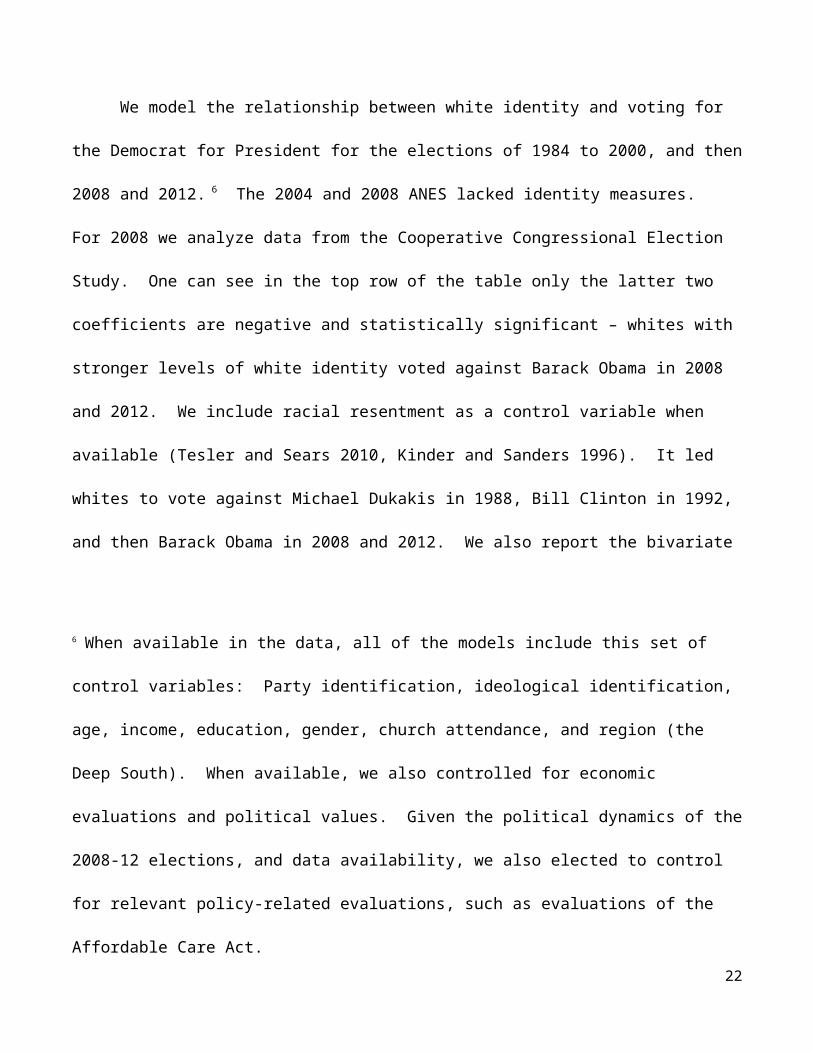
We model the relationship between white identity and voting for the
Democrat for President for the elections of 1984 to 2000, and then 2008 and
2012. 6 The 2004 and 2008 ANES lacked identity measures. For 2008 we analyze
data from the Cooperative Congressional Election Study. One can see in the top
row of the table only the latter two coefficients are negative and statistically
significant – whites with stronger levels of white identity voted against Barack
Obama in 2008 and 2012. We include racial resentment as a control variable
when available (Tesler and Sears 2010, Kinder and Sanders 1996). It led whites
to vote against Michael Dukakis in 1988, Bill Clinton in 1992, and then Barack
Obama in 2008 and 2012. We also report the bivariate coefficients between white
identity and vote choice for comparison purposes.
We plot the white identity coefficients (from the full models) and their
corresponding 95% confidence intervals in Figure 1. One can see that before
2008, the coefficients centered around zero, and had very wide confidence
intervals. However, in 2008 and 2012, the coefficients center below zero, and the
confidence intervals stop before reaching the zero point, which reflects statistical
6 When available in the data, all of the models include this set of control variables:
Party identification, ideological identification, age, income, education, gender,
church attendance, and region (the Deep South). When available, we also
controlled for economic evaluations and political values. Given the political
dynamics of the 2008-12 elections, and data availability, we also elected to
control for relevant policy-related evaluations, such as evaluations of the
Affordable Care Act.
17

confidence that these results hold for the population. In other words, the hyper-
racialized thesis does not hold, as white identity only correlates with vote choice
when Barack Obama is the candidate. The null hypothesis does not hold as well.
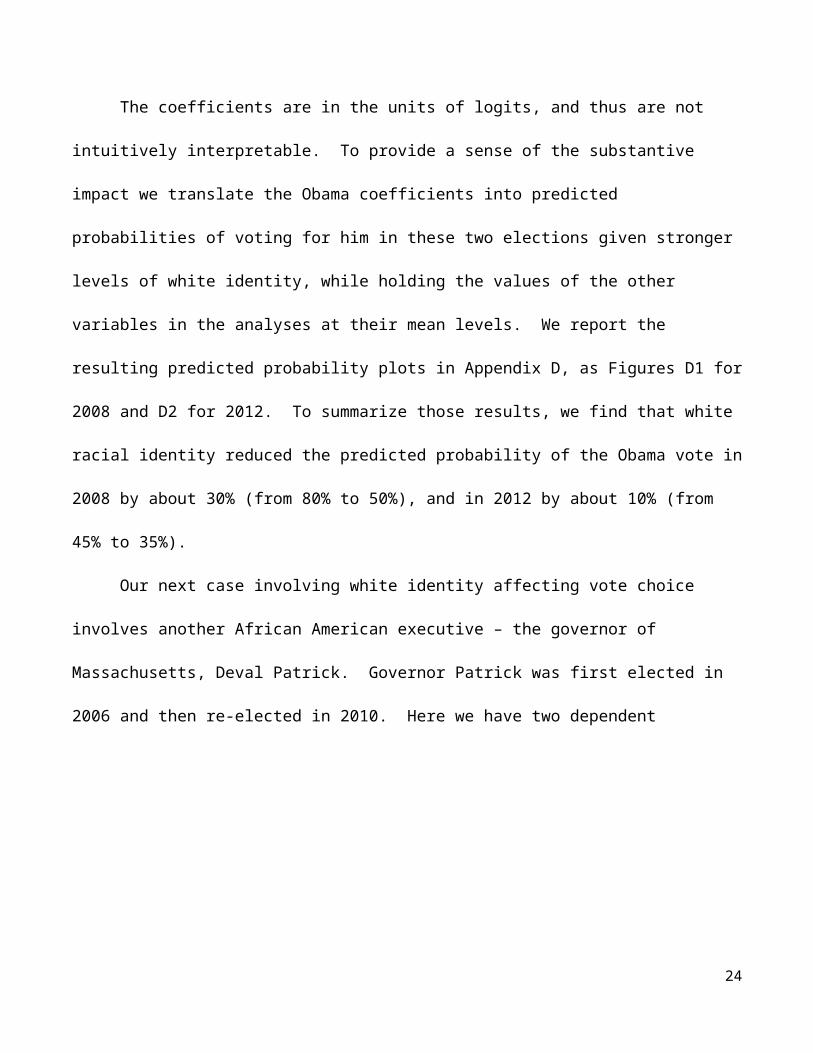
The coefficients are in the units of logits, and thus are not intuitively
interpretable. To provide a sense of the substantive impact we translate the
Obama coefficients into predicted probabilities of voting for him in these two
elections given stronger levels of white identity, while holding the values of the
other variables in the analyses at their mean levels. We report the resulting
predicted probability plots in Appendix D, as Figures D1 for 2008 and D2 for
2012. To summarize those results, we find that white racial identity reduced the
predicted probability of the Obama vote in 2008 by about 30% (from 80% to 50%),
and in 2012 by about 10% (from 45% to 35%).
Our next case involving white identity affecting vote choice involves another
African American executive – the governor of Massachusetts, Deval Patrick.
18

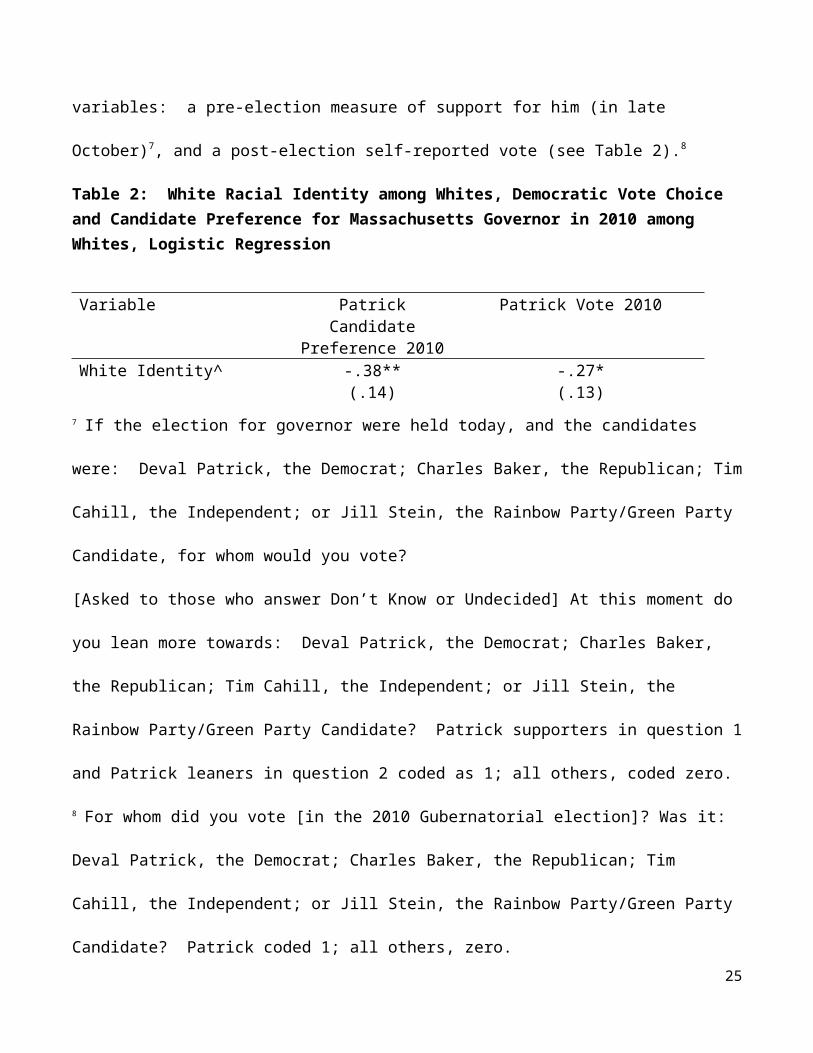
Governor Patrick was first elected in 2006 and then re-elected in 2010. Here we
have two dependent variables: a pre-election measure of support for him (in late
October)7, and a post-election self-reported vote (see Table 2).8
Table 2: White Racial Identity among Whites, Democratic Vote Choice and Candidate Preference for Massachusetts Governor in 2010 among Whites, Logistic Regression
Variable Patrick Candidate Preference 2010
Patrick Vote 2010
White Identity^ -.38** (.14)
-.27* (.13)
Intercept^ -.26 (.77)
.77 (1.51)
N^ 390 204Pseudo R2 .42 .47Bivariate White Identity -.17* -.15
7 If the election for governor were held today, and the candidates were: Deval
Patrick, the Democrat; Charles Baker, the Republican; Tim Cahill, the
Independent; or Jill Stein, the Rainbow Party/Green Party Candidate, for whom
would you vote?
[Asked to those who answer Don’t Know or Undecided] At this moment do you
lean more towards: Deval Patrick, the Democrat; Charles Baker, the Republican;
Tim Cahill, the Independent; or Jill Stein, the Rainbow Party/Green Party
Candidate? Patrick supporters in question 1 and Patrick leaners in question 2
coded as 1; all others, coded zero.
8 For whom did you vote [in the 2010 Gubernatorial election]? Was it: Deval
Patrick, the Democrat; Charles Baker, the Republican; Tim Cahill, the
Independent; or Jill Stein, the Rainbow Party/Green Party Candidate? Patrick
coded 1; all others, zero.
19

coefficient (.08) (.09)**p<.01, *p<.05Data source: 2010 Massachusetts State Survey.See Appendix C for full coefficient reportResults incorporate sample weights for gender, age, and race.Models cluster standard errors on counties.^Control variables in these two models: Massachusetts right direction, party identification, education, income, female and age.
The survey interviewers at Western New England University who conducted
the Massachusetts State Survey re-interviewed more than 200 of the respondents
from the pre-election survey to ask them whom they actually voted for (the white
identity measure is from wave 1). This allows us to analyze both the pre-election
candidate preference (from wave one), as well as the self-reported vote choice
(from wave two). In both cases, stronger white identity predicts opposition to
Governor Patrick. In the last row of the table we report the bivariate coefficient
for comparison purposes.
To assess the substantive magnitudes of these relationships, we estimate
how the predicted probabilities of Patrick’s pre-election support and Election Day
vote choice share vary according to stronger levels of white racial identity. When
estimating this relationship, we hold the other variables in the analysis constant
at their means. We find that moving from the weakest level of white identity to
the strongest reduces Patrick’s support by about 15% on both measures. Because
half of all respondents chose the strongest white identity category, this
represents a meaningful reduce in his electoral support. We display these results
visually in Appendix D, Figure D3.
20

We now turn to an analysis of voting for Congress in the 2010 midterm
elections. We consider elections for the U.S. Congress in which black candidates
oppose white ones. In Table 3 we report results from the 2010 Congressional
elections. We begin with white voters in states with black U.S. Senate candidates
(South Carolina, Georgia and Florida). All black candidates were also Democrats,
and the dependent variable is respondents’ self-report of supporting the
Democratic candidate for U.S. Senate in an October pre-election survey
conducted by the ANES. In columns one and two, we include a term for the
interaction between the three states with U.S. Senate contests featuring black
candidates and white racial identity. The results are collinear, and so we mean-
center the interaction components to reduce collinearity (e.g. Jaccard and Turrisi
2003).9 In the first column the model includes only the three variables of interest
–white identity, black U.S. Senate candidates, and the interaction. However, the
second column reports the model we are the most interested in, because that
model includes a bevy of control variables. We expect the interaction coefficients
to be negative. We find that they are. Compared to elections without black
candidates, and compared to elections with black candidates but where
9 Some scholars find that centering items at their means before multiplying them
together in an interaction is not an advantageous collinearity solution. However,
Paccagnella (2006) finds that in the specific case of cross-level interactions,
centering is a good solution. We of course estimate such an interaction here. Our
collinearity statistics indicate that the centering solved the collinearity problem.
21
respondents endorse the lowest white identity category, whites with stronger
white identities will be more likely to oppose black candidates.
Table 3: White Racial Identity among Whites and 2010 U.S. Congress Candidate Preference among Whites, Logistic Regression Variable Democratic
U.S. Senate Candidate Preference
Democratic U.S. Senate Candidate Preference
^
Democratic U.S. House
Candidate Preference
Democratic U.S. House Candidate
Preference^
U.S. Congress InteractionsWhite Identity X Black U.S. Democratic Congressional candidate
-1.17* (.49)
-1.37**(.47)
-2.60*(1.22)
-2.34** (.86)
Interaction Effect ComponentsBlack Democratic U.S. Congressional candidate
-.32 (.32)
2.08* (1.04)
1.63* (.64)
2.18** (.63)
White Identity -.29 (.20)
.00 (.22)
-.34 (.18)
-.04 (.25)
Political PredispositionsDemocratic Party ID
.46** (.10)
.64** (.10)
Liberal Ideology ID .23 (.17)
.13 (.15)
Racial Resentment -.01 (.05)
.01 (.04)
Intercept -.02 (.16)
.59 (2.37)
-.19*(.08)
-.53 (1.46)
N 596 581 790 771Pseudo R2 .02 .50 .01 .50
**p<.01 two tailed test, *p<.05 two tailed testData source: 2010 ANES. Results incorporate ANES sample weight.See Appendix C for full coefficient reportU.S. Senate models cluster standard errors on States, U.S. House models cluster standard errors on Congressional Districts.All interaction terms centered at 0 to reduce collinearity.
22

^Control variables: Presidential approval, economic stimulus evaluations, Democratic legislative agenda evaluations, education, income, gender, region (South), church attendance and age.U.S. Senate elections, all three black candidates were DemocratsU.S. House elections, 16 major party candidates were black, 14 of them
Democrats
We perform similar analyses for U.S. House elections in 2010. We find that
the two interactions between white identity and black U.S. House candidates are
also negative and statistically significant. We plot the results from the table to
see how the predicted probability of supporting black Democratic candidates
varies with levels of white identity (for the model including the control variables).
We set the other variables in the analyses to their means. We begin by plotting
the results from the U.S. Senate vote choice model. We use the second U.S.
Senate vote choice interaction term from Table 3 to plot the predicted probability
of voting for black Democratic U.S. Senate candidates. We then use the white
identity coefficient from the same table to plot how the predicted probability of
supporting non-black Democratic candidates for the U.S. Senate varies with levels
of white identity. This results in Figure 2.
23
For the black U.S. Senate candidates, the solid line with the negative slope
indicates that accompanying each stronger level of white identity is a statistically
significant decrease in support for black Democratic candidates compared to the
weakest category of white identity (feeling “not at all” close to whites). In
elections with black U.S. Senate candidates, white identity appears to reduce the
predicted probability of supporting such candidates by about 60%. In contrast,
when Democratic candidates are not black, the line is flat and dotted, indicating
there are no statistically significant changes from the weakest category of white
identity to the strongest.10
10 The dotted flat line indicates that when Democratic U.S. Senate candidates were
not black, on average they received about 30% of the vote nationally. We note
that at the national level, Democrats regularly receive less than half of the vote
from whites, with supermajorities from non-whites generating the winning
margins when they sometimes occur.
24
As with the other analyses, we plotted the effect of white identity on the
predicted probability of supporting a Democratic candidate for the U.S. House,
for voters with both black and non-black major party candidates. This results in
Figure 3. We generate the results for this figure by holding all other variables at
their means. As with the U.S. Senate results, we represent the negative slope of
the predicted probability of support for black U.S. House candidates with a solid
line, indicating that the lower levels of white support, corresponding with
stronger levels of white identity, are statistically different from the weakest white
identity level. The predicted probability of supporting non-black U.S. House
Democratic candidates varies only slightly with stronger levels of white identity,
and we find no statistically significant differences, as reflected by the flat and
dotted line. Therefore we can reject the null hypothesis of no effect of white id,
and also hypothesis one, which claimed that higher white identification
diminishes support for all Democratic candidates. The evidence supports
hypothesis two – black candidates activate white racial identity among whites.
25

As with the results from 2008 and 2012 for the Obama vote, and 2010 for
the Patrick vote, we consider how the distribution of the white identity variable
could affect that variable’s contribution to the final election outcome. When
responding to this survey item, 55% of whites choose the two strongest white
identity categories. Similarly to the other operationalizations of white identity,
this measure reflects large numbers of whites’ willingness to claim a strong racial
identity, which then causes the identity to have a substantive effect on the final
vote outcome.
Presidential Approval as a Mediating Variable
Our previous results estimated the direct effect of white identity on vote
choice. However, a potent indirect effect exists as well – people’s approval levels
of the President affects whether or not they vote for the President’s party’s
candidates for Congress (e.g. Tufte 1975). Since we found that white identity led
26

whites to vote against Barack Obama, we test whether it also led them to approve
of him less. Given Kinder and Dale-Riddle’s (2012) and Tufte's (1975) claims, we
test whether white identity affected support for all Democratic Congressional
candidates across the country. Following the structure of our earlier analysis, we
begin by testing whether white identity affected Presidential approval of previous
Presidents. We run regressions in which Presidential approval is the dependent
variable, and we report our results in Table 4. If the racialization hypothesis
holds, we expect white identity will increase approval for Republican presidents,
and decrease it for Democratic presidents. Alternatively, if a black president
activates white identity, then we would expect to see that it only affects
Presidential approval when Barack Obama is President. In the last row of the
table we report the bivariate white identity coefficients for comparison purposes.
27
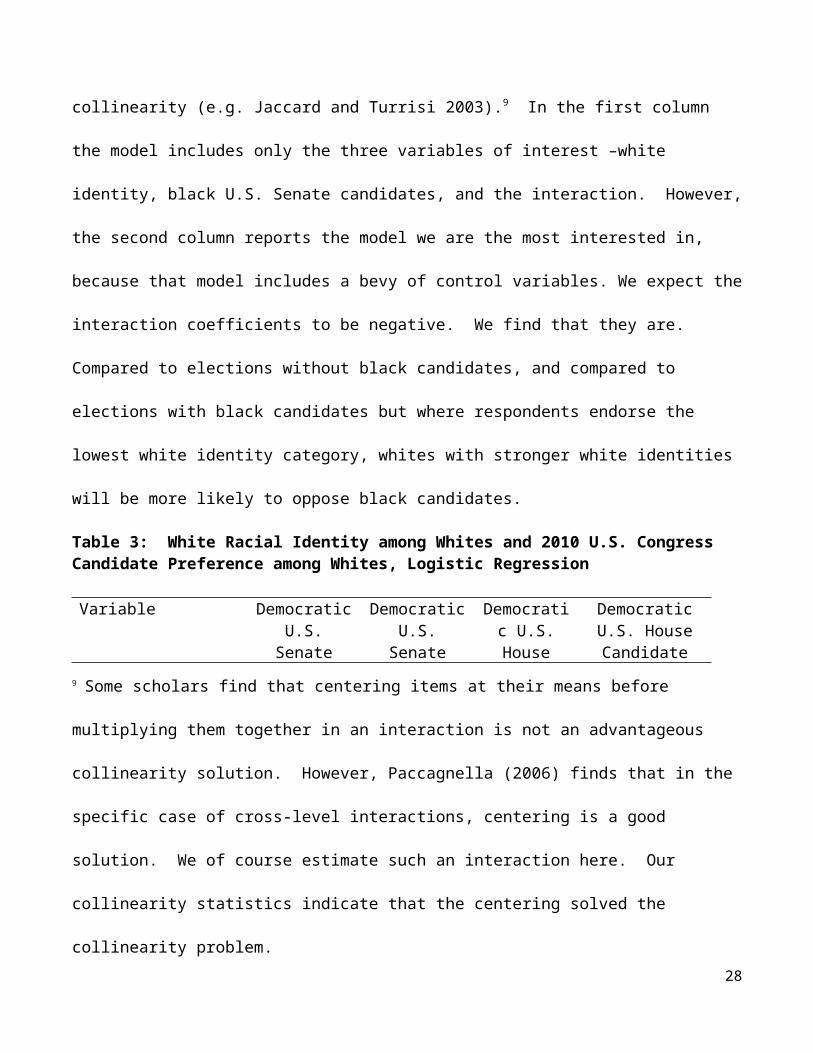
Table 4. White Racial Identity among Whites and Presidential Approval in 1984 thru 2000; 2008 thru 2012: OLS
1984 1988 1992 1996 2000 2008 2010 2012Ronald Reagan
Ronald Reagan
George HW Bush
Bill Clinton
Bill Clinton
George W Bush
Barack Obama
Barack Obama
White Identity -.04 (.06)
.01 (.07)
-.03 (.07)
.07 (.08)
.06* (.03)
-.04 (.06)
-.12** (.04)
-.04* (.02)
Racial Resentment
Not availabl
e
.02* (.01)
.08 (.04)
Not availabl
e
.01 (.03)
.08 (.05)
-.06* (.02)
-.08*(.03)
Intercept 1.14** (.29)
2.05** (.28)
.65 (.38)
2.32** (.48)
.56** (.14)
.24 (.40)
10.16** (.39)
3.85** (.31)
R2 .50 .37 .41 .57 .36 .55 .68 .68N 1490 1601 1513 691 1047 586 883 3176Bivariate White Identity coefficient
.06 (.08)
.22* (.09)
.07 (.09)
-.20(.10)
.02(.03)
.02(.05)
-.12** (.03)
-.07** (.02)
*p<.05, **p<.01See Appendix C for full coefficient reportAnalysis of American National Election Study data for all election years but 2008; and in 2008, the Cooperative Congressional Election Study. In the ANES before 2010, the white identity measure is the dichotomous “Feel close to Whites” measure. In the CCES and the ANES in 2010 and 2012, it is the ones we report in Appendix A.1984 standard errors clustered on counties; 1988 and 1992 on census tracts; 1996 and 2000 counties; 2008, 2010 and 2012 Congressional DistrictsStarting with 1992, all models employ sample weightsControl variables in all models: Party identification, ideological identification, economic evaluations, education, income, age, marital status, church attendance, region (South)Control variables in all models but 2008 and 2010: Egalitarianism and limited governmentControl variable in 2010 and 2012: Oppose Affordable Care ActControl variable in 2008 only: Support Iraq withdrawControl variables in 2010 only: Oppose Democratic legislative agenda and oppose the economic stimulus bill
28

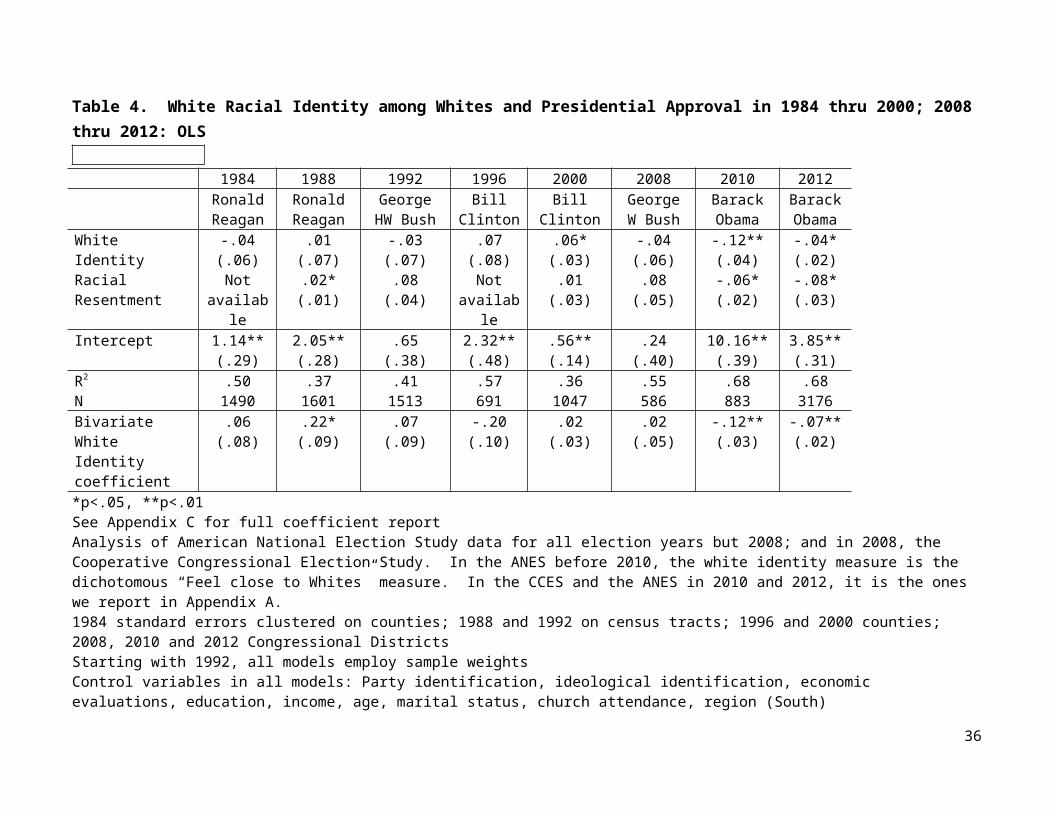
In this table we report predictors of Presidential approval for the election
years of 1984 through 2000, as well as 2008 to 2012. We do not report 2004
because the ANES dropped measures of identity in that survey. We find in the
top row of the table only one statistically significant result before 2010: In 2000,
whites with higher levels of white identity approved more of Bill Clinton. Given
our first hypothesis, we would expect the coefficient to be negative. However,
when Barack Obama is President in 2010 and 2012, the coefficient is negative and
statistically significant with a two-tailed test at the p<.01 level in 2010 and p<.05
level in 2012. We plot the coefficients and 95% confidence intervals from the fully
specified models in Figure 4.
We now consider the empirical implications for Congressional vote choice
when white identity reduces the Presidential approval of a black President. We
29
know from a vast trove of previous findings that Presidential approval affects
electoral support for the Congressional candidates from the President’s party
(e.g. Campbell 1993). One way to test this kind of mediating hypothesis is with a
Structural Equation Model (SEM) in which white identity affects approval in the
first stage of the model, approval affects vote choice in stage two, and an indirect
effect on electoral support for all Congressional Democratic candidates is
manifested through lower approval. This leads us to Table 5, in which we report
the results of four models. In the first two, we analyze 2010 ANES data, using the
October pre-election horserace question as the dependent variable. The first
column is for the U.S. House results, and the second for the U.S. Senate. In the
latter two columns we analyze the 2012 ANES data, using self-reported vote
choice as the dependent variables.
30

Table 5: Indirect Paths of White Racial Identity among Whites and White Candidate Preference for the U.S. Congress in 2010 and U.S. Congress Vote Choice in 2012, Structural Equation Models
Endogenous Variables Exogenous Variables
U.S. House 2010^
U.S. Senate 2010^
U.S. House 2012^
U.S. Senate 2012^
President Obama ApprovalWhite Identity -.12**
(.04)-.12** (04)
-.04** (.01)
-.05** (.02)
Racial Resentment -.06** (.02)
-.06** (.02)
-.09** (.03)
-.08** (.03)
R2 .68 .68 .68 .68Democratic Congressional Voting
President Obama Approval
.04** (.01)
.33** (.11)
1.00** (.18)
.51** (.08)
R2 .48 .61 .52 .69N 883 883 3,193 3,193
Indirect Paths to Democratic Congressional Voting thru Approval
White Identity
Racial Resentment
-.01*(.00)-.00* (.00)
-.04* (.02)-.02* (.01)
-.04** (.01)-.09** (.03)
-.02** (.01)-.04* (.02)
**p<.01, *p<.05^ 2010 results for October 2010 candidate preference; 2012 results for post-election vote choiceData sources: 2010 and 2012 ANESError terms of President Obama Approval and Democratic Congressional Voting correlated for all models but U.S. House 2010Results incorporate ANES sample weight.2010 models and 2012 U.S. House model cluster standard errors at the state level; 2012 U.S. Senate model clusters standard errors at the Congressional District level U.S. House Candidate Preference Model 2010: chi2 = 94.50 (p<.01) df=56, CFI = .78, TLI = .69, RMSEA = .028U.S. Senate Candidate Preference Model 2010: chi2 = 118.03 (p<.01) df=55, CFI = .64, TLI = .48, RMSEA = .036U.S. House Vote Choice Model 2012: chi2 = 376.81 (p<.01) df=102, CFI = .60, TLI = .47, RMSEA = .032U.S. Senate Vote Choice Model 2012: chi2 = 425.88 (p<.01) df=105, CFI = .48, TLI = .34, RMSEA = .031See Appendix C for tables with complete coefficient reports for control variables
31

In all four models we use SEMs to consider the indirect path of white
identity operating on Congressional vote choice, as mediated by Presidential
approval. In other words, we report results for two endogenous variables –
Presidential approval, and also Congressional vote choice. Both variables are
ordinal, so we use Mplus to adjust for the variables’ not being interval. We also
employ the ANES’ survey weights. We report the indirect effect coefficients at
the bottom of the table.
In the first row we report the coefficients for the effects of white identity on
presidential approval in 2010 and 2012, with coefficients estimated separately for
the Senate election models and the House election models. White identity
correlated negatively with President Obama’s approval in all four models, with
the coefficients statistically significant at the p<.01 level with a two tailed test.
We include racial resentment as a control variable, and it, too, correlates
negatively with the President’s approval.
We next consider how President Obama’s approval impacts voting in
Congressional elections. All four coefficients are substantively large and
statistically significant at the p<.01 level, indicating that in the Congressional
elections in both 2010 and 2012, people’s approval levels of the President were a
large force in determining which party to support in the election. At the bottom
of the table we find that in all four cases the indirect effect coefficients for white
identity on Democratic Congressional vote choice are all negative and statistically
significant at the p<.01 or p<.05 level with a two tailed test. We also present the
32

same indirect effects for racial resentment and find that they are generally of the
same magnitude, and also statistically significant in all four cases.
At the very bottom of the table we report model fit statistics. The root mean
square error of approximation (RMSEA) statistics all indicate that the models fit
the data well (an RMSEA of below .05 is considered good model fit; MacCallum,
Browne and Sugawara (1996)). We expect that the unexplained variance for
Presidential approval and Congressional vote choice will be correlated. We know
that Presidential approval and Congressional voting share a strong relationship,
and we acknowledge that even after modeling the causes of both, as we do here,
other factors probably remain unaccounted for by the model. Those factors are
manifest in the error terms for the two variables, and they should be related to
one another. Therefore, we correlate the errors of the two endogenous variables.
When we fail to do so, the model fit suffers in three of the four models. Please see
Appendix E where we describe the different model variations we estimated, and
where we also report the model fit statistics for the second-best fitting models
that we estimated.
The next results we report are for the magnitudes of the relationships
between white identity and support for Congressional Democrats. To present the
magnitudes of the results in a more accessible format, we plot how the predicted
averages of supporting Democratic U.S. House and Senate candidates in the
ANES 2010 pre-election survey, and the predicted vote choice in the ANES 2012
post-election survey, varied according to levels of white identity. Because the
pre-election Democratic candidate support variables are coded as 0 (supporting a
33

Republican or third party candidate) or 1 (supporting a Democrat), the average is
akin to a predicted probability of supporting the Democratic candidate. We
report this result as a range between 0 and 100 to ease interpretation. The
variance in support for these candidates, given levels of white identity, reflects
the indirect path of white identity on the election support, as mediated by
Presidential approval.11 These values are averaged over all of the other variables
in the models.
We report the resulting predicted probability plots in Appendix D, Figures
D4 (for 2010) and D5 (for 2012). In Appendix D we also include some text to
guide the interpretation of the figures. To summarize those results, we find that
in 2010 white identity reduced the predicted probability of supporting Democratic
U.S. House and Senate candidates by about 20% (from about 60% to 40%), and in
2012 by about 15% (from about 55% to 40%).
DISCUSSION AND CONCLUSION
There is little research on white identity and vote choice, and there is none
that tests for how variations in racial cues lead to its activation. There are studies
of how white racial identity relates to other constructs. Policy and/or social
attitudes—not vote choice—are the dependent variables in Wong (2010), Kinder
11 We estimated the models in Table 3 using Mplus. To estimate the predicted
averages, we took the coefficients for white identity and Presidential approval
from the Mplus output and fed them into Stata’s Structural Equation Model
program and then used the Predict command to generate the predicted score
averages and variances which we report here.
34

and Kam (2009), Citrin and Sears (2014), Wong and Cho (2005) and the
experiments reviewed in Hutchings and Jardina (2009). Vote choice is a
dependent variable in Tesler and Sears (2010) and Kinder and Dale-Riddle (2012),
but those authors do not test for the independent influence of in-group
identification except to the extent that their unidimensional scales (racial
resentment and ethnocentrism, respectively) pick it up. Jardina (2014, p 138 and
251) comes closest to our analyses. She tests for the influence of white identity
and controls for racial resentment. She also concludes that white in-group
identity affected vote choice in the 2012 presidential election. However, without
the replication of 2008 and the comparison to the mono-racial elections in the
1984 – 2000 elections, her vote choice analysis does not include variation in what
we claim activates white identity: a black candidate running against a white
candidate.
Thus, this study is the first to test for relationships between white racial
identity and vote choice across a range of elections. The central contribution of
this study is that white in-group evaluations lead whites to oppose black
candidates. White identity involves no explicit out-group evaluations at all. All of
the results we observe in this study, in which whites penalize black political
candidates, are due solely to whites’ affinity for their own group – their desire to
benefit their own group, without reference to any out-groups. This view
corresponds with the work of the psychologist Marilynn Brewer (1999) – in-group
“love” in and of itself can lead to out-group “hate.” To clarify both our meaning
and hers, “hate” involves the actions that the in-group takes against the out-
35
group. Previous scholars have found that negative feelings and attitudes toward
out-groups lead to acts against them, but Brewer (1999) argues that positive in-
group evaluations in and of themselves can lead to the same outcomes. Our
findings here support that view. This work builds on the work of scholars like
Sears and Tesler (2010) and Piston (2010) who find that negative evaluations of
other groups, vis-à-vis our positive evaluations of our own group, can lead whites
to vote against black candidates. Our work extends their analyses to an
additional causal process: in-group identity. The social identity literature shows
that in-group processes are distinct from out-group processes (Brewer 1999).
That is, there are two dimensions—attitudes toward the in-groups and attitudes
toward out-groups—rather than one dimension, where attachment to an in-group
can only mean greater distance from out-groups.
Our analyses show this empirically. Racial resentment and white in-group
identity have independent effects; they are not two ends of a single spectrum. In
1992 racial resentment is statistically significant in predicting voting against Bill
Clinton for President, but white identity is not. However in 2008 and 2012 white
identity is statistically significant and substantively important in the same
elections when racial resentment is also statistically significant. The magnitudes
of the results for the two factors are also comparable, and the white identity
results are at least as robust as the ones for racial resentment. 12 Racial
resentment tends to be a variable that deflates the impacts of other racial factors,
12 Both variables are coded between 0 and 1, and so the coefficients are
comparable.
36
but white in-group identity’s associations with voting in elections with black
candidates remains large and robust. This is evidence they are conceptually
distinct. Racial resentment is an attitude, which focuses on the out-group. White
racial identity correlates with racial resentment (as we report in Appendix B), but
it also leads to a whole constellation of beliefs about the in-group.
As with the effects of racial resentment on vote choice, black political
candidates cue (or activate) white racial identity (Kinder and Dale-Riddle 2012,
Jardina 2014). Tesler and Sears (2010), in their Table 3.1, statistically isolate the
effect of racial resentment from other elements of Presidential vote choice models
across several elections. They persuasively demonstrate that racial resentment
becomes more influential in contests involving Barack Obama. We find that while
white racial identity does not correlate with vote choice in most elections, it does
when black candidates are on the ballot. Obama's elections did activate white
racial identity. We find the most satisfying theoretical basis for this explanation
comes from Kinder and Dale-Riddle (2012, 25) when they write,
"In the short run, which aspects of identity and attitude become
important--which are activated--depend on political circumstances….
Even more effective is to embody membership, as Barack Obama
embodied race in 2008. … Whatever Obama said about society and
government and about problems and policies, at the end of the day,
every time American voters caught a glimpse of him, he was black."
Our analysis ends in 2012, but readers will likely wonder about its
applicability to 2016. We found that white identity affected support for
37

Congressional candidates even though President Obama was not a candidate in
those elections. Sides and Ferrell (2016) found that white racial identity
correlated with support for Donald Trump in the Republican primaries. This leads
us to wonder if white in-group identity’s influence will persist after President
Obama leaves office. Some analysts suggest that one reason for Donald Trump’s
victory is the activation of white in-group identity. However, the 2016 election is
confounded because while the election included both racial rhetoric and charges
of racism, it was also a referendum on a sitting black President. We do not know
whether white in-group identity can be activated by rhetoric only.
We tested four hypotheses for possible effects of white identity – white
identity would lead white voters to oppose all Democrats, no Democrats at all,
only when the identity was cued by a black candidate, or indirectly by lowering
President Obama’s approval. We estimated the effects of white identity on
Presidential vote choice and Presidential approval in Presidential elections going
back to Ronald Reagan’s re-election in 1984, and only for President Obama do we
find negative effects. This leads us to reject hypotheses zero (the null) and one
(white identity would lead whites to oppose all Democrats). We also find effects
for white identity on voting in Deval Patrick’s 2010 gubernatorial re-election
campaign in Massachusetts, and for U.S. Senate and U.S. House when candidates
are black. Hypothesis two thus stands – that black candidates cue the identity
and make it salient, causing white voting discrimination. Furthermore, we find
support for hypothesis three (the indirect effect on vote), because in 2010 and
2012 white identity apparently reduces President Obama’s approval, which then
38

indirectly reduces support for Democratic candidates in the Congressional
elections.
We note several limitations to these findings. First, the 2010 analyses rely
solely on pre-election candidate support measured in October. As a result, it is
possible that for the actual vote choice, the results may have been weaker.
However, we believe our interpretation is valid for several reasons. First, we
replicate the 2010 indirect effect of white identity on voting for Democratic
Congressional candidates using the 2012 data, which does involve vote choice.
Second, the pre-election candidate support in 2010 was measured less than a
month before the election, and so it is likely that the vast majority of voters had
already made up their minds as to whom they would vote for.
Second, in results we do not report here due to space limitations, the
correlations that we find between white identity and Congressional candidate
support in 2010 are not statistically significant in 2008 or 2012. We speculate
that in Presidential election years, the campaign and turnout stimulus of the
Presidential election swamps the effects of white identity on Congressional vote
choice (e.g. Campbell 1993). However, in midterm elections, in which
information about candidates is much less plentiful, a black candidate’s racial
group membership serves as a stronger cue. Or perhaps the effects of white
identity under a black President affect Congressional elections when the public
cannot vote on the President directly, but are focused on the President when he is
on the ballot.
39

Third, we find white identity correlates negatively with both pre-election
support for Deval Patrick, and also the vote choice, as reported by respondents
after the election. The vote choice result is especially notable given the small
sample size. Unfortunately, a full slate of control variables is not available in
those models; most importantly, the model lacks ideological identification and
racial resentment. While white racial identity is our only racial variable in the
models, the results are consistent with the results from the more complex models,
and so we have some confidence in the results.
A fourth limitation of the study is that the black Democrats running for the
U.S. Senate in 2010 were non-competitive candidates. Starting with Florida, that
Senate race featured a strong white Independent candidate, former Republican
Governor Charlie Crist, who opposed both Republican candidate Marco Rubio (of
Cuban-American descent) and Democratic candidate Kendrick Meek (who is
African-American). The Election Day vote shares were: Rubio with 49%, Crist
with 30%, and Meek with 20% (Federal Election Commission 2010). In the races
for U.S. Senate in Georgia and South Carolina, the margin of victory for the white
Republican candidate over the black Democratic candidate was 19 percentage
points in Georgia and 34 percentage points in South Carolina (Federal Election
Commission 2010). Because all three Senate races were non-competitive, then
the Senate results we find can only be generalized to non-competitive U.S. Senate
races with black Democratic candidates. However, we find apparent effects for
white identity in the Presidential elections of 2008 and 2012, and the
Massachusetts Gubernatorial election of 2010, and these elections were
40

competitive. Perhaps the apparent effect of white identity in U.S. Senate
elections with black Democratic candidates would be even stronger in competitive
elections.
WORKS CITED
American Association for Public Opinion Research. 2011. Standard Definitions:
Final Dispositions of Case Codes and Outcome Rates for Surveys. 7th
edition. AAPOR.
Ansolabehere, Stephen. 2008. Cooperative Congressional Election Study 2008.
[computer file] (Study Global ID hdl:1902.1/14003).
Arriola, Kimberly R. Jacob and Elizabeth R. Cole. 2001. “Framing the
Affirmative-Action Debate: Attitudes toward the Out-Group Members and
White Identity.” Journal of Applied Social Psychology 31(12): 2462-2483.
Barone, Michael and Chuck McCutcheon. 2011. The Almanac of American Politics
2012. Chicago: University of Chicago Press.
Bobo, Lawrence, and Gilliam, Franklin D. Jr. 1990. “Race, Sociopolitical
Participation, and Black Empowerment.” American Political Science Review
84(2):377-93.
Bollen, Kenneth A. 1989. Structural Equations with Latent Variables. New York:
Wiley.
Branscombe, Nyla R.. Michael T. Schmitt and Kristin Schiffhauer. 2007. “Racial
Attitudes in Response to Thoughts of White Privilege.” European Journal of
Social Psychology 37: 207-15.
41

Brewer, Marilynn B. 1999. “The Psychology of Prejudice: Ingroup Love or
Outgroup Hate?” Journal of Social Issues, 55(3): 429-44.
Brewer, Marilynn B. and Wendi Gardner. 1996. “Who is This ‘We’? Levels of
Collective Identity and Self Representations.” Journal of Personality and
Social Psychology 71(1):83-93.
Bullock, Charles S. III. 2000. “Partisan Changes in the Southern Congressional
Delegation and their Consequences.” in David W. Brady, John F. Cogan, and
Morris Fiorina (eds.), Continuity and Change in House Elections, pp. 39-64,
Stanford, CA: Stanford University Press.
Bullock, Charles S. III, and Richard E. Dunn. 1999. “The Demise of Racial
Redistricting and the Future of Black Representation.” Emory Law Journal
48: 1209-53.
Campbell, James. 1993. The Presidential Pulse of Congressional Elections.
University of Kentucky.
Carmines, Edward G. and James A. Stimson. 1989. Issue Evolution: Race and the
Transformation of American Politics. Princeton University Press.
Carmines, Edward G. and James A. Stimson. 1986. “On the Structure and
Sequence of Issue Evolution.” American Political Science Review 80(3): 901-
920.
Carmines, Edward G. and James A. Stimson. 1981. “Issue Evolution, Population
Replacement, and Normal Partisan Change.” American Political Science
Review. 71(1): 107-118.
42

Carter, Robert. 1990. “The Relationship between Racism and Racial Identity
Development among White Americans: An Exploratory Investigation.”
Journal of Counseling and Development 69: 46-50.
Carter, Robert, Janet E. Helms and Heather L. Juby. 2004. “The Relationship
between Racism and Racial Identity for White Americans: a Profile Analysis.”
Journal of Multicultural Counseling and Development 32 (January): 2-17.
Chow, Rosalind M., Brian S. Lowery and Eric D. Knowles. 2008. “The Two Faces
of Dominance: The Differential Effect of In-Group Superiority and Out-Group
Inferiority on Dominant-Group Identity and Group Esteem.” Journal of
Experimental Social Psychology 44: 1073-81.
Citrin, Jack and David O. Sears. 2014. American Identity and the Politics of
Multiculturalism. Cambridge University Press.
Citrin, Jack, Donald Phillip Green and David O. Sears. 1990. “White Reactions to
Black Candidates: When Does Race Matter?” The Public Opinion Quarterly
1(Spring): 74-96.
Coates, Ta-Nehisi. 2014. “Bill Clinton was Racialized, Too.” The Atlantic.
[http://www.theatlantic.com/politics/archive/2014/05/bill-clinton-was-
racialized-too/361764] (Accessed November 1, 2014.)
Congressional Black Caucus. 2012. “Directory.”
http://thecongressionalblackcaucus.com/members/directory/ (July 10, 2012).
Conover, Pamela Johnston. 1984. “The Influence of Group Identification on
Political Participation and Evaluation.” Journal of Politics 46(August): 760-
85.
43

Conover, Pamela Johnston. 1988. “The Role of Social Groups in Political
Thinking.” British Journal of Political Science 18 (January): 51-76.
Croll, Paul R. 2007 “Modeling Determinants of White Racial Identity: Results from
a New National Survey.” Social Forces 2 (December): 613-42.
Dade, Corey. 2011. “GOP's Rep. Allen West Draws Black Caucus Spotlight.”
January 5.
http://www.npr.org/blogs/itsallpolitics/2011/01/05/132680148/rep-allen-
west-draws-black-caucus-spotlight (July 10, 2012).
Devos, Thierry and Mahzarin R. Banaji. 2005. “American = White?” Journal of
Personality and Social Psychology 88(3): 447-66.
Doane, Ashley W. 2005. “Dominant Group Ethnic Identity in the United States.”
Sociological Quarterly 38(3): 375-97.
Edsall, Thomas Byrne and Mary D. Edsall. 1992. Chain Reaction: The Impact of
Race, Rights, and Taxes on American Politics. W.W. Norton and Company.
Ellis, Christopher and James A. Stimson. 2012. Ideology in America. Cambridge
University Press.
Federal Election Commission. 2010. “Federal Elections 2010: Election Results for
the U.S. Senate and the U.S. House of Representatives.” Retrieved from
http://www.fec.gov/pubrec/fe2010/federalelections2010.shtml
Gay, Claudine. 2001. “The Effect of Black Congressional Representation on
Political Participation.” American Political Science Review 95(3):589-602.
44

Gay, Claudine. 1997. Taking Charge: Black Electoral Success and the
Redefinition of American Politics. Ph.D. diss. Department of Political
Science. Harvard University.
Goren, Matt J. and Victoria C. Plaut. 2012. “Identity Form Matters: White Racial
Identity and Attitudes Toward Diversity.” Self and Identity 11: 237-54.
Green, Donald, Bradley Palmquist and Eric Schickler. 2002. Partisan Hearts and
Minds: Political Parties and the Social Identities of Voters. New Haven, CT:
Yale University Press.
Hajnal, Zoltan L. 2001. “White Residents, Black Incumbents, and a Declining
Racial Divide.” American Political Science Review, 95(3): 603-18.
Helms, John E. 1990. Black and White Racial Identity Attitudes: Theory, Research
and Practice. Westport, CT: Greenwood.
Highton, Benjamin. 2004. “White Voters and African American Candidates for
Congress.” Political Behavior 26 (March): 1-25.
Highton, Benjamin. 2011. “Prejudice Rivals Partisanship and Ideology When
Explaining the 2008 Presidential Vote Across the States.” PS: Political
Science & Politics 44(3): 530-35.
Huddy, Leonie. 2013. “From Group Identity to Political Cohesion and
Commitment.” Oxford Handbook of Political Psychology. Eds. Leonie
Huddy, David O. Sears and Jack Levy. Oxford University Press.
Hutchings, Vincent L., Cara Wong, James Jackson and Ronald Brown. 2011.
“Explaining Perceptions of Competitive Threat in a Multi-Racial Context.”
Race, Reform and Regulation of the Electoral Process: Recurring Puzzles in
45

American Democracy. Eds. Charles E. Guy-Uriel, Heather K. Gerken and
Michael S. Kang. Cambridge University Press.
Ignatiev, Noel. 1995. How the Irish became White. New York: Routledge.
Jaccard, James and Robert Turrisi. 2003. Interaction Effects in Multiple
Regression Second Edition. Sage Publications. Thousand Oaks, California.
Jackman, Simon and Lynn Vavreck. 2010. “Obama’s Advantage? Race,
Partisanship and Racial Attitudes in Context.” Presented at the Annual
Meeting of the Midwest Political Science Association, Chicago, Illinois,
April.
Jardina, Ashley Elizabeth. 2014. The Demise of Dominance: Group Threat and the
New Relevance of White Identity for American Politics. Ph.D. Dissertation.
Jaret, Charles and Donald C. Reitzes. 1999. “The Importance of Racial-Ethnic
Identity and Social
Setting for Blacks, Whites and Multiracials.” Sociological Perspectives 42
(4): 711-37.
Kellstedt, Paul M. 2003. The Mass Media and the Dynamics of American Racial
Attitudes. Cambridge University Press.
Key, Valdimer Orlando. 1949. Southern Politics in State and Nation. New York:
A.A. Knopf.
Kinder, Donald R. and Allison Dale-Riddle. 2012. The End of Race? Obama, 2008,
and Racial Politics in America. New Haven, CT: Yale University Press.
Kinder, Donald R. and Lynn Sanders. 1996. Divided by Color. Chicago: University
of Chicago Press.
46

Knowles, Eric D., Brian S. Lowery, Elizabeth P. Shulman, and Rebecca L.
Schaumberg. 2013. “Race, Ideology, and the Tea Party: A Longitudinal
Study.” PLOS ONE 8(6): 1-11.
Knowles, Eric D. and Brian S. Lowery. 2012. “Meritocracy, Self-Concerns and
Whites’ Denial of Racial Inequity.” Self and Identity 11: 202-22.
Levin, Shana and Jim Sidanius. 1999. “Social Dominance and Social Identity in
the United States and Israel: Ingroup Favoritism or Outgroup Derogation?”
Political Psychology 20 (March): 99-126.
Levin, Shana, Jim Sidanius, Joshua L. Rabinowitz, and Christopher Federico.
1998. “Ethnic Identity, Legitimizing Ideologies, and Social Status: A Matter
of Ideological Asymmetry.” Political Psychology 19(2): 373-404.
Levy, Dena, Nicole R. Krassas, Vinessa Buckland, Katherine Dillon, and Justin
Glownia. 2010. “Time for a Change? Media Coverage of the 2008
Presidential Election.” Presented at the Annual Meeting of the Midwest
Political Science Association, Chicago, Illinois, April 21-25.
Lewis-Beck, Michael S.; Charles Tien and Richard Nadeau. 2010. “Obama’s
Missed Landslide: A Racial Cost?” PS: Political Science & Politics 42
(January) 69-76.
Lowery, Brian S., Eric D. Knowles, Rosalind M. Chow and Miguel M. Unzueta.
2012. “Paying for Positive Esteem: How Inequity Frames Affect Whites’
Responses to Redistributive Policies.” Journal of Personality and Social
Psychology 102 (2): 323-36.
47

Lowery, Brian S., Eric D. Knowles and Miguel M. Unzueta. 2007. “Framing
Inequity Safely: Whites’ Motivated Perceptions of Racial Privilege.”
Personality and Social Psychology Bulletin 33(9): 1237-50.
Mack, Dan A., C. Douglas Johnson, Troy D. Green, Anthony G. Parisi, and Kecia M.
Thomas. 2002. “Motivation to Control Prejudice as a Mediator of Identity
and Affirmative Action Attitudes.” Journal of Applied Social Psychology
32(5): 934-64.
Martinez, Michael D. and Stephen C. Craig. 2010. “Race and 2008 Presidential
Politics in Florida: A List Experiment.” The Forum 8 (2): 1-14.
MacCallum, Robert Charles, Browne, Michael W., & Sugawara, Hazuki M.
1996. “Power Analysis and Determination of Sample Size for Covariance
Structure Modeling.” Psychological Methods 1: 130-149.
McIlwain, Charlton D. and Stephen Maynard Caliendo. 2007. “Racialized Media
Framing in Federal Elections, 1992-2006.” Presented at the annual meeting
of the Midwest Political Science Association, April 12-15.
Morrison, Kimberly Rios, Victoria C. Plaut and Oscar Ybarra. 2010. “Predicting
whether Multiculturalism Positively or Negatively Influences White
Americans’ Intergroup Attitudes: The Role of Ethnic identification.”
Personality and Social Psychology Bulletin 36: 1648-1661.
Muthen, Linda K. and Bengt O. Muthen. 2007. M-Plus: Statistical Analysis with
Latent Variables, Users Guide. Los Angeles: Statmodel.com.
48

Paccagnella, Omar. 2006. “Centering or Not Centering in Multi-level Models? The
Role of the Group Mean and the Assessment of Group Effects.” Evaluation
Review 30 (February): 66-85.
Pasek, Josh, Alexander Tahk, Yphtach Lelkes, Jon A. Krosnick, B. Keith Payne,
Omair Akhtar, and Trevor Tompson. 2009. “Determinants of Turnout and
Candidate Choice in the 2008 Presidential Election.” Public Opinion
Quarterly 73(5): 943-994.
Petrow, Gregory A. 2010. “The Minimal Cue Hypothesis: How Black Candidates
Cue Race to Increase White Voting Participation.” Political Psychology 31
(December): 915-50.
Piston, Spencer. 2010. “How Explicit Racial Prejudice Hurt Obama in the 2008
Election.”
Political Behavior 32(4): 431-451.
Pope-Davis, Donald B. and Thomas M. Ottavi. 1994. “The Relationship Between
Racism and Racial Identity Among White Americans: A Replication and
Extension.” Journal of Counseling and Development, 72: 293-97.
Redlawsk, David P., Caroline J. Tolbert and William Franko. 2010. “Voters,
Emotion and Race in 2008: Obama as the First Black President.” Political
Research Quarterly 63(4): 875-89.
Reeves, Keith. 1997. Voting Hopes or Voting Fears? White Voters, Black
Candidates, and Racial Politics in America. Oxford: Oxford University Press.
Roediger, David R. 2007. Wages of Whiteness: Race and the Making of the
American Working Class. London and New York: Verso.
49

Rowe, Wayne, Sandra K. Bennett, and Donald R. Atkinson. 1994. “White Racial
Identity Models: A Critique and Alternative Proposal.” Counseling
Psychology 22: 129-46.
Schaffner, Brian F. 2011. “Racial Salience and the Obama Vote.” Political
Psychology 32 (6): 963-88.
Sears, David O. and P.J. Henry. 2005. “Over Thirty Years Later: A Contemporary
Look at Symbolic Racism.” Advances in Experimental Social Psychology. 37:
95-150.
Sears, David O. and Victoria Savalei. 2006. “The Political Color Line in America:
Many ‘Peoples of Color’ or Black Exceptionalism?” Political Psychology 27
(December): 895-924.
Sidanius, Jim and Felicia Pratto. 1999. Social Dominance: An Intergroup Theory
of Social Hierarchy and Oppression. Cambridge University Press.
Sides, John and Henry Ferrell. 2016. The Science of Trump: Explaining the Rise
of an Unlikely Candidate. Amazon Digital Services LLC.
Stephens-Davidowitz, Seth. 2011. “The Effects of Racial Animus on Voting:
Evidence Using Google Search Data.” Unpublished typescript.
Tajfel, Henri. 1982. “Social Psychology of Intergroup Relations.” Annual Review
of Psychology 33: 1-30.
Terkildsen, Nayda. 1993. “When White Voters Evaluate Black Candidates: The
Processing Implications of Candidate Skin Color, Prejudice, and Self
Monitoring.” American Journal of Political Science 37(4): 1032-53.
50

Tesler, Michael and David O. Sears. 2010. Obama’s Race: The 2008 Election and
the Dream of a Post-Racial America. University of Chicago Press.
Tocqueville, Alexis de. 1841. De le democartie en Amerique, Bruxelles: L. Hauman
et Cie.
Tufte, Edward R. 1975. “Determinants of the Outcomes of Midterm Congressional
Elections.” American Political Science Review 69 (September): 812-26.
Valentino, Nicholas A., and David O. Sears. 2005. “Old Times There Are Not
Forgotten: Race
and Partisan Realignment in the Contemporary South.” American Journal of
Political Science 49(3): 672-688.
Voss, D. Stephen and David Lublin. 2001. “Black Incumbents, White Districts:
An Appraisal of the 1996 Congressional Elections.” American Politics
Research 29: 141-82.
Wong, Cara and Grace E. Cho. 2005. “Two Headed Coins or Kandinskys: White
Racial Identification.” Political Psychology 26 (5): 699-720.
51

APPENDIX A
For the 2008 election we analyze data from the Cooperative Congressional
Election Study (CCES; Ansolabehere 2008)13, for the 2010 and 2012 elections we
use data from the American National Election Study (ANES)14, and for the
Massachusetts Gubernatorial election we use data from the Massachusetts
13 The CCES went into the field before the presidential election (October 8 to
November 3) and then again after (November 5 to December 1). This was an
Internet-based survey conducted by YouGov/Polimetrix. The company maintains a
panel of people who have been recruited to participate in on-line surveys. They
begin with a target random sample of the adult population based on the 2006
American Community Survey. For each member of this target sample,
YouGov/Polimetrix recruits members from their opt-in sample that match that
person on a number of characteristics, including gender, age, race, region,
education, news interest, marital status, party identification, ideology, religious
affiliation, church attendance, income, and registration status. Analysts then
weight the sample using propensity scores to assure that the sample is nationally
representative. The total sample size was 1,000 adult American citizens, of which
760 were white, with 576 whites reporting that they voted in the 2008 election.
The within panel response rate (RR3) for the study was 47.1% (American
Association of Public Opinion Researchers 2011, 45). Other sampling information
is posted at http://web.mit.edu/polisci/portl/cces/index.html.
14 The 2010 data is the Evaluations of Government and Society Study 1 (EGSS 1).
Interviews were conducted with 1,189 respondents (960 whites) from October 8
52

Statewide Survey (MSS) conducted by the Western New England University
Polling Institute.15
WHITE IDENTITY VARIABLE DESCRIPTIONS
We measured white identity using the following four questions.
Interviewers asked the questions of all respondents, but in the analyses here we
use only white respondents. We report the question wording and also a
histogram with the resulting frequency distribution.
From the 2008 CCES:
How strongly to do you identify with white people? Very strongly, somewhat
strongly, not very strongly, not at all strongly.
to 19, 2010, and all interviews were conducted over the Internet by Knowledge
Networks for the ANES. The 2012 data is the 2012 ANES Time Series Study.
The study involved the standard pre- and post-election interviews, this time
involving face to face interviews with 2,054 respondents, and Internet interviews
with 3,860 respondents. The pre-election interviews occurred during the two
months prior to the election, and the post-election interviews occurred during the
two months after. We analyze all respondents pooled together, and we include a
dummy variable for interview mode.
15 The survey was administered over the telephone to a Random Digit Dial-selected
random sample of self-identified registered voters in Massachusetts from October
16-21, 2010. A follow-up survey was conducted and 210 individuals were re-
interviewed from November 7-18 2010, at which point interviewers asked
respondents for whom they voted.
53

From the 2010 ANES:
How close do you feel to [whites] in terms of ideas and interests? Extremely
close, very close, moderately close, a little close or not at all close?
From the MSS:
54
How strongly do you identify with white people? Would you say: Very strongly,
somewhat strongly, not very strongly, not at all, or, I do not know how strongly I
identify with white people.
From the 2012 ANES:
How important is being white to your identity? Extremely important, very
important, moderately important, a little important, or not at all important.
55

OTHER VARIABLE DESCRIPTIONS
For the 2010 ANES we coded respondents as voting in states that did or did
not have black candidates for the U.S. Senate (Barone and McCutcheon 2011).
We did the same for respondents’ Congressional districts (for both 2010 and
2012), coding them either having, or not having, a black member of the U.S.
House in 2011, such that black members of Congress were successful black
candidates for the House in 2010 (Congressional Black Caucus 2012).
The dependent variables for all of our models are dichotomous – they are all
either self-reported post-election vote choice, or pre-election candidate support.
Results from the 2008 CCES and 2012 ANES surveys use post-Election Day vote
choice. Results from the 2010 MSS include both pre-Election Day support, as
well as post-Election Day vote choice. The 2010 ANES interviews were in late
October, but there were no post-Election Day re-interviews, and so these
dependent variables are all pre-Election Day candidate support.
56

For the 2008 Presidential, 2012 Presidential, and 2010 Massachusetts
Gubernatorial elections, all of the respondents were choosing whether or not to
vote for a black candidate. For the 2010 Midterm elections, some respondents
were in U.S. States or Congressional districts featuring black Democratic
candidates, while most were not. In these cases, we use self-reported support for
Democratic U.S. Senate and House candidates as dependent variables, but we
employ an interaction term between white identity and facing a black candidate
to capture the impact of the racial identity in elections with black candidates. For
all of these models we estimate a logistic regression.
Finally, we expect that as white identity strengthens for white Americans,
approval ratings for President Obama are likely to be lower, which will in turn
decrease support for all Democratic congressional candidates. In this model, no
interaction term is needed. However, in addition to estimating a single equation
regression (see Table 4), we also estimate a Structural Equation Model (SEM)
with Presidential Approval and support for Democratic candidates as endogenous
variables, using a polychoric covariance matrix to account for the dichotomous
nature of the vote choice dependent variable (e.g. Bollen 1989). We estimate the
indirect effect of white identity on voting for Democratic Congressional
candidates, as it operates through Presidential approval, and we used Mplus 7 to
estimate the coefficient for the indirect effect (Muthen and Muthen 2007).
57

APPENDIX B
Table B1: American National Election Study 2012 Bivariate Regression Coefficients between White Identity and Other Constructs
Black Feeling^
White Feeling^
Hispanic Feeling^
Black Sympathy^^
Black Admiration^^
Link White^^
Obama Favors Blacks^^
Obama Muslim^^^
Racial Resentment^
White-Black Stereotypes^
-1.77** (.48)
3.76** (.34)
-1.80** (.39)
-.01 (.02)
-.06** (.02)
.11** (.02)
.07** (.02)
.14** (.04)
.11** (.02)
.66** (.06)
n= 3247
3247 3247 3247 3247 3247
3247 3247 3247 3247
*p<.05, two tailed test; **p<.01, two tailed test^ OLS Regression^^Ordered Probit^^^Logit
We assess the construct validity of the ANES measure of white identity. We
run bivariate regressions employing 10 dependent variables. Nine of the
coefficients are statistically significant. Stronger levels of white identity predict:
Colder feelings toward blacks, warmer feelings toward whites, colder Hispanic
feelings, less admiration for blacks, greater linked fate with whites, the belief that
Obama favors blacks over whites, the belief that Obama is a Muslim, racial
resentment, and more positive white stereotypes over blacks. One coefficient for
feelings of sympathy for blacks is not statistically significant.
American National Election Study Construct Validity Variables
“feelings toward blacks, whites and Hispanics”:I'd like to get your feelings toward some of our political leaders and other people who are in the news these days. I'll read the name of a person and I'd like you to rate that person using something we call the feeling thermometer. Ratings between 50 degrees and 100 degrees mean that you feel favorable and warm toward the person. Ratings between 0 degrees and 50 degrees mean that you don't feel favorable toward the person and that you don't care too much for that person. You would rate the person at the 50 degree mark if you don't feel particularly warm or cold toward the person. Still using the thermometer, how would you rate the following groups:
58

BlacksWhiteHispanics
59

“Feelings of sympathy for blacks”:How often have you felt sympathy for Blacks? Always, about half the time, some of the time, or never?
“Feelings of admiration for blacks”: How often have you felt admiration for Blacks? Always, about half the time, some of the time, or never?
“Linked fate with whites”:Do you think that what happens generally to white people in this country will have something to do with what happens in your life? Yes or no?
“the belief that Obama favors blacks over whites”:Do the policies of the Obama administration favor whites over blacks, favor blacks over whites, or do they treat both groups the same?
“the belief that Obama is a Muslim”: Now we would like to ask you some questions about the religion of the presidential candidates. Would you say that [Obama] is Protestant, Catholic, Jewish, Muslim, Mormon, some other religion, or is he not religious? Codes so 1=Muslim, 0=rest.
60
Table B2: Cooperative Congressional Election Study 2008 Bivariate Regression Coefficients between White Identity and Other Constructs
McCain Anger
Perceived Anti-Black Discrimination
White Pride
Black Anger
McCain Feeling Thermometer
Obama Feeling Thermometer over McCain
Too Little White Influence
Too Little Black Influence
Racial Resentment
More angry at blacks than whites
Racial Threat
Blacks Cause Racial Tension
Logit Ordered Probit
Ordered Probit
Ordered Probit
OLS OLS Ordered Probit
Ordered Probit
OLS OLS Logit Ordered Probit
-.21* (.09)
-.10* (.04)
.22** (.06)
.12* (.06)
2.67* (1.12)
-5.74* (2.60)
.22** (.06)
-.14** (.04)
.22** (.04)
.12** (.04)
.22* (.11)
.18** (.04)
744 749 670 693 713 665 748 745 752 666 728 751**p<.01, two tailed test; *p<.05, two tailed test
We report results from 10 bivariate analyses which demonstrate that the white identity variable
correlates with 10 constructs that one expects to be related to a valid measure of white identity. First,
whites with stronger white identities reported feeling less anger toward John McCain. They were less
likely to perceive that blacks face discrimination. Third, whites with stronger white identities feel more
white pride, and also, greater anger toward blacks. These whites also feel warmer feelings for John
McCain as measured with a feeling thermometer, and stronger white racial identities correlate with
warmer feelings for McCain in comparison to Barack Obama. Stronger white identities correlate
positively with whites believing that whites have too little influence in society, and negatively with the
belief that blacks have too little influence. The variable predicts higher levels of racial resentment, as
61

well as a greater likelihood of answering that one feels angry at blacks, relative to whites. The CCES
measured racial threat by asking if people thought black civil rights leaders were “moving too fast,” and
stronger white racial identities predict that one agrees. Finally, stronger white identities increase the
likelihood that whites will answer that blacks are mainly responsible for creating racial tension.
62

APPENDIX C
Table C1. White Racial Identity among Whites and Democratic Presidential Vote Choice in 1984 thru 2000 and 2008 thru 2012: Logistic Regression
1984 1988 1992 1996 2000 2008 2012Mondale v.
ReaganDukakis v. GHW Bush
Clinton v. GHW Bush
Clinton v. Dole
Gore v. GW Bush
Obama v. McCain
Obama v. Romney
White Identity -.04 (.19)
-.08 (.22)
.10 (.25)
-.16 (.32)
-.13 (.34)
-.55* (.26)
-.16** (.06)
Racial controlsRacial Resentment
Not available
-.07* (.03)
-.36* (.17)
Not available
-.28 (.32)
-.69* (.30)
-.45** (.17)
Political issues and valuesEgalitarianism .56**
(.11).33** (.12)
.52** (.19)
.65* (.27)
.06 (.20)
.41** (.15)
Limited Government
-.16* (.07)
-.37** (.09)
-.12 (.16)
-.61** (.16)
-.73** (.19)
-.93** (.24)
Withdraw Iraq 3.03** (.57)
Support Carbon Tax
2.34** (.66)
Oppose Health Care Reform Act
-.83** (.11)
Republican Party Identification
-.83** (.07)
-.84** (.06)
-.90** (.07)
-.79** (.10)
-.88** (.10)
-.84** (.09)
-.77** (.07)
Conservative Ideological Identification
-.47** (.09)
-.20** (.06)
-.32** (.11)
-.36* (.16)
-.87** (.14)
-.49 (.37)
-.39** (.08)
Retrospective Economy
-.65** (.15)
-.40** (.12)
-.74** (.15)
.70** (.23)
.30* (.15)
-.42 (.23)
.81** (.10)
Prospective Economy
-.31 (.18)
.00 (.08)
.06 (.17)
.55* (.24)
.06 (.19)
.14 (.45)
.29 (.20)
Demographics
63

Female -.06 (.25)
-.20 (.22)
-.40 (.24)
-.16 (.34)
-.13 (.28)
-.22 (.55)
.14 (.26)
Education .02 (.05)
.02 (.07)
-.02 (.09)
-.24* (.09)
.37** (.12)
.25 (.20)
.05 (.09)
Income -.02 (.02)
-.03 (.02)
-.00 (.02)
.03 (.02)
-.03 (.05)
-.34 (.19)
-.03** (.01)
Age .01 (.01)
.01 (.01)
.01 (.01)
-.01 (.01)
.01 (.01)
-.03 (.02)
-.01 (.02)
Church Attendance
-.06 (.06)
-.03 (.07)
-.32** (.08)
-.35** (.13)
-.16 (.10)
-.18 (.16)
-.28** (.04)
Deep South -.50* (.21)
-.43* (.20)
-.10 (.25)
.01 (.30)
-.70* (.34)
.36 (.49)
-.36 (.25)
Intercept 4.96** (.96)
2.48* (1.01)
5.61** (1.49)
.49 (1.44)
4.24* (1.84)
10.89** (2.69)
5.37** (1.32)
Pseduo-R2 .51 .47 .56 .58 .61 .78 .71N 1024 994 930 587 764 526 2478
*p<.05, **p<.01All dependent variables coded as 2 party vote1984 to 2000: Analysis of American National Election Study data. The white identity measure is the dichotomous “Feel close to Whites” measure.2008: Cooperative Congressional Election Study Data. See Appendix A for white identity wording.2012: American National Election Study data. See Appendix A for white identity wording.1984 standard errors clustered on counties; 1988 and 1992 on census tracts; 1996 and 2000 counties; 2008 and 2012 Congressional DistrictsStarting with 1992, all models employ sample weightsDeep South: Respondents in former Confederacy states of South Carolina, Mississippi, Florida, Alabama, Georgia, Louisiana, Texas, Virginia, Arkansas, Tennessee, and North Carolina.
64

Table C2: White Racial Identity among Whites, Democratic Vote Choice and Candidate Preference for Massachusetts Governor in 2010 among Whites, Logistic Regression
Variable Patrick Candidate Preference 2010
Patrick Vote 2010
White Identity -.38** (.14)
-.27* (.13)
Massachusetts Right Direction16
1.46** (.36)
1.61** (.51)
Republican Party ID -1.27** (.10)
-1.39** (.19)
Education -.00 (.08)
-.25 (.14)
Income .23 (.27)
.11 (.56)
Female -.68** (.27)
-.78 (.57)
Age .04 (.15)
.20 (.25)
Intercept -.26 (.77)
.77 (1.51)
N 390 204Pseudo R2 .42 .47
**p<.01, *p<.05Data source: 2010 Massachusetts State Survey.Results incorporate sample weights for gender, age, and race.Models cluster standard errors on counties.
16 Do you feel things in Massachusetts are generally going in the right direction, or
do you feel things have pretty seriously gotten off on the wrong track? Right track,
wrong track, or do you not know?
65
Table C3: White Racial Identity among Whites and 2010 U.S. Congress Candidate Preference among Whites, Logistic Regression
Variable Democratic U.S. Senate Candidate
Preference
Democratic U.S. House Candidate
PreferenceU.S. Congress InteractionsWhite Identity X Black Democratic U.S. Congressional candidate
-1.37** (.47)
-2.34** (.86)
Interaction Effect ComponentsBlack Democratic U.S. Congress candidate
2.08* (1.04)
2.18**(.63)
White Identity .00 (.22)
-.04 (.25)
Political and Economic EvaluationsObama Approval .24^
(.14).13
(.11)Negative Economic Stimulus Evaluation
-.31* (.15)
-.40** (.12)
Negative Economic Evaluation
-.02 (.15)
-.15 (.13)
Disapprove Democratic Legislative Agenda
-.29** (.11)
-.15 (.08)
Political PredispositionsDemocratic Party ID .46**
(.10).64** (.10)
Liberal Ideology ID .23 (.17)
.13 (.15)
Racial Resentment -.01 (.05)
.01 (.04)
DemographicsEducation .13
(.22).13
(.18)Income -.05
(.04).01
(.03)Female -.05
(.31)-.00 (.37)
Deep South -2.30* (.92)
-1.35** (.50)
Church Attendance .03(.08)
-.07(.06)
Age .01 .00
66

(.01) (.01)Intercept .59
(2.37)-.53
(1.46)N 581 771Pseudo R2 .50 .50
**p<.01 two tailed test, *p<.05 two tailed test, ^p<.10, two tailed testData source: 2010 ANES. Results incorporate ANES sample weight.U.S. Senate models cluster standard errors on States, U.S. House models cluster standard errors on Congressional Districts.All interaction terms centered at 0 to reduce collinearity.Deep South: Respondents in former Confederacy states of South Carolina, Mississippi, Florida, Alabama, Georgia, Louisiana, Texas, Virginia, Arkansas, Tennessee, and North Carolina.U.S. Senate elections, all three black candidates were DemocratsU.S. House elections, 16 major party candidates were black, 14 of them Democrats
67

Table C4. White Racial Identity among Whites and Presidential Approval in 1984 thru 2000; 2008 thru 2012: OLS
1984 1988 1992 1996 2000 2008 2010 2012Ronald Reagan
Ronald Reagan
George HW Bush
Bill Clinton
Bill Clinton
George W Bush
Barack Obama
Barack Obama
White Identity -.04 (.06)
.01 (.07)
-.03 (.07)
.07 (.08)
.06* (.03)
-.04 (.06)
-.12** (.04)
-.04* (.02)
Racial Resentment
Not availabl
e
.02* (.01)
.08 (.04)
Not availabl
e
.01 (.03)
.08 (.05)
-.06* (.02)
-.08*(.03)
Political Predispositions and EvaluationsRepublican Party Identification
.29** (.02)
.32** (.02)
.34** (.02)
-.28** (.03)
-.08** (.01)
.26** (.03)
-.28** (.03)
-.26** (.02)
Conservative Ideological Identification
.13** (.03)
.06** (.02)
.07* (.03)
-.19** (.04)
-.04** (.01)
-.04 (.07)
-.11 (.07)
-.05* (.02)
Egalitarianism -.28** (.03)
-.07 (.04)
-.07 (.06)
.16* (.07)
.03 (.02)
Not available
Not available
.03 (.03)
Limited Government
-.01 (.02)
.10** (.03)
-.03 (.05)
-.18* (.07)
-.04* (.02)
Not available
Not available
-.45** (.10)
Retrospective Economy
.48** (.05)
.28** (.04)
.45** (.04)
.43** (.05)
.03** (.01)
.40** (.11)
.37** (.06)
.28** (.04)
Prospective Economy
.23** (.05)
.06* (.03)
.17** (.06)
.21** (.07)
.02 (.02)
.12 (.09)
.11** (.03)
Current Economy
.26** (.03)
Withdraw Iraq -.71** (.16)
Ck Oppose Affordable Ca
-.44* (.06)
-.38** (.04)
68
Care ActOppose Democratic Legislative Agenda
-.10** (.03)
Oppose Economic Stimulus Bill
-.25** (.04)
Demographics and ControlsEducation -.01
(.01)-.09** (.02)
-.09** (.02)
-.05 (.03)
.01 (.01)
-.04 (.05)
.09* (.03)
-.03(.02)
Income .01 (.01)
.01* (.01)
.00 (.01)
.01 (.01)
.01** (.00)
.02 (.04)
-.01 (.01)
-.01**(.00)
Age -.00 (.00)
-.01** (.00)
-.00 (.00)
.00 (.00)
.00* (.00)
-.00 (.00)
-.00 (.00)
-.00(.01)
Church Attendance
.04 (.02)
.07** (.02)
.06** (.02)
-.03 (.04)
-.02** (.01)
.11** (.03)
-.01 (.03)
-.04**(.01)
Deep South .15 (.08)
.19** (.07)
.11 (.08)
.10 (.12)
-.03 (.02)
.13 (.14)
.08 (.10)
-.08(.05)
Face to face interview mode
.07(.06)
Intercept 1.14** (.29)
2.05** (.28)
.65 (.38)
2.32** (.48)
.56** (.14)
.24 (.40)
10.16** (.39)
3.85** (.31)
R2 .50 .37 .41 .57 .36 .55 .68 .68N 1490 1601 1513 691 1047 586 883 3176*p<.05, **p<.01Analysis of American National Election Study data from all election years but 2008; and in 2008, the Cooperative Congressional Election Study. In the ANES before 2010, the white identity measure is the dichotomous “Feel close to Whites” measure. For the CCES and the ANES in 2010 and 2012, see Appendix A.1984 standard errors clustered on counties; 1988 and 1992 on census tracts; 1996 and 2000 counties; 2008, 2010 and 2012 Congressional DistrictsStarting with 1992, all models employ sample weightsDeep South: Respondents in former Confederacy states of South Carolina, Mississippi, Florida, Alabama, Georgia, Louisiana, Texas, Virginia, Arkansas, Tennessee, and North Carolina.
69

Table C5: Indirect Paths of White Racial Identity among Whites and White Candidate Preference for the U.S. Congress in 2010 and U.S. Congress Vote Choice in 2012, Structural Equation Models
Endogenous Variables
Exogenous Variables
U.S. House 2010^
U.S. Senate 2010^
U.S. House 2012^
U.S. Senate 2012^
President Obama ApprovalWhite Identity -.12**
(.04)-.12** (04)
-.04** (.01)
-.05** (.02)
Racial Resentment -.06** (.02)
-.06** (.02)
-.09** (.03)
-.08** (.03)
Republican Party ID
-.28** (.04)
-.28** (.04)
-.26** (.01)
-.26** (.01)
Conservative Ideology ID
-.11** (.04)
-.11** (.04)
-.05** (.02)
-.05** (.02)
Negative Economic Stimulus Evaluations
-.25** (.04)
-.25** (.03)
Negative Democratic Legislative Agenda Evaluations
-.11** (.04)
-.10** (.04)
Negative Affordable Care Act Evaluations
-.45** (.11)
-.44** (.11)
-.38** (.03)
-.38** (.03)
Positive Current National Economic Evaluations
.37**(.04)
.37**(.04)
.26** (.03)
.25** (.03)
Positive Retrospective National Economic EvaluationsPositive Prospective National Economic Evaluations
Not available
Not available
Not available
Not available
.28** (.04)
.11** (.03)
.29** (.04)
.12** (.03)
Limited Not Not -.45** -.46**
70

Government available
available
(.08) (.08)
Egalitarianism Not available
Not available
.03 (.03)
.03 (.03)
Income -.01 (.01)
-.01 (.01)
-.01** (.00)
-.01** (.00)
Age -.00 (.00)
-.00 (.00)
-.00 (.01)
-.00 (.01)
Female .05 (.10)
.05 (.10)
.08** (.03)
.08** (.03)
Education .09 (.05)
.09 (.05)
-.03* (.02)
-.03* (.02)
Deep South .08 (.14)
.08 (.14)
-.09 (.06)
-.09 (.06)
Church Attendance
-.01(.03)
-.01(.03)
-.04** (.02)
-.04**(.02)
Face to Face Interview Mode
.07 (.05)
.07 (.05)
Intercept 10.16**(.47)
10.16**(.47)
3.85** (.25)
3.85** (.25)
R2 .68 .68 .68 .68Democratic Congressional Voting
President Obama Approval
.04** (.01)
.33** (.11)
1.00** (.18)
.51** (.08)
Republican Party ID
-.09** (.01)
-.17** (.06)
-.05 (.04)
-.26** (.05)
Conservative Ideology ID
-.01 (.01)
-.13 (.08)
-.12 (.08)
-.11 (.06)
Negative Democratic Legislative Agenda Evaluations
-.14* (.06)
Negative Economic Stimulus Evaluations
-.04** (.01)
Positive Current National Economic
-22* (.10)
71

EvaluationsPositive Retrospective National Economic EvaluationsPositive Prospective National Economic Evaluations
Not available
Not available
Not available
Not available
-.12* (.06)
-.06 (.06)
Income .02 (.02)
-.02 (.02)
.00 (.01)
.01 (.01)
Age .00 (.01)
.01 (.01)
.03 (.02)
.07** (.02)
Female -.01 (.03)
-.05 (.22)
-.07 (.10)
.11 (.09)
Education .02 (.02)
.05 (.12)
.10 (.06)
.05 (.06)
Deep South -.12** (.03)
-.51* (.22)
-.26 (.19)
.01 (.20)
Church Attendance
-.01(.01)
.02(.04)
-.11** (.04)
Face to Face Interview Mode
-.41** (.10)
-.09 (.13)
Threshold -4.96** (1.01)
-1.63 (1.31)
.96 (.82)
.82 (.74)
R2 .48 .61 .52 .69N 883 883 3,193 3,193
Indirect Effects on Democratic Congressional Voting thru Approval
White Identity
Racial Resentment
-.01*(.00)-.00* (.00)
-.04* (.02)-.02* (.01)
-.04** (.01)-.09** (.03)
-.02** (.01)-.04* (.02)
**p<.01, *p<.05^ 2010 results for October 2010 candidate preference; 2012 results for post-election vote choiceData sources: 2010 and 2012 ANESError terms of President Obama Approval and Democratic Congressional Voting correlated for all models but U.S. House 2010Results incorporate ANES sample weight.
72
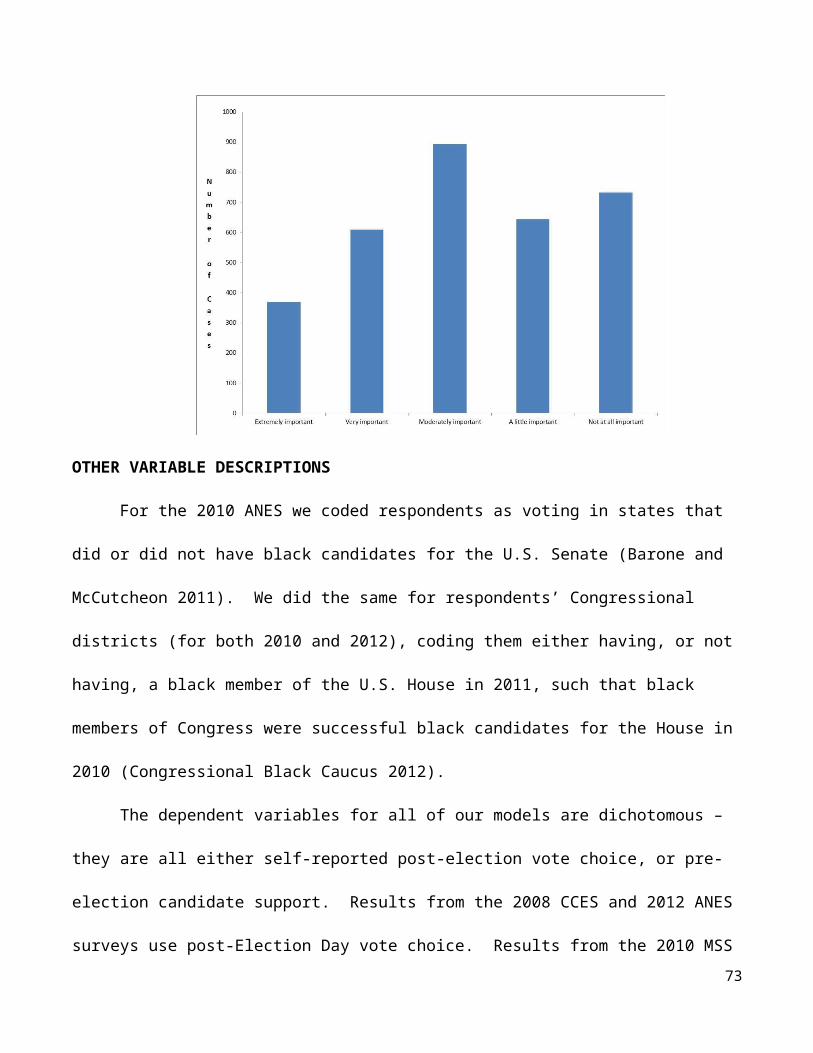
2010 models and 2012 U.S. House model cluster standard errors at the state level; 2012 U.S. Senate model clusters standard errors at the Congressional District level U.S. House Candidate Preference Model 2010: chi2 = 94.50 (p<.01) df=56, CFI = .78, TLI = .69, RMSEA = .028U.S. Senate Candidate Preference Model 2010: chi2 = 118.03 (p<.01) df=55, CFI = .64, TLI = .48, RMSEA = .036U.S. House Vote Choice Model 2012: chi2 = 376.81 (p<.01) df=102, CFI = .60, TLI = .47, RMSEA = .032U.S. Senate Vote Choice Model 2012: chi2 = 425.88 (p<.01) df=105, CFI = .48, TLI = .34, RMSEA = .031Deep South: Respondents in former Confederacy states of South Carolina, Mississippi, Florida, Alabama, Georgia, Louisiana, Texas, Virginia, Arkansas, Tennessee, and North Carolina.
73

APPENDIX D
74

Predicted Probability plots for Congressional Elections
75

Consider Figure D4. When whites report feeling “Not at all” close to
whites, for both the House and Senate, the probability of declaring support
for the Democratic candidate appears to be about 60%. The predicted
probability of support then appears to drop (although not monotonically),
reaching about 40% for both the House and Senate at the “Very” close to
whites category. In other words, whites who indicated that they felt “very
close” to whites were statistically less likely (at the p<.05 level) to report
support for Democrats, compared to whites who responded they felt “not at
all” close to whites. The same holds true for those feeling “moderately” and
“extremely” close to whites. While it appears that those who answered that
they felt “a little” close to whites also reported lower levels of Democratic
candidate support, those differences are not statistically significant – as we
indicate with the dotted line. The analysis indicates that white identity
reduces the predicted probability of support for Democratic U.S. House and
Senate candidates in the 2010 midterm elections by about 20%.
76

In Figure D5 we plot analogous results from the analysis of 2012. In
this case, self-reported vote choice from the 2012 ANES survey is the
dependent variable. The weakest category of white identity is for those
whites who answered “Not at all” to the question of how important being
white is to their identities. The top line has a negative slope, indicating that
whites with progressively stronger white identities were less likely to self-
report voting for Democratic U.S. Senate candidates – representing the
indirect effect of white identity on vote choice, operating through
Presidential approval. Whites who responded to the white identity question
with “a little” did not have a statistically significantly lower likelihood of
voting for Democratic candidates compared to the weakest white identity
77

category (as reflected by the dotted line). However, those who chose the
three strongest white identity categories (moderately, very and extremely)
were statistically less likely to vote for Democrats (as reflected by the solid
line).
The line below that is for the predicted probability of voting for
Democratic U.S. House candidates in 2012. The slope of the decreases in
the predicted probabilities given stronger levels of white identity is nearly
parallel compared to the decreases for the U.S. Senate. The white identity
categories with the statistically significant reductions in the predicted
probability of candidate support are identical to those of the U.S. Senate
results. It appears white identity reduced the predicted probability of
voting for Democrats for the U.S. House and Senate in 2012 by about 15%
(from 55% to 40%).
78

APPENDIX E
Additional SEM model configurations
For the 2010 SEMs, we estimated 16 different model configurations for both
the U.S. House and Senate vote choice models (32 different models total).
For the 2012 SEMs, we estimated 12 different model configurations for
each (24 total). In Tables 5 and C5 we report the results for the four models
with the strongest overall model fits.
The 2010 SEMs
In the “full model” we allowed Affordable Care Act evaluations, economic
evaluations and evaluations of the 2010 Democratic legislative agenda to
directly affect vote choice. In the next model we dropped health care from
the vote choice model (forcing the full effect to operate through Presidential
approval). Then we dropped the economic evaluation variables. Then we
dropped the Democratic legislative agenda evaluations. This results in four
different models. We then ran these four models clustering the standard
errors at the state level, and then again at the Congressional District level
(resulting in eight models). We then ran these eight models two more
times, correlating the endogenous errors, and then not correlating them (for
a total of 16 models).
For the U.S. House model, the next-strongest model fit correlated the errors
and clustered at the state level, dropping the Affordable Care Act variable
and the economic evaluation variables from the vote choice model. The
resulting model fit statistics are: chi2 = 93.71 (p<.01) df=56, CFI = .78, TLI
79

= .68, RMSEA = .028. The white identity indirect effect coefficient is not
statistically significant at the p<.05 level in this model. The chi-square
statistic indicates this model is a better fit, while the TLI indicates that the
model we report in the table is a better fit. The other model statistics are
identical.
For the U.S. Senate model, the next-strongest model fit clustered the
standard errors at the state level, did not correlate the endogenous errors,
and dropped health care and economic evaluations from the vote choice
model. The model fit statistics are: chi2 = 118.59 (p<.01) df=55, CFI = .64,
TLI = .47, RMSEA = .036. The white identity indirect effect coefficient is
statistically significant at the p<.05 level in this model. The chi-square from
this model indicates a worse fit compared to the one we report, as does the
TLI, while the others are identical.
The 2012 SEMs
In the “full model” we allowed evaluations of the Affordable Care act and
economic evaluations to directly affect vote choice. In the next model we
dropped the health care variable from the vote choice model (forcing the
full effect to operate through approval). In the next model we dropped
economic evaluations from the vote choice model. This results in three
models. We then ran them clustering at the state level, and then the
Congressional District level (resulting in six models). We then ran those six
models correlating the endogenous error, and not doing so (resulting in
twelve models).
80

For the U.S. House model, next strongest-fitting model is identical to the
model we report in Table 5, but the Affordable Care Act variable is allowed
to affect vote choice directly. The model fit statistics are: chi2 = 377.311
(p<.01) df=102, CFI = .59, TLI = .46, RMSEA = .029. The white identity
indirect effect coefficient is not statistically significant at the p<.05 level in
this model. All of the model fit statistics we report here indicate a worse fit,
compared to the model we report in the table.
For the U.S. Senate model, the next-strongest fitting model is identical to
the one in Table 5, excepting that the economic evaluations are allowed to
affect vote choice directly. The model fit statistics are: chi2 = 428.67
(p<.01) df=105, CFI = .47, TLI = .31, RMSEA = .032. The white identity
indirect effect coefficient is statistically significant at the p<.05 level in this
model. All of the model fit statistics we report here indicate a worse fit,
compared to the model we report in the table.
81