Embed Size (px)
Citation preview
CQELL
Classroom Qualities for English Language Learnersin Language Arts Instruction
Technical Report
2013
Claude Goldenberg Edward Haertel Rhoda ColemanStanford University Stanford University CSU-Long Beach
Leslie Reese Claudia Rodriguez-MojicaCSU-Long Beach Stanford University
This research was supported by grant number 10367 from the W. T. Grant Foundation and grant number 201000065 from The Spencer Foundation. The views expressed herein are those of the authors, and no endorsement by sponsoring organizations should be inferred.

CQELL Technical Report
Overview of the CQELL
The CQELL (Classroom Qualities for English Language Learners in Language Arts Instruction) is an observation protocol for English language arts (ELA) classes in elementary schools. It was developed for use in research on ELA instruction for English learners (ELs) — students who are learning academic content while simultaneously learning the language of instruction. It can be used to observe ELA instruction in any self-contained elementary school classroom, but is de-signed in particular for classrooms serving a mix of students including some ELs. Note that the CQELL is designed for use in classrooms where the language of instruction is English and that the CQELL is designed for observation of ELA lessons, not English language development (ELD) lessons. CQELL validation studies to date have been limited to classrooms in which ELs are pre-dominantly native Spanish speakers, but nothing in the design of the CQELL is expected or in-tended to limit its applicability with other EL populations.
The CQELL is intended primarily for research applications, but is also intended to be useful in the context of preservice or in-service teacher professional development. For example, it may be helpful in facilitating reflection or identifying individual goals for instructional improvement. It must be emphasized, however, that the CQELL itself does not constitute a professional devel-opment model nor an instructional model.
The CQELL observation protocol addresses 14 key elements of the classroom environment, in-cluding six generic elements and eight elements representing additional EL support. For each element, between two and ten specific, observable sub-items are specified. After recording the presence or absence of these sub-items, the observer assigns an overall prominence rating for each element. The CQELL codebook provides detailed instructions for using the observation protocol, including concrete explanations and examples for each sub-item and clear criteria for assigning the element prominence ratings. A separate document ("What is CQELL?") explains the logistics of arranging an observation session, including the use of a brief Pre-Observation Questionnaire (Appendix A in "What is CQELL?") that provides context for the observation. "What is CQELL?" also describes the procedures to be followed during the observation.
The CQELL is designed to serve as a descriptive observation instrument, not an evaluation tool. It is intended to capture the prominence of specific instructional elements but does not specifically measure the quality of their implementation. There is no expectation that all of the elements will be observed in any particular lesson. Thus, lower prominence ratings on some or even many elements do not necessarily signal a weak lesson.
This Technical Report is intended to accompany and complement the CQELL observation proto-col, CQELL codebook, "What is CQELL?", and training materials. This overview section includes brief discussions of the theoretical foundations of the CQELL, its purposes and intended uses, and reporting scales. The next section presents a chronology of CQELL development. A third
2

section addresses the statistical properties of the CQELL, including studies of inter-rater agree-ment, generalizability (reliability), and criterion-related validity evidence. Finally, concluding sections offer more specific guidelines for appropriate CQELL use and interpretation, as well as criteria for observer qualification.
Theoretical FoundationsThe CQELL is grounded in traditional learning theory (e.g., Gage & Berliner, 1975; Slavin, 2000; Wang et al., 1993), socio-cultural theory (e.g., Rogoff, 2003; Tharp & Gallimore, 1988), theories of second language acquisition (e.g., Lightbown & Spada, 2006), and sheltered instruction theory (Echevarria, Vogt, & Short, 2007; Krashen, 1985). Unfortunately our knowledge base about effective instructional settings for ELs is sparse (August & Shanahan, 2006; Genesee et al., 2006; Goldenberg & Coleman, 2010; Goldenberg, 2012). Learning theory accounts for a wide range of generic teaching elements that predict student achievement, but offers little guidance concerning the specific needs of the growing EL population in elementary school classrooms. Socio-cultural theory considers classrooms as social contexts for learning, directing attention to the issues of students’ classroom roles and identities, for example. Second language acquisition theory views language use for communication and explicit language instruction as important influences on the development of second language proficiency.
Over the past 15-20 years a set of procedures and principles—collectively known as "sheltered instruction"—has appeared in the literature. The basic premise of this approach is that second language learners can learn academic content when instructed in a second language if instruction is made comprehensible, explicit, and highly engaging. Building on the theoretical work of Krashen (e.g., Krashen, 1985), sheltered instruction seeks to make academic content comprehensible for students who are simultaneously learning both that content and the language in which it is being taught. A number of instructional procedures have been developed, e.g., graphical displays and redundant information, simultaneous content and language objectives, extended language use, and clear input with little extraneous material, all designed to make content instruction more comprehensible for second language learners. The Sheltered Instruction Observation Protocol (SIOP; Echevarria, Vogt, & Short, 2007) is currently the most widely used exemplar of this approach. Sheltered instruction theory suggests that such instructional modifications will help narrow the achievement gap between ELs and non-ELs while further accelerating ELs' English language development.
However, there is virtually no empirical research documenting that sheltered instruction actually improves student achievement. There have been three published studies of SIOP effects. One found very weak effects (Echevarria, Short, & Powers, 2006); another was marred by the researchers' exclusion of low-implementation classrooms (McIntyre, Kyle, Chen, Munoz, & Beldon, 2010); a third found positive trends but no significant effects (Echevarria, Richards-Tutor, Canges, & Francis, 2011). A recent evaluation of another instructional model for ELs, Quality Teaching for English Learners (QTEL), which shares many features with sheltered instruction, found no effects on teachers’ behaviors and knowledge nor on students’ learning (Bos, Sanchez, Tseng, Rayyes, Ortiz, & Sinicrope, 2012), although that evaluation also had flaws
3
limiting the conclusions that could be drawn. To our knowledge, no other sheltered instruction models have even been evaluated.
The design of the CQELL was based on surveys of the professional literature (e.g., Echevarria et al., 2007) and of the research literature (e.g., August & Shanahan, 2006; Genesee et al., 2006), intended to catalog as many classroom and instructional strategies as possible that have been identified as potentially helpful for improving ELs' achievement (see Goldenberg & Coleman, 2010; Goldenberg, 2012). Genesee et al. (2006) in particular helped ground the general orientation of the CQELL, which was to identity classroom and instructional procedures associated with direct teaching and interactive learning: "Direct instruction of specific skills ensures [ELs'] mastery of literacy-related skills that are often embedded in complex literacy or academic tasks. Presenting direct instruction in interactive learning environments ensures that it is meaningful, contextualized, and individualized" (Genesee et al. 2006, pp. 139-140). As stated in the CQELL codebook, the CQELL protocol is most directly aligned with elements of directed, interactive lessons. Not all sub-items may be applicable to inquiry, constructivist-based lessons.
Purposes and Intended UsesThe purpose of the CQELL is to measure the prominence of “generic” and “EL-specific” elements of classroom instruction that might be related to ELs’ achievement. Teachers are routinely admonished that effective instruction for ELs is "not just good instruction." In other words, "generic effective instruction" is almost certainly not enough to be effective with ELs. Aspects of both "generic" and "EL-specific" instruction are probably necessary, especially if the goal is more rapid progress by lower-achieving student groups so as to close achievement gaps. The purpose of the CQELL is to indicate the extent to which an instructional element is present in a lesson. Making these determinations reliably is the first step in trying to investigate which classroom elements are in fact related to ELs' achievement. Because we lack a comprehensive, empirically validated model for effective EL instructional practices (Goldenberg & Coleman, 2010), the CQELL cannot be used to evaluate teachers or classrooms. The CQELL is descriptive, not evaluative. Its purpose is simply to provide reliable quantitative scales for capturing the degrees to which specific elements are present during classroom language arts lessons. It has been developed in response to the perceived need for better instrumentation in the service of research leading to better instruction for better learning outcomes for English learners.
Appropriate uses of the CQELL Research on the prevalence of specific teaching practices and the associations between
these practices and student learning outcomes. Feedback and advising for pre-service teacher education program faculty, regarding
possible instructional elements to include in lessons with English Learners. EL coaching for pre-service teachers in the context of supervised teaching practica. Focusing discussion and targeting possible areas for school-wide improvement, low-
stakes monitoring and analysis in the context of school-wide communities of practice
4

(e.g., Professional Learning Communities [PLCs], grade-level groups of teachers within a school).
EL coaching or mentoring for in-service teachers on use of instructional practices identified as focus areas for school wide improvement.
Teacher self-assessment used to guide lesson planning.
Inappropriate uses of the CQELL Consequential evaluations for pre-service teachers, pre-service teacher education
programs, in-service teachers, principals, schools, or districts. Prescriptive models of “best practices” for EL instruction—The CQELL was designed with
the goal of documenting the degree to which different teaching practices are employed. The elements of instruction included in the CQELL are believed to represent sound teaching practices for ELs, but it bears repeating that the CQELL is first and foremost a research tool. Over time, research using the CQELL should help determine which of these elements, alone or in combination, are demonstrably related to ELs' achievement. The fact that an element is included in the CQELL does not signify that its effectiveness has already been demonstrated through empirical research.
Reporting ScalesThe CQELL addresses six “generic” elements of classroom environments believed to promote achievement for all learners, plus eight “EL-specific” elements that recent work suggests may contribute to classroom quality for ELs. These 14 CQELL elements are not intended as an exhaustive list, but there is at least some theoretical or empirical work suggesting that each of them can help promote ELs' achievement. Future research may show that some of the CQELL elements are in fact unimportant, or may identify additional elements beyond those included. The CQELL authors do not take a position as to what group or cluster of elements, if any, comprises "effective instruction" for English learners. For an overview of the research base that informs the CQELL, see Goldenberg and Coleman (2010).
Each element comprises between two and ten specific operationalizing sub-items. The elements and sub-items are fully described, with examples and non-examples, in a detailed CQELL codebook. While or after observing a lesson (for approximately 45 minutes), an observer indicates whether each sub-item is observed (O) or not observed (N).1 Based on sub-item coding, the observer then assigns a prominence rating to each element on a five-point scale, from "not observed" to "very prominent." Each prominence rating scale is described separately, with descriptions of each scale point. In most cases, prominence ratings are constrained by the patterns of sub-items observed, but there is generally latitude for interpretation. Prominence ratings are more than simple summaries of sub-item codes, and cannot be derived from the sub-item coding alone.
1 For one sub-item, N3, a “Not Applicable” (N/A) code is also specified.
5

Section A of the CQELL protocol is captioned:
A. Classroom instruction is organized according to levels of students’ English proficiency.
This section addresses various aspects of overall classroom organization according to levels of students’ English proficiency. It differs from the remaining sections in that it does not include a prominence rating. The nine sub-items in Section A are intended to distinguish various potentially important variations in grouping and instructional differentiation.
Sections B through G of the CQELL protocol are captioned:
B. The lesson addresses one or more learning objectives. C. The teacher/lesson explicitly links new concepts to students’ background experiences and
past learning.D. The teacher provides accurate input and models skills, strategies, concepts related to the
lesson objective.E The teacher/lesson provides structured opportunities for students to practice and
consolidate skills, strategies and concepts.F. The teacher uses assessment as part of instruction.G. The teacher uses techniques designed to engage all students.
These sections, each associated with a single prominence rating, address the six “generic” elements of classroom learning environments hypothesized to support effective instruction for all students, including ELs.
Sections H through N of the CQELL protocol are captioned:
H. The lesson addresses one or more language objectives targeted for ELLs.I. The teacher provides instruction on the language objective.J. The teacher uses strategies to adapt instruction for students with limited English proficiency.K. The lesson uses materials and visuals to clarify and illustrate concepts.L. The teacher/lesson provides opportunities for interactions that encourage student language
production in English.M. The teacher/lesson provides primary language support during lesson.N. The classroom uses predictable and consistent management and routines.
These CQELL instructional elements are classified as “EL-specific” because they are hypothesized to contribute in particular to positive learning outcomes for ELs. The principal elements of “sheltered instruction” are included in this set.
There is one prominence rating associated with each of sections H, I, K, L, M, and N. There are two prominence ratings associated with section J: “Teacher Adapts Language” and “Teacher Adapts Strategies.”
6

For research purposes, users may wish to form composites by taking weighed or unweighted sums of two or more prominence ratings. Researchers may also wish to investigate the predictive validity of specific sub-items. Such applications are by no means discouraged, but the reliability and validity of sub-items and of composite scales are not reported.2
Chronology of CQELL Development
The CQELL grew out of a need for a new generation of reliable and valid classroom-level assessment tools to fully characterize the kinds of classrooms in which English learners can reach their full potential. The earliest version of the CQELL was developed in 2006 as an evaluation tool for the Standards-Based Differentiated ELD Instruction professional development program (Center for Language Minority Education and Research, 2005).
From 2006 to 2008, researchers at CSU-Long Beach and at Stanford University conducted various studies that involved training classroom observers to use the CQELL, conducting CQELL observations of ELA instruction, and then refining the CQELL based on levels of CQELL observer debriefs, analysis of observer inconsistencies, and feedback from school administrators and experienced staff developers. This work surfaced areas needing improvement in the measure, but also documented the reliability and validity of the CQELL (Goldenberg, Coleman, Amabisca, McKnight, & McKnight, 2008). In February 2009, two of the authors (Goldenberg and Haertel) developed a proposal in response to a request for proposals issued jointly by The W. T. Grant Foundation and The Spencer Foundation, to further refine and validate the CQELL protocol and to obtain some preliminary evidence concerning the relation of CQELL elements to student learning outcomes. The proposal was successful, and with the generous support of these two sponsoring foundations, four additional cycles of data collection, analysis, and instrument refinement were completed. These included two Classroom Observation Studies, referred to in this report as COS 1 and COS 2, and two Video Coding studies, referred to here as VCS 1 and VCS 2. Although the basic structure of the CQELL has remained unchanged, the CQELL has undergone numerous revisions that have led to its present form. In the remainder of this section, these four final data collections, COS 1, VCS 1, COS 2, and VCS 2, are described. This Technical Report does not include any analyses of CQELL versions from 2008 or earlier.
Data CollectionCOS 1, COS 2, and VCS 2 employed different samples of ELA lessons taught by 2nd and
5th grade teachers in their own classrooms VCS 1 employed videotapes of two ELA lessons, one taught by a kindergarten teacher and one by a third-grade teacher in their own classrooms. All of the classrooms videotaped and nearly all of the classrooms observed included at least 50 percent ELs, of whom the majority were native Spanish speakers.3 Each of the live observation
2 Sub-item descriptive statistics and inter-rater agreement indices are provided in this report. Sub-item reliabilities are not reported. Reliability and criterion-related validity of several composites of prominence ratings were investigated, but did not appear to add any useful information beyond that available in the individual prominence ratings.3 In a very small number of COS 2 classrooms, in spite of careful screening, the proportion of ELs turned out to be slightly below 50 percent.
7
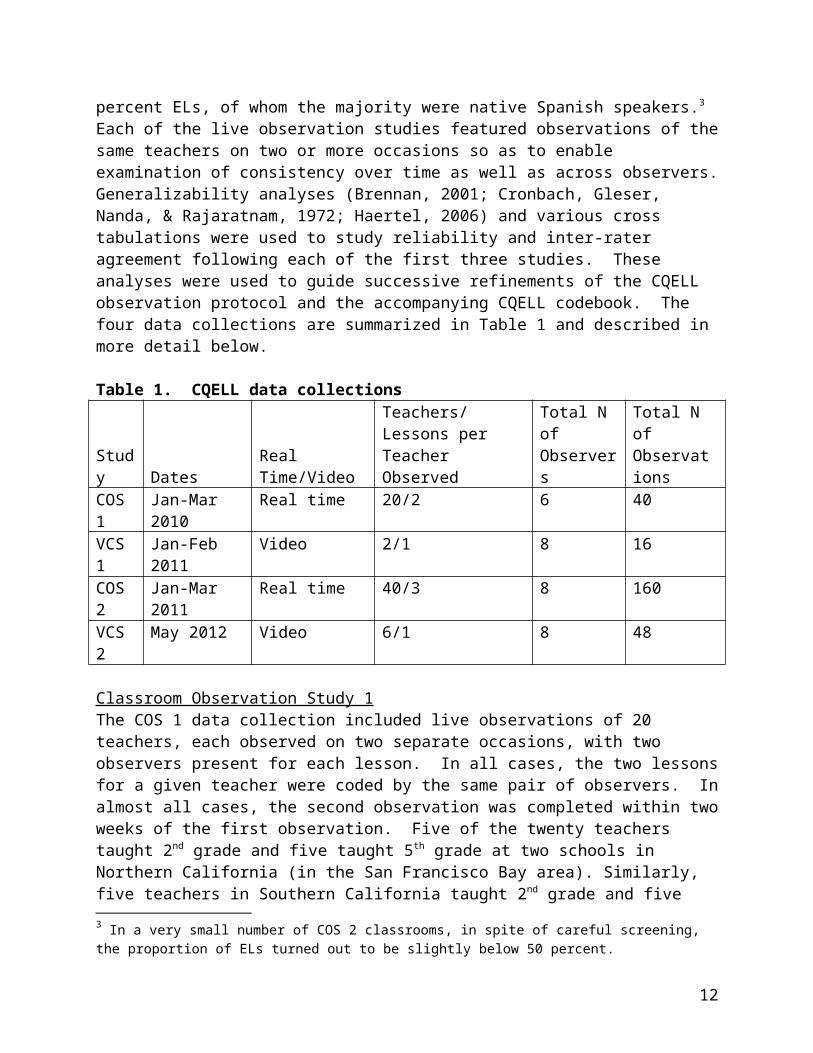
studies featured observations of the same teachers on two or more occasions so as to enable examination of consistency over time as well as across observers. Generalizability analyses (Brennan, 2001; Cronbach, Gleser, Nanda, & Rajaratnam, 1972; Haertel, 2006) and various cross tabulations were used to study reliability and inter-rater agreement following each of the first three studies. These analyses were used to guide successive refinements of the CQELL observation protocol and the accompanying CQELL codebook. The four data collections are summarized in Table 1 and described in more detail below.
Table 1. CQELL data collections
Study Dates Real Time/VideoTeachers/Lessons per Teacher Observed
Total N of Observers
Total N of Observations
COS 1 Jan-Mar 2010 Real time 20/2 6 40VCS 1 Jan-Feb 2011 Video 2/1 8 16COS 2 Jan-Mar 2011 Real time 40/3 8 160VCS 2 May 2012 Video 6/1 8 48
Classroom Observation Study 1The COS 1 data collection included live observations of 20 teachers, each observed on two separate occasions, with two observers present for each lesson. In all cases, the two lessons for a given teacher were coded by the same pair of observers. In almost all cases, the second observation was completed within two weeks of the first observation. Five of the twenty teachers taught 2nd grade and five taught 5th grade at two schools in Northern California (in the San Francisco Bay area). Similarly, five teachers in Southern California taught 2nd grade and five taught 5th grade at two schools in the Los Angeles area. Data were collected by a total of six observers, three from Northern California and three from Southern California. All six participated in a single two-day CQELL training session, conducted at CSU-Long Beach, to prepare them to use the CQELL protocol and CQELL codebook. (Feedback on training was solicited for use in refining training procedures.) Student outcome data (statewide end-of-year tests in English language arts and mathematics) were obtained from school records. For fifth-grade students, prior-year test scores were obtained to use as statistical controls. An end-of-year writing assessment was also administered to fifth graders.
This study confirmed that good inter-rater agreement could be obtained at the level of sub-item codes, although good inter-rater agreement did not necessarily translate into high reliability coefficients, because some sub-items showed little variance across teachers. Reliabilities were somewhat lower for the prominence ratings, in part due to instability across occasions. Some refinements were made to clarify items found to be confusing, based on both empirical analyses of inter-rater agreement and feedback from the observers themselves. During COS 1, observers debriefed frequently to highlight ambiguities and recommend clarifications. All original, independent ratings were preserved unchanged, but debriefing may have affected subsequent coding over the course of the data collection.
8
Video Coding Study 1A total of eight observers, four from Northern California and four from Southern California, participated in a two-day CQELL training prior to the VCS 1 data collection. One observer from the Northern California team and one from the Southern California team had participated in COS 1. For the remaining six observers, the training session was their first exposure to the CQELL. The VCS 1 collection involved coding videotaped English language arts lessons from a kindergarten class and a third grade class. Each of the eight observers viewed and coded both lessons.
In this study, matters of particular attention were (1) effectiveness of revisions made on the basis of COS 1 and (2) conceptual distinction built into the CQELL between a lesson’s content objective versus its language objective. This distinction was viewed as critical to the theoretical framework of sheltered instruction, but was proving highly problematical in practice when applied to elementary English language arts lessons. In the versions of the CQELL used for COS 1 and VCS 1, many sub-items were handled differently depending on the presence of an explicit language objective, and some prominence ratings were specific to one kind of objective or the other. For that reason, if one observer discerned distinct language and content objectives but another observer did not, that discrepancy affected inter-rater agreement across a large number of sub-items and prominence ratings. Analyses of observers’ codes against the actual video recordings, as well as feedback from the observers themselves, led to moderately extensive revisions in a further effort to clarify this key question. In the subsequent, final version of the CQELL, judgments as to the presence versus absence of a language objective are relevant for only two prominence ratings (H and I) and their associated sub-items. No generalizability analyses were performed using these data because only two lessons were employed. However, having eight independent codings of each lesson proved extremely valuable for purposes of further CQELL protocol revisions.
Classroom Observation Study 2The eight observers from VCS 1 also conducted all observations for the COS 2 data collection.4 COS 2 included live observations of 40 teachers. Ten 2nd and ten 5th grade teachers were observed at eight schools in two school districts in Northern California; and ten 2nd and ten 5th grade teachers were observed at eight schools in two school districts in Southern California. Each of these 40 teachers was observed on three separate occasions. On one occasion, typically the first, a pair of observers were both present. The remaining two observations were each conducted by one member of that same pair. Thus, a total of 160 ELA lesson observations were completed, distributed over a total of 120 ELA lessons. For each teacher, one lesson was coded by two observers and each of two additional lessons was coded by a single observer. Student outcome data were collected, as for COS 1.
4 The eight COS 2 observers included Rhoda Coleman, who was one of the lead developers for the CQELL and was responsible for all observer training across the four studies. The complex sample design for COS 2 made it infeasible to conduct analyses or report results excluding Dr. Coleman’s observations, but the inclusion of her data may have caused some slight inflation of inter-rater agreement and reliability statistics reported in Tables 4 and 5, as well as a slight reduction in standard errors from COS 2 reported in Table 6.
9
Following this study, some restructuring was done so that inconsistency in coding for a language objective would not affect additional codes. The coding of sub-items was also simplified. In all CQELL versions up to this point, in addition to “Observed” (O) or “Not Observed” (N) codes, observers had the option to code “Evidence” (E). On average across all sub-items, the E code was used only about 2.7 percent of the time, although there were a total of eight sub-items for which it was used more than ten percent of the time. The E code proved to be a continuing source of confusion. Data analyses were conducted first pooling E codes with N codes, then pooling E codes with O codes, and results were compared. Because only tiny differences were found, the CQELL development team finally concluded that it was best to dispense with the E code altogether, and the CQELL codebook and observation protocol were revised accordingly. CQELL codebook examples were also further refined. It was clear from Study 3 that observers who carefully followed the CQELL codebook instructions were quite consistent, but a couple of outlier observers highlighted the need for more emphasis during CQELL observer training on the importance of referring back to the CQELL codebook, adhering to all coding instructions, and checking completed protocols to assure that no sub-items or prominence ratings were omitted.
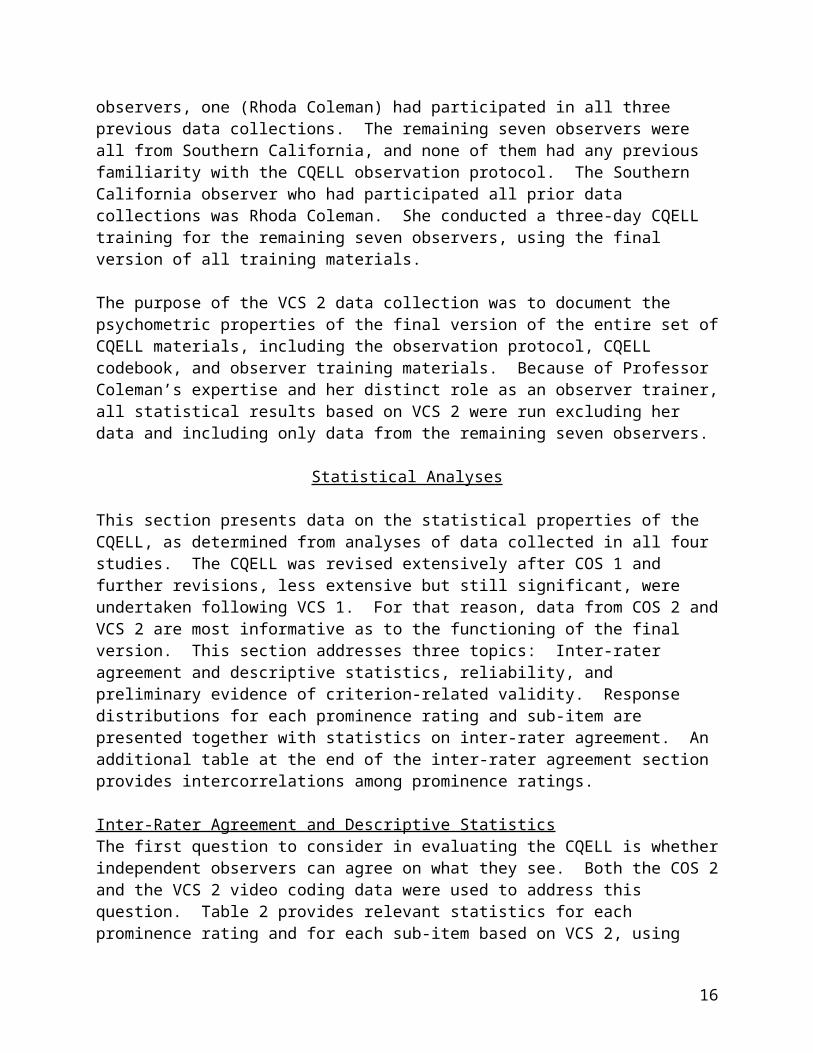
Video Coding Study 2The VCS 2 data collection employed six video recordings, including three 2nd grade lessons and three 5th grade lessons, taught by a total of six different teachers. All six videos were coded by each of eight observers using the final versions of the CQELL observation protocol and "What is CQELL?". Of these eight observers, one (Rhoda Coleman) had participated in all three previous data collections. The remaining seven observers were all from Southern California, and none of them had any previous familiarity with the CQELL observation protocol. The Southern California observer who had participated all prior data collections was Rhoda Coleman. She conducted a three-day CQELL training for the remaining seven observers, using the final version of all training materials.
The purpose of the VCS 2 data collection was to document the psychometric properties of the final version of the entire set of CQELL materials, including the observation protocol, CQELL codebook, and observer training materials. Because of Professor Coleman’s expertise and her distinct role as an observer trainer, all statistical results based on VCS 2 were run excluding her data and including only data from the remaining seven observers.
Statistical Analyses
This section presents data on the statistical properties of the CQELL, as determined from analyses of data collected in all four studies. The CQELL was revised extensively after COS 1 and further revisions, less extensive but still significant, were undertaken following VCS 1. For that reason, data from COS 2 and VCS 2 are most informative as to the functioning of the final version. This section addresses three topics: Inter-rater agreement and descriptive statistics, reliability, and preliminary evidence of criterion-related validity. Response distributions for each prominence rating and sub-item are presented together with statistics on inter-rater
10
agreement. An additional table at the end of the inter-rater agreement section provides intercorrelations among prominence ratings.
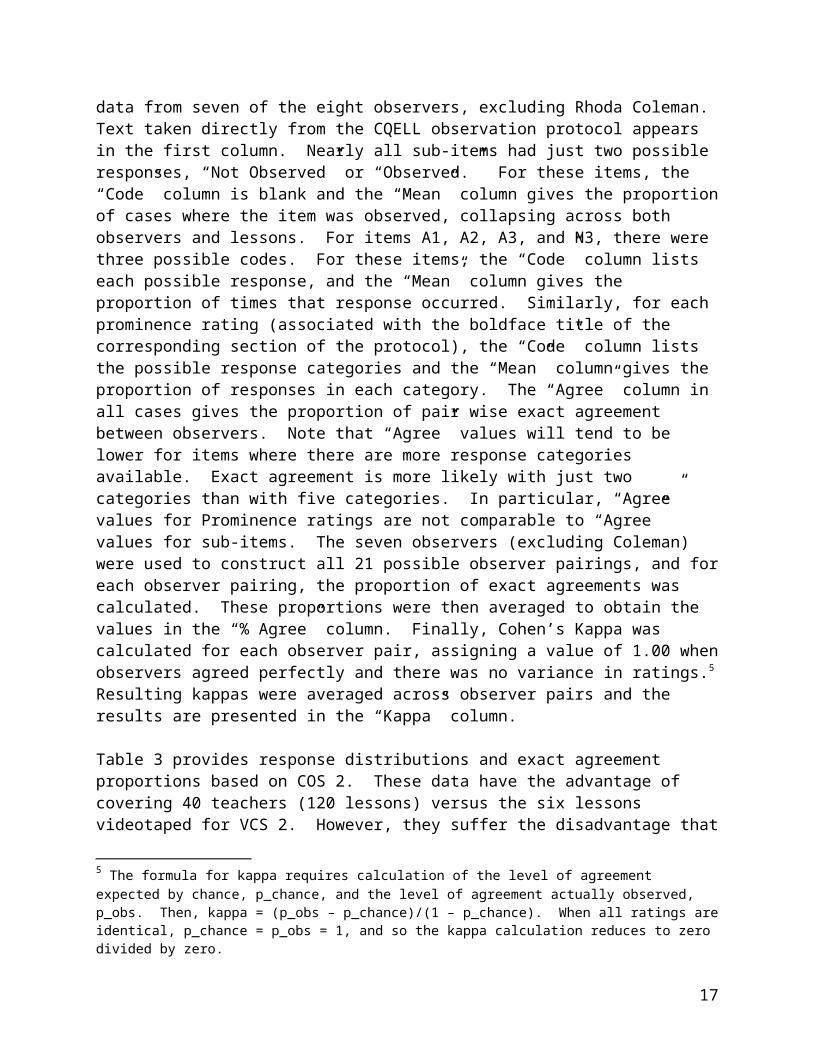
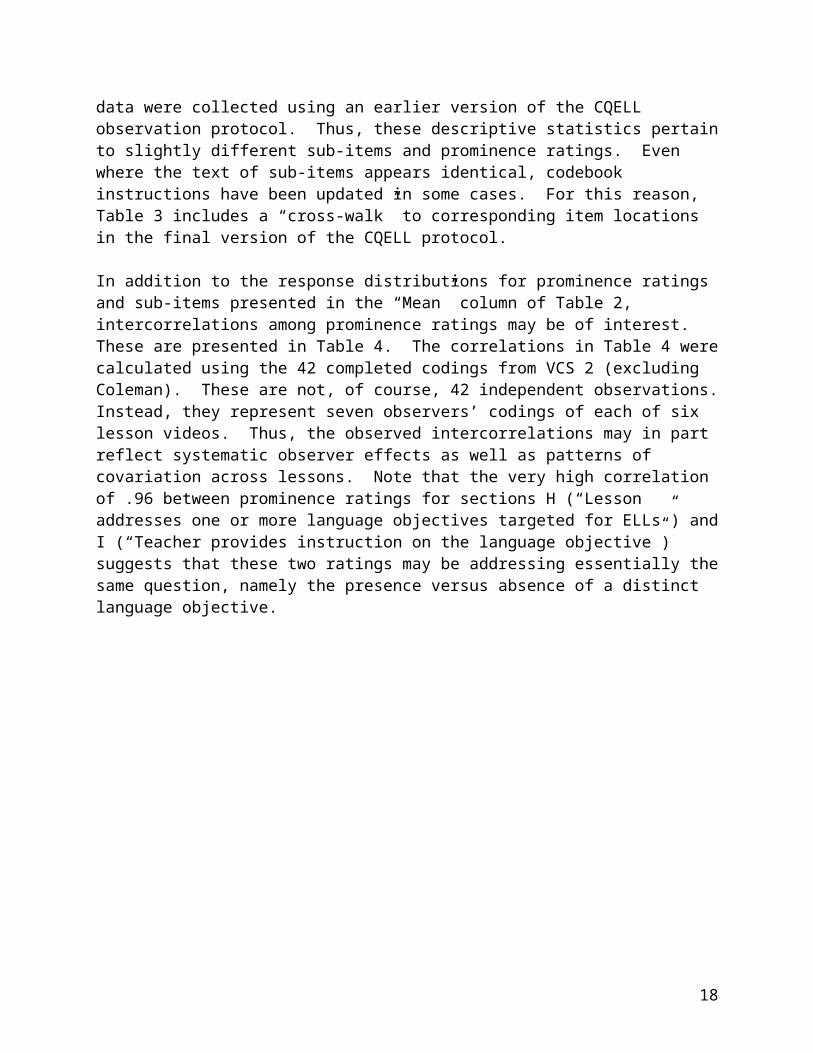
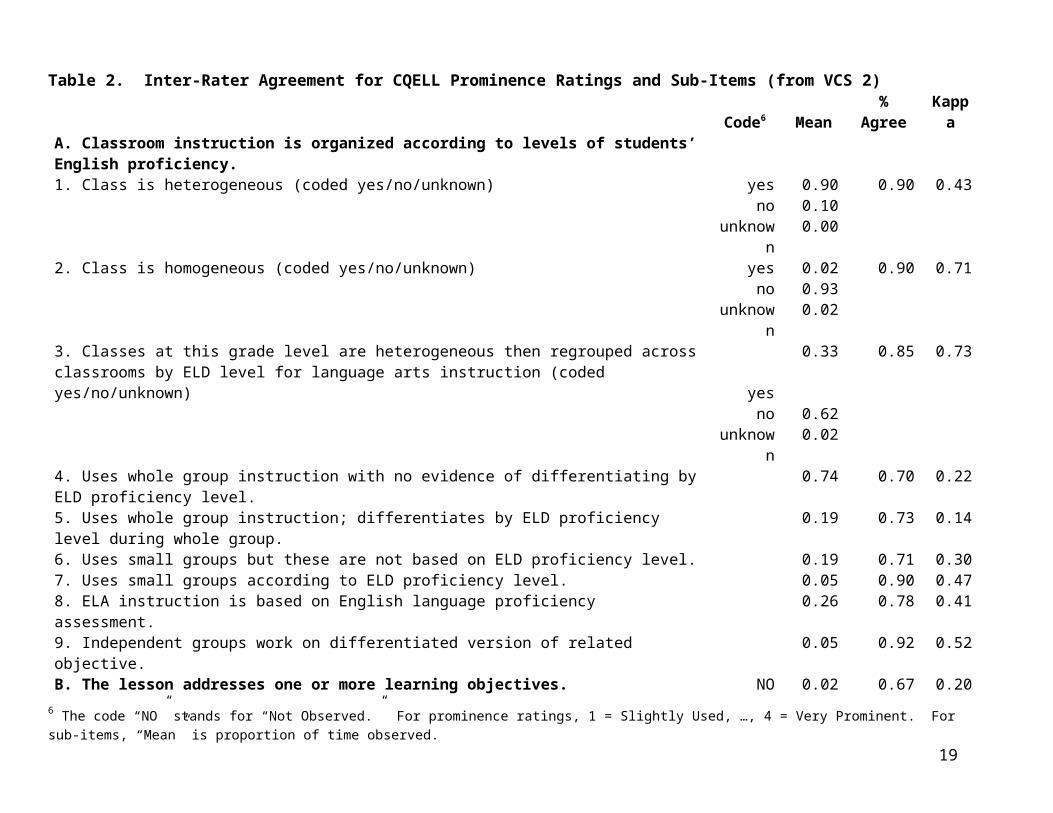
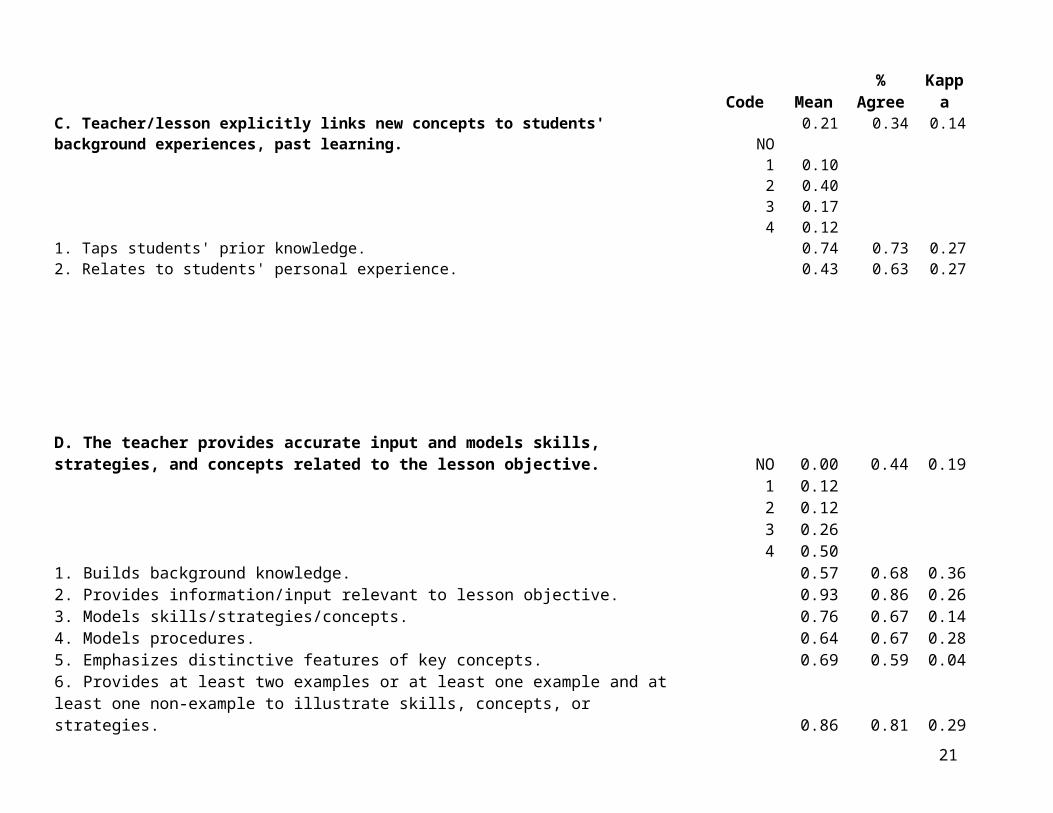
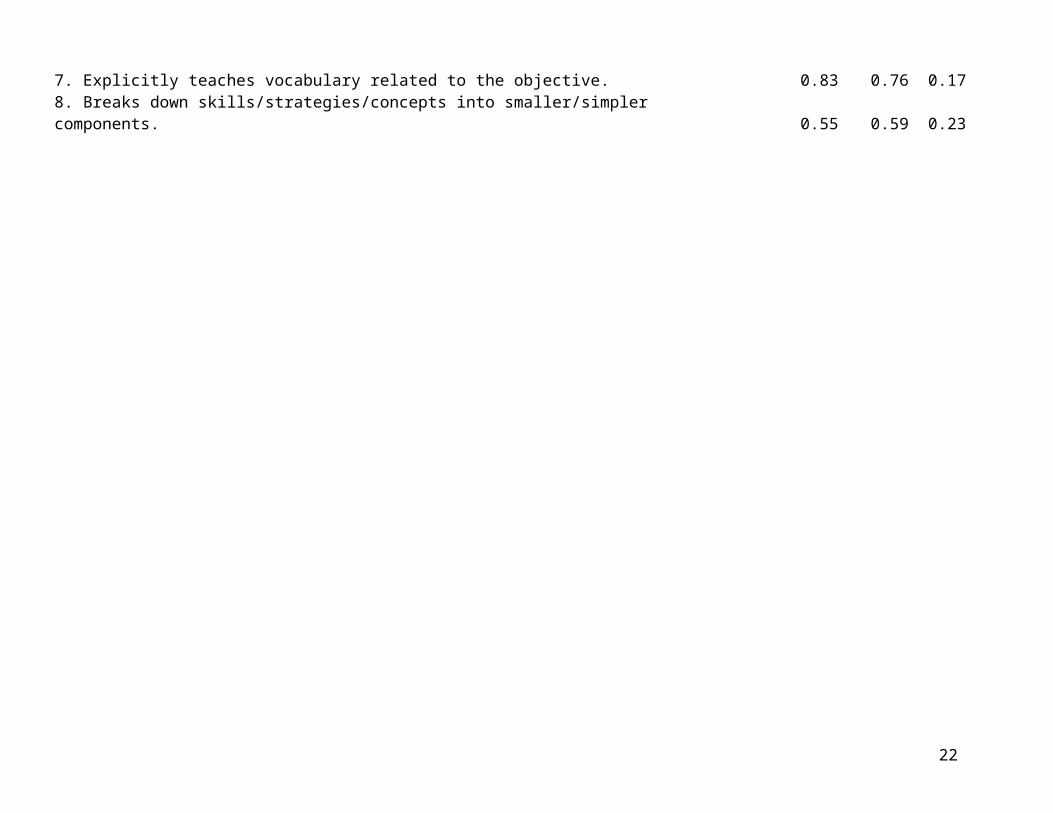
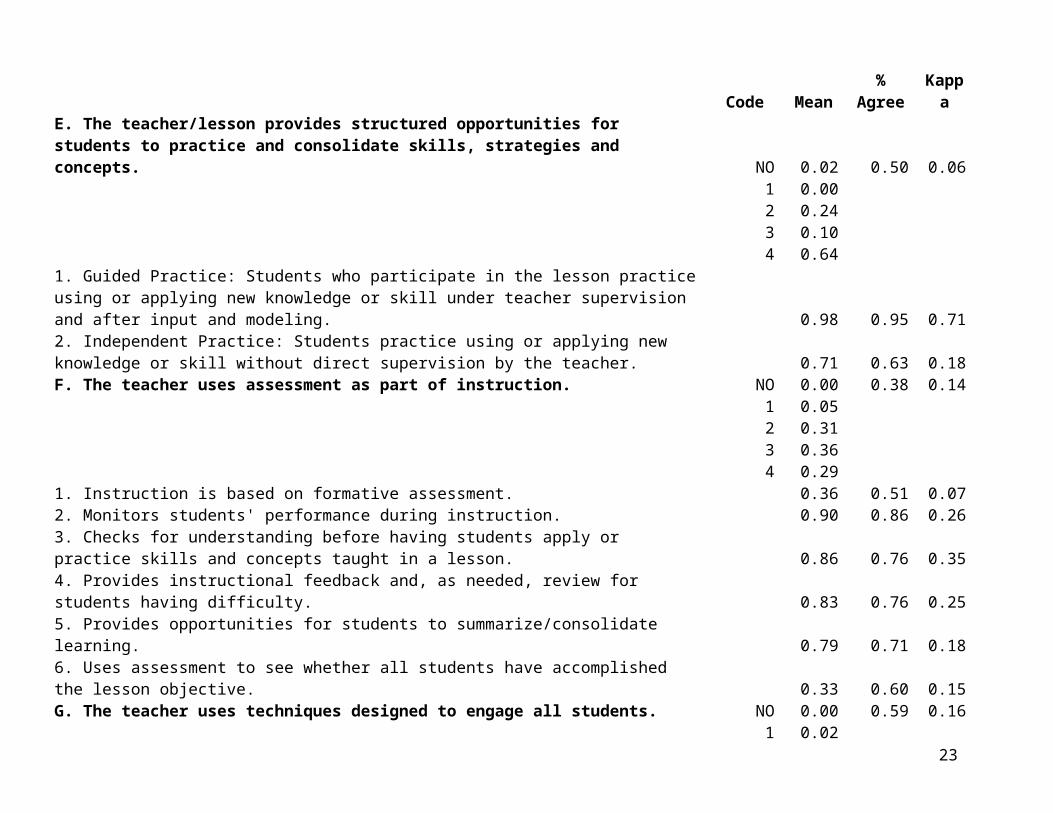
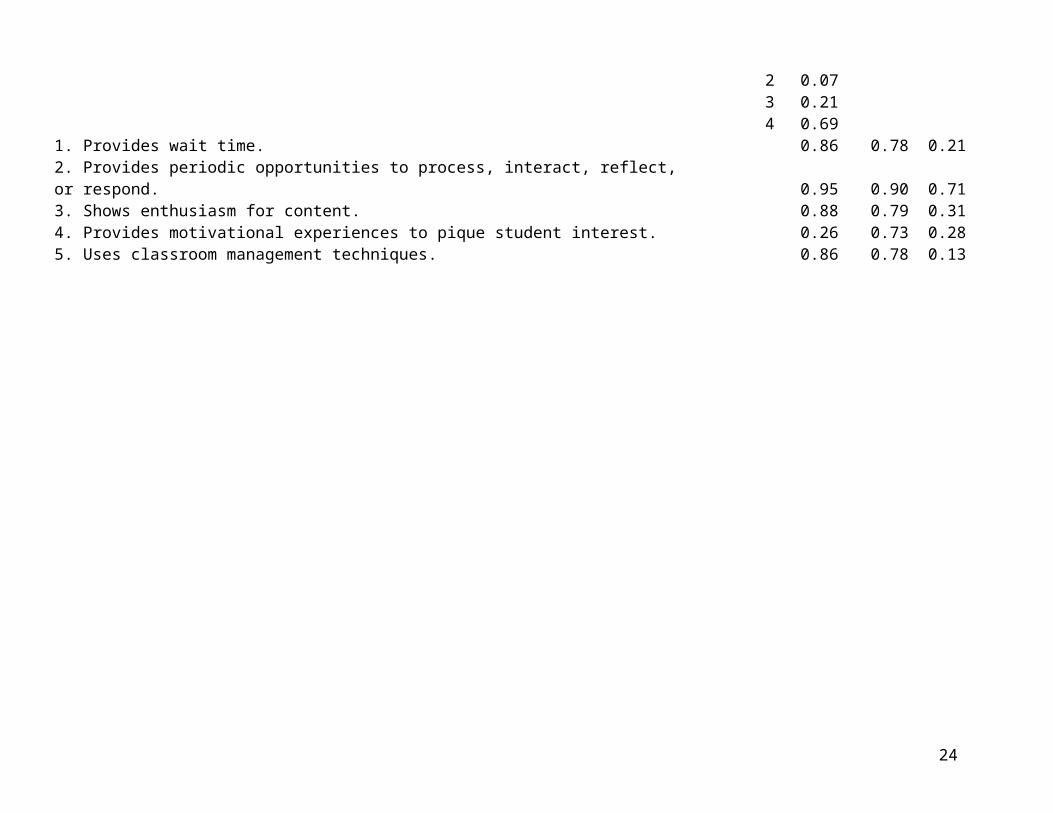
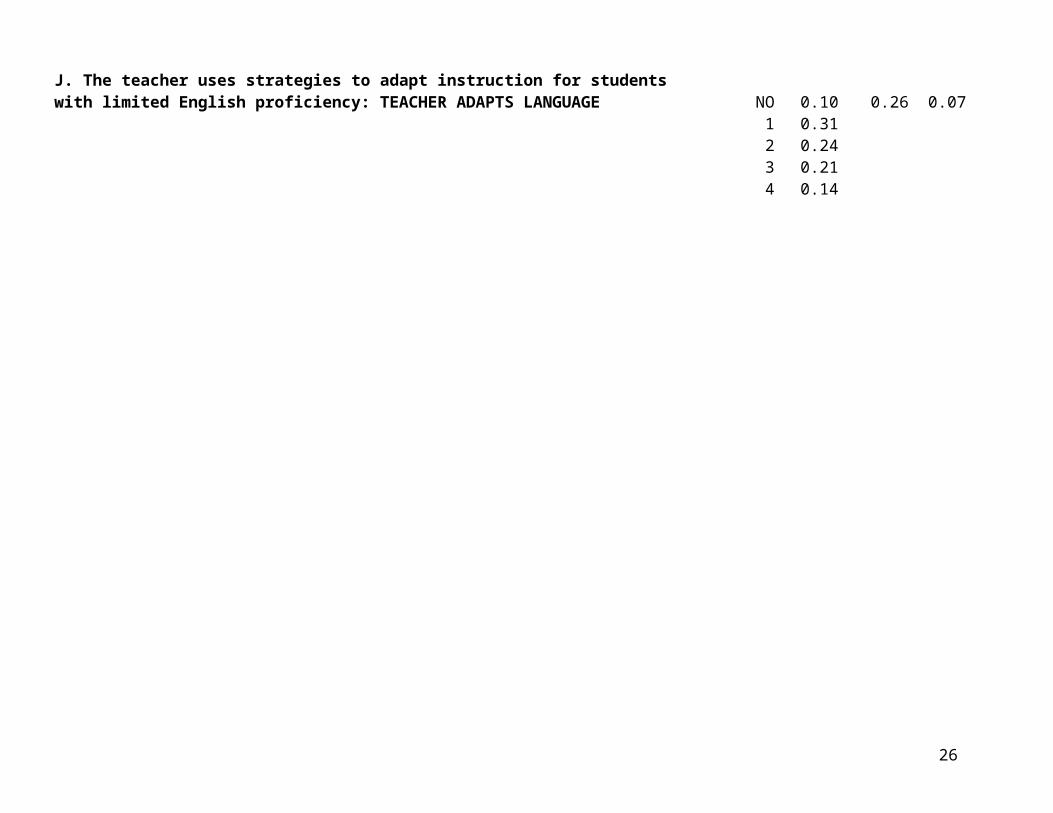
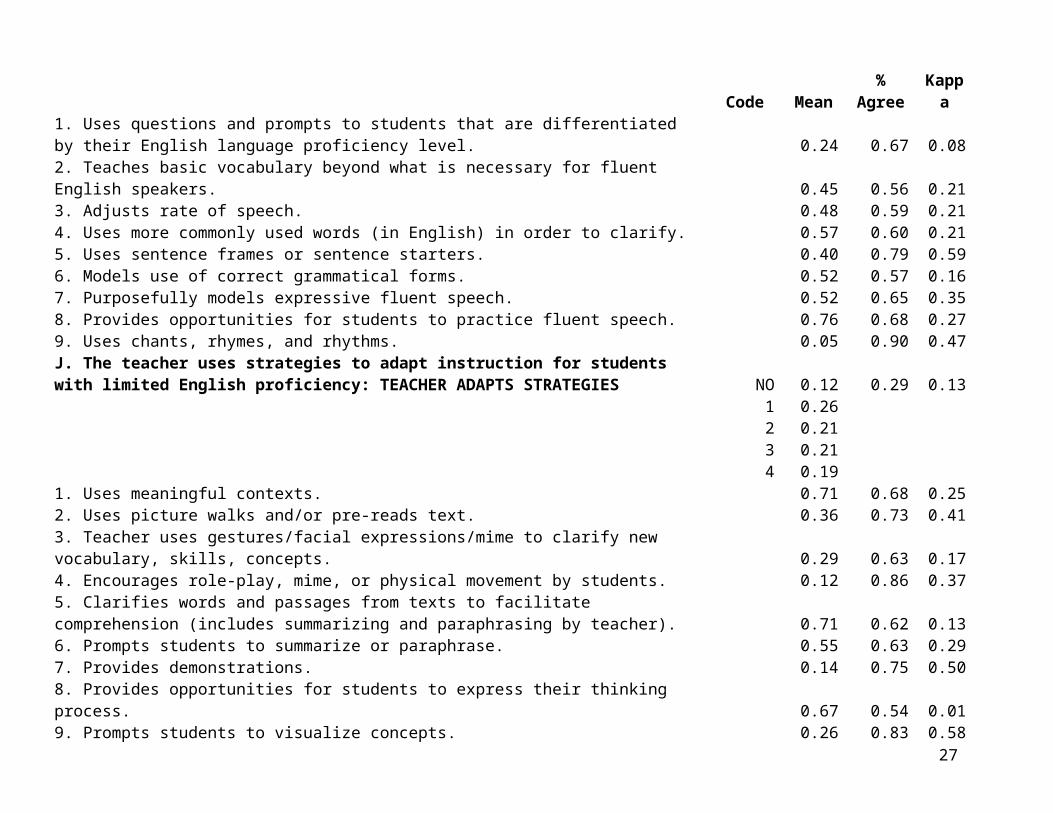
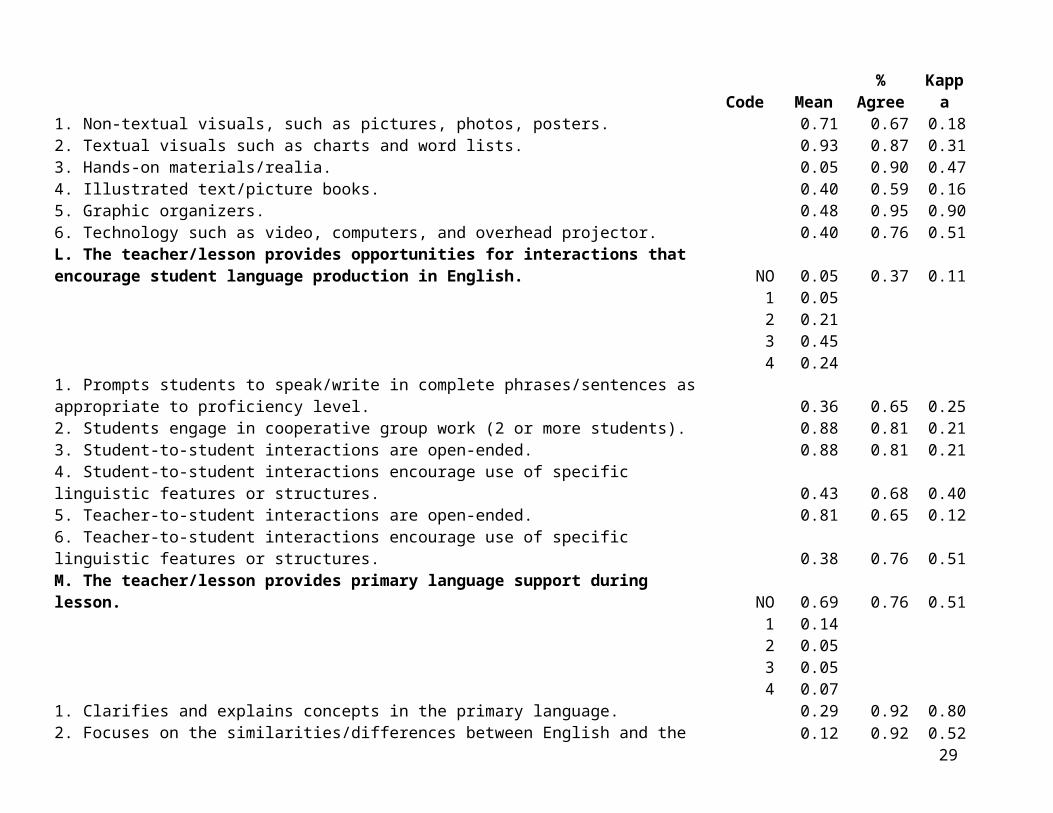
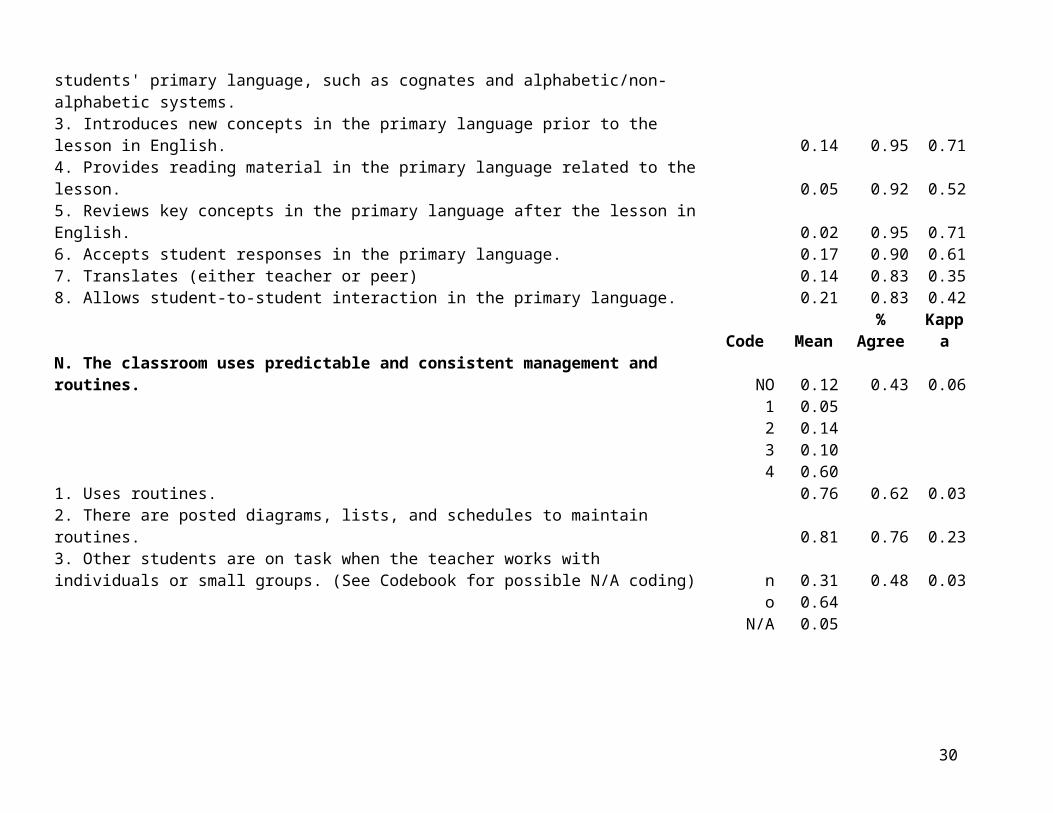
Inter-Rater Agreement and Descriptive StatisticsThe first question to consider in evaluating the CQELL is whether independent observers can agree on what they see. Both the COS 2 and the VCS 2 video coding data were used to address this question. Table 2 provides relevant statistics for each prominence rating and for each sub-item based on VCS 2, using data from seven of the eight observers, excluding Rhoda Coleman. Text taken directly from the CQELL observation protocol appears in the first column. Nearly all sub-items had just two possible responses, “Not Observed” or “Observed.” For these items, the “Code” column is blank and the “Mean” column gives the proportion of cases where the item was observed, collapsing across both observers and lessons. For items A1, A2, A3, and N3, there were three possible codes. For these items, the “Code” column lists each possible response, and the “Mean” column gives the proportion of times that response occurred. Similarly, for each prominence rating (associated with the boldface title of the corresponding section of the protocol), the “Code” column lists the possible response categories and the “Mean” column gives the proportion of responses in each category. The “Agree” column in all cases gives the proportion of pair wise exact agreement between observers. Note that “Agree” values will tend to be lower for items where there are more response categories available. Exact agreement is more likely with just two categories than with five categories. In particular, “Agree” values for Prominence ratings are not comparable to “Agree” values for sub-items. The seven observers (excluding Coleman) were used to construct all 21 possible observer pairings, and for each observer pairing, the proportion of exact agreements was calculated. These proportions were then averaged to obtain the values in the “% Agree” column. Finally, Cohen’s Kappa was calculated for each observer pair, assigning a value of 1.00 when observers agreed perfectly and there was no variance in ratings.5 Resulting kappas were averaged across observer pairs and the results are presented in the “Kappa” column.
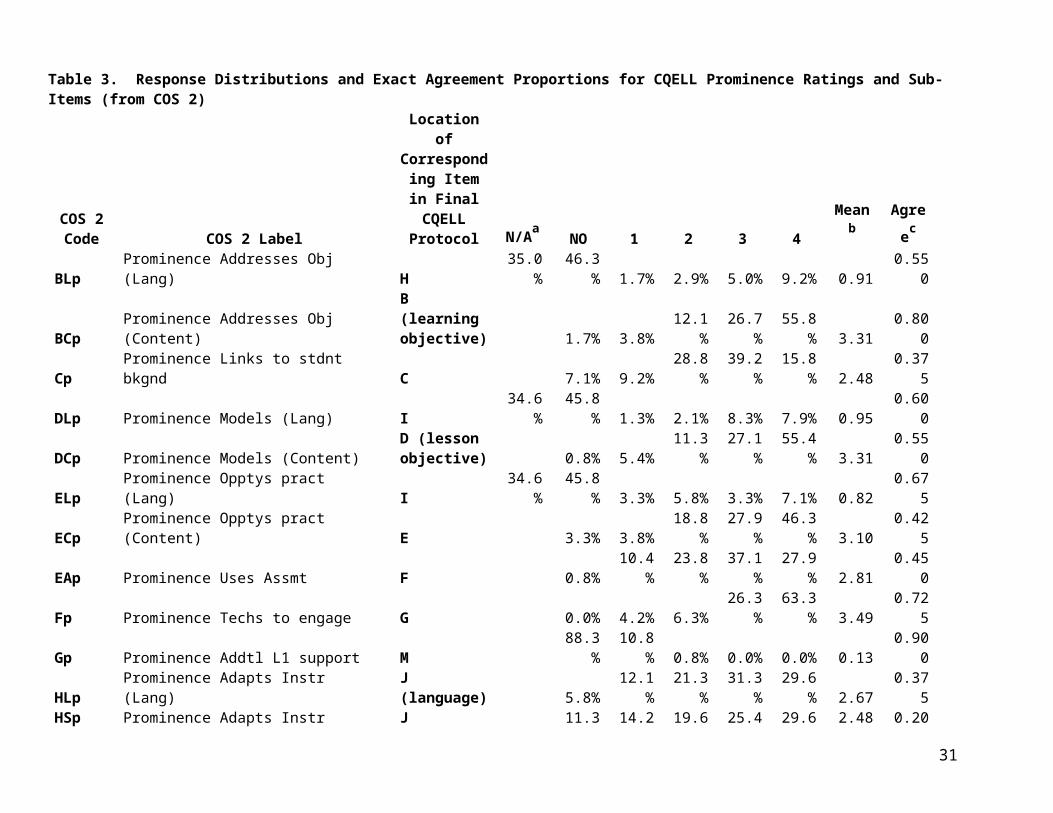
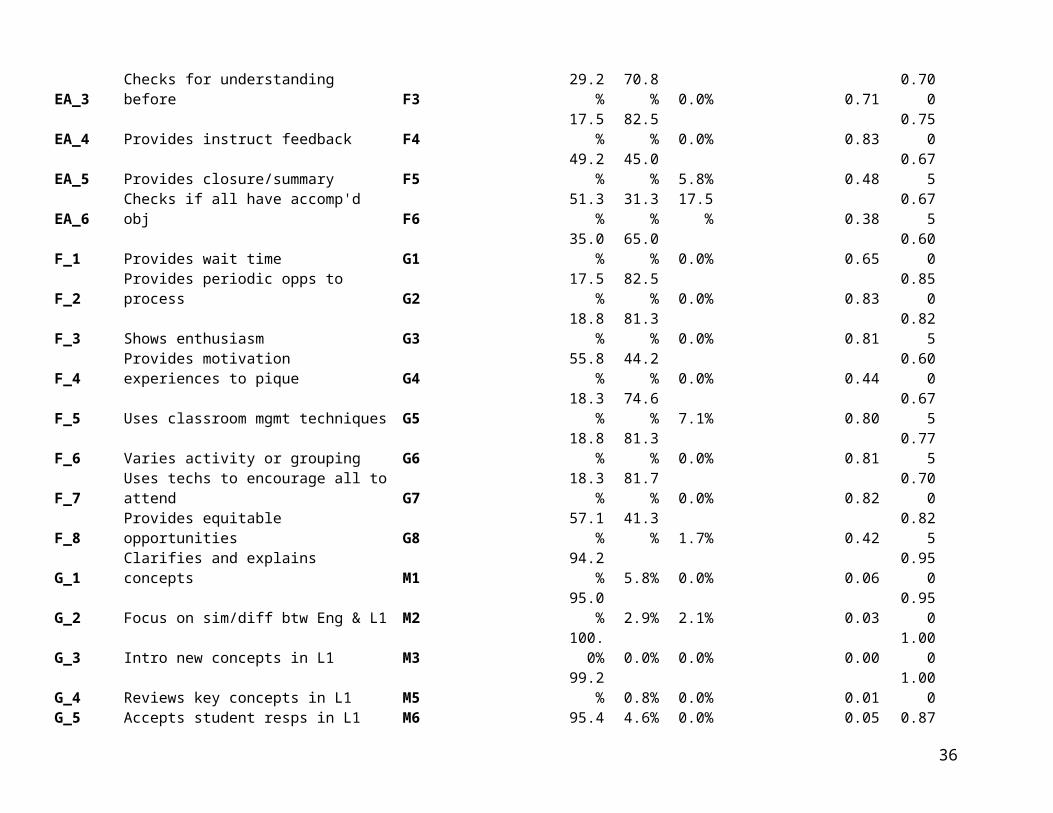
Table 3 provides response distributions and exact agreement proportions based on COS 2. These data have the advantage of covering 40 teachers (120 lessons) versus the six lessons videotaped for VCS 2. However, they suffer the disadvantage that data were collected using an earlier version of the CQELL observation protocol. Thus, these descriptive statistics pertain to slightly different sub-items and prominence ratings. Even where the text of sub-items appears identical, codebook instructions have been updated in some cases. For this reason, Table 3 includes a “cross-walk” to corresponding item locations in the final version of the CQELL protocol.
In addition to the response distributions for prominence ratings and sub-items presented in the “Mean” column of Table 2, intercorrelations among prominence ratings may be of interest. These are presented in Table 4. The correlations in Table 4 were calculated using the 42 completed codings from VCS 2 (excluding Coleman). These are not, of course, 42 independent 5 The formula for kappa requires calculation of the level of agreement expected by chance, p_chance, and the level of agreement actually observed, p_obs. Then, kappa = (p_obs – p_chance)/(1 – p_chance). When all ratings are identical, p_chance = p_obs = 1, and so the kappa calculation reduces to zero divided by zero.
11
observations. Instead, they represent seven observers’ codings of each of six lesson videos. Thus, the observed intercorrelations may in part reflect systematic observer effects as well as patterns of covariation across lessons. Note that the very high correlation of .96 between prominence ratings for sections H (“Lesson addresses one or more language objectives targeted for ELLs”) and I (“Teacher provides instruction on the language objective”) suggests that these two ratings may be addressing essentially the same question, namely the presence versus absence of a distinct language objective.
12

Table 2. Inter-Rater Agreement for CQELL Prominence Ratings and Sub-Items (from VCS 2)Code6 Mean % Agree Kappa
A. Classroom instruction is organized according to levels of students’ English proficiency.1. Class is heterogeneous (coded yes/no/unknown) yes 0.90 0.90 0.43
no 0.10unknown 0.00
2. Class is homogeneous (coded yes/no/unknown) yes 0.02 0.90 0.71no 0.93
unknown 0.023. Classes at this grade level are heterogeneous then regrouped across classrooms by ELD level for language arts instruction (coded yes/no/unknown) yes
0.33 0.85 0.73
no 0.62unknown 0.02
4. Uses whole group instruction with no evidence of differentiating by ELD proficiency level. 0.74 0.70 0.225. Uses whole group instruction; differentiates by ELD proficiency level during whole group. 0.19 0.73 0.146. Uses small groups but these are not based on ELD proficiency level. 0.19 0.71 0.307. Uses small groups according to ELD proficiency level. 0.05 0.90 0.478. ELA instruction is based on English language proficiency assessment. 0.26 0.78 0.419. Independent groups work on differentiated version of related objective. 0.05 0.92 0.52B. The lesson addresses one or more learning objectives. NO 0.02 0.67 0.20
1 0.002 0.073 0.144 0.76
1. There is a discernible objective. 0.98 0.95 0.712. A discernible objective is explicitly stated to students. 0.98 0.95 0.713. The lesson objective is aligned with grade level language arts content standards. 0.79 0.68 0.05
6 The code “NO” stands for “Not Observed.” For prominence ratings, 1 = Slightly Used, …, 4 = Very Prominent. For sub-items, “Mean” is proportion of time observed.13
Code Mean % Agree KappaC. Teacher/lesson explicitly links new concepts to students' background experiences, past learning. NO 0.21 0.34 0.14
1 0.102 0.403 0.174 0.12
1. Taps students' prior knowledge. 0.74 0.73 0.272. Relates to students' personal experience. 0.43 0.63 0.27
D. The teacher provides accurate input and models skills, strategies, and concepts related to the lesson objective. NO 0.00 0.44 0.19
1 0.122 0.123 0.264 0.50
1. Builds background knowledge. 0.57 0.68 0.362. Provides information/input relevant to lesson objective. 0.93 0.86 0.263. Models skills/strategies/concepts. 0.76 0.67 0.144. Models procedures. 0.64 0.67 0.285. Emphasizes distinctive features of key concepts. 0.69 0.59 0.046. Provides at least two examples or at least one example and at least one non-example to illustrate skills, concepts, or strategies. 0.86 0.81 0.297. Explicitly teaches vocabulary related to the objective. 0.83 0.76 0.178. Breaks down skills/strategies/concepts into smaller/simpler components. 0.55 0.59 0.23
14
Code Mean % Agree KappaE. The teacher/lesson provides structured opportunities for students to practice and consolidate skills, strategies and concepts. NO 0.02 0.50 0.06
1 0.002 0.243 0.104 0.64
1. Guided Practice: Students who participate in the lesson practice using or applying new knowledge or skill under teacher supervision and after input and modeling. 0.98 0.95 0.712. Independent Practice: Students practice using or applying new knowledge or skill without direct supervision by the teacher. 0.71 0.63 0.18F. The teacher uses assessment as part of instruction. NO 0.00 0.38 0.14
1 0.052 0.313 0.364 0.29
1. Instruction is based on formative assessment. 0.36 0.51 0.072. Monitors students' performance during instruction. 0.90 0.86 0.263. Checks for understanding before having students apply or practice skills and concepts taught in a lesson. 0.86 0.76 0.354. Provides instructional feedback and, as needed, review for students having difficulty. 0.83 0.76 0.255. Provides opportunities for students to summarize/consolidate learning. 0.79 0.71 0.186. Uses assessment to see whether all students have accomplished the lesson objective. 0.33 0.60 0.15G. The teacher uses techniques designed to engage all students. NO 0.00 0.59 0.16
1 0.022 0.073 0.214 0.69
1. Provides wait time. 0.86 0.78 0.212. Provides periodic opportunities to process, interact, reflect, or respond. 0.95 0.90 0.713. Shows enthusiasm for content. 0.88 0.79 0.314. Provides motivational experiences to pique student interest. 0.26 0.73 0.285. Uses classroom management techniques. 0.86 0.78 0.13
15
Code Mean % Agree Kappa6. Varies activities and/or groupings at least twice. 0.86 0.78 0.217. Uses techniques designed to encourage all students to attend and respond (e.g., signaling, choral responses, white boards). 0.83 0.75 0.218. Provides equitable opportunities for each individual student to participate and/or contribute during classroom activities, (e.g., pulling "equity" sticks with names). 0.50 1.00 1.00H. The lesson addresses one or more language objectives targeted for ELLs. NO 0.48 0.33 0.07
1 0.022 0.103 0.214 0.19
1. There is a discernible language objective. 0.52 0.51 0.112. A discernible language objective is explicitly stated to students. 0.40 0.56 0.203. The language objective is appropriate to the content objective being taught. 0.48 0.49 0.054. The language objective is appropriate to students' language proficiency levels. 0.36 0.51 0.06I. The teacher provides instruction on the language objective. NO 0.48 0.37 0.07
1 0.052 0.003 0.124 0.36
1. Provides information/input relevant to the language objective. 0.52 0.51 0.112. Models the language objective. 0.43 0.54 0.213. Provides opportunities to practice the language objective. 0.48 0.49 0.054. Checks for understanding and monitors students' performance on the language objective. 0.48 0.52 0.11J. The teacher uses strategies to adapt instruction for students with limited English proficiency: TEACHER ADAPTS LANGUAGE NO 0.10 0.26 0.07
1 0.312 0.243 0.214 0.14
16
Code Mean % Agree Kappa1. Uses questions and prompts to students that are differentiated by their English language proficiency level. 0.24 0.67 0.082. Teaches basic vocabulary beyond what is necessary for fluent English speakers. 0.45 0.56 0.213. Adjusts rate of speech. 0.48 0.59 0.214. Uses more commonly used words (in English) in order to clarify. 0.57 0.60 0.215. Uses sentence frames or sentence starters. 0.40 0.79 0.596. Models use of correct grammatical forms. 0.52 0.57 0.167. Purposefully models expressive fluent speech. 0.52 0.65 0.358. Provides opportunities for students to practice fluent speech. 0.76 0.68 0.279. Uses chants, rhymes, and rhythms. 0.05 0.90 0.47J. The teacher uses strategies to adapt instruction for students with limited English proficiency: TEACHER ADAPTS STRATEGIES NO 0.12 0.29 0.13
1 0.262 0.213 0.214 0.19
1. Uses meaningful contexts. 0.71 0.68 0.252. Uses picture walks and/or pre-reads text. 0.36 0.73 0.413. Teacher uses gestures/facial expressions/mime to clarify new vocabulary, skills, concepts. 0.29 0.63 0.174. Encourages role-play, mime, or physical movement by students. 0.12 0.86 0.375. Clarifies words and passages from texts to facilitate comprehension (includes summarizing and paraphrasing by teacher). 0.71 0.62 0.136. Prompts students to summarize or paraphrase. 0.55 0.63 0.297. Provides demonstrations. 0.14 0.75 0.508. Provides opportunities for students to express their thinking process. 0.67 0.54 0.019. Prompts students to visualize concepts. 0.26 0.83 0.5810. Provides a common experience to build language before speaking and/or writing. 0.43 0.54 0.06K. The lesson uses materials and visuals to clarify and illustrate concepts. NO 0.00 0.43 0.26
1 0.292 0.193 0.174 0.36
17
Code Mean % Agree Kappa1. Non-textual visuals, such as pictures, photos, posters. 0.71 0.67 0.182. Textual visuals such as charts and word lists. 0.93 0.87 0.313. Hands-on materials/realia. 0.05 0.90 0.474. Illustrated text/picture books. 0.40 0.59 0.165. Graphic organizers. 0.48 0.95 0.906. Technology such as video, computers, and overhead projector. 0.40 0.76 0.51L. The teacher/lesson provides opportunities for interactions that encourage student language production in English. NO 0.05 0.37 0.11
1 0.052 0.213 0.454 0.24
1. Prompts students to speak/write in complete phrases/sentences as appropriate to proficiency level. 0.36 0.65 0.252. Students engage in cooperative group work (2 or more students). 0.88 0.81 0.213. Student-to-student interactions are open-ended. 0.88 0.81 0.214. Student-to-student interactions encourage use of specific linguistic features or structures. 0.43 0.68 0.405. Teacher-to-student interactions are open-ended. 0.81 0.65 0.126. Teacher-to-student interactions encourage use of specific linguistic features or structures. 0.38 0.76 0.51M. The teacher/lesson provides primary language support during lesson. NO 0.69 0.76 0.51
1 0.142 0.053 0.054 0.07
1. Clarifies and explains concepts in the primary language. 0.29 0.92 0.802. Focuses on the similarities/differences between English and the students' primary language, such as cognates and alphabetic/non-alphabetic systems. 0.12 0.92 0.523. Introduces new concepts in the primary language prior to the lesson in English. 0.14 0.95 0.714. Provides reading material in the primary language related to the lesson. 0.05 0.92 0.525. Reviews key concepts in the primary language after the lesson in English. 0.02 0.95 0.716. Accepts student responses in the primary language. 0.17 0.90 0.617. Translates (either teacher or peer) 0.14 0.83 0.358. Allows student-to-student interaction in the primary language. 0.21 0.83 0.42
18
Code Mean % Agree KappaN. The classroom uses predictable and consistent management and routines. NO 0.12 0.43 0.06
1 0.052 0.143 0.104 0.60
1. Uses routines. 0.76 0.62 0.032. There are posted diagrams, lists, and schedules to maintain routines. 0.81 0.76 0.233. Other students are on task when the teacher works with individuals or small groups. (See Codebook for possible N/A coding) n 0.31 0.48 0.03
o 0.64N/A 0.05
19
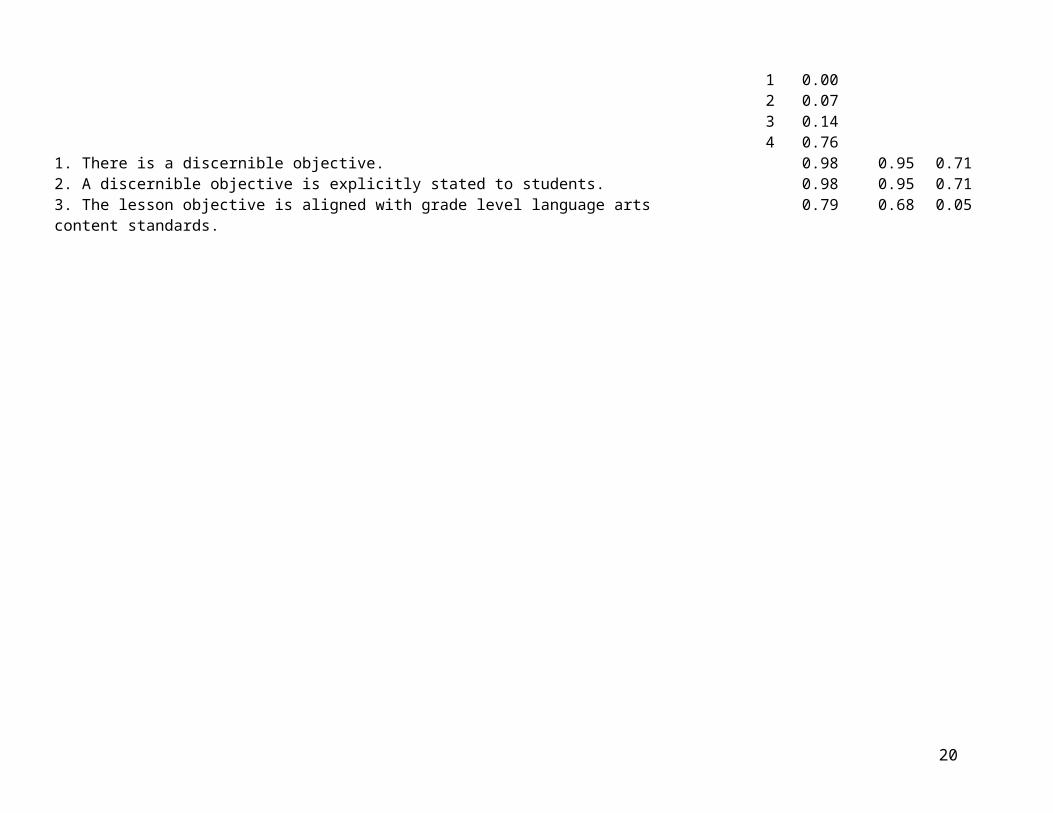
Table 3. Response Distributions and Exact Agreement Proportions for CQELL Prominence Ratings and Sub-Items (from COS 2)
COS 2 Code COS 2 Label
Location of Corresponding Item in Final
CQELL Protocol N/Aa
NO 1 2 3 4 Meanb Agreec
BLp Prominence Addresses Obj (Lang) H 35.0% 46.3% 1.7% 2.9% 5.0% 9.2% 0.91 0.550
BCp Prominence Addresses Obj (Content)B (learning objective) 1.7% 3.8% 12.1% 26.7% 55.8% 3.31 0.800
Cp Prominence Links to stdnt bkgnd C 7.1% 9.2% 28.8% 39.2% 15.8% 2.48 0.375DLp Prominence Models (Lang) I 34.6% 45.8% 1.3% 2.1% 8.3% 7.9% 0.95 0.600
DCp Prominence Models (Content)D (lesson objective) 0.8% 5.4% 11.3% 27.1% 55.4% 3.31 0.550
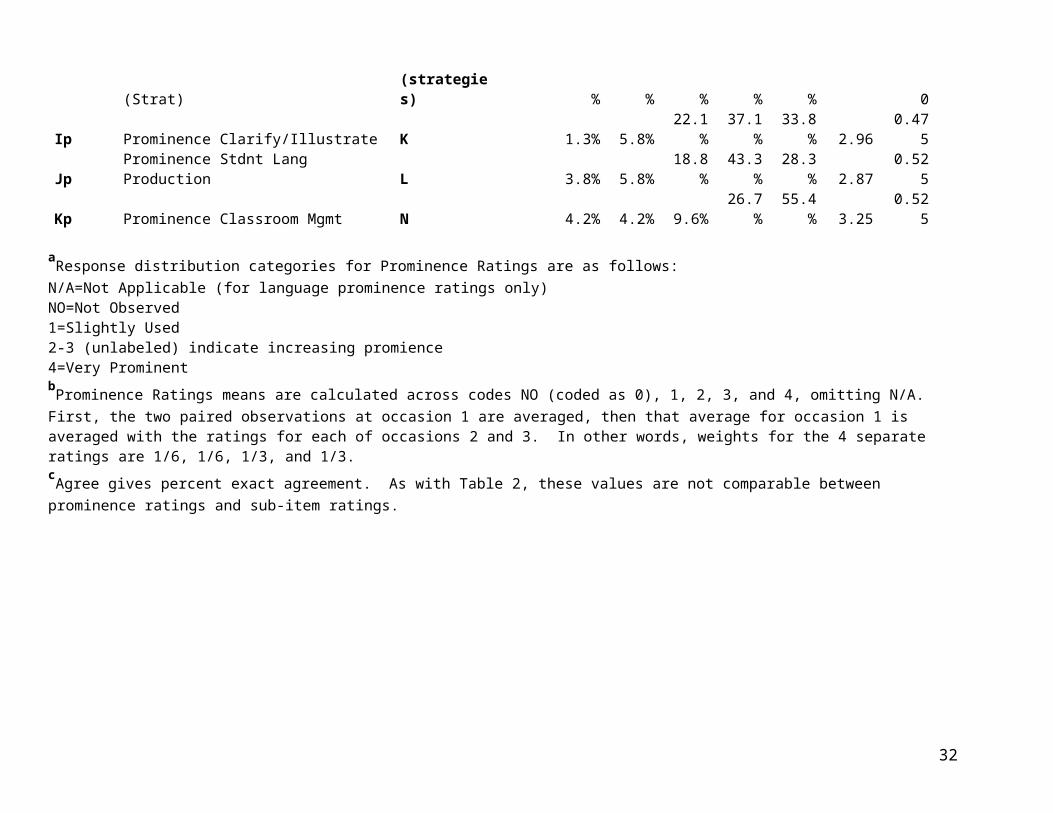
ELp Prominence Opptys pract (Lang) I 34.6% 45.8% 3.3% 5.8% 3.3% 7.1% 0.82 0.675ECp Prominence Opptys pract (Content) E 3.3% 3.8% 18.8% 27.9% 46.3% 3.10 0.425EAp Prominence Uses Assmt F 0.8% 10.4% 23.8% 37.1% 27.9% 2.81 0.450Fp Prominence Techs to engage G 0.0% 4.2% 6.3% 26.3% 63.3% 3.49 0.725Gp Prominence Addtl L1 support M 88.3% 10.8% 0.8% 0.0% 0.0% 0.13 0.900HLp Prominence Adapts Instr (Lang) J (language) 5.8% 12.1% 21.3% 31.3% 29.6% 2.67 0.375HSp Prominence Adapts Instr (Strat) J (strategies) 11.3% 14.2% 19.6% 25.4% 29.6% 2.48 0.200Ip Prominence Clarify/Illustrate K 1.3% 5.8% 22.1% 37.1% 33.8% 2.96 0.475Jp Prominence Stdnt Lang Production L 3.8% 5.8% 18.8% 43.3% 28.3% 2.87 0.525Kp Prominence Classroom Mgmt N 4.2% 4.2% 9.6% 26.7% 55.4% 3.25 0.525
aResponse distribution categories for Prominence Ratings are as follows:N/A=Not Applicable (for language prominence ratings only)NO=Not Observed1=Slightly Used2-3 (unlabeled) indicate increasing promience4=Very Prominent bProminence Ratings means are calculated across codes NO (coded as 0), 1, 2, 3, and 4, omitting N/A. First, the two paired observations at occasion 1 are averaged, then that average for occasion 1 is averaged with the ratings for each of occasions 2 and 3. In other words, weights for the 4 separate ratings are 1/6, 1/6, 1/3, and 1/3.cAgree gives percent exact agreement. As with Table 2, these values are not comparable between prominence ratings and sub-item ratings.
20
COS 2 Code COS 2 Label
Location of Corresponding
Item in Final CQELL
Protocol N/A NOd1 2 3 4 Meane
AgreeA_1 Class is heterogeneous A1 1.7% 95.4% 2.9% 0.98 0.975A_2 Class is homogeneous A2 92.9% 4.2% 2.9% 0.04 0.975A_3 Class is heterogeneous then regrouped A3 85.0% 10.8% 4.2% 0.11 0.950A_4 Whole group instr, no evid. differentiating A4 10.0% 90.0% 0.0% 0.90 0.900
A_5Whole group instr, diff by ELD during whole gp A5 85.4% 14.2% 0.4% 0.14 0.900
A_6 Uses small group not based on ELD level A6 72.9% 26.7% 0.4% 0.27 0.900A_7 Uses small group according to ELD level A7 95.8% 4.2% 0.0% 0.04 1.000
A_8fELA instruction based on EL prof assessment A8 70.6% 8.8% 20.6% 0.11 0.800
A_9 Indep gps work on diff version of related obj A9 96.7% 2.5% 0.8% 0.03 1.000
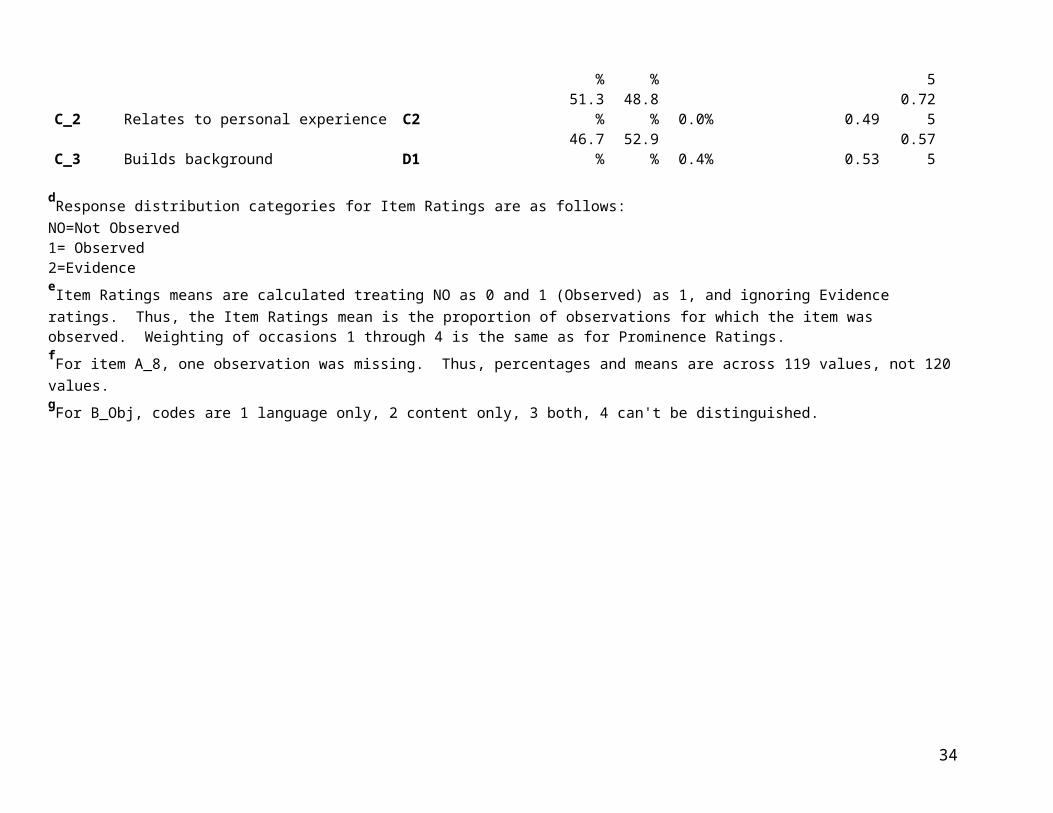
B_Objg Type(s) of objective(s) addressed 0.4% 44.2% 18.3% 37.1% 0.625B_Discrn There is a discernible objective B1 6.7% 92.5% 0.8% 0.93 0.850B_Stated Explicitly stated discernible objective B2 26.3% 72.1% 1.7% 0.73 0.875C_1 Taps prior knowledge C1 25.4% 74.6% 0.0% 0.75 0.625C_2 Relates to personal experience C2 51.3% 48.8% 0.0% 0.49 0.725C_3 Builds background D1 46.7% 52.9% 0.4% 0.53 0.575
dResponse distribution categories for Item Ratings are as follows:NO=Not Observed1= Observed2=EvidenceeItem Ratings means are calculated treating NO as 0 and 1 (Observed) as 1, and ignoring Evidence ratings. Thus, the Item Ratings mean is the proportion of observations for which the item was observed. Weighting of occasions 1 through 4 is the same as for Prominence Ratings.fFor item A_8, one observation was missing. Thus, percentages and means are across 119 values, not 120 values.gFor B_Obj, codes are 1 language only, 2 content only, 3 both, 4 can't be distinguished.
21
COS 2 Code COS 2 Label
Location of Corresp. Item in Final CQELL
Protocol N/A NO 1 2 3 4 Mean AgreeD_1 Provides info/input relevant to obj D2 12.1% 87.9% 0.0% 0.88 0.825D_2 Models skills D3 22.5% 76.7% 0.8% 0.77 0.800D_3 Models procedures D4 43.8% 55.8% 0.4% 0.56 0.750D_4 Emphasizes distinctive features D5 33.3% 66.7% 0.0% 0.67 0.650D_5 Provides examples D6 16.7% 82.5% 0.8% 0.83 0.850D_6 Explicitly teaches vocab D7 33.3% 66.3% 0.4% 0.67 0.600D_7 Provide instr on grammar forms 60.0% 39.6% 0.4% 0.40 0.700D_8 Breaks down skills D8 41.3% 58.8% 0.0% 0.59 0.625EP_1 Guided practice E1 10.0% 90.0% 0.0% 0.90 0.850EP_2 Independent practice E2 19.6% 75.4% 5.0% 0.79 0.775EP_3 Practicing the objective 40.8% 57.1% 2.1% 0.58 0.500EA_1 Instruct based on formative assmt F1 74.2% 12.9% 12.9% 0.15 0.800EA_2 Monitors students' perf F2 10.0% 90.0% 0.0% 0.90 0.900EA_3 Checks for understanding before F3 29.2% 70.8% 0.0% 0.71 0.700EA_4 Provides instruct feedback F4 17.5% 82.5% 0.0% 0.83 0.750EA_5 Provides closure/summary F5 49.2% 45.0% 5.8% 0.48 0.675EA_6 Checks if all have accomp'd obj F6 51.3% 31.3% 17.5% 0.38 0.675F_1 Provides wait time G1 35.0% 65.0% 0.0% 0.65 0.600F_2 Provides periodic opps to process G2 17.5% 82.5% 0.0% 0.83 0.850F_3 Shows enthusiasm G3 18.8% 81.3% 0.0% 0.81 0.825F_4 Provides motivation experiences to pique G4 55.8% 44.2% 0.0% 0.44 0.600F_5 Uses classroom mgmt techniques G5 18.3% 74.6% 7.1% 0.80 0.675F_6 Varies activity or grouping G6 18.8% 81.3% 0.0% 0.81 0.775F_7 Uses techs to encourage all to attend G7 18.3% 81.7% 0.0% 0.82 0.700F_8 Provides equitable opportunities G8 57.1% 41.3% 1.7% 0.42 0.825G_1 Clarifies and explains concepts M1 94.2% 5.8% 0.0% 0.06 0.950G_2 Focus on sim/diff btw Eng & L1 M2 95.0% 2.9% 2.1% 0.03 0.950
G_3 Intro new concepts in L1 M3100.0
% 0.0% 0.0% 0.00 1.000G_4 Reviews key concepts in L1 M5 99.2% 0.8% 0.0% 0.01 1.000
22
G_5 Accepts student resps in L1 M6 95.4% 4.6% 0.0% 0.05 0.875
COS 2 Code COS 2 Label
Location of Corresp. Item in Final CQELL
Protocol N/A NO 1 2 3 4 Mean AgreeG_6 Translates M7 98.8% 1.3% 0.0% 0.01 0.975
G_7hBases use of L1 on Ss Eng prof 67.9% 2.1% 30.0% 0.03 0.500
HL_1 Uses qs and prompts differentiated by JL1 86.3% 12.9% 0.8% 0.13 0.750HL_2 Teaches basic vocab for ELs JL2 57.1% 42.9% 0.0% 0.43 0.675HL_3 Adjusts rate of speech JL3 42.5% 57.5% 0.0% 0.58 0.450HL_4 Uses words in English familiar JL4 30.8% 67.5% 1.7% 0.69 0.600HL_5 Uses sentence frames JL5 62.9% 34.6% 2.5% 0.35 0.675HL_6 Models use of correct grammar forms JL6 72.9% 26.7% 0.4% 0.27 0.675HL_7 Purposeful expressive fluent speech JL7 56.3% 43.8% 0.0% 0.44 0.625HL_8 Provides opps for students to practice JL8 46.7% 53.3% 0.0% 0.53 0.550HS_01 Uses meaningful contexts JS1 46.7% 53.3% 0.0% 0.53 0.550HS_02 Uses picture walks JS2 87.9% 10.8% 1.3% 0.11 0.925HS_03 Uses gestures/facial expressions/mime JS3 55.4% 44.6% 0.0% 0.45 0.825HS_04 Encourages role play JS4 77.9% 22.1% 0.0% 0.22 0.825HS_05 Facilitates students' summarization JS6 60.0% 39.2% 0.8% 0.39 0.500HS_06 Clarifies difficult words and passages JS5 55.8% 44.2% 0.0% 0.44 0.600HS_07 Provides demonstration JS7 93.3% 5.8% 0.8% 0.06 0.900HS_08 Provides opps to verbalize thinking JS8 63.3% 36.7% 0.0% 0.37 0.600HS_09 Prompts students to visual concepts JS9 75.8% 23.3% 0.8% 0.24 0.750HS_10 Common exprnce to build lang before spk JS10 74.6% 25.4% 0.0% 0.25 0.575I_1 Non-textual visuals, such as pics K1 47.5% 40.8% 11.7% 0.46 0.675I_2 Textual visuals such as charts K2 11.3% 73.8% 15.0% 0.87 0.750I_3 Hands-on materials K3 81.7% 14.6% 3.8% 0.15 0.900I_4 Illustrated text/picture books K4 60.0% 37.1% 2.9% 0.38 0.825I_5 Chants, rhymes, rhythms JL9 74.2% 23.8% 2.1% 0.24 0.900I_6 Graphic organizers K5 41.7% 43.3% 15.0% 0.51 0.650I_7 Tech such as video K6 18.3% 68.8% 12.9% 0.79 0.950
hCodes for Item G_7 are NO = Unknown; 1 = Yes; 2 = No.
23
COS 2 Code COS 2 Label
Location of Corresp. Item in Final CQELL
Protocol N/A NO 1 2 3 4 Mean Agree
J_1Prompts stdnts speak/write complete phrases L1 66.3% 32.5% 1.3% 0.33 0.675
J_2 Cooperative group work L2 26.7% 73.3% 0.0% 0.73 0.850J_3 S-to-S interactions open ended L3 30.4% 69.6% 0.0% 0.70 0.825J_4 S-to-S interactions encourage specific … L4 73.8% 26.3% 0.0% 0.26 0.725J_5 T-to-S interactions are open ended L5 14.2% 85.8% 0.0% 0.86 0.700J_6 T-to-S interactions encourage specific … L6 57.9% 42.1% 0.0% 0.42 0.475K_1 Uses routines N1 15.8% 78.8% 5.4% 0.83 0.700K_2 There are posted diagrams, lists, and sched N2 16.3% 77.1% 6.7% 0.83 0.625K_3 Others on task while tchr with indiv/sm gp N3 45.4% 10.0% 44.6% 0.82 0.600
24
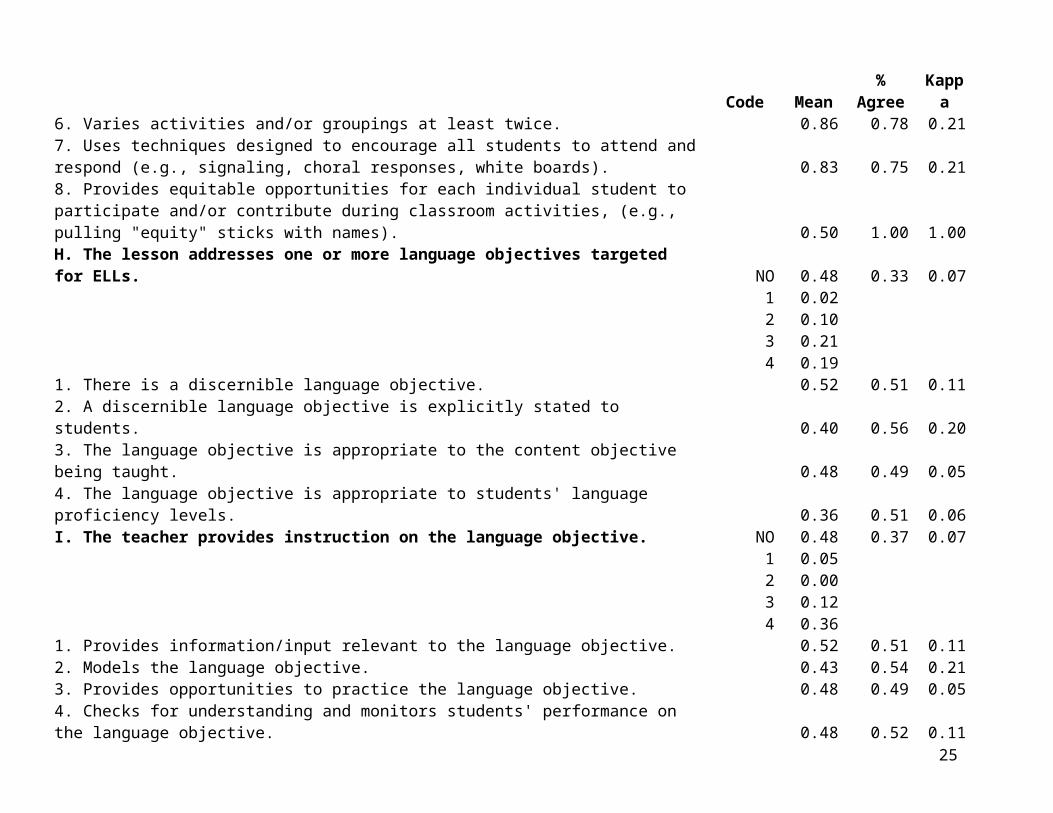
Table 4. Video Coding Study 2 intercorrelations among prominence ratingsB C D E F G H I J(Lng) J(Str) K L M N
B 1.00C 0.05 1.00D 0.46 0.29 1.00E 0.13 0.17 0.56 1.00F 0.00 -0.06 0.31 0.15 1.00G 0.45 0.15 0.43 0.26 0.07 1.00H 0.24 0.17 0.47 0.11 0.08 0.38 1.00I 0.27 0.12 0.49 0.20 0.09 0.40 0.96 1.00
J(Lng) 0.31 0.08 0.42 0.32 0.18 0.38 0.52 0.53 1.00
J(Str) 0.19 0.09 0.48 0.49 0.32 0.42 0.43 0.43 0.77 1.00K 0.25 0.18 0.12 0.19 0.09 0.31 0.20 0.22 0.41 0.45 1.00L 0.22 -0.11 0.10 0.14 0.11 0.13 0.33 0.38 0.70 0.48 0.46 1.00
M -0.01 0.05 0.13 0.23 -0.10 0.08 0.15 0.25 0.26 0.17 0.39 0.39 1.00N 0.33 0.21 0.29 0.20 -0.02 0.44 0.06 0.04 0.49 0.36 0.50 0.42 0.20 1.00
ReliabilityReliability, or generalizability, refers to the stability across replications of the measurement process. In the context of an observation protocol like the CQELL, generalizability theory (Brennan, 2001; Cronbach, et al., 1972; Haertel, 2006) provides more useful information than classical test theory, because it explicitly distinguishes among multiple sources of error. In the case of the CQELL, it is of interest to ask about stability across different observers, different occasions on which a teacher might be observed, and the interaction of these two dimensions of variation. If observers disagree (low inter-rater agreement), then improvements in training may be indicated. If inter-rater agreement is high but stability across occasions is low, then it may be necessary to observe a larger number of lessons in order to characterize a teacher’s performance accurately. Observer by occasion interaction and other interaction terms are most often regarded as sources of error. The most efficient data collection design may differ depending on the relative magnitude of these different variance components. For a thorough discussion of these issues, the reader is referred to Brennan (2001). Generalizability theory also offers a straightforward method for calculating the expected generalizability (i.e., reliability) under a range of alternative data collection scenarios, in this case referring to data collection designs varying according to the numbers of occasions (lessons) and observers present on each occasion.
Table 5 presents generalizability analyses based on COS 2 and VCS 2 data collections. VCS 2, which employed the final version of the CQELL observation protocol, was used to estimate variance components for all prominence ratings and sub-items. Because each teacher in the VCS 2 data collection was observed only once, occasion of measurement becomes a “hidden facet” in this design. As a consequence, the teacher variance component would be expected to increase, since any variability otherwise attributable to the teacher by occasion interaction will appear instead as part of the estimated teacher effect (the “signal,” or “true-score variance”). Generalizability analyses of VCS 2 provided estimates of variance components for teacher,
25
observer, and the teacher-by-observer interaction. Data from Rhoda Coleman were excluded in carrying out these calculations. Note that all of these variance component estimates will have large standard errors, because only six teachers and seven observers were included. The teacher by observer interaction component will be estimated most accurately. These three variance component estimates appear in the first three columns of Table 5. They are followed by three columns showing the percentage of total variance each represents. In other words, the three columns with percents are just the three prior columns expressed as proportions summing to 100%. In some cases, the estimation procedure yields an inadmissible negative value for a variance component estimate. By convention, negative estimates are replaced by 0.
The column headed “G(1 occ, 4 obs)” gives the estimated generalizability for an observation design under which a single lesson is coded independently by four observers. These values may be calculated as var(tchr)/[var(tchr) + var(t x r)/4].
The remaining columns of Table 5 give generalizability study results from COS 2, which featured live observations on multiple occasions. As explained earlier, some significant revisions were made to the CQELL observation protocol between COS 2 and VCS 2. Numerous small changes were made to sub-items, sections of the protocol were reordered, and the structure of prominence ratings was modified, primarily to clarify coding decisions that depend upon the distinction between lesson language objectives versus content objectives. For this reason, COS 2 generalizability results are provided only for prominence ratings. It should be emphasized that the COS 2 prominence ratings do not precisely correspond to the VCS 2 prominence ratings, due to these revisions. The ninth column of Table 5, ”Old Sect. (Prom.),” indicates where each prominence rating appeared on the prior CQELL version. In this column, the abbreviations “Cont.,” “Lang.,” “Assess.,” and “Strat.” refer to content, language, assessment, and strategy prominence ratings. For section I of the final CQELL protocol, “The teacher provides instruction on the language objective,” two earlier prominence ratings offered partial matches. The old section E language prominence rating referred to “Opportunities to practice and consolidate language” and the old section D language prominence rating referred to “Input/model language.” Generalizability study results for both are shown in Table 5.
The COS 2 data collection design was complex, with one paired observation and two independent observations, each carried out by one of the two paired observers. Thus, each teacher was observed a total of three occasions, by a total of 2 observers, following a design that required just 4 observations in total. From these data, five variance component estimates were obtained for each prominence rating, as shown in columns 10-14 of Table 5, labeled “tchr,” “rater” (i.e., observer), “txr,” “occ w/in tchr,” and “occ w/in txr.” These variance components were estimated from the COS 2 data using the Stata xtmixed procedure, setting aside observations where a given prominence rating was coded as “Not Applicable.” The final column of Table 5 gives reliability estimates for an average of four observations consisting of paired observations on two occasions, conducted each time by the same pair of observers, but with potentially different observers coding different teachers.
26
Each of the two generalizability estimates for each prominence rating are calculated assuming four observations, but the estimates differ considerably from one another in some cases. This variation arises, first, because the estimates are based on different assumptions about sources of error. The G (1 occ, 4 obs) and G (2 occ, 2obs) estimates combine error variance components differently. In addition, a major source of variation is random error. The numbers of teachers and observers involved are small, and all of the estimates shown for variance components and for generalizability coefficients have large standard errors. Note also that the COS 2 and VCS 2 estimates are derived from different datasets, involving entirely different teachers at different grade levels and with no overlap among observers. Finally, COS 2 and VCS 2 were conducted using different versions of the CQELL protocol and CQELL codebook. All of these factors limit the comparability of the generalizability estimates presented.
27
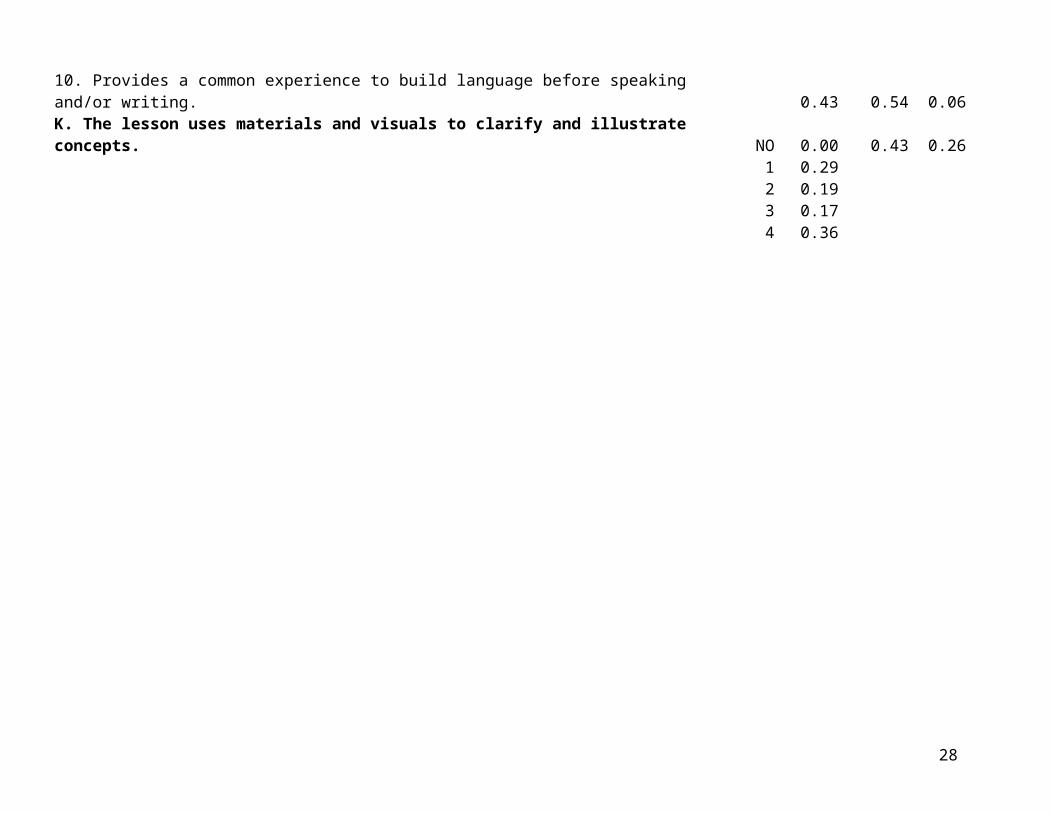
Table 5. Variance Components and Generalizability Estimates for CQELL Prominence Ratings and Sub-ItemsVideo Coding Study (VCS 2) Live Observations (COS 2)
Variance Components Percent of Total Variance Components
tchr rater t x r tchr rater t x rG (1 occ,
4 obs)Old Sect. (Prom.) tchr rater
tchr X rater
occ w/in tchr
occ w/in t x r
G (2 occ, 2 obs)
A.4 Whole gp, no diff 0.056 0.002 0.149 26.9% 0.8% 72.3% 0.60A.5 Whole gp, diff 0.027 0.000 0.135 16.7% 0.0% 83.3% 0.44
A.6 Small gp, not based 0.029 0.076 0.067 16.7%44.4
% 38.9% 0.63A.7 Small gp, accrdg to 0.000 0.000 0.046 0.0% 0.0% 100.0% 0.00A.8 ELA inst based on 0.103 0.010 0.102 48.1% 4.4% 47.4% 0.80A.9 Indep gps diff vers 0.008 0.000 0.040 16.7% 0.0% 83.3% 0.44
B prominence 0.233 0.087 0.405 32.2%12.0
% 55.8% 0.70 B (Cont.) 0.202 0.007 0.174 0.531 0.131 0.34B.1 discrn obj 0.000 0.000 0.024 0.0% 0.0% 100.0% 0.00B.2 explicitly stated 0.000 0.000 0.024 0.0% 0.0% 100.0% 0.00B.3 obj aligned 0.016 0.000 0.159 9.2% 0.0% 90.8% 0.29C prominence 0.568 0.000 1.135 33.3% 0.0% 66.7% 0.67 C 0.129 0.012 0.175 0.596 0.299 0.22C.1 taps prior 0.075 0.005 0.130 35.6% 2.3% 62.1% 0.70C.2 relates personal 0.080 0.000 0.183 30.5% 0.0% 69.5% 0.64
D prominence 0.452 0.190 0.548 38.0%16.0
% 46.0% 0.77 D (Cont.) 0.254 0.001 0.072 0.329 0.283 0.48D.1 builds bkgnd 0.108 0.000 0.159 40.5% 0.0% 59.5% 0.73D.2 provides info 0.000 0.000 0.068 0.0% 0.0% 100.0% 0.00
D.3 models skills 0.027 0.032 0.135 13.9%16.4
% 69.7% 0.44D.4 models procs 0.083 0.016 0.151 33.1% 6.4% 60.5% 0.69D.5 emph features 0.015 0.000 0.206 6.7% 0.0% 93.3% 0.22D.6 examples 0.037 0.008 0.087 27.7% 6.0% 66.3% 0.63D.7 explicit vocab 0.027 0.000 0.119 18.6% 0.0% 81.4% 0.48
D.8 breakdowns 0.060 0.033 0.173 22.6%12.5
% 64.9% 0.58
28
Video Coding Study (VCS 2) Live Observations (COS 2)Variance Components Percent of Total Variance Components
tchr rater t x r tchr rater t x rG (1 occ,
4 obs)Old Sect. (Prom.) tchr rater
tchr X rater
occ w/in tchr
occ w/in t x r
G (2 occ, 2 obs)
E prominence 0.032 0.025 0.959 3.1% 2.5% 94.4% 0.12 E (Cont.) 0.308 0.034 0.024 0.249 0.530 0.53E.1 guided practice 0.000 0.000 0.024 0.0% 0.0% 100% 0.00E.2 indep practice 0.037 0.038 0.144 16.7% 17.4% 65.9% 0.50
F prominence 0.278 0.084 0.479 33.0% 10.0% 57.0% 0.70E
(Assess.) 0.414 0.003 0.029 0.198 0.335 0.68F.1 uses frmtv assess. 0.002 0.100 0.146 0.6% 40.4% 59.0% 0.04F.2 monitors 0.020 0.000 0.071 21.6% 0.0% 78.4% 0.52F.3 checks understand 0.014 0.048 0.071 10.7% 35.7% 53.6% 0.44F.4 inst fdbk 0.030 0.021 0.098 20.2% 13.8% 66.0% 0.55F.5 opps summarize 0.037 0.013 0.130 20.4% 7.1% 72.6% 0.53F.6 check obj accomp'd 0.040 0.038 0.160 16.7% 16.0% 67.3% 0.50G prominence 0.035 0.083 0.441 6.2% 14.8% 79.0% 0.24 F 0.144 0.041 0.121 0.290 0.120 0.38G.1 wait time 0.017 0.005 0.106 13.6% 3.7% 82.7% 0.40G.2 periodic opps 0.000 0.010 0.038 0.0% 20.0% 80.0% 0.00G.3 enthuse 0.008 0.021 0.083 7.1% 18.6% 74.3% 0.28G.4 motivat exper 0.075 0.005 0.130 35.6% 2.3% 62.1% 0.70G.5 cl mgmt technqs 0.017 0.000 0.111 13.1% 0.0% 86.9% 0.38G.6 varies activities 0.017 0.005 0.106 13.6% 3.7% 82.7% 0.40G.7 encourage attend 0.021 0.019 0.108 14.0% 12.9% 73.1% 0.43G.8 equit opps 0.021 0.019 0.108 14.0% 12.9% 73.1% 0.43H prominence 0.322 1.527 1.211 10.5% 49.9% 39.6% 0.52 B (Lang.) 0.820 0.077 0.000 0.777 0.632 0.60H.1 discrn lang obj 0.029 0.122 0.124 10.4% 44.5% 45.1% 0.48H.2 lang obj explicit 0.046 0.121 0.102 17.2% 45.0% 37.9% 0.64H.3 lng obj mtch cntent 0.016 0.098 0.156 5.9% 36.5% 57.6% 0.29H.4 lng obj mtch stdnts 0.000 0.078 0.167 0.0% 31.9% 68.1% 0.00
29
Video Coding Study (VCS 2) Live Observations (COS 2)Variance Components Percent of Total Variance Components
tchr rater t x r tchr rater t x rG (1 occ,
4 obs)Old Sect. (Prom.) tchr rater
tchr X rater
occ w/in tchr
occ w/in t x r
G (2 occ, 2 obs)
I prominence 0.370 1.602 1.835 9.7% 42.1% 48.2% 0.45 E (Lang.) 0.883 0.020 0.153 0.859 0.127 0.62D (Lang.) 0.729 0.187 0.000 0.401 1.009 0.62
I.1 lang obj info 0.029 0.122 0.124 10.4% 44.5% 45.1% 0.48I.2 models lang obj 0.040 0.108 0.122 14.7% 40.0% 45.3% 0.56I.3 practice lang obj 0.016 0.098 0.156 5.9% 36.5% 57.6% 0.29I4. ck undrstnd lng obj 0.035 0.102 0.137 12.8% 37.2% 50.0% 0.51J Lang prominence 0.417 0.284 0.906 26.0% 17.7% 56.4% 0.65 H (Lang.) 0.310 0.157 0.024 0.264 0.661 0.50J.1 diff q's,prompts 0.022 0.000 0.167 11.9% 0.0% 88.1% 0.35J.2 basic vocab 0.049 0.086 0.137 18.1% 31.6% 50.3% 0.59J.3 rate of speech 0.063 0.041 0.165 23.5% 15.3% 61.2% 0.61J.4 clarifying words 0.063 0.014 0.184 24.2% 5.5% 70.3% 0.58J.5 sentence frames 0.170 0.011 0.092 62.2% 4.1% 33.7% 0.88J.6 models grammar 0.048 0.000 0.214 18.4% 0.0% 81.6% 0.47J.7 expressive speech 0.102 0.048 0.127 36.8% 17.2% 46.0% 0.76J.8 opps pract fluent 0.038 0.044 0.114 19.4% 22.6% 58.1% 0.57J.9 chants etc. 0.000 0.000 0.046 0.0% 0.0% 100% 0.00J Strat prominence 0.375 0.143 1.302 20.6% 7.9% 71.6% 0.54 H (Strat.) 0.292 0.178 0.268 0.398 0.609 0.38J.1 contexts 0.064 0.000 0.157 29.0% 0.0% 71.0% 0.62J.2 pict walks, prereads 0.121 0.022 0.113 47.2% 8.7% 44.1% 0.81J.3 gest., face, mime 0.038 0.049 0.133 17.3% 22.3% 60.4% 0.53J.4 role-play, etc. 0.043 0.005 0.067 37.5% 4.2% 58.3% 0.72J.5 clarify wds, psgs 0.025 0.025 0.165 11.8% 11.8% 76.5% 0.38J.6 prompt paraphrase 0.087 0.027 0.156 32.4% 10.0% 57.6% 0.69J.7 demos 0.006 0.057 0.070 4.8% 42.9% 52.4% 0.27J.8 thinking process 0.003 0.043 0.187 1.4% 18.4% 80.3% 0.06J.9 visualize 0.130 0.000 0.087 59.8% 0.0% 40.2% 0.86J.10 common exper. 0.024 0.000 0.230 9.5% 0.0% 90.5% 0.30
30
Video Coding Study (VCS 2) Live Observations (COS 2)Variance Components Percent of Total Variance Components
tchr rater t x r tchr rater t x rG (1 occ,
4 obs)Old Sect. (Prom.) tchr rater
tchr X rater
occ w/in tchr
occ w/in t x r
G (2 occ, 2 obs)
K prominence 0.924 0.086 0.700 54.0% 5.0% 40.9% 0.84 I 0.194 0.000 0.165 0.204 0.345 0.42K.1 nontext visuals 0.050 0.000 0.167 23.0% 0.0% 77.0% 0.54K.2 textual visuals 0.005 0.000 0.063 7.6% 0.0% 92.4% 0.25K.3 hands-on, realia 0.000 0.000 0.046 0.0% 0.0% 100% 0.00K.4 illustrated texts 0.048 0.002 0.205 18.7% 0.6% 80.6% 0.48K.5 graphic organizers 0.271 0.000 0.024 91.9% 0.0% 8.1% 0.98K.6 technology 0.150 0.000 0.119 55.7% 0.0% 44.3% 0.83L prominence 0.202 0.216 0.689 18.2% 19.5% 62.3% 0.54 J 0.345 0.019 0.107 0.194 0.399 0.58L.1 prmpt cmplt sent. 0.071 0.000 0.175 28.9% 0.0% 71.1% 0.62L.2 coop groups 0.014 0.000 0.095 13.0% 0.0% 87.0% 0.37L.3 stu-stu open-end 0.014 0.000 0.095 13.0% 0.0% 87.0% 0.37L.4 stu-stu spec ling 0.111 0.022 0.137 41.2% 8.2% 50.6% 0.77L.5 tch-stu open-end 0.000 0.039 0.124 0.0% 23.9% 76.1% 0.00L.6 tch-stu spec ling 0.144 0.006 0.113 54.8% 2.4% 42.8% 0.84M prominence 1.313 0.046 0.335 77.5% 2.7% 19.8% 0.94 G 0.000 0.001 0.022 0.077 0.027 0.00M.1 explain in stu L1 0.198 0.000 0.040 83.3% 0.0% 16.7% 0.95M.2 cntrst Eng, stu L1 0.079 0.000 0.040 66.7% 0.0% 33.3% 0.89M.3 intro ideas in L1 0.119 0.000 0.024 83.3% 0.0% 16.7% 0.95M.4 text in L1 0.008 0.000 0.040 16.7% 0.0% 83.3% 0.44M.5 review ideas in L1 0.000 0.000 0.024 0.0% 0.0% 100% 0.00M.6 accept stu use L1 0.111 0.002 0.046 70.0% 1.0% 29.0% 0.91M.7 translate 0.046 0.010 0.078 34.5% 7.1% 58.3% 0.70M.8 allow stu-st in L1 0.100 0.002 0.086 53.4% 0.8% 45.8% 0.82N prominence 0.448 0.586 1.152 20.5% 26.8% 52.7% 0.61 K 0.442 0.017 0.144 0.212 0.371 0.62N.1 routines 0.000 0.038 0.152 0.0% 20.0% 80.0% 0.00N.2 posted diag.s etc. 0.046 0.003 0.116 27.9% 1.9% 70.2% 0.61N.3 seatwork on task 0.000 0.063 0.168 0.0% 27.2% 72.8% 0.00
31
As shown in Table 5, generalizability coefficients assuming four observations (across some combination of observers and occasions) are moderately high. Taking averages of the two coefficients for each prominence rating, the prominence generalizabilities range from a low of .31 for Section G, using techniques designed to engage all students, to a high of .69 for Section F, using assessment as part of instruction. The median is .56 and the mean across all 14 ratings is .52. To put these values in context, one point of comparison is offered by the preliminary results released this year by the Bill and Melinda Gates Foundation for their large Measures of Effective Teaching (MET) study. For the five classroom observation protocols included in that project, implied subscale reliabilities based on four observations ranged from .44 to .65, from .55 to .61, from .38 to .60, from .20 to .42, and from .39 to .57 (MET Project, 2012, p. 35). The comparison is imperfect, but does suggest that CQELL reliabilities are at or above the levels attained by these other state-of-the-art classroom observation protocols.
Generalizability coefficients, like the reliability coefficients of classical test theory, indicate primarily the stability of rank orderings of individuals. A G coefficient may be low because the standard error of measurement is large or because there is little variability among teachers or classrooms in the construct measured, or both. For many purposes, the standard error of measurement is more informative. The standard error of measurement is an estimate of the standard deviation across replications of the measurement procedure. It tells how much one individual’s scores would be likely to vary, without regard to any other individual’s scores. Just as generalizability theory provides multiple generalizability coefficients corresponding to different observation plans, so too it provides multiple standard errors corresponding to different definitions of “replications of the measurement procedure.”7 Table 6 displays estimates of standard errors for each prominence rating. The VCS 2 estimates assume four observers and one lesson. The COS 2 estimates assume two observers and two lessons, and are based on the penultimate version of the CQELL protocol, not the final version. These estimates are expressed on the same 0-5 scale as the CQELL prominence ratings. In general, estimates that factor in variability across occasions are slightly higher. It is encouraging that these standard errors, based on an average of four codings, are all less than one score point on the five-point scale. To a good approximation, standard errors for a single coding (one observer on one occasion) would be twice as large as the values shown in Table 6.
7 G theory also provides for distinct standard errors according to whether relative comparisons versus absolute estimates are intended. The coefficients in Table 5 are for absolute estimates—The accuracy with which a mean across CQELL codings by the same two observers on the same two two occasions can be expected to characterize the true, long-run average value across indefinitely large numbers of observers and occasions.
32
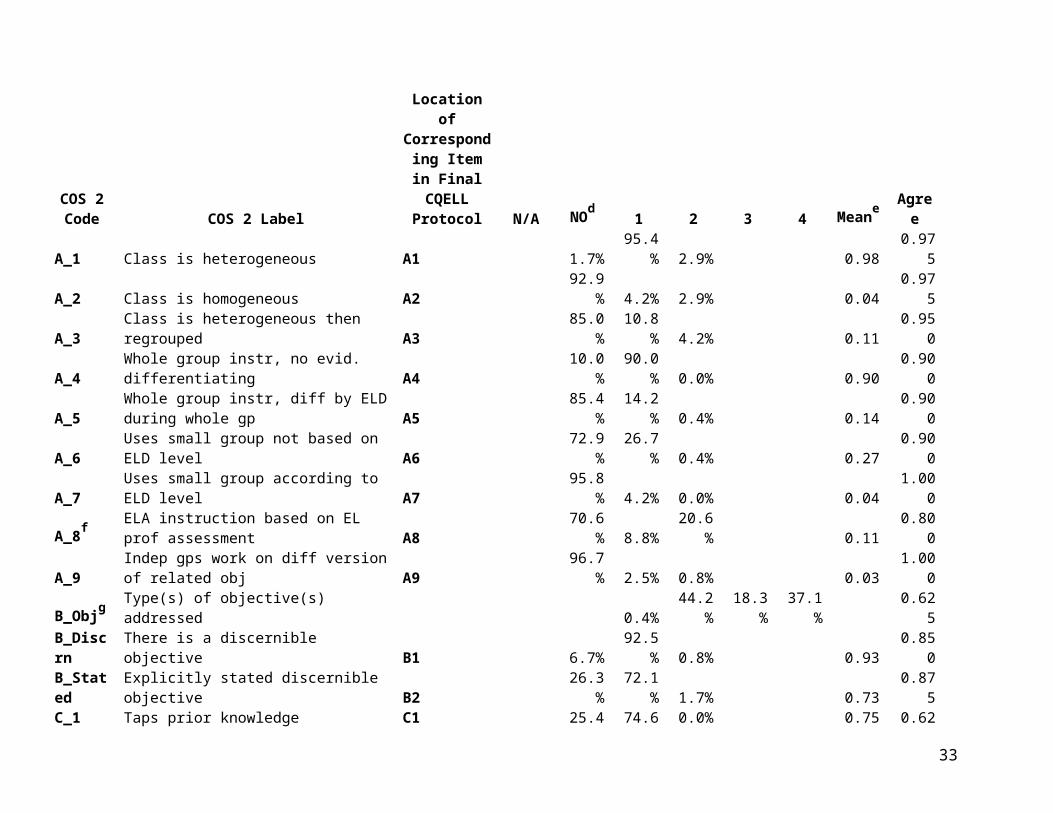
Table 6. Standard Errors of Measurement for Prominence Ratings
Rating
VCS 2 SE (1 occ, 4 obs)
Location in COS 2 CQELL
Version
COS 2 SE (2 occ, 2 obs)
B (objectives) 0.343 B (Cont.) 0.500C (builds bkgnd) 0.559 C 0.683D (input, modeling) 0.408 D (Cont.) 0.550E (practice) 0.491 E (Cont.) 0.564F (assessment) 0.374 E (Assess.) 0.462G (engagement) 0.347 F 0.389H (lang objective) 0.805 B (Lang.) 0.681I (instruct lang obj) 0.908 E (Lang.) 0.591
D (Lang.) 0.661J (adapts language) 0.566 H (Lang.) 0.717J (adapts strategies) 0.589 H (Strat.) 0.858K (materials, visuals) 0.458 I 0.509L (English production) 0.473 J 0.517M (L1 support) 0.286 G 0.248N (routines) 0.648 K 0.552
Preliminary Evidence of CQELL Criterion-Related (Predictive) ValidityThe COS 2 data collection was designed in part to examine correlations between CQELL prominence ratings and student learning outcomes. Because available student learning outcomes differed for 2nd grade versus 5th grade classrooms, correlations were calculated within grade level, further reducing the already limited sample size. With only 20 teachers per grade level, it is unsurprising that no clear patterns emerged. The procedures followed are documented in this section, and selected tables of findings are presented.
Outcome variables. The primary student achievement outcomes available were end-of-year scores on the California Standards Tests (CSTs), which are the State of California’s accountability assessments, in English language arts (ELA) and mathematics (Math). In addition, fifth-grade students completed an end-of-year writing assessment. This was in fact a released form of the State of California’s fourth-grade direct writing assessment, from an earlier year chosen such that no current fifth-grade students should have encountered it previously. It consisted of a timed response to a single essay prompt, scored on a four-point scale using the rubric published by the California Department of Education. Each writing assessment was scored twice. When the two raters disagreed, they conferred to reach a final score, which was used in subsequent analyses. This final score correlated .94 with the mean of the two ratings. Thus, the reliability of the final score should be well approximated by the reliability of the mean of the two scores, which was .88. Note that this is the reliability of the individual-level writing scores, which were then aggregated to the classroom level. Reliabilities of all classroom-level outcome variables are discussed below.
33
The first set of outcome variables were unadjusted end-of-year scores on these assessments, namely ELA CST scale scores (2nd grade and 5th grade), Math CST scale scores (2nd grade and 5th grade), and direct writing assessments administered as part of the current study (5th grade only).
In addition to these unadjusted scores, three sets of scores were constructed by adjusting for beginning-of-year performance on the California English Language Development Test (CELDT) (Set 2); for prior-year CST scores (Set 3); and for both beginning-of-year CELDT and prior-year CST scores (Set 4). Set 2 included student outcomes corresponding to each of the variables in Set 1, but because prior-year scores were only available for fifth-grade students, Sets 3 and 4 were only available for fifth-graders. Adjustments were made by regressing end-of-year scores on prior CELDT or CST scores and replacing the original end-of-year scores with the residuals from these regressions. For CELDT adjustments, five variables were input, namely the CELDT reading, writing, speaking, listening, and overall scale scores. CST adjustments were made using prior-year ELA scores to adjust both the end-of-year CST ELA score and the writing assessment score. CST math scores were adjusted using prior-year CST math scores. In total, this yielded a total of 4 outcomes at grade 2 and 12 outcomes at grade 5, all variations on the same 3 variables. The grade 2 outcomes were CST ELA and Math scores unadjusted and CST ELA and Math scores adjusted for prior CELDT performance. The grade 5 outcomes were CST ELA and Math scores and the writing score each unadjusted, each adjusted for prior CSTs, each adjusted for prior CELDT performance, and each adjusted for both prior CSTs and prior CELDT performance.
Once these student-level outcomes were constructed, they were averaged up to the classroom level. Separate classroom-level averages were constructed for all students, for EL students, and for non-EL students. (Because non-EL students did not have CELDT scores, only one classroom-level aggregation was defined for Set 3 and Set 4 outcomes.) This yielded 8 classroom-level variables for grade 2 (unadjusted ELA and Math averages for all students, EL students, and non-EL students together with average CELDT-adjusted scores for EL students). For grade 5, a total of 24 classroom-level variables were defined. (These included, for each of ELA, Math, and Writing, means of unadjusted scores for all students, ELs, and non-ELs, CST-adjusted scores for all students, ELs, and non-ELs, CELDT-adjusted scores for ELs, and CELDT-and-CST-adjusted scores for ELs.)
The reliabilities of these classroom-level variables are presented in Table 7. These were calculated from the intraclass correlations of individual student scores within classrooms. Thus, they reflect both measurement error and sampling error. As can be seen in Table 7, reliabilities were highest for classroom means across all students and somewhat lower for the EL and non-EL subgroups. They tended to be higher for unadjusted outcome variables and somewhat lower for regression residuals controlling for prior test scores.
34
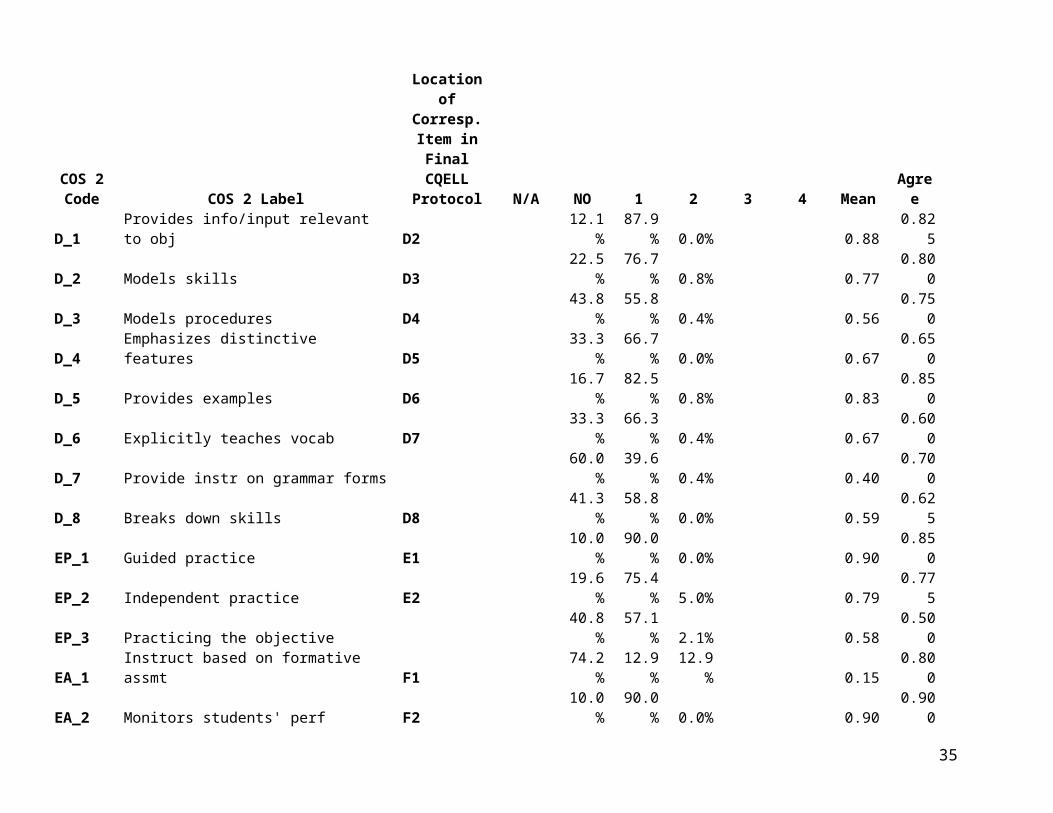
Table 7. Reliabilities of Classroom-Level Outcome Variables
Grade OutcomeStudent Group
Statistical Controls Reliability
2 ELA All None 0.832 Math All None 0.882 ELA All CELDT 0.662 Math All CELDT 0.752 ELA EL None 0.772 Math EL None 0.822 ELA non-EL None 0.742 Math non-EL None 0.735 ELA All None 0.895 Math All None 0.865 Writing All None 0.915 ELA All CELDT 0.345 Math All CELDT 0.615 Writing All CELDT 0.675 ELA All CST 0.375 Math All CST 0.895 Writing All CST 0.785 ELA All CELDT & CST 0.225 Math All CELDT & CST 0.805 Writing All CELDT & CST 0.685 ELA EL None 0.725 Math EL None 0.475 Writing EL None 0.775 ELA EL CST 0.365 Math EL CST 0.745 Writing EL CST 0.665 ELA non-EL None 0.725 Math non-EL None 0.815 Writing non-EL None 0.805 ELA non-EL CST 0.175 Math non-EL CST 0.845 Writing non-EL CST 0.61
A few additional variables were explored. All analyses were rerun for classroom-level averages constructed by pooling EL students with students reclassified as fully English proficient (RFEP). Results did not differ materially from those for the EL group, and are not reported. Finally, some limited investigations were made using a classroom-level variable defined as the contrast between classroom-level EL versus non-EL unadjusted scores on the CST ELA.
35
Predictor variables. The primary predictor variables were the 15 prominence ratings from the COS 2 version of the CQELL observation protocol. A weighted average of the four observations for each classroom was calculated, with weights of 1/6 for each of the two paired observations and 1/3 for each of the solo observations. Thus, observations of the 3 lessons observed were given equal weight. In addition, several sums of these mean ratings were constructed: (1) the sum of all generic elements, (2) the sum of all elements representing additional EL support, and (3) the sum of the language objectives (part of old sections B, D, E, and H, corresponding to final CQELL sections H, I, and J).
Findings. For grade 2, of the 120 predictor-outcome correlations between each of the 15 prominence ratings and each of the 8 classroom-level outcomes, none was statistically significant at the nominal .05 level. Somewhat surprisingly, of the 120 correlations, 81 were negative and only 39 were positive.8 Focusing just on the 30 predictor-outcome correlations involving means of unadjusted outcomes for all students, 23 were less than zero and 7 were greater than zero.
For grade 5, of the 360 predictor-outcome correlations between each of the 15 prominence ratings and each of the 24 classroom-level outcomes, 15 (4%) were significant at the nominal .05 level, as might be expected by chance. Of these statistically significant correlations, 10 were negative and 5 were positive. Of the entire set of 360 correlations, 213 were negative and 147 were positive. Focusing just on the 45 correlations involving means of unadjusted outcomes for all students, two were statistically significant, both with coefficients less than zero. These were correlations of the old section E language prominence rating,9 corresponding to section I (Instruct language objective) in the final CQELL protocol. This prominence rating correlated -.45 with the CST ELA mean for all students and -.48 with the CST Math mean for all students.
To further investigate the predominance of negative correlations, predictor-outcome partial correlations were calculated, controlling for percent EL at the classroom level. This analysis was suggested by the hypothesis that CQELL elements might be more salient in classes serving higher proportions of EL students, and that such classrooms might also, on average, have lower standardized test scores. At grade 2, after controlling for percent EL, the negative-positive breakdown shifted from 81 negative and 39 positive to 68 negative and 52 positive. However, at grade 5, the negative-positive breakdown shifted from 213 negative and 147 positive to 253 negative and 107 positive. So, the hypothesis was not confirmed. If nothing else, these analyses highlight the pitfalls of attempting causal inferences from observed correlations. After adjusting for percent EL, the two grade-5 correlations noted earlier, between the old section E language prominence rating and the unadjusted CST ELA and Math means for all students, were no longer statistically significant. These correlations dropped from -.45 to -.20 for the ELA CST and from -.48 to -.29 for the Math CST.8 Because these correlations were not statistically independent, there is no straightforward way to test the statistical significance of the difference between these enumerations.9 In the earlier version of the CQELL protocol, this prominence rating was for “structured opportunities for students to practice and consolidate skills, strategies and concepts” related to the lesson’s language objective.
36
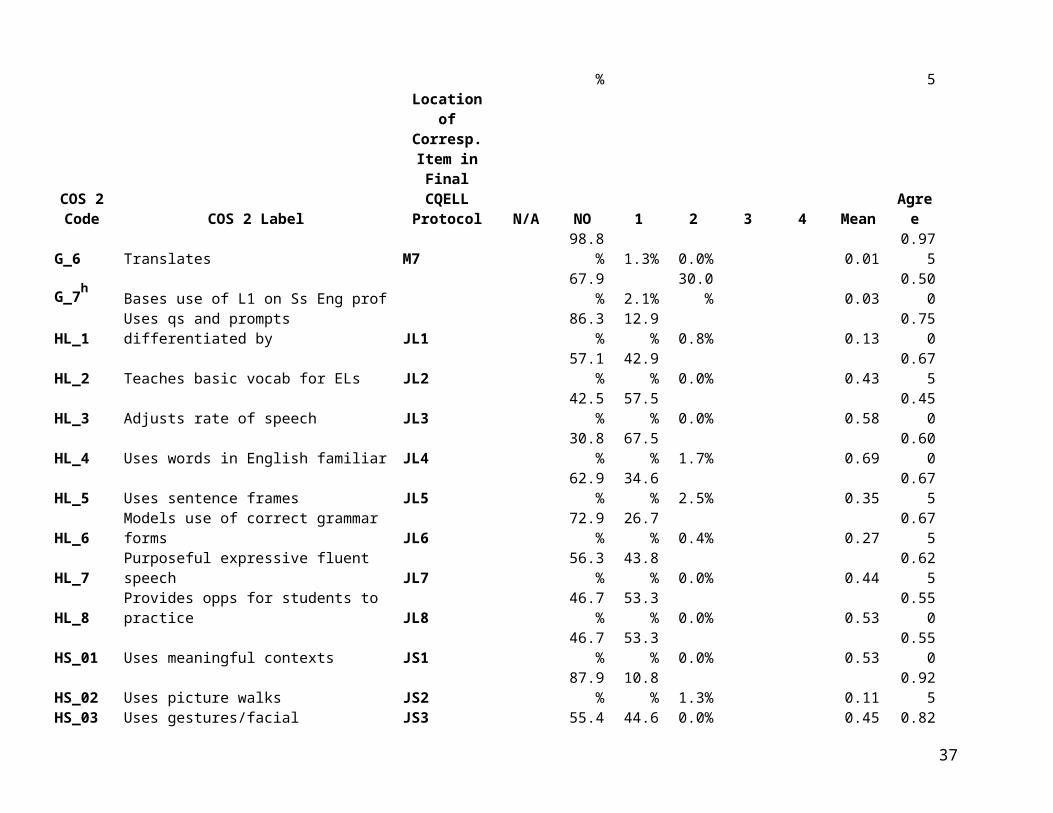
CELDT scores were collected prior to the COS 2 CQELL observations, at the beginning of the school year, and so could not be regarded as potential outcome measures. However, correlations of classroom-level CELDT score averages with subsequent CQELL prominence ratings might provide some support for the hypothesis that the CQELL elements were more salient in classrooms serving EL students with lower levels of English proficiency. (Note that according to this hypothesis, negative correlations would be expected.) Accordingly, correlations were calculated between each of the five CELDT scale score means (overall, reading, writing, speaking, and listening) and each of the 15 prominence ratings included on the old COS 2 version of the CQELL. For grade 2, of the 75 CELDT-CQELL correlations, 55 were negative and only 20 were positive. Three of these correlations (4%) were significant at the nominal .05 level.10 For grade 5, of the 75 CELDT-CQELL correlations, 35 were negative and 40 were positive. Three of these correlations (4%) were significant at the nominal .05 level.11 Across both grade levels, all six of the statistically significant correlations were negative. Thus, it appears that there may be some support for the hypothesis that CQELL elements are more salient in second-grade classrooms where EL students have lower levels of English proficiency. Again, no causal inference is warranted.
Finally, for fifth graders, correlations of prominence ratings with prior-year CST scores were examined. Classroom-level mean prior-year CST scores in each of ELA and Math were calculated these two variables were then correlated with subsequent CQELL prominence ratings. As with the correlations involving prior-year CQELL scores, this analysis was intended to inform the hypothesis that some of the instructional practices addressed by the CQELL protocol might be more salient in classrooms serving lower-proficiency students. Each of the 15 COS 2 prominence ratings was correlated with each of the prior-year ELA and Math CST means, for a total of 30 correlations. Of these, two (7 percent) were significant at the nominal .05 level.12 Both were negative. These results are suggestive, but no causal inference is warranted.
Guidelines for CQELL Use and Interpretation
In the overview section at the beginning of this technical report, six appropriate uses of the CQELL were listed, as follows:
10 One of the significant Grade 2 correlations was between the Section B “Content” prominence rating from the COS 2 version of the CQELL protocol, corresponding to Section B in the final protocol, and the beginning-of-year classroom mean CELDT Speaking subscore. The remaining two significant Grade 2 correlations involved the CELDT Reading subscore and the COS 2 Section I and J prominence ratings, corresponding to final CQELL Sections K and L, respectively. 11 The significant Grade 5 correlations all involved the Section G prominence rating from the COS 2 version of the CQELL protocol, corresponding to Section M in the final protocol. The G prominence rating had significant negative correlations with beginning-of-year classroom mean CELDT Overall scores as well as the Reading and Listening subscores.12 The fifth-grade prior-year CST classroom means for both ELA and Math had significant negative correlations with the COS 2 Section E Language prominence rating, corresponding to part of the Section I prominence rating in the final version of the CQELL protocol.
37
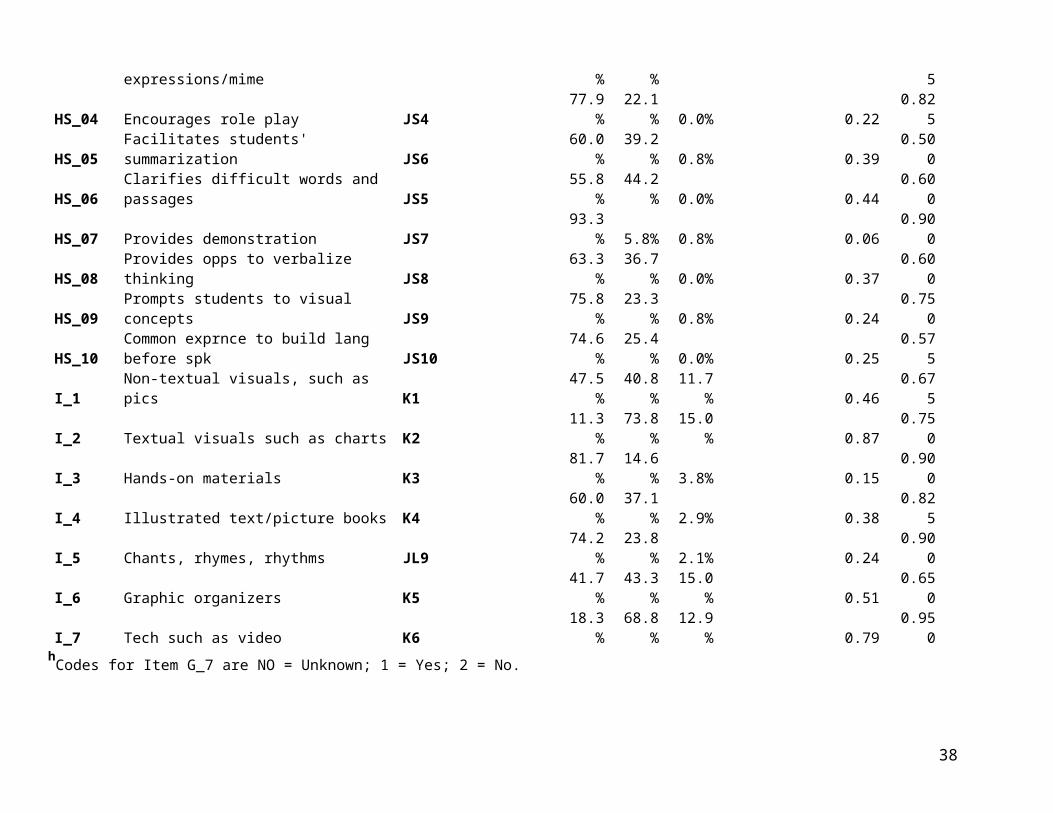
Research on the prevalence of specific teaching practices and the associations between these practices and student learning outcomes.
Feedback and advising for pre-service teacher education program faculty, regarding possible instructional elements to include in lessons with English Learners.
EL coaching for pre-service teachers in the context of supervised teaching practica. Focusing discussion and targeting possible areas for school-wide improvement, low-stakes
monitoring and analysis in the context of school-wide communities of practice (e.g., Professional Learning Communities [PLCs], grade-level groups of teachers within a school).
EL coaching or mentoring for in-service teachers on use of instructional practices identified as focus areas for school wide improvement.
Teacher self-assessment used to guide lesson planning.
In this final section, these uses are addressed in turn.
ResearchThe principal motivation for developing the CQELL was to provide researchers with a validated observation protocol offering standardized, replicable definitions of classroom practices recommended in the research literature on EL instruction, but often ill-defined. For research purposes, the reliability of scores for individual teachers or classrooms is of secondary importance. Low reliability affects statistical power, but this can be compensated for by increasing overall sample size. The prominence rating generalizabilities reported in Table 5 suggest that a research design involving four CQELL observations should provide adequate reliability for such applications. The COS 2 variance components in Table 5 suggest that observer main effects are negligible. This implies that CQELL training was successful in calibrating observers so that there were no large, systematic differences in their tendency to assign higher versus lower ratings. The major sources of error were teacher by observer and teacher by occasion interactions. These variance components were of approximately equal magnitude. This suggests that the best possible design would be to have each classroom observed on four different occasions, with a different observer each time. Using two observers on each of two occasions would also be quite satisfactory. The appropriate variables for further analysis would be, for each section, the mean of the four prominence ratings assigned (either one observation on each of four occasions or two observations on each of two occasions).
Researchers might also wish to study specific sub-items. Given the large number of sub-items in the final CQELL protocol, any use of sub-items as outcome variables should be driven by specific research hypotheses, as opposed to a “fishing expedition” for significant correlations. VCS 2 reliabilities for sub-items are presented in Table 5, but of course these can only reflect variability across observers, not variability across occasions of measurement.
Feedback and AdvisingFor purposes of pre-service teacher education, clear definitions of classroom practices, accompanied by specific examples and non-examples, can be of great value. The CQELL provides useful enumerations of sub-items associated with each element of classroom practice.
38
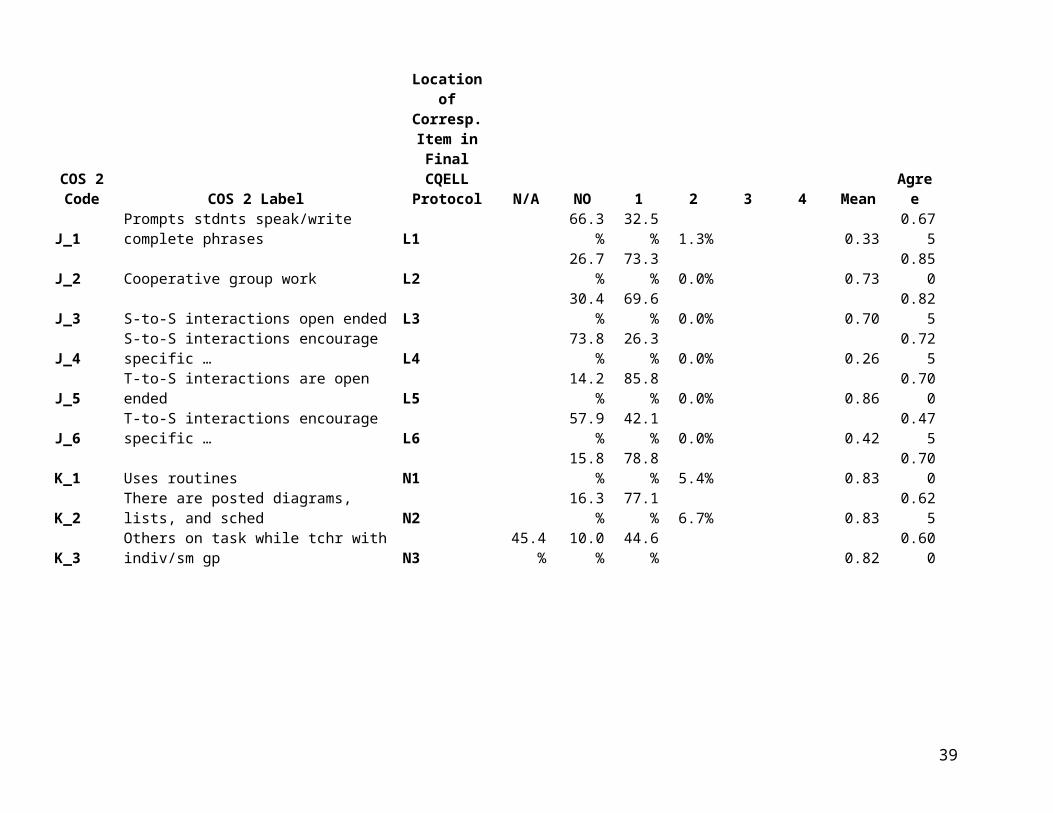
Examples in the CQELL codebook as well as video clips from training materials can be used to demonstrate and to communicate the meaning of recommended practices. For teaching purposes, pre-service teachers might use the CQELL to sharpen their own perception of lessons they are given opportunities to observe. For feedback and advising purposes, the CQELL protocol and training materials per se would be of value. For informal feedback purposes, CQELL coding by one observer on one occasion would be perfectly satisfactory.
Pre-Service EL CoachingPre-service student teachers are generally afforded opportunities to teach during supervised practica. If this practice teaching is observed, an observer might complete the CQELL observation protocol and use it as the basis for a discussion with the student teacher concerning strengths and weaknesses of the lesson offered. For this purpose, scores per se are relatively unimportant. It bears repeating that there is no one pattern of prominence ratings that defines a “good” lesson. However, the CQELL might help reveal the extent to which the student teacher succeeded in his or her own instructional goals for a particular lesson. For coaching purposes, the coach’s focus is likely to be on the strengths and weaknesses of the particular lesson observed. Thus, a single occasion of CQELL observation is most sensible. The inter-rater agreement statistics presented in Table 2 imply that a CQELL coding by a single trained observer is sufficient for an accurate portrayal of the strengths and weaknesses of a single lesson.
Focusing Discussion and Targeting Possible Areas for School-Wide ImprovementElementary school faculty might use the CQELL as the basis for discussion of teaching practices, setting measureable goals for instructional improvement. For this purpose, the CQELL might be used initially to code a school-wide sample of ELA lessons. Results would then be aggregated and examined to identify potential problems, such as lack of clarity as to lesson objectives, for example. The faculty might then work together to identify improvement targets and to implement specific change strategies. The CQELL could be used again later to evaluate the success of the change effort.
In-Service EL Coaching or MentoringThe CQELL also might be useful in structuring individual lesson observations for in-service teachers. For this purpose, a single observation of a single lesson would be appropriate. It bears repeating, however, that the CQELL is not intended, nor is it validated, for use in high-stakes teacher evaluations of any kind. As an informal, low-stakes resource to facilitate discussion of possible lesson strengths and weaknesses, the CQELL may be of value. However, there is as yet only limited empirical evidence to confirm that the practices identified in the CQELL are in fact associated with better student learning outcomes.
Teacher Self-AssessmentA final recommended use of the CQELL observation protocol is for teacher self-assessment. Teachers might simply use the protocol and CQELL codebook exemplars as a tool for study, but a more productive approach would be coding of a teacher’s own lesson video. In this
39
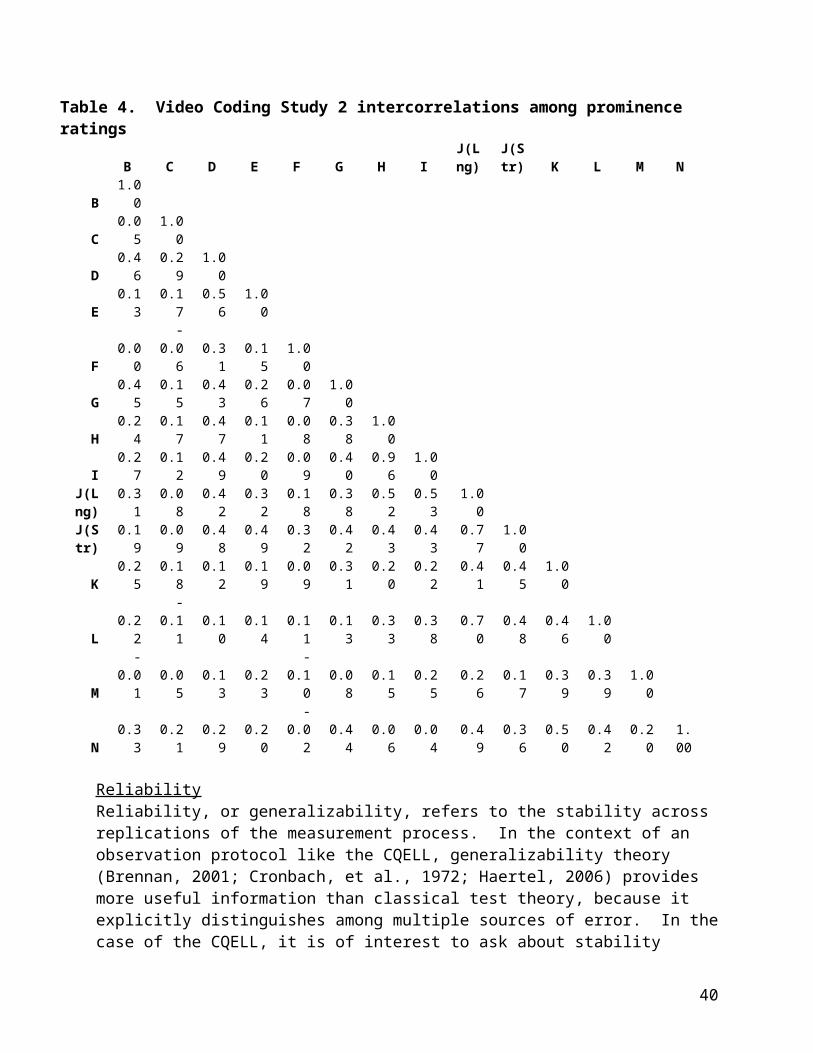
application, the CQELL serves as a tool for structuring the lesson observation, directing attention to specific elements of classroom practice.
Observer Qualifications
In all of the CQELL development work, efforts were made to recruit observers from a pool of experienced classroom teachers. In the rare instances where an observer lacked actual elementary classroom teaching experience, levels of inter-rater agreement were lower. Out of the CQELL development work, the authors also formed an impression that very highly experienced ELA specialists and teacher educators sometimes paid less attention to the detailed instructions and examples in the CQELL codebook. Usage of some terms varies, and observers are cautioned not to rely on preconceived notions as to how sub-items or prominence ratings are to be used.
Before any observers use the CQELL protocol, they should become certified as CQELL observers. The process for becoming certified is to complete the online training and then to observe one or more of the six keyed videos (as explained below) and code it with a satisfactory level of accuracy. Training materials for the CQELL may be accessed on the CQELL website at https://people.stanford.edu/claudeg/cqell/about. The website also provides links to each of the six video recordings of complete lessons that were used in VCS 2 (the second video coding study). All six of these videos are now publicly available.
Following VCS 2, the research team reviewed the multiple codings for each video that were generated as part of that study, reviewed the videos themselves, and agreed on the definitive, correct coding for each element prominence rating and for each sub-item, for each video. These definitive codes serve as scoring keys for the six videos, providing benchmarks against which an observer’s coding accuracy may be determined. Using these scoring keys, the performance of the seven observers who participated in VCS 2 (excluding Rhoda Coleman) was evaluated against various alternative accuracy criteria. Based on this evaluation, final criteria were established for observer certification.
Scoring keys for two of the six videos have been made publicly available and may be accessed from the website.13 The keys for the remaining four videos are being kept secure, but are available upon request to qualified users, subject to a nondisclosure agreement, as described on the website.
To determine level of accuracy, the 14 prominence codes the observer assigns are compared to the video’s scoring key. Note that an observer’s coding of the sub-items is ignored for purposes of certification. See explanation and illustration on Table 8 below.
13 Keys are publicly available for videos of lessons taught by Gary, a second-grade teacher; and by Maria, a fifth-grade teacher. Secure keys are available to qualified users for videos of lessons taught by Donna, a fifth-grade teacher; by Carol, a fifth-grade teacher; by Salvador, a second-grade teacher; and by Lisa, a second-grade teacher. It is recommended that the videos by Donna, Carol, Salvador, and Lisa be used in that order. All names are pseudonyms.
40

Initial certification requires that, for at least one video, an observer’s codes are within plus or minus one point of the scoring key for at least 10 of the 14 element prominence ratings. This level of certification indicates that the observer is qualified to conduct classroom observations for low-stakes research purposes, under a data collection plan with two or more observers coding each of two or more of a teacher’s lessons.
Advanced certification requires that, for at least two video recordings, an observer meets the same criterion of coding within plus or minus one point of the scoring key for at least 10 of the 14 element prominence ratings. In other words, once initial certification has been achieved, advanced certification requires that the same level of accuracy be demonstrated again, on a second video. Advanced certification indicates that the observer is qualified to coach pre-service or in-service teachers or to use the CQELL in other ways as a professional development tool.
For purposes of determining whether a prominence rating is within plus or minus one point of the scoring key, a rating of “Not Observed” (“NO”) is treated as zero. Thus, if a scoring key gives “NO” for some prominence rating, an observer’s coding of either “NO” or “1” is counted as a match. If a scoring key gives “1” for some prominence rating, then an observer’s coding of “NO,” “1,” or “2” is counted as a match.
Observers whose coding does not reach the required level of accuracy using the two videos with publicly available scoring keys are welcome to retrain and attempt to meet the certification criterion using the videos with secure keys. For most purposes, the videos with publicly available keys will be sufficient to establish rater qualification. However, when a higher level of rater qualification is desirable, or when the number of trials required to reach a satisfactory level of accuracy exceeds the two videos with publicly available keys, the videos with secure keys may also be used. If the videos with secure keys are required, only as many as necessary should be used. They should be used in the order specified on the website, beginning with the lesson by Donna, and then proceeding in turn to lessons taught by Carol, Salvador, and finally, Lisa. (All names are pseudonyms.)
Scoring for certification purposes is illustrated in Table 8, which shows the prominence ratings keyed for Gary’s video together with ratings assigned by a hypothetical observer. The rightmost column of Table 1 shows, for each rating, whether the observer was within one point of the key. In this case, the observer matched the key within one point for 12 of the 14 prominence ratings, which satisfies the established criterion of 10 or more matches across the 14 ratings. Thus, this observer would be awarded initial certification.
41
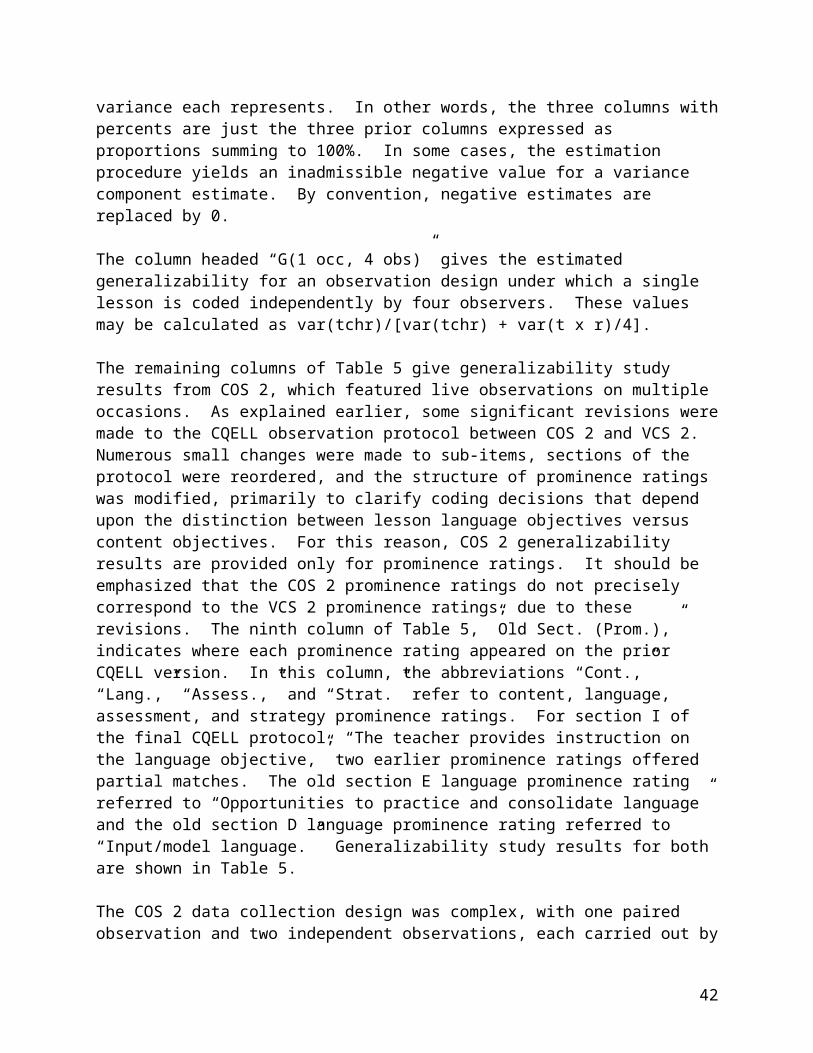
Table 8. Illustration of certification for a hypothetical observer
Code Element Prominence Rating
Gary (Scoring Key)
Observer
Within 1?
bprom B. The lesson addresses one or more learning objectives. 4 4 yes
cpromC. Teacher/lesson explicitly links new concepts to students' background experiences, past learning. NO 2 no
dpromD. The teacher provides accurate input and models skills, strategies, and concepts related to the lesson objective. 4 4 yes
epromE. The teacher/lesson provides structured opportunities for students to practice and consolidate skills, strategies and concepts. 4 4 yes
fprom F. The teacher uses assessment as part of instruction. 3 2 yesgprom G. The teacher uses techniques designed to engage all students. 4 4 yeshprom H. The lesson addresses one or more language objectives targeted for ELLs. 4 3 yesiprom I. The teacher provides instruction on the language objective. 4 4 yes
jlpromJ. The teacher uses strategies to adapt instruction for students with limited English proficiency: TEACHER ADAPTS LANGUAGE 4 1 no
jspromJ. The teacher uses strategies to adapt instruction for students with limited English proficiency: TEACHER ADAPTS STRATEGIES 3 2 yes
kprom K. The lesson uses materials and visuals to clarify and illustrate concepts. 4 4 yes
lpromL. The teacher/lesson provides opportunities for interactions that encourage student language production in English. 4 3 yes
mprom M. The teacher/lesson provides primary language support during lesson. 3 4 yesnprom N. The classroom uses predictable and consistent management and routines. 4 4 yes
Total within 1 12
42
Summary
The CQELL observation protocol and accompanying CQELL codebook, "What is CQELL?", and training materials, together with this Technical Manual, are offered as a resource for research and for the improvement of classroom practice in the service of English Learners. The evidence presented here, though limited, supports the claim that the CQELL scale reliabilities compare favorably with those of other established classroom observation protocols. It is the hope of the authors of this report that the CQELL will prove to be a useful tool for these and other purposes.
Please direct correspondence and queries to Claude Goldenberg ([email protected]), Rhoda Coleman [email protected]), or Edward Haertel ([email protected]).
43
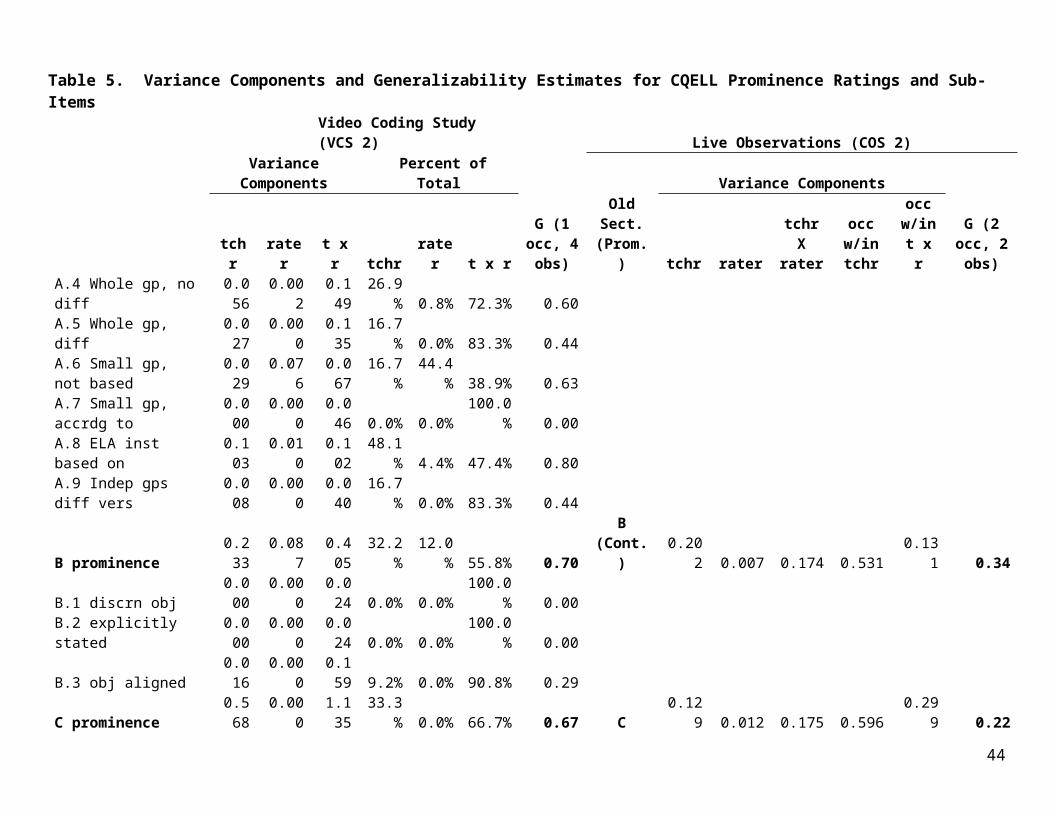
References
August, D. & Shanahan, T. (Eds.). (2006). Developing literacy in second-language learners: Report of the National Literacy Panel on Language-Minority Children and Youth. Mahwah, NJ: Lawrence Erlbaum.
Bos, J., Sanchez, R., Tseng, F., Rayyes, N., Ortiz, L., and Sinicrope, C. (2012). Evaluation of Quality Teaching for English Learners (QTEL) Professional Development (NCEE 2012-4005). Washington, DC: National Center for Education Evaluation and Regional Assistance, Institute of Education Sciences, U.S. Department of Education.
Brennan, R. L. (2001). Generalizability theory. New York: Springer-Verlag.
Center for Language Minority Education and Research. (2005). Standards-based differentiated ELD instruction. Long Beach, CA: Author.
Cronbach, L. J., Gleser, G. C., Nanda, H., & Rajaratnam, N. (1972). The dependability of behavioral measurements: Theory of generalizability for scores and profiles. New York: John Wiley.
Echevarria, J., Richards-Tutor, C., Canges, R., & Francis, D. (2011). Using the SIOP model to promote the acquisition of language and science concepts with English Learners. Bilingual Research Journal, 34, 334–351.
Echevarria, J., Short, D, & Powers, K. (2006). School reform and standards-based education: A model for English-language learners. Journal of Educational Research, 99, 195-210.
Echevarria, J., Vogt, M., & Short, D. (2007). Making content comprehensible for English learners: The SIOP model (3rd ed.). Boston: Allyn & Bacon.
Gage, N., & Berliner, D. (1975). Educational psychology. Chicago: Rand McNally.
Genesee, F., Lindholm-Leary, K., Saunders, W., & Christian, D. (2006). Educating English Language Learners. NY: Cambridge University Press.
Goldenberg, C. (2012). Research on English Learner Instruction. In M. Calderon (Ed.), Breaking through: Effective instruction & assessment for reaching English Learners (pp. 39-61). Bloomington, IN: Solution Tree Press.
Goldenberg, C., & Coleman, R. (2010). Improving academic achievement for English language learners, A guide to the research. Thousand Oaks: Corwin Press.
44
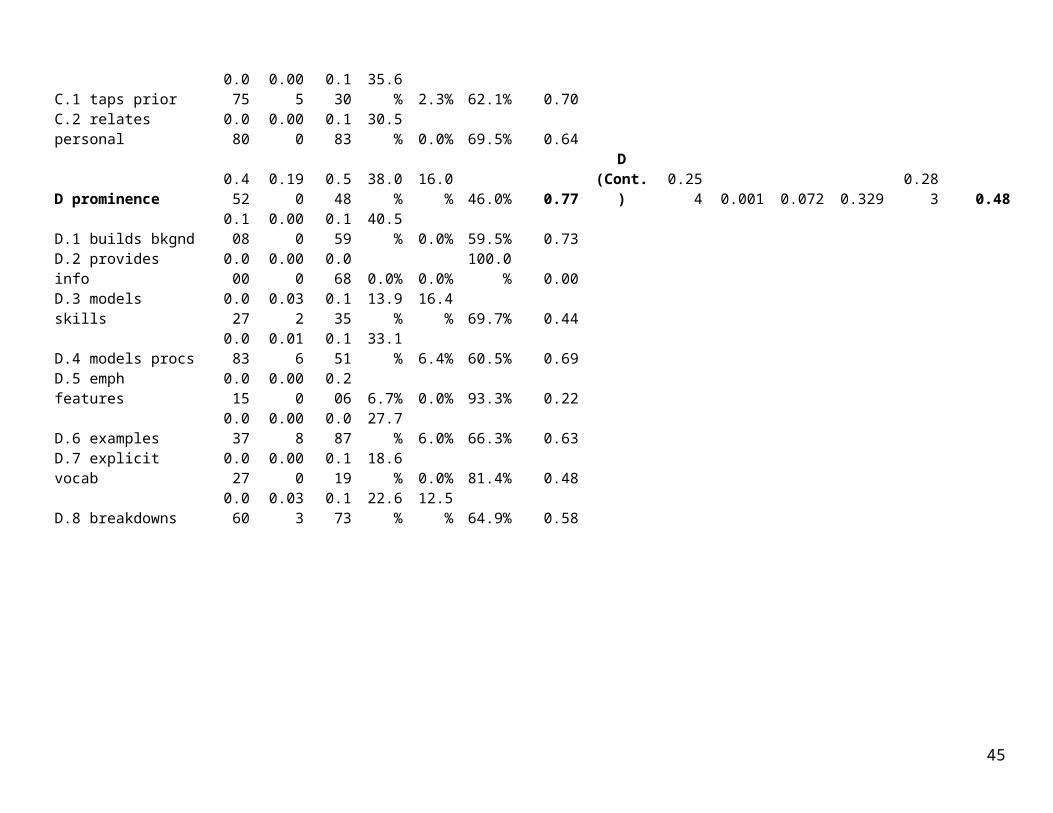
Goldenberg, C., Coleman, R., Amabisca, A., McKnight, K., & McKnight, P. (2008). Implementation of standards-based differentiated ELD instruction: Impact on teaching. Paper presented at annual meeting of the American Educational Research Association, New York, NY.
Haertel, E. H. (2006). Reliability. In R. L. Brennan (Ed.), Educational measurement (4th ed., pp. 65-110). Westport, CT: American Council on Education/Praeger.
Krashen, S. (1985). The input hypothesis: Issues and implications. New York: Longman.
Lightbown, P., & Spada, N. (2006). How languages are learned. Oxford, Eng: Oxford University Press.
McIntyre, E., Kyle, D., Chen, C., Munoz, M. & Beldon, S. (2010). Teacher learning and ELL reading achievement in sheltered instruction classrooms: Linking professional development to student development. Literacy Research and Instruction, 49, 334–351.
MET Project. (2012, January). Gathering feedback for teaching: Combining high-quality observations with student surveys and achievement gains. Bill & Melinda Gates Foundation. (Downloaded August 31, 2012 from http://www.metproject.org/reports.php)
Rogoff, B. (2003). The cultural nature of human development. Oxford: Oxford University Press.
Slavin, R. (2000). Educational psychology. Boston: Allyn & Bacon.
Tharp, R., & Gallimore, R. (1988). Rousing minds to life: Teaching, learning and schooling in social context. Cambridge, Eng.: Cambridge University Press.
Wang, M., Haertel, G., & Walberg, H. (1993). Toward a knowledge base for school learning. Review of Educational Research, 63, 249-294.
45