Embed Size (px)
Citation preview
Brazil’s Globalization and Integration of Output Markets Agenda
Draft version: February 20181
Section 1. Introduction
1. Opening to trade can boost productivity growth and resource allocation through numerous channels. The literature identifies Three main channels through which trade can boost resource allocation, and then productivity. First, the import competition channel: lower trade barriers can strengthen competition in the liberalized sector(s), putting pressure on domestic producers to exploit economies of scale; reduce price margins, (Helpman and Krugman, 1985), improve efficiency, absorb foreign technology, or innovate (Aghion et al, 2005). Second, the input variety-quality channel: trade liberalization can boost productivity by increasing the quality and variety of intermediate inputs available to domestic producers. Recent firm-level evidence for several countries confirms the importance of this input channel (see Fernandes, 2007; Kasahara and Rodrigues, 2008; Topalova and Khandelwal, 2011; Amiti and Konings, 2013; Halpern et al., 2015). Third, the export channel: exporting can improve productivity at firm level in two main complementary ways; by encouraging firms to invest in innovation and through learning from foreign markets, which can happen both directly via buyer-seller relationship, and indirectly, through exposure to competition. For empirical evidence on the impact of trade liberalization on innovation spending, see Bustos (2011). See De Loecker (2013) for empirical evidence on the effects of learning by exports on firm productivity performance in Slovenia. Overall, the combination of all these channels would help boosting productivity at industry level, as trade shocks are expected to reshuffle market shares towards the more productive firms, therefore increasing aggregate productivity. See Melitz (2003), and Melitz and Ottaviano (2008) for a theoretical and empirical investigation on this aspect, and Pavcin (2002) for empirical evidence on the productivity dividends coming from the reallocation effects caused by trade liberalization in Chile.
2. In fact, empirical evidence for Brazil has shown that the unilateral trade liberalization episode of the late 1980s and early 1990s has brought positive payoffs to productivity. Using sector level data for the 1985/97 period, Rossi Jr and Ferreira (1999) show that a 10% reduction of import tariffs is associated with an increase in labor productivity growth of 0.88% per year and of TFP growth by 3.3% per year at the sectoral level. Muendler (2004) uses firm level data for the manufacturing industry in the 1986-1998 period to analyze how the reduction of inward trade barriers between 1990 and 1993 affected productivity and finds evidence that foreign competition pressures firms to raise productivity markedly, whereas the use of foreign inputs plays a minor role for productivity change. Schor (2004) runs a firm level analysis also for manufacturing industry and for the same period and found evidence that both nominal tariffs and tariffs on inputs have a negative impact on firm productivity and concludes that along with higher competition, new access to better inputs also contributes to enhance productivity after trade liberalization. Lisboa et al (2010) uses 1988-1998 data and confirms that the trade liberalization episode that took place in Brazil in the late 1980s and early 1990s brought
1 Authors: Jose Guilherme Reis, Mariana Iootty (corresponding author: [email protected]), Jose Signoret, Tanja Goodwin, Martha Licetti, Alice Duhaut and Somik Lall.
1

positive impacts for productivity in the manufacturing industry and that the main driver of productivity growth was the reduction of input tariffs. Using a more recent data panel (2000-2008) and drawing on firm level data from both manufacturing and mining industry, Cirera et al (2011) find evidence that reductions in both output and input were associated with improvements in firms’ productivity, and that the impact of tariff reduction on productivity does not depend on firms’ trading status which suggests the existence of spillovers from trading firms to other firms.
3. Productivity dividends accruing from trade liberalization can be enhanced when domestic market is integrated and function in a way that resources are allocated to their most productive uses. If reallocation costs are high, which are ultimately influenced by policy interventions, then the potential productivity returns would be limited. Easing barriers to trade is expected to trigger an intensive reallocation and churning process where resources are expected to move to more productive uses, within and between firms, sectors and regions, therefore boosting productivity growth. In this context, resource reallocation can be dampened by policy interventions. For example, Restuccia and Rogerson (2017) provides a compelling review of how policy interventions (or lack thereof) can distort resource allocation; three main policy causes can be listed: statutory provisions that vary with firm characteristics 2, discretionary provisions favoring specific firms 3 and market frictions4.
4. This paper aims at shedding light on this matter by presenting the potential gains from trade liberalization in Brazil and discussing the (policy created) stringencies that have been limiting domestic integration and distorting markets. The paper is organized in five sections besides this introduction. Section 2 shows how closed to trade is the Brazilian economy and discusses the key policy interventions that lie behind these results. Section 3 highlights the potential gains accruing from trade liberalization and points to opportunities to boost productivity through trade integration. Section 4 sheds light on domestic market integration and discusses the (policy created) stringencies that have been affecting resource allocation in Brazil; three main areas are highlighted: infrastructure, use of distortive and ineffective business support policies and product market regulation and competition law enforcement. Section 5 shows the potential productivity benefits accruing from stronger competition. Section 6 concludes.
Section 2. How close to trade is the Brazilian economy and which policies lie behind this result?
5. Openness to trade in Brazil is limited. Trade openness (measured as trade of goods and services over GDP) in Brazil, considering the level of per capita income, is below the predicted line, with no signs of improvement (Figures 1 and 2). In 2016, the ratio of exports plus imports over GDP was 22.6 percent relative to the world average of 51.3 percent. Although larger economies do tend to be more dependent on their domestic markets and export less, Brazil is the least open country and significantly below its benchmarked openness based on different econometric specifications and after controlling for country size and distance to main partners (Lederman et al, 2014).
2 For example, provisions of the tax code that vary with firm size; employment protection measures; product market regulation limiting size or market access; and tariffs applied to specific categories of goods.3 Discretionary provisions made by the government or other entities (such as banks) that favor or penalize specific firms ; for instance, subsidies, tax breaks, low interest loans granted to specific firms.4 For example. monopoly power, market frictions, and enforcement of property rights.
2
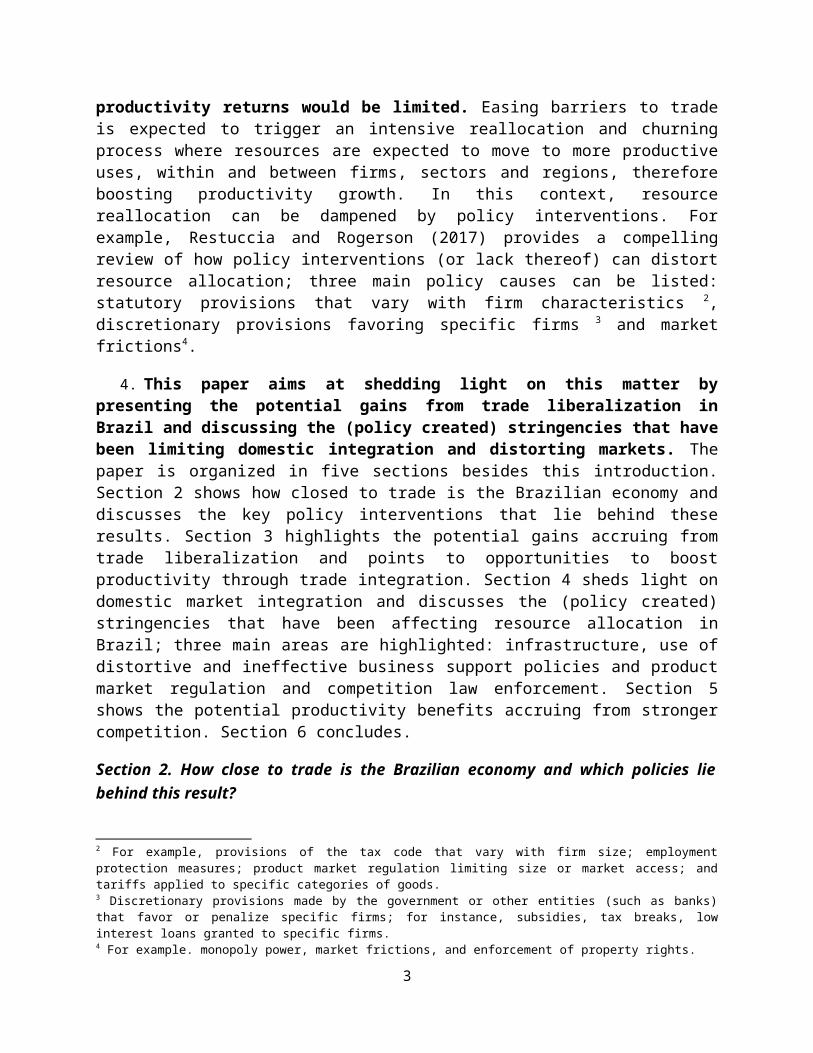
Figure 1: Trade to GDP: 2000-2011(%) Figure 2: Trade to GDP: 2012-2015(%)
Brazil
010
020
030
040
0Tr
ade
to G
DP
(%) a
v 20
00-2
011
6 8 10 12Log of GDP per capita (PPP, av 2000-2011)
tradegdp predicted trade
Brazil
010
020
030
040
0Tr
ade
to G
DP
(%) a
v 20
12-2
015
6 8 10 12Log of GDP per capita (PPP, av 2012-2015)
tradegdp predicted trade
Source: World Bank staff elaboration using WDI data Source: World Bank staff elaboration using WDI data
6. Consistent with a limited trade openness, Brazil’s participation in global value chains (GVC) is low, though it varies across sectors. GVCs represent a new path for trade, whereby a country does not need the capability to produce an entire export good but instead contributes a segment of its production process. Brazil’s relative low engagement concerning GVCs is reflected when looking at measures on what Brazil buys (backward participation) and sells (forward participation) in the GVC. The first measure captures the foreign value-added content embodied in Brazilian’s gross exports, while the second one is measured as domestic value added embodied in third party country’s gross exports. Overall, data suggests that Brazil’s participation in GVC is reduced when compared to international peers and is relatively stronger on the seller (forward) side than on the buyer (backward) side. Brazil’s performance differs substantially across sectors: when considering GVC-intensive sectors in which Brazil is relatively competitive (agribusiness, metal production, automotive and chemicals)5, the charts in Figure 3 shows that Brazil in these sectors is relatively stronger on the seller (forward) side than on the buyer (backward) side. This is not the case for Brazil’s automotive sector in which its GVC participation is low compared to its peer countries. The agribusiness in Brazil show both strong forward and backward linkages whilst having a reasonable level of participation overall compared to some of its comparators such as Mexico and Turkey.
5 The indicator of revealed comparative advantage (RCA) based on domestic value added (as opposed to gross terms) is applied to assess Brazil’s relative strength on key sectors. The data supports that Brazil is most competitive in agribusiness (excluding primary agriculture), wood and paper, basic metals and the automotive industry. Brazil also performs relatively well in the chemicals sector, and since this sector in Brazil is one of the largest in the world, it was selected in place of the wood and paper industry. The RCA measures are presented in Annex 1.
3

Figure 3. Participation in GVC by sector and country (Backward and Forward) (2009)*
01
23
4
BRA ARG THA IDN CAN MEX TUR ZAF
Agribusiness
Backward (PART) Forward (PART)
02
46
8
BRA TUR ZAF CAN MEX THA IDN ARG
Metals
Backward (PART) Forward (PART)
02
46
8
BRA MEX CAN TUR ARG ZAF THA IDN
Automotive
Backward (PART) Forward (PART)
02
46
8
BRA THA TUR CAN IDN ZAF ARG MEX
Chemicals
Backward (PART) Forward (PART)
Source: Hollweg and Rocha (2017). Note:* No updates for 2011.
Box 1. Key challenges for Brazilian auto industry
Despite the apparently well succeeded integration to GVC, as suggested by the TiVA data (displayed in Figure 3), the Brazilian automotive sector shows a subdued performance in several fronts: exports, productivity and innovation. In addition, consumers pay high prices for relatively low-quality cars.
The underlying policy supporting the sector has always prioritized production for domestic market. And while it was responsible to preserve a large share of employment in the economy, it has also made use of a combination of measures that brought negative impacts on efficiency and economies of scale.
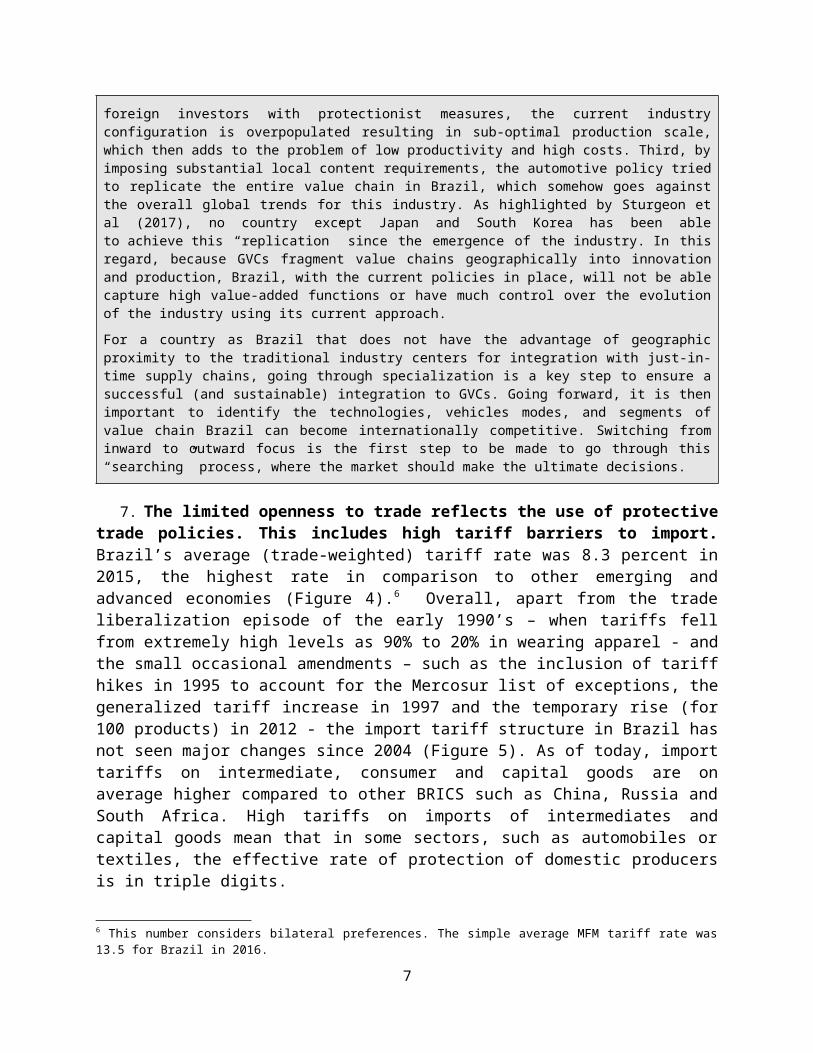
First, industrial policies in all its different versions since the 1950s (being under the import substitution framework of the 1950s or under the Inovar Auto more recently – see Box 3 for more details) have never prioritized an export-oriented approach. Second, by attracting too many foreign investors with protectionist measures, the current industry configuration is overpopulated resulting in sub-optimal production scale, which then adds to the problem of low productivity and high costs. Third, by imposing substantial local content requirements, the automotive policy tried to replicate the entire value chain in Brazil, which somehow goes against the overall global trends for this industry. As highlighted by Sturgeon et al (2017), no country except Japan and South Korea has been able to achieve this “replication” since the emergence of the industry. In this regard, because GVCs fragment value chains geographically into innovation and production, Brazil, with the current policies in place, will not be able capture high value-added functions or have much control over the evolution of the industry using its current approach.
For a country as Brazil that does not have the advantage of geographic proximity to the traditional industry centers for integration with just-in-time supply chains, going through specialization is a key step to ensure a
4

successful (and sustainable) integration to GVCs. Going forward, it is then important to identify the technologies, vehicles modes, and segments of value chain Brazil can become internationally competitive. Switching from inward to outward focus is the first step to be made to go through this “searching” process, where the market should make the ultimate decisions.
7. The limited openness to trade reflects the use of protective trade policies. This includes high tariff barriers to import. Brazil’s average (trade-weighted) tariff rate was 8.3 percent in 2015, the highest rate in comparison to other emerging and advanced economies (Figure 4).6 Overall, apart from the trade liberalization episode of the early 1990’s – when tariffs fell from extremely high levels as 90% to 20% in wearing apparel - and the small occasional amendments – such as the inclusion of tariff hikes in 1995 to account for the Mercosur list of exceptions, the generalized tariff increase in 1997 and the temporary rise (for 100 products) in 2012 - the import tariff structure in Brazil has not seen major changes since 2004 (Figure 5). As of today, import tariffs on intermediate, consumer and capital goods are on average higher compared to other BRICS such as China, Russia and South Africa. High tariffs on imports of intermediates and capital goods mean that in some sectors, such as automobiles or textiles, the effective rate of protection of domestic producers is in triple digits.
Figure 4. Average ad-valorem equivalent of tariffs and NTMs, 2015: Brazil vs selected
peers
Figure 5. Import tariffs in Brazil: maximum, average, mode and minimum
ChileMexi
co Peru
Cana
da
United
State
s
Europ
ean U
nion
Russi
an Fe
derat
ionTur
key
Colom
bia
South
Afric
aCh
ina
Korea
, Rep
.Ind
iaBra
zil0.0
5.0
10.0
15.0
20.0
25.0
Effective tariffs NTMsSource: estimations using UNCTAD TRAINS and UN COMPTRADE data
Source: Pastore et al (2016)
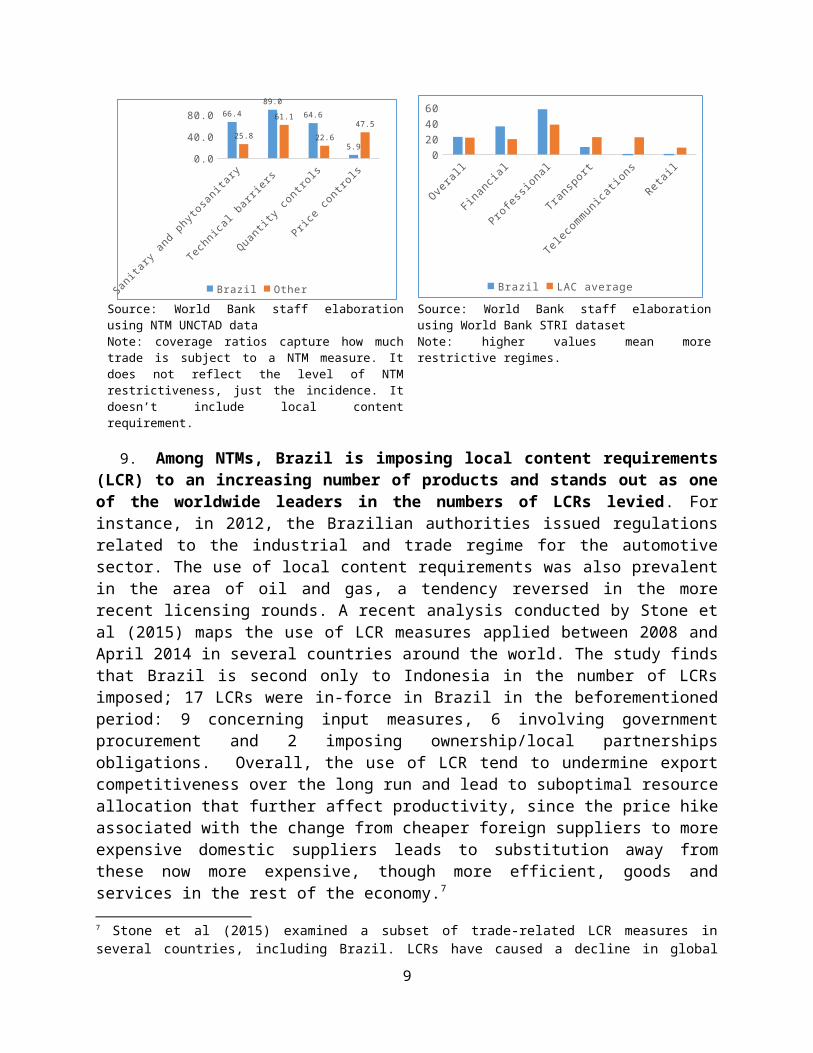
8. There is also widespread use of restrictive non-tariff measures (NTMs). Beyond tariffs, NTMs and procedural obstacles in Brazil are widespread, raising the costs of trade. The ad-valorem equivalent of NTMs – a measure of effective restrictiveness of NTMs – is almost 12% (Figure 4). According to NTM data by UNCTAD, the coverage ratios, or the percentage of imports subject to at least one NTM, is high in Brazil when compared to other countries: the percentage of imports subject to sanitary and phytosanitary measures and technical barriers is 66% and 89% respectively, well above the world average of 26% and 61% respectively (Figure 6). While certain NTMs, in particular with respect to sanitary and phytosanitary measures and technical barriers, may serve legitimate purposes, others might be driven by protectionist interest.
6 This number considers bilateral preferences. The simple average MFM tariff rate was 13.5 for Brazil in 2016.
5

Figure 6. NTM coverage: Brazil vs other countries, 2015 (percent)
Figure 7. Services trade restrictiveness index, Brazil relative to LAC average
Sanita
ry an
d phytosanita
ry
Technica
l barr
iers
Quantity
contro
ls
Price c
ontrols
0.020.040.060.080.0
100.066.4
89.0
64.6
5.9
25.8
61.1
22.6
47.5
Brazil Other
Overall
Financia
l
Profes
sional
Transp
ort
Teleco
mmunicatio
nsReta
il0
20
40
60
Brazil LAC average
Source: World Bank staff elaboration using NTM UNCTAD dataNote: coverage ratios capture how much trade is subject to a NTM measure. It does not reflect the level of NTM restrictiveness, just the incidence. It doesn’t include local content requirement.
Source: World Bank staff elaboration using World Bank STRI datasetNote: higher values mean more restrictive regimes.
9. Among NTMs, Brazil is imposing local content requirements (LCR) to an increasing number of products and stands out as one of the worldwide leaders in the numbers of LCRs levied. For instance, in 2012, the Brazilian authorities issued regulations related to the industrial and trade regime for the automotive sector. The use of local content requirements was also prevalent in the area of oil and gas, a tendency reversed in the more recent licensing rounds. A recent analysis conducted by Stone et al (2015) maps the use of LCR measures applied between 2008 and April 2014 in several countries around the world. The study finds that Brazil is second only to Indonesia in the number of LCRs imposed; 17 LCRs were in-force in Brazil in the beforementioned period: 9 concerning input measures, 6 involving government procurement and 2 imposing ownership/local partnerships obligations. Overall, the use of LCR tend to undermine export competitiveness over the long run and lead to suboptimal resource allocation that further affect productivity, since the price hike associated with the change from cheaper foreign suppliers to more expensive domestic suppliers leads to substitution away from these now more expensive, though more efficient, goods and services in the rest of the economy.7
10. Trade in services, a key enabler of GVC integration and productivity growth, is hampered by policy and regulatory barriers as well as by a distortive tax structure. The internationalization of production and subsequently trading in the GVC also requires attention to the role of services. Next to the fact that many services are used as inputs into the production of GVC goods, they are also essential in the smooth operation of the GVC to connect the different production sides across borders. A clear example is logistics services. Latest OECD-WTO TiVA data for 2011 shows that the service value added (both from domestic and foreign sources) contained in Brazil’s gross exports (49%) is above the average of LAC peers (42.3%) but below the OECD average (54%). In addition, only one-tenth of the total services content of exports
7 Stone et al (2015) examined a subset of trade-related LCR measures in several countries, including Brazil. LCRs have caused a decline in global imports and total exports in every region. The estimated permanent reduction in total exports from Brazil due to these measures amounts to 0.65 percent.
6
originates from foreign providers. This limited contribution is somehow influenced by substantial policy barriers in the service sector. On average, Brazil has more restrictions to trade in services than the average in the LAC region, according to World Bank Services Trade Restrictiveness Index (STRI),8 with the most restrictive scores in financial and professional services, which are critical inputs across all industries for productivity growth and competitiveness (Figure 7).9 In addition to restrictive policies and regulations, there is also a distortive tax system for trading services in Brazil: tax burden on service imports in Brazil compares unfavorably to other countries which contributes to hamper the absorption of imported technology (Figure 8).10
Figure 8. Tax burden on service imports: Brazil vs selected peer countries (%)
Figure 9. Logistic Performance Index (2016)[very low” (1) to very high” (5)]
Saudi A
rabia
ChinaUK
South Korea
Japan
India
Brazil
Argen
tina
0.0
10.0
20.0
30.0
40.0
50.0
60.0
Argen
tina
Indonesi
aBraz
ilIn
dia
Turkey
China
South Afri
ca0.0
1.0
2.0
3.0
4.0
5.0
Source: CNI (2017) Source: World Bank staff elaboration using World Bank LPI dataset
11. Brazil also faces challenges in trade logistics and trade facilitation. To compete in the global economy, traders require seamless supply chains, including efficient border management and clearance processes, as well as the development of efficient logistics services and improvements in both the hard and soft international logistics infrastructure. The score of overall logistics competence (and quality) in Brazil – as captured by the Logistics Performance Index (LPI) in 2016 – is below Mexico, Turkey, India, China and South Africa (Figure 9). Brazil’s overall integration in GVCs (Global Value Chains) is low compared to international peers in part because of relatively lengthy and costly procedures to import and export.11 Indeed, firms’
8 The World Bank STRI dataset focuses on policies and regulations that discriminate against foreign services or foreign service providers, as well as certain key aspects of the overall regulatory environment that have a significant impact on trade in services.9 These results are also valid when using OECD STRI; latest numbers from 2017 show that Brazil scores worse than Mexico, Chile and Colombia for accounting, architecture, engineering and legal services and for commercial banking and insurance. For telecoms and retail, the value of the Brazil STRI index is zero.10 Overall tax burden on services is heavier than in other sectors: while the average tax burden on the production and consumption of goods and services is 19.4%, it is much higher in the services segments most critical to other sectors of the economy: the tax toll exceeds 23% in transport and business services, 27% in IT services and over 30% in utilities (OECD, 2016). This tends to be particularly burdensome for firms that operate in supply chain organizations as they are not allowed to claim full credit for indirect taxes paid on services inputs in lieu of the "physical credit" principle in ICMS and they cannot claim for credit for inputs in ISS.11 This forces firms to adopt costly hedging strategies and complicates their ability to engage in just-in-time production or react quickly to demand shifts. Evidence suggests that inventory-holding costs can vary from 15 percent of the cost of goods per year to as much as 50 percent (Clark et al., 2016). Similarly, each day in transit is equivalent to an ad-valorem tariff ranging between 0.6 percent and 2.3 percent; and trade in components is extremely time-sensitive (Hummels and Schauer, 2013). Customs delays
7

integration to GVCs critically depends on their capacity to provide good quality products delivered on time to buyers further up in the value chain. Yet, unpredictability in customs clearance times due to physical inspection, or delays at border posts generated by excessive cargo handling in response to controls by multiple border agencies, increase uncertainty in delivery times. Despite the recent introduction of the “Portal Único de Comercio Exterior” - an electronic data interchange system that has reduced the time for documentary compliance for both exporting and importing12 - and the recent cooperation agreements between Customs and other border control agencies (as well as with third countries’ agencies13), Brazil still fares poorly in terms of monetary costs of border and documentary compliance when compared to a range of peers (Figure 10).
Figure 10. Cost to export and import: border compliance in USD (2018)
Argentina Indonesia Turkey India South Africa
China Brazil0
200
400
600
800
1000
1200
1400
Cost to export: Border compliance (USD) Cost to import: Border compliance (USD)
Source: data from Doing Business database (2018)
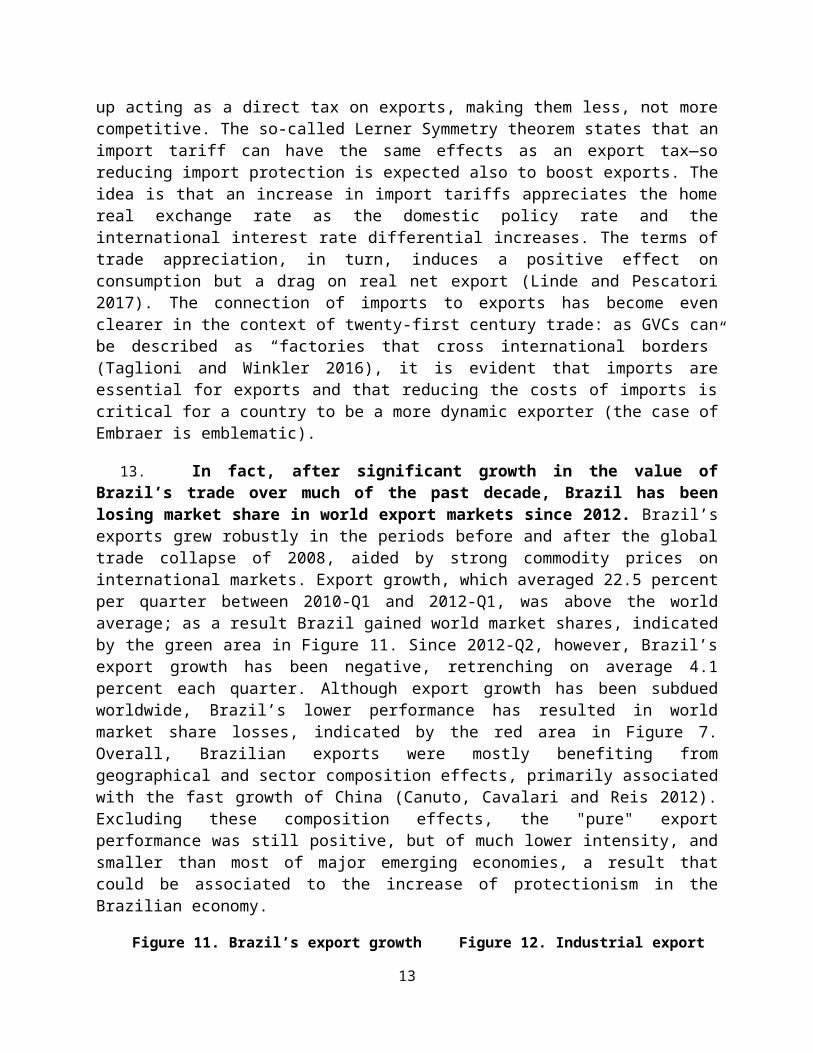
12. As expected, the use of those protective trade policies (particularly in tariff and NTMS) was not conducive to increase export competitiveness. On the contrary, import protection ends up acting as a direct tax on exports, making them less, not more competitive. The so-called Lerner Symmetry theorem states that an import tariff can have the same effects as an export tax—so reducing import protection is expected also to boost exports. The idea is that an increase in import tariffs appreciates the home real exchange rate as the domestic policy rate and the international interest rate differential increases. The terms of trade appreciation, in turn, induces a positive effect on consumption but a drag on real net export (Linde and Pescatori 2017). The connection of imports to exports has become even clearer in the context of twenty-first century trade: as GVCs can be described as “factories that cross international borders” (Taglioni and Winkler 2016), it is evident that imports are essential for exports and that reducing
also reduce exports value and export market diversification (Volpe Martincus et al., 2015).12 Organized as a joint effort between more than 20 agencies and the private sector, Portal Unico promotes the simplification, streamlining and cost reduction of trade-related procedures and formalities with the support of risk management, automation and information technology tools. The initiative aims to eliminate redundant formalities and document requirements, to optimize the performance of the agencies which intervene in trade, and to reduce by 40% the average times to export and to import. According to 2018 Doing Business, the average time to comply with documentary export obligations fell from 18 to 12 hours between 2016 and 2017, a reduction of a third. The average time on the import side decreased from 120 to 48 hours, a reduction of 60%. Brazil improved by ten positions in the “Trading across borders” indicator.13 Recent examples include the cooperation between Mercosur and the Pacific Alliance countries to enable the exchange of electronic trade documents. Certificates of origin, originally in paper, are already being replaced by digital documents with Argentina, Chile and Uruguay. Brazil is also working to exchange electronic phytosanitary certificates with the United States.
8
the costs of imports is critical for a country to be a more dynamic exporter (the case of Embraer is emblematic).
13. In fact, after significant growth in the value of Brazil’s trade over much of the past decade, Brazil has been losing market share in world export markets since 2012. Brazil’s exports grew robustly in the periods before and after the global trade collapse of 2008, aided by strong commodity prices on international markets. Export growth, which averaged 22.5 percent per quarter between 2010-Q1 and 2012-Q1, was above the world average; as a result Brazil gained world market shares, indicated by the green area in Figure 11. Since 2012-Q2, however, Brazil’s export growth has been negative, retrenching on average 4.1 percent each quarter. Although export growth has been subdued worldwide, Brazil’s lower performance has resulted in world market share losses, indicated by the red area in Figure 7. Overall, Brazilian exports were mostly benefiting from geographical and sector composition effects, primarily associated with the fast growth of China (Canuto, Cavalari and Reis 2012). Excluding these composition effects, the "pure" export performance was still positive, but of much lower intensity, and smaller than most of major emerging economies, a result that could be associated to the increase of protectionism in the Brazilian economy.
Figure 11. Brazil’s export growth versus world export growth, 2006Q1-2016Q1
Figure 12. Industrial export quality index: Brazil vs BRICS peers
00.10.20.30.40.50.60.70.80.9
1
1990
1991
1992
1993
1994
1995
1996
1997
1998
1999
2000
2001
2002
2003
2004
2005
2006
2007
2008
2009
2010
2011
2012
2013
2014
Brazil China India
Russian Federation South Africa
Source: World Bank staff elaboration using World Bank’s Measuring Export Competitiveness Database.
Source: World Bank staff elaboration using UNIDO dataset
14. In addition, Brazil’s industrial export quality has been deteriorating in the past years. Economic development entails reallocating resources towards more productive firms and improving the quality of goods produced within existing sectors. Producing higher quality (and generally higher priced) products involves an intense “learning by exporting” process and helps to bring productivity gains (De Loecker 2013).14 Brazil export quality has been deteriorating in the past years and is currently below most part of BRICS peers, except Russia (Figure 12). Recent analysis conducted by Henn et al (2015) corroborates this result and shows that Brazil’s overall export quality is well below the average implied by the frontier of other major emerging economies.
Section 3 Potential gains accruing from trade liberalization and opportunities to boost productivity through trade integration
14 Besides quality upgrading, other mechanisms drive the “learning by exporting” process and the potential productivity gains, such as investing in marketing, innovating, or dealing withforeign buyers (De Loecker, 2013).
9

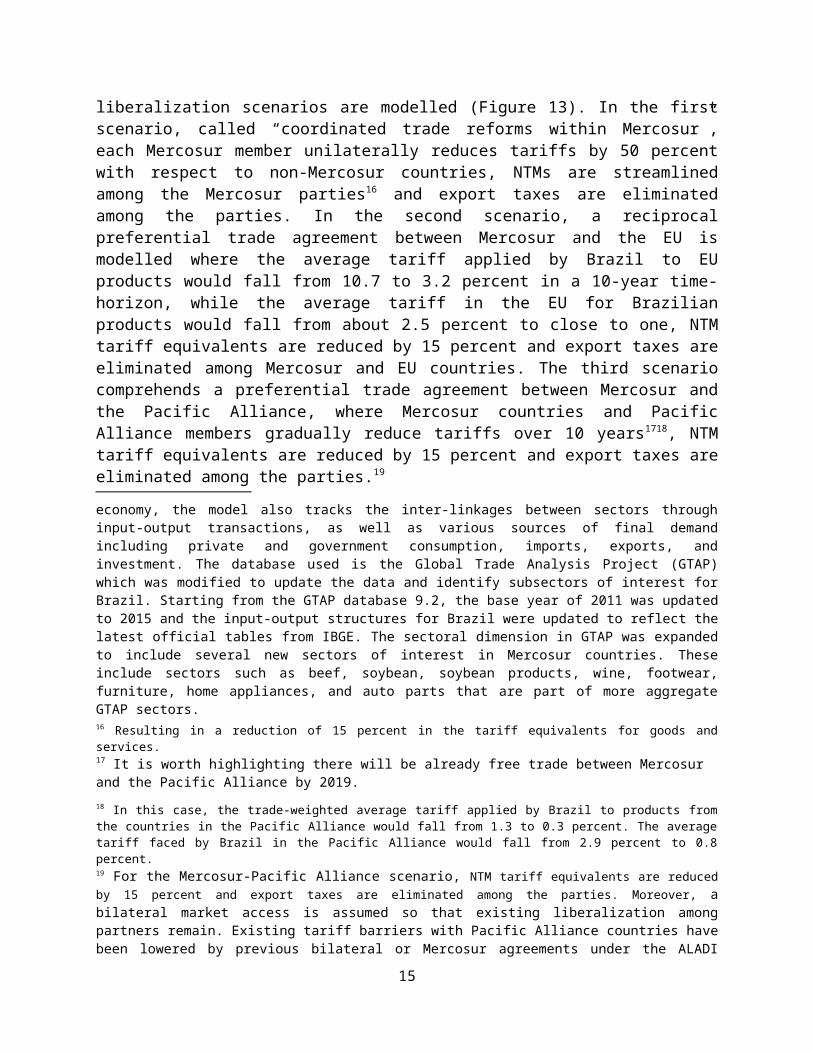
15. Policy simulations points to substantial gains from trade liberalization in Brazil. A customized CGE model for Brazil is applied to assess the impacts of trade liberalization reforms on exports, imports, GDP and output.15 Three hypothetical liberalization scenarios are modelled (Figure 13). In the first scenario, called “coordinated trade reforms within Mercosur”, each Mercosur member unilaterally reduces tariffs by 50 percent with respect to non-Mercosur countries, NTMs are streamlined among the Mercosur parties16 and export taxes are eliminated among the parties. In the second scenario, a reciprocal preferential trade agreement between Mercosur and the EU is modelled where the average tariff applied by Brazil to EU products would fall from 10.7 to 3.2 percent in a 10-year time-horizon, while the average tariff in the EU for Brazilian products would fall from about 2.5 percent to close to one, NTM tariff equivalents are reduced by 15 percent and export taxes are eliminated among Mercosur and EU countries. The third scenario comprehends a preferential trade agreement between Mercosur and the Pacific Alliance, where Mercosur countries and Pacific Alliance members gradually reduce tariffs over 10 years1718, NTM tariff equivalents are reduced by 15 percent and export taxes are eliminated among the parties.19
Figure 13. CGE trade liberalization scenarios “Community reforms” at
MercosurMercosur-EU Mercosur- Pacific Alliance
Tariffs Tariffs in all Mercosur countries reduced by 50%
Bilateral tariffs: in Mercosur from 10.5 to 3.1%; in the EU from 2.5 to 0.7%
Bilateral tariffs: in Mercosur from 1.3 to 0.3%; in the PA from 2.6 to 0.6%
NTMs Reduced by 15% intra-Mercosur; export controls eliminated
Reduced by 15% among parties; export controls eliminated
Reduced by 15% among parties; export controls eliminated
16. The largest economy-wide gains would come from coordinated trade reforms within Mercosur. Exports and imports would increase by 7.5 and 6.6 percent, respectively, while real
15 The model used is the LINKAGE model, which is a dynamic, multi-sector, multi-region model with economy-wide coverage for each region. For each economy, the model also tracks the inter-linkages between sectors through input-output transactions, as well as various sources of final demand including private and government consumption, imports, exports, and investment. The database used is the Global Trade Analysis Project (GTAP) which was modified to update the data and identify subsectors of interest for Brazil. Starting from the GTAP database 9.2, the base year of 2011 was updated to 2015 and the input-output structures for Brazil were updated to reflect the latest official tables from IBGE. The sectoral dimension in GTAP was expanded to include several new sectors of interest in Mercosur countries. These include sectors such as beef, soybean, soybean products, wine, footwear, furniture, home appliances, and auto parts that are part of more aggregate GTAP sectors.16 Resulting in a reduction of 15 percent in the tariff equivalents for goods and services.17 It is worth highlighting there will be already free trade between Mercosur and the Pacific Alliance by 2019.18 In this case, the trade-weighted average tariff applied by Brazil to products from the countries in the Pacific Alliance would fall from 1.3 to 0.3 percent. The average tariff faced by Brazil in the Pacific Alliance would fall from 2.9 percent to 0.8 percent.19 For the Mercosur-Pacific Alliance scenario, NTM tariff equivalents are reduced by 15 percent and export taxes are eliminated among the parties. Moreover, a bilateral market access is assumed so that existing liberalization among partners remain. Existing tariff barriers with Pacific Alliance countries have been lowered by previous bilateral or Mercosur agreements under the ALADI framework, especially with respect to Chile and Peru. Most tariff liberalization in this scenario would be with respect to Mexico and to a lesser extent Colombia. Liberalization with the Pacific Alliance is assumed to take place both more quickly and more comprehensively. No products are excluded from liberalization and all tariffs are either removed or partially reduced for the most sensitive products.
10

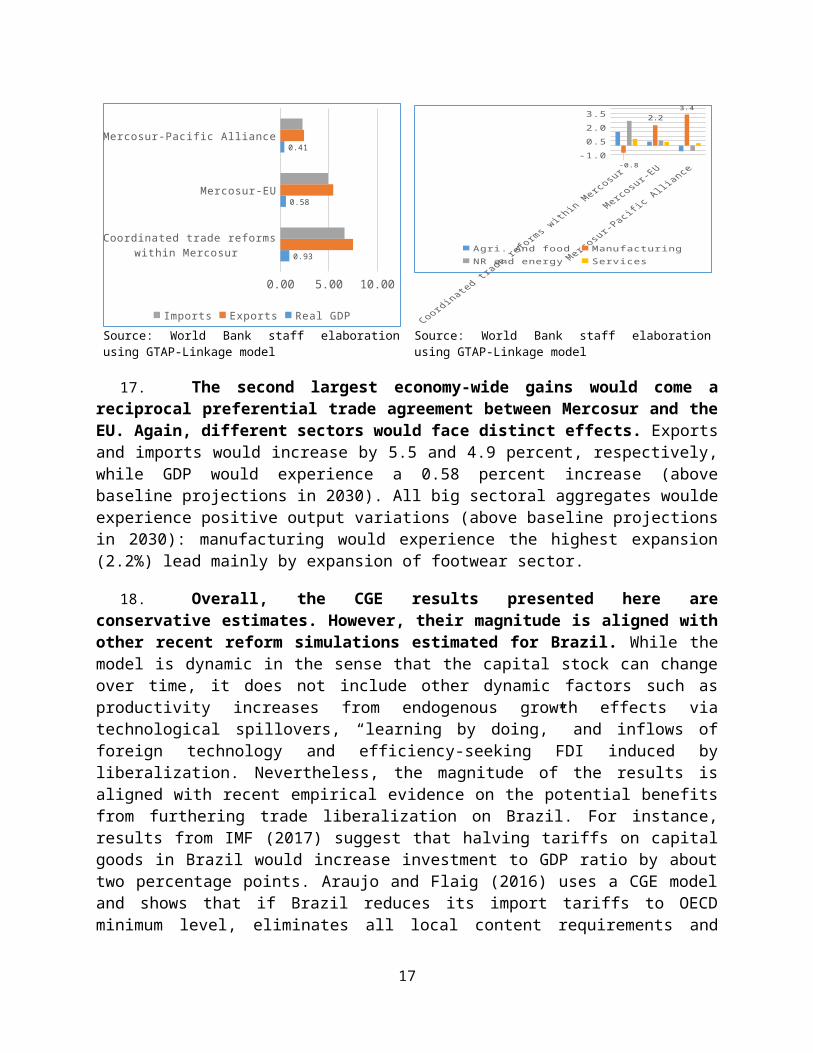
GDP would experience a 0.93 percent increase (above baseline projections in 2030). The effects on output would be different across sectors. Figure 15 shows the output percentage deviations from the baseline in 2030. The largest negative effects are seen for manufacturing (-0.8 percent), led by retrenchments of textiles and apparel sector (-$2.37 billion) and vehicles (-$2.17 billion). All other broad sectors would expand relative to the baseline as resource shift to other activities. On a dollar basis, the services sector expands the most (by $16.6 billion), followed by natural resources and energy products ($10.3 billion), and agriculture ($8.1 billion).
Figure 14. Economy wide effects - deviations from the baseline, 2030 (percent)
Figure 15. Sectoral output deviations from the baseline, 2030 (percent)
Coordinated trade reforms within Mercosur
Mercosur-EU
Mercosur-Pacific Alliance
0.00 2.00 4.00 6.00 8.00
0.93
0.58
0.41
Imports Exports Real GDP
-1.00.01.02.03.04.0
-0.8
2.23.4
Agri. And food ManufacturingNR and energy Services
Source: World Bank staff elaboration using GTAP-Linkage model
Source: World Bank staff elaboration using GTAP-Linkage model
17. The second largest economy-wide gains would come a reciprocal preferential trade agreement between Mercosur and the EU. Again, different sectors would face distinct effects. Exports and imports would increase by 5.5 and 4.9 percent, respectively, while GDP would experience a 0.58 percent increase (above baseline projections in 2030). All big sectoral aggregates woulde experience positive output variations (above baseline projections in 2030): manufacturing would experience the highest expansion (2.2%) lead mainly by expansion of footwear sector.
18. Overall, the CGE results presented here are conservative estimates. However, their magnitude is aligned with other recent reform simulations estimated for Brazil. While the model is dynamic in the sense that the capital stock can change over time, it does not include other dynamic factors such as productivity increases from endogenous growth effects via technological spillovers, “learning by doing,” and inflows of foreign technology and efficiency-seeking FDI induced by liberalization. Nevertheless, the magnitude of the results is aligned with recent empirical evidence on the potential benefits from furthering trade liberalization on Brazil. For instance, results from IMF (2017) suggest that halving tariffs on capital goods in Brazil would increase investment to GDP ratio by about two percentage points. Araujo and Flaig (2016) uses a CGE model and shows that if Brazil reduces its import tariffs to OECD minimum level, eliminates all local content requirements and reduces export tariffs to zero, aggregate output would grow by 1.7 percent.
11

19. At firm level, higher participation in GVCs is expected to bring productivity dividends to firms. The literature on the productivity effects from GVC participation points to three main transmission channels. First, through specialization in tasks. The growth of GVCs has led to increasing specialization in specific activities within value chains. Firms then can reap productivity gains by specializing in those core tasks for which they are most efficient, and offshoring less efficient parts of the production process abroad (Grossman and Rossi-Hansberg, 2008). Second, through access to a larger variety and quality of intermediate inputs; as previously highlighted in this chapter there is vast empirical evidence in the literature showing the effects of importing inputs in productivity growth (see Halpern et al (2015), for instance). Third, through knowledge spillovers from multinational enterprises. To the extent that these firms tend to demand more and/or better-quality inputs from local suppliers and may also share knowledge-technology and encourage the adoption of new practices, sales of GVC-linked local intermediates to international buyers is expected to spur productivity by increasing the demand for more or better inputs and by providing assistance to local suppliers (Taglioni and Winkler 2016).20
20. The existence of productivity spillovers from structural integration in GVCs for Brazilian manufacturing firms is confirmed by recent analysis. Using a cross-section of around 12,700 domestic manufacturing firms in 22 low- and middle-income countries from the World Bank’s Enterprise Surveys, Winkler (2017) explores the relationship between GVC integration and labor productivity for Brazil and the full sample (see Annex 2 for a brief methodological explanation). Results suggest that Brazilian manufacturing firms operating in industries with a high structural integration into GVCs, namely which equals or exceeds the 75th percentile across all 22 countries in the sample for that industry, show significantly higher labor productivity levels than those firms that operate in industries with lower GVC integration. Their difference in productivity is stronger for GVC integration as a seller (+11.2% on average) compared to GVC integration as a buyer (+8.5% on average) in the Brazil sample, holding all other variables constant. By comparison, the findings suggest that GVC integration as a seller at the industry level is correlated with a smaller labor productivity surplus (+3.8% on average) in the sample of 22 countries, and is non-existent for high GVC integration as a buyer.
21. Integrating to CGV represents a challenge to countries that are far from trade hubs. However, there are also some opportunities. A recent OECD study – see OECD (2015) – suggests that location is one of the main non-policy determinants of GVC participation: evidence suggests that because GVC activity is organized around large manufacturing hubs, the larger the distance to the main manufacturing hubs in Europe, North America and Asia, the lower is the backward (buyer) engagement. On the other hand, while there is a premium to locating close to “headquarter” economies, there are also opportunities for GVC integration for countries located far from the large manufacturing hubs. First, distance is likely to be a significant barrier in some value chains, but much less so for others; a recent empirical analysis conducted by Cheng et al (2015) on the determinants of GVC participation suggest that physical distance (weighted by economy size) is negatively associated with trade in GVC only for low tech manufacturing
20 It is worth stressing however that the knowledge spillovers from international buyers and FDI in general tend to accrue asymmetrically, benefitting firms with sufficient absorptive capacity. In this regard, the capacity of a country or a firm to absorb, adapt, and reap the full benefits of knowledge produced at the frontier depends on strategic investments in R&D, organizational know-how, and other forms of knowledge-based capital. (OECD, 2015)for a theoretical and empirical discussion on the role of technology diffusion as a channel to boost productivity growth.
12
sectors. Moreover, production networks serving European or U.S. markets do not need to be the only focus. With growing markets in the Americas, a regional network of production might be increasingly sustainable.
22. Increasing the number and depth of preferential trade agreements (PTAs) offers an important channel to increase participation in GVC. Given the increasing unbundling of export goods production, PTAs have become the main vehicle to bring in new disciplines (such as competition policy, intellectual property, investment, etc) that allow factories to connect across borders in a seamless way. The frequency and depth of PTAs have been increasing substantially: data presented in Hollweg and Rocha (2017) shows that the number of agreements notified to WTO have increased from about 70 in 1990 to close to 300 presently in force. The same dataset21 shows that more recent PTAs cover more policy areas than earlier PTAs: agreements signed before 1991 included on average 9 provisions whereas agreements signed between 2005 and 2015 included on average 15 provisions; more than 50 percent of agreements include deeper provisions such as anti-dumping and countervailing (CVM) measures, rules on competition, movement of capitals and intellectual property rights (TRIPS and IPR). Evidence presented by Hollweg and Rocha (2017) also suggests that GVC-related trade – proxied with trade in parts and components - is higher on average for countries that have signed deeper agreements (Figure 16), where depth of an agreement is the number of legally enforceable provisions. Drawing on a gravity framework, the same authors also present estimates showing that, on average, country-pairs that have signed deeper agreements have higher levels of GVC-related trade: an additional provision is associated with a 1 percent increase in GVC-related trade22, all else equal; similarly, GVC-related trade between countries that signed the deepest agreement is 36 percent higher than before signing the PTAs.
Figure 16. Deep PTAs and GVC-related trade: simple correlations
Figure 17. Number of active agreements by country for selected economies (2015): Latin
America
21 The World Bank dataset on PTAs content; see Annex 3 for further details.22 See Annex 3 for a methodological description of this analysis. One caveat from this estimation model is that the marginal effect of an additional provision is the same regardless of what type of provision is included. It is well possible that provisions in deep trade agreements have a different impact depending on how relevant they are for trade.
13

Source: Hollweg and Rocha (2017)Note: Low depth – agreements with less than or equal to 15 provisions; Medium depth – agreements with 15 or more provisions but less than or equal to 30; High depth – agreements with more than 30 provisions
Source: Hollweg and Rocha (2017)
23. However, Brazil sits at the margins of regional integration trends in other parts of the world, and Mercosur, the only PTA Brazil is signatory of, has a low level of depth with only six enforceable provisions. Although countries around the world have increased their participation in preferential trade agreements, especially in the last two decades, Brazil has not followed this trend. In comparison to Latin American region, countries such as Chile, Peru, Mexico and Colombia have signed on average 13 agreements (Figure 17). Compared with the other BRICS Brazil has the lowest number of agreements, followed by South Africa with a total number of 4 active agreements. Countries such as India, China and Russia have a total of 11, 8 and 20 active PTAs respectively in 2015 (Figure 18). Brazil has only one PTA, Mercosur.23 With respect to content, only 6 out of the 17 disciplines that are covered and legally enforceable24 in the Mercosur agreement are currently in force.25 If measuring the total depth of an agreement as the total number of legally enforceable provisions it includes, Brazil –and Mercosur- represent the PTA with the lowest level of depth signed by Latin American countries with the exception of agreements signed by Bolivia, Ecuador and Venezuela (Figure 19).26 In relation to the BRICS the depth of Mercosur is comparable to the one of agreements signed by China and India.
Figure 18. Number of active agreements by country for selected economies (2015): BRICS
Figure 19. PTA depth, Latin American countries
23 In addition to Mercosur, Brazil has in place a PTA with Israel since 2010; this agreement however has not been notified to the WTO. Brazil is also member of 5 partial scope agreements (PSA). A PSA which is not defined or referred to in the WTO Agreement, means that the agreement covers only certain products. Partial scope agreements are notified under paragraph 4(a) of the Enabling Clause (source: https://rtais.wto.org/UserGuide/RTAIS_USER_GUIDE_EN.html). The PSAs Brazil is signatory of are the following: Global System of Trade Preferences among Developing Countries (GSTP), Latin American Integration Association (LAIA), Protocol on Trade Negotiations (PTN) and MERCOSUR-India and Mercosur-SACU.24 See Annex 3 for a definition of enforceable provision.25 This figure has been confirmed by experts and governments in Mercosur. Although all the disciplines that currently fall into the mandate of the WTO (WTO+ provisions) are included in the Mercosur agreement, less than half are in force. The provisions in force include: FTA Industrial and Agriculture, Anti-dumping (AD), Technical barriers to trade (TBT), GATS, and Sanitary and phytosanitary measures (SPS). Other provisions such as Customs, State Enterprises (STE) and Public Procurement, are legally enforceable but currently not in force. Mercosur also includes disciplines that go beyond the WTO mandate (WTO-X provisions) such as Competition Policy, Intellectual Property Rights (IPR) and Movement of Capital. However, none of these are currently in force.26 Depth of an agreement is the number of legally enforceable provisions.
14
Ecuad
orBolivi
a
Venezu
elaBraz
il
Argentina
Paragu
ay
Uruguay
Chile
Colombia
Mexico Peru
0
5
10
15
20
25
30
35
1 1 2 1 1 1 2
22
810
13
max depth avg. Depth # of agreements
Source: Hollweg and Rocha (2017) Source: Hollweg and Rocha (2017)
Section 4. Domestic market integration and (policy created) stringencies affecting resource allocation
24. For Brazil to take full advantage of the opportunities that external integration offers, domestic markets also need to function better in a way to allow efficient allocation of resources across firm, sectors and regions. Key (policy induced) factors have been limiting domestic integration and distorting markets. The potential productivity returns accruing from further integration with the global economy can be eventually muted if the internal market is not properly integrated. Reaping the full benefits of trade liberalization will depend on how production factors move across firms, sectors and regions. In this regard, resource misallocation is ultimately influenced by policy interventions.
High costs of doing business
25. First, high costs of doing business in Brazil – traditionally referred to as Custo Brasil - tend to impose higher burden on entry of new firms that could be potentially more efficient than incumbents. Using a worldwide database, Klapper et al (2006) found that entry regulations have significant adverse effects on entrepreneurship and tend to mute the disciplining effect of competition by indiscriminately screening out small young firms that could be more productive than incumbents.27 More recently, Fuentes and Mies (2014) show that (reforms tackling) entry barriers become increasingly important to close the productivity gap as countries develop. Costs of doing business in Brazil, traditionally referred to as Custo Brasil, are high, particularly those associated with entry procedures. According to 2018 Doing Business data, entrepreneurs face substantial difficulties with regard to key entry costs of doing business, as such business registration, dealing with construction permits, and registering property. In all these three cases, Brazil ranks in the bottom third of the Doing Business 2018 ranking (176th, 170th and 131th, respectively). With regards to operational costs, the performance is even worse for paying taxes, where Brazil occupies the 184th position out of 190 countries (Figure 20).
Figure 20. Doing Business in Brazil: rank and distance to frontier
27 Evidence presented in the analysis shows that the growth in labor productivity for firms older than two years is relatively lower in naturally high-entry industries when the industry is in a country with higher bureaucratic barriers to entry.
15

Topics DB 2018 Rank
DB 2017 Distance to Frontier (%
points)
Change in Distance to
Frontier 2018-2017 (% points)
Overall 125 56.45 0.38Starting a Business 176 65.05 0.01Dealing with Construction Permits 170 49.83 0.04Getting Electricity 45 82.46 1.23Registering Property 131 52.6 0.02Getting Credit 105 45 ..Protecting Minority Investors 43 63.33 ..Paying Taxes 184 32.97 ..
Trading across Borders 139 59.78 4.21Enforcing Contracts 47 66 ..Resolving Insolvency 80 47.46 1.69
Source: World Bank Doing Business 2018 dataset.Note: An economy’s distance to frontier score is indicated on a scale from 0 to 100, where 0 represents the worst performance and 100 the frontier
Box 2. Tax structure and resource allocation in Brazil
Aggregate productivity performance at country level is particularly impaired by a complex tax structure that hampers resource allocation across sectors and states. The Brazilian tax structure with regards to goods and services is extremely complex, with four main taxes (ICMS, IPI, ISS and PIS-Cofins) that have distinct incidence coverage (cumulative, non-cumulative and mixed). More importantly, individual products are subject to different regimes depending on the industry, the way the production process is structured (vertical integration versus fragmentation) and the locality where the production process takes place. Thus, relative prices are distorted with impacts on resource allocation and productivity.
As a result, firms are often induced to integrate its activities in a vertical way, even when the production of goods and services would be cheaper if outsourced. Second, the fact that ICMS is cumulative – as it follows the origin principle and has restrictions on input tax credits – impairs exports of goods and services. Third, tax war and regional tax breaks lead to regional capital misallocation. More specifically, Brazilian states (and also municipalities) have been engaging over the years in tax competition, known as “fiscal war”; benefiting from full administrative autonomy in setting their ICMS rates, states have used the ICMS as an industrial policy instrument by granting tax exemptions to attract investment, not only in manufacturing but also services (distribution centers). As a consequence, firms are often encouraged to locate their activities in regions/states where taxes are lower, even if the production is less efficient.
Inadequate state of physical infrastructure
26. Second, another key component of Custo Brasil is the inadequate state of physical infrastructure, which constrains connectivity and hinders the increase of economies of scale, a crucial feature to reap the benefits of trade openness and to boost productivity growth. In principle, increasing the efficiency in overall public infrastructure is expected to raise productivity directly through higher infrastructure capital (measured as capital intensity) which makes private capital more productive. Recent analysis conducted by IMF (2014) - for a panel of 17 advanced economies during the 1985-2013 period - provided evidence that an increase in
16
public investment equivalent to one percentage of GDP is associated to an increase of labor productivity of 0.5 percent over the medium term, although primary through higher physical capital intensity. The impacts are higher the more efficient is the public spending system. In Brazil, the average rates of investment on overall infrastructure have been decreasing in the past decades, falling from average 5.42 percent over GDP in the 1970-80s to average 2.15 percent in 2011-16 (Frischtak and Mourao, 2017). This sinking investment trend, explained by a reduction in public investment that was not counterbalanced by private sector investment28, brought negative impacts in terms of infrastructure adequacy: Brazil scores lower than its main export competitors on qualitative indicators of infrastructure adequacy, both in terms of overall infrastructure and transport infrastructure (Figures 21 and 22). Moreover, the strong preference for road transport over other modes combined with low percentage of paved roads – 60% of cargo in Brazil flows through highways of which only 14% is paved – increases logistics costs. There is also evidence that inadequacy of transport infrastructure is associated with market segmentation in Brazil: evidence presented by Garcia-Escribano et al (2015) shows a positive correlation between slower price convergence across major metropolitan areas and longer commuting times between cities in Brazil. All these factors together converge to hamper domestic market integration which then prevents increasing economies of scale, a crucial feature to reap up the benefits of trade openness.
Figure 21. Quality of overall infrastructure, rank (2016-17)
1 = best; 144 = worst
Figure 22. Quality of road infrastructure, rank (2016-17)
1 = best; 144 = worst
United Stat
es
Canad
a
Australi
a
South Afri
ca
Russian
Federa
tion
Mex
ico
Uruguay
Argen
tina
Brazil
0
20
4060
80100
120140
1323
35
59 64 65
87
122 123
United Stat
es
Canad
a
South Afri
ca
Australi
a
Mex
ico
Uruguay
Argen
tina
Brazil
Russian
Federa
tion
0
20
4060
80100
120140
1426
3441
54
95108
121 123
Source: World Economic Forum 2016-17 Report Source: World Economic Forum 2016-17 Report
Excessive (and ineffective) use of business support programs
27. Third, several business support programs seem not only to be inefficient in reaching their objectives but they also appear to undermine creative destruction. The use of industrial policies per se is not necessarily a problem. They could be in principle justifiable in the presence of certain conditions and when the policy design (and implementation) follow certain principles. Harrison and Rodriguez-Clare (2010) argue that the theoretical justification for intervention requires at a minimum either industry-level rents or a latent comparative advantage, as well as
28 In addition, public infrastructure spending efficiency in Brazil, and Latin America in general, has been hampered by several factors, as listed by World Bank (2016), such as: weak planning, project appraisal and preparation capacity; overly rigid or myopic budgeting; difficulties with budget execution; inefficient procurement system; unclear project sustainability (caused by an imbalance between capital and current spending); uncompetitive construction industry.
17
large Marshallian externalities from production. However, because these necessary conditions are not often satisfied and/or cannot be easily identified by policy makers ex ante, promoting "soft" industrial policies that deal directly with the coordination failures that may arise within the sectors or clusters where the country has a comparative advantage is the ideal way to deviate from policy neutrality.29,30 At the aggregate level, the large fiscal transfers to businesses have not been accompanied by a positive change in productivity or in the critical inputs to productivity, such as innovation investments or the quality of managerial practices. The evolution of productivity in the Brazilian economy has been disappointing. Brazil’s share of total world manufacturing value added has remained at a similar low level as in 1990 at slightly more than 2 percent. This is striking given the sizeable increase from 3.0 to 4.5 percent of GDP in federal spending on sectoral business support policies between 2006 and 2015. In contrast, China’s share increased from about Brazil’s level in 1990 to well over 20 percent by 2013.
28. At micro level, evaluations of specific support programs also suggest a broad lack of impact on productivity. For instance, Lazzarini et al. (2014) analyses BNDES direct activity through loans and equity funding and find evidence that BNDES mostly finances large and profitable firms, lowering their financial expenses, but with no effect on their investments and performance. Also, sized-based policies – as the Simples - the largest tax exemption program in place in Brazil – have showed no impact on key economic performance indicators. For instance, Piza (2016) finds that Simples was not effective in increasing formalization rates of small firms. More recently, Courseuil and Moura (2017) show that the same program did not have any impact on firm performance within manufacturing industry: the impact on wages, employment and value added were all statistically null. In addition, Lei de Informática and the Lei do Bem31
disproportionately benefited a small number of large firms and is not able to cover, by design, young firms that are likely to be more productive. Moreover, a recent assessment of various Brazilian programs of firm support —including productive finance, business consulting, value chain, export promotion, and innovation support – presented at IADB (2017) suggests that there were few positive results on productivity or other indicators; in most cases either no impact was found or regression results were inconclusive. Overall, evidence suggest that through these non-competitively allocated incentives, Brazil has created an unlevel playing field that has favored the profitability of less efficient firms, both small as well as larger and older firms – thereby preventing more efficient firms from expanding, and likely deterring potentially more productive firms from entering these markets (Dutz et al, 2017).
29 A recent paper by Hevia et al (2017) presents an analytical framework that captures the informational problem and trade-offs that policymakers face when choosing public goods (e.g., public information, infrastructure, and law and order) or targeted industrial policies (e.g., firm or sector-specific subsidies, grants, and tax breaks). The authors argue that government lack the capacity to set firm-specific taxes that are a function of firms’ claimed productivity and then propose sub-optimal but simpler policies, which are more appropriate when the planner does not have the ability to set up an elaborate tax and compliance system. In this, more realistic, context, the model finds that providing public goods tends to be preferable to industry or firm-specific industrial policies.30 Aghion et al (2011) follows a similar approach and conclude that industrial policy interventions are “acceptable” when targeted at areas in which competition and innovation play a key role, and when intervention is governed in a way that it is both competition and innovation friendly. In practice, evidence provided for China by Aghion et al (2015) – examining the effects of tax expenditures, subsidized credit and general expenditures - suggests that incentives can promote productivity growth upon certain conditions: i) when the target sectors are already characterized by more intense competition and especially when they are competition enhancing (i.e. more dispersed across firms rather than concentrated on one or a small number of firms within the sector); and, ii) when they induce entry or encourage young firms to grow.31 Lei do Bem is a R&D tax subsidy program instituted in 2007 with the objective of expanding incentives for investments in R&D; it authorizes companies that invest in R&D and meet certain requirements to claim tax incentives automatically for certain types of spending.
18

Box 3. Inovar Auto: key features and impact
Inovar-Auto was created in April 2012. Its official objective was to promote R&D, improve the quality of domestically produced cars (energy efficiency was a target within this framework) and to promote investment and domestic production.
The incentives provided under the program follow a two-pronged approach. First, it increases a tax levied on industrialized products (IPI) by 30% for all light-duty vehicles (LDVs) and light commercial vehicles. Second, it defines a set of requirements for automakers to qualify for up to 30% discount in the IPU as follows:
Meet a corporate average vehicle efficiency target (precisely to improve the average efficiency for new LDVs by about 12% from 2012 levels by 2017)
Conduct a minimum number of manufacturing and engineering activities in Brazil for at least 80% of produced LDV and light commercial vehicles32, and
Choose at least 2 out of 3 pre-requisites to qualify for the program – (1) investment in R&D, (2) investment in engineering, industrial technology, and supplier capacitation, and (3) participation in the Vehicle Labeling Scheme.
In other words, IPI taxes will remain unchanged for those manufacturers that meet the requirements, which in principle incentivizes investments in vehicle efficiency, national production, R&D, and automotive technology. The program is limited to vehicles manufactured between 2013 and 2017, after which IPI rates return to pre-2013 levels.
While the official objective of the program was to increase the sector’s competitiveness, its real motivation seems to have been to protect domestic producers from losing market share to imports. By not including instruments to promote exports (even a t the regional level), and not boosting the sustained development of supplier’s capabilities, the program neglected the benefits of a more outward expansion approach while inflicting a longer period for technological catching up, as there was limited space to import inputs of better quality and higher variety. Overall, this program adds to other distortive policies discussed in this report – such as subsidized loans from BNDES and high import tariffs – that once taken altogether amount to a high fiscal cost with unclear impact.
In fact, according to Sturgeon et al (2017), although Inovar-Auto may have shifted demand from imports to domestic production in the short-term, it did not alter the competitiveness of the industry enough to allow Brazilian production to grow through exports or trough costs and price reductions in the domestic market. Despite the absence of a counterfactual, the authors present evidence suggesting lack of impact on most economic outcomes, as such: employment wages, production and productivity. In addition, the authors show that while Inovar-Auto improved the trade balance through a reduction of imports it did not increase the industry participation in global value chains (via increased bi-lateral trade in intermediates and knowledge-intensive services) and has not increased scale-efficiency, since automakers over invested in different plants.
On August 29th, WTO gave Brazil 90 days to remove the Inovar Auto incentives, supporting complaints of unfair competition by European Union and Japan. The Brazilian government has appealed.
29. At regional level, development policies aiming at redistributing economic activity in less flourishing areas, have been showing mixed impacts on local productivity growth and might be dampening economic agglomeration effects. Proximity to large economic and population mass tends to be beneficial for productivity.33 As in many international examples,
32 For cars and light commercial vehicles these manufacturing stages are: Stamping; welding; anticorrosive treatment and painting; plastic injection; motor manufacturing; gearbox and suspension systems assembly; steering and suspension systems assembly; electrical systems assembly; axle and brake systems assembly; monoblock manufacturing or chassis assembly; final assembly, review and testing; and own laboratory infrastructure for product development and testing. For trucks these manufacturing stages are: Stamping; welding; anticorrosive treatment and painting; plastic injection; motor manufacturing; gearbox and suspension systems assembly; steering and suspension systems assembly; electrical systems assembly; axle and brake systems assembly; monoblock manufacturing or chassis assembly; final assembly, review and testing; final assembly of cabins or bodies, with installation of items, including acoustic and thermal, lining and finishing; Production of bodies predominantly through single pieces stamped regionally; and own laboratory infrastructure for product development and testing. For chassis with an engine the manufacturing stages are: welding; anticorrosive treatment and painting; plastic injection; motor manufacturing; gearbox and suspension systems assembly; steering and suspension systems assembly; electrical systems assembly; axle and brake systems assembly; monoblock manufacturing or chassis assembly; final assembly, review and testing; production of bodies; and own laboratory infrastructure for product development and testing. 33 Several intuitive theoretical mechanisms suggest that productivity and economic concentration carry a positive relation. Thicker labor markets reduce search cost provide a deep pool of worker and improve matches. Proximity might also be directly beneficial: externalities occurs when firms learn from closely located firms, and workers for workers in the same area. Third, public service delivery and provision of infrastructure are cheaper in denser areas, making it easier for the local and national
19

there is evidence that concentration of urban population is correlated with productivity index (and higher average earnings) in Brazil. Estimations presented by Duhaut and Lall (2017) show that in 2010, a 10 percent increase in the urban population concentration of a municipality was linked to a roughly 4 percent increase in local productivity index (see Annex 6 for detailed methodological presentation and results). Several regional policies aim at revitalizing low performing areas in Brazil (Box 4) and results on the impact of these policies on local labor productivity are mixed. Duhaut and Lall (2017) apply a propensity score method combined with a difference-in-differences estimator to assess how credit provided under the regional Constitutional Financing Funds as well as loans provided by BNDES under the Regional Dynamization Policy (the PDR)34 impact local productivity growth between 2008 and 2014 (see Annex 7 for a methodological presentation). Two elements constrain the analysis: first, in 2014, 98% of the municipalities saw at least one firm of any size receive a credit card, such that the municipalities whose firms do not receive any funds from the BNDES are in limited number. The data available do not allow for controlling for amount of credits received in the past such that caution should be exercised when drawing conclusion on causality. However, several links between the two types of credits and productivity can be established by comparing areas with similar ex-ante growth trends. Figure 23 compares minimally comparable areas (MCAs) according to the type of credits they receive: Constitutional Funds, BNDES and areas that receive both types of credits. When pooling all MCAs together or when looking at low population density MCAs only, the type of receiving both types of credits is positively linked with local productivity changes: pooling across all population densities, receiving credits from the Constitutional Funds and the BNDES is linked to an 12% higher productivity index in 2014 compared to areas that received Constitutional Funds only, 8 % for low density areas. In conclusion, a careful analysis of spatially targeted policies and instruments of support for industrial policy in Brazil show little evidence of a differentiated impact on local productivity However, when they coincide, spatially targeted and sectoral policies are shown to be linked to greater improvement in productivity, which suggests that shows that regional development programs in Brazil may generate higher productivity dividends if better coordinated.
Figure 23. Effects of Funds and Credits on local productivity (by urban density of minimum comparable areas)
Dependent variable: logarithm of productivity indexAll densities High density MCAs (> p
(50))Low density
MCAs (<p(50))BNDES 0.537*** 0.094 0.354*
(0.143) (0.224) (0.184)Both -0.016 0.130 -0.005
(0.103) (0.274) (0.079)2014 0.581*** 0.364*** 0.557***
(0.031) (0.103) (0.039)BNDES x 2014 0.017 0.162 0.157
(0.062) (0.104) (0.134)Both x 2014 0.114** 0.046 0.079*
(0.054) (0.117) (0.046)
authorities to provide better quality service and infrastructure for local firms. Finally, in presence of transport cost, being located nearby bigger markets of potential customers and having access to a larger pool of input provider might be more efficient for firms. In practice, the link between productivity and economic concentration is well documented. For example, for the United States, Rosenthal and Strange (2004) report an elasticity of city productivity with respect to size between 0.04-0.11. For Great Britain, doubling the workforce in an area is linked to a 3.5% increase in productivity (Rice, Venables and Patacchini,2006)).34 Specifically, the BNDES Automatico and BNDES FINEM lines.
20

Constant 5.757*** 6.361*** 5.707***(0.089) (0.214) (0.075)
Leads Yes Yes YesN 4860 2450 2429Adj. R2 0.47 0.41 0.53Notes: The dependent variable is the logarithm of the productivity index, the independent variables are a set of dummy for the type of funds received, year considered and the interaction. * p < 0.05, ** p < 0.01, *** p < 0.001.
Box 4. Brief Overview of regional development policies in Brazil
Since 1988, the Brazilian Constitution emphasizes the importance of reducing regional disparities. This objective translates in the National Policy for Regional Development (PNDR) with the dual goals of reducing regional inequalities and activating the development potential of the Brazilian regions. To work towards these dual goals, several instruments are in place at the regional and the federal level.
First, the Regional Development Funds – the National Fund for Regional Development; the three Constitutional Financing Funds (FCO, FNE and FNO); and the Northeast Development Funds (FDNE) and Amazonia (FDA). Constitutional funds are allocated to productive activities in the North, North-East, and Centre West under the form of loans by authorized banks. The Constitutional Funds invested more than R$. 82.93 billion in between 2004 and 2010, representing the biggest instrument of regional policy in Brazil (Carvo and Resende (2015)).
Second, Regional Plans for specific sub regions- the Macroregional Development Plans (Sustainable Amazonia, Northeast / Semi-Arid and Midwest); and Mesoregional Development Plans.
Third, Government Programs – the program for Promotion of Sustainability of Sub-Regional Spaces – PROMISE; the program for Integrated and Sustainable Development of the Semi-Arid – CONVIVER; the program for Social Development of the Border Region – PDFF and the program for the Development of the Integrated Development Regions (RIDE's) of the District Federal and surroundings, Juazeiro-BA and Petrolina-PE, and Grande Teresina-PI.
Finally, there are also programs that are publicly funded but are not a direct government program; this is the case of the Regional Dynamization Policy (Política de Dinamização Regional) managed by the Brazilian Development Bank (BNDES). Overall, the Bank is the main financing agent for development in Brazil and offers several financial support mechanisms to Brazilian companies of all sizes as well as public administration entities, enabling investments in all economic sectors. Regional and local development priorities are addressed through the Regional Dynamization Policy which aims to reduce regional and social income inequality. It consists of several budget lines that support investments in all sector, with higher participation allowed in firms in relevant targeted sectors. Two credit lines, FINEM and BNDES Automatico offer better financial conditions to priority municipalities under the PDR. The two lines represented almost 50 % of the total of BNDES loans between 2008 and 2015.
30. Despite limited benefits, the cost of these business support policies has been very high and not been accompanied by an effective oversight and evaluation system. Federal spending on business support measures in Brazil - encompassing tax expenditures, subsidized credit and general expenditures35 - more than doubled in real terms in the past decade, jumping from R$ 125 billion in 2006 to R$ 267 billion in 2015; all figures in 2015 values (Figure 24). The responsibility for spending and oversight of industrial policies at the federal level in Brazil is spread across a range of ministries and public entities. There is no one entity overseeing overall implementation: such an entity could in principle take advantage of synergies and avoid cross-program overlap, as well as evaluate the effectiveness and efficiency of individual programs.36
Figure 24. Total federal fiscal expenditures on sectoral business support policies35 Tax expenditures cover exemptions that result in foregone tax revenues; subsidized credit states for credit provided at below-market rates, and general expenditures include grants and subsidies to outputs and non-credit inputs, and payments for program administration, equipment and buildings, etc.36 See Dutz et al (2017) for a detailed discussion about the main incentives granted at federal level and how they are spread across a range of public institutions.
21

Source: Federal Revenue Service of Brazil; BNDES; FAT; Ministry of S&T (MCTI); Ministry of Industry (MDIC) Note: Values in R$ MM 2015 base year; estimated credit before 2008 and general expenditures after 2013
31. Tax exemptions are by far the most important component of federal spending on sectoral business support policies. One key characteristic of these exemptions is their non-neutral implementation which tends to focus in specific sectors and types of firms. Tax exemptions (expenditures) account for almost 61 percent of total sectoral business support policy spending and 2.9 percent of GDP in 2015. They lower otherwise-required tax payments and thereby provide an incentive to firms to invest in equipment, local content sourcing, upgrading or innovation. The expenditures related to exemptions have doubled in real terms over the past decade. The major components are payroll tax exemptions, introduced in 2011, the simplified tax regime for smaller companies, and the Manaus Free Zone. Compared with other countries, Brazil is an outlier with 2.9 percent of its GDP spent on tax exemptions. This compares to OECD economies and structural peers that spend approximatively 1 percent of their GDP on tax exemptions as well as other Latin American countries such as Argentina (1.0 percent), Chile (1.5 percent) and Peru (1.5 percent). Except for the Simples size-based tax exemptions and the R&D incentives, the remaining incentives have a sectoral focus and thereby generate distortions across sectors and activities. In addition, Simples also provides incentives to smaller firms, which can create threshold effects in preventing formal firm growth. The bulk of the implicit subsidies created by incentives go to firms in trade and services, and manufacturing industries. These differences across sectors erode a level playing field by favoring some firms and sectors over others.
32. Direct expenditure is the smallest spending category but has increased steadily 77 percent in real terms from 2006-2015. Direct spending accounted for 11.6 percent of total spending on sectoral business support policies and 0.53 percent of GDP in 2015. General expenditures include current spending, investment and transfer payments. An advantage of direct spending is that it is directly oriented to the beneficiary, which makes it easier to monitor and evaluate, as the public institution that allocates the funds can collect detailed information on the recipients during application and disbursement stages.
22

Additional government interventions: product market regulations and competition law enforcement.
33. Reducing cost of doing business and improving the adequacy of infrastructure are not enough to foster competition in markets and ensure domestic market integration. Effective antitrust enforcement and pro-competition regulation are also important. Even when transport and transaction costs are lower, or when costs of paying taxes, getting electricity and dealing with construction permits are reduced, there may be still firms exercising significant market power even in geographically large and integrated markets, for example, if they agree to collude on prices, or if there is a lack of regulation that prevents the abuse of dominance by firms that supply services in segments with features of a natural monopoly. Effective antitrust enforcement and pro-competition regulation minimize these risks and are key pillars of a holistic competition policy37 In this turn, while this paper discusses specific policies that can enhance healthy market dynamics and competition, it does not include an assessment of Brazil’s competition policy implementation itself.38
34. Available data on product market regulation reveal that government interventions in domestic markets have not been conducive to competition. Competition enhances productivity by improving allocative efficiency, enhancing productive efficiency, and boosting innovation. Syverson (2011) identifies studies that find higher competition intensity to drive productivity levels within an industry by firstly, moving market shares to more efficient firms and secondly, by raising incentives for firms to increase their efficiency (through cost-reduction or innovation/technology upgrade). Aghion, Akcigit and Howitt (2014) also provide a compelling framework linking market competition to productivity growth through creative destruction. Some government interventions unduly inhibit firm’s ability or incentives to compete. The OECD Product Market Regulation (PMR) indicator measures the degree to which policies or regulatory measures promote or inhibit competition in areas of the product market where competition is viable. PMR data for Brazil in 2013 suggests that policies and regulations in key sectors are less conducive to competition than in comparator countries.
35. While other BRICS countries have promoted reforms over the last decade, the overall restrictiveness of product market regulation in Brazil remained unchanged between 2008 and 2013. The general degree of restrictiveness of product market regulations in Brazil has not changed since between 2008 and 2013, and compares less favorably to other economies which on average have moved towards a more pro-competitive regulatory framework (Figure 25). In fact, while others such as China, Russia, South Africa and India have reduced their PMR scores by 9 to 17 percent, Brazil’s overall PMR score suggests little reform progress between 2008 and 2013 (Figure 26).
Figure 25. PMR indicators: Brazil vs comparator countries, 2013
(Index scale 0 to 6 from least to most restrictive)
Figure 26. Changes in the OECD Product Market Regulation Indicator from 2008 to
2013- (Greater reduction in the PMR is associated with
37 Competition policy encompasses a set of policies and laws that ensure competition in the marketplace is not restricted in such a way as to reduce economic welfare (Motta, 2004).38 For more details on what competition policy encompasses, see Kitzmueller and Licetti (2012).
23

regulations less restrictive to competition)
Source: Product Market Regulation WBG OECD databaseNote: OECD top 5 are Austria, Denmark, Netherlands, New Zealand and the UK
Source: Product Market Regulation WBG OECD databaseNote: OECD top 5 are Austria, Denmark, Netherlands, New Zealand and the UK
36. Barriers to entrepreneurship represent the largest source of restrictiveness to competition in Brazil and are likely to slow down the reallocation process by preventing entry of potentially more productive firms and/or reinforcing the dominance in specific markets. Three main policy areas are mapped by the PMR methodology: state control, barriers to entrepreneurship, and barriers to trade and investment, economy-wide and in key sectors, including transport, retail, professional services, energy and telecommunications39. A decomposition of the PMR Indicator for “barriers to entrepreneurship” reveals that the complexity of regulatory procedures is particularly burdensome (Figure 25). For instance, the license and permits system has seen no improvement since 2008.
37. There are sizeable barriers to competition in services sectors – especially those needed for construction. For example, the number of tasks for which the legal, accounting and architectural services have exclusive rights (7, 9 and 8, respectively) is higher than other OECD countries; for the three professional services, there is compulsory chamber membership and a requirement for accreditation. In Brazil, engineering services can only be provided by professionals registered with a professional association (CONFEA/CREA)40. In other countries, such membership to professional associations is usually just voluntary. These associations additionally have the power to regulate the engineering profession in Brazil, which presents high barriers to entry of foreign competitors. This is critical, since Brazil graduates on average 6 engineers per 1,000 working population compared to 25 engineers per 1,000 working population in the United States and Japan.41 Permanent registration by foreign engineers with the CREA may take up to 3 years, while temporary registration is subject to the CREAs’ discretion. Even with a temporary registration, foreign engineers need to have their work supervised by a registered Brazilian professional and cannot hold a majority stake or occupy a management position in a Brazilian engineering company.42 CONFEA additionally decides on the list of tasks that can be 39 See Koske et al (2015) for a detailed presentation of the PMR methodology.40 Conselho Federal de Engenharia e Agronomia - CONFEA (Federal Council of Engineering and Agronomy) is the professional associations entrusted with the regulation of engineers and engineering services in Brazil. CONFEA operates nationwide through its state agencies called CREAs (Regional Council of Engineering and Agronomy).41 Based on 2015 data. See also: http://www.confea.org.br/cgi/cgilua.exe/sys/start.htm?infoid=15360&sid=1206.42 Brazil is also not party to any of the three international agreements on mutual recognition of engineering accredited programs:
24
executed only by registered engineers, which is opposed to good practice where such lists are set by independent bodies43. CREAs publish tables with engineering service fees. Even though they are not mandatory, CONFEA’s Code of Ethics establishes that engineers should not practice prices that are either excessive or that deviate from the minimum amounts that are set in CREA’s tables.
Figure 27. PMR indicator decomposition through state control: Brazil, 2013
(Index scale 0 to 6 from least to most restrictive)
Figure 28. PMR indicator decomposition through barriers to entrepreneurship: Brazil,
2013(Index scale 0 to 6 from least to most restrictive)
Source: World Bank staff elaboration using WBG-OECD data Source: World Bank staff elaboration using WBG-OECD data
38. Overall, construction in infrastructure is critical to reduce stringencies that prevent efficient allocation of resources across regions, and effective competition policy in related markets will remain critical to ensure to maximize the potential gains of such investments. While investments into infrastructure will be critical for higher connectivity, connected markets must be well-functioning to maximize the enhanced integration of domestic markets: Competition policy can ensure that engineers have higher incentives to provide quality services at competitive prices, that providers of construction materials do not engage in market-sharing agreements and that transport and fuel providers compete effectively. As highlighted in (World Bank 2017), physical infrastructure is only part of the transportation challenge.
39. Directly government participation in markets can be distortive to competition, and competitive neutrality could be strengthened. SOEs can be found in at least 23 markets in Brazil. While SOE participation is common, especially in sector in network sectors, effectively implemented rules that guarantee competitive neutrality are critical to ensure that all market participants (public and potential private competitors) have the right incentives to operate efficiently and competitively. In this regard, publicly-controlled firms in Brazil may benefit from undue competitive advantages as they can receive financing which is not available to public companies. While Article 173 of the Brazilian Constitution stipulates that public enterprises may not receive any tax benefits that are not available to private enterprises, this does not extend to other forms of financial transfers (such as loans) and the article does not apply to any enterprise that provides a public service44. State control is also high when measured in terms of
the Washington Accord for Engineers, the Sydney Accord for Engineering Technologists, and the Dublin Accord for Engineering Technicians.43 OECD (1999) Competition Policy in Professional Services, p. 9.44 Article 175 of the Constitution and Surpreme Court decisions relating to “Casa da Moeda”, “ECT” and “Infraero”
25
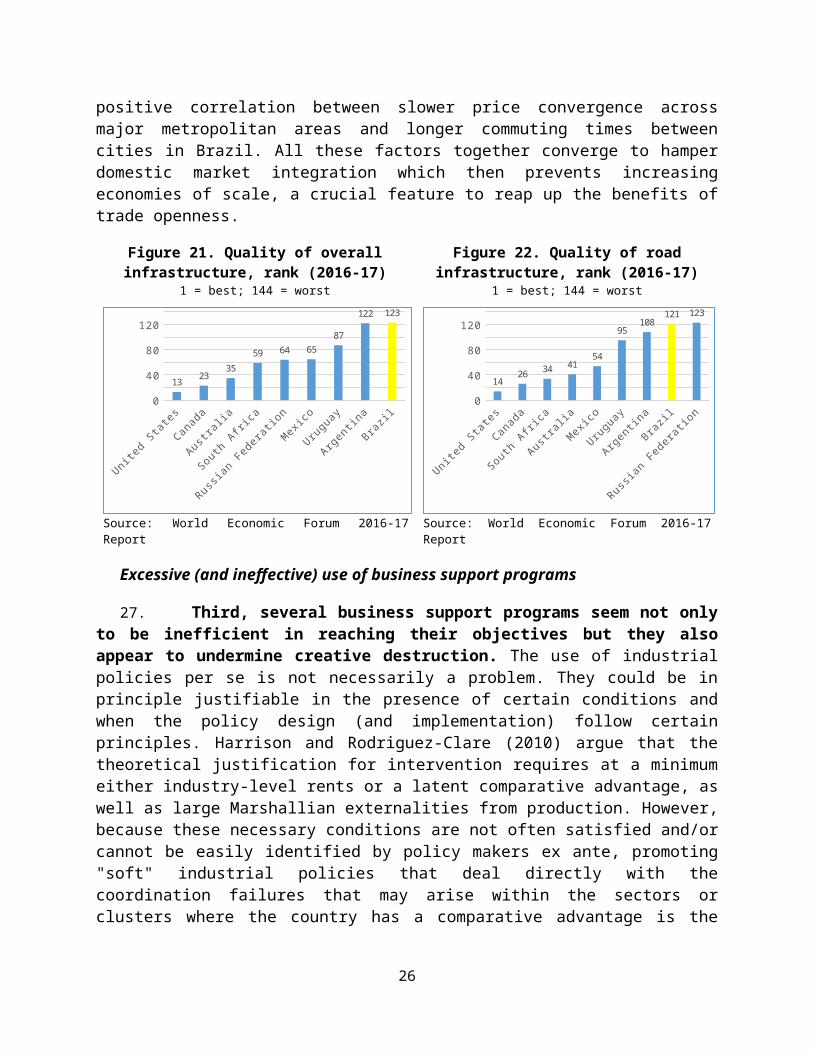
involvement in business operations. For instance, unlike in several other countries, as of 2013, price controls still applied to pharmaceuticals.
40. While there are regulatory barriers that hinder the efficient allocation of resources across sectors, regions and firms, some critical markets also have inherent features that reduce contestability and facilitates anti-competitive behavior. In 2014, Brazil’s Competition Authority CADE sanctioned 6 domestic cement companies that represented 75% of the domestic cement market for forming collusive agreements. While local cement sales had doubled in the past decade, prices had increased by around 33%. CADE estimates that customers overpaid around US$9 billion over the two decades the cartel existed.45 A total of 14 cartel agreements have been uncovered by CADE in fuel retail and LPG markets between 2002 and 2015. In one of these, subsequent consumer savings were estimated at over U$ 10 million a year. 46
Section 5. Potential productivity dividends accruing from stronger competition
41. Reducing distortions to market functioning – through the combination of opening to foreign trade with the reduction of policy induced stringencies that hamper resource allocation in the domestic market -would boost competition in product markets which is then expected to bring positive payoffs for productivity growth in the manufacturing industry. An econometric analysis is conducted to measure the association between productivity growth and competition intensity for Brazil. The analysis draws on the methodology presented at Aghion et al (2008) and uses data at CNAE 3-digit level from 2007–2014 Pesquisa Industrial Annual (see Annex 4 for a methodological presentation). The results suggest that higher price cost margins (implying that firms face lower levels of competition intensity) are significantly associated with lower (labor) productivity growth in the following year (see Figure 29).47 The economic magnitude of the (average) “effect” is non-negligible: a 10 percent decrease from the manufacturing overall mean price cost margin of 0.14 is associated with an increase in productivity growth of 3.4 percent per year. With regards to this average “effect”, two aspects are worth highlighting. First, the productivity dividends reflect overall competition pressure and therefore includes both domestic and foreign competition pressure exerted by trade. In fact, data shows that sectors (at 3-digit level) with higher import penetration present lower price cost margins (see Figure 30), which suggests that increasing import penetration can be one effective channel to increase competition pressure.48 In addition, the largest productivity growth dividends from fiercer competition (at 2-digit sector) are observed in sectors where import penetration is already high (see Figure 31), suggesting that greatest gains can be achieved from promoting fiercer competition in domestic markets. Second, as expected, the magnitude of the (lagged) markup coefficient varies substantially across markets: the productivity growth dividend of a 10 percent decrease in average markup by sector varies from 1.43 percent (“Roasting and Milling of Coffee”) to 7.54 percent (“Magnetic and optical media”) (Figure 32).
45 http://www.reuters.com/article/2014/05/29/brazil-cement-antitrust-idUSL1N0OE2IF2014052946 http://www.cade.gov.br/upload/Brazil_Leniencia_Program_Brochure.pdf47 The relationship between price cost margin and productivity is negative on average and did not present a U-shaped format, as the coefficient of the squared PCM term was not statistically significant (see column 2).48 Import penetration data is taken from Confederacao Nacional da Industria website (available at http://www6.sistemaindustria.org.br/gpc/externo/estatisticaAcessoSistemaExterno.faces)
26

Figure 29. Price cost margin and labor productivity growth in Brazil's manufacturing industry (3-digit sector level analysis, 2007-2014)
(1) (2)PCM[t-1] -2.374***
(0.167)-2.833***
(0.421)PCM[t-1] squared 1.442
(1.191)Constant 0.394***
(0.026)0.425***
(0.036)Year fixed effects Yes YesSector (3-digit) fixed effects Yes YesNo. of observations 691 691W0ithin R-squared 0.334 0.336
Note1: Clustered standard errors at year level are in parentheses. ***, **, and * indicate significance at 1 percent, 5 percent, and 10 percentNote2: Results are from a fixed effects OLS regression (excluding influential outliers). The dependent variable is the real labor productivity growth, and labor productivity equals value added per worker. Price cost margin is defined as (Value added - labor costs)/gross output. All variables (value added, number of employees, labor costs and gross output) are taken from PIA sector tabulations at 3 digit level. Nominal values of value added are deflated to 2007 values using the CPI as reported by the OECD.
Figure 30. Import penetration vs price cost margin (at 3-digit level); pooled observations
2007-2014
Figure 31. Import penetration vs (estimated) productivity growth dividend: 2-digit sector;
average 2007-2014
27

Figure 32. Estimated “effect” on productivity growth from a 10 percent decrease in average markup by (3 digit) sector
0.00
1.00
2.00
3.00
4.00
5.00
6.00
7.00
8.00
1.43
7.54
perc
ent
Note: productivity growth dividend at sector level correspond to the coefficient of the (3-digit level) sector interaction with the PCMt-1 variable. The figure shows only the sectors for which the interaction coefficient was statistically significant.
28

Section 6. Conclusions and overall policy recommendations
42. As a result of protective trade policies, Brazil’s external integration is substantially limited which has been preventing local firms to benefit from multiple sources of productivity gains, such as: reaping the benefits from economies of scales accrued from access to larger markets; relaxing technological constraints through access to better-quality and competitively priced inputs, and facing stronger competition (either from import competition or entry of foreign companies) which pushes firms to increase efficiency.
43. Evidence compiled by this paper suggests there is large scope for further trade reforms in the country. Tariffs are high, use of NTMs is widespread, use of local content requirement is substantial, and the number (and depth) of FTAs Brazil is signatory of is quite restricted. Unilateral tariff reforms could prioritize reducing tariffs on capital goods and intermediates; reducing tariff escalation and establishing more homogeneous levels of protection; and simplifying the tariff structure by reducing the number of tariff levels. Opening to trade goes beyond tariff liberalization. In this regard, tariff liberalization efforts should be combined with a more aggressive strategy of trade agreements, especially with more technologically sophisticated countries with significant GVC integration and learning potential for Brazilian companies (e.g. Canada, EFTA and New Zealand as warm-up for US, EU and Australia). In addition, LCRs in input markets should be removed and tax structure on services imports should be streamlined. From trade facilitation front, the recent unified export system with an online platform that has started to function in mid-2017 represents a major improvement; however, there is still space to streamline other initiatives, such as the Authorized Economic Operator Program where ANVISA and Exercito could provide a common assessment framework and a single authorization.
44. Reducing barriers to trade would bring substantial payoffs for Brazil, according to a customized analysis developed for this paper. Estimations from a customized CGE model show that coordinated reforms at the Mercosur level would permanently accelerate overall trade (parts, components and final goods), increasing both exports and imports by 7.5 and 6.6 percent, respectively, by 2030 relative to the baseline. These reforms would also trigger a permanent expansion of economic activity: real GDP would be 0.93 percent higher than the baseline by 2030. In addition, increasing the level of depth of Mercosur would increase Brazil’s GVC-related trade with Mercosur partners: if Mercosur had all 17 legally enforceable provisions currently in force, Brazil exports in parts and components to other Mercosur members would increase 22 percent on average (2,287 $USD million).
45. Reaping the full benefits from further integration to the global economy will depend on how production factors move across firms, sectors and regions. Evidence compiled by this paper suggests that resource allocation process in Brazil has been hampered by several stringencies created by distortive “behind the border” policies. Four key issues were highlighted. First, high costs of doing business tend to impose higher burden on entry of new firms that could be potentially more efficient than incumbents. Second, lagging transport infrastructure and lack of technology diffusion policies constrain the increase of economies of scale. Third, federal spending on industrial policies has been growing at high speed and several incentive programs seem not only to be inefficient in reaching their objectives but they also appear to undermine
29

creative destruction. Fourth, product market regulations in markets have been not conducive to competition.
46. Main policy recommendations for further trade integration include:
Reform of the tariff schedule: The new tariff schedule should be designed to give greater rationality to the protection structure. In addition to high import tax rates, there are a number of distortions resulting from both the Brazilian tariff structure and the way it has been managed, resulting in levels of effective protection badly distributed, ad hoc administration of import tariffs, reintroduction of temporary import quotas associated with tariff reductions, and costly proliferation of tariff exemptions. A new protection structure should be designed to provide long-term predictability for producers and investors in Brazil. The trade liberalization schedule should be announced in advance and be implemented gradually over a few years and should focus on simplification of the tariff schedule, limitation in the number of levels of tax rates, a reduction of the cost of imports of intermediate products and capital goods, and a reduction in the effective rates of protection.
Reducing or streamlining the application of non-tariff measures, involving, inter alia:
a. Remove local content requirements, in particular in input markets. LCRs in input markets deter integration into GVCs, limit the choice of best-global inputs, and thereby depress productivity & competitiveness of user industries.
b. Reduction of the tax burden on exports. Simplifying national tax regimes, reducing ancillary costs in meeting tax requirements, and eliminating tax residues levied on exports with the payment of tax credits due to exporters is essential to give predictability and greater competitiveness to domestic production.
c. Reinforcement of institutions for technical regulation and product certification (eg INPI and INMETRO). Participation in global value chains requires property rights guarantees for technology transfer along the chain and ability to comply with standards and technical regulations. It is essential to reduce time limits in obtaining patents and to develop the capacity to participate in the definition of international norms and regulations that affect Brazilian exports.
d. Reduction of services costs. Reforms should start by reducing the high levels of restrictiveness especially in financial and professional services (substantially above the regional average). It would be important to reassess the tax treatment for imports of technical services in Brazil, essential for technology attraction, business consulting, etc. and currently highly taxed (see CNI 2016). Finally, Brazil would benefit from removing barriers to services trade and investment in international trade agreements - it should start with opening up restrictions in its main trade agreement, Mercosur – much more
30

restrictive than most trade agreements in the region, and especially comparted to LAC commitments in FTAs with the US.
Reinforcement of the Trade Facilitation agenda, including:
a. Accelerate the implementation of the Single Portal for exports and imports:
b. Creation of a single payment system for all government fees.
c. Use of risk based assessment at the border, including all agencies involved
d. Authorized Economic Operator
Pursue an aggressive strategy for (deeper) trade agreements, starting by completing ongoing negotiations Mercosur-European Union, the main market for Brazilian exports, but also including moving forward in negotiations within the Americas, including Mercosur-Pacific Alliance and resuming the idea of a free trade area in the Americas.
47. Looking forward, there is also large scope for “domestic” reforms aiming at improving resource allocation process across firms, sectors and regions. First, reducing economy-wide regulatory costs of doing business would help alleviate the burden that are disproportionately higher for new entrants. In addition, the tax structure needs to be streamlined at least to harmonize taxes across jurisdictions as a way to boost the efficiency of resource allocation process across states and municipalities. Second, transport infrastructure needs to be streamlined which requires improving infrastructure public spending efficiency. According to World Bank (2016), Brazil, as most Latin American countries, has limited fiscal space to increase public investments, so much of what is needed to increase public spending efficiency (in transport and overall infrastructure) lies outside the infrastructure sector and has to do with broader government issues—from pro-competition reforms in construction services sectors, such as engineering and architecture (to help bring costs down) to budgeting rules that no longer solely focus on controlling cash expenditures Third, business support programs need to be revisited and properly evaluated to identify which incentives are effectively working as well as those that should be eliminated to avoid prolonging the distortive incentive structure that private sector firms often rely on to survive. Fourth, tackling anti-competitive business practices, removing product market regulation that restrict competition represent key anchors to boost domestic competition. In this sense, trade liberalization also plays a role as import competition represents an extra channel to boost domestic competition.
48. Last but not least, it is key to ensure that the removal of external barriers to integration is accompanied and coordinated with the removal of internal distortions. In addition to the progress achieved in the area of trade facilitation and the initial steps to remove local content requirements, the removal of trade barriers can be accelerated by the elimination of regulatory barriers to export and by an in-depth assessment of NTMs; these are measures that are less costly from a fiscal standpoint and are likely to bring positive impacts on trade and possibly on jobs. As a second step, we would recommend tackling tariff peaks and tariff escalation in the context of the flexibility Mercosur already offers (i.e. unilaterally) while advancing negotiations
31
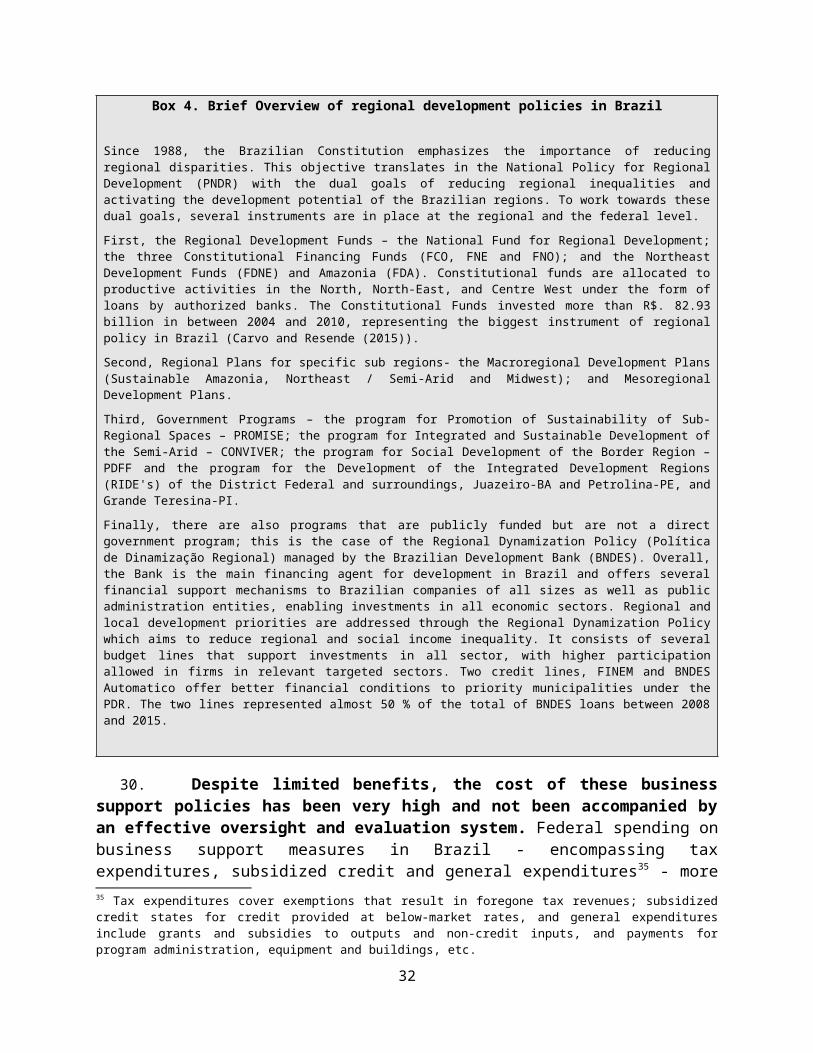
on new Preferential Trade Agreements (PTAs). Meanwhile, the removal of internal market distortions will involve the combination of (medium term) policies encompassing the reduction of regulatory costs of doing business, with particular focus on the elimination of tax distortions across states, reduction of connectivity costs and boosting competition.
32
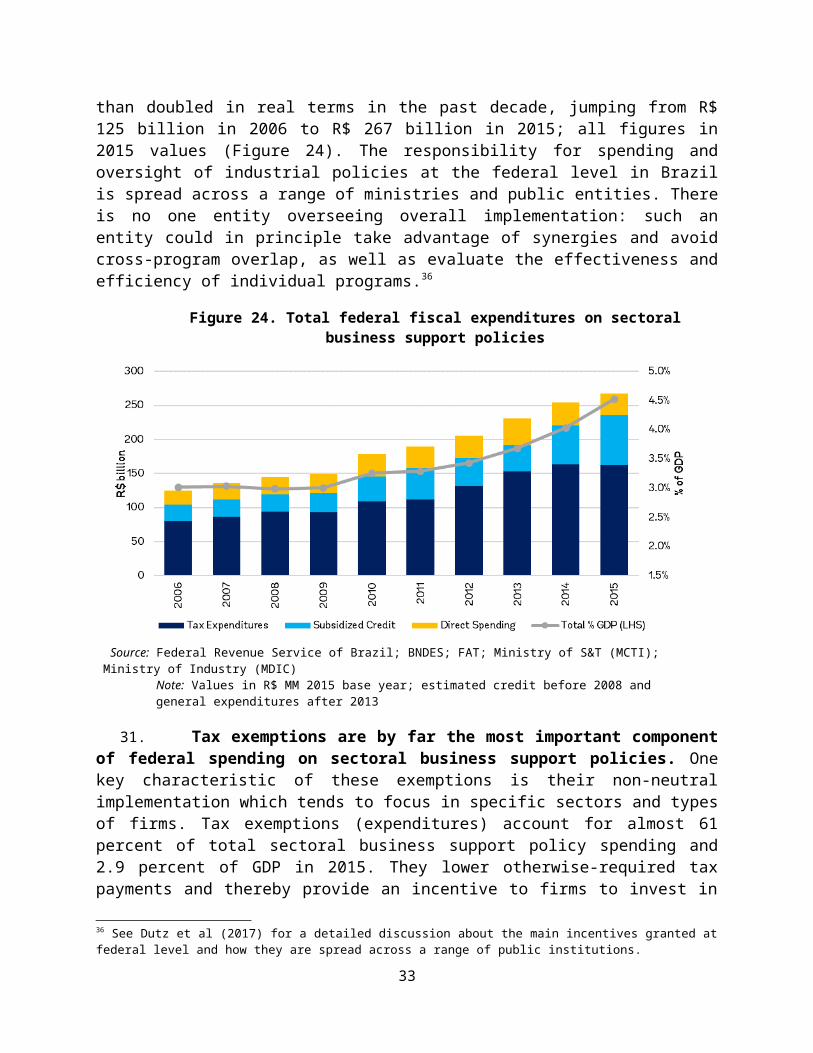
Annex 1. Revealed Comparative Advantage in Brazil
Table A1.1. Revealed Comparative Advantage in Brazil using value added (2011)TiVA code Industry description RCA
C15T16 Food products, beverages and tobacco 3.61
C01T05 Agriculture, hunting, forestry and fishing 3.29
C10T14 Mining and quarrying 1.67
C21T22 Pulp, paper, paper products, printing and publ. 1.47
C27 Basic metals 1.34
C20 Wood and products of wood and cork 1.28
C34 Motor vehicles, trailers and semi-trailers 0.94
C24 Chemicals and chemical products 0.88
C26 Other non-metallic mineral products 0.76
C29 Machinery and equipment 0.76
C35 Other transport equipment 0.75
C25 Rubber and plastics products 0.64
C28 Fabricated metal products exc. Machinery 0.54
C31 Electrical machinery and apparatus nec 0.49
C17T19 Textiles, textile products, leather and footwear 0.44
C23 Coke, refined petroleum products and nuclear 0.40
C30T33 Computer, electronic and optical products 0.22
C36T37 Manufacturing nec; recycling 0.11Source: Hollweg and Rocha (2017)
33

Annex 2. Methodology for the estimation of the relationship between GVC integration and labor productivity
Using a cross-section of around 12,700 domestic manufacturing firms in 22 low- and middle-income countries from the World Bank’s Enterprise Surveys, the analysis presented in Winkler (2017) explores the relationship between global value chain (GVC) integration and labor productivity for Brazil and the full sample. Besides the standard variables from Enterprise Survey, the database was merged with two sectoral measures of structural integration in GVCs, as captured by the measures of Eigenvector centrality: BONwin (buyer’s perspective) and BONwout (seller’s perspective). The measures were computed by Taglioni and Santoni (2014) and are based on value added trade data. The measures express the idea that the influence of a node in a trade network is proportional to the influence of its neighbors: the node’s eigenvector centrality is largely determined by the eigenvector centrality of its neighbors.
The analysis assesses for the full sample and Brazil separately how GVC integration and other firm characteristics are correlated with a domestic firm’s average labor productivity. The baseline equation is estimated by ordinary least squares (OLS) and takes the following form:
lnlpirst= α + βACcst + ζlncapintirst + Dr + Ds + Dt + εirst (1)
lnlpirst indicates the labor productivity for firm i in subnational region r, sector s and at time t in natural logarithms, defined as value added per worker. AC designates a firm’s absorptive capacity and includes the measures as defined in the table below. lncapintirst is capital intensity in natural logarithms. The equation also includes subnational region, sector and time fixed effects. Standard errors are robust to heteroscedasticity and clustered at the country-sector level.
The analysis is particularly interested in whether labor productivity for domestic firms is higher in sectors that are characterized by higher GVC integration. The variable BON_d is then introduced; it is a dummy that takes the value of 1 if a sector’s GVC integration equals or exceeds the median across all countries, and 0 otherwise.49 The analysis is replicated for Brazilian firms only which allows to compare the relationship of firm characteristics, including the extent of GVC integration at the sector level, with labor productivity.50
Box A2.1 Measures of absorptive capacity
• gap = firm’s LP relative to median LP of multinational firms in sector in natural logarithms; a higher number indicates a lower gap.
• tech = firm’s technology indicator, defined as iso + tech_for + website + email, where tech ϵ {0, 1, 2, 3, 4}. iso = 1 if firm owns internationally-recognized quality certification and 0 otherwise, tech_for = 1 if firm uses technology licensed from foreign firms and 0 otherwise, website = 1 if firm uses own website to communicate with clients or suppliers, email = 1 if firm uses email to communicate with clients or suppliers. The technology indicator serves as a proxy for R&D intensity which is unavailable;
49 The continuous BON variables got dropped from the Brazil regressions which required using a GVC dummy variable.50 Our dataset includes 851 domestic firms and 59 foreign firms in Brazil (see Annex 1).
34

• skills = firm’s share of high-skilled labor in firm’s total labor force;• size = firm’s total number of permanent and temporary employees in natural logarithms;• aggl = region’s total number of manufacturing and services firms as percentage of a country’s total number of
manufacturing and services firms. This measure is a proxy for urbanization economies (locational advantages) and covers both domestic and foreign firms;
• exp = firm’s share of direct or indirect exports in firm sales.
• imp = firm’s share of imported inputs in total inputs.
Results for the full sample. Table A2.1 reports the correlation between firm characteristics and labor productivity for all domestic manufacturing firms in the sample, following equation (1). The baseline regression in column 1 suggests that capital intensity is positively correlated with labor productivity which holds across all specifications. Columns 2 and 3 focus on GVC integration as buyer and seller. GVC integration is captured by a dummy which is 1 if the sectoral measure of structural integration into GVCs equals or exceeds the median value across all countries for that sector, and 0 otherwise. None of the GVC dummies show a statistically significant correlation with labor productivity in the full sample.
Table A2.1: Productivity and Firm Characteristics, All Domestic Manufacturing Firms, OLSDependent variable: lnlpirst
GVC dummy = 1 if sectoral GVC integration >= median across all countries Continuous GVC integration measure
(1) (2) (3) (4) (5) (6) (7) (8) (9) (10) (11) (12) (13)
lncapintirst
BONwincst
BONwoutcst
gapirst
techirst
skillsirst
sizeirst
expirst
impirst
constantt
0.2580*** 0.2580***0.2580*** 0.0379*** 0.2403*** 0.2577*** 0.2526*** 0.2579*** 0.2526***0.0348***(0.000) (0.000) (0.000) (0.000) (0.000) (0.000) (0.000) (0.000) (0.000) (0.000)
-0.0353 -0.0950(0.327) (0.284)
-0.0275 0.1520*(0.526) (0.090)
0.8626*** 0.8578***(0.000) (0.000)
0.2226*** 0.0313***(0.000) (0.006)
-0.0141 0.0092(0.806) (0.588)
0.1267*** 0.0167***(0.000) (0.007)
0.4301*** 0.0299(0.000) (0.540)
0.0031*** 0.0006**(0.000) (0.044)
5.9605*** 5.9939*** 5.9733*** 8.2047*** 5.8319*** 4.5451*** 5.3609*** 5.8357*** 4.5561*** 8.5954***(0.000) (0.000) (0.000) (0.000) (0.000) (0.000) (0.000) (0.000) (0.000) (0.000)
0.2580*** 0.2578*** 0.0324***(0.000) (0.000) (0.000)0.7058 -4.7013(0.568) (0.128)
3.7733 23.1776***(0.303) (0.001)
0.8620***(0.000)0.0342***(0.002)0.0089(0.601)0.0140**(0.025)0.0243(0.562)0.0007**(0.014)
5.8501*** 5.4570*** 6.2394***(0.000) (0.000) (0.000)
Obs.R-squared
7,716 7,716 7,716 7,160 7,716 7,621 7,716 7,670 7,670 7,0010.48 0.48 0.48 0.92 0.50 0.48 0.49 0.49 0.48 0.93
7,716 7,716 7,0010.48 0.48 0.93
Source: Own computations based on Farole and Winkler (2012) and Taglioni and Santoni (2014). Note: p*<0.1, p**<0.05, p***<0.01 (p-values in parentheses). All regressions include sector, subnational region, and year fixed effects. Standard errors are clustered at the country-sector level.
Most other firm characteristics, however, are positively correlated with labor productivity, including a lower technology gap relative to multinational firms in a sector (column 4), a higher technology intensity (column 5), a larger firm size (column 7), a higher export share (column 8),
35
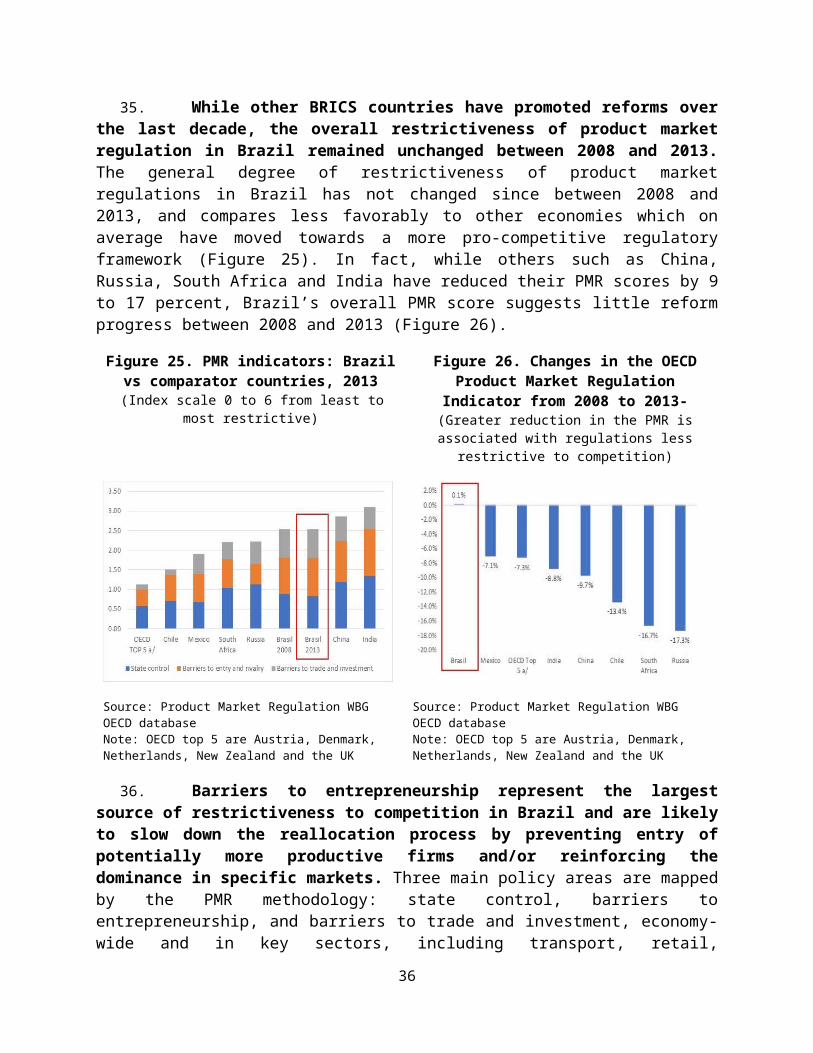
and a higher share of imported inputs (column 9). Technology gap, in particular, explains the largest portion of a firm’s labor productivity, as indicated by the high R-squared of 0.92. Surprisingly, a higher skill intensity is uncorrelated with labor productivity in the full sample (column 6).
Controlling for all firm characteristics simultaneously reveals that most of the firm characteristics continue to be positively correlated with labor productivity, although their coefficient sizes become smaller due to the large explanatory power of technology gap (column 10). Interestingly, firms operating in sectors with a high GVC integration on the selling side now show a positive relationship with labor productivity. This probably explains why a higher export share at the firm level is no longer significantly correlated with labor productivity.
Columns 11 to 13 use the continuous GVC measures instead of the GVC dummy. While the GVC measures show no correlation when considered individually, structural integration into GVCs on the selling side shows a statistically significant effect when all control variables are included (column 13). Reassuringly, the coefficients of the other firm characteristics are similar in terms of size and significance.
Results for Brazil. Table A2.2 shows the correlation between firm characteristics and labor productivity for the Brazilian subsample only. Capital intensity is more strongly correlated with labor productivity compared to the full sample in Table A2.1. Firms operating in sectors with a higher GVC integration as a buyer also show a higher labor productivity (column 2). The model could not be estimated for GVC integration as a seller, since all sectors in the Brazilian sample were assigned a dummy of 1, i.e. exceeded the median GVC integration across the 22 countries in the full sample.
Table A2.2: Productivity and Firm Characteristics, Brazilian Manufacturing Firms, OLSDependent variable: lnlpirst
GVC dummy = 1 if sectoral GVC integration >= median across all countries
(1) (2) (3) (4) (5) (6) (7) (8) (9) (10)
lncapintirst
BONwincst
BONwoutcst
gapirst
techirst
skillsirst
sizeirst
expirst
impirst
constantt
0.5661*** 0.5661*** 0.5661*** 0.0000 0.5518*** 0.5649*** 0.5634*** 0.5654*** 0.5651*** 0.0000(0.000) (0.000) (0.000) (0.189) (0.000) (0.000) (0.000) (0.000) (0.000) (0.194)
0.7005*** 1.6295***(0.000) (0.000)
0.0000 0.0000(.) (.)
1.0000*** 1.0000***(0.000) (0.000)
0.1700** -0.0000(0.039) (0.180)
-0.0513 0.0000(0.773) (0.366)
0.0791 -0.0000(0.249) (0.723)
0.1779 -0.0000(0.342) (0.514)
0.0009 0.0000(0.758) (0.429)
3.2524*** 3.2524*** 3.2524*** 9.6447*** 3.1709*** 3.3272*** 3.0796*** 3.2538*** 3.2456*** 9.6447***(0.000) (0.000) (0.000) (0.000) (0.000) (0.000) (0.000) (0.000) (0.000) (0.000)
Obs.R-squared
844 844 844 704 844 840 844 843 843 6980.48 0.48 0.48 0.92 0.50 0.48 0.49 0.49 0.51 1.00
36

• Source: Own computations based on Farole and Winkler (2012) and Taglioni and Santoni (2014). • Note: p*<0.1, p**<0.05, p***<0.01 (p-values in parentheses). All regressions include sector, subnational region, and year fixed effects.
Standard errors are clustered at the country-sector level.
Among other firm characteristics, technology gap explains a larger portion of labor productivity in Brazil (column 4) compared to the full country sample. A higher technology intensity, by contrast, is less strongly correlated with labor productivity in Brazil (column 5). Surprisingly, other characteristics like firm size, export share, or imported input share are uncorrelated with labor productivity in Brazil which is in contrast to the findings using the full sample. The full specification in column 10 confirms the positive correlation between labor productivity and a lower technology gap as well as for firms operating in sectors that are highly integrated on the buying side. Technology intensity, however, no longer shows a statistically significant correlation.
In order to allow for sectoral variation of the GVC dummy on the selling side in Brazil, Table A2.3 replicates the regressions using an alternative GVC dummy which takes the value of 1 if the measure of structural integration into GVCs equals or exceeds the 75th percentile across all countries for that sector, and 0 otherwise. In other words, the threshold to be assigned a dummy of 1 is higher for sectors in Table A2.3 compared to Table A2.2.
Table A2.3: Productivity and Firm Characteristics, Alternative GVC Dummy, Domestic Manufacturing Firms, OLS
Dependent variable: lnlpirst
GVC dummy = 1 if sectoral GVC integration >= 75 pctl across all countries
Brazilian sample Full sample
(1) (2) (3) (4) (5) (6)
lncapintirst
BONwincst
BONwoutcst
gapirst
techirst
skillsirst
sizeirst
expirst
impirst
constantt
0.5661*** 0.5661*** 0.0000(0.000) (0.000) (0.194)0.0908** 0.8218***(0.016) (0.000)
0.7005*** 1.0793***(0.000) (0.000)
1.0000***(0.000)-0.0000(0.180)0.0000(0.366)-0.0000(0.723)-0.0000(0.514)0.0000(0.429)
3.2524*** 3.2524*** 9.6447***(0.000) (0.000) (0.000)
0.2580*** 0.2580*** 0.0330***(0.000) (0.000) (0.000)0.0131 0.0907(0.768) (0.347)
0.0627 0.3233**(0.213) (0.037)
0.8604***(0.000)0.0344***(0.002)0.0050(0.768)0.0132**(0.042)0.0091(0.819)0.0007**(0.014)
5.9588*** 5.9614*** 8.6132***(0.000) (0.000) (0.000)
Obs.R-squared
844 844 6980.50 0.50 1.00
7,716 7,716 7,0010.48 0.48 0.93
Source: Own computations based on Farole and Winkler (2012) and Taglioni and Santoni (2014). Note: p*<0.1, p**<0.05, p***<0.01 (p-values in parentheses). All regressions include sector, subnational region, and year fixed effects. Standard errors are clustered at the country-sector level.
37

The results show that Brazilian firms with a high GVC integration as a buyer continue to show higher labor productivity, but their coefficient size is lower using the 75th percentile threshold (column 1). In other words, there seem to be decreasing labor productivity gains to increased GVC integration on the buying side in Brazil. Focusing on firms that operate in sectors with a high GVC integration as a seller now also shows a positive correlation with labor productivity (column 2). The coefficient size is much larger than for GVC integration on the buying side.
Taking into account all firm level controls in column 3 confirms the positive relationship for Brazilian firms that are highly integrated on the buying and selling sides. Besides GVC integration, technology gap is the only other firm characteristic in the Brazilian sample that explains differences in labor productivity.
The results for the full country sample show that none of the individual effects of GVC integration is significant (columns 4 and 5). Only when all firm characteristics are being simultaneously controlled for do firms operating in sectors with high GVC integration on the selling side show significantly higher productivity levels (column 6), but the coefficient size is smaller compared to the Brazil sample only. In addition, firms with a lower productivity gap, higher technology intensity, larger firm size, and larger share of imported inputs are more productive. The findings for the full country sample are in line with the results using the GVC integration dummies with the median threshold (Table A2.1, column 10).
In summary, Brazilian firms operating in sectors with high GVC integration as a buyer show higher productivity levels using the median GVC integration level as threshold. Since all sectors in Brazil show a high extent of GVC integration as a seller using the median threshold, the 75th percentile is used as alternative threshold. The results show that operating in sectors with very high GVC integration as a seller explains a large portion of Brazilian firms’ productivity. While very high GVC integration on the buying side continues to be positively related to labor productivity, the coefficient size becomes smaller.
38
Annex 3. Methodology for the Estimation of the Impact of Deep Integration Through FTAs on GVC Trade
The relationship between deep agreements and GVC-related trade is formally estimated using a structural gravity equation. An augmented gravity equation is estimated for 189 countries, using data from 1990 to 2014, to investigate the relationship between the depth of an agreement and GVC-related trade. The depth of an agreement is captured by the number of legally enforceable provisions that it includes. This methodology has been extensively used by economists to test empirically the determinants of trade flows, and to estimate the effect of preferential trade opening on trade flows.
Dataset. The New World Bank dataset on content of PTAs, is an extension of Horn et al. (2010) and WTO (2011) datasets and contains 280 PTAs signed by 180 countries between 1980 and 2015.
The methodology of Horn et al. (2010) is followed in order to define the content and the legal enforceability of PTAs. As a first step, a set of 51 policy areas covered in PTAs is identified. These areas can be classified into two different groups. The first group is represented by WTO+ provisions which fall under the current mandate of the WTO and are already subject to some form of commitment in WTO agreements. The second group of policy areas, which is denoted as WTO-X provisions, includes those obligations that are outside the current mandate of the WTO. Table A3.1 lists the 51 policy areas that are identified.
Table A3.1: Provisions included in PTAsWTO+ provisions WTO-X provisions
FTA Industrial Public Procurement Competition Policy Political Dialogue Approximation of Legislation
FTA Agriculture STE Movement of Capital Social Matters Innovation Policies
Customs TRIMs Investment Financial Assistance Audio Visual
Export Taxes SPS IPR Cultural Cooperation Health
AD CVM Environmental Laws Anti-Corruption Illicit Drugs
TBT TRIPs Information Society Taxation Human Rights
State Aid GATS Regional Cooperation Data Protection Mining
Agriculture Education and Training Money Laundering
Visa and Asylum Industrial Cooperation Terrorism
Labor Market Regulation Public Administration Illegal Immigration
Economic Policy Dialogue Statistics Nuclear Safety
Research and Technology Consumer Protection Energy
SME Civil Protection
Note: Provisions in blue are included in the Mercosur agreement and are in force. Provisions in red are included in Mercosur but are not in force
39

The legal enforceability of the PTA obligations is established according to the language used in the text of the agreements. In other words, it is assumed that commitments expressed with a clear, specific and imperative legal language, can more successfully be invoked by a complainant in a dispute settlement proceeding, and therefore are more likely to be legally enforceable. In contrast, unclearly formulated legal language might be related with policy areas that are covered but that might not be legally enforceable.
Empirical strategy. Gravity equations are derived from models that seek to explain or predict the relationship between a (dependent) variable (in this case bilateral GVC-related trade) and a set of other (independent or explanatory) variables whose values can be estimated (in this case elements of deep integration).
Endogeneity occurs when both the variable being explained (the left-hand side variable in the equation) and the explanatory variable (the right-hand side variable in the equation) may be determined by a third factor not in the model. For example, firms that want to invest in a country may also lobby for free trade agreements. Consequently, a free trade agreement may not increase FDI, but both FDI and FTAs may both come about due to perceived economic benefits of firms and their political lobbying efforts.
In order to control for endogeneity and for the existence of zero trade flows the following structural gravity regression is estimated for a set of 189 countries between include 1990 and 2014 using Poisson pseudo maximum‐likelihood (PPML)51:
GVC ijt=exp {β1 Depthijt+δ ij+δ¿+δ jt }+εijt (1)
Where GVCijt is a measure of GVC-related trade between country i and j at time t and it is captured with gross trade flows in parts and components from the UN Broad Economic Categories classification (BEC)52 Depthijt is a measure of the depth PTAs. A statistically significant and positive coefficient β1 implies that signing a deeper agreement is associated with greater GVC-related trade. This variable is calculated as the number of enforceable provisions that are included in a certain agreement. The δs are a series of fixed effects: i for importer, j for exporter and t is year. Finally, εijt is the error term.
The following calculations are based on the results from the gravity estimation presented above. The following scenarios in terms of depth of a PTA are considered in order to assess the potential impact of a deeper Mercosur and of a potential agreement between the Pacific Alliance and Mercosur on GVC-related trade:
Mercosur 17 scenario: all the 17 provisions that have currently covered in Mercosur enter into force. This scenario shows Brazil’s currently “money left on the table” by not including disciplines such as customs, export taxes, public procurement, TRIPs, stated aid, countervailing measures, TRIMs and state enterprises, as well as competition policy, movement of capital and IPR provisions in force. Deepest within Pacific Alliance scenario: Mercosur is renegotiated as deep as “Colombia – Mexico” which is the deepest bilateral agreement within the pacific alliance countries with a total of 19 legally enforceable
51 See Piermatini and Yotov (2016).52 Parts and components include non-fuel BEC intermediates (111,121,21,22,42 and 53).
40
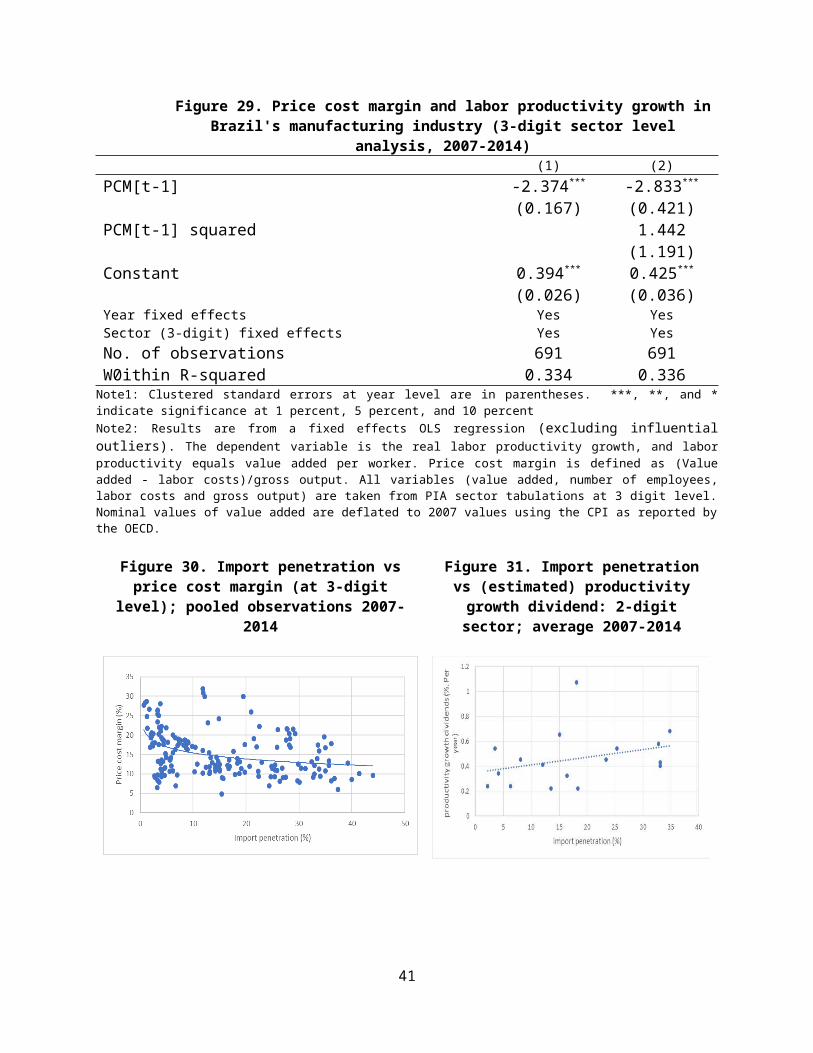
provisions. In this scenario disciplines such as investment and visa and asylum are included in addition to the “Mercosur 17” scenario.
Deepest outside Pacific Alliance scenario: Mercosur is renegotiated as deep as “Peru – Korea” which is the deepest bilateral agreement of a pacific alliance member, including a total of 30 disciplines. Additional disciplines that are not present in the previous scenarios include labor market regulation, consumer protection, cultural cooperation, research and technology and agriculture.
Improvements in the level of depth of Mercosur will further increase Brazil’s GVC-related trade with Mercosur partners. Rough calculations based on the gravity estimations suggest that if Mercosur had all 17 legally enforceable provisions currently in force, Brazil exports in parts and components to other Mercosur members would increase 22 percent on average53 (2,287 $USD million), while imports in intermediates form other Mercosur members would increase around 37 percent more (2,660 $USD million). In particular, exports to Argentina would increase on average 1,800 $USD million, while imports would increase around 1,916 $USD million. In the same way, exports to Paraguay would increase about 343 $USD million, as imports would increase on average 304 $USD million (see column a of Table A3.2). These results represent a lower bound and imply the entering into force of disciplines that are already covered. Re-negotiation of a deeper Mercosur could increase GVC related trade up to 30 $USD billion, where exports to Mercosur members would growth on average 55 percent (5,654 $USD million) whereas imports from other Mercosur members would almost duplicate to 14,332 $USD million (see columns b and c of Table A3.2).
Table A3.2: Change in Brazil's GVC-related trade within Mercosur under different scenarios (a) (b) (c)
"Mercosur 17" "Deepest within PA" "Deepest outside PA" scenario scenario scenarioDepth 17 19 30
(USD'MM) orts
GVC-related Exports 22.2% 26.7% 54.9%Argentina $1,802 $2,171 $4,456 Paraguay $343 $413 $848 Uruguay $142 $171 $350
Total Exports $2,287 $2,755 $5,654
GVC-related Imports 36.7% 44.7% 97.9%
Argentina $1,916 $2,333 $5,106 Paraguay $304 $370 $811 Uruguay $440 $536 $1,172
Total Imports $2,660 $3,239 $7,089
Notes: Depth increases from 6 to 17 in the “Mercosur 17” scenario, to 20 in the “Deepest within PA” scenario and to 30 in the “Deepest outside PA” scenario.
53 The following formula is used to calculate the percentage change in GVC related trade
exp((0.364+0.438 )¿¿ 17
44)
exp((0.364+0.438 )¿¿ 644
)−1=0.222¿¿
41

42
Annex 4. Methodology for the Estimation of the association between intensity of competition and productivity growth in the Brazilian manufacturing industry.
Following the standard in the literature, we measure market power using the price-cost margin (PCM), which is a Lerner Index. The PCM measure margins (i.e., the difference between price and marginal cost) as proportion of price. In the absence of information on price and marginal cost, the extent of pricing power in an industry is proxied by the difference between value added and labor costs as a proportion of output (all measured in current prices), as follows:
PCM jt≃(value added ) jt−( labor costs ) jt
gross output jt, (1)
where j denotes the sector and t denotes the respective year (varying from 2007 to 2014). Gross output, valued added and labor costs are all extracted from PIA sectoral tabulations at CNAE 3 digit level for manufacturing industry (sectoral tabulations are available at SIDRA IBGE system at https://sidra.ibge.gov.br/pesquisa/pia-empresa/tabelas). All nominal values were deflated to 2007 values using Brazil’s CPI as reported by the OECD. Due to lack of data, financial costs of capital are not included in the average costs. However, Aghion et al (2005) show that excluding costs of capital from the Lerner measure does not affect the results given that these costs are relatively small and constant over time. Changes in PCM within a sector drive changes in productivity, while the different levels of PCMs across sectors are not indicative of differences in productivity levels. Typically, the capital stock or cost and the capital rent as a fraction of value added does not change dramatically from year to year within one sector.
We use real labor productivity growth as our measure of productivity growth. We calculate real labor productivity by sector j as real valued added in sector j (CNAE 3 digit) per worker. We use the average number of employees in sector j in the year t– also extracted from PIA tabulation - as the measure of employment.
Using contemporaneous values of the measures to evaluate the relation between market power and productivity growth could be problematic. Higher margins could be the result, rather than cause, of innovation and changes in productivity growth. Similarly, the cost-advantage gained from innovation could translate into higher margins. We, therefore, address this problem by relating PCMs from the preceding year (denoted as “[t-1]”) with changes in contemporaneous productivity growth as done in other studies (e.g., Aghion et al, 2008). Exceptional growth in labor productivity can occur independently from competition firm’s innovation efforts. The analysis therefore accounts for productivity shocks that occur economy-wide at specific points in time and for differences across industries in the growth rates of productivity that are unrelated to competition levels and do not change over time by including industry and year fixed effects. Recent studies (e.g., Aghion et al 2005, 2008) have shown that the relationship between market power and productivity growth could be non-linear and so we allow for that by including the squared term of PCM in the regression analysis.
Based on Aghion et al (2008), we estimated the following fixed effect regression:
43
ln (LP¿¿ j , t / LP j ,t−1)=α +β PCM jt−1+γ [ PCM jt−1 ]2+∑j
θ j sector j + ∑t
δt timet+∈ jt (2)¿
where ∆ LP j ,t ,t −1/ LP j ,t−1 is defined as the growth rate of real labor productivity in sector j, from year t-1 to t. The term PCM jt−1 denotes the one year lagged mark-up in (sub) sector j, as computed in equation (1). The sector level observations are not assumed to be independent within each year, so that we compute significance levels using errors that are clustered at the year level. If competition spurs productivity growth, we would expect a negative coefficient for PCM. Table A4.1 shows the average values of real labor productivity growth and price cost margin in Brazilian manufacturing industry.
Table A4.1 Average (real) labor productivity growth and price cost margin in Brazilian
Table 1855 (A): Real labor productivity growth and price-cost margin (PCM) in Brazil's manufacturing industries
Productivity growth
Price-cost margin
2008 0.0688 0.14692009 -0.0618 0.14322010 0.0926 0.15092011 -0.0217 0.14322012 0.0056 0.13892013 0.0316 0.14262014 -0.0481 0.1291Total 0.0096 0.1421
Note: Real labor productivity = real value added per worker. Valued added is taken from Table 1855. The average number of employees in the year is taken from Table 1841. Nominal values of value added are deflated to 2007 values using the CPI as reported by the OECD. PCM = (Value added - labor costs)/gross output. Labor costs equals personnel expenses relating to salaries, withdrawals and other remunerations and is taken from Table 1844. Gross output is the gross production value and is taken from Table 1855. Results exclude influential outliers.
Table A4.5. Estimated productivity growth (in percentage) by sector accrued from average 10% sectoral markup reduction
TO BE INCLUDED
44

Annex 5. Measuring productivity at local level in Brazil
The estimation of productivity at local level in Brazil draws on the methodology of Rice, Venables and Patacchini (2006) which looks at productivity differentials using an analysis based on local wages. The rationale to use wages relies on the idea they reflect relative productivities, such that the differences in wages for the same occupation k between area i and area j will be equal to the difference in productivity between the two areas54. Productivity is here seen as a location specific effect that allows certain places to better perform.
The differences in average earnings can be decomposed in composition effect and productivity effect. The productivity effect indicates what would be the average earning in i if the composition of the local occupations followed the national average. The composition effect indicates what would be the average earning in i with the local structure of occupations if the wage levels followed the national average.
More formally, the average earning e i is decomposed as:
e i≡∑k
w ik λk+∑
kw❑
k λ ik+∑
k(wi
k−w❑k )(λ i
k−λk)-∑k
(w❑k λk)
(1)
where λ ik is the average share of occupation k in the total of employment in i, λk is the average
share of occupation k in the total of employment in the country, w ik is the wage level for
occupation k in I and w❑k is the average wage level for occupation k in the country. The first term
of the right-hand side is the weighted average of the local wages with the occupation share as in the rest of the economy. This will be the productivity index used in the analysis.
The dataset used for this analysis is the RAIS (Relação Anual de Informaçãoes Sociais). It is made of annual record of formal sector employees earning, education and occupation. The IBGE estimates its coverage of the formal sector to about 97 %. The Brazilian Occupational Classification (Classificação Brasileira de Ocupaçãoes, CBO-2002) is used to classify workers’ activity. The classification system groups occupations into classes by analogue of their content and the conditions required for performance55 . It provides several levels of details: occupations are grouped in 10 broad groups -e.g., Administrative workers-, 47 main groups -e.g. clerks-, 192 subgroups, - e.g. accounting and finance clerks and 596 families of occupations - e.g. Bank office clerks. The data used here were retrieved aggregated at the municipal and family level from DataViva56 for each year between 2002 and 2014.
54 More precisely, in a competitive equilibrium where prices of the goods in different locations equalize and the price takers firms exhibit constant return to scales technologies, then the relative price of factors is equal to the relative productivities.55 Muendler et al. (2004)56 DataViva is an initiative of the Government of the State of Minas Gerais and Minas Gerais Investment and Trade Promotion Agency (INDI) with the support of Fundação de Amparo à Pesquisa do Estado de Minas Gerais (FAPEMIG) that offers access to a large range of public data on Brazilian economy, workers and education. It was developed in partnership with MIT Media Lab researchers and uses dataset from Ministério do Trabalho e Previdência Social (MTPS) to provide aggregated RAIS data. It can be accessed at http://dataviva.info.
45

Annex 6. Assessing the link between urban concentration and productivity in Brazil
To understand the link between urban concentration and productivity in Brazil, the analysis uses two cross section regressions for 2002 and 2010 of the average earning and productivity on urban population size and density and control variable to account for the location effects and the educational level of the population. The data used come from many sources, listed and described below.
The average wage per municipality and productivity index are obtained as described in Annex 5 on RAIS data.
The urban and total population data are coming from IBGE censuses. The 2000 census data is used to understand 2002 earnings and productivity, while 2010 values are used for 2010 earnings and productivity.
Two types of education data are used, both coming from the 2000 and 2010 censuses by IBGE. As higher education is likely to be crucial when explaining productivity, we construct a variable reflecting the number of inhabitants in a given municipality that hold at least a high school degree. The definition of the variable changes between the two censuses: in 2000, the variable reflectsthe population aged 10 or more with 11 years of more of education, while the 2010 census explicitly gives the number of inhabitants aged 25 or more that have a high school degree and those who have a more advanced degree. We aggregated the last two categories for the variable on “medio” level of education.
The other variable included in the analysis is the adult illiteracy rate. The 2000 census indicates the literacy rate in the population aged 15 or more. This variable was subsequently transformed in illiteracy rate and number of illiterate by municipality. The 2010 census provides direct information on the percentage of the population aged 15 or more that is illiterate.
The accessibility variable is based on the methodology developed for the global accessibility map in Uchida and Nelson (2009)57. The underlying data are the transport network described in VMap0 from National Imagery and Mapping Agency (NIMA) in 1997, the navigable rivers map information by CIA World DataBank II the urban areas classification from IBGE and the landcover and slope information form the GLC2000 was by the European Joint Research Center58. It measures each area centroid theoretical accessibility in minutes from the neighboring 1km cell. It is not intended to give an accurate depiction of the travel time but gives an idea of the transport infrastructure and natural constraint for travelling.
Geographical data on municipalities characteristics (IPEA). The analysis uses the rainfall (summer, winter) in millimeter per month, as well as the temperatures (summer, winter) as the average degree Celsius per month.
The regression is based on the following assumption about the:
log (q¿¿i)=μr+ log(x¿¿ i ')β+ϵi ¿¿
57 Uchida, H. and Nelson, A. Agglomeration Index: Towards a New Measure of Urban Concentration. Background paper for the World Bank’s World Development Report 2009.58 Further details on the sources can be found at http://forobs.jrc.ec.europa.eu/products/gam/sources.php.
46

Where log (q¿¿i)¿ represents the logarithm of the productivity index, μr is a regional indicator, log( x¿¿ i ')¿ is the log of the variables described above and ϵ i Is a contemporary unobserved idiosyncratic and independently distributed shock. This model is first estimated via ordinary least squares (OLS). However, ordinary least square assume that unobserved elements affecting earnings and productivity are independent of the population size. It is likely that spatial variations in earnings and productivity arise because some locations have intrinsically better characteristics such that they attract a bigger population and are also more productive. If the population size and average earnings and productivity index are endogenous, i.e., if shock affecting them also affect the shocks to productivity. In this case, the ordinary least squares estimation will be inconsistent. The second estimated model, based on an instrumental variable strategy, answer those concerns. It uses the historical population level coming from the 1950 and 1960 census as a control for the current population level. Using this instrument means that Brazil’s municipalities have to be standardized over time to be able to produce meaningful comparisons. To do this, we create some minimally comparable areas by aggregating the municipalities based on the 1950 census boundaries using the cluster methodology of Ehrl (2017)59. Table A6.1 shows the results of the regression of the productivity index on the population size and the other variables described above.
Table A6.1: Drivers of local productivity in 2002 and 2010
Dependent variable: Productivity index
2010 2002
(1) (2) (1) (2)
Urban population 0.376*** 0.426*** 0.387*** 0.446***
(0.015) (0.024) (0.016) (0.024)
Illiteracy rate 0.221*** 0.276*** -0.010 0.090*
(0.051) (0.055) (0.046) (0.053)
Ratio of inhabitant with high school degree or more
0.239*** 0.171*** 0.071** 0.032
(0.055) (0.059) (0.031) (0.031)
Average rainfall during summer (mm/month)-0.189*** -0.149*** -0.230*** -0.184***
(0.044) (0.047) (0.046) (0.047)
Average rainfall during winter (mm/month) -0.044*** -0.053*** -0.003 -0.015
(0.017) (0.016) (0.018) (0.018)
Average temperature during summer (degree C)
0.859 1.182** 0.732 1.152**
(0.569) (0.579) (0.566) (0.577)
Average rainfall during summer (degree C) -0.726** -0.958*** -0.751** -1.088***
(0.346) (0.354) (0.351) (0.360)
59 Ehrl, Philipp. "Minimum comparable areas for the period 1872-2010: an aggregation of Brazilian municipalities." Estudos Econômicos (São Paulo) 47.1 (2017): 215-229.
47

Maximum accessibility 0.283*** 0.238*** 0.272*** 0.226***
(0.028) (0.031) (0.029) (0.031)
Regional dummies Y Y Y Y
Constant 3.263*** 2.081* 3.387*** 1.987*
(1.095) (1.181) (1.090) (1.160)
Number of observations 1784 1784 1785 1784
Notes: The dependent variable is the logarithm of the productivity index. The analysis uses the logarithm of all the variables. * p < 0.05, ** p < 0.01, *** p < 0.001.
48
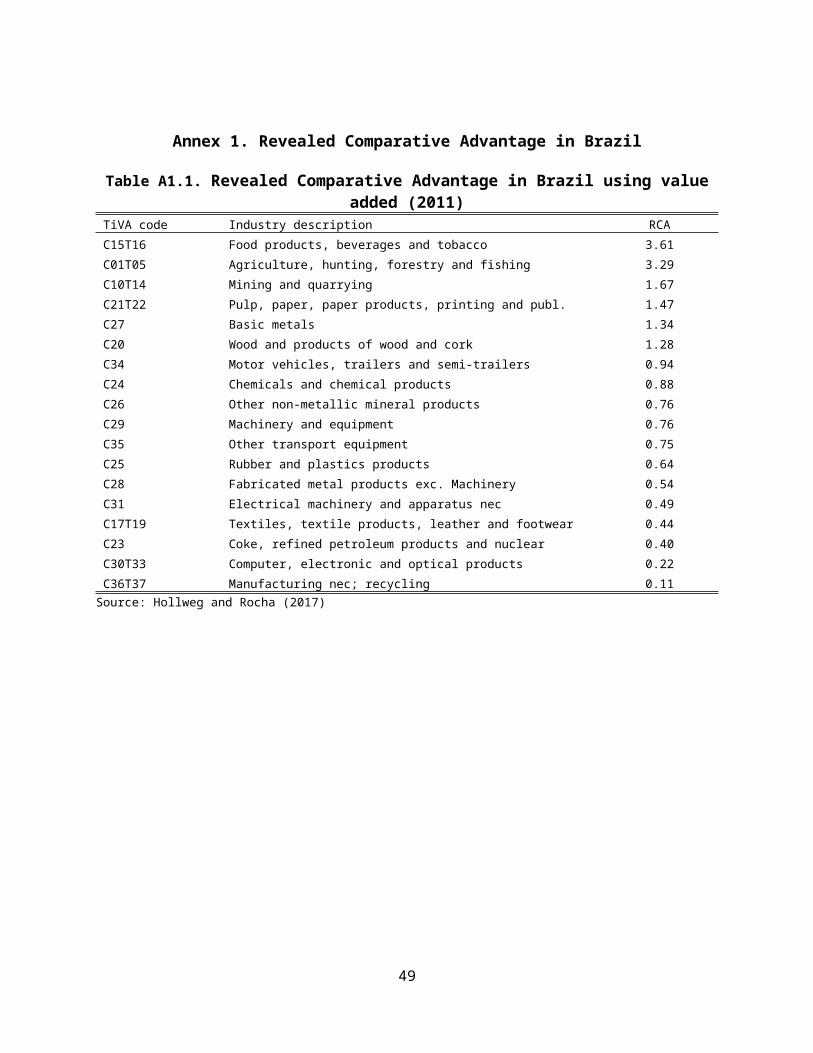
Annex 7. Is regional development credit effective in increasing local productivity?
To answer those two questions, the areas that received credits between 2008 and 2014 and those that do not are compared. To understand the impact of the allocation of BNDES credits and Constitutional Funds on local areas labor productivity, the first analysis compares the performance of areas with similar characteristics before the program. As areas benefiting from credits might further differ in trends and characteristics, the sample of MCA within each class is further skimmed using a propensity score method developed by Rosenbaum and Robin (1983). Finally, the effect of the BNDES Credits and Constitutional Funds on local labor productivity are estimated using a difference-in-difference approach that controls for unobservable and observable invariant characteristics.
Three steps method for recovering the effects of receiving BNDES Credits and Constitutional Funds. The first step recovers the propensity for each area to have its productive units being allocated BNDEs Credits (first type of credits), Constitutional Funds (CF, second type of credits), or both (third type of credits). This is done using a multinomial logit:
Pr ( Funding i=c )= eα+ βc Xi
∑k=1
K
eα+ β k X i❑
where the X i variables used are the deflated GDP and population growth between 2002 and 2006, per capita GDP in 2006, and variables capturing local natural advantages such as distance to state capital, temperature in the winter and pluviometry. This analysis allows for an understanding of the type of areas that receive funds and to match areas that exhibit the same dynamic before the analyzed period (the parallel trend assumption).
The second step focuses on eliminating the differences between the areas that receive funds and those that do not. This is done by removing from the sample the areas that are not likely at all to receive any of the three type of funds, based on the propensity score. This ensures that in each categories, the sample is composed by areas that are likely to receive BNDES credits, Constitutional Funds or both. Further, this approach generates weights to correct for the difference in the covariates in the different type of credits groups (inverse probability weights). This is close to the approach developed in Ichino et al. (2007).
The third step estimates the effect of receiving each type of funds on the MCA receiving funds using the difference-in-difference method estimated using a dynamic panel data estimator to account for the persistence in productivity (Arellano-Bond (1991)).
log (q¿¿¿)=μt+αc+β I t , c❑ + log (q¿¿¿−1,)+ϵ ¿ ,c¿¿
Where log (q¿¿¿)¿denotes the logarithm of the productivity index , t denotes the time, i the area and c the type of funds or credits received. μt represents a time effect, α c represents the credit type group fixed effect and I t , c
❑ is an indicator variable that indicates the type of credits received. This approach compares MCAs before and after receiving funds and credits or not. It allows for filtering the effect of unobservable and time invariant factors that might influence local labor productivity. It relies on the assumption that the group of MCA that received credits exhibits the same trend -not level- in labor productivity that the group that did not. Further, the approach
49

developed here relies on the assumption that, after controlling for the observable using step one, receiving credits is exogenous to an idiosyncratic shock that would occur, ϵ ¿ ,c.
50

![documents.worldbank.orgdocuments.worldbank.org/curated/en/915151520353831656/pdf/SF… · Reference No.: Guohuangping Zhengjiazidi [2606] Midterm Restructuring Construction Components](https://img.pdfslide.us/doc/110x75/5f072e947e708231d41bb6ce/reference-no-guohuangping-zhengjiazidi-2606-midterm-restructuring-construction.jpg)

![documents.worldbank.orgdocuments.worldbank.org/curated/en/877201468287135419/... · 2016-07-12PK ! 3 @ 0 O [Content_Types].xml ( ė](https://img.pdfslide.us/doc/110x75/5adadd807f8b9add658d3792/-3-0-o-contenttypesxml-e.jpg)