Embed Size (px)
Citation preview

Supplemental Materials
Table S1 A summary of all acoustically tagged perch included in the analysis of objective one (to test for the potential relationship between perch activity, space use and habitat choice and vulnerability to angling) and three (to disentangle the relative importance of perch and angler behaviour for determining individual vulnerability from the fish perspective), including tagging information, size, capture data and data yield.
ID Transmitter Model
BurstRate (s)
Lake Origin Total Length (mm)
WetMass (g)
DayReleased
TimesCaptured
Daily DetectionsMean ± sd Minimum Maximum Mean % Maximum %
45800 MM-M-TP-11-28 27.5 Kleiner Döllnsee 366 724 Oct.28 2014 2 2043 ± 378 1190 2589 65.02 82.4045900 MM-M-TP-11-28 27.5 Kleiner Döllnsee 361 752 Oct. 28 2014 0 1846 ± 361 1064 2486 58.75 79.1346000 MM-M-TP-11-28 27.5 Kleiner Döllnsee 400 962 Oct. 28 2014 0 1389 ± 485 641 2472 44.20 78.6846100 MM-M-TP-11-28 27.5 Kleiner Döllnsee 391 763 May 19 2015 0 1505 ± 367 793 2293 47.90 72.9846200 MM-M-TP-11-28 27.5 Kleiner Döllnsee 423 1096 May 19 2015 0 1766 ± 447 845 2732 56.22 86.9646300 MM-M-TP-11-28 27.5 Kleiner Döllnsee 377 738 May 19 2015 1 1649 ± 390 616 2370 52.50 75.4346400 MM-M-TP-11-28 27.5 Kleiner Döllnsee 351 578 May 19 2015 1 1302 ± 416 300 2410 41.43 76.7146700 MM-M-TP-11-28 27.5 Kleiner Döllnsee 394 850 Oct .28 2015 2 1321 ± 458 469 2292 42.04 72.9546900 MM-M-TP-11-28 27.5 Kleiner Döllnsee 354 554 May 19 2015 0 1699 ± 420 767 2480 54.09 78.9447100 MM-M-TP-11-28 27.5 Kleiner Döllnsee 370 750 May 19 2015 0 997 ± 377 277 1689 31.74 53.7647300 MM-M-TP-11-28 27.5 Kleiner Döllnsee 392 819 May 19 2015 1 1690 ± 444 652 2683 53.78 85.4047400 MM-M-TP-11-28 27.5 Kleiner Döllnsee 366 741 Oct. 28 2014 0 690 ± 421 133 1680 21.97 53.4747600 MM-M-TP-11-28 27.5 Kleiner Döllnsee 396 934 Oct. 28 2014 1 1757 ± 385 958 2373 55.91 75.5347700 MM-M-TP-11-28 27.5 Kleiner Döllnsee 363 609 May 19 2015 0 1707 ± 416 596 2328 54.34 74.1047800 MM-M-TP-11-28 27.5 Kleiner Döllnsee 377 863 May 19 2015 1 1603 ± 427 543 2332 51.01 74.2247900 MM-M-TP-11-28 27.5 Größer Vätersee 376 676 Oct. 29 2014 0 1231 ± 433 498 2300 39.18 73.2148000 MM-M-TP-11-28 27.5 Kleiner Döllnsee 345 511 May 19 2015 0 1617 ± 491 331 2428 51.45 77.2848200 MM-M-TP-11-28 27.5 Kleiner Döllnsee 376 728 May-19 2015 0 1531 ± 333 839 2279 48.74 72.5448300 MM-M-TP-11-28 27.5 Kleiner Döllnsee 427 1035 May 19 2015 1 2018 ± 322 1264 2571 64.22 81.8348500 MM-M-TP-11-28 27.5 Kleiner Döllnsee 348 632 Oct. 28 2014 2 1873 ± 452 707 2564 59.63 81.6148600 MM-M-TP-11-28 27.5 Größer Vätersee 352 512 May 18 2015 0 1668 ± 344 1074 2421 53.10 77.0648700 MM-M-TP-11-28 27.5 Größer Vätersee 364 683 Oct. 30 2014 1 1792 ± 508 651 2654 57.03 84.4748900 MM-M-TP-11-28 27.5 Kleiner Döllnsee 360 653 May 19 2015 0 1383 ± 309 643 1934 44.01 61.5649100 MM-M-TP-11-28 27.5 Größer Vätersee 363 611 Oct. 29 2014 0 1792 ± 367 1087 2462 57.03 78.3649300 MM-M-TP-11-28 27.5 Kleiner Döllnsee 335 605 Oct. 28 2014 0 1575 ± 483 293 2322 50.12 73.9149400 MM-M-TP-11-28 27.5 Kleiner Döllnsee 368 702 Oct. 28 2014 1 1823 ± 380 779 2426 58.04 77.2249500 MM-M-TP-11-28 27.5 Kleiner Döllnsee 356 646 Nov. 25 2014 1 474 ± 287 34 1058 15.09 33.6749600 MM-M-TP-11-28 27.5 Kleiner Döllnsee 374 716 May 19 2015 3 1071 ± 342 280 1755 34.07 55.8649700 MM-M-TP-11-28 27.5 Kleiner Döllnsee 389 782 Oct. 28 2014 0 641 ± 429 12 1592 20.41 50.6749800 MM-M-TP-11-28 27.5 Kleiner Döllnsee 360 641 May 19 2015 1 1617 ± 404 791 2361 51.46 75.1550200 MM-M-TP-11-28 27.5 Kleiner Döllnsee 364 827 Oct .28 2014 0 597 ± 382 89 1412 19.00 44.9450500 MM-M-TP-11-28 27.5 Kleiner Döllnsee 397 942 Oct .28 2014 0 1051 ± 522 287 2341 33.46 74.5150600 MM-M-TP-11-28 27.5 Kleiner Döllnsee 350 570 May 19 2015 2 1219 ± 368 471 2074 38.80 66.01

Table S2 Parameter estimates from three additional models from objective 3 reported in Table 5, their standard errors, odds ratios with 95% confidence interval (CI) and deviances.
Model No. Covariate Estimate SE Odds Ratio 95% CI of Odds
RatioDeviance
7 Intercept 0.82 0.76 2.27 0.63 15.82Latitude 3.68 1.45 39.44 4.37 2049.89 8.02Longitude -3.03 1.24 0.05 0.002 0.32 10.26Total Length -0.30 0.68 0.74 0.17 2.60 0.49Encounters (Middle Skill in Northern shoreline)
2.14 1.14 8.53 1.40 196.27 3.04
Encounters (Middle Skill in Southern shoreline)
-1.13 0.63 0.32 0.07 0.90 4.82
5 Intercept 0.72 0.85 2.05 0.51 16.49Latitude 2.74 1.19 15.45 2.12 296.76 8.02Longitude -2.88 1.13 0.056 0.003 0.33 10.26Total Length 0.03 0.63 1.03 0.27 3.50 0.49Encounters (Northern shoreline) 2.09 1.33 8.09 1.26 233.94 5.35Encounters (Southern shoreline) -0.97 0.82 0.38 0.05 1.61 1.66
13 Intercept 0.12 0.56 1.13 0.38 3.68Latitude 3.15 1.15 23.42 3.78 424.12 8.02Longitude -2.62 1.02 0.08 0.006 0.36 10.26Total Length -0.45 0.59 0.64 0.17 1.86 0.49Encounters 1.17 0.71 3.23 0.96 17.57 3.56

Figure S1 Panel A shows the bathymetric map of Kleiner Döllnsee and panel B shows the coverage of aquatic macrophytes in Kleiner Döllnsee above 10 cm in height. The bathymetric map in panel A was used to create the three encounter zones considered in our models comparing encounter rates and intrinsic vulnerability of perch to angling shown in panel C. The pelagic offshore zone (>5 m depth is in dark grey, the southern onshore zone is below the pelagic zone in light grey, and the northern onshore zone is shown above the pelagic zone with a mid-shade of grey.

Figure S2 Correlation Matrix of behaviours used in the analysis in objecive one on the behavioural selection of angling. The upper panel shows the pearson correlation coefficients, while the lower panels show the scatter plots for each behavioural comparison. The points in black represent uncaptured fish while the points in red represent captured fish. This plot shows the unstandardzed variables while the models were run with z-transformed variables.
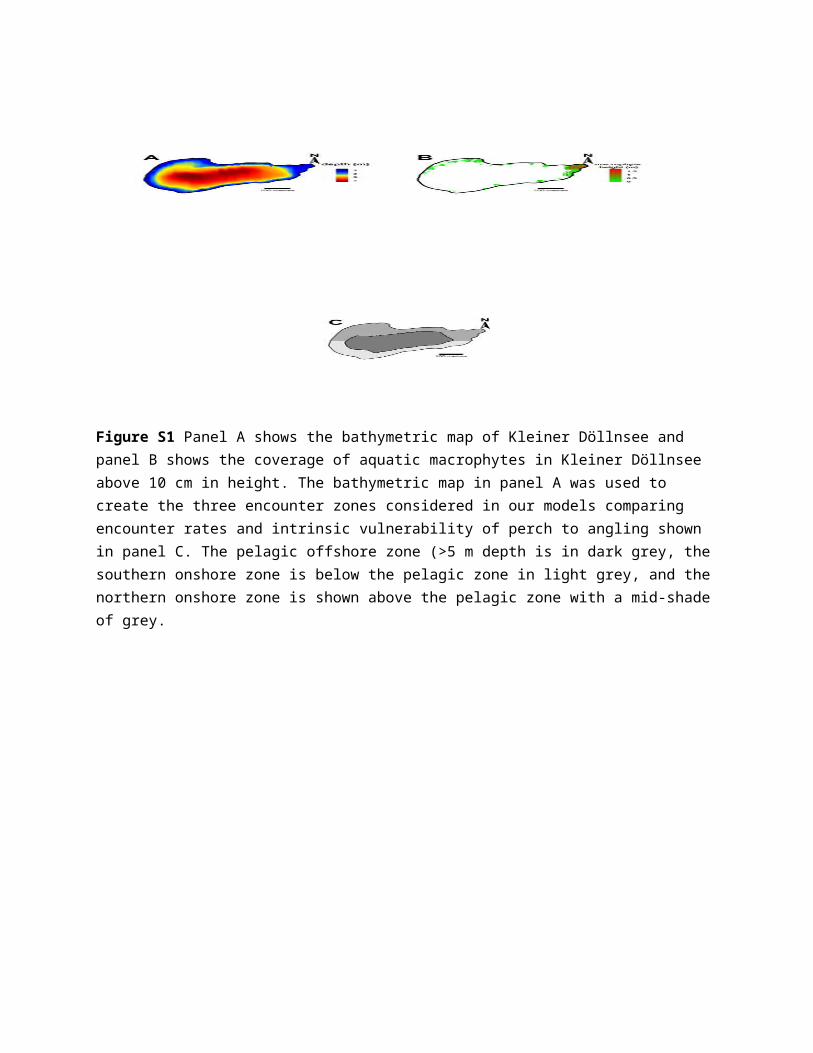
Figure S3 A summary of daily perch behaviours (distance swam, activity space size and distance to the shore) during the study period as a function of whether the fish were captured or not during the angling trials. The bars inside the box represent the median, the box represents the range between the 25 th and 75th percentile and whiskers extend to 1.5 times the interquartile range. Outliers are indicated by points.

Figure S4 The activity space of individual perch used in the models of objective one to three over the entire study duration (September 7 to October 19). The shading represents the estimated kernel density distributions from 95% utilization in blue to 5% utilization in red. Perch in the top three rows with red ID labels were captured at least once, while perch in the bottom three rows were never captured.

Figure S5 Boxplots summarising the mean latitude (left panel) and longitude (right panel) calculated hourly for each individual acoustically tagged perch (n = 33) for each hour of a day during the 1.5 months of the angling trials. Red boxes are values for captured individuals and blue boxes are values for individuals that were never captured. The bars inside the box represent the median, the box represents the range between the 25 th and 75th percentile and whiskers extend to 1.5 times the interquartile range. Outliers are indicated by points.

Figure S6 Kernel Utilization distributions for all anglers. Utilization is colored from 95% in blue to 5% in red. The color of the lake outline indicates the skill group of the angler (low = blue, middle = green and high = red)

Figure S7 A summary of the encounter rates of acoustically tagged perch by the three skill groups. The left panel shows the encounter minutes spent within 15 m of fish scaled by fishing effort, and the right panel shows the number of new unique fish encountered scaled by fishing effort. The bars inside the box represent the median, the box represents the range between the 25th and 75th percentile and whiskers extend to 1.5 times the interquartile range. Outliers are indicated by points.