Embed Size (px)
Citation preview
Page 1 of 10
West African Resources Ltd (WAF)
Gold
: D
evelo
per
/ E
xp
lore
r
WAF.asxSpeculative Buy
Share Price
Valuation $0.72
Price Target (12 month) $0.80
Brief Business Description:
Hartleys Brief Investment Conclusion
Chairman & MD
Top Shareholders
1832 Asset Management 6.3%
Van ECK Associates Corporation 5.4%
Board & Management 3.4%
Company Address
Issued Capital
- fully diluted
Market Cap
- fully diluted
Cash (est)
Debt
EV
EV / Resource Oz
EV / Reserve Oz
Prelim. (A$m) FY19e FY20e FY21e
Prod (koz Au) 0.0 56.5 225.9
Op Cash Flw -9.13 72.55 243.77
Norm NPAT -11.6 57.3 232.1
CF/Share (cps) -1.2 8.8 29.4
EPS (cps) -1.9 7.6 28.0
P/E -18.9 4.6 1.2
A u
Reserves (Moz) 1.6
Resources (Moz) 2.9
Mike Millikan
Resources Analyst
Ph: +61 8 9268 2805
690.8m
25 Jun 2018
$0.350
Richard Hyde (Managing Director)
14 Southbourne St
Scarborough WA, 6007
Sanbrado is a high-quality project, w ell advanced w ith
updated FS now released. Mining and environmental
approvals obtained, w ith further updates expected soon.
Strong exploration upside.
Mark Connelly (Non-Exec Chairman)
Gold explorer and developer focused on the Sanbrado
Project in Burkina Faso
707.1m
A$241.8m
A$247.5m
A$196.8m
Hartleys has assisted in the completion of part of a
capital raising in the past 12 months for West African
Resources Ltd ("WAF") for w hich it has earned fees.
Hartleys has provided corporate advice w ithin the past
12 months to WAF for w hich it has earned fees. Hartleys
has a beneficial interest in 5 million unlisted options in
West African Resources Limited. The analyst has a
beneficial interest in WAF shares.
A$125/oz
A$0.0m
A$45.0m
A$68/oz
WEST AFRICAN RESOURCES LTD (WAF)
Sanbrado – DFS enhances high quality development West African Resources (WAF) has released the Definitive Feasibility Study
(DFS) for the Sanbrado Gold Project in Burkina Faso, demonstrating a high-
quality project development, which has targeted first production in 2020.
The study highlights average annual production (100% basis) of 211kozpa
(+250kozpa in the first 2 years) for the first 5 years at an attractive AISC of
US$551/oz (~A$735/oz), with an impressive head grade averaging over 4g/t
Au. The strong early cashflow generation is expected to provide quick capital
payback, and at current gold prices we see payback in under 1½ years. The
study is underpinned by strong reserves which are now 1.6Moz (up 76%).
The pre-production capex of US$185M is higher than the Feb’17 FS, as
anticipated, as the underground pre-production mining and development
costs have now been included and also includes contingencies of ~US$14M.
The project development has attractive financials with Company estimates of
pre-tax NPV5% of US$567m (~A$754m) and IRR 62% and post-tax NPV5%
of US$405m (~A$540m) and IRR 49%, using a US$1,300/oz gold price, with
the high IRR testament to the low cost, high margin operation.
Project scale remains unchanged at 2Mtpa with ore feed from the M5 (OP),
M1 South (OP and UG), and other pits (M1 North and M3). The LOM
production averages 133kozpa (up from 93kozpa) over an 11 year mine life
(up from 9 years), which currently assumes underground mining at M1 South
completes in year 5, which appears unlikely as high-grade extensions at
depth are not as yet included in resources/reserves or the mine plan.
In addition to extending the underground mine life of M1 South, WAF expects
to complete a Scoping Study on the potential underground development of
M5 (due Q3). In the meantime, drilling is ongoing and importantly all of the
gold systems (in particular the key M1 South deposit) remains open.
Updated mining licence expected Q3, financing in Q4 CY18 WAF already has the environmental approvals for the project development
with the updated mining licence expected to be received in Q3 CY18. Project
financing is expected to be completed before CY18 end, with discussions with
a syndicate of banks well advanced. Project financing remains a risk but is
somewhat mitigated by the quality of the study. WAF currently has a healthy
cash position of A$45M, which provides some funds for early stage works
(pre-production underground works at M1 South) and ongoing exploration.
World-class project with massive appeal – Speculative Buy Sanbrado is a tier 1 asset, with an increasing high-grade mining inventory,
simple processing flowsheet (free-milling ores), strong production profile
(+200kozpa) and long mine life (+10 years). The project has significant
appeal, being 90%-owned, development ready (mining licence being
updated), and has attractive project metrics (low cost, high-margin operation).
Importantly, WAF boasts an impressive team to execute, with development
and operational experience in gold projects throughout West Africa, with
some key new appointments expected soon.
We maintain our Speculative Buy recommendation with a price target of
80cps, NAV of 72cps, spot NAV of 80cps. Our modelling has been updated
by the DFS, but also includes some upside for mine life growth to M1 South.
Hartleys Limited ABN 33 104 195 057 (AFSL 230052) 141 St Georges Terrace, Perth, Western Australia, 6000
Hartleys does and seeks to do business with companies covered in its research reports. As a result, investors should be aware that the
firm may have a conflict of interest that could affect the objectivity of this report. Investors should consider this report as only a single
factor in making their investment decision. Further information concerning Hartleys’ regulatory disclosures can be found on Hartleys
website www.hartleys.com.au
0.00
0.10
0.20
0.30
0.40
0.50
0.60
.
5.
10.
15.
20.
25.
30.
35.
40.
45.
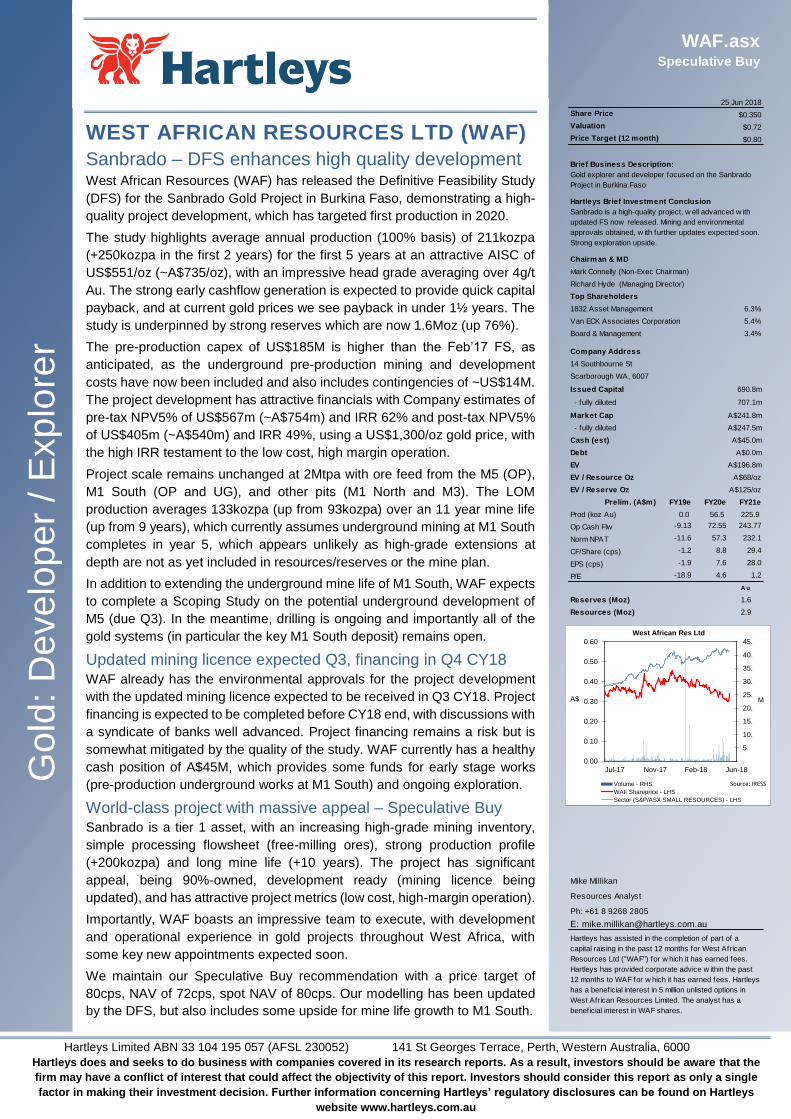
Jun-18Feb-18Nov-17Jul-17
Volume - RHS
WAF Shareprice - LHS
Sector (S&P/ASX SMALL RESOURCES) - LHS
A$ M
West African Res Ltd
Source: IRESS

Hartleys Limited West African Resources (WAF) 25 June 2018
Page 2 of 10
SUMMARY MODEL
West African Res Ltd Share Price
WAF $0.350 Speculative Buy
Key Market Information Directors & Management Company InformationShare Price $0.350 Mark Connelly (Non-Exec Chairman) 14 Southbourne StMarket Capitalisation - ordinary A$242m Richard Hyde (Managing Director) Scarborough WA, 6007Net Debt (cash) -$45m Simon Storm (Non-Exec Director & Comp Sec) +61 8 9481 7344Market Capitalisation - fully diluted A$247m +61 8 9481 7355EV A$202m Lyndon Hopkins (COO)Issued Capital 690.8m Vincent Morel (Expl Manager) www.westafricanresources.com.auOptions 16.2m Joanne Thompson (Sustainability Manager)Issued Capital (fully diluted inc. all options) 707.1m Nick Harch (Project Finance)Issued Capital (fully diluted inc. all options and new capital) 834.2m Pierre Tapsoba (National Director)
Valuation $0.72 Top Shareholders (est) m shares %12month price target $0.80 1832 Asset Management 43.5 6.3%
Van ECK Associates Corporation 37.6 5.4%
P&L Unit 30 Jun 18 30 Jun 19 30 Jun 20 30 Jun 21 30 Jun 22 Board & Management 23.8 3.4%
Net Revenue A$m 0.0 0.0 94.3 372.9 354.9Total Costs A$m -11.9 -7.7 -6.2 -60.8 -72.5EBITDA A$m -11.9 -7.7 88.1 312.1 282.4 - margin - - 93% 84% 80% Reserves & Resources Mt g/t Au Koz LCDepreciation/Amort A$m -0.5 -4.9 -17.1 -29.3 -32.4 Reserves 22-Jun-18
EBIT A$m -12.3 -12.5 71.0 282.8 250.0 Open Pit 18.9 1.7 1021
Net Interest A$m -1.5 -1.5 -1.5 -1.5 -1.5 Underground 1.5 11.7 553
Norm. Pre-Tax Profit A$m -13.8 -14.0 69.5 281.3 248.5 20.4 2.4 1,574 Reported Tax Expense A$m 0.0 0.0 -7.1 -49.2 -43.5 Resources 22-Jun-18
Normalised NPAT A$m -11.4 -11.6 57.3 232.1 205.0 M1 South OP 0.9 6.6 180 0.5g/t AuAbnormal Items A$m -2.4 -2.5 5.0 0.0 0.0 M1 South UG 1.0 21.2 680 3.0g/t AuReported Profit A$m -13.8 -14.0 62.4 232.1 205.0 M5 50.0 1.2 1,960 0.5g/t AuMinority A$m 0 0 0 0 0 M1 North 1.3 2.0 80 0.5g/t AuProfit Attrib A$m -13.8 -14.0 62.4 232.1 205.0 M3 0.4 1.8 20 0.5g/t Au
Total 53.5 1.7 2,900
Balance Sheet Unit 30 Jun 18 30 Jun 19 30 Jun 20 30 Jun 21 30 Jun 22Cash A$m 44.6 190.5 57.2 240.9 417.0 Production Summary Unit Jun 19 Jun 20 Jun 21 Jun 22
Other Current Assets A$m 0.1 0.1 7.9 30.9 29.5 Mill Throughput Mt 0.0 0.5 1.8 1.9
Total Current Assets A$m 44.7 190.6 65.0 271.8 446.5 Strip Ratio x 21.1 8.8 8.6 7.6
Property, Plant & Equip. A$m 4.7 49.8 223.3 216.7 210.2 Milled grade g/t 0.00 4.7 4.6 4.3
Exploration A$m 16.0 24.0 32.0 40.0 48.0 Combined Recovery & Payability % 0% 93% 93% 93%
Investments/other A$m 0.0 0.0 0.0 0.0 0.0 Gold (koz) 0.0 63 251 240
Tot Non-Curr. Assets A$m 20.7 73.8 255.3 256.7 258.2 Gold attr. 90% (koz) 0.0 57 226 216
Total Assets A$m 65.4 264.5 320.3 528.5 704.8 Implied Resource Conversion % 18% 16% 13% 11%
Mine Life yr 11.0 11.0 10.00 9.00
Short Term Borrowings A$m - - - - -Other A$m 1.0 1.0 1.9 7.4 8.6 Costs Unit Jun 19 Jun 20 Jun 21 Jun 22Total Curr. Liabilities A$m 1.0 1.0 1.9 7.4 8.6 Cost per milled tonne $A/t - 39.0 41.8 49.9
Long Term Borrowings A$m 0.0 145.9 137.9 107.9 77.9 EBITDA / tonne milled ore $A/t - 195.7 171.0 150.6
Other A$m - - - - -
Total Non-Curr. Liabil. A$m 0.0 145.9 137.9 107.9 77.9 C1: Operating Cash Cost = (a) $A/oz - 252 273 350
Total Liabilities A$m 1.0 146.9 139.8 115.3 86.5 (a) + Royalty = (b) $A/oz - 327 348 424
Net Assets A$m 64.3 117.5 180.5 413.2 618.3 C2: (a) + depreciation & amortisation = (c) $A/oz - 524 390 485
Net Debt A$m -44.6 -44.7 80.7 -133.0 -339.2 (a) + actual cash for development = (d) $A/oz - 730 396 491 C3: (c) + Royalty $A/oz - 599 464 559
Cashflow Unit 30 Jun 18 30 Jun 19 30 Jun 20 30 Jun 21 30 Jun 22 (d) + Royalty $A/oz - 805 470 565
Operating Cashflow A$m -1.5 -7.6 81.2 294.5 285.1 All In Sustaining Cost (AISC) $A/oz - 733 629 639
Income Tax Paid A$m 0.0 0.0 -7.1 -49.2 -43.5 All In Sustaining Cost (AISC) $US/oz - 559 485 497
Interest & Other A$m -1.5 -1.5 -1.5 -1.5 -1.5
Operating Activities A$m -3.0 -9.1 72.6 243.8 240.1 Price Assumptions Unit Jun 19 Jun 20 Jun 21 Jun 22
AUDUSD A$/US$ 0.76 0.76 0.77 0.78
Property, Plant & Equip. A$m -5.0 -50.0 -190.5 -22.7 -25.9 Gold US$/oz 1325 1288 1275 1275
Exploration and Devel. A$m -16.0 -8.0 -8.0 -8.0 -8.0
Other A$m 0.0 0.0 0.0 0.0 0.0 Hedging Jun 19 Jun 20 Jun 21 Jun 22
Investment Activities A$m -21.0 -58.0 -198.5 -30.7 -33.9 Hedges maturing? No No No No
Borrowings A$m 0.0 145.9 -8.0 -30.0 -30.0 Sensitivity Analysis
Equity or "tbc capital" A$m 58.1 67.2 0.6 0.7 0.0 Valuation
Dividends Paid A$m 0.0 0.0 0.0 0.0 0.0 Base Case 0.72
Financing Activities A$m 58.1 213.1 -7.4 -29.3 -30.0 Spot Prices 0.80 (10.7%)
Spot USD/AUD 0.74, Gold $1271/oz.
Net Cashflow A$m 34.0 145.9 -133.4 183.7 176.2 AUDUSD +/--10% 0.62 / 0.84 (-13.6% / 16.5%) 56.4 / 69.7 (-9.6% / 11.8%)
Gold +/--10% 0.86 / 0.59 (18.4% / -18.6%) 69.8 / 55.0 (11.9% / -11.9%)
Shares Unit 30 Jun 18 30 Jun 19 30 Jun 20 30 Jun 21 30 Jun 22 Production +/--10% 0.86 / 0.58 (19.3% / -19.5%) 70.1 / 54.6 (12.5% / -12.5%)Ordinary Shares - End m 688.1 824.7 826.7 829.5 829.5 Operating Costs +/--10% 0.70 / 0.75 (-3.6% / 3.5%) 61.6 / 63.2 (-1.3% / 1.3%)Ordinary Shares - Weighted m 586.2 756.4 825.7 828.1 829.5Diluted Shares - Weighted m 586.2 751.7 815.2 815.2 815.2 Unpaid Capital - ITM
Year Expires No. (m) $m Avg price % ord
Ratio Analysis Unit 30 Jun 18 30 Jun 19 30 Jun 20 30 Jun 21 30 Jun 22 30-Jun-18 0.0 0.0 0.00 0.0%
Cashflow Per Share A$ cps -0.5 -1.2 8.8 29.4 28.9 30-Jun-19 9.5 1.0 0.11 1.4%
Cashflow Multiple x -68.4 -29.0 4.0 1.2 1.2 30-Jun-20 2.0 0.6 0.28 0.3%
Earnings Per Share A$ cps -2.4 -1.9 7.6 28.0 24.7 30-Jun-21 4.8 1.5 0.31 0.7%
Price to Earnings Ratio x -14.9 -18.9 4.6 1.2 1.4 TOTAL 16.2 3.0 0.19 2.3%
Dividends Per Share AUD - - - - -
Dividend Yield % 0.0% 0.0% 0.0% 0.0% 0.0%
Net Debt / Net Debt + Equity % -226% -61% 31% -47% -122% Share Price Valuation (NAV) Risked Est. A$m
Interest Cover X na na 47.7 189.9 167.9 90% Sanbrado (pre-tax NAV at disc. rate of 12%) 587
Return on Equity % na na 32% 56% 33% Exploration upside, other assets etc 70
Forwards 0Corporate Overheads -17Net Cash (Debt) 45Tax (NPV future liability) -84Options & Other Equity 1
Hedging 0
Total 603
Analyst: Mike Millikan
+61 8 9268 2805
"tbc capital" could be equity or debt. Our valuation is risk-adjusted for how this may be obtained.
Sources: IRESS, Company Information, Hartleys Research
0.00
0.72
63.8 (2.3%)
FY19 NPAT
62.4
0.08
0.00-0.020.05-0.100.00
Last Updated: 25/06/2018
Est. A$/share
0.70

Hartleys Limited West African Resources (WAF) 25 June 2018
Page 3 of 10
SANBRADO GOLD PROJECT – BURKINA FASO The Sanbrado Gold Project (formerly Tanlouka Gold Project) is located ~90km
southeast of Ouagadougou, Burkina Faso. The project comprises one granted mining
permit and one granted exploration licence, covering an area of ~116km².
WAF has a 90% interest in the project, with the Government of Burkina Faso entitled
to a free-carried 10% interest. The project was acquired by WAF through an all scrip
transaction with TSX-V listed gold junior Channel Resources. At the time of the
acquisition the project contained the ~1Moz (0.5g/t LC) Mankarga 5 deposit.
Subsequently WAF has discovered the high-grade M1 South deposit and extended
mineralisation at M5, M1 North and M3 prospects.
Fig. 1: Sanbrado Project Location
Source: West African Resources Limited
Reserves are now estimated to be 20.4Mt @ 2.4g/t Au for 1.57Moz gold (up some
76% on the previous estimate). The latest Sanbrado resource estimate (total) is
53.5Mt grading 1.7g/t Au for 2.9Moz, with over 2.3Moz now Indicated.
Fig. 2: Sanbrado Project – Resource Statement June 2018
Source: West African Resources Limited; Hartleys Estimates
Deposit Type Cut-off Tonnes Grade (g/t) Oz Tonnes Grade (g/t) Oz Tonnes Grade (g/t) Oz
Open Pit (<120m) 0.5 800,000 6.6 170,000 50,000 4.8 10,000 850,000 6.6 180,000
Underground (>120m) 3.0 750,000 25.5 620,000 250,000 7.6 60,000 1,000,000 21.2 680,000
Total Combined 1,550,000 15.9 780,000 300,000 6.9 70,000 1,850,000 14.3 850,000
M5 Open Pit 0.5 37,150,000 1.3 1,510,000 12,800,000 1.1 450,000 49,950,000 1.2 1,960,000
M1 North Open Pit 0.5 750,000 2.0 50,000 500,000 2.0 30,000 1,250,000 2.0 80,000
M3 Open Pit 0.5 150,000 2.0 10,000 200,000 1.5 10,000 350,000 1.8 20,000
Total Combined 39,600,000 1.8 2,350,000 13,850,000 1.2 550,000 53,450,000 1.7 2,900,000
Indicated Inferred Total
M1 South
Sanbrado is located
~90km southeast of
Ouagadougou in
Burkina Faso
Burkina Faso remains
a mining fr iendly
jur isdict ion
The project comprises
one granted mining
permit ( to be updated
in Q3) and one
granted exploration
l icence, cover ing an
area of ~116km²
A reserve posi t ion in
excess of 1.5Moz has
been achieved
Reserves and
resources have been
upgraded

Hartleys Limited West African Resources (WAF) 25 June 2018
Page 4 of 10
Sanbrado is proposed to be a conventional CIL operation, with free-milling ores and
anticipated low reagent consumption and a good portion of gravity recoverable gold.
Recent DFS work optimised the processing flowsheet, with the P80 90μm grind size
considered to be the most cost-effective option based on the economic parameters
applied for M5 and M1 South open pits and a grind size of P80 75μm was determined
to be appropriate for the higher grade M1 South fresh ores.
The average gold recoveries over the LOM is expected to be ~93%.
Fig. 3: Sanbrado Site Layout
Source: West African Resources Limited
Fig. 4: Sanbrado Processing Flowsheet
Source: West African Resources Limited
Sanbrado is proposed
to be a convent ional
CIL operation, with
free-mi l l ing ores and
anticipated low
reagent consumpt ion
and a good por t ion of
gravi ty recoverable
gold
Average gold
recoveries over the
LOM is expected to be
~93%
2Mtpa SABC CIL Plant

Hartleys Limited West African Resources (WAF) 25 June 2018
Page 5 of 10
Fig. 5: Sanbrado – M5 Open Pit (bulk feed)
Source: West African Resources Limited
Fig. 6: Sanbrado – M1 South Underground (high-grade feed)
Source: West African Resources Limited
Sanbrado is a high
qual ity gold project
contain ing the key
deposits: M5 ( large
system, open at depth
and along str ike) and
M1 South (ul tra-high
grade deposit ,
growing at depth)
M5 ore from surface
with over 50% oxide,
remains open at depth
and provides potent ial
for a future
underground mine
(current ly being
scoped)
M1 South is expected
to provide 300-350kt
per annum from the
underground mine
Latest dr i l l ing has
conf irmed high-grade
mineralisat ion at M1
South extends to
vert ical depths of
+580m, system
remains open
Underground advance
is expected to be
~80m vert ical, which
impl ies another 2
years could added to
the mine l i fe once
addit ional resources
are added and
converted to reserves
WAF remains wel l
funded for exploration
dri l l ing to extend and
converted resources

Hartleys Limited West African Resources (WAF) 25 June 2018
Page 6 of 10
VALUATION – UPDATED BY THE DFS Our modelling uses inputs from the Combined Open Pit and Underground DFS but
also includes some upside for the M1 South. We assume a project scale of 2.0Mtpa
(unchanged), with a slightly adjusted mine plan and updated cost estimates.
We have maintained our LOM gold recoveries at 93%, which could be considered
conservative given the high contribution from the M1 South underground, which is
expected to have recoveries over 95%. We now assume pre-production capex of
~US$185M (~A$250M), up from ~US$161M (~A$217M). Our modelling assumptions
are summarised below.
Fig. 7: Sanbrado Project Model Assumptions
Source: Hartleys Estimates* BC= Base Case
We now assume a blended LOM head grade of ~2.6/t Au, improved gold recoveries
and total mining inventory of ~1.59Moz, versus the current reserve of 1.6Moz (which
we expect with grow through resource extension and conversion). Our production
profile provides average LOM production of ~145kozpa over a mine-life of ~11 years.
We see significant potential for additional higher grade tonnes at M1 South as the
deposit remains open at depth. The exploration potential of the project are remains
strong and we continue to model a nominal A$70m ($0.08/share) value for exploration
upside.
Fig. 8: Hartleys Sum of Parts Valuation for WAF
Source: Hartleys Estimates
Sanbrado Open Pit FSSanbrado Combined OP/UG
DFSHartleys BC (old) Hartleys BC (new)
LOM Strip Ratio (x) 5.0x 4.6x 5.0x 4.7x
Reserve or Mining Inventory - Base 16.8Mt @ 1.7g/t Au for 0.89Moz 20.4Mt @ 2.4g/t Au for 1.6Moz 20Mt @ 2.6g/t Au for 1.6Moz 20.4Mt @ 2.4g/t Au for 1.6Moz
Resource - Base 21.1Mt @ 2.36g/t Au for 1.55Moz 53.5Mt @ 1.7g/t Au for 2.9Moz 24Mt @ 2.7g/t Au for 2.1Moz 53.5Mt @ 1.7g/t Au for 2.9Moz
Operation Scale (Mtpa) 2.0Mtpa 2.0Mtpa 2.0Mtpa 2.0Mtpa
LOM Head Grade g/t 1.7g/t 2.4g/t 2.6g/t 2.6g/t
LOM Recovered Grade g/t 1.4g/t 2.1g/t 2.4g/t 2.3g/t
LOM Gold recovery 90.7% 93% 93% 93%
Total Gold Produced 0.81Moz 1.46Moz 1.53Moz 1.59Moz
Total Gold Produced pa 93Kozpa 133Kozpa 153Kozpa 145Kozpa
Current Assumed Mine Life (yrs) 8.75yrs 11.0yrs 10.0yrs 11.0yrs
Commencement Date (qtr) Jun-19 Jun-20 Jun-20 Jun-20
LOM avg selling price (US$/gold oz) US$1200/oz US$1300/oz US$1242/oz US$1240/oz
LOM Cash Costs (US$/gold oz) US$717/oz US$577/oz US$515/oz US$545/oz
LOM AISC (US$/gold oz) US$759/oz US$640/oz US$613/oz US$633/oz
LOM Operating Margin (US$mpa) US$41mpa US$88mpa US$96mpa US$88mpa
Capex - Pre-production US$131m US$185m US$161m US$185m
Pre-tax NPV @ 5% US$143m US$567m US$554m US$592m
Share Price Valuation (NAV) Risked Est. A$m90% Sanbrado (pre-tax NAV at disc. rate of 12%) 587Exploration upside, other assets etc 70Forwards 0Corporate Overheads -17Net Cash (Debt) 45Tax (NPV future liability) -84Options & Other Equity 1
Hedging 0
Total 603
Est. A$/share0.700.080.00-0.020.05-0.100.00
0.00
0.72
We now assume
~US$185M capex
requirement in FY19
to build a 2.0Mtpa CIL
plant , open pit and
underground mine (M1
South)
We assume a nominal
A$70M value
(unchanged) for
explorat ion upside and
other gold assets
within the port fol io
Hart leys sum of par ts
valuation for WAF is
72cps (up from 67cps)

Hartleys Limited West African Resources (WAF) 25 June 2018
Page 7 of 10
PRICE TARGET Our price target is based on our Base Case valuation at both Hartleys commodity price
and current spot prices, using our development discount rate of 12% and future
production discount rate of 8%. We have included a small weighting for the current net
cash backing.
Fig. 9: WAF Price Target Methodology
Source: Hartleys Estimates
WAF Price Target Methodology Weighting Spot 12 mth out
50% $0.72 $0.80
25% $0.80 $0.88
15% $0.85 $0.90
5% $0.95 $1.01
Net Cash 5% $0.07 $0.07
Risk weighted composite $0.74
12 Months Price Target $0.80
Shareprice - Last $0.350
12 mth total return (% to 12mth target ) 128%
Sanbrado NPV@ 12% - Base Case
Sanbrado NPV@ 12% - Base Case - Spot
Sanbrado NPV@ 8% - Upside Case
Sanbrado NPV@ 8% - Upside Case - Spot
Hart leys 12 month
price target is 80cps
(up from 77cps)

Hartleys Limited West African Resources (WAF) 25 June 2018
Page 8 of 10
EV/EBITDA BANDS
Fig. 10: Using Hartleys base case commodity forecasts
Source: Hartleys Estimates, IRESS
Fig. 11: Using spot commodity prices
Source: Hartleys Estimates, IRESS
.00
.50
1.00
1.50
2.00
2.50
3.00
3.50
WAF Actual
Hartleys Target
8x EV/EBITDA
6x EV/EBITDA
4x EV/EBITDA
2x EV/EBITDA
1x EV/EBITDA
Shareprice
.00
.50
1.00
1.50
2.00
2.50
3.00
3.50
WAF Actual
8x EV/EBITDA
6x EV/EBITDA
4x EV/EBITDA
2x EV/EBITDA
1x EV/EBITDA
Shareprice

Hartleys Limited West African Resources (WAF) 25 June 2018
Page 9 of 10
RISKS
Fig. 12: Key assumptions and risks for valuation Assumption Risk of not realising
assumption Risk to valuation if
assumption is incorrect
Comment
Feasible project development
Moderate Meaningful WAF is leveraged to the success of the Sanbrado project. We model a 2.0Mtpa project for 11 years. If the project varies largely from these metrics our valuation will be at risk to
upside and downside Model parameters
Moderate
Meaningful
We have made a number of assumptions in our
valuation of WAF, changes in these assumptions can change our valuation to both the upside and
downside. Our model is largely based on the latest DFS inputs.
Exploration upside potential
Moderate
Meaningful
We assume exploration upside at Sanbrado.
Our valuation will be at risk if WAF has no further exploration success
Funding Risk
Moderate
High
We assume a ~60:40 debt:equity funding
scenario to develop the 2.0Mtpa CIL project, if this funding scenario is not achievable our
valuation will be at risk, equity dilution is the highest risk to our valuation
Conclusion At this early stage we have made significant assumptions but believe these are achievable.
Source: Hartleys Research

Page 10 of 10
HARTLEYS CORPORATE DIRECTORY Research Trent Barnett Head of Research +61 8 9268 3052
Mike Millikan Resources Analyst +61 8 9268 2805
John Macdonald Resources Analyst +61 8 9268 3020
Paul Howard Resources Analyst +61 8 9268 3045
Aiden Bradley Research Analyst +61 8 9268 2876
Oliver Stevens Research Analyst +61 8 9268 2879
Michael Scantlebury Junior Analyst +61 8 9268 2837
Janine Bell Research Assistant +61 8 9268 2831
Corporate Finance Dale Bryan Director & Head of
Corp Fin.
+61 8 9268 2829
Richard Simpson Director +61 8 9268 2824
Ben Crossing Director +61 8 9268 3047
Ben Wale Director +61 8 9268 3055
Stephen Kite Director +61 8 9268 3050
Scott Weir Director +61 8 9268 2821
Scott Stephens Associate Director +61 8 9268 2819
Rhys Simpson Associate Director +61 8 9268 2851
Registered Office
Level 6, 141 St Georges Tce Postal Address:
Perth WA 6000 GPO Box 2777
Australia Perth WA 6001
PH:+61 8 9268 2888 FX: +61 8 9268 2800
www.hartleys.com.au [email protected]
Note: personal email addresses of company employees are structured
in the following manner: [email protected]
Hartleys Recommendation Categories
Buy Share price appreciation anticipated.
Accumulate Share price appreciation anticipated but the risk/reward is
not as attractive as a “Buy”. Alternatively, for the share
price to rise it may be contingent on the outcome of an
uncertain or distant event. Analyst will often indicate a
price level at which it may become a “Buy”.
Neutral Take no action. Upside & downside risk/reward is evenly
balanced.
Reduce /
Take profits
It is anticipated to be unlikely that there will be gains over
the investment time horizon but there is a possibility of
some price weakness over that period.
Sell Significant price depreciation anticipated.
No Rating No recommendation.
Speculative
Buy
Share price could be volatile. While it is anticipated that,
on a risk/reward basis, an investment is attractive, there
is at least one identifiable risk that has a meaningful
possibility of occurring, which, if it did occur, could lead to
significant share price reduction. Consequently, the
investment is considered high risk.
Institutional Sales Carrick Ryan +61 8 9268 2864
Justin Stewart +61 8 9268 3062
Simon van den Berg +61 8 9268 2867
Digby Gilmour +61 8 9268 2814
Jayme Walsh +61 8 9268 2828
Veronika Tkacova +61 8 9268 3053
Wealth Management Nicola Bond +61 8 9268 2840
Bradley Booth +61 8 9268 2873
Adrian Brant +61 8 9268 3065
Nathan Bray +61 8 9268 2874
Sven Burrell +61 8 9268 2847
Simon Casey +61 8 9268 2875
Tony Chien +61 8 9268 2850
Tim Cottee +61 8 9268 3064
David Cross +61 8 9268 2860
Nicholas Draper +61 8 9268 2883
John Featherby +61 8 9268 2811
Ben Fleay +61 8 9268 2844
James Gatti +61 8 9268 3025
John Goodlad +61 8 9268 2890
Andrew Gribble +61 8 9268 2842
David Hainsworth +61 8 9268 3040
Murray Jacob +61 8 9268 2892
Gavin Lehmann +61 8 9268 2895
Shane Lehmann +61 8 9268 2897
Steven Loxley +61 8 9268 2857
Andrew Macnaughtan +61 8 9268 2898
Scott Metcalf +61 8 9268 2807
David Michael +61 8 9268 2835
Jamie Moullin +61 8 9268 2856
Chris Munro +61 8 9268 2858
Michael Munro +61 8 9268 2820
Ian Parker +61 8 9268 2810
Matthew Parker +61 8 9268 2826
Charlie Ransom
(CEO)
+61 8 9268 2868
Mark Sandford +61 8 9268 3066
David Smyth +61 8 9268 2839
Greg Soudure +61 8 9268 2834
Sonya Soudure +61 8 9268 2865
Dirk Vanderstruyf +61 8 9268 2855
Samuel Williams +61 8 9268 3041
Disclaimer/Disclosure
The author of this publication, Hartleys Limited ABN 33 104 195 057 (“Hartleys”), its Directors and their Associates from time to time may hold
shares in the security/securities mentioned in this Research document and therefore may benefit from any increase in the price of those securities.
Hartleys and its Advisers may earn brokerage, fees, commissions, other benefits or advantages as a result of a transaction arising from any advice
mentioned in publications to clients.
Hartleys has assisted in the completion of part of a capital raising in the past 12 months for West African Resources Ltd ("WAF") for which it has
earned fees. Hartleys has provided corporate advice within the past 12 months to WAF for which it has earned fees. Hartleys has a beneficial
interest in 5 million unlisted options in West African Resources Limited.
Any financial product advice contained in this document is unsolicited general information only. Do not act on this advice without first consulting
your investment adviser to determine whether the advice is appropriate for your investment objectives, financial situation and particular needs.
Hartleys believes that any information or advice (including any financial product advice) contained in this document is accurate when issued.
Hartleys however, does not warrant its accuracy or reliability. Hartleys, its officers, agents and employees exclude all liability whatsoever, in
negligence or otherwise, for any loss or damage relating to this document to the full extent permitted by law.