Embed Size (px)
Citation preview

UNITED STATES
SECURITIES AND EXCHANGE COMMISSION Washington, D.C. 20549
________________
FORM 10-Q
QUARTERLY REPORT PURSUANT TO SECTION 13 OR 15(d) OF THE SECURITIES EXCHANGE ACT OF 1934
For the quarterly period ended June 30, 2016 Commission File Number 1-8787
American International Group, Inc.
(Exact name of registrant as specified in its charter)
Delaware 13-2592361(State or other jurisdiction of incorporation or organization)
(I.R.S. EmployerIdentification No.)
175 Water Street, New York, New York 10038(Address of principal executive offices) (Zip Code)
Registrant’s telephone number, including area code: (212) 770-7000
________________
Indicate by check mark whether the registrant (1) has filed all reports required to be filed by Section 13 or 15(d) of the Securities Exchange Act of 1934 during the preceding 12 months (or for such shorter period that the registrant was required to file such reports), and (2) has been subject to such filing requirements for the past 90 days. Yes No ☐ Indicate by check mark whether the registrant has submitted electronically and posted on its corporate Web site, if any, every Interactive Data File required to be submitted and posted pursuant to Rule 405 of Regulation S-T (§232.405 of this chapter) during the preceding 12 months (or for such shorter period that the registrant was required to submit and post such files). Yes No ☐ Indicate by check mark whether the registrant is a large accelerated filer, an accelerated filer, a non-accelerated filer, or a smaller reporting company. See the definitions of “large accelerated filer,” “accelerated filer” and “smaller reporting company” in Rule 12b-2 of the Exchange Act. Large accelerated filer Accelerated filer ☐ Non-accelerated filer ☐ Smaller reporting company ☐ (Do not check if a
smaller reporting company)
Indicate by check mark whether the registrant is a shell company (as defined in Rule 12b-2 of the Exchange Act). Yes ☐ No As of July 29, 2016, there were 1,070,659,944 shares outstanding of the registrant’s common stock.

1
AMERICAN INTERNATIONAL GROUP, INC. QUARTERLY REPORT ON FORM 10-Q FOR THE QUARTERLY PERIOD ENDED JUNE 30, 2016 TABLE OF CONTENTS
FORM 10-Q Item Number Description Page
PART I — FINANCIAL INFORMATION
Item 1 Condensed Consolidated Financial Statements 2 Note 1. Basis of Presentation 7 Note 2. Summary of Significant Accounting Policies 8 Note 3. Segment Information 13 Note 4. Fair Value Measurements 14 Note 5. Investments 34 Note 6. Lending Activities 43 Note 7. Variable Interest Entities 45 Note 8. Derivatives and Hedge Accounting 47 Note 9. Contingencies, Commitments and Guarantees 53 Note 10. Equity 59 Note 11. Earnings Per Share 63 Note 12. Employee Benefits 63 Note 13. Income Taxes 65 Note 14. Information Provided in Connection with Outstanding Debt 68 Note 15. Subsequent Events 73
Item 2 Management’s Discussion and Analysis of Financial Condition and Results of Operations 74 Cautionary Statement Regarding Forward-Looking Information 74 Use of Non-GAAP Measures 77 Executive Overview 80 Results of Operations 96 Investments 139 Insurance Reserves 159 Liquidity and Capital Resources 172 Enterprise Risk Management 186 Critical Accounting Estimates 191 Regulatory Environment 192 Glossary 193 Acronyms 196
Item 3 Quantitative and Qualitative Disclosures About Market Risk 197Item 4 Controls and Procedures 197
PART II — OTHER INFORMATION Item 1 Legal Proceedings 198Item 1A Risk Factors 198Item 2 Unregistered Sales of Equity Securities and Use of Proceeds 199Item 4 Mine Safety Disclosures 199Item 6 Exhibits 199
SIGNATURES 200

2
PART I – FINANCIAL INFORMATION
ITEM 1. FINANCIAL STATEMENTS AMERICAN INTERNATIONAL GROUP, INC. CONDENSED CONSOLIDATED BALANCE SHEETS (unaudited) June 30, December 31,
(in millions, except for share data) 2016 2015Assets:
Investments:
Fixed maturity securities:
Bonds available for sale, at fair value (amortized cost: 2016 - $244,450; 2015 - $240,968) $ 262,089 $ 248,245
Other bond securities, at fair value (See Note 5) 15,335 16,782
Equity Securities:
Common and preferred stock available for sale, at fair value (cost: 2016 - $1,246; 2015 - $1,379) 1,642 2,915
Other common and preferred stock, at fair value (See Note 5) 661 921
Mortgage and other loans receivable, net of allowance (portion measured at fair value: 2016 - $11; 2015 - $11) 31,261 29,565
Other invested assets (portion measured at fair value: 2016 - $7,177; 2015 - $8,912) 27,345 29,794
Short-term investments (portion measured at fair value: 2016 - $3,949; 2015 - $2,591) 12,334 10,132
Total investments 350,667 338,354
Cash 1,784 1,629
Accrued investment income 2,590 2,623
Premiums and other receivables, net of allowance 12,078 11,451
Reinsurance assets, net of allowance 21,441 20,413
Deferred income taxes 18,542 20,394
Deferred policy acquisition costs 10,487 11,115
Other assets, including restricted cash of $191 in 2016 and $170 in 2015 12,188 11,289
Separate account assets, at fair value 80,572 79,574Total assets $ 510,349 $ 496,842Liabilities:
Liability for unpaid losses and loss adjustment expenses $ 74,143 $ 74,942
Unearned premiums 22,165 21,318
Future policy benefits for life and accident and health insurance contracts 45,982 43,585
Policyholder contract deposits (portion measured at fair value: 2016 - $4,016; 2015 - $2,325) 131,936 127,588
Other policyholder funds (portion measured at fair value: 2016 - $5; 2015 - $6) 4,292 4,212
Other liabilities (portion measured at fair value: 2016 - $241; 2015 - $62) 27,393 26,164
Long-term debt (portion measured at fair value: 2016 - $3,747; 2015 - $3,670) 33,329 29,249
Separate account liabilities 80,572 79,574Total liabilities 419,812 406,632Contingencies, commitments and guarantees (see Note 9)
AIG shareholders’ equity:
Common stock, $2.50 par value; 5,000,000,000 shares authorized; shares issued: 2016 - 1,906,671,492 and
2015 - 1,906,671,492 4,766 4,766
Treasury stock, at cost; 2016 - 823,982,130 shares; 2015 - 712,754,875 shares of common stock (36,262) (30,098)
Additional paid-in capital 81,232 81,510
Retained earnings 31,951 30,943
Accumulated other comprehensive income 8,259 2,537Total AIG shareholders’ equity 89,946 89,658Non-redeemable noncontrolling interests 591 552Total equity 90,537 90,210Total liabilities and equity $ 510,349 $ 496,842
See accompanying Notes to Condensed Consolidated Financial Statements.

ITEM 1 / FINANCIAL STATEMENTS
3
AMERICAN INTERNATIONAL GROUP, INC. CONDENSED CONSOLIDATED STATEMENTS OF INCOME (unaudited) Three Months Ended Six Months Ended
June 30, June 30,
(dollars in millions, except per share data) 2016 2015 2016 2015Revenues:
Premiums $ 8,751 $ 9,545 $ 17,557 $ 18,367
Policy fees 696 688 1,383 1,365
Net investment income 3,683 3,826 6,696 7,664
Net realized capital gains (losses):
Total other-than-temporary impairments on available for sale securities (65) (148) (274) (235)
Portion of other-than-temporary impairments on available for sale
fixed maturity securities recognized in Other comprehensive income (loss) (29) (4) (22) (14)
Net other-than-temporary impairments on available for sale
securities recognized in net income (94) (152) (296) (249)
Other realized capital gains 1,136 278 232 1,716
Total net realized capital gains (losses) 1,042 126 (64) 1,467
Other income 552 1,514 931 2,811Total revenues 14,724 15,699 26,503 31,674Benefits, losses and expenses:
Policyholder benefits and losses incurred 6,872 7,100 13,259 13,651
Interest credited to policyholder account balances 961 942 1,911 1,877
Amortization of deferred policy acquisition costs 1,345 1,356 2,607 2,706
General operating and other expenses 2,586 3,090 5,589 6,039
Interest expense 320 316 626 656
Loss on extinguishment of debt 7 342 90 410
Net (gain) loss on sale of divested businesses (225) 1 (223) 7Total benefits, losses and expenses 11,866 13,147 23,859 25,346Income from continuing operations before income tax expense 2,858 2,552 2,644 6,328Income tax expense 924 777 866 2,077Income from continuing operations 1,934 1,775 1,778 4,251Income (loss) from discontinued operations, net of income tax expense (10) 16 (57) 17Net income 1,924 1,791 1,721 4,268Less:
Net income (loss) from continuing operations attributable to
noncontrolling interests 11 (9) (9) -Net income attributable to AIG $ 1,913 $ 1,800 $ 1,730 $ 4,268
Income (loss) per common share attributable to AIG:
Basic:
Income from continuing operations $ 1.73 $ 1.34 $ 1.57 $ 3.16
Income (loss) from discontinued operations $ (0.01) $ 0.01 $ (0.05) $ 0.01
Net income attributable to AIG $ 1.72 $ 1.35 $ 1.52 $ 3.17
Diluted:
Income from continuing operations $ 1.69 $ 1.31 $ 1.54 $ 3.09
Income (loss) from discontinued operations $ (0.01) $ 0.01 $ (0.05) $ 0.01
Net income attributable to AIG $ 1.68 $ 1.32 $ 1.49 $ 3.10Weighted average shares outstanding:
Basic 1,113,587,927 1,329,157,366 1,135,068,193 1,347,452,833
Diluted 1,140,045,973 1,365,390,431 1,163,089,748 1,376,325,971Dividends declared per common share $ 0.320 $ 0.125 $ 0.640 $ 0.250
See accompanying Notes to Condensed Consolidated Financial Statements.

ITEM 1 / FINANCIAL STATEMENTS
4
AMERICAN INTERNATIONAL GROUP, INC. CONDENSED CONSOLIDATED STATEMENTS OF COMPREHENSIVE INCOME (LOSS) (unaudited) Three Months Ended Six Months Ended
June 30, June 30,
(in millions) 2016 2015 2016 2015
Net income $ 1,924 $ 1,791 $ 1,721 $ 4,268
Other comprehensive income (loss), net of tax
Change in unrealized appreciation (depreciation) of fixed maturity investments on
which other-than-temporary credit impairments were taken 22 (36) (327) (108)
Change in unrealized appreciation (depreciation) of all other investments 2,409 (2,991) 5,836 (2,452)
Change in foreign currency translation adjustments 313 (37) 221 (496)
Change in retirement plan liabilities adjustment (10) 27 (8) 56
Other comprehensive income (loss) 2,734 (3,037) 5,722 (3,000)
Comprehensive income (loss) 4,658 (1,246) 7,443 1,268
Comprehensive income (loss) attributable to noncontrolling interests 11 (9) (9) (3)
Comprehensive income (loss) attributable to AIG $ 4,647 $ (1,237) $ 7,452 $ 1,271 See accompanying Notes to Condensed Consolidated Financial Statements.

ITEM 1 / FINANCIAL STATEMENTS
5
AMERICAN INTERNATIONAL GROUP, INC. CONDENSED CONSOLIDATED STATEMENTS OF EQUITY (unaudited) Non-
Accumulated Total AIG redeemable
Additional Other Share- Non-
Common Treasury Paid-in Retained Comprehensive holders' controlling Total
(in millions) Stock Stock Capital Earnings Income Equity Interests Equity
Six Months Ended June 30, 2016
Balance, beginning of year $ 4,766 $ (30,098) $ 81,510 $ 30,943 $ 2,537 $ 89,658 $ 552 $ 90,210
Common stock issued under stock plans - 84 (172) - - (88) - (88)
Purchase of common stock - (6,248) - - - (6,248) - (6,248)
Net income (loss) attributable to AIG or
noncontrolling interests - - - 1,730 - 1,730 (9) 1,721
Dividends - - - (713) - (713) - (713)
Other comprehensive income - - - - 5,722 5,722 - 5,722
Current and deferred income taxes - - 19 - - 19 - 19
Net increase due to acquisitions and consolidations - - - - - - 44 44
Contributions from noncontrolling interests - - - - - - 3 3
Distributions to noncontrolling interests - - - - - - (15) (15)
Other - - (125) (9) - (134) 16 (118)
Balance, end of period $ 4,766 $ (36,262) $ 81,232 $ 31,951 $ 8,259 $ 89,946 $ 591 $ 90,537
Six Months Ended June 30, 2015
Balance, beginning of year $ 4,766 $ (19,218) $ 80,958 $ 29,775 $ 10,617 $ 106,898 $ 374 $ 107,272
Purchase of common stock - (3,947) - - - (3,947) - (3,947)
Net income attributable to AIG or
noncontrolling interests - - - 4,268 - 4,268 - 4,268
Dividends - - - (335) - (335) - (335)
Other comprehensive loss - - - - (2,997) (2,997) (3) (3,000)
Deferred income taxes - - (12) - - (12) - (12)
Net increase due to acquisitions and consolidations - - - - - - 9 9
Contributions from noncontrolling interests - - - - - - - -
Distributions to noncontrolling interests - - - - - - (3) (3)
Other - - 384 (1) - 383 7 390
Balance, end of period $ 4,766 $ (23,165) $ 81,330 $ 33,707 $ 7,620 $ 104,258 $ 384 $ 104,642
See accompanying Notes to Condensed Consolidated Financial Statements.

ITEM 1 / FINANCIAL STATEMENTS
6
AMERICAN INTERNATIONAL GROUP, INC. CONDENSED CONSOLIDATED STATEMENTS OF CASH FLOWS (unaudited) Six Months Ended June 30, (in millions) 2016 2015Cash flows from operating activities:
Net income $ 1,721 $ 4,268(Income) loss from discontinued operations 57 (17)Adjustments to reconcile net income to net cash provided by operating activities: Noncash revenues, expenses, gains and losses included in income:
Net gains on sales of securities available for sale and other assets (907) (666)Net (gain) loss on sale of divested businesses (223) 7Losses on extinguishment of debt 90 410Unrealized (gains) losses in earnings - net 1,130 (1,425)Equity in (income) loss from equity method investments, net of dividends or distributions 145 (715)Depreciation and other amortization 2,270 2,410Impairments of assets 636 471
Changes in operating assets and liabilities: Insurance reserves 313 (420)Premiums and other receivables and payables - net (614) (1,359)Reinsurance assets and funds held under reinsurance treaties (988) 573Capitalization of deferred policy acquisition costs (2,554) (2,880)Current and deferred income taxes - net 750 1,739Other, net (1,255) (1,903)Total adjustments (1,207) (3,758)
Net cash provided by operating activities 571 493Cash flows from investing activities: Proceeds from (payments for)
Sales or distributions of: Available for sale investments 13,540 14,144Other securities 2,246 3,998Other invested assets 3,687 6,218
Maturities of fixed maturity securities available for sale 12,350 12,176Principal payments received on and sales of mortgage and other loans receivable 2,964 2,470Purchases of:
Available for sale investments (27,573) (24,198)Other securities (381) (583)Other invested assets (1,602) (1,743)Mortgage and other loans receivable (5,081) (4,459)
Net change in restricted cash (78) 1,462Net change in short-term investments (1,755) (2,693)Other, net 1,419 (1,506)
Net cash provided by (used in) investing activities (264) 5,286Cash flows from financing activities: Proceeds from (payments for)
Policyholder contract deposits 9,539 7,541Policyholder contract withdrawals (6,787) (7,225)Issuance of long-term debt 6,688 2,774Repayments of long-term debt (2,919) (3,701)Purchase of common stock (6,248) (3,743)Dividends paid (713) (335)Other, net 250 (877)
Net cash used in financing activities (190) (5,566)Effect of exchange rate changes on cash 38 (34)Net increase in cash 155 179Cash at beginning of year 1,629 1,758Change in cash of businesses held-for-sale - -Cash at end of period $ 1,784 $ 1,937
Supplementary Disclosure of Condensed Consolidated Cash Flow Information Cash paid during the period for:
Interest $ 650 $ 760Taxes $ 117 $ 338
Non-cash investing/financing activities: Interest credited to policyholder contract deposits included in financing activities $ 1,797 $ 1,826Non-cash consideration received from sale of AerCap $ - $ 500
See accompanying Notes to Condensed Consolidated Financial Statements.
I TEM 1 / NOTE 1. BASIS OF PRESENTATION
NOTES TO CONDENSED CONSOLIDATED FINANCIAL STATEMENTS (unaudited)
7
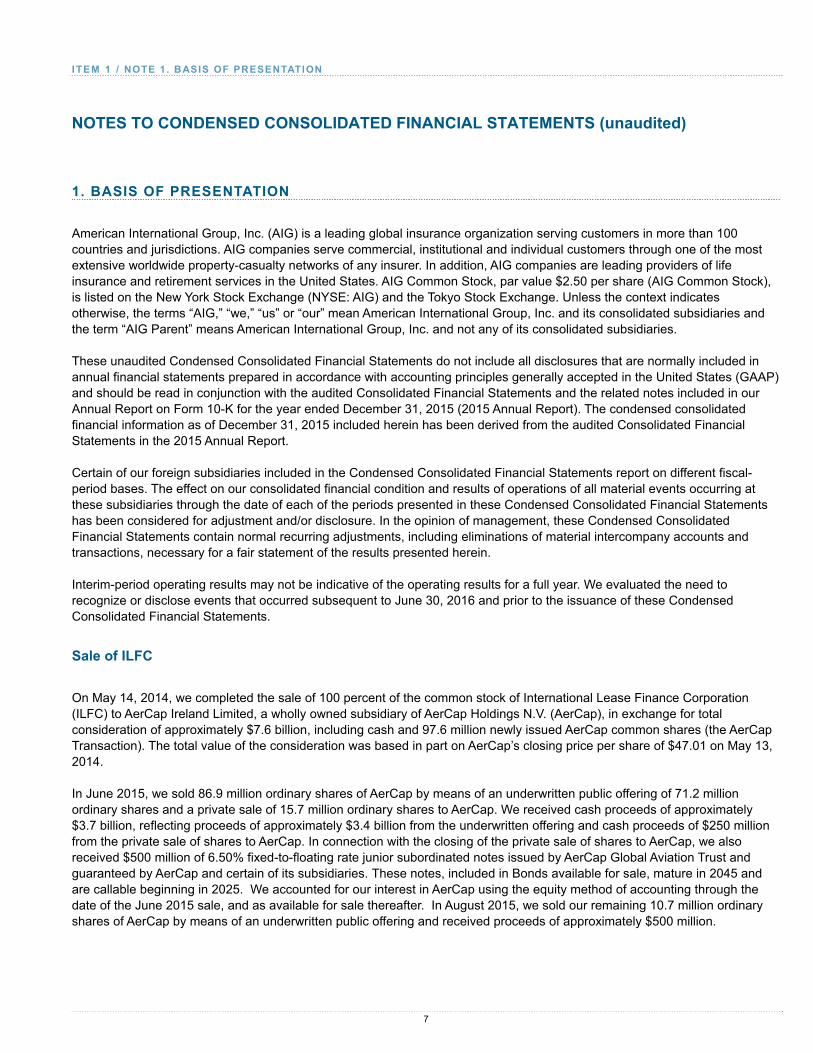
1. BASIS OF PRESENTATION
American International Group, Inc. (AIG) is a leading global insurance organization serving customers in more than 100 countries and jurisdictions. AIG companies serve commercial, institutional and individual customers through one of the most extensive worldwide property-casualty networks of any insurer. In addition, AIG companies are leading providers of life insurance and retirement services in the United States. AIG Common Stock, par value $2.50 per share (AIG Common Stock), is listed on the New York Stock Exchange (NYSE: AIG) and the Tokyo Stock Exchange. Unless the context indicates otherwise, the terms “AIG,” “we,” “us” or “our” mean American International Group, Inc. and its consolidated subsidiaries and the term “AIG Parent” means American International Group, Inc. and not any of its consolidated subsidiaries.
These unaudited Condensed Consolidated Financial Statements do not include all disclosures that are normally included in annual financial statements prepared in accordance with accounting principles generally accepted in the United States (GAAP) and should be read in conjunction with the audited Consolidated Financial Statements and the related notes included in our Annual Report on Form 10-K for the year ended December 31, 2015 (2015 Annual Report). The condensed consolidated financial information as of December 31, 2015 included herein has been derived from the audited Consolidated Financial Statements in the 2015 Annual Report.
Certain of our foreign subsidiaries included in the Condensed Consolidated Financial Statements report on different fiscal-period bases. The effect on our consolidated financial condition and results of operations of all material events occurring at these subsidiaries through the date of each of the periods presented in these Condensed Consolidated Financial Statements has been considered for adjustment and/or disclosure. In the opinion of management, these Condensed Consolidated Financial Statements contain normal recurring adjustments, including eliminations of material intercompany accounts and transactions, necessary for a fair statement of the results presented herein.
Interim-period operating results may not be indicative of the operating results for a full year. We evaluated the need to recognize or disclose events that occurred subsequent to June 30, 2016 and prior to the issuance of these Condensed Consolidated Financial Statements.
Sale of ILFC
On May 14, 2014, we completed the sale of 100 percent of the common stock of International Lease Finance Corporation (ILFC) to AerCap Ireland Limited, a wholly owned subsidiary of AerCap Holdings N.V. (AerCap), in exchange for total consideration of approximately $7.6 billion, including cash and 97.6 million newly issued AerCap common shares (the AerCap Transaction). The total value of the consideration was based in part on AerCap’s closing price per share of $47.01 on May 13, 2014.
In June 2015, we sold 86.9 million ordinary shares of AerCap by means of an underwritten public offering of 71.2 million ordinary shares and a private sale of 15.7 million ordinary shares to AerCap. We received cash proceeds of approximately $3.7 billion, reflecting proceeds of approximately $3.4 billion from the underwritten offering and cash proceeds of $250 million from the private sale of shares to AerCap. In connection with the closing of the private sale of shares to AerCap, we also received $500 million of 6.50% fixed-to-floating rate junior subordinated notes issued by AerCap Global Aviation Trust and guaranteed by AerCap and certain of its subsidiaries. These notes, included in Bonds available for sale, mature in 2045 and are callable beginning in 2025. We accounted for our interest in AerCap using the equity method of accounting through the date of the June 2015 sale, and as available for sale thereafter. In August 2015, we sold our remaining 10.7 million ordinary shares of AerCap by means of an underwritten public offering and received proceeds of approximately $500 million.

I TEM 1 / NOTE 1. BASIS OF PRESENTATION
NOTES TO CONDENSED CONSOLIDATED FINANCIAL STATEMENTS (unaudited)
8
Use of Estimates
The preparation of financial statements in accordance with GAAP requires the application of accounting policies that often involve a significant degree of judgment. Accounting policies that we believe are most dependent on the application of estimates and assumptions are considered our critical accounting estimates and are related to the determination of:
• income tax assets and liabilities, including recoverability of our net deferred tax asset and the predictability of future tax operating profitability of the character necessary to realize the net deferred tax asset;
• liability for unpaid losses and loss adjustment expenses;
• reinsurance assets;
• valuation of future policy benefit liabilities and timing and extent of loss recognition;
• valuation of liabilities for guaranteed benefit features of variable annuity products;
• estimated gross profits to value deferred acquisition costs for investment-oriented products;
• impairment charges, including other-than-temporary impairments on available for sale securities, impairments on other invested assets, including investments in life settlements, and goodwill impairment;
• liability for legal contingencies; and
• fair value measurements of certain financial assets and liabilities.
These accounting estimates require the use of assumptions about matters, some of which are highly uncertain at the time of estimation. To the extent actual experience differs from the assumptions used, our consolidated financial condition, results of operations and cash flows could be materially affected.
2. SUMMARY OF SIGNIFICANT ACCOUNTING POLICIES
Accounting Standards Adopted During 2016
Accounting for Share-Based Payments with Performance Targets
In June 2014, the FASB issued an accounting standard that clarifies the accounting for share-based payments when the terms of an award provide that a performance target could be achieved after the requisite service period. The standard requires that a performance target that affects vesting and that could be achieved after the requisite service period be treated as a performance condition.
We adopted the standard prospectively on its required effective date of January 1, 2016. The adoption of this standard did not have a material effect on our consolidated financial condition, results of operations or cash flows.

I TEM 1 / NOTE 2. SUMMARY OF SIGNIFICANT ACCOUNTING POLICIES
NOTES TO CONDENSED CONSOLIDATED FINANCIAL STATEMENTS (unaudited)
9
Measuring the Financial Assets and the Financial Liabilities of a Consolidated Collateralized Financing Entity
In August 2014, the FASB issued an accounting standard that allows a reporting entity to measure the financial assets and financial liabilities of a qualifying consolidated collateralized financing entity using the fair value of either its financial assets or financial liabilities, whichever is more observable.
We adopted the standard retrospectively on its required effective date of January 1, 2016. The adoption of this standard did not have a material effect on our consolidated financial condition, results of operations or cash flows.
Consolidation: Amendments to the Consolidation Analysis
In February 2015, the FASB issued an accounting standard that affects reporting entities that are required to evaluate whether they should consolidate certain legal entities. Specifically, the amendments modify the evaluation of whether limited partnerships and similar legal entities are variable interest entities (VIEs) or voting interest entities; eliminate the presumption that a general partner should consolidate a limited partnership; affect the consolidation analysis of reporting entities that are involved with VIEs, particularly those that have fee arrangements and related party relationships; and provide a scope exception from consolidation guidance for reporting entities with interests in legal entities that are required to comply with or operate in accordance with requirements that are similar to those in Rule 2a-7 of the Investment Company Act of 1940 for registered money market funds.
We adopted the standard prospectively on its required effective date of January 1, 2016. The adoption of this standard did not have a material effect on our consolidated financial condition, results of operations or cash flows.
Customer’s Accounting for Fees Paid in a Cloud Computing Arrangement
In April 2015, the FASB issued an accounting standard that provides guidance to customers about whether a cloud computing arrangement includes a software license. If a cloud computing arrangement includes a software license the customer should account for the software license element of the arrangement consistent with the acquisition of other software licenses. If a cloud computing arrangement does not include a software license, the customer should account for the arrangement as a service contract. The guidance does not change generally accepted accounting principles applicable to a customer's accounting for service contracts. Consequently, all software licenses will be accounted for consistent with other licenses of intangible assets.
We adopted this standard prospectively on its required effective date of January 1, 2016. The adoption of this standard did not have a material effect on our consolidated financial condition, results of operations or cash flows.
Simplifying the Presentation of Debt Issuance Costs
In April 2015, the FASB issued an accounting standard that amends the guidance for debt issuance costs by requiring such costs to be presented as a deduction to the corresponding debt liability, rather than as an asset, and for the amortization of such costs to be reported as interest expense. The amendments are intended to simplify the presentation of debt issuance costs and make it consistent with the presentation of debt discounts or premiums. The amendments, however, do not change the recognition and measurement guidance applicable to debt issuance costs.
We adopted this standard on a retrospective basis on January 1, 2016, its required effective date. Because the new standard did not affect accounting recognition or measurement of debt issuance costs, the adoption of the standard did not have a material effect on our consolidated financial condition, results of operations or cash flows.
I TEM 1 / NOTE 2. SUMMARY OF SIGNIFICANT ACCOUNTING POLICIES
NOTES TO CONDENSED CONSOLIDATED FINANCIAL STATEMENTS (unaudited)
10
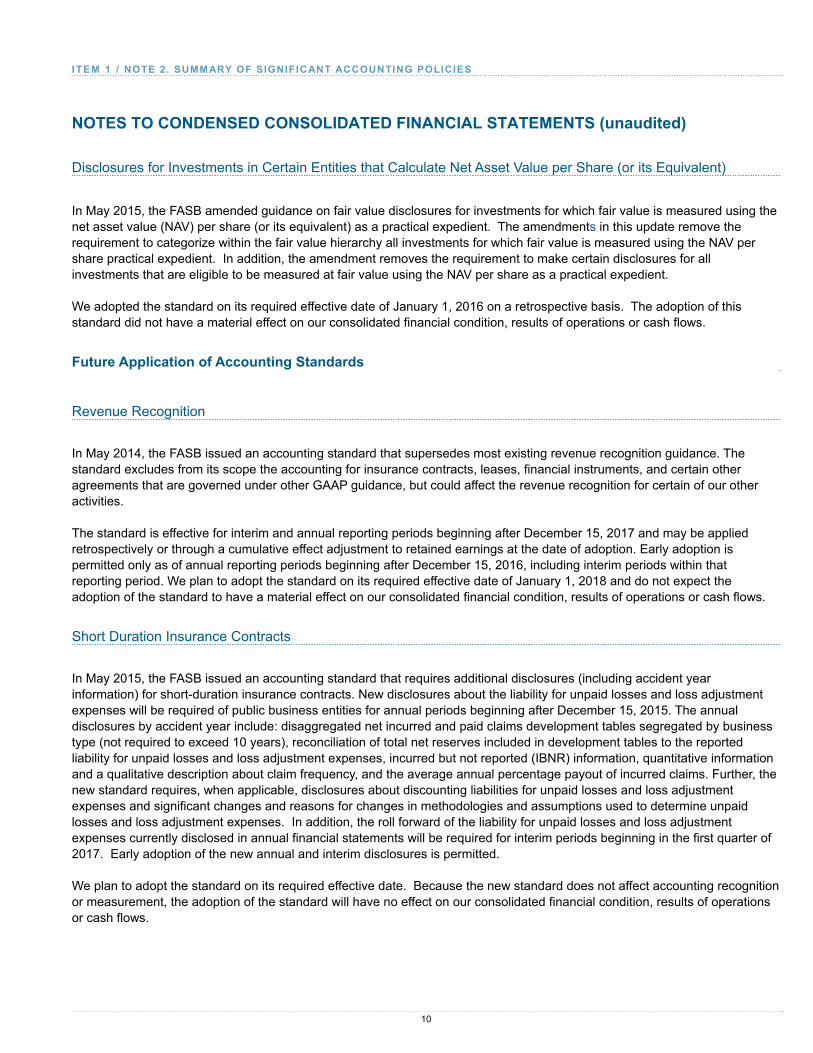
Disclosures for Investments in Certain Entities that Calculate Net Asset Value per Share (or its Equivalent)
In May 2015, the FASB amended guidance on fair value disclosures for investments for which fair value is measured using the net asset value (NAV) per share (or its equivalent) as a practical expedient. The amendments in this update remove the requirement to categorize within the fair value hierarchy all investments for which fair value is measured using the NAV per share practical expedient. In addition, the amendment removes the requirement to make certain disclosures for all investments that are eligible to be measured at fair value using the NAV per share as a practical expedient.
We adopted the standard on its required effective date of January 1, 2016 on a retrospective basis. The adoption of this standard did not have a material effect on our consolidated financial condition, results of operations or cash flows.
Future Application of Accounting Standards
Revenue Recognition
In May 2014, the FASB issued an accounting standard that supersedes most existing revenue recognition guidance. The standard excludes from its scope the accounting for insurance contracts, leases, financial instruments, and certain other agreements that are governed under other GAAP guidance, but could affect the revenue recognition for certain of our other activities.
The standard is effective for interim and annual reporting periods beginning after December 15, 2017 and may be applied retrospectively or through a cumulative effect adjustment to retained earnings at the date of adoption. Early adoption is permitted only as of annual reporting periods beginning after December 15, 2016, including interim periods within that reporting period. We plan to adopt the standard on its required effective date of January 1, 2018 and do not expect the adoption of the standard to have a material effect on our consolidated financial condition, results of operations or cash flows.
Short Duration Insurance Contracts
In May 2015, the FASB issued an accounting standard that requires additional disclosures (including accident year information) for short-duration insurance contracts. New disclosures about the liability for unpaid losses and loss adjustment expenses will be required of public business entities for annual periods beginning after December 15, 2015. The annual disclosures by accident year include: disaggregated net incurred and paid claims development tables segregated by business type (not required to exceed 10 years), reconciliation of total net reserves included in development tables to the reported liability for unpaid losses and loss adjustment expenses, incurred but not reported (IBNR) information, quantitative information and a qualitative description about claim frequency, and the average annual percentage payout of incurred claims. Further, the new standard requires, when applicable, disclosures about discounting liabilities for unpaid losses and loss adjustment expenses and significant changes and reasons for changes in methodologies and assumptions used to determine unpaid losses and loss adjustment expenses. In addition, the roll forward of the liability for unpaid losses and loss adjustment expenses currently disclosed in annual financial statements will be required for interim periods beginning in the first quarter of 2017. Early adoption of the new annual and interim disclosures is permitted.
We plan to adopt the standard on its required effective date. Because the new standard does not affect accounting recognition or measurement, the adoption of the standard will have no effect on our consolidated financial condition, results of operations or cash flows.

I TEM 1 / NOTE 2. SUMMARY OF SIGNIFICANT ACCOUNTING POLICIES
NOTES TO CONDENSED CONSOLIDATED FINANCIAL STATEMENTS (unaudited)
11
Recognition and Measurement of Financial Assets and Financial Liabilities
In January 2016, the FASB issued an accounting standard that affects the recognition, measurement, presentation, and disclosure of financial instruments. Specifically, under the new standard, equity investments (other than those accounted for using the equity method of accounting or those subject to consolidation) will be measured at fair value with changes in fair value recognized in earnings. Also, for those financial liabilities for which fair value option accounting has been elected, the new standard requires changes in fair value due to instrument-specific credit risk to be presented separately in other comprehensive income. The standard updates certain fair value disclosure requirements for financial instruments carried at amortized cost.
The standard is effective for interim and annual reporting periods beginning after December 15, 2017. Early adoption of certain provisions is permitted. We are assessing the impact of the standard on our consolidated financial condition, results of operations and cash flows.
Leases
In February 2016, the FASB issued an accounting standard that will require lessees with lease terms of more than 12 months to recognize a right of use asset and a corresponding lease liability on their balance sheets. For income statement purposes, the FASB retained a dual model, requiring leases to be classified as either operating leases or finance leases.
The standard is effective for fiscal years, and interim periods within those fiscal years, beginning after December 15, 2018, with early adoption permitted using a modified retrospective approach. We are assessing the impact of the standard on our consolidated financial condition, results of operations and cash flows.
Derivative Contract Novations
In March 2016, the FASB issued an accounting standard that clarifies that a change in the counterparty (novation) to a derivative instrument that has been designated as a hedging instrument does not, in and of itself, require de-designation of that hedging relationship provided that all other hedge accounting criteria continue to be met.
The standard is effective for interim and annual reporting periods beginning after December 15, 2016, with early adoption permitted. We do not expect the adoption of the standard to have a material effect on our consolidated financial condition, results of operations or cash flows.
Contingent Put and Call Options in Debt Instruments
In March 2016, the FASB issued an accounting standard that clarifies the requirements for assessing whether contingent call (put) options that can accelerate the payment of principal on debt instruments are clearly and closely related to their debt hosts. The standard requires an evaluation of embedded call (put) options solely on a four-step decision sequence that requires an entity to consider whether (1) the amount paid upon settlement is adjusted based on changes in an index, (2) the amount paid upon settlement is indexed to an underlying other than interest rates or credit risk, (3) the debt involves a substantial premium or discount and (4) the put or call option is contingently exercisable.
The standard is effective for interim and annual reporting periods beginning after December 15, 2016, with early adoption permitted. We do not expect the adoption of the standard to have a material effect on our consolidated financial condition, results of operations or cash flows.

I TEM 1 / NOTE 2. SUMMARY OF SIGNIFICANT ACCOUNTING POLICIES
NOTES TO CONDENSED CONSOLIDATED FINANCIAL STATEMENTS (unaudited)
12
Simplifying the Transition to the Equity Method of Accounting
In March 2016, the FASB issued an accounting standard that eliminates the requirement that when an investment qualifies for use of the equity method as a result of an increase in the level of ownership interest or degree of influence, an investor must adjust the investment, results of operations, and retained earnings retroactively on a step-by-step basis as if the equity method had been in effect during all previous periods during which the investment had been held.
The standard is effective for interim and annual reporting periods beginning after December 15, 2016, with early adoption permitted. We do not expect the adoption of the standard to have a material effect on our consolidated financial condition, results of operations or cash flows.
Improvements to Employee Share-Based Payment Accounting
In March 2016, the FASB issued a standard that simplifies several aspects of the accounting for share-based compensation, including the accounting for income taxes, forfeitures, and statutory tax withholding requirements, as well as classification on the statement of cash flows.
The standard is effective for interim and annual reporting periods beginning after December 15, 2016, with early adoption permitted. We do not expect the adoption of the standard to have a material effect on our consolidated financial condition, results of operations or cash flows.
Calculation of Credit Losses
In June 2016, the FASB issued an accounting standard that will change how entities account for credit losses for most financial assets. The standard will replace the existing incurred loss impairment model with a new “current expected credit loss model” and will apply to financial assets subject to credit losses, those measured at amortized cost and certain off-balance sheet credit exposures. The impairment for available-for-sale debt securities will be measured in a similar manner, except that losses will be recognized as allowances rather than reductions in the amortized cost of the securities. The standard will also require additional information to be disclosed in the footnotes.
The standard is effective for interim and annual reporting periods beginning after December 15, 2019, with early adoption permitted for annual and interim periods after December 15, 2018. We are assessing the impact of the standard on our consolidated financial condition, results of operations or cash flows.

I TEM 1 / NOTE 3. SEGMENT INFORMATION
NOTES TO CONDENSED CONSOLIDATED FINANCIAL STATEMENTS (unaudited)
13
3. SEGMENT INFORMATION
We report our results of operations consistent with the manner in which our chief operating decision makers review the business to assess performance and allocate resources through two reportable segments: Commercial Insurance and Consumer Insurance as well as a Corporate and Other category. The Corporate and Other category consists of businesses and items not allocated to our reportable segments.
We evaluate performance based on revenues and pre-tax operating income (loss). Pre-tax operating income (loss) is derived by excluding certain items from net income (loss) attributable to AIG. See the table below for the items excluded from pre-tax operating income (loss).
The following tables present our operations by reportable segment:
2016 2015
Pre-Tax Pre-Tax
Three Months Ended June 30, Total Operating Total Operating
(in millions) Revenues Income (Loss) Revenues Income (Loss)
Commercial Insurance
Property Casualty $ 5,540 $ 791 $ 6,233 $ 1,192
Mortgage Guaranty 275 187 261 157
Institutional Markets 695 110 1,172 151
Total Commercial Insurance 6,510 1,088 7,666 1,500
Consumer Insurance
Retirement 2,209 741 2,465 804
Life 1,690 184 1,632 149
Personal Insurance 2,915 179 2,869 70
Total Consumer Insurance 6,814 1,104 6,966 1,023
Corporate and Other* 450 (544) 1,119 372
AIG consolidation and elimination (205) (28) (116) (27)
Total AIG consolidated operating revenues and pre-tax operating income 13,569 1,620 15,635 2,868
Reconciling items from Total revenues and Pre-tax operating income
(loss) to revenues and pre-tax income (loss):
Changes in fair values of securities used to hedge guaranteed
living benefits 120 120 (87) (87)
Changes in benefit reserves and DAC, VOBA and SIA related to
net realized capital gains - (64) - (28)
Other income - net - 5 - -
Loss on extinguishment of debt - (7) - (342)
Net realized capital gains 1,042 1,042 126 126
Income (loss) from divested businesses - 225 (33) (34)
Non-operating litigation reserves and settlements 7 7 76 49
Reserve development related to non-operating run-off insurance business - - - -
Restructuring and other costs - (90) - -
Other (14) - (18) -
Revenues and pre-tax income $ 14,724 $ 2,858 $ 15,699 $ 2,552

I TEM 1 / NOTE 3. SEGMENT INFORMATION
NOTES TO CONDENSED CONSOLIDATED FINANCIAL STATEMENTS (unaudited)
14
2016 2015
Pre-Tax Pre-Tax
Six Months Ended June 30, Total Operating Total Operating
(in millions) Revenues Income (Loss) Revenues Income (Loss)
Commercial Insurance
Property Casualty $ 10,818 $ 1,511 $ 12,189 $ 2,362
Mortgage Guaranty 536 350 525 302
Institutional Markets 1,314 116 1,796 298
Total Commercial Insurance 12,668 1,977 14,510 2,962
Consumer Insurance
Retirement 4,323 1,202 4,853 1,604
Life 3,287 289 3,245 320
Personal Insurance 5,736 401 5,731 44
Total Consumer Insurance 13,346 1,892 13,829 1,968
Corporate and Other* 656 (1,277) 2,161 534
AIG consolidation and elimination (364) (18) (275) (69)
Total AIG consolidated operating revenues and pre-tax operating income 26,306 2,574 30,225 5,395
Reconciling items from Total revenues and Pre-tax operating income
(loss) to revenues and pre-tax income (loss):
Changes in fair values of securities used to hedge guaranteed
living benefits 253 253 (43) (43)
Changes in benefit reserves and DAC, VOBA and SIA related to
net realized capital gains - (24) - (82)
Other income - net - 12 - -
Loss on extinguishment of debt - (90) - (410)
Net realized capital gains (losses) (64) (64) 1,467 1,467
Income (loss) from divested businesses - 223 (48) (55)
Non-operating litigation reserves and settlements 41 38 91 56
Reserve development related to non-operating run-off insurance business - - - -
Restructuring and other costs - (278) - -
Other (33) - (18) -
Revenues and pre-tax income $ 26,503 $ 2,644 $ 31,674 $ 6,328
* Corporate and Other includes income from assets held by AIG Parent and other corporate subsidiaries.
4. FAIR VALUE MEASUREMENTS
Fair Value Measurements on a Recurring Basis
Assets and liabilities recorded at fair value in the Condensed Consolidated Balance Sheets are measured and classified in accordance with a fair value hierarchy consisting of three “levels” based on the observability of valuation inputs:
Level 1: Fair value measurements based on quoted prices (unadjusted) in active markets that we have the ability to access for identical assets or liabilities. Market price data generally is obtained from exchange or dealer markets. We do not adjust the quoted price for such instruments.
Level 2: Fair value measurements based on inputs other than quoted prices included in Level 1 that are observable for the asset or liability, either directly or indirectly. Level 2 inputs include quoted prices for similar assets and liabilities in active markets, quoted prices for identical or similar assets or liabilities in markets that are not active, and inputs other than quoted

I TEM 1 / NOTE 4. FAIR VALUE MEASUREMENTS
NOTES TO CONDENSED CONSOLIDATED FINANCIAL STATEMENTS (unaudited)
15
prices that are observable for the asset or liability, such as interest rates and yield curves that are observable at commonly quoted intervals.
Level 3: Fair value measurements based on valuation techniques that use significant inputs that are unobservable. Both observable and unobservable inputs may be used to determine the fair values of positions classified in Level 3. The circumstances for using these measurements include those in which there is little, if any, market activity for the asset or liability. Therefore, we must make certain assumptions about the inputs a hypothetical market participant would use to value that asset or liability.
In certain cases, the inputs used to measure fair value may fall into different levels of the fair value hierarchy. In such cases, the level in the fair value hierarchy within which the fair value measurement in its entirety falls is determined based on the lowest level input that is significant to the fair value measurement in its entirety.
Assets and Liabilities Measured at Fair Value on a Recurring Basis
The following table presents information about assets and liabilities measured at fair value on a recurring basis and indicates the level of the fair value measurement based on the observability of the inputs used:
June 30, 2016 Counterparty Cash
(in millions) Level 1 Level 2 Level 3 Netting(b) Collateral Total
Assets:
Bonds available for sale:
U.S. government and government sponsored entities $ 19 $ 2,248 $ - $ - $ - $ 2,267
Obligations of states, municipalities and political subdivisions - 26,464 2,313 - - 28,777
Non-U.S. governments 654 19,410 28 - - 20,092
Corporate debt - 141,325 836 - - 142,161
RMBS - 20,665 16,779 - - 37,444
CMBS - 12,679 2,295 - - 14,974
CDO/ABS - 9,299 7,075 - - 16,374
Total bonds available for sale 673 232,090 29,326 - - 262,089
Other bond securities:
U.S. government and government sponsored entities 136 3,459 - - - 3,595
Obligations of states, municipalities and political subdivisions - - - - - -
Non-U.S. governments - 55 - - - 55
Corporate debt - 1,949 18 - - 1,967
RMBS - 439 1,486 - - 1,925
CMBS - 498 168 - - 666
CDO/ABS - 815 6,312 - - 7,127
Total other bond securities 136 7,215 7,984 - - 15,335
Equity securities available for sale:
Common stock 1,117 - - - - 1,117
Preferred stock 23 - - - - 23
Mutual funds 501 1 - - - 502
Total equity securities available for sale 1,641 1 - - - 1,642
Other equity securities 647 - 14 - - 661
Mortgage and other loans receivable - - 11 - - 11
Other invested assets(a) - 2 241 - - 243

I TEM 1 / NOTE 4. FAIR VALUE MEASUREMENTS
NOTES TO CONDENSED CONSOLIDATED FINANCIAL STATEMENTS (unaudited)
16
Derivative assets:
Interest rate contracts - 5,014 15 - - 5,029
Foreign exchange contracts - 1,495 1 - - 1,496
Equity contracts 104 123 52 - - 279
Credit contracts - - 3 - - 3
Other contracts - - 23 - - 23
Counterparty netting and cash collateral - - - (2,192) (3,233) (5,425)
Total derivative assets 104 6,632 94 (2,192) (3,233) 1,405
Short-term investments 2,453 1,496 - - - 3,949
Separate account assets 74,755 5,817 - - - 80,572
Total $ 80,409 $ 253,253 $ 37,670 $ (2,192) $ (3,233) $ 365,907
Liabilities:
Policyholder contract deposits $ - $ 26 $ 3,990 $ - $ - $ 4,016
Other policyholder funds 5 - - - - 5
Derivative liabilities:
Interest rate contracts - 2,965 61 - - 3,026
Foreign exchange contracts - 1,441 10 - - 1,451
Equity contracts - 5 - - - 5
Credit contracts - - 376 - - 376
Other contracts - - 125 - - 125
Counterparty netting and cash collateral - - - (2,192) (738) (2,930)
Total derivative liabilities - 4,411 572 (2,192) (738) 2,053
Long-term debt - 3,680 67 - - 3,747
Other liabilities 114 127 - - - 241
Total $ 119 $ 8,244 $ 4,629 $ (2,192) $ (738) $ 10,062
December 31, 2015 Counterparty Cash
(in millions) Level 1 Level 2 Level 3 Netting(b) Collateral Total
Assets:
Bonds available for sale:
U.S. government and government sponsored entities $ - $ 1,844 $ - $ - $ - $ 1,844
Obligations of states, municipalities and political subdivisions - 25,199 2,124 - - 27,323
Non-U.S. governments 683 17,480 32 - - 18,195
Corporate debt - 134,618 1,370 - - 135,988
RMBS - 19,690 16,537 - - 36,227
CMBS - 10,986 2,585 - - 13,571
CDO/ABS - 8,928 6,169 - - 15,097
Total bonds available for sale 683 218,745 28,817 - - 248,245
Other bond securities:
U.S. government and government sponsored entities - 3,369 - - - 3,369
Obligations of states, municipalities and political subdivisions - 75 - - - 75
Non-U.S. governments - 50 - - - 50
Corporate debt - 2,018 17 - - 2,035
RMBS - 649 1,581 - - 2,230
CMBS - 557 193 - - 750
CDO/ABS - 1,218 7,055 - - 8,273
Total other bond securities - 7,936 8,846 - - 16,782

I TEM 1 / NOTE 4. FAIR VALUE MEASUREMENTS
NOTES TO CONDENSED CONSOLIDATED FINANCIAL STATEMENTS (unaudited)
17
Equity securities available for sale:
Common stock 2,401 - - - - 2,401
Preferred stock 22 - - - - 22
Mutual funds 491 1 - - - 492
Total equity securities available for sale 2,914 1 - - - 2,915
Other equity securities 906 1 14 - - 921
Mortgage and other loans receivable - - 11 - - 11
Other invested assets(a) 2 1 332 - - 335
Derivative assets:
Interest rate contracts - 3,150 12 - - 3,162
Foreign exchange contracts - 766 - - - 766
Equity contracts 91 32 54 - - 177
Credit contracts - - 3 - - 3
Other contracts - 2 21 - - 23
Counterparty netting and cash collateral - - - (1,268) (1,554) (2,822)
Total derivative assets 91 3,950 90 (1,268) (1,554) 1,309
Short-term investments 1,416 1,175 - - - 2,591
Separate account assets 73,699 5,875 - - - 79,574
Total $ 79,711 $ 237,684 $ 38,110 $ (1,268) $ (1,554) $ 352,683
Liabilities:
Policyholder contract deposits $ - $ 36 $ 2,289 $ - $ - $ 2,325
Other policyholder funds 6 - - - - 6
Derivative liabilities:
Interest rate contracts - 2,137 62 - - 2,199
Foreign exchange contracts - 1,197 7 - - 1,204
Equity contracts - 68 - - - 68
Credit contracts - - 508 - - 508
Other contracts - - 69 - - 69
Counterparty netting and cash collateral - - - (1,268) (760) (2,028)
Total derivative liabilities - 3,402 646 (1,268) (760) 2,020
Long-term debt - 3,487 183 - - 3,670
Other liabilities - 62 - - - 62
Total $ 6 $ 6,987 $ 3,118 $ (1,268) $ (760) $ 8,083
(a) Excludes investments that are measured at fair value using the NAV per share (or its equivalent), which totaled $7.0 billion and $8.6 billion as of June 30, 2016 and December 31, 2015, respectively.
(b) Represents netting of derivative exposures covered by qualifying master netting agreements.
Transfers of Level 1 and Level 2 Assets and Liabilities
Our policy is to record transfers of assets and liabilities between Level 1 and Level 2 at their fair values as of the end of each reporting period, consistent with the date of the determination of fair value. Assets are transferred out of Level 1 when they are no longer transacted with sufficient frequency and volume in an active market. Conversely, assets are transferred from Level 2 to Level 1 when transaction volume and frequency are indicative of an active market.
During the three- and six-month periods ended June 30, 2016, we transferred $229 million and $312 million, respectively, of securities issued by Non-U.S. government entities from Level 1 to Level 2, as they are no longer considered actively traded. For similar reasons, during the three- and six-month periods ended June 30, 2016 we transferred $16 million of securities issued by the U.S. government and government sponsored entities from Level 1 to Level 2. We had no material transfers from Level 2 to Level 1 during the three- and six-month periods ended June 30, 2016.

I TEM 1 / NOTE 4. FAIR VALUE MEASUREMENTS
NOTES TO CONDENSED CONSOLIDATED FINANCIAL STATEMENTS (unaudited)
18
During the three- and six-month periods ended June 30, 2015, we transferred $190 million and $262 million, respectively, of securities issued by Non-U.S. government entities from Level 1 to Level 2, as they are no longer considered actively traded. For similar reasons, during the three- and six-month periods ended June 30, 2015, we transferred $65 million and $180 million, respectively, of securities issued by the U.S. government and government sponsored entities from Level 1 to Level 2. We had no material transfers from Level 2 to Level 1 during the three- and six-month periods ended June 30, 2015.
Changes in Level 3 Recurring Fair Value Measurements
The following tables present changes during the three- and six-month periods ended June 30, 2016 and 2015 in Level 3 assets and liabilities measured at fair value on a recurring basis, and the realized and unrealized gains (losses) related to the Level 3 assets and liabilities in the Condensed Consolidated Balance Sheets at June 30, 2016 and 2015:
Net Changes in
Realized and Unrealized Gains
Unrealized Purchases, (Losses) Included
Fair Value Gains (Losses) Other Sales, Gross Gross Fair Value in Income on
Beginning Included Comprehensive Issues and Transfers Transfers End Instruments Held
(in millions) of Period in Income Income (Loss) Settlements, Net In Out of Period at End of Period
Three Months Ended June 30, 2016
Assets:
Bonds available for sale:
Obligations of states, municipalities
and political subdivisions $ 2,196 $ 2 $ 136 $ (21) $ - $ - $ 2,313 $ -
Non-U.S. governments 30 - - 2 - (4) 28 -
Corporate debt 1,024 2 7 (65) 193 (325) 836 -
RMBS 16,162 234 61 61 261 - 16,779 -
CMBS 2,368 16 10 (87) - (12) 2,295 -
CDO/ABS 6,592 8 93 382 - - 7,075 -
Total bonds available for sale 28,372 262 307 272 454 (341) 29,326 -
Other bond securities:
Corporate debt 18 1 - (1) - - 18 1
RMBS 1,513 14 - (41) - - 1,486 (19)
CMBS 170 - - (2) - - 168 9
CDO/ABS 6,576 109 - (308) - (65) 6,312 (60)
Total other bond securities 8,277 124 - (352) - (65) 7,984 (69)
Equity securities available for sale:
Common stock - - - - - - - -
Total equity securities available for sale - - - - - - - -
Other equity securities 15 (1) - - - - 14 -
Mortgage and other loans receivable 11 - - - - - 11 -
Other invested assets 263 (12) 6 (16) - - 241 -
Total $ 36,938 $ 373 $ 313 $ (96) $ 454 $ (406) $ 37,576 $ (69)

I TEM 1 / NOTE 4. FAIR VALUE MEASUREMENTS
NOTES TO CONDENSED CONSOLIDATED FINANCIAL STATEMENTS (unaudited)
19
Net Changes in
Realized and Unrealized Gains
Unrealized Purchases, (Losses) Included
Fair Value (Gains) Losses Other Sales, Gross Gross Fair Value in Income on
Beginning Included Comprehensive Issues and Transfers Transfers End Instruments Held
(in millions) of Period in Income Income (Loss) Settlements, Net In Out of Period at End of Period
Liabilities:
Policyholder contract deposits $ 3,251 $ 598 $ - $ 141 $ - $ - $ 3,990 $ 16
Derivative liabilities, net:
Interest rate contracts 48 3 - (5) - - 46 -
Foreign exchange contracts 9 1 - (1) - - 9 (1)
Equity contracts (51) (4) - 3 - - (52) 3
Commodity contracts - - - - - - - -
Credit contracts 490 (28) - (89) - - 373 18
Other contracts 121 (24) - 5 - - 102 23
Total derivative liabilities, net(a) 617 (52) - (87) - - 478 43
Long-term debt(b) 184 (2) - (2) - (113) 67 -
Total $ 4,052 $ 544 $ - $ 52 $ - $ (113) $ 4,535 $ 59
Net Changes in
Realized and Unrealized Gains
Unrealized Purchases, (Losses) Included
Fair Value Gains (Losses) Other Sales, Gross Gross Fair Value in Income on
Beginning Included Comprehensive Issues and Transfers Transfers End Instruments Held
(in millions) of Period(a) in Income Income (Loss) Settlements, Net In Out of Period at End of Period
Six Months Ended June 30, 2016
Assets:
Bonds available for sale:
Obligations of states, municipalities
and political subdivisions $ 2,124 $ 2 $ 194 $ (7) $ - $ - $ 2,313 $ -
Non-U.S. governments 32 - (2) 2 - (4) 28 -
Corporate debt 1,370 3 (17) (36) 314 (798) 836 -
RMBS 16,537 479 (359) (172) 294 - 16,779 -
CMBS 2,585 58 (78) (168) - (102) 2,295 -
CDO/ABS 6,169 20 43 820 23 - 7,075 -
Total bonds available for sale 28,817 562 (219) 439 631 (904) 29,326 -
Other bond securities:
Corporate debt 17 2 - (1) - - 18 3
RMBS 1,581 (23) - (54) - (18) 1,486 (61)
CMBS 193 (2) - (23) - - 168 7
CDO/ABS 7,055 (24) - (719) 65 (65) 6,312 (364)
Total other bond securities 8,846 (47) - (797) 65 (83) 7,984 (415)
Equity securities available for sale:
Common stock - - - - - - - -
Total equity securities available for sale - - - - - - - -
Other equity securities 14 - - - - - 14 1
Mortgage and other loans receivable 11 - - - - - 11 -
Other invested assets 332 (1) 1 (37) - (54) 241 -
Total $ 38,020 $ 514 $ (218) $ (395) $ 696 $ (1,041) $ 37,576 $ (414)

I TEM 1 / NOTE 4. FAIR VALUE MEASUREMENTS
NOTES TO CONDENSED CONSOLIDATED FINANCIAL STATEMENTS (unaudited)
20
Net Changes in
Realized and Unrealized Gains
Unrealized Purchases, (Losses) Included
Fair Value (Gains) Losses Other Sales, Gross Gross Fair Value in Income on
Beginning Included Comprehensive Issues and Transfers Transfers End Instruments Held
(in millions) of Period(a) in Income Income (Loss) Settlements, Net In Out of Period at End of Period
Liabilities:
Policyholder contract deposits $ 2,289 $ 1,443 $ - $ 258 $ - $ - $ 3,990 $ 37
Derivative liabilities, net:
Interest rate contracts 50 7 - (11) - - 46 (5)
Foreign exchange contracts 7 2 - - - - 9 (1)
Equity contracts (54) - - 2 - - (52) -
Commodity contracts - - - - - - - -
Credit contracts 505 (34) - (98) - - 373 28
Other contracts 48 30 - 24 - - 102 (31)
Total derivative liabilities, net(a) 556 5 - (83) - - 478 (9)
Long-term debt(b) 183 - - (3) - (113) 67 3
Total $ 3,028 $ 1,448 $ - $ 172 $ - $ (113) $ 4,535 $ 31
Net Changes in
Realized and Unrealized Gains
Unrealized Purchases, (Losses) Included
Fair value Gains (Losses) Other Sales, Gross Gross Fair value in Income on
Beginning Included Comprehensive Issues and Transfers Transfers End Instruments Held
(in millions) of Period in Income Income (Loss) Settlements, Net In Out of Period at End of Period
Three Months Ended June 30, 2015
Assets:
Bonds available for sale:
Obligations of states, municipalities
and political subdivisions $ 2,256 $ - $ (124) $ 93 $ - $ (45) $ 2,180 $ -
Non-U.S. governments 34 - (1) - - - 33 -
Corporate debt 1,827 14 (50) (85) 412 - 2,118 -
RMBS 17,345 281 (99) (430) - - 17,097 -
CMBS 2,694 22 (40) 17 - (16) 2,677 -
CDO/ABS 6,453 97 (196) (283) - - 6,071 -
Total bonds available for sale 30,609 414 (510) (688) 412 (61) 30,176 -
Other bond securities:
Corporate debt 16 - - - - - 16 -
RMBS 1,288 45 - 16 15 (27) 1,337 31
CMBS 269 8 - (54) - - 223 1
CDO/ABS 7,850 265 - (688) - (1) 7,426 93
Total other bond securities 9,423 318 - (726) 15 (28) 9,002 125
Equity securities available for sale:
Common stock 1 2 - (3) - - - -
Total equity securities available for sale 1 2 - (3) - - - -
Other equity securities 22 - - - - - 22 -
Mortgage and other loans receivable 6 - - - - - 6 -
Other invested assets 422 62 4 (51) - - 437 -
Total $ 40,483 $ 796 $ (506) $ (1,468) $ 427 $ (89) $ 39,643 $ 125

I TEM 1 / NOTE 4. FAIR VALUE MEASUREMENTS
NOTES TO CONDENSED CONSOLIDATED FINANCIAL STATEMENTS (unaudited)
21
Net Changes in
Realized and Unrealized Gains
Unrealized Purchases, (Losses) Included
Fair value (Gains) Losses Other Sales, Gross Gross Fair value in Income on
Beginning Included Comprehensive Issues and Transfers Transfers End Instruments Held
of Period in Income Income (Loss) Settlements, Net In Out of Period at End of Period
Liabilities:
Policyholder contract deposits $ 1,835 $ (736) $ - $ 133 $ - $ - $ 1,232 $ 110
Derivative liabilities, net:
Interest rate contracts 69 (4) - (3) - - 62 3
Foreign exchange contracts 8 (2) - 1 - - 7 1
Equity contracts (66) 2 - 1 - - (63) (3)
Credit contracts 791 (13) - (227) - - 551 22
Other contracts 59 (59) 2 14 - - 16 33
Total derivatives liabilities, net(a) 861 (76) 2 (214) - - 573 56
Long-term debt(b) 186 13 - (6) - - 193 (6)
Total $ 2,882 $ (799) $ 2 $ (87) $ - $ - $ 1,998 $ 160
Net Changes in
Realized and Unrealized Gains
Unrealized Purchases, (Losses) Included
Fair value Gains (Losses) Other Sales, Gross Gross Fair value in Income on
Beginning Included Comprehensive Issues and Transfers Transfers End Instruments Held
(in millions) of Period in Income Income (Loss) Settlements, Net In Out of Period at End of Period
Six Months Ended June 30, 2015
Assets:
Bonds available for sale:
Obligations of states, municipalities
and political subdivisions(c) $ 2,159 $ 1 $ (79) $ 158 $ - $ (59) $ 2,180 $ -
Non-U.S. governments 30 - (1) 4 - - 33 -
Corporate debt 1,883 14 (33) (146) 456 (56) 2,118 -
RMBS 16,805 539 (171) (76) - - 17,097 -
CMBS 2,696 46 (30) 47 - (82) 2,677 -
CDO/ABS 6,110 130 (167) 119 - (121) 6,071 -
Total bonds available for sale 29,683 730 (481) 106 456 (318) 30,176 -
Other bond securities:
Corporate debt - - - - 16 - 16 (1)
RMBS 1,105 26 - 220 44 (58) 1,337 1
CMBS 369 8 - (154) - - 223 8
CDO/ABS 7,449 397 - (926) 581 (75) 7,426 51
Total other bond securities 8,923 431 - (860) 641 (133) 9,002 59
Equity securities available for sale:
Common stock 1 2 - (3) - - - -
Total equity securities available for sale 1 2 - (3) - - - -
Other equity securities - - - - 22 - 22 -
Mortgage and other loans receivable 6 - - - - - 6 -
Other invested assets 1,042 472 (488) (589) - - 437 -
Total $ 39,655 $ 1,635 $ (969) $ (1,346) $ 1,119 $ (451) $ 39,643 $ 59
I TEM 1 / NOTE 4. FAIR VALUE MEASUREMENTS
NOTES TO CONDENSED CONSOLIDATED FINANCIAL STATEMENTS (unaudited)
22
Net Changes in
Realized and Unrealized Gains
Unrealized Purchases, (Losses) Included
Fair value (Gains) Losses Other Sales, Gross Gross Fair value in Income on
Beginning Included Comprehensive Issues and Transfers Transfers End Instruments Held
(in millions) of Period in Income Income (Loss) Settlements, Net In Out of Period at End of Period
Liabilities:
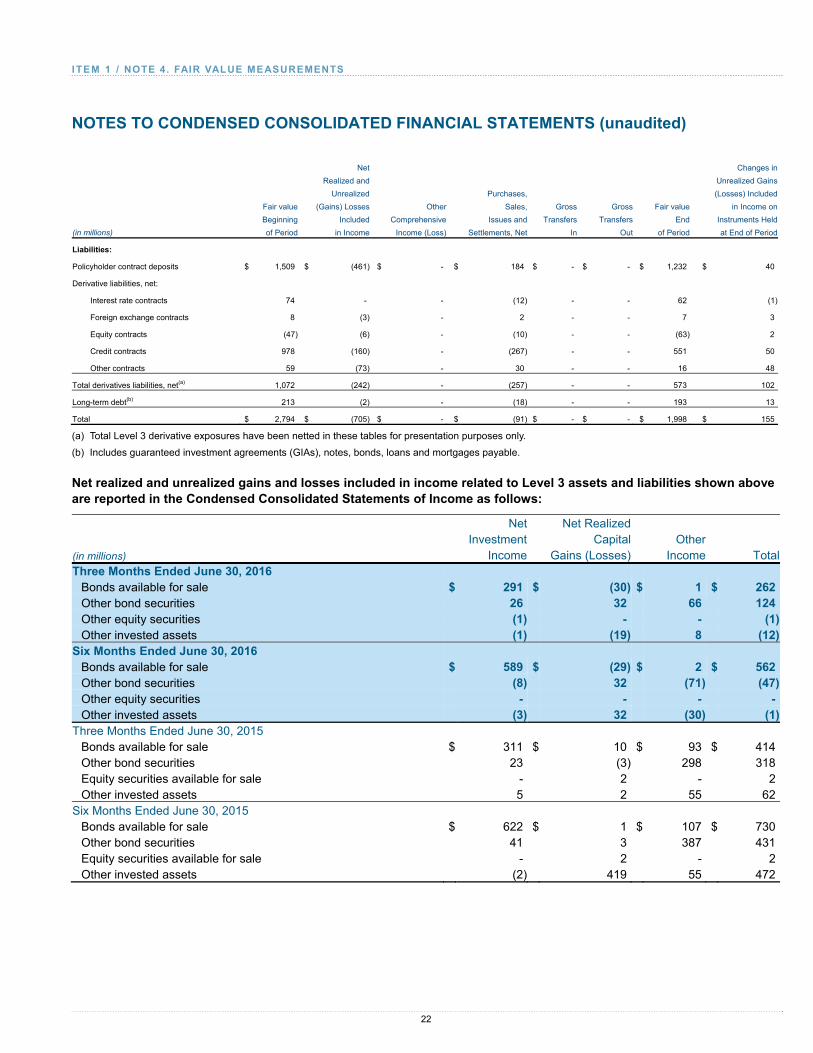
Policyholder contract deposits $ 1,509 $ (461) $ - $ 184 $ - $ - $ 1,232 $ 40
Derivative liabilities, net:
Interest rate contracts 74 - - (12) - - 62 (1)
Foreign exchange contracts 8 (3) - 2 - - 7 3
Equity contracts (47) (6) - (10) - - (63) 2
Credit contracts 978 (160) - (267) - - 551 50
Other contracts 59 (73) - 30 - - 16 48
Total derivatives liabilities, net(a) 1,072 (242) - (257) - - 573 102
Long-term debt(b) 213 (2) - (18) - - 193 13
Total $ 2,794 $ (705) $ - $ (91) $ - $ - $ 1,998 $ 155
(a) Total Level 3 derivative exposures have been netted in these tables for presentation purposes only.
(b) Includes guaranteed investment agreements (GIAs), notes, bonds, loans and mortgages payable.
Net realized and unrealized gains and losses included in income related to Level 3 assets and liabilities shown above are reported in the Condensed Consolidated Statements of Income as follows:
Net Net Realized Investment Capital Other(in millions) Income Gains (Losses) Income TotalThree Months Ended June 30, 2016
Bonds available for sale $ 291 $ (30) $ 1 $ 262Other bond securities 26 32 66 124Other equity securities (1) - - (1)Other invested assets (1) (19) 8 (12)
Six Months Ended June 30, 2016 Bonds available for sale $ 589 $ (29) $ 2 $ 562Other bond securities (8) 32 (71) (47)Other equity securities - - - -Other invested assets (3) 32 (30) (1)
Three Months Ended June 30, 2015 Bonds available for sale $ 311 $ 10 $ 93 $ 414Other bond securities 23 (3) 298 318Equity securities available for sale - 2 - 2Other invested assets 5 2 55 62
Six Months Ended June 30, 2015 Bonds available for sale $ 622 $ 1 $ 107 $ 730Other bond securities 41 3 387 431Equity securities available for sale - 2 - 2Other invested assets (2) 419 55 472

I TEM 1 / NOTE 4. FAIR VALUE MEASUREMENTS
NOTES TO CONDENSED CONSOLIDATED FINANCIAL STATEMENTS (unaudited)
23
Net Net Realized Investment Capital Other(in millions) Income Gains (Losses) Income TotalThree Months Ended June 30, 2016
Policyholder contract deposits $ - $ 598 $ - $ 598Derivative liabilities, net - - (52) (52)Long-term debt - - (2) (2)
Six Months Ended June 30, 2016 Policyholder contract deposits $ - $ 1,443 $ - $ 1,443Derivative liabilities, net - 4 1 5Long-term debt - - - -
Three Months Ended June 30, 2015 Policyholder contract deposits $ - $ (736) $ - $ (736)Derivative liabilities, net 19 1 (96) (76)Long-term debt - - 13 13
Six Months Ended June 30, 2015 Policyholder contract deposits $ - $ (461) $ - $ (461)Derivative liabilities, net - (5) (237) (242)Long-term debt - - (2) (2)
The following table presents the gross components of purchases, sales, issues and settlements, net, shown above, for the three- and six-month periods ended June 30, 2016 and 2015 related to Level 3 assets and liabilities in the Condensed Consolidated Balance Sheets:
Purchases,
Sales, Issues and
(in millions) Purchases Sales Settlements Settlements, Net(a)
Three Months Ended June 30, 2016
Assets:
Bonds available for sale:
Obligations of states, municipalities and political subdivisions $ 17 $ (7) $ (31) $ (21)
Non-U.S. governments 2 - - 2
Corporate debt - (25) (40) (65)
RMBS 1,040 - (979) 61
CMBS 4 (27) (64) (87)
CDO/ABS 612 (11) (219) 382
Total bonds available for sale 1,675 (70) (1,333) 272
Other bond securities:
Corporate debt - - (1) (1)
RMBS 26 - (67) (41)
CMBS - - (2) (2)
CDO/ABS 61 (19) (350) (308)
Total other bond securities 87 (19) (420) (352)

I TEM 1 / NOTE 4. FAIR VALUE MEASUREMENTS
NOTES TO CONDENSED CONSOLIDATED FINANCIAL STATEMENTS (unaudited)
24
Equity securities available for sale - - - -
Other equity securities - - - -
Other invested assets 9 (2) (23) (16)
Total assets $ 1,771 $ (91) $ (1,776) $ (96)
Liabilities:
Policyholder contract deposits $ - $ 140 $ 1 $ 141
Derivative liabilities, net (1) - (86) (87)
Long-term debt(b) - - (2) (2)
Total liabilities $ (1) $ 140 $ (87) $ 52
Three Months Ended June 30, 2015
Assets:
Bonds available for sale:
Obligations of states, municipalities and political subdivisions $ 116 $ - $ (23) $ 93
Non-U.S. governments 2 - (2) -
Corporate debt 182 (10) (257) (85)
RMBS 446 (143) (733) (430)
CMBS 70 - (53) 17
CDO/ABS 282 (178) (387) (283)
Total bonds available for sale 1,098 (331) (1,455) (688)
Other bond securities:
RMBS 64 (4) (44) 16
CMBS - (43) (11) (54)
CDO/ABS 12 (331) (369) (688)
Total other bond securities 76 (378) (424) (726)
Equity securities available for sale - (2) (1) (3)
Other invested assets (42) (2) (7) (51)
Total assets $ 1,132 $ (713) $ (1,887) $ (1,468)
Liabilities:
Policyholder contract deposits $ - $ 112 $ 21 $ 133
Derivative liabilities, net (2) - (212) (214)
Long-term debt(b) - - (6) (6)
Total liabilities $ (2) $ 112 $ (197) $ (87)
Purchases,
Sales, Issues and
(in millions) Purchases Sales Settlements Settlements, Net(a)
Six Months Ended June 30, 2016
Assets:
Bonds available for sale:
Obligations of states, municipalities and political subdivisions $ 46 $ (7) $ (46) $ (7)
Non-U.S. governments 3 - (1) 2
Corporate debt 29 (25) (40) (36)
RMBS 1,543 (58) (1,657) (172)
CMBS 106 (58) (216) (168)
CDO/ABS 1,151 (11) (320) 820
Total bonds available for sale 2,878 (159) (2,280) 439

I TEM 1 / NOTE 4. FAIR VALUE MEASUREMENTS
NOTES TO CONDENSED CONSOLIDATED FINANCIAL STATEMENTS (unaudited)
25
Other bond securities:
Corporate debt - - (1) (1)
RMBS 89 (26) (117) (54)
CMBS 53 (71) (5) (23)
CDO/ABS 69 (36) (752) (719)
Total other bond securities 211 (133) (875) (797)
Equity securities available for sale - - - -
Other equity securities 14 - (14) -
Other invested assets 18 (2) (53) (37)
Total assets $ 3,121 $ (294) $ (3,222) $ (395)
Liabilities:
Policyholder contract deposits $ - $ 270 $ (12) $ 258
Derivative liabilities, net (3) - (80) (83)
Long-term debt(b) - - (3) (3)
Total liabilities $ (3) $ 270 $ (95) $ 172
Six Months Ended June 30, 2015
Assets:
Bonds available for sale:
Obligations of states, municipalities and political subdivisions(c) $ 223 $ (22) $ (43) $ 158
Non-U.S. governments 8 - (4) 4
Corporate debt 188 (60) (274) (146)
RMBS 1,407 (165) (1,318) (76)
CMBS 142 (27) (68) 47
CDO/ABS 861 (201) (541) 119
Total bonds available for sale 2,829 (475) (2,248) 106
Other bond securities:
RMBS 309 (10) (79) 220
CMBS - (79) (75) (154)
CDO/ABS 226 (371) (781) (926)
Total other bond securities 535 (460) (935) (860)
Equity securities available for sale - (2) (1) (3)
Other invested assets 27 (587) (29) (589)
Total assets $ 3,391 $ (1,524) $ (3,213) $ (1,346)
Liabilities:
Policyholder contract deposits $ - $ 185 $ (1) $ 184
Derivative liabilities, net (17) - (240) (257)
Long-term debt(b) - - (18) (18)
Total liabilities $ (17) $ 185 $ (259) $ (91)
(a) There were no issuances during the three- and six-month periods ended June 30, 2016 and 2015, respectively.
(b) Includes GIAs, notes, bonds, loans and mortgages payable.
Both observable and unobservable inputs may be used to determine the fair values of positions classified in Level 3 in the tables above. As a result, the unrealized gains (losses) on instruments held at June 30, 2016 and 2015 may include changes in fair value that were attributable to both observable (e.g., changes in market interest rates) and unobservable inputs (e.g., changes in unobservable long-dated volatilities).

I TEM 1 / NOTE 4. FAIR VALUE MEASUREMENTS
NOTES TO CONDENSED CONSOLIDATED FINANCIAL STATEMENTS (unaudited)
26
Transfers of Level 3 Assets and Liabilities
We record transfers of assets and liabilities into or out of Level 3 classification at their fair values as of the end of each reporting period, consistent with the date of the determination of fair value. The Net realized and unrealized gains (losses) included in income (loss) or Other comprehensive income (loss) as shown in the table above excluded $3 million of net gains and $10 million of net losses, related to assets and liabilities transferred into Level 3 during the three- and six-month periods ended June 30, 2016, respectively, and included $8 million and $53 million, of net losses related to assets and liabilities transferred out of Level 3 during the three- and six-month periods ended June 30, 2016, respectively.
The Net realized and unrealized gains (losses) included in income or Other comprehensive income (loss) as shown in the table above contained no material net gains (losses) related to assets and liabilities transferred into or out of Level 3 during the three-month period ended June 30, 2015. The Net realized and unrealized gains (losses) included in income or Other comprehensive income (loss) as shown in the table above excluded $18 million of net gains related to assets and liabilities transferred into Level 3, and included $3 million of net gains related to assets and liabilities transferred out of Level 3 during the six-month period ended June 30, 2015.
Transfers of Level 3 Assets
During the three- and six-month periods ended June 30, 2016 and 2015, transfers into Level 3 assets primarily included certain investments in private placement corporate debt, RMBS and CDO/ABS. Transfers of private placement corporate debt and certain ABS into Level 3 assets were primarily the result of limited market pricing information that required us to determine fair value for these securities based on inputs that are adjusted to better reflect our own assumptions regarding the characteristics of a specific security or associated market liquidity. The transfers of investments in RMBS and CDO and certain ABS into Level 3 assets were due to decreases in market transparency and liquidity for individual security types.
During the three- and six-month periods ended June 30, 2016 and 2015, transfers out of Level 3 assets primarily included private placement and other corporate debt, CMBS, CDO/ABS, RMBS and certain investments in municipal securities. Transfers of certain investments municipal securities, corporate debt, RMBS, CMBS and CDO/ABS out of Level 3 assets were based on consideration of market liquidity as well as related transparency of pricing and associated observable inputs for these investments. Transfers of certain investments in private placement corporate debt and certain ABS out of Level 3 assets were primarily the result of using observable pricing information that reflects the fair value of those securities without the need for adjustment based on our own assumptions regarding the characteristics of a specific security or the current liquidity in the market.
Transfers of Level 3 Liabilities
There were no significant transfers of derivative or other liabilities into or out of Level 3 for the three- and six-month periods ended June 30, 2016 and 2015.

I TEM 1 / NOTE 4. FAIR VALUE MEASUREMENTS
NOTES TO CONDENSED CONSOLIDATED FINANCIAL STATEMENTS (unaudited)
27
Quantitative Information About Level 3 Fair Value Measurements
The table below presents information about the significant unobservable inputs used for recurring fair value measurements for certain Level 3 instruments, and includes only those instruments for which information about the inputs is reasonably available to us, such as data from independent third-party valuation service providers and from internal valuation models. Because input information from third-parties with respect to certain Level 3 instruments (primarily CDO/ABS) may not be reasonably available to us, balances shown below may not equal total amounts reported for such Level 3 assets and liabilities:
Fair Value at
June 30, Valuation Range
(in millions) 2016 Technique Unobservable Input(b) (Weighted Average)
Assets:
Obligations of states,
municipalities and
political subdivisions $ 1,448 Discounted cash flow Yield 3.44% - 4.29% (3.86%)
Corporate debt 386 Discounted cash flow Yield 3.80% - 4.77% (4.29%)
RMBS(a) 17,238 Discounted cash flow Constant prepayment rate 1.26% - 8.84% (5.05%)
Loss severity 46.90% - 80.26% (63.58%)
Constant default rate 3.41% - 9.02% (6.22%)
Yield 2.78% - 6.07% (4.43%)
CDO/ABS(a) 3,017 Discounted cash flow Yield 3.54% - 5.55% (4.54%)
CMBS 73 Discounted cash flow Yield 1.32% - 2.73% (2.03%)
Liabilities:
Embedded derivatives
within Policyholder
contract deposits:
GMWB and GMAB 2,710 Discounted cash flow Equity volatility 15.00% - 50.00%
Base lapse rate 1.00% - 17.00%
Dynamic lapse rate 0.20% - 25.50%
Mortality multiplier(c) 80.00% - 104.27%
Utilization rate 0.00% - 70.00%
Equity / interest-rate correlation 20.00% - 40.00%
Index Annuities 963 Discounted cash flow Lapse rate 0.75% - 66.00%
Mortality multiplier(c) 50.00% - 75.00%
Indexed Life 345 Discounted cash flow Equity volatility 12.62% to 21.70%
Base lapse rate 2.00% to 19.00%
Mortality rate 0.00% to 40.00%
I TEM 1 / NOTE 4. FAIR VALUE MEASUREMENTS
NOTES TO CONDENSED CONSOLIDATED FINANCIAL STATEMENTS (unaudited)
28
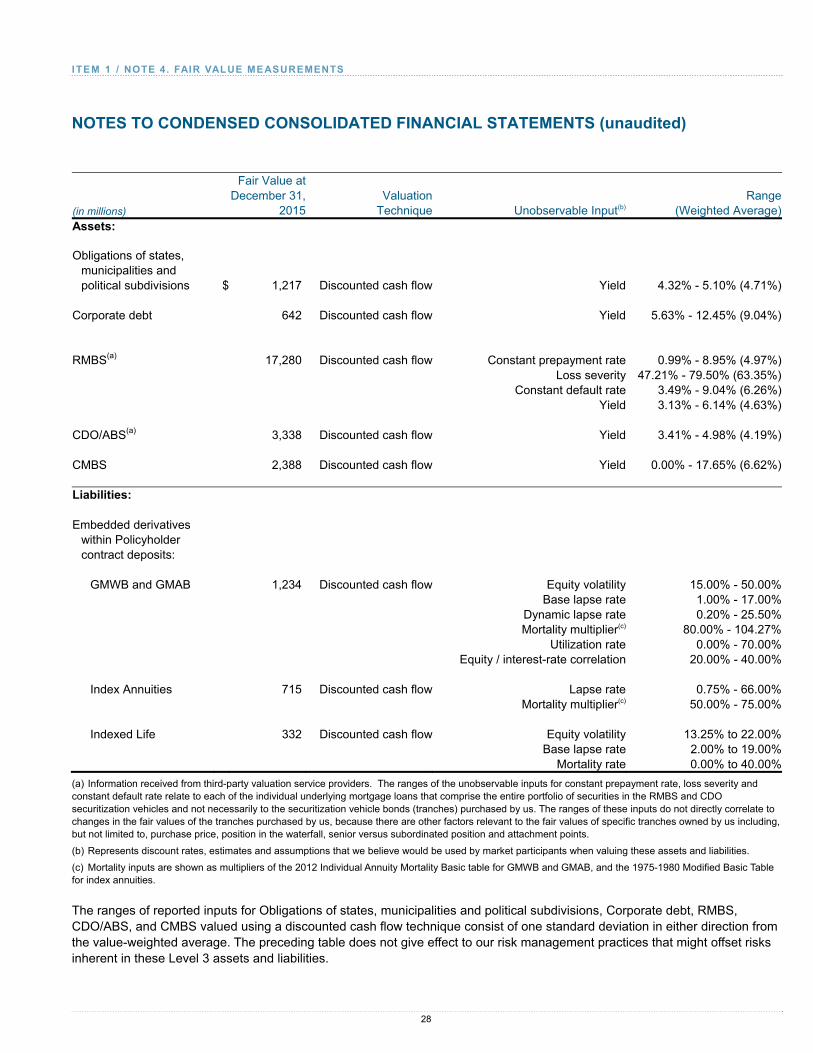
Fair Value at December 31, Valuation Range(in millions) 2015 Technique Unobservable Input(b) (Weighted Average)Assets: Obligations of states,
municipalities and political subdivisions $ 1,217 Discounted cash flow Yield 4.32% - 5.10% (4.71%)
Corporate debt 642 Discounted cash flow Yield 5.63% - 12.45% (9.04%) RMBS(a) 17,280 Discounted cash flow Constant prepayment rate 0.99% - 8.95% (4.97%) Loss severity 47.21% - 79.50% (63.35%) Constant default rate 3.49% - 9.04% (6.26%) Yield 3.13% - 6.14% (4.63%) CDO/ABS(a) 3,338 Discounted cash flow Yield 3.41% - 4.98% (4.19%) CMBS 2,388 Discounted cash flow Yield 0.00% - 17.65% (6.62%) Liabilities: Embedded derivatives
within Policyholder
contract deposits:
GMWB and GMAB 1,234 Discounted cash flow Equity volatility 15.00% - 50.00%
Base lapse rate 1.00% - 17.00% Dynamic lapse rate 0.20% - 25.50% Mortality multiplier(c) 80.00% - 104.27% Utilization rate 0.00% - 70.00% Equity / interest-rate correlation 20.00% - 40.00%
Index Annuities 715 Discounted cash flow Lapse rate 0.75% - 66.00% Mortality multiplier(c) 50.00% - 75.00%
Indexed Life 332 Discounted cash flow Equity volatility 13.25% to 22.00% Base lapse rate 2.00% to 19.00% Mortality rate 0.00% to 40.00%
(a) Information received from third-party valuation service providers. The ranges of the unobservable inputs for constant prepayment rate, loss severity and constant default rate relate to each of the individual underlying mortgage loans that comprise the entire portfolio of securities in the RMBS and CDO securitization vehicles and not necessarily to the securitization vehicle bonds (tranches) purchased by us. The ranges of these inputs do not directly correlate to changes in the fair values of the tranches purchased by us, because there are other factors relevant to the fair values of specific tranches owned by us including, but not limited to, purchase price, position in the waterfall, senior versus subordinated position and attachment points.
(b) Represents discount rates, estimates and assumptions that we believe would be used by market participants when valuing these assets and liabilities.
(c) Mortality inputs are shown as multipliers of the 2012 Individual Annuity Mortality Basic table for GMWB and GMAB, and the 1975-1980 Modified Basic Table for index annuities.
The ranges of reported inputs for Obligations of states, municipalities and political subdivisions, Corporate debt, RMBS, CDO/ABS, and CMBS valued using a discounted cash flow technique consist of one standard deviation in either direction from the value-weighted average. The preceding table does not give effect to our risk management practices that might offset risks inherent in these Level 3 assets and liabilities.

I TEM 1 / NOTE 4. FAIR VALUE MEASUREMENTS
NOTES TO CONDENSED CONSOLIDATED FINANCIAL STATEMENTS (unaudited)
29
Sensitivity to Changes in Unobservable Inputs
We consider unobservable inputs to be those for which market data is not available and that are developed using the best information available to us about the assumptions that market participants would use when pricing the asset or liability. Relevant inputs vary depending on the nature of the instrument being measured at fair value. The following paragraphs provide a general description of sensitivities of significant unobservable inputs along with interrelationships between and among the significant unobservable inputs and their impact on the fair value measurements. The effect of a change in a particular assumption in the sensitivity analysis below is considered independently of changes in any other assumptions. In practice, simultaneous changes in assumptions may not always have a linear effect on the inputs discussed below. Interrelationships may also exist between observable and unobservable inputs. Such relationships have not been included in the discussion below. For each of the individual relationships described below, the inverse relationship would also generally apply.
Obligations of States, Municipalities and Political Subdivisions
The significant unobservable input used in the fair value measurement of certain investments in obligations of states, municipalities and political subdivisions is yield. In general, increases in the yield would decrease the fair value of investments in obligations of states, municipalities and political subdivisions.
Corporate Debt
Corporate debt securities included in Level 3 are primarily private placement issuances that are not traded in active markets or that are subject to transfer restrictions. Fair value measurements consider illiquidity and non-transferability. When observable price quotations are not available, fair value is determined based on discounted cash flow models using discount rates based on credit spreads, yields or price levels of publicly-traded debt of the issuer or other comparable securities, considering illiquidity and structure. The significant unobservable input used in the fair value measurement of corporate debt is the yield. The yield is affected by the market movements in credit spreads and U.S. Treasury yields. In addition, the migration in credit quality of a given security generally has a corresponding effect on the fair value measurement of the security. For example, a downward migration of credit quality would increase spreads. Holding U.S. Treasury rates constant, an increase in corporate credit spreads would decrease the fair value of corporate debt.
RMBS and CDO/ABS
The significant unobservable inputs used in fair value measurements of RMBS and certain CDO/ABS valued by third-party valuation service providers are constant prepayment rates (CPR), loss severity, constant default rates (CDR), and yield. A change in the assumptions used for the probability of default will generally be accompanied by a corresponding change in the assumption used for the loss severity and an inverse change in the assumption used for prepayment rates. In general, increases in CPR, loss severity, CDR, and yield, in isolation, would result in a decrease in the fair value measurement. Changes in fair value based on variations in assumptions generally cannot be extrapolated because the relationship between the directional change of each input is not usually linear.

I TEM 1 / NOTE 4. FAIR VALUE MEASUREMENTS
NOTES TO CONDENSED CONSOLIDATED FINANCIAL STATEMENTS (unaudited)
30
CMBS
The significant unobservable input used in fair value measurements for CMBS is the yield. Prepayment assumptions for each mortgage pool are factored into the yield. CMBS generally feature a lower degree of prepayment risk than RMBS because commercial mortgages generally contain a penalty for prepayment. In general, increases in the yield would decrease the fair value of CMBS.
Embedded derivatives within Policyholder contract deposits
Embedded derivatives reported within Policyholder contract deposits include guaranteed minimum withdrawal benefits (GMWB) and guaranteed minimum accumulation benefits (GMAB) within variable annuity products, and interest crediting rates based on market indices within index annuities, indexed life and guaranteed investment contracts (GICs). For any given contract, assumptions for unobservable inputs vary throughout the period over which cash flows are projected for purposes of valuing the embedded derivative. The following unobservable inputs are used for valuing embedded derivatives measured at fair value:
• Long-term equity volatilities represent equity volatility beyond the period for which observable equity volatilities are available. Increases in assumed volatility will generally increase the fair value of both the projected cash flows from rider fees as well as the projected cash flows related to benefit payments. Therefore, the net change in the fair value of the liability may be either a decrease or an increase, depending on the relative changes in projected rider fees and projected benefit payments.
• Equity / interest rate correlation estimates the relationship between changes in equity returns and interest rates in the economic scenario generator used to value our GMWB and GMAB embedded derivatives. In general, a higher positive correlation assumes that equity markets and interest rates move in a more correlated fashion, which generally increases the fair value of the liability.
• Base lapse rate assumptions are determined by company experience and are adjusted at the contract level using a dynamic lapse function, which reduces the base lapse rate when the contract is in-the-money (when the contract holder’s guaranteed value, as estimated by the company, is worth more than their underlying account value). Lapse rates are also generally assumed to be lower in periods when a surrender charge applies. Increases in assumed lapse rates will generally decrease the fair value of the liability, as fewer policyholders would persist to collect guaranteed withdrawal amounts, but in certain scenarios, increases in assumed lapse rates may increase the fair value of the liability.
• Mortality rate assumptions, which vary by age and gender, are based on company experience and include a mortality improvement assumption. Increases in assumed mortality rates will decrease the fair value of the liability, while lower mortality rate assumptions will generally increase the fair value of the liability, because guaranteed payments will be made for a longer period of time.
• Utilization rate assumptions estimate the timing when policyholders with a GMWB will elect to utilize their benefit and begin taking withdrawals. The assumptions may vary by the type of guarantee, tax-qualified status, the contract’s withdrawal history and the age of the policyholder. Utilization rate assumptions are based on company experience, which includes partial withdrawal behavior. Increases in assumed utilization rates will generally increase the fair value of the liability.
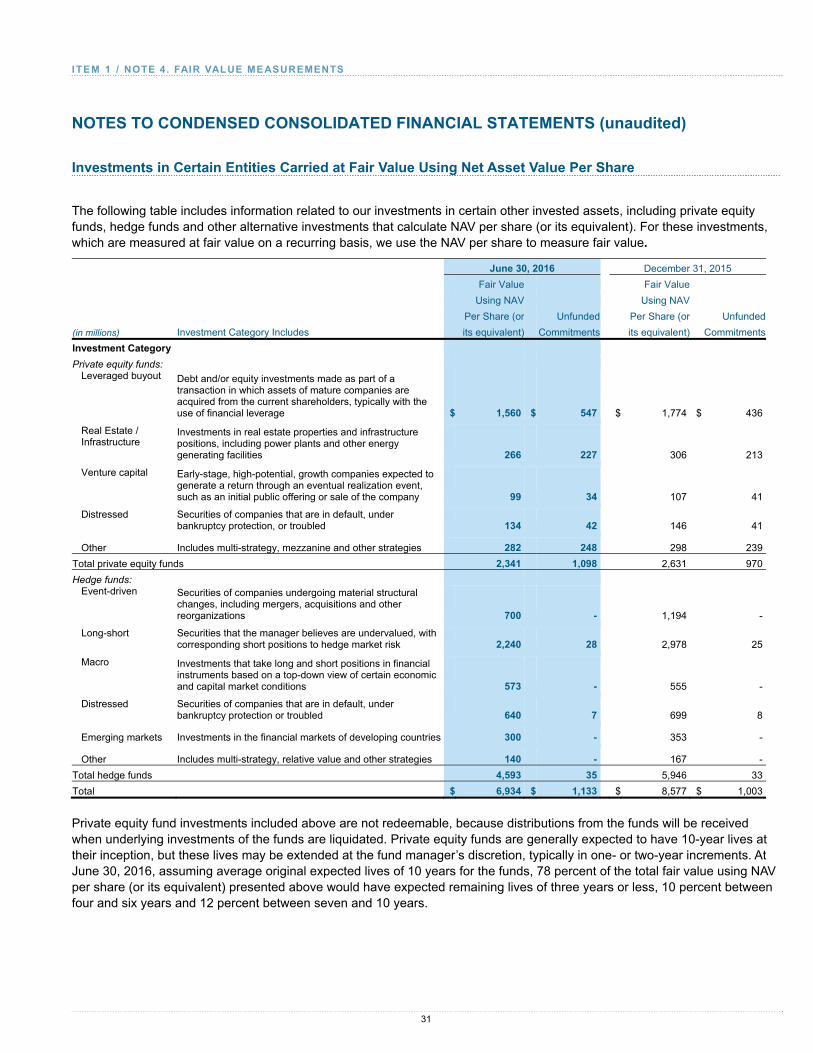
I TEM 1 / NOTE 4. FAIR VALUE MEASUREMENTS
NOTES TO CONDENSED CONSOLIDATED FINANCIAL STATEMENTS (unaudited)
31
Investments in Certain Entities Carried at Fair Value Using Net Asset Value Per Share
The following table includes information related to our investments in certain other invested assets, including private equity funds, hedge funds and other alternative investments that calculate NAV per share (or its equivalent). For these investments, which are measured at fair value on a recurring basis, we use the NAV per share to measure fair value.
June 30, 2016 December 31, 2015
Fair Value Fair Value
Using NAV Using NAV
Per Share (or Unfunded Per Share (or Unfunded
(in millions) Investment Category Includes its equivalent) Commitments its equivalent) Commitments
Investment Category
Private equity funds: Leveraged buyout Debt and/or equity investments made as part of a
transaction in which assets of mature companies are acquired from the current shareholders, typically with the use of financial leverage $ 1,560 $ 547 $ 1,774 $ 436
Real Estate / Infrastructure
Investments in real estate properties and infrastructure positions, including power plants and other energy generating facilities 266 227 306 213
Venture capital Early-stage, high-potential, growth companies expected to generate a return through an eventual realization event, such as an initial public offering or sale of the company 99 34 107 41
Distressed Securities of companies that are in default, under bankruptcy protection, or troubled 134 42 146 41
Other Includes multi-strategy, mezzanine and other strategies 282 248 298 239
Total private equity funds 2,341 1,098 2,631 970
Hedge funds: Event-driven Securities of companies undergoing material structural
changes, including mergers, acquisitions and other reorganizations 700 - 1,194 -
Long-short Securities that the manager believes are undervalued, with corresponding short positions to hedge market risk 2,240 28 2,978 25
Macro Investments that take long and short positions in financial instruments based on a top-down view of certain economic and capital market conditions 573 - 555 -
Distressed Securities of companies that are in default, under bankruptcy protection or troubled 640 7 699 8
Emerging markets Investments in the financial markets of developing countries 300 - 353 -
Other Includes multi-strategy, relative value and other strategies 140 - 167 -
Total hedge funds 4,593 35 5,946 33
Total $ 6,934 $ 1,133 $ 8,577 $ 1,003
Private equity fund investments included above are not redeemable, because distributions from the funds will be received when underlying investments of the funds are liquidated. Private equity funds are generally expected to have 10-year lives at their inception, but these lives may be extended at the fund manager’s discretion, typically in one- or two-year increments. At June 30, 2016, assuming average original expected lives of 10 years for the funds, 78 percent of the total fair value using NAV per share (or its equivalent) presented above would have expected remaining lives of three years or less, 10 percent between four and six years and 12 percent between seven and 10 years.

I TEM 1 / NOTE 4. FAIR VALUE MEASUREMENTS
NOTES TO CONDENSED CONSOLIDATED FINANCIAL STATEMENTS (unaudited)
32
The hedge fund investments included above, which are carried at fair value, are generally redeemable monthly (14 percent), quarterly (41 percent), semi-annually (12 percent) and annually (33 percent), with redemption notices ranging from one day to 180 days. At June 30, 2016, investments representing approximately 81 percent of the total fair value of these hedge fund investments had partial contractual redemption restrictions. These partial redemption restrictions are generally related to one or more investments held in the hedge funds that the fund manager deemed to be illiquid. The majority of these contractual restrictions, which may have been put in place at the fund’s inception or thereafter, have pre-defined end dates. The majority of these restrictions are generally expected to be lifted by the end of 2017.
Fair Value Option
The following table presents the gains or losses recorded related to the eligible instruments for which we elected the fair value option:
Gain (Loss) Three Months Ended June 30,
Gain (Loss) Six Months Ended June 30,
(in millions) 2016 2015 2016 2015Assets:
Bond and equity securities $ 248 $ 460 $ 298 $ 601Alternative Investments(a) 33 118 (214) 263Other, including Short-term investments - - - 2
Liabilities: Long-term debt(b) (71) 131 (247) 55Other liabilities - - - (3)
Total gain (loss) $ 210 $ 709 $ (163) $ 918
(a) Includes certain hedge funds, private equity funds and other investment partnerships.
(b) Includes GIAs, notes, bonds and mortgages payable.
We recognized gains of $3 million and $8 million during the three- and six-month periods ended June 30, 2016, respectively, and gains of $5 million and $11 million during the three- and six-month periods ended June 30, 2015, respectively, attributable to the observable effect of changes in credit spreads on our own liabilities for which the fair value option was elected. We calculate the effect of these credit spread changes using discounted cash flow techniques that incorporate current market interest rates, our observable credit spreads on these liabilities and other factors that mitigate the risk of nonperformance such as cash collateral posted.
The following table presents the difference between fair values and the aggregate contractual principal amounts of mortgage and other loans receivable and long-term debt for which the fair value option was elected:
June 30, 2016 December 31, 2015 Outstanding Outstanding(in millions) Fair Value Principal Amount Difference Fair Value Principal Amount DifferenceAssets: Mortgage and other loans receivable $ 11 $ 8 $ 3 $ 11 $ 9 $ 2Liabilities:
Long-term debt* $ 3,747 $ 2,594 $ 1,153 $ 3,670 $ 2,675 $ 995
* Includes GIAs, notes, bonds, loans and mortgages payable.

I TEM 1 / NOTE 4. FAIR VALUE MEASUREMENTS
NOTES TO CONDENSED CONSOLIDATED FINANCIAL STATEMENTS (unaudited)
33
Fair Value Measurements on a Non-Recurring Basis
The following table presents assets measured at fair value on a non-recurring basis at the time of impairment and the related impairment charges recorded during the periods presented:
Assets at Fair Value Impairment Charges Non-Recurring Basis Three Months Ended June 30, Six Months Ended June 30,
(in millions) Level 1 Level 2 Level 3 Total 2016 2015 2016 2015
June 30, 2016
Other investments $ - $ - $ 176 $ 176 $ 29 $ 27 $ 31 $ 52
Investments in life settlements - - 534 534 92 72 249 142
Other assets - - 1 1 9 4 9 8
Total $ - $ - $ 711 $ 711 $ 130 $ 103 $ 289 $ 202
December 31, 2015
Other investments $ - $ - $ 1,117 $ 1,117
Investments in life settlements - - 828 828
Other assets - - 129 129
Total $ - $ - $ 2,074 $ 2,074
Fair Value Information About Financial Instruments Not Measured at Fair Value
The following table presents the carrying value and estimated fair value of our financial instruments not measured at fair value and indicates the level in the fair value hierarchy of the estimated fair value measurement based on the observability of the inputs used:
Estimated Fair Value Carrying(in millions) Level 1 Level 2 Level 3 Total ValueJune 30, 2016 Assets:
Mortgage and other loans receivable $ - $ 174 $ 32,795 $ 32,969 $ 31,250Other invested assets - 620 2,897 3,517 4,191Short-term investments - 8,385 - 8,385 8,385Cash 1,784 - - 1,784 1,784
Liabilities: Policyholder contract deposits associated
with investment-type contracts - 366 126,279 126,645 111,459Other liabilities - 3,697 - 3,697 3,697Long-term debt - 25,918 4,693 30,611 29,582
December 31, 2015 Assets:
Mortgage and other loans receivable $ - $ 198 $ 30,147 $ 30,345 $ 29,554Other invested assets - 563 2,880 3,443 4,169Short-term investments - 7,541 - 7,541 7,541Cash 1,629 - - 1,629 1,629
Liabilities: Policyholder contract deposits associated
with investment-type contracts - 309 117,537 117,846 108,788Other liabilities - 2,852 - 2,852 2,852Long-term debt - 21,686 4,528 26,214 25,579

I TEM 1 / NOTE 5. INVESTMENTS
NOTES TO CONDENSED CONSOLIDATED FINANCIAL STATEMENTS (unaudited)
34
5. INVESTMENTS
Securities Available for Sale
The following table presents the amortized cost or cost and fair value of our available for sale securities:
Other-Than-
Amortized Gross Gross Temporary
Cost or Unrealized Unrealized Fair Impairments
(in millions) Cost Gains Losses Value in AOCI(a)
June 30, 2016
Bonds available for sale:
U.S. government and government sponsored entities $ 2,024 $ 245 $ (2) $ 2,267 $ -
Obligations of states, municipalities and political subdivisions 26,244 2,560 (27) 28,777 -
Non-U.S. governments 18,559 1,643 (110) 20,092 -
Corporate debt 132,265 11,026 (1,130)
142,161 (37)
Mortgage-backed, asset-backed and collateralized:
RMBS 35,072 2,824 (452)
37,444 1,020
CMBS 14,103 928 (57)
14,974 78
CDO/ABS 16,183 398 (207)
16,374 37
Total mortgage-backed, asset-backed and collateralized 65,358 4,150 (716)
68,792 1,135
Total bonds available for sale(b) 244,450 19,624 (1,985) 262,089 1,098
Equity securities available for sale:
Common stock 796 332 (11)
1,117 -
Preferred stock 19 4 -
23 -
Mutual funds 431 71 -
502 -
Total equity securities available for sale 1,246 407 (11) 1,642 -
Total $ 245,696 $ 20,031 $ (1,996) $ 263,731 $ 1,098
December 31, 2015
Bonds available for sale:
U.S. government and government sponsored entities $ 1,698 $ 155 $ (9) $ 1,844 $ -
Obligations of states, municipalities and political subdivisions 26,003 1,424 (104) 27,323 19
Non-U.S. governments 17,752 805 (362) 18,195 -
Corporate debt 133,513 6,462 (3,987)
135,988 (87)
Mortgage-backed, asset-backed and collateralized:
RMBS 33,878 2,760 (411)
36,227 1,326
CMBS 13,139 561 (129) 13,571 185
CDO/ABS 14,985 360 (248) 15,097 39
Total mortgage-backed, asset-backed and collateralized 62,002 3,681 (788) 64,895 1,550
Total bonds available for sale(b) 240,968 12,527 (5,250) 248,245 1,482
Equity securities available for sale:
Common stock 913 1,504 (16) 2,401 -
Preferred stock 19 3 - 22 -
Mutual funds 447 53 (8) 492 -
Total equity securities available for sale 1,379 1,560 (24) 2,915 -
Total $ 242,347 $ 14,087 $ (5,274) $ 251,160 $ 1,482
(a) Represents the amount of other-than-temporary impairments recognized in Accumulated other comprehensive income. Amount includes unrealized gains and losses on impaired securities relating to changes in the fair value of such securities subsequent to the impairment measurement date.

I TEM 1 / NOTE 5. INVESTMENTS
NOTES TO CONDENSED CONSOLIDATED FINANCIAL STATEMENTS (unaudited)
35
(b) At June 30, 2016 and December 31, 2015, bonds available for sale held by us that were below investment grade or not rated totaled $35.8 billion and $34.9 billion, respectively.
Securities Available for Sale in a Loss Position
The following table summarizes the fair value and gross unrealized losses on our available for sale securities, aggregated by major investment category and length of time that individual securities have been in a continuous unrealized loss position:
Less than 12 Months 12 Months or More Total
Gross Gross Gross
Fair Unrealized Fair Unrealized Fair Unrealized
(in millions) Value Losses Value Losses Value Losses
June 30, 2016
Bonds available for sale:
U.S. government and government sponsored entities $ 51 $ 2 $ 12 $ - $ 63 $ 2
Obligations of states, municipalities and political
subdivisions 163 1 257 26 420 27
Non-U.S. governments 1,236 25 1,005 85 2,241 110
Corporate debt 8,058 302 9,098 828
17,156 1,130
RMBS 4,263 125 4,731 327
8,994 452
CMBS 620 29 639 28 1,259 57
CDO/ABS 4,936 104 2,888 103 7,824 207
Total bonds available for sale 19,327 588 18,630 1,397 37,957 1,985
Equity securities available for sale:
Common stock 142 10 2 1 144 11
Mutual funds 13 - - - 13 -
Total equity securities available for sale 155 10 2 1 157 11
Total $ 19,482 $ 598 $ 18,632 $ 1,398 $ 38,114 $ 1,996
December 31, 2015
Bonds available for sale:
U.S. government and government sponsored entities $ 483 $ 9 $ 1 $ - $ 484 $ 9
Obligations of states, municipalities and political
subdivisions 2,382 87 268 17 2,650 104
Non-U.S. governments 4,327 203 832 159 5,159 362
Corporate debt 41,317 2,514 5,428 1,473
46,745 3,987
RMBS 7,215 133 4,318 278
11,533 411
CMBS 4,138 108 573 21 4,711 129
CDO/ABS 7,064 104 2,175 144 9,239 248
Total bonds available for sale 66,926 3,158 13,595 2,092 80,521 5,250
Equity securities available for sale:
Common stock 91 16 - - 91 16
Mutual funds 200 8 - - 200 8
Total equity securities available for sale 291 24 - - 291 24
Total $ 67,217 $ 3,182 $ 13,595 $ 2,092 $ 80,812 $ 5,274

I TEM 1 / NOTE 5. INVESTMENTS
NOTES TO CONDENSED CONSOLIDATED FINANCIAL STATEMENTS (unaudited)
36
At June 30, 2016, we held 7,153 and 140 individual fixed maturity and equity securities, respectively, that were in an unrealized loss position, of which 3,129 individual fixed maturity securities were in a continuous unrealized loss position for 12 months or more. We did not recognize the unrealized losses in earnings on these fixed maturity securities at June 30, 2016 because we neither intend to sell the securities nor do we believe that it is more likely than not that we will be required to sell these securities before recovery of their amortized cost basis. For fixed maturity securities with significant declines, we performed fundamental credit analyses on a security-by-security basis, which included consideration of credit enhancements, expected defaults on underlying collateral, review of relevant industry analyst reports and forecasts and other available market data.
Contractual Maturities of Fixed Maturity Securities Available for Sale
The following table presents the amortized cost and fair value of fixed maturity securities available for sale by contractual maturity:
Total Fixed Maturity Securities Fixed Maturity Securities in a Loss June 30, 2016 Available for Sale Position Available for Sale (in millions) Amortized Cost Fair Value Amortized Cost Fair Value Due in one year or less $ 8,363 $ 8,501 $ 745 $ 734Due after one year through five years 51,468 54,680 4,813 4,616Due after five years through ten years 50,399 53,104 7,253 6,779Due after ten years 68,862 77,012 8,338 7,751Mortgage-backed, asset-backed and collateralized 65,358 68,792 18,793 18,077Total $ 244,450 $ 262,089 $ 39,942 $ 37,957December 31, 2015 Due in one year or less $ 9,176 $ 9,277 $ 1,122 $ 1,103Due after one year through five years 47,230 49,196 9,847 9,494Due after five years through ten years 54,120 54,459 22,296 20,686Due after ten years 68,440 70,418 26,235 23,755Mortgage-backed, asset-backed and collateralized 62,002 64,895 26,271 25,483Total $ 240,968 $ 248,245 $ 85,771 $ 80,521
Actual maturities may differ from contractual maturities because certain borrowers have the right to call or prepay certain obligations with or without call or prepayment penalties.
The following table presents the gross realized gains and gross realized losses from sales or maturities of our available for sale securities:
Three Months Ended June 30, Six Months Ended June 30, 2016 2015 2016 2015 Gross Gross Gross Gross Gross Gross Gross Gross Realized Realized Realized Realized Realized Realized Realized Realized(in millions) Gains Losses Gains Losses Gains Losses Gains LossesFixed maturity securities $ 217 $ 93 $ 194 $ 59 $ 404 $ 642 $ 343 $ 177Equity securities 980 6 24 3 1,012 14 520 8Total $ 1,197 $ 99 $ 218 $ 62 $ 1,416 $ 656 $ 863 $ 185

I TEM 1 / NOTE 5. INVESTMENTS
NOTES TO CONDENSED CONSOLIDATED FINANCIAL STATEMENTS (unaudited)
37
For the three and six-month periods ended June 30, 2016, the aggregate fair value of available for sale securities sold was $8.3 billion and $14.4 billion, respectively, which resulted in net realized capital gains of $1.1 billion and net realized capital gains of $760 million, respectively.
For the three and six-month periods ended June 30, 2015, the aggregate fair value of available for sale securities sold was $7.1 billion and $14.0 billion, respectively, which resulted in net realized capital gains of $156 million and $678 million, respectively.
Other Securities Measured at Fair Value
The following table presents the fair value of other securities measured at fair value based on our election of the fair value option:
June 30, 2016 December 31, 2015 Fair Percent Fair Percent (in millions) Value of Total Value of Total Fixed maturity securities:
U.S. government and government sponsored entities $ 3,595 23 % $ 3,369 19 % Obligations of states, municipalities and political subdivisions - - 75 - Non-U.S. governments 55 - 50 - Corporate debt 1,967 12 2,035 12 Mortgage-backed, asset-backed and collateralized:
RMBS 1,925 12 2,230 13 CMBS 666 4 750 4 CDO/ABS and other collateralized* 7,127 45 8,273 47
Total mortgage-backed, asset-backed and collateralized 9,718 61 11,253 64 Total fixed maturity securities 15,335 96 16,782 95 Equity securities 661 4 921 5 Total $ 15,996 100 % $ 17,703 100 %
* Includes $557 million and $712 million of U.S. Government agency-backed ABS at June 30, 2016 and December 31, 2015, respectively.
Other Invested Assets
The following table summarizes the carrying amounts of other invested assets:
June 30, December 31,(in millions) 2016 2015Alternative investments(a) (b) $ 14,972 $ 18,150Investment real estate(c) 7,340 6,579Aircraft asset investments(d) 427 477Investments in life settlements 3,565 3,606All other investments 1,041 982Total $ 27,345 $ 29,794
(a) At June 30, 2016, includes hedge funds of $8.3 billion, private equity funds of $6.0 billion, and affordable housing partnerships of $633 million. At December 31, 2015, includes hedge funds of $10.9 billion, private equity funds of $6.5 billion, and affordable housing partnerships of $701 million.
(b) Approximately 59 percent of our hedge fund portfolio is available for redemption in 2016, an additional 24 percent and 10 percent will be available in 2017 and 2018, respectively.
(c) Net of accumulated depreciation of $579 million and $668 million in June 30, 2016 and December 31, 2015, respectively.
(d) Consists of investments in aircraft equipment held in consolidated trusts.

I TEM 1 / NOTE 5. INVESTMENTS
NOTES TO CONDENSED CONSOLIDATED FINANCIAL STATEMENTS (unaudited)
38
Net Investment Income
The following table presents the components of Net investment income:
Three Months Ended Six Months Ended
June 30, June 30,
(in millions) 2016 2015 2016 2015
Fixed maturity securities, including short-term investments $ 2,992 $ 2,800 $ 5,928 $ 5,683
Equity securities (22) 66 (44) 81
Interest on mortgage and other loans 376 347 765 686
Alternative investments* 310 658 (56) 1,244
Real estate 35 24 88 50
Other investments 101 48 238 189
Total investment income 3,792 3,943 6,919 7,933
Investment expenses 109 117 223 269
Net investment income $ 3,683 $ 3,826 $ 6,696 $ 7,664
* Beginning in the first quarter of 2016, the presentation of income on alternative investments has been refined to include only income from hedge funds, private equity funds and affordable housing partnerships. Prior period disclosures have been reclassified to conform to this presentation. Hedge funds for which we elected the fair value option are recorded as of the balance sheet date. Other hedge funds are generally reported on a one-month lag, while private equity funds are generally reported on a one-quarter lag.
Net Realized Capital Gains and Losses
The following table presents the components of Net realized capital gains (losses):
Three Months Ended Six Months Ended June 30, June 30, (in millions) 2016 2015 2016 2015Sales of fixed maturity securities $ 124 $ 135 $ (238) $ 166Sales of equity securities 974 21 998 512Other-than-temporary impairments:
Severity (3) - (5) (2)Change in intent (4) (88) (33) (112)Foreign currency declines (1) (3) (7) (32)Issuer-specific credit events (95) (70) (226) (138)Adverse projected cash flows (5) (3) (41) (8)
Provision for loan losses (30) (13) - 11Foreign exchange transactions (38) 66 (558) 320Derivatives and hedge accounting 170 288 97 496Impairments on investments in life settlements (92) (72) (249) (142)Other* 42 (135) 198 396Net realized capital gains (losses) $ 1,042 $ 126 $ (64) $ 1,467
* Includes $107 million of realized gains due to a purchase price adjustment on the sale of Class B shares of Prudential Financial Inc. for the six months ended June 30, 2016 and $357 million of realized gains due to the sale of common shares of SpringLeaf Holdings, $428 million of realized gains due to the sale of Class B shares of Prudential Financial Inc. and $463 million of realized losses due to the sale of ordinary shares of AerCap for the six months ended June 30, 2015.

I TEM 1 / NOTE 5. INVESTMENTS
NOTES TO CONDENSED CONSOLIDATED FINANCIAL STATEMENTS (unaudited)
39
Change in Unrealized Appreciation (Depreciation) of Investments
The following table presents the increase (decrease) in unrealized appreciation (depreciation) of our available for sale securities and other investments:
Three Months Ended Six Months Ended June 30, June 30, (in millions) 2016 2015 2016 2015Increase (decrease) in unrealized appreciation (depreciation) of investments:
Fixed maturity securities $ 5,584 $ (6,559) $ 10,362 $ (4,403)Equity securities (1,045) 287 (1,140) (95)Other investments (66) (37) (214) (540)
Total Increase (decrease) in unrealized appreciation (depreciation) of investments $ 4,473 $ (6,309) $ 9,008 $ (5,038)
Evaluating Investments for Other-Than-Temporary Impairments
For a discussion of our policy for evaluating investments for other-than-temporary impairments, see Note 5 to the Consolidated Financial Statements in the 2015 Annual Report.
Credit Impairments
The following table presents a rollforward of the cumulative credit losses in other-than-temporary impairments recognized in earnings for available for sale fixed maturity securities:
Three Months Ended Six Months Ended June 30, June 30, (in millions) 2016 2015 2016 2015Balance, beginning of period $ 1,523 $ 2,466 $ 1,747 $ 2,659
Increases due to: Credit impairments on new securities subject to impairment losses 13 35 123 50Additional credit impairments on previously impaired securities 74 25 129 47
Reductions due to: Credit impaired securities fully disposed of for which there was no
prior intent or requirement to sell (93) (108) (243) (150)Accretion on securities previously impaired due to credit* (219) (180) (458) (368)
Balance, end of period $ 1,298 $ 2,238 $ 1,298 $ 2,238
* Represents both accretion recognized due to changes in cash flows expected to be collected over the remaining expected term of the credit impaired securities and the accretion due to the passage of time.

I TEM 1 / NOTE 5. INVESTMENTS
NOTES TO CONDENSED CONSOLIDATED FINANCIAL STATEMENTS (unaudited)
40
Purchased Credit Impaired (PCI) Securities
We purchase certain RMBS securities that have experienced deterioration in credit quality since their issuance. We determine, based on our expectations as to the timing and amount of cash flows expected to be received, whether it is probable at acquisition that we will not collect all contractually required payments for these PCI securities, including both principal and interest after considering the effects of prepayments. At acquisition, the timing and amount of the undiscounted future cash flows expected to be received on each PCI security is determined based on our best estimate using key assumptions, such as interest rates, default rates and prepayment speeds. At acquisition, the difference between the undiscounted expected future cash flows of the PCI securities and the recorded investment in the securities represents the initial accretable yield, which is accreted into Net investment income over their remaining lives on a level-yield basis. Additionally, the difference between the contractually required payments on the PCI securities and the undiscounted expected future cash flows represents the non-accretable difference at acquisition. The accretable yield and the non-accretable difference will change over time, based on actual payments received and changes in estimates of undiscounted expected future cash flows, which are discussed further below.
On a quarterly basis, the undiscounted expected future cash flows associated with PCI securities are re-evaluated based on updates to key assumptions. Declines in undiscounted expected future cash flows due to further credit deterioration as well as changes in the expected timing of the cash flows can result in the recognition of an other-than-temporary impairment charge, as PCI securities are subject to our policy for evaluating investments for other-than-temporary impairment. Changes to undiscounted expected future cash flows due solely to the changes in the contractual benchmark interest rates on variable rate PCI securities will change the accretable yield prospectively. Significant increases in undiscounted expected future cash flows for reasons other than interest rate changes are recognized prospectively as adjustments to the accretable yield.
The following tables present information on our PCI securities, which are included in bonds available for sale:
(in millions) At Date of AcquisitionContractually required payments (principal and interest) $ 34,940Cash flows expected to be collected* 28,437Recorded investment in acquired securities 19,059
* Represents undiscounted expected cash flows, including both principal and interest. (in millions) June 30, 2016 December 31, 2015Outstanding principal balance $ 17,173 $ 16,871Amortized cost 12,397 12,303Fair value 12,992 13,164
The following table presents activity for the accretable yield on PCI securities:
Three Months Ended Six Months Ended June 30, June 30, (in millions) 2016 2015 2016 2015Balance, beginning of period $ 6,622 $ 6,765 $ 6,846 $ 6,865
Newly purchased PCI securities 245 170 451 415Disposals - (13) - (13)Accretion (209) (221) (423) (441)Effect of changes in interest rate indices 60 (6) (239) (144)Net reclassification from (to) non-accretable difference,
including effects of prepayments 325 138 408 151Balance, end of period $ 7,043 $ 6,833 $ 7,043 $ 6,833

I TEM 1 / NOTE 5. INVESTMENTS
NOTES TO CONDENSED CONSOLIDATED FINANCIAL STATEMENTS (unaudited)
41
Pledged Investments
Secured Financing and Similar Arrangements
We enter into secured financing transactions whereby certain securities are sold under agreements to repurchase (repurchase agreements), in which we transfer securities in exchange for cash, with an agreement by us to repurchase the same or substantially similar securities. Our secured financing transactions also include those that involve the transfer of securities to financial institutions in exchange for cash (securities lending agreements). In all of these secured financing transactions, the securities transferred by us (pledged collateral) may be sold or repledged by the counterparties. These agreements are recorded at their contracted amounts plus accrued interest, other than those that are accounted for at fair value.
Pledged collateral levels are monitored daily and are generally maintained at an agreed-upon percentage of the fair value of the amounts borrowed during the life of the transactions. In the event of a decline in the fair value of the pledged collateral under these secured financing transactions, we may be required to transfer cash or additional securities as pledged collateral under these agreements. At the termination of the transactions, we and our counterparties are obligated to return the amounts borrowed and the securities transferred, respectively.
The following table presents the fair value of securities pledged to counterparties under secured financing transactions, including repurchase and securities lending agreements:
(in millions) June 30, 2016 December 31, 2015Fixed maturity securities available for sale $ 1,704 $ 1,145Other bond securities, at fair value $ 2,093 $ 1,740
At June 30, 2016 and December 31, 2015, amounts borrowed under repurchase and securities lending agreements totaled $3.8 billion and $2.9 billion, respectively.
The following table presents the fair value of securities pledged under our repurchase agreements by collateral type and by remaining contractual maturity:
Remaining Contractual Maturity of the Agreements
(in millions)
Overnight and
Continuousup to 30
days31 - 90
days91 - 364
days 365 days
or greater Total
June 30, 2016 Other bond securities:
U.S. government and government sponsored entities $ 116 $ - $ - $ - $ - $ 116Non-U.S. governments - - - 55 - 55Corporate debt - 73 734 980 120 1,907
Total $ 116 $ 73 $ 734 $ 1,035 $ 120 $ 2,078
December 31, 2015 Bonds available for sale:
Non-U.S. governments $ - $ 50 $ - $ - $ - $ 50Other bond securities:
Non-U.S. governments - - - 49 - 49Corporate debt - 33 332 1,326 - 1,691
Total $ - $ 83 $ 332 $ 1,375 $ - $ 1,790

I TEM 1 / NOTE 5. INVESTMENTS
NOTES TO CONDENSED CONSOLIDATED FINANCIAL STATEMENTS (unaudited)
42
The following table presents the fair value of securities pledged under our securities lending agreements by collateral type and by remaining contractual maturity:
Remaining Contractual Maturity of the Agreements
(in millions)
Overnight and
Continuousup to 30
days31 - 90
days 91 - 364
days 365 days
or greater Total
June 30, 2016 Bonds available for sale:
Corporate debt $ - $ 285 $ 713 $ 243 $ 20 $ 1,261RMBS - 241 201 - - 442
Other bond securities: RMBS - 9 7 - - 16
Total $ - $ 535 $ 921 $ 243 $ 20 $ 1,719
December 31, 2015 Bonds available for sale:
Non-U.S. governments $ - $ - $ 57 $ - $ - $ 57Corporate debt - - 914 - - 914RMBS - - - 124 - 124
Total $ - $ - $ 971 $ 124 $ - $ 1,095
We also enter into agreements in which securities are purchased by us under agreements to resell (reverse repurchase agreements), which are accounted for as secured financing transactions and reported as short-term investments or other assets, depending on their terms. These agreements are recorded at their contracted resale amounts plus accrued interest, other than those that are accounted for at fair value. In all reverse repurchase transactions, we take possession of or obtain a security interest in the related securities, and we have the right to sell or repledge this collateral received.
The following table presents information on the fair value of securities pledged to us under reverse repurchase agreements:
(in millions) June 30, 2016 December 31, 2015Securities collateral pledged to us $ 1,489 $ 1,742Amount sold or repledged by us $ 105 $ -
Insurance – Statutory and Other Deposits
Total carrying values of cash and securities deposited by our insurance subsidiaries under requirements of regulatory authorities or other insurance-related arrangements, including certain annuity-related obligations and certain reinsurance treaties, were $5.1 billion and $4.9 billion at June 30, 2016 and December 31, 2015, respectively.
Other Pledges and Restrictions
Certain of our subsidiaries are members of Federal Home Loan Banks (FHLBs) and such membership requires the members to own stock in these FHLBs. We owned an aggregate of $107 million and $47 million of stock in FHLBs at June 30, 2016 and December 31, 2015, respectively. In addition, our subsidiaries have pledged securities available for sale with a fair value of $3.5 billion and $1.2 billion at June 30, 2016 and December 31, 2015, respectively, associated with advances from the FHLBs.

I TEM 1 / NOTE 5. INVESTMENTS
NOTES TO CONDENSED CONSOLIDATED FINANCIAL STATEMENTS (unaudited)
43
Certain GIAs have provisions that require collateral to be posted or payments to be made by us upon a downgrade of our long-term debt ratings. The actual amount of collateral required to be posted to the counterparties in the event of such downgrades, and the aggregate amount of payments that we could be required to make, depend on market conditions, the fair value of outstanding affected transactions and other factors prevailing at and after the time of the downgrade. The fair value of securities pledged as collateral with respect to these obligations was approximately $2.3 billion and $2.4 billion at June 30, 2016 and December 31, 2015, respectively. This collateral primarily consists of securities of the U.S. government and government sponsored entities and generally cannot be repledged or resold by the counterparties.
Short-term investments held in escrow accounts or otherwise subject to restriction as to their use were $507 million and $439 million at June 30, 2016 and December 31, 2015, respectively.
6. LENDING ACTIVITIES
The following table presents the composition of Mortgage and other loans receivable, net:
June 30, December 31,(in millions) 2016 2015Commercial mortgages* $ 22,904 $ 22,067Residential mortgages 3,307 2,758Commercial loans, other loans and notes receivable 2,820 2,451Life insurance policy loans 2,538 2,597Total mortgage and other loans receivable 31,569 29,873Allowance for credit losses (308) (308)Mortgage and other loans receivable, net $ 31,261 $ 29,565
* Commercial mortgages primarily represent loans for offices, retail properties and apartments, with exposures in New York and California representing the largest geographic concentrations (aggregating approximately 24 percent and 12 percent, respectively, at June 30, 2016, and 22 percent and 12 percent, respectively, at December 31, 2015).
Credit Quality of Commercial Mortgages
The following table presents debt service coverage ratios and loan-to-value ratios for commercial mortgages:
Debt Service Coverage Ratios(a)
(in millions) >1.20X 1.00X - 1.20X <1.00X Total
June 30, 2016
Loan-to-Value Ratios(b)
Less than 65% $ 12,105 $ 1,873 $ 139 $ 14,117
65% to 75% 5,660 352 43 6,055
76% to 80% 1,445 164 84 1,693
Greater than 80% 576 267 196 1,039
Total commercial mortgages $ 19,786 $ 2,656 $ 462 $ 22,904
December 31, 2015
Loan-to-Value Ratios(b)
Less than 65% $ 10,283 $ 1,704 $ 150 $ 12,137
65% to 75% 6,361 611 45 7,017
76% to 80% 1,370 169 81 1,620
Greater than 80% 646 226 421 1,293
Total commercial mortgages $ 18,660 $ 2,710 $ 697 $ 22,067
(a) The debt service coverage ratio compares a property’s net operating income to its debt service payments, including principal and interest.

I TEM 1 / NOTE 6. LENDING ACTIVITIES
NOTES TO CONDENSED CONSOLIDATED FINANCIAL STATEMENTS (unaudited)
44
(b) The loan-to-value ratio compares the current unpaid principal balance of the loan to the estimated fair value of the underlying property collateralizing the loan.
The following table presents the credit quality performance indicators for commercial mortgages:
Number Percent
of Class of
(dollars in millions) Loans Apartments Offices Retail Industrial Hotel Others Total(c) Total $
June 30, 2016
Credit Quality Performance Indicator:
In good standing 802 $ 4,342 $ 7,647 $ 4,995 $ 1,713 $ 2,454 $ 1,450 $ 22,601 99 %
Restructured(a) 8 - 235 19 - 16 - 270 1
90 days or less delinquent - - - - - - - - -
>90 days delinquent or in
process of foreclosure 7 3 12 - - 6 12 33 -
Total(b) 817 $ 4,345 $ 7,894 $ 5,014 $ 1,713 $ 2,476 $ 1,462 $ 22,904 100 %
Allowance for credit losses:
Specific $ - $ 4 $ 1 $ 6 $ 1 $ - $ 12 - %
General 48 55 44 6 21 12 186 1
Total allowance for credit losses $ 48 $ 59 $ 45 $ 12 $ 22 $ 12 $ 198 1 %
December 31, 2015
Credit Quality Performance Indicator:
In good standing 830 $ 3,916 $ 7,484 $ 4,809 $ 1,902 $ 2,082 $ 1,435 $ 21,628 98 %
Restructured(a) 9 - 156 25 6 16 6 209 1
90 days or less delinquent 1 - - 4 - - - 4 -
>90 days delinquent or in
process of foreclosure 9 3 205 - 6 - 12 226 1
Total(b) 849 $ 3,919 $ 7,845 $ 4,838 $ 1,914 $ 2,098 $ 1,453 $ 22,067 100 %
Allowance for credit losses:
Specific $ - $ 16 $ 1 $ 6 $ 1 $ - $ 24 - %
General 35 47 29 8 15 13 147 1
Total allowance for credit losses $ 35 $ 63 $ 30 $ 14 $ 16 $ 13 $ 171 1 %
(a) Loans that have been modified in troubled debt restructurings and are performing according to their restructured terms. For additional discussion of troubled debt restructurings, see Note 6 to the Consolidated Financial Statements in the 2015 Annual Report.
(b) Does not reflect allowance for credit losses.
(c) Approximately all of the commercial mortgages held at such respective dates were current as to payments of principal and interest. There were no significant amounts of nonperforming commercial mortgages (defined as those loans where payment of contractual principal or interest is more than 90 days past due) during any of the periods presented.

I TEM 1 / NOTE 6. LENDING ACTIVITIES
NOTES TO CONDENSED CONSOLIDATED FINANCIAL STATEMENTS (unaudited)
45
Allowance for Credit Losses
See Note 6 to the Consolidated Financial Statements in the 2015 Annual Report for a discussion of our accounting policy for evaluating Mortgage and other loans receivable for impairment.
The following table presents a rollforward of the changes in the allowance for losses on Mortgage and other loans receivable:
2016 2015
Six Months Ended June 30, Commercial Other Commercial Other
(in millions) Mortgages Loans Total Mortgages Loans Total
Allowance, beginning of year $ 171 $ 137 $ 308 $ 159 $ 112 $ 271
Loans charged off (13) - (13) (4) (1) (5)
Recoveries of loans previously charged off 11 - 11 3 1 4
Net charge-offs (2) - (2) (1) - (1)
Provision for loan losses 29 (27) 2 (9) (3) (12)
Other - - - 2 2 4
Allowance, end of period $ 198 * $ 110 $ 308 $ 151 * $ 111 $ 262
* Of the total allowance, $12 million and $30 million relate to individually assessed credit losses on $352 million and $570 million of commercial mortgages at June 30, 2016 and 2015, respectively.
During the six-month periods ended June 30, 2016 and 2015, loans with a carrying value of $84 million and $97 million, respectively, were modified in troubled debt restructurings.
7. VARIABLE INTEREST ENTITIES
We enter into various arrangements with VIEs in the normal course of business and consolidate the VIEs when we determine we are the primary beneficiary. This analysis includes a review of the VIE’s capital structure, related contractual relationships and terms, nature of the VIE’s operations and purpose, nature of the VIE’s interests issued and our involvement with the entity. When assessing the need to consolidate a VIE, we evaluate the design of the VIE as well as the related risks the entity was designed to expose the variable interest holders to.
The primary beneficiary of a VIE is the entity that has both (1) the power to direct the activities of the VIE that most significantly affect the entity’s economic performance and (2) the obligation to absorb losses or the right to receive benefits that could be potentially significant to the VIE.

I TEM 1 / NOTE 7. VARIABLE INTEREST ENTITIES
NOTES TO CONDENSED CONSOLIDATED FINANCIAL STATEMENTS (unaudited)
46
Balance Sheet Classification and Exposure to Loss
The following table presents the total assets and total liabilities associated with our variable interests in consolidated VIEs, as classified in the Condensed Consolidated Balance Sheets:
(in millions)
Real Estate and
Investment Entities(d)
Securitization Vehicles
Structured Investment
Vehicle
Affordable Housing
Partnerships Other Total
June 30, 2016
Assets:
Bonds available for sale $ - $ 10,116 $ - $ - $ 8 $ 10,124
Other bond securities - 5,254 334 - 6 5,594
Mortgage and other loans receivable 1 1,654 - - 118 1,773
Other invested assets 2,043 427 - 2,848 25 5,343
Other (a) 570 912 78 296 168 2,024
Total assets(b) $ 2,614 $ 18,363 $ 412 $ 3,144 $ 325 $ 24,858
Liabilities:
Long-term debt $ 1,538 $ 845 $ 52 $ 1,639 $ 6 $ 4,080
Other (c) 216 216 - 235 142 809
Total liabilities $ 1,754 $ 1,061 $ 52 $ 1,874 $ 148 $ 4,889
December 31, 2015
Assets:
Bonds available for sale $ - $ 10,309 $ - $ - $ 15 $ 10,324
Other bond securities - 5,756 387 - 24 6,167
Mortgage and other loans receivable 1 1,960 - - 132 2,093
Other invested assets 489 477 - 2,608 24 3,598
Other (a) 29 1,349 94 293 159 1,924
Total assets(b) $ 519 $ 19,851 $ 481 $ 2,901 $ 354 $ 24,106
Liabilities:
Long-term debt $ - $ 1,025 $ 53 $ 1,513 $ 6 $ 2,597
Other(c) 34 236 1 214 71 556
Total liabilities $ 34 $ 1,261 $ 54 $ 1,727 $ 77 $ 3,153
(a) Comprised primarily of Short-term investments and Other assets at June 30, 2016 and December 31, 2015.
(b) The assets of each VIE can be used only to settle specific obligations of that VIE.
(c) Comprised primarily of Other liabilities and Derivative liabilities, at fair value, at June 30, 2016 and December 31, 2015.
(d) At June 30, 2016 and December 31, 2015, off-balance sheet exposure primarily consisting of commitments to real estate and investment entities was $119 million and $131 million, respectively.
We calculate our maximum exposure to loss to be (i) the amount invested in the debt or equity of the VIE, (ii) the notional amount of VIE assets or liabilities where we have also provided credit protection to the VIE with the VIE as the referenced obligation, and (iii) other commitments and guarantees to the VIE. Interest holders in VIEs sponsored by us generally have recourse only to the assets and cash flows of the VIEs and do not have recourse to us, except in limited circumstances when we have provided a guarantee to the VIE’s interest holders.

I TEM 1 / NOTE 7. VARIABLE INTEREST ENTITIES
NOTES TO CONDENSED CONSOLIDATED FINANCIAL STATEMENTS (unaudited)
47
The following table presents total assets of unconsolidated VIEs in which we hold a variable interest, as well as our maximum exposure to loss associated with these VIEs:
Maximum Exposure to Loss Total VIE On-Balance Off-Balance (in millions) Assets Sheet(a) Sheet TotalJune 30, 2016
Real estate and investment entities(d) $ 425,402 $ 12,346 $ 2,166 $ 14,512Affordable housing partnerships 4,908 825 - 825Other 4,346 339 779 (b) 1,118
Total (c) $ 434,656 $ 13,510 $ 2,945 $ 16,455December 31, 2015
Real estate and investment entities(d) $ 21,951 $ 3,072 $ 398 $ 3,470Affordable housing partnerships 5,255 774 - 774Other 1,110 215 1,000 (b) 1,215
Total $ 28,316 $ 4,061 $ 1,398 $ 5,459
(a) At June 30, 2016 and December 31, 2015, $ 13.0 billion and $3.8 billion, respectively, of our total unconsolidated VIE assets were recorded as Other invested assets.
(b) These amounts primarily represent our estimate of the maximum exposure to loss under certain insurance policies issued to VIEs if a hypothetical loss occurred to the extent of the full amount of the insured value. Our insurance policies cover defined risks and our estimate of liability is included in our insurance reserves on the balance sheet.
(c) As discussed in Note 2, on January 1, 2016, we adopted accounting guidance that resulted in an increase in the number of our investment entities classified as VIEs.
(d) Comprised primarily of hedge funds and private equity funds.
See Note 9 to the Consolidated Financial Statements in the 2015 Annual Report for additional information on VIEs.
8. DERIVATIVES AND HEDGE ACCOUNTING
We use derivatives and other financial instruments as part of our financial risk management programs and as part of our investment operations. See Note 10 to the Consolidated Financial Statements in the 2015 Annual Report for a discussion of our accounting policies and procedures regarding derivatives and hedge accounting.
Our businesses use derivatives and other instruments as part of their financial risk management. Interest rate derivatives (such as interest rate swaps) are used to manage interest rate risk associated with embedded derivatives contained in insurance contract liabilities, fixed maturity securities, outstanding medium- and long-term notes as well as other interest rate sensitive assets and liabilities. Foreign exchange derivatives (principally foreign exchange forwards and options) are used to economically mitigate risk associated with non-U.S. dollar denominated debt, net capital exposures, and foreign currency transactions. Equity derivatives are used to mitigate financial risk embedded in certain insurance liabilities. The derivatives are effective economic hedges of the exposures that they are meant to offset.
In addition to hedging activities, we also enter into derivative instruments with respect to investment operations, which may include, among other things, CDSs and purchases of investments with embedded derivatives, such as equity-linked notes and convertible bonds.

I TEM 1 / NOTE 8. DERIVATIVES AND HEDGE ACCOUNTING
NOTES TO CONDENSED CONSOLIDATED FINANCIAL STATEMENTS (unaudited)
48
The following table presents the notional amounts of our derivative instruments and the fair value of derivative assets and liabilities in the Condensed Consolidated Balance Sheets:
June 30, 2016 December 31, 2015
Gross Derivative Assets Gross Derivative Liabilities Gross Derivative Assets Gross Derivative Liabilities
Notional Fair Notional Fair Notional Fair Notional Fair
(in millions) Amount Value Amount Value Amount Value Amount Value
Derivatives designated as
hedging instruments:(a)
Interest rate contracts $ 519 $ 4 $ 520 $ 3 $ 301 $ 1 $ 725 $ 2
Foreign exchange contracts 5,081 455 852 32 2,903 207 914 56
Equity contracts 120 1 - - - - 121 23
Derivatives not designated
as hedging instruments:(a)
Interest rate contracts 68,331 5,025 30,817 3,023 45,846 3,161 65,733 2,197
Foreign exchange contracts 11,131 1,041 7,784 1,419 9,472 559 8,900 1,148
Equity contracts 11,046 278 7,478 5 6,656 177 5,028 45
Credit contracts(b) 4 3 967 376 4 3 1,289 508
Other contracts(c) 38,793 23 192 125 37,586 23 203 69
Total derivatives, gross $ 135,025 $ 6,830 $ 48,610 $ 4,983 $ 102,768 $ 4,131 $ 82,913 $ 4,048
Counterparty netting(d) (2,192) (2,192) (1,268) (1,268)
Cash collateral(e) (3,233) (738) (1,554) (760)
Total derivatives on condensed
consolidated balance sheets(f) $ 1,405 $ 2,053 $ 1,309 $ 2,020
(a) Fair value amounts are shown before the effects of counterparty netting adjustments and offsetting cash collateral.
(b) As of June 30, 2016 and December 31, 2015, included CDSs on super senior multi-sector CDOs with a net notional amount of $0.9 billion and $1.1 billion (fair value liability of $353 million and $483 million), respectively. The expected weighted average maturity as of June 30, 2016 is six years. Because of long-term maturities of the CDSs in the portfolio, we are unable to make reasonable estimates of the periods during which any payments would be made. However, the net notional amount represents the maximum exposure to loss on the portfolio. As of June 30, 2016 and December 31, 2015, there were no super senior corporate debt/CLOs remaining.
(c) Consists primarily of stable value wraps and contracts with multiple underlying exposures.
(d) Represents netting of derivative exposures covered by a qualifying master netting agreement.
(e) Represents cash collateral posted and received that is eligible for netting.
(f) Freestanding derivatives only, excludes Embedded derivatives. Derivative instrument assets and liabilities are recorded in Other Assets and Liabilities, respectively. Fair value of assets related to bifurcated Embedded derivatives was $0 at both June 30, 2016 and December 31, 2015. Fair value of liabilities related to bifurcated Embedded derivatives was $4.1 billion and $2.3 billion, respectively, at June 30, 2016 and December 31, 2015. A bifurcated Embedded derivative is generally presented with the host contract in the Condensed Consolidated Balance Sheets. Embedded derivatives are primarily related to guarantee features in variable annuity products, which include equity and interest rate components.
Collateral
We engage in derivative transactions that are not subject to a clearing requirement directly with unaffiliated third parties, in most cases, under International Swaps and Derivatives Association, Inc. (ISDA) Master Agreements. Many of the ISDA Master Agreements also include Credit Support Annex (CSA) provisions, which provide for collateral postings that may vary at various ratings and threshold levels. We attempt to reduce our risk with certain counterparties by entering into agreements that enable collateral to be obtained from a counterparty on an upfront or contingent basis. We minimize the risk that counterparties might be unable to fulfill their contractual obligations by monitoring counterparty credit exposure and collateral value and generally requiring additional collateral to be posted upon the occurrence of certain events or circumstances. In addition, certain derivative transactions have provisions that require collateral to be posted upon a downgrade of our long-term debt ratings or give the counterparty the right to terminate the transaction. In the case of some of the derivative transactions, upon a downgrade of our long-term debt ratings, as an alternative to posting collateral and subject to certain conditions, we may assign the transaction to an obligor with higher debt ratings or arrange for a substitute guarantee of our obligations by an

I TEM 1 / NOTE 8. DERIVATIVES AND HEDGE ACCOUNTING
NOTES TO CONDENSED CONSOLIDATED FINANCIAL STATEMENTS (unaudited)
49
obligor with higher debt ratings or take other similar action. The actual amount of collateral required to be posted to counterparties in the event of such downgrades, or the aggregate amount of payments that we could be required to make, depends on market conditions, the fair value of outstanding affected transactions and other factors prevailing at and after the time of the downgrade.
Collateral posted by us to third parties for derivative transactions was $3.1 billion and $3.0 billion at June 30, 2016 and December 31, 2015, respectively. In the case of collateral posted under derivative transactions that are not subject to clearing, this collateral can generally be repledged or resold by the counterparties. Collateral provided to us from third parties for derivative transactions was $3.3 billion and $1.6 billion at June 30, 2016 and December 31, 2015, respectively. In the case of collateral provided to us under derivative transactions that are not subject to clearing, we generally can repledge or resell collateral.
Offsetting
We have elected to present all derivative receivables and derivative payables, and the related cash collateral received and paid, on a net basis on our Condensed Consolidated Balance Sheets when a legally enforceable ISDA Master Agreement exists between us and our derivative counterparty. An ISDA Master Agreement is an agreement governing multiple derivative transactions between two counterparties. The ISDA Master Agreement generally provides for the net settlement of all, or a specified group, of these derivative transactions, as well as transferred collateral, through a single payment, and in a single currency, as applicable. The net settlement provisions apply in the event of a default on, or affecting any, one derivative transaction or a termination event affecting all, or a specified group of, derivative transactions governed by the ISDA Master Agreement.
Hedge Accounting
We designated certain derivatives entered into with third parties as fair value hedges of available for sale investment securities held by our insurance subsidiaries. The fair value hedges include foreign currency forwards and cross currency swaps designated as hedges of the change in fair value of foreign currency denominated available for sale securities attributable to changes in foreign exchange rates. We also designated certain interest rate swaps entered into with third parties as fair value hedges of fixed rate GICs attributable to changes in benchmark interest rates.
We use foreign currency denominated debt and cross-currency swaps as hedging instruments in net investment hedge relationships to mitigate the foreign exchange risk associated with our non-U.S. dollar functional currency foreign subsidiaries. For net investment hedge relationships where issued debt is used as a hedging instrument, we assess the hedge effectiveness and measure the amount of ineffectiveness based on changes in spot rates. For net investment hedge relationships that use derivatives as hedging instruments, we assess hedge effectiveness and measure hedge ineffectiveness using changes in forward rates. For the three- and six-month periods ended June 30, 2016, we recognized losses of $4 million and $9 million, respectively, and for the three- and six-month periods ended June 30, 2015, we recognized gains (losses) of $(21) million and $73 million, respectively, included in Change in foreign currency translation adjustment in Other comprehensive income related to the net investment hedge relationships.
A qualitative methodology is utilized to assess hedge effectiveness for net investment hedges, while regression analysis is employed for all other hedges.

I TEM 1 / NOTE 8. DERIVATIVES AND HEDGE ACCOUNTING
NOTES TO CONDENSED CONSOLIDATED FINANCIAL STATEMENTS (unaudited)
50
The following table presents the gain (loss) recognized in earnings on our derivative instruments in fair value hedging relationships in the Condensed Consolidated Statements of Income:
Gains/(Losses) Recognized in
Earnings for: Including Gains/(Losses) Attributable to: Hedging Hedged Hedge Excluded (in millions) Derivatives(a) Items Ineffectiveness Components Other(b) Three Months Ended June 30, 2016 Interest rate contracts:
Realized capital gains/(losses) $ - $ - $ - $ - $ -Interest credited to policyholder
account balances - - - - -Other income - 5 - - 5Gain/(Loss) on extinguishment of debt - - - - -
Foreign exchange contracts: Realized capital gains/(losses) 389 (345) - 43 1Interest credited to policyholder
account balances - - - - -Other income - 5 - - 5Gain/(Loss) on extinguishment of debt - - - - -
Equity contracts:
Realized capital gains/(losses) 10 (7) - 3 -Three Months Ended June 30, 2015 Interest rate contracts:
Realized capital gains/(losses) $ - $ - $ - $ - $ -Interest credited to policyholder
account balances - - - - -Other income - 2 - - 2Gain/(Loss) on extinguishment of debt - - - - -
Foreign exchange contracts: Realized capital gains/(losses) (60) 73 - 13 -Interest credited to policyholder
account balances - - - - -Other income - 4 - - 4Gain/(Loss) on extinguishment of debt - 1 - - 1
Equity contracts:
Realized capital gains/(losses) (13) 13 - - -

I TEM 1 / NOTE 8. DERIVATIVES AND HEDGE ACCOUNTING
NOTES TO CONDENSED CONSOLIDATED FINANCIAL STATEMENTS (unaudited)
51
Gains/(Losses) Recognized in
Earnings for: Including Gains/(Losses) Attributable to: Hedging Hedged Hedge Excluded (in millions) Derivatives(a) Items Ineffectiveness Components Other(b)
Six Months Ended June 30, 2016
Interest rate contracts:
Realized capital gains/(losses) $ 1 $ (7) $ - $ - $ (6)
Interest credited to policyholder
account balances - - - - -
Other income - 7 - - 7
Gain/(Loss) on extinguishment of debt - - - - -
Foreign exchange contracts:
Realized capital gains/(losses) 423 (409) - 14 -
Interest credited to policyholder
account balances - - - - -
Other income - 12 - - 12
Gain/(Loss) on extinguishment of debt - - - - -
Equity contracts:
Realized capital gains/(losses) 20 (19) - 1 -
Six Months Ended June 30, 2015
Interest rate contracts:
Realized capital gains/(losses) $ 1 $ (1) $ - $ - $ -
Interest credited to policyholder
account balances - - - - -
Other income - 5 - - 5
Gain/(Loss) on extinguishment of debt - 13 - - 13
Foreign exchange contracts:
Realized capital gains/(losses) 72 (56) - 13 3
Interest credited to policyholder
account balances - (1) - - (1)Other income - 10 - - 10
Gain/(Loss) on extinguishment of debt - 17 - - 17
Equity contracts:
Realized capital gains/(losses) (19) 18 - (1) -
a) The amounts presented do not include the periodic net coupon settlements of the derivative contract or the coupon income (expense) related to the hedged item.
(b) Represents accretion/amortization of opening fair value of the hedged item at inception of hedge relationship, amortization of basis adjustment on hedged item following the discontinuation of hedge accounting, and the release of debt basis adjustment following the repurchase of issued debt that was part of previously-discontinued fair value hedge relationship.

I TEM 1 / NOTE 8. DERIVATIVES AND HEDGE ACCOUNTING
NOTES TO CONDENSED CONSOLIDATED FINANCIAL STATEMENTS (unaudited)
52
Derivatives Not Designated as Hedging Instruments
The following table presents the effect of derivative instruments not designated as hedging instruments in the Condensed Consolidated Statements of Income:
Gains (Losses) Recognized in Earnings Three Months Ended Six Months Ended June 30, June 30, (in millions) 2016 2015 2016 2015By Derivative Type:
Interest rate contracts $ 603 $ (427) $ 1,373 $ (71)Foreign exchange contracts 182 (52) 154 270Equity contracts (141) (31) (272) (120)Commodity contracts - - - (1)Credit contracts 28 13 34 160Other contracts 20 (35) 36 (13)Embedded derivatives (513) 846 (1,285) 673
Total $ 179 $ 314 $ 40 $ 898By Classification:
Policy fees $ 20 $ 20 $ 40 $ 39Net investment income 13 (13) 12 14Net realized capital gains 123 305 88 476Other income (losses) 18 8 (112) 370Policyholder benefits and claims incurred 5 (6) 12 (1)
Total $ 179 $ 314 $ 40 $ 898
Credit Risk-Related Contingent Features
The aggregate fair value of our derivative instruments that contain credit risk-related contingent features that were in a net liability position at both June 30, 2016 and December 31, 2015, was approximately $2.0 billion. The aggregate fair value of assets posted as collateral under these contracts at both June 30, 2016 and December 31, 2015, was approximately $2.1 billion.
We estimate that at June 30, 2016, based on our outstanding financial derivative transactions, a downgrade of our long-term senior debt ratings to BBB+, BBB or BBB– by Standard & Poor’s Financial Services LLC, a subsidiary of S&P Global Inc., and/or a downgrade to Baa2 or Baa3 by Moody’s Investors’ Service, Inc. would permit counterparties to make additional collateral calls and permit certain counterparties to elect early termination of contracts, resulting in corresponding collateral postings and termination payments in the total amount of up to approximately $137 million.
Additional collateral postings upon downgrade are estimated based on the factors in the individual collateral posting provisions of the CSA with each counterparty and current exposure as of June 30, 2016. Factors considered in estimating the termination payments upon downgrade include current market conditions and the terms of the respective CSA provisions. Our estimates are also based on the assumption that counterparties will terminate based on their net exposure to us. The actual termination payments could differ from our estimates given market conditions at the time of downgrade and the level of uncertainty in estimating both the number of counterparties who may elect to exercise their right to terminate and the payment that may be triggered in connection with any such exercise.

I TEM 1 / NOTE 8. DERIVATIVES AND HEDGE ACCOUNTING
NOTES TO CONDENSED CONSOLIDATED FINANCIAL STATEMENTS (unaudited)
53
Hybrid Securities with Embedded Credit Derivatives
We invest in hybrid securities (such as credit-linked notes) with the intent of generating income, and not specifically to acquire exposure to embedded derivative risk. As is the case with our other investments in RMBS, CMBS, CDOs and ABS, our investments in these hybrid securities are exposed to losses only up to the amount of our initial investment in the hybrid security. Other than our initial investment in the hybrid securities, we have no further obligation to make payments on the embedded credit derivatives in the related hybrid securities.
We elect to account for our investments in these hybrid securities with embedded written credit derivatives at fair value, with changes in fair value recognized in Net investment income and Other income. Our investments in these hybrid securities are reported as Other bond securities in the Condensed Consolidated Balance Sheets. The fair values of these hybrid securities were $5.1 billion and $5.7 billion at June 30, 2016 and December 31, 2015, respectively. These securities have par amounts of $10.6 billion and $11.2 billion at June 30, 2016 and December 31, 2015, respectively, and have remaining stated maturity dates that extend to 2052.
9. CONTINGENCIES, COMMITMENTS AND GUARANTEES
In the normal course of business, various contingent liabilities and commitments are entered into by AIG and our subsidiaries. In addition, AIG Parent guarantees various obligations of certain subsidiaries.
Although AIG cannot currently quantify its ultimate liability for unresolved litigation and investigation matters, including those referred to below, it is possible that such liability could have a material adverse effect on AIG’s consolidated financial condition or its consolidated results of operations or consolidated cash flows for an individual reporting period.
Legal Contingencies
Overview. In the normal course of business, AIG and our subsidiaries are, like others in the insurance and financial services industries in general, subject to litigation, including claims for punitive damages. In our insurance and mortgage guaranty operations, litigation arising from claims settlement activities is generally considered in the establishment of our liability for unpaid losses and loss adjustment expenses. However, the potential for increasing jury awards and settlements makes it difficult to assess the ultimate outcome of such litigation. AIG is also subject to derivative, class action and other claims asserted by its shareholders and others alleging, among other things, breach of fiduciary duties by its directors and officers and violations of insurance laws and regulations, as well as federal and state securities laws. In the case of any derivative action brought on behalf of AIG, any recovery would accrue to the benefit of AIG.
Various regulatory and governmental agencies have been reviewing certain transactions and practices of AIG and our subsidiaries in connection with industry-wide and other inquiries into, among other matters, certain business practices of current and former operating insurance subsidiaries. We have cooperated, and will continue to cooperate, in producing documents and other information in response to subpoenas and other requests.
AIG’s Subprime Exposure, AIGFP Credit Default Swap Portfolio and Related Matters
AIG, AIG Financial Products Corp. and related subsidiaries (collectively AIGFP), and certain directors and officers of AIG, AIGFP and other AIG subsidiaries have been named in various actions relating to our exposure to the U.S. residential subprime mortgage market, unrealized market valuation losses on AIGFP’s super senior credit default swap portfolio, losses

I TEM 1 / NOTE 9. CONTINGENCIES, COMMITMENTS AND GUARANTEES
NOTES TO CONDENSED CONSOLIDATED FINANCIAL STATEMENTS (unaudited)
54
and liquidity constraints relating to our securities lending program and related disclosure and other matters (Subprime Exposure Issues).
Consolidated 2008 Securities Litigation. On May 19, 2009, a consolidated class action complaint, resulting from the consolidation of eight purported securities class actions filed between May 2008 and January 2009, was filed against AIG and certain directors and officers of AIG and AIGFP, AIG’s outside auditors, and the underwriters of various securities offerings in the United States District Court for the Southern District of New York (the Southern District of New York) in In re American International Group, Inc. 2008 Securities Litigation (the Consolidated 2008 Securities Litigation), asserting claims under the Securities Exchange Act of 1934, as amended (the Exchange Act), and claims under the Securities Act of 1933, as amended (the Securities Act), for allegedly materially false and misleading statements in AIG’s public disclosures from March 16, 2006 to September 16, 2008 relating to, among other things, the Subprime Exposure Issues.
On July 15, 2014 and August 1, 2014, lead plaintiff, AIG and AIG’s outside auditor accepted mediators’ proposals to settle the Consolidated 2008 Securities Litigation against all defendants. On October 22, 2014, AIG made a cash payment of $960 million, which is being held in escrow until all funds are distributed. On March 20, 2015, the Court issued an Order and Final Judgment approving the class settlement and dismissing the action with prejudice, and the AIG settlement became final on June 29, 2015.
Individual Securities Litigations. Between November 18, 2011 and February 9, 2015, eleven separate, though similar, securities actions (Individual Securities Litigations) were filed asserting claims substantially similar to those in the Consolidated 2008 Securities Litigation against AIG and certain directors and officers of AIG and AIGFP. Two of the actions were voluntarily dismissed. On September 10, 2015, the Southern District of New York granted AIG’s motion to dismiss some of the claims in the Individual Securities Litigations in whole or in part. AIG has settled eight of the nine remaining actions.
On March 27, 2015, an additional securities action was filed in state court in Orange County, California asserting a claim against AIG pursuant to Section 11 of the Securities Act (the California Action) that is substantially similar to those in the Consolidated 2008 Securities Litigation and the remaining Individual Securities Litigation pending in the Southern District of New York. On July 10, 2015, AIG filed a motion to stay the California Action. On September 18, 2015, the court denied AIG’s motion to stay the California Action. On October 23, 2015, AIG filed an appeal of the court’s denial. On January 28, 2016, the California appellate court summarily denied AIG’s appeal. On February 8, 2016, AIG filed a petition for review in the California Supreme Court, which was denied on March 30, 2016. On April 11, 2016, AIG filed a demurrer to dismiss all of the claims asserted in the California Action. On May 31, 2016, the court overruled AIG’s demurrer in the California Action. On June 24, 2016, AIG filed a petition for writ of mandate in appellate court of the court’s decision overruling AIG’s demurrer.
We have accrued our current estimate of probable loss with respect to these litigations.
Starr International Litigation
On November 21, 2011, Starr International Company, Inc. (SICO) filed a complaint against the United States in the United States Court of Federal Claims (the Court of Federal Claims), bringing claims, both individually and on behalf of the classes defined below and derivatively on behalf of AIG (the SICO Treasury Action). The complaint challenges the government’s assistance of AIG, pursuant to which AIG entered into a credit facility with the Federal Reserve Bank of New York (the FRBNY, and such credit facility, the FRBNY Credit Facility) and the United States received an approximately 80 percent ownership in AIG. The complaint alleges that the interest rate imposed on AIG and the appropriation of approximately 80 percent of AIG’s equity was discriminatory, unprecedented, and inconsistent with liquidity assistance offered by the government to other comparable firms at the time and violated the Equal Protection, Due Process, and Takings Clauses of the U.S. Constitution.
In the SICO Treasury Action, the only claims naming AIG as a party (as a nominal defendant) are derivative claims on behalf of AIG. On September 21, 2012, SICO made a pre-litigation demand on our Board demanding that we pursue the derivative claims or allow SICO to pursue the claims on our behalf. On January 9, 2013, our Board unanimously refused SICO’s demand

I TEM 1 / NOTE 9. CONTINGENCIES, COMMITMENTS AND GUARANTEES
NOTES TO CONDENSED CONSOLIDATED FINANCIAL STATEMENTS (unaudited)
55
in its entirety and on January 23, 2013, counsel for the Board sent a letter to counsel for SICO describing the process by which our Board considered and refused SICO’s demand and stating the reasons for our Board’s determination.
On March 11, 2013, SICO filed a second amended complaint in the SICO Treasury Action alleging that its demand was wrongfully refused. On June 26, 2013, the Court of Federal Claims granted AIG’s and the United States’ motions to dismiss SICO’s derivative claims in the SICO Treasury Action due to our Board’s refusal of SICO’s demand and denied the United States’ motion to dismiss SICO’s direct, non-derivative claims.
On March 11, 2013, the Court of Federal Claims in the SICO Treasury Action granted SICO’s motion for class certification of two classes with respect to SICO’s non-derivative claims: (1) persons and entities who held shares of AIG Common Stock on or before September 16, 2008 and who owned those shares on September 22, 2008 (the Credit Agreement Shareholder Class); and (2) persons and entities who owned shares of AIG Common Stock on June 30, 2009 and were eligible to vote those shares at AIG’s June 30, 2009 annual meeting of shareholders (the Reverse Stock Split Shareholder Class). SICO has provided notice of class certification to potential members of the classes, who, pursuant to a court order issued on April 25, 2013, had to return opt-in consent forms by September 16, 2013 to participate in either class. 286,908 holders of AIG Common Stock during the two class periods have opted into the classes.
On June 15, 2015, the Court of Federal Claims issued its opinion and order in the SICO Treasury Action. The Court found that the United States exceeded its statutory authority by exacting approximately 80 percent of AIG’s equity in exchange for the FRBNY Credit Facility, but that AIG shareholders suffered no damages as a result. SICO argued during trial that the two classes are entitled to a total of approximately $40 billion in damages, plus interest. The Court also found that the United States was not liable to the Reverse Stock Split Class in connection with the reverse stock split vote at the June 30, 2009 annual meeting of shareholders.
On June 17, 2015, the Court of Federal Claims entered judgment stating that “the Credit Agreement Shareholder Class shall prevail on liability due to the Government's illegal exaction, but shall recover zero damages, and that the Reverse Stock Split Shareholder Class shall not prevail on liability or damages.” SICO filed a notice of appeal of the July 2, 2012 dismissal of SICO’s unconstitutional conditions claim, the June 26, 2013 dismissal of SICO’s derivative claims, the Court’s June 15, 2015 opinion and order, and the Court’s June 17, 2015 judgment to the United States Court of Appeals for the Federal Circuit. The United States filed a notice of cross appeal of the Court’s July 2, 2012 opinion and order denying in part its motion to dismiss, the Court’s June 26, 2013 opinion and order denying its motion to dismiss SICO’s direct claims, the Court’s June 15, 2015 opinion and order, and the Court’s June 17, 2015 judgment to the United States Court of Appeals for the Federal Circuit.
On August 25, 2015, SICO filed its appellate brief, in which it stated SICO does not appeal the dismissal of the derivative claims it asserted on behalf of AIG.
In the Court of Federal Claims, the United States has alleged, as an affirmative defense in its answer, that AIG is obligated to indemnify the FRBNY and its representatives, including the Federal Reserve Board of Governors and the United States (as the FRBNY’s principal), for any recovery in the SICO Treasury Action.
AIG believes that any indemnification obligation would arise only if: (a) SICO prevails on its appeal and ultimately receives an award of damages; (b) the United States then commences an action against AIG seeking indemnification; and (c) the United States is successful in such an action through any appellate process. If SICO prevails on its claims and the United States seeks indemnification from AIG, AIG intends to assert defenses thereto. A reversal of the Court of Federal Claim’s June 17, 2015 decision and judgment and a final determination that the United States is liable for damages, together with a final determination that AIG is obligated to indemnify the United States for any such damages, could have a material adverse effect on our business, consolidated financial condition and results of operations.

I TEM 1 / NOTE 9. CONTINGENCIES, COMMITMENTS AND GUARANTEES
NOTES TO CONDENSED CONSOLIDATED FINANCIAL STATEMENTS (unaudited)
56
False Claims Act Complaint
On February 25, 2010, a complaint was filed in the United States District Court for the Southern District of California by two individuals (Relators) seeking to assert claims on behalf of the United States against AIG and certain other defendants, including Goldman Sachs and Deutsche Bank, under the False Claims Act. Relators filed a first amended complaint on September 30, 2010, adding certain additional defendants, including Bank of America and Société Générale. The first amended complaint alleged that defendants engaged in fraudulent business practices in respect of their activities in the over-the-counter market for collateralized debt obligations, and submitted false claims to the United States in connection with the FRBNY Credit Facility and Maiden Lane II LLC and Maiden Lane III LLC entities (the Maiden Lane Interests) through, among other things, misrepresenting AIG’s ability and intent to repay amounts drawn on the FRBNY Credit Facility, and misrepresenting the value of the securities that the Maiden Lane Interests acquired from AIG and certain of its counterparties. The first amended complaint sought unspecified damages pursuant to the False Claims Act in the amount of three times the damages allegedly sustained by the United States as well as interest, attorneys’ fees, costs and expenses. The complaint and the first amended complaint were initially filed and maintained under seal while the United States considered whether to intervene in the action. On or about April 28, 2011, after the United States declined to intervene, the District Court lifted the seal, and Relators served the first amended complaint on AIG on July 11, 2011. On April 19, 2013, the Court granted AIG’s motion to dismiss, dismissing the first amended complaint in its entirety, without prejudice, giving the Relators the opportunity to file a second amended complaint. On May 24, 2013, the Relators filed a second amended complaint, which attempted to plead the same claims as the prior complaints and did not specify an amount of alleged damages. AIG and its co-defendants filed motions to dismiss the second amended complaint on August 9, 2013. On March 29, 2014, the Court dismissed the second amended complaint with prejudice. On April 30, 2014, the Relators filed a Notice of Appeal to the Ninth Circuit. On May 5, 2016, the Ninth Circuit affirmed the decision of the trial court. We are unable to reasonably estimate the possible loss or range of losses, if any, arising from this litigation.
Litigation Matters Relating to AIG’s Insurance Operations
Caremark. AIG and certain of its subsidiaries have been named defendants in two putative class actions in state court in Alabama that arise out of the 1999 settlement of class and derivative litigation involving Caremark Rx, Inc. (Caremark). The plaintiffs in the second-filed action intervened in the first-filed action, and the second-filed action was dismissed. An excess policy issued by a subsidiary of AIG with respect to the 1999 litigation was expressly stated to be without limit of liability. In the current actions, plaintiffs allege that the judge approving the 1999 settlement was misled as to the extent of available insurance coverage and would not have approved the settlement had he known of the existence and/or unlimited nature of the excess policy. They further allege that AIG, its subsidiaries, and Caremark are liable for fraud and suppression for misrepresenting and/or concealing the nature and extent of coverage.
The complaints filed by the plaintiffs and the intervenors request compensatory damages for the 1999 class in the amount of $3.2 billion, plus punitive damages. AIG and its subsidiaries deny the allegations of fraud and suppression, assert that information concerning the excess policy was publicly disclosed months prior to the approval of the settlement, that the claims are barred by the statute of limitations, and that the statute cannot be tolled in light of the public disclosure of the excess coverage. The plaintiffs and intervenors, in turn, have asserted that the disclosure was insufficient to inform them of the nature of the coverage and did not start the running of the statute of limitations.
On August 15, 2012, the trial court entered an order granting plaintiffs’ motion for class certification, and on September 12, 2014, the Alabama Supreme Court affirmed that order. AIG and the other defendants’ petition for rehearing of that decision was denied on February 27, 2015. The matter was remanded to the trial court for general discovery and adjudication of the merits. On November 24, 2015, the trial court ruled that the defendants had a duty to disclose the amount of insurance available at the settlement approval hearings and that the defendants breached that duty. The parties have settled this matter in principle, subject to formal documentation and court approval. Preliminary approval of the settlement was entered by the trial

I TEM 1 / NOTE 9. CONTINGENCIES, COMMITMENTS AND GUARANTEES
NOTES TO CONDENSED CONSOLIDATED FINANCIAL STATEMENTS (unaudited)
57
court on June 1, 2016. The hearing on final approval is expected in the third quarter. We have accrued our current estimate of loss with respect to this litigation.
Regulatory and Related Matters
In April 2007, the National Association of Insurance Commissioners (NAIC) formed a Settlement Review Working Group, directed by the State of Indiana, to review the Workers’ Compensation Residual Market Assessment portion of the settlement between AIG, the Office of the New York Attorney General, and the New York State Department of Insurance. In late 2007, the Settlement Review Working Group, under the direction of Indiana, Minnesota and Rhode Island, recommended that a multi-state targeted market conduct examination focusing on workers’ compensation insurance be commenced under the direction of the NAIC’s Market Analysis Working Group. AIG was informed of the multi-state targeted market conduct examination in January 2008. The lead states in the multi-state examination were Delaware, Florida, Indiana, Massachusetts, Minnesota, New York, Pennsylvania and Rhode Island. All other states (and the District of Columbia) agreed to participate in the multi-state examination. The examination focused on legacy issues related to certain AIG entities’ writing and reporting of workers compensation insurance between 1985 and 1996.
On December 17, 2010, AIG and the lead states reached an agreement to settle all regulatory liabilities arising out of the subjects of the multistate examination. This regulatory settlement agreement, which was agreed to by all 50 states and the District of Columbia, included, among other terms, (i) AIG’s payment of $100 million in regulatory fines and penalties; (ii) AIG’s payment of $46.5 million in outstanding premium taxes and assessments; (iii) AIG’s agreement to enter into a compliance plan describing agreed-upon specific steps and standards for evaluating AIG’s ongoing compliance with state regulations governing the setting of workers’ compensation insurance premium rates and the reporting of workers’ compensation premiums; and (iv) AIG’s agreement to pay up to $150 million in contingent fines in the event that AIG fails to comply substantially with the compliance plan requirements. In furtherance of the compliance plan, the agreement provided for a monitoring period from May 29, 2012 to May 29, 2014 leading up to a compliance plan examination. After the close of the monitoring period, as part of preparation for the actual conduct of the compliance plan examination, on or about October 1, 2014, AIG and the lead states agreed upon corrective action plans to address particular issues identified during the monitoring period. The compliance plan examination is ongoing. There can be no assurance that the result of the compliance plan examination will not result in a fine, have a material adverse effect on AIG’s ongoing operations or lead to civil litigation.
In connection with a multi-state examination of certain accident and health products, including travel products, issued by National Union Fire Insurance Company of Pittsburgh, Pa. (National Union), AIG Property Casualty Inc. (formerly Chartis Inc.), on behalf of itself, National Union, and certain of AIG Property Casualty Inc.’s insurance and non-insurance companies (collectively, the AIG PC parties) entered into a Regulatory Settlement Agreement with regulators from 50 U.S. jurisdictions effective November 29, 2012. Under the agreement, and without admitting any liability for the issues raised in the examination, the AIG PC parties (i) paid a civil penalty of $50 million, (ii) entered into a corrective action plan describing agreed-upon specific steps and standards for evaluating the AIG PC parties’ ongoing compliance with laws and regulations governing the issues identified in the examination, and (iii) agreed to pay a contingent fine in the event that the AIG PC parties fail to satisfy certain terms of the corrective action plan. On April 29, 2016, National Union and other AIG companies achieved a settlement in principle of civil litigation relating to the conduct of their accident and health business, subject to formal documentation and court approval. We have accrued our current estimate of loss with respect to this settlement. On May 23, 2016, the managing lead state in the multi-state examination ordered that the companies subject to the Regulatory Settlement Agreement have “complied with the terms” of the Regulatory Settlement Agreement and that no contingent fine or civil penalty would be due.
Other Commitments
In the normal course of business, we enter into commitments to invest in limited partnerships, private equity funds and hedge funds and to purchase and develop real estate in the U.S. and abroad. These commitments totaled $3.2 billion at June 30, 2016.

I TEM 1 / NOTE 9. CONTINGENCIES, COMMITMENTS AND GUARANTEES
NOTES TO CONDENSED CONSOLIDATED FINANCIAL STATEMENTS (unaudited)
58
Guarantees
Subsidiaries
We have issued unconditional guarantees with respect to the prompt payment, when due, of all present and future payment obligations and liabilities of AIGFP and of AIG Markets arising from transactions entered into by AIG Markets.
In connection with AIGFP’s business activities, AIGFP has issued, in a limited number of transactions, standby letters of credit or similar facilities to equity investors of structured leasing transactions in an amount equal to the termination value owing to the equity investor by the lessee in the event of a lessee default (the equity termination value). The total amount outstanding at June 30, 2016 was $208 million. In those transactions, AIGFP has agreed to pay such amount if the lessee fails to pay. The amount payable by AIGFP is, in certain cases, partially offset by amounts payable under other instruments typically equal to the present value of scheduled payments to be made by AIGFP. In the event that AIGFP is required to make a payment to the equity investor, the lessee is unconditionally obligated to reimburse AIGFP. To the extent that the equity investor is paid the equity termination value from the standby letter of credit and/or other sources, including payments by the lessee, AIGFP takes an assignment of the equity investor’s rights under the lease of the underlying property. Because the obligations of the lessee under the lease transactions are generally economically defeased, lessee bankruptcy is the most likely circumstance in which AIGFP would be required to pay without reimbursement.
Asset Dispositions
General
We are subject to financial guarantees and indemnity arrangements in connection with the completed sales of businesses pursuant to our asset disposition plan. The various arrangements may be triggered by, among other things, declines in asset values, the occurrence of specified business contingencies, the realization of contingent liabilities, developments in litigation or breaches of representations, warranties or covenants provided by us. These arrangements are typically subject to various time limitations, defined by the contract or by operation of law, such as statutes of limitation. In some cases, the maximum potential obligation is subject to contractual limitations, while in other cases such limitations are not specified or are not applicable.
We are unable to develop a reasonable estimate of the maximum potential payout under certain of these arrangements. Overall, we believe that it is unlikely we will have to make any material payments related to completed sales under these arrangements, and no material liabilities related to these arrangements have been recorded in the Condensed Consolidated Balance Sheets.
Other
See Note 7 to the Condensed Consolidated Financial Statements for additional discussion of commitments and guarantees associated with VIEs.
See Note 8 to the Condensed Consolidated Financial Statements for additional disclosures about derivatives.
See Note 14 to the Condensed Consolidated Financial Statements for additional disclosures about guarantees of outstanding debt.

I TEM 1 / NOTE 10. EQUITY
NOTES TO CONDENSED CONSOLIDATED FINANCIAL STATEMENTS (unaudited)
59
10. EQUITY
Shares Outstanding
The following table presents a rollforward of outstanding shares:
Common Treasury Common Stock
Stock Issued Stock Outstanding
Six Months Ended June 30, 2016
Shares, beginning of year 1,906,671,492 (712,754,875) 1,193,916,617
Shares issued - 2,017,200 2,017,200
Shares repurchased - (113,244,455) (113,244,455)
Shares, end of period 1,906,671,492 (823,982,130) 1,082,689,362
Dividends
Payment of future dividends to our shareholders and repurchases of AIG Common Stock depends in part on the regulatory framework that we are currently subject to and that will ultimately be applicable to us, including as a nonbank systemically important financial institution under the Dodd-Frank Wall Street Reform and Consumer Protection Act (Dodd-Frank) and a global systemically important insurer. In addition, dividends are payable on AIG Common Stock only when, as and if declared by our Board of Directors in its discretion, from funds legally available for this purpose. In considering whether to pay a dividend or purchase shares of AIG Common Stock, our Board of Directors considers a number of factors, including, but not limited to: the capital resources available to support our insurance operations and business strategies, AIG’s funding capacity and capital resources in comparison to internal benchmarks, expectations for capital generation, rating agency expectations for capital, regulatory standards for capital and capital distributions, and such other factors as our Board of Directors may deem relevant.
On March 28, 2016, we paid a dividend of $0.32 per share on AIG Common Stock to shareholders of record on March 14, 2016. On June 27, 2016, we paid a dividend of $0.32 per share on AIG Common Stock to shareholders of record on June 13, 2016.
See Note 18 to the Consolidated Financial Statements in the 2015 Annual Report for a discussion of restrictions on payments of dividends to AIG Parent by its subsidiaries.
Repurchase of AIG Common Stock
Our Board of Directors has authorized the repurchase of shares of AIG Common Stock through a series of actions. On February 11, 2016, our Board of Directors authorized an additional increase of $5.0 billion to its previous share repurchase authorization. As of June 30, 2016, approximately $1.8 billion remained under our share repurchase authorization. Shares may be repurchased from time to time in the open market, private purchases, through forward, derivative, accelerated repurchase or automatic repurchase transactions or otherwise (including through the purchase of warrants). Certain of our share repurchases have been and may from time to time be effected through Exchange Act Rule 10b5-1 repurchase plans.
We repurchased approximately 113 million shares of AIG Common Stock in the six-month period ended June 30, 2016 for an aggregate purchase price of approximately $6.2 billion, and we repurchased 15 million warrants to purchase shares of AIG Common Stock for an aggregate purchase price of $263 million.

I TEM 1 / NOTE 10. EQUITY
NOTES TO CONDENSED CONSOLIDATED FINANCIAL STATEMENTS (unaudited)
60
The timing of any future repurchases will depend on market conditions, our financial condition, results of operations, liquidity and other factors.
Accumulated Other Comprehensive Income
The following table presents a rollforward of Accumulated other comprehensive income:
Unrealized Appreciation (Depreciation) of Fixed
Maturity Investments on Which Other-Than-
Temporary Credit Impairments Were Taken
Unrealized
Appreciation (Depreciation)
of All Other Investments
Foreign Currency
Translation Adjustments
Retirement Plan
Liabilities Adjustment
(in millions) Total
Balance, December 31, 2015, net of tax $ 696 $ 5,566 $ (2,879) $ (846) $ 2,537
Change in unrealized appreciation (depreciation) of investments (491) 9,499 - - 9,008
Change in deferred policy acquisition costs adjustment and other (8) (682) - - (690)
Change in future policy benefits - (1,583) - - (1,583)
Change in foreign currency translation adjustments - - 158 - 158
Change in net actuarial loss - - - 11 11
Change in prior service cost - - - (13) (13)
Change in deferred tax asset (liability) 172 (1,398) 63 (6) (1,169)
Total other comprehensive income (loss) (327) 5,836 221 (8) 5,722
Noncontrolling interests - - - - -
Balance, June 30, 2016, net of tax $ 369 $ 11,402 $ (2,658) $ (854) $ 8,259
Balance, December 31, 2014, net of tax $ 1,043 $ 12,327 $ (1,784) $ (969) $ 10,617
Change in unrealized depreciation of investments (195) (4,843) - - (5,038)
Change in deferred policy acquisition costs adjustment and other (9) 495 - - 486
Change in future policy benefits 92 804 - - 896
Change in foreign currency translation adjustments - - (684) - (684)
Change in net actuarial loss - - - 91 91
Change in prior service credit - - - (23) (23)
Change in deferred tax asset (liability) 4 1,092 188 (12) 1,272
Total other comprehensive income (loss) (108) (2,452) (496) 56 (3,000)
Noncontrolling interests - - (3) - (3)
Balance, June 30, 2015, net of tax $ 935 $ 9,875 $ (2,277) $ (913) $ 7,620

I TEM 1 / NOTE 10. EQUITY
NOTES TO CONDENSED CONSOLIDATED FINANCIAL STATEMENTS (unaudited)
61
The following table presents the other comprehensive income reclassification adjustments for the three-month periods ended June 30, 2016 and 2015, respectively:
Unrealized Appreciation (Depreciation) of Fixed
Maturity Investments on Which Other-Than-
Temporary Credit Impairments Were
Taken
Unrealized
Appreciation (Depreciation)
of All Other Investments
Foreign Currency
Translation Adjustments
Retirement Plan
Liabilities Adjustment
(in millions) Total
Three Months Ended June 30, 2016
Unrealized change arising during period $ 59 $ 4,277 $ 290 $ (11) $ 4,615
Less: Reclassification adjustments
included in net income 25 1,038 - (4) 1,059
Total other comprehensive income (loss),
before income tax expense (benefit) 34 3,239 290 (7) 3,556
Less: Income tax expense (benefit) 12 830 (23) 3 822
Total other comprehensive income (loss),
net of income tax expense (benefit) $ 22 $ 2,409 $ 313 $ (10) $ 2,734
Three Months Ended June 30, 2015
Unrealized change arising during period $ 35 $ (4,475) $ (52) $ 14 $ (4,478)
Less: Reclassification adjustments
included in net income 46 99 - (23) 122
Total other comprehensive income (loss),
before income tax expense (benefit) (11) (4,574) (52) 37 (4,600)
Less: Income tax expense (benefit) 25 (1,583) (15) 10 (1,563)
Total other comprehensive income (loss),
net of income tax expense (benefit) $ (36) $ (2,991) $ (37) $ 27 $ (3,037)
Six Months Ended June 30, 2016
Unrealized change arising during period $ (399) $ 7,917 $ 158 $ (10) $ 7,666
Less: Reclassification adjustments
included in net income 100 683 - (8) 775
Total other comprehensive income (loss),
before income tax expense (benefit) (499) 7,234 158 (2) 6,891
Less: Income tax expense (benefit) (172) 1,398 (63) 6 1,169
Total other comprehensive income (loss),
net of income tax expense (benefit) $ (327) $ 5,836 $ 221 $ (8) $ 5,722
Six Months Ended June 30, 2015
Unrealized change arising during period $ (57) $ (2,968) $ (684) $ 21 $ (3,688)
Less: Reclassification adjustments
included in net income 55 576 - (47) 584
Total other comprehensive income (loss),
before income tax expense (benefit) (112) (3,544) (684) 68 (4,272)
Less: Income tax expense (benefit) (4) (1,092) (188) 12 (1,272)
Total other comprehensive income (loss),
net of income tax expense (benefit) $ (108) $ (2,452) $ (496) $ 56 $ (3,000)
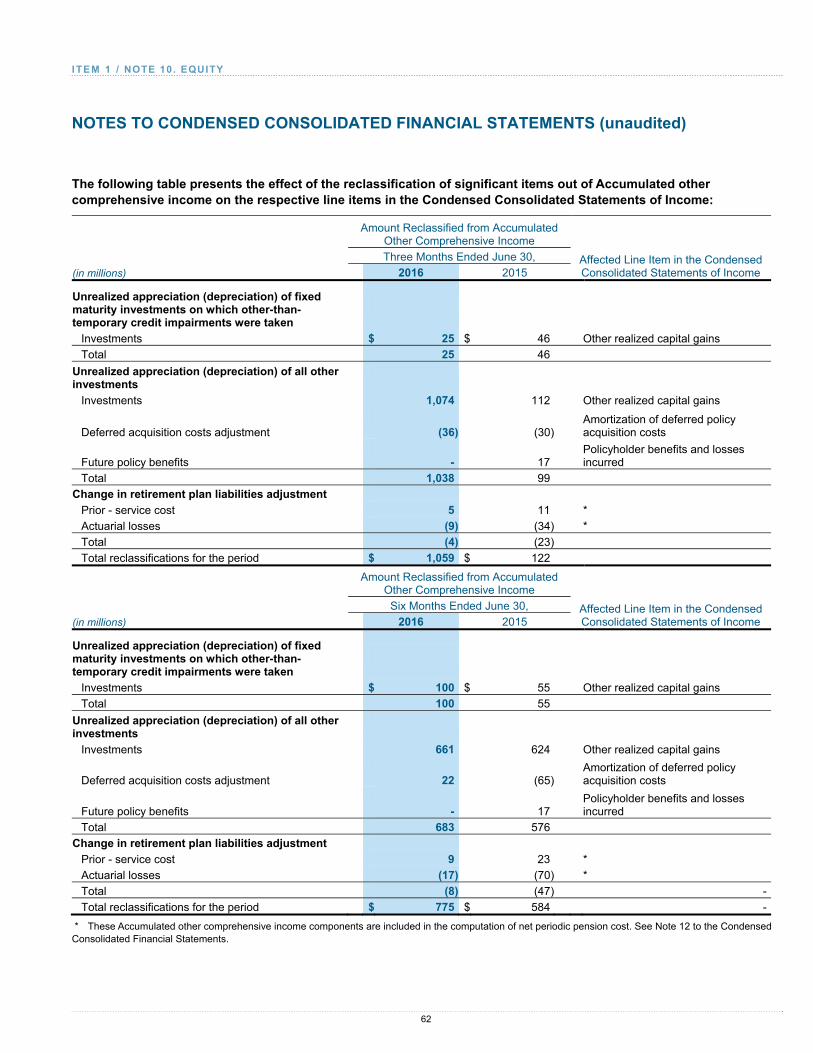
I TEM 1 / NOTE 10. EQUITY
NOTES TO CONDENSED CONSOLIDATED FINANCIAL STATEMENTS (unaudited)
62
The following table presents the effect of the reclassification of significant items out of Accumulated other comprehensive income on the respective line items in the Condensed Consolidated Statements of Income:
Amount Reclassified from Accumulated Other Comprehensive Income
Affected Line Item in the Condensed Consolidated Statements of Income
Three Months Ended June 30,
(in millions) 2016 2015
Unrealized appreciation (depreciation) of fixed maturity investments on which other-than-temporary credit impairments were taken
Investments $ 25 $ 46 Other realized capital gains
Total 25 46
Unrealized appreciation (depreciation) of all other investments
Investments 1,074 112 Other realized capital gains
Deferred acquisition costs adjustment
(36)
(30)Amortization of deferred policy acquisition costs
Future policy benefits
-
17Policyholder benefits and losses incurred
Total 1,038 99
Change in retirement plan liabilities adjustment
Prior - service cost 5 11 *
Actuarial losses (9) (34) *
Total (4) (23)
Total reclassifications for the period $ 1,059 $ 122
Amount Reclassified from Accumulated Other Comprehensive Income
Affected Line Item in the Condensed Consolidated Statements of Income
Six Months Ended June 30,
(in millions) 2016 2015
Unrealized appreciation (depreciation) of fixed maturity investments on which other-than-temporary credit impairments were taken
Investments $ 100 $ 55 Other realized capital gains
Total 100 55
Unrealized appreciation (depreciation) of all other investments
Investments 661 624 Other realized capital gains
Deferred acquisition costs adjustment
22
(65)Amortization of deferred policy acquisition costs
Future policy benefits
-
17Policyholder benefits and losses incurred
Total 683 576
Change in retirement plan liabilities adjustment
Prior - service cost 9 23 *
Actuarial losses (17) (70) *
Total (8) (47) -
Total reclassifications for the period $ 775 $ 584 -
* These Accumulated other comprehensive income components are included in the computation of net periodic pension cost. See Note 12 to the Condensed Consolidated Financial Statements.

I TEM 1 / NOTE 11. EARNINGS PER SHARE (EPS)
NOTES TO CONDENSED CONSOLIDATED FINANCIAL STATEMENTS (unaudited)
63
11. EARNINGS PER SHARE (EPS)
The basic EPS computation is based on the weighted average number of common shares outstanding, adjusted to reflect all stock dividends and stock splits. The diluted EPS computation is based on those shares used in the basic EPS computation plus shares that would have been outstanding assuming issuance of common shares for all dilutive potential common shares outstanding and adjusted to reflect all stock dividends and stock splits.
The following table presents the computation of basic and diluted EPS:
Three Months Ended Six Months Ended
June 30, June 30,
(dollars in millions, except per share data) 2016 2015 2016 2015
Numerator for EPS:
Income from continuing operations $ 1,934 $ 1,775 $ 1,778 $ 4,251
Less: Net income (loss) from continuing operations attributable to noncontrolling interests 11 (9) (9) -
Income attributable to AIG common shareholders from continuing operations 1,923 1,784 1,787 4,251
Income (loss) from discontinued operations, net of income tax expense (10) 16 (57) 17
Net income attributable to AIG common shareholders 1,913 1,800 1,730 4,268
Denominator for EPS:
Weighted average shares outstanding - basic 1,113,587,927 1,329,157,366 1,135,068,193 1,347,452,833
Dilutive shares 26,458,046 36,233,065 28,021,555 28,873,138
Weighted average shares outstanding - diluted* 1,140,045,973 1,365,390,431 1,163,089,748 1,376,325,971
Income per common share attributable to AIG:
Basic:
Income from continuing operations $ 1.73 $ 1.34 $ 1.57 $ 3.16
Income (loss) from discontinued operations $ (0.01) $ 0.01 $ (0.05) $ 0.01
Net income attributable to AIG $ 1.72 $ 1.35 $ 1.52 $ 3.17
Diluted:
Income from continuing operations $ 1.69 $ 1.31 $ 1.54 $ 3.09
Income (loss) from discontinued operations $ (0.01) $ 0.01 $ (0.05) $ 0.01
Net income attributable to AIG $ 1.68 $ 1.32 $ 1.49 $ 3.10
* Dilutive shares include our share-based employee compensation plans and a weighted average portion of the warrants issued to AIG shareholders as part of AIG’s recapitalization in January 2011. The number of shares excluded from diluted shares outstanding was 0.1 million and 0.3 million for the three- and six-month periods ended June 30, 2016, respectively, and 0.2 million and 0.3 million for the three- and six-month periods ended June 30, 2015, respectively, because the effect of including those shares in the calculation would have been anti-dilutive.
12. EMPLOYEE BENEFITS
We sponsor various defined benefit pension plans, post-retirement medical and life insurance plans for eligible employees and retirees in the U.S. and certain non-U.S. countries. Effective January 1, 2016, the U.S. defined benefit pension plans were frozen for current participants and closed to new hires. Accordingly, compensation-based benefits are no longer credited to the cash balance accounts of plan participants.
Beginning in 2016, interest cost for pension and postretirement benefits for our U.S. plans and largest non-U.S. plans is measured by applying the specific spot rates along the yield curve to the plans’ corresponding discounted cash flows that

I TEM 1 / NOTE 12. EMPLOYEE BENEFITS
NOTES TO CONDENSED CONSOLIDATED FINANCIAL STATEMENTS (unaudited)
64
comprise the obligation (the Spot Rate Approach). This method provides a more precise measurement of interest cost by aligning the timing of the plans’ discounted cash flows to the corresponding spot rates on the yield curve. Previously, we measured interest cost utilizing a single weighted-average discount rate derived from the yield curve used to measure the benefit obligations.
The following table presents the components of net periodic benefit cost with respect to pensions and other postretirement benefits:
Pension Postretirement
U.S. Non-U.S. U.S. Non-U.S.
(in millions) Plans Plans Total Plans Plans Total
Three Months Ended June 30, 2016
Components of net periodic benefit cost:
Service cost $ 5 $ 7 $ 12 $ - $ 1 $ 1
Interest cost 45 5 50 2 1 3
Expected return on assets (74) (6) (80) - - -
Amortization of prior service credit - - - (3) - (3)
Amortization of net loss 6 2 8 - - -
Curtailment gain - (1) (1) - - -
Net periodic benefit (income) cost $ (18) $ 7 $ (11) $ (1) $ 2 $ 1
Three Months Ended June 30, 2015
Components of net periodic benefit cost:
Service cost $ 51 $ 10 $ 61 $ 1 $ 1 $ 2
Interest cost 55 6 61 2 - 2
Expected return on assets (72) (6) (78) - - -
Amortization of prior service credit (8) - (8) (2) - (2)
Amortization of net loss 33 2 35 - - -
Curtailment gain - (1) (1) - - -
Net periodic benefit cost $ 59 $ 11 $ 70 $ 1 $ 1 $ 2
Six Months Ended June 30, 2016
Components of net periodic benefit cost:
Service cost $ 9 $ 15 $ 24 $ 1 $ 2 $ 3
Interest cost 91 10 101 3 2 5
Expected return on assets (147) (13) (160) - - -
Amortization of prior service credit - - - (5) - (5)
Amortization of net loss 12 4 16 - - -
Curtailment gain - (3) (3) - - -
Net periodic benefit (income) cost $ (35) $ 13 $ (22) $ (1) $ 4 $ 3
Six Months Ended June 30, 2015
Components of net periodic benefit cost:
Service cost $ 103 $ 21 $ 124 $ 3 $ 2 $ 5
Interest cost 110 12 122 4 1 5
Expected return on assets (144) (12) (156) - - -
Amortization of prior service credit (16) (1) (17) (5) - (5)
Amortization of net loss 65 5 70 - - -
Curtailment gain - (1) (1) - - -
Net periodic benefit cost $ 118 $ 24 $ 142 $ 2 $ 3 $ 5

I TEM 1 / NOTE 13. INCOME TAXES
NOTES TO CONDENSED CONSOLIDATED FINANCIAL STATEMENTS (unaudited)
65
13. INCOME TAXES
Interim Tax Calculation Method
We use the estimated annual effective tax rate method in computing our interim tax provision. Certain items, including those deemed to be unusual, infrequent or that cannot be reliably estimated, are excluded from the estimated annual effective tax rate. In these cases, the actual tax expense or benefit is reported in the same period as the related item. Certain tax effects are also not reflected in the estimated annual effective tax rate, primarily certain changes in the realizability of deferred tax assets and uncertain tax positions.
Interim Tax Expense (Benefit)
For the three-month period ended June 30, 2016, the effective tax rate on income from continuing operations was 32.3 percent. The effective tax rate on income from continuing operations differs from the statutory tax rate of 35 percent primarily due to tax benefits associated with tax exempt interest income and reclassifications from accumulated other comprehensive income to income from continuing operations related to the disposal of available for sale securities, partially offset by increases in the deferred tax asset valuation allowances associated with certain foreign jurisdictions.
For the six-month period ended June 30, 2016, the effective tax rate on income from continuing operations was 32.8 percent. The effective tax rate on income from continuing operations differs from the statutory tax rate of 35 percent primarily due to tax benefits associated with tax exempt interest income, the impact of an agreement reached with the Internal Revenue Service (IRS) related to certain tax issues under audit and reclassifications from accumulated other comprehensive income to income from continuing operations related to the disposal of available for sale securities, partially offset by a tax charge and related interest associated with increases in uncertain tax positions related to cross border financing transactions.
For the three- and six-month periods ended June 30, 2015, the effective tax rate on income from continuing operations was 30.4 percent and 32.8 percent, respectively. The effective tax rate on income from continuing operations in both periods differs from the statutory tax rate of 35 percent primarily due to tax benefits associated with tax exempt interest income, reclassifications from accumulated other comprehensive income to income from continuing operations related to the deferred tax asset valuation allowance previously released to accumulated other comprehensive income, and changes in the deferred tax asset valuation allowance associated with certain foreign jurisdictions. For the three-month period ended June 30, 2015, there was a decrease in the deferred tax asset valuation allowance associated with certain foreign jurisdictions primarily attributable to changes in projections of future taxable income. The six-month period ended June 30, 2015 includes an increase in the deferred tax asset valuation allowance primarily attributable to the effects of changes in the Japanese tax law enacted on March 31, 2015, partially offset by changes in projections of future taxable income.
Assessment of Deferred Tax Asset Valuation Allowance
The evaluation of the recoverability of our deferred tax asset and the need for a valuation allowance requires us to weigh all positive and negative evidence to reach a conclusion that it is more likely than not that all or some portion of the deferred tax asset will not be realized. The weight given to the evidence is commensurate with the extent to which it can be objectively verified. The more negative evidence that exists, the more positive evidence is necessary and the more difficult it is to support a conclusion that a valuation allowance is not needed.

I TEM 1 / NOTE 13. INCOME TAXES
NOTES TO CONDENSED CONSOLIDATED FINANCIAL STATEMENTS (unaudited)
66
Our framework for assessing the recoverability of the deferred tax asset requires us to consider all available evidence, including:
the nature, frequency, and amount of cumulative financial reporting income and losses in recent years;
the sustainability of recent operating profitability of our subsidiaries;
the predictability of future operating profitability of the character necessary to realize the net deferred tax asset;
the carryforward period for the net operating loss, capital loss and foreign tax credit carryforwards, including the effect of reversing taxable temporary differences; and
prudent and feasible actions and tax planning strategies that would be implemented, if necessary, to protect against the loss of the deferred tax asset.
In performing our assessment of the recoverability of the deferred tax asset under this framework, we consider tax laws governing the utilization of the net operating loss, capital loss and foreign tax credit carryforwards in each applicable jurisdiction. Under U.S. tax law, a company generally must use its net operating loss carryforwards before it can use its foreign tax credit carryforwards, even though the carryforward period for the foreign tax credit is shorter than for the net operating loss. Our U.S. federal consolidated income tax group includes both life companies and non-life companies. While the U.S. taxable income of our non-life companies can be offset by the net operating loss carryforwards, only a portion (no more than 35 percent) of the U.S. taxable income of our life companies can be offset by those net operating loss carryforwards. The remaining tax liability of our life companies can be offset by the foreign tax credit carryforwards. Accordingly, we utilize both the net operating loss and foreign tax credit carryforwards concurrently which enables us to realize our tax attributes prior to expiration. As of June 30, 2016, based on all available evidence, it is more likely than not that the U.S. net operating loss and foreign tax credit carryforwards will be utilized prior to expiration and, thus, no valuation allowance has been established.
Estimates of future taxable income, including income generated from prudent and feasible actions and tax planning strategies could change in the near term, perhaps materially, which may require us to consider any potential impact to our assessment of the recoverability of the deferred tax asset. Such potential impact could be material to our consolidated financial condition or results of operations for an individual reporting period.
For the three- and six-month periods ended June 30, 2016, recent changes in market conditions, including falling interest rates, impacted the unrealized tax gains and losses in the U.S. Life Insurance Companies’ available for sale securities portfolio, resulting in a net deferred tax liability related to net unrealized tax capital gains. Accordingly, as of June 30, 2016, based on all available evidence, we concluded that the valuation allowance should be released. As a result, for the three- and six-month periods ended June 30, 2016, we released $350 million and $1.2 billion, respectively, of valuation allowance associated with the unrealized tax losses in the U.S. Life Insurance Companies’ available for sale securities portfolio, all of which was recognized in other comprehensive income.
During the three- and six-month periods ended June 30, 2016, we recognized a net increase of $35 million and $1 million, respectively, in our deferred tax asset valuation allowance associated with certain foreign jurisdictions, primarily attributable to factors such as cumulative losses in recent years and the inability to demonstrate profits within the specific jurisdictions over the relevant carryforward periods. The six-month period ended June 30, 2016 also included a decrease in our deferred tax asset valuation allowance resulting from changes in projections of taxable income.
Tax Examinations and Litigation
On August 1, 2012, we filed a motion for partial summary judgment related to the disallowance of foreign tax credits associated with cross border financing transactions in the Southern District of New York. On March 29, 2013, the Southern District of New York denied our motion. On March 17, 2014, the U.S. Court of Appeals for the Second Circuit (the Second Circuit) granted our petition for an immediate appeal of the partial summary judgment decision. On September 9, 2015, the Second Circuit affirmed

I TEM 1 / NOTE 13. INCOME TAXES
NOTES TO CONDENSED CONSOLIDATED FINANCIAL STATEMENTS (unaudited)
67
the decision of the Southern District of New York. On October 13, 2015, we filed a petition for a writ of certiorari to the U.S Supreme Court. On March 7, 2016 the U.S. Supreme Court denied our petition for certiorari. As a result, the case will be remanded back to the Southern District of New York for a jury trial.
We will vigorously defend our position and continue to believe that we have adequate reserves for any liability that could result from these government actions. We continue to monitor legal and other developments in this area, including recent decisions affecting other taxpayers, and evaluate their effect, if any, on our position.
Accounting for Uncertainty in Income Taxes
At June 30, 2016 and December 31, 2015, our unrecognized tax benefits, excluding interest and penalties, were $4.5 billion and $4.3 billion, respectively. The six-month period ended June 30, 2016, reflects an increase in amounts associated with cross border financing transactions, partially offset by benefits realized due to an agreement reached with the IRS related to certain tax issues under audit. At both June 30, 2016 and December 31, 2015, our unrecognized tax benefits related to tax positions that, if recognized, would not affect the effective tax rate because they relate to such factors as the timing, rather the permissibility, of the deduction were $0.1 billion. Accordingly, at June 30, 2016 and December 31, 2015, the amounts of unrecognized tax benefits that, if recognized, would favorably affect the effective tax rate were $4.4 billion and $4.2 billion, respectively.
Interest and penalties related to unrecognized tax benefits are recognized in income tax expense. At both June 30, 2016 and December 31, 2015, we had accrued liabilities of $1.2 billion for the payment of interest (net of the federal benefit) and penalties. For the six-month period ended June 30, 2016, we accrued benefits of $48 million for the payment of interest and penalties primarily related to benefits associated with an agreement reached with the IRS related to certain tax issues under audit, partially offset by an increase associated with cross border financing transactions. For the six-month period ended June 30, 2015, we accrued benefits of $15 million.
We regularly evaluate adjustments proposed by taxing authorities. At June 30, 2016, such proposed adjustments would not have resulted in a material change to our consolidated financial condition, although it is possible that the effect could be material to our consolidated results of operations for an individual reporting period. Although it is reasonably possible that a change in the balance of unrecognized tax benefits may occur within the next 12 months, based on the information currently available, we do not expect any change to be material to our consolidated financial condition.

I TEM 1 / NOTE 14. INFORMATION PROVIDED IN CONNECTION WITH OUTSTANDING DEBT
NOTES TO CONDENSED CONSOLIDATED FINANCIAL STATEMENTS (unaudited)
68
14. INFORMATION PROVIDED IN CONNECTION WITH OUTSTANDING DEBT
The following Condensed Consolidating Financial Statements reflect the results of AIGLH, a holding company and a wholly owned subsidiary of AIG. AIG provides a full and unconditional guarantee of all outstanding debt of AIGLH.
Condensed Consolidating Balance Sheets American
International Reclassifications
Group, Inc. Other and Consolidated
(in millions) (As Guarantor) AIGLH Subsidiaries Eliminations AIG
June 30, 2016
Assets:
Short-term investments $ 3,727 $ - $ 12,769 $ (4,162) $ 12,334
Other investments(a) 5,790 - 332,543 - 338,333
Total investments 9,517 - 345,312 (4,162) 350,667
Cash 12 6 1,766 - 1,784
Loans to subsidiaries(b) 35,007 - 395 (35,402) -
Investment in consolidated subsidiaries(b) 58,001 33,137 - (91,138) -
Other assets, including deferred income taxes 24,455 132 136,529 (3,218) 157,898
Total assets $ 126,992 $ 33,275 $ 484,002 $ (133,920) $ 510,349
Liabilities:
Insurance liabilities $ - $ - $ 278,518 $ - $ 278,518
Long-term debt 22,208 641 10,480 - 33,329
Other liabilities, including intercompany balances(a) 14,444 65 101,009 (7,553) 107,965
Loans from subsidiaries(b) 394 - 35,008 (35,402) -
Total liabilities 37,046 706 425,015 (42,955) 419,812
Total AIG shareholders’ equity 89,946 32,569 58,396 (90,965) 89,946
Non-redeemable noncontrolling interests - - 591 - 591
Total equity 89,946 32,569 58,987 (90,965) 90,537
Total liabilities and equity $ 126,992 $ 33,275 $ 484,002 $ (133,920) $ 510,349
December 31, 2015
Assets:
Short-term investments $ 4,042 $ - $ 9,637 $ (3,547) $ 10,132
Other investments(a) 7,425 - 320,797 - 328,222
Total investments 11,467 - 330,434 (3,547) 338,354
Cash 34 116 1,479 - 1,629
Loans to subsidiaries(b) 35,927 - 578 (36,505) -
Investment in consolidated subsidiaries(b) 51,151 30,239 - (81,390) -
Other assets, including deferred income taxes 23,299 258 135,690 (2,388) 156,859
Total assets $ 121,878 $ 30,613 $ 468,181 $ (123,830) $ 496,842
Liabilities:
Insurance liabilities $ - $ - $ 271,645 $ - $ 271,645
Long-term debt 19,777 704 8,768 - 29,249
Other liabilities, including intercompany balances(a) 11,869 201 99,777 (6,109) 105,738
Loans from subsidiaries(b) 574 3 35,928 (36,505) -
Total liabilities 32,220 908 416,118 (42,614) 406,632
Total AIG shareholders’ equity 89,658 29,705 51,511 (81,216) 89,658
Non-redeemable noncontrolling interests - - 552 - 552
Total equity 89,658 29,705 52,063 (81,216) 90,210
Total liabilities and equity $ 121,878 $ 30,613 $ 468,181 $ (123,830) $ 496,842
(a) Includes intercompany derivative positions, which are reported at fair value before credit valuation adjustment.
(b) Eliminated in consolidation.

I TEM 1 / NOTE 14. INFORMATION PROVIDED IN CONNECTION WITH OUTSTANDING DEBT
NOTES TO CONDENSED CONSOLIDATED FINANCIAL STATEMENTS (unaudited)
69
Condensed Consolidating Statements of Income
American
International Reclassifications
Group, Inc. Other and Consolidated
(in millions) (As Guarantor) AIGLH Subsidiaries Eliminations AIG
Three Months Ended June 30, 2016
Revenues:
Equity in earnings of consolidated subsidiaries* $ 2,168 $ 888 $ - $ (3,056) $ -
Other income 127 - 14,843 (246) 14,724
Total revenues 2,295 888 14,843 (3,302) 14,724
Expenses:
Interest expense 250 13 59 (2) 320
Loss on extinguishment of debt - - 7 - 7
Other expenses 257 7 11,520 (245) 11,539
Total expenses 507 20 11,586 (247) 11,866
Income (loss) from continuing operations before income tax
expense (benefit) 1,788 868 3,257 (3,055) 2,858
Income tax expense (benefit) (125) (7) 1,056 - 924
Income (loss) from continuing operations 1,913 875 2,201 (3,055) 1,934
Loss from discontinued operations, net of income taxes - - (10) - (10)
Net income (loss) 1,913 875 2,191 (3,055) 1,924
Less:
Net income from continuing operations attributable to
noncontrolling interests - - 11 - 11
Net income (loss) attributable to AIG $ 1,913 $ 875 $ 2,180 $ (3,055) $ 1,913
Three Months Ended June 30, 2015
Revenues:
Equity in earnings of consolidated subsidiaries* $ 2,319 $ 749 $ - $ (3,068) $ -
Other income 14 - 15,916 (231) 15,699
Total revenues 2,333 749 15,916 (3,299) 15,699
Expenses:
Interest expense 267 14 65 (30) 316
Loss on extinguishment of debt 297 - 45 - 342
Other expenses 301 47 12,343 (202) 12,489
Total expenses 865 61 12,453 (232) 13,147
Income (loss) from continuing operations before income tax
expense (benefit) 1,468 688 3,463 (3,067) 2,552
Income tax expense (benefit) (333) (20) 1,129 1 777
Income (loss) from continuing operations 1,801 708 2,334 (3,068) 1,775
Income (loss) from discontinued operations, net of income taxes (1) - 17 - 16
Net income (loss) 1,800 708 2,351 (3,068) 1,791
Less:
Net loss from continuing operations attributable to
noncontrolling interests - - (9) - (9)
Net income (loss) attributable to AIG $ 1,800 $ 708 $ 2,360 $ (3,068) $ 1,800

I TEM 1 / NOTE 14. INFORMATION PROVIDED IN CONNECTION WITH OUTSTANDING DEBT
NOTES TO CONDENSED CONSOLIDATED FINANCIAL STATEMENTS (unaudited)
70
American
International Reclassifications
Group, Inc. Other and Consolidated
(in millions) (As Guarantor) AIGLH Subsidiaries Eliminations AIG
Six Months Ended June 30, 2016
Revenues:
Equity in earnings of consolidated subsidiaries* $ 1,224 $ (795) $ - $ (429) $ -
Other income 64 5 26,881 (447) 26,503
Total revenues 1,288 (790) 26,881 (876) 26,503
Expenses:
Interest expense 494 27 108 (3) 626
Loss on extinguishment of debt 77 - 13 - 90
Other expenses 448 14 23,125 (444) 23,143
Total expenses 1,019 41 23,246 (447) 23,859
Income (loss) from continuing operations before income tax
expense (benefit) 269 (831) 3,635 (429) 2,644
Income tax expense (benefit) (1,462) (13) 2,341 - 866
Income (loss) from continuing operations 1,731 (818) 1,294 (429) 1,778
Loss from discontinued operations, net of income taxes (1) - (56) - (57)
Net income (loss) 1,730 (818) 1,238 (429) 1,721
Less:
Net loss from continuing operations attributable to
noncontrolling interests - - (9) - (9)
Net income (loss) attributable to AIG $ 1,730 $ (818) $ 1,247 $ (429) $ 1,730
Six Months Ended June 30, 2015
Revenues:
Equity in earnings of consolidated subsidiaries* $ 5,076 $ 1,522 $ - $ (6,598) $ -
Other income 164 - 31,830 (320) 31,674
Total revenues 5,240 1,522 31,830 (6,918) 31,674
Expenses:
Interest expense 556 30 130 (60) 656
Loss on extinguishment of debt 358 - 45 7 410
Other expenses 547 42 23,952 (261) 24,280
Total expenses 1,461 72 24,127 (314) 25,346
Income (loss) from continuing operations before income tax
expense (benefit) 3,779 1,450 7,703 (6,604) 6,328
Income tax expense (benefit) (490) (63) 2,630 - 2,077
Income (loss) from continuing operations 4,269 1,513 5,073 (6,604) 4,251
Income (loss) from discontinued operations, net of income taxes (1) - 18 - 17
Net income (loss) 4,268 1,513 5,091 (6,604) 4,268
Less:
Net income (loss) from continuing operations attributable to
noncontrolling interests - - - - -
Net income (loss) attributable to AIG $ 4,268 $ 1,513 $ 5,091 $ (6,604) $ 4,268
* Eliminated in consolidation.

I TEM 1 / NOTE 14. INFORMATION PROVIDED IN CONNECTION WITH OUTSTANDING DEBT
NOTES TO CONDENSED CONSOLIDATED FINANCIAL STATEMENTS (unaudited)
71
Condensed Consolidating Statements of Comprehensive Income American
International Reclassifications
Group, Inc. Other and Consolidated
(in millions) (As Guarantor) AIGLH Subsidiaries Eliminations AIG
Three Months Ended June 30, 2016
Net income (loss) $ 1,913 $ 875 $ 2,191 $ (3,055) $ 1,924
Other comprehensive income (loss) 2,734 7,734 (7,006) (728) 2,734
Comprehensive income (loss) 4,647 8,609 (4,815) (3,783) 4,658
Total comprehensive income attributable to noncontrolling interests - - 11 - 11
Comprehensive income (loss) attributable to AIG $ 4,647 $ 8,609 $ (4,826) $ (3,783) $ 4,647
Three Months Ended June 30, 2015
Net income (loss) $ 1,800 $ 708 $ 2,351 $ (3,068) $ 1,791
Other comprehensive income (loss) (3,037) 3,582 53,694 (57,276) (3,037)
Comprehensive income (loss) (1,237) 4,290 56,045 (60,344) (1,246)
Total comprehensive loss attributable to noncontrolling interests - - (9) - (9)
Comprehensive income (loss) attributable to AIG $ (1,237) $ 4,290 $ 56,054 $ (60,344) $ (1,237)
Six Months Ended June 30, 2016
Net income (loss) $ 1,730 $ (818) $ 1,238 $ (429) $ 1,721
Other comprehensive income (loss) 5,722 7,260 48,548 (55,808) 5,722
Comprehensive income (loss) 7,452 6,442 49,786 (56,237) 7,443
Total comprehensive loss attributable to noncontrolling interests - - (9) - (9)
Comprehensive income (loss) attributable to AIG $ 7,452 $ 6,442 $ 49,795 $ (56,237) $ 7,452
Six Months Ended June 30, 2015
Net income (loss) $ 4,268 $ 1,513 $ 5,091 $ (6,604) $ 4,268
Other comprehensive income (loss) (2,997) 4,490 52,633 (57,126) (3,000)
Comprehensive income (loss) 1,271 6,003 57,724 (63,730) 1,268
Total comprehensive loss attributable to noncontrolling interests - - (3) - (3)
Comprehensive income (loss) attributable to AIG $ 1,271 $ 6,003 $ 57,727 $ (63,730) $ 1,271

I TEM 1 / NOTE 14. INFORMATION PROVIDED IN CONNECTION WITH OUTSTANDING DEBT
NOTES TO CONDENSED CONSOLIDATED FINANCIAL STATEMENTS (unaudited)
72
Condensed Consolidating Statements of Cash Flows American
International Reclassifications
Group, Inc. Other and Consolidated
(in millions) (As Guarantor) AIGLH Subsidiaries* Eliminations* AIG
Six Months Ended June 30, 2016
Net cash (used in) provided by operating activities $ 2,734 $ 680 $ (1,022) $ (1,821) $ 571
Cash flows from investing activities:
Sales of investments 1,944 - 39,689 (6,846) 34,787
Purchase of investments (606) - (40,877) 6,846 (34,637)
Loans to subsidiaries - net 1,050 - 180 (1,230) -
Contributions from (to) subsidiaries - net 880 - - (880) -
Net change in restricted cash - - (78) - (78)
Net change in short-term investments (733) - (1,022) - (1,755)
Other, net (298) - 1,717 - 1,419
Net cash (used in) provided by investing activities 2,237 - (391) (2,110) (264)
Cash flows from financing activities:
Issuance of long-term debt 3,832 - 2,856 - 6,688
Repayments of long-term debt (1,421) (63) (1,435) - (2,919)
Purchase of common stock (6,248) - - - (6,248)
Intercompany loans - net (180) (3) (1,047) 1,230 -
Cash dividends paid (713) (724) (1,097) 1,821 (713)
Other, net (263) - 2,385 880 3,002
Net cash (used in) provided by financing activities (4,993) (790) 1,662 3,931 (190)
Effect of exchange rate changes on cash - - 38 - 38
Change in cash (22) (110) 287 - 155
Cash at beginning of year 34 116 1,479 - 1,629
Cash at end of period $ 12 $ 6 $ 1,766 $ - $ 1,784
Six Months Ended June 30, 2015
Net cash (used in) provided by operating activities $ 2,230 $ 527 $ 2,581 $ (4,845) $ 493
Cash flows from investing activities:
Sales of investments 4,703 - 36,970 (2,667) 39,006
Purchase of investments (942) - (32,708) 2,667 (30,983)
Loans to subsidiaries - net 189 - 130 (319) -
Contributions from (to) subsidiaries - net - - - - -
Net change in restricted cash - - 1,462 - 1,462
Net change in short-term investments (2,093) - (600) - (2,693)
Other, net (65) - (1,441) - (1,506)
Net cash (used in) provided by investing activities 1,792 - 3,813 (319) 5,286
Cash flows from financing activities:
Issuance of long-term debt 2,342 - 432 - 2,774
Repayments of long-term debt (2,016) (114) (1,571) - (3,701)
Purchase of common stock (3,743) - - - (3,743)
Intercompany loans - net (130) - (189) 319 -
Cash dividends paid (335) (500) (4,345) 4,845 (335)
Other, net (75) - (486) - (561)
Net cash (used in) provided by financing activities (3,957) (614) (6,159) 5,164 (5,566)
Effect of exchange rate changes on cash - - (34) - (34)

I TEM 1 / NOTE 14. INFORMATION PROVIDED IN CONNECTION WITH OUTSTANDING DEBT
NOTES TO CONDENSED CONSOLIDATED FINANCIAL STATEMENTS (unaudited)
73
Change in cash 65 (87) 201 - 179
Cash at beginning of year 26 91 1,641 - 1,758
Cash at end of period $ 91 $ 4 $ 1,842 $ - $ 1,937
Supplementary Disclosure of Condensed Consolidating Cash Flow Information American
International Reclassifications
Group, Inc. Other and Consolidated
(in millions) (As Guarantor) AIGLH Subsidiaries* Eliminations* AIG
Cash (paid) received during the 2016 period for:
Interest:
Third party $ (515) $ (27) $ (108) $ - $ (650)
Intercompany - - - - -
Taxes:
Income tax authorities $ (7) $ - $ (110) $ - $ (117)
Intercompany 629 - (629) - -
Cash (paid) received during the 2015 period for:
Interest:
Third party $ (585) $ (32) $ (143) $ - $ (760)
Intercompany - - - - -
Taxes:
Income tax authorities $ (6) $ - $ (332) $ - $ (338)
Intercompany 1,249 - (1,249) - -
American International Group, Inc. (As Guarantor) supplementary disclosure of non-cash activities: Six Months Ended June 30,
(in millions) 2016 2015
Intercompany non-cash financing and investing activities:
Capital contributions $ 2,915 $ 111
Dividends received in the form of securities 1,790 1,551
Return of capital 1 -
Fixed maturity securities received in exchange for equity securities 440 -
Non-cash financing/investing activities:
Consideration received from sale of shares of AerCap - 500
15. SUBSEQUENT EVENTS
Dividends Declared and Increase in Share Repurchase Authorization
On August 2, 2016, our Board of Directors declared a cash dividend on AIG Common Stock of $0.32 per share, payable on September 29, 2016 to shareholders of record on September 15, 2016.
On August 2, 2016, our Board of Directors authorized an additional increase to its previous repurchase authorization of AIG Common Stock of $3.0 billion, resulting in an aggregate remaining authorization on such date of approximately $4.0 billion.

74
ITEM 2 / MANAGEMENT’S DISCUSSION AND ANALYSIS OF FINANCIAL CONDITION AND RESULTS OF OPERATIONS
GLOSSARY AND ACRONYMS OF SELECTED INSURANCE TERMS AND REFERENCES
Throughout this Management’s Discussion and Analysis of Financial Condition and Results of Operations (MD&A), we use certain terms and abbreviations, which are summarized in the Glossary and Acronyms.
American International Group, Inc. (AIG) has incorporated into this discussion a number of cross-references to additional information included throughout this Quarterly Report on Form 10-Q, the Quarterly Report on Form 10-Q for the quarterly period ended March 31, 2016 and in our Annual Report on Form 10-K for the year ended December 31, 2015 (2015 Annual Report) to assist readers seeking additional information related to a particular subject.
In this Quarterly Report on Form 10-Q, unless otherwise mentioned or unless the context indicates otherwise, we use the terms “AIG,” the “Company,” “we,” “us” and “our” to refer to American International Group, Inc., a Delaware corporation, and its consolidated subsidiaries. We use the term “AIG Parent” to refer solely to American International Group, Inc., and not to any of its consolidated subsidiaries.
CAUTIONARY STATEMENT REGARDING FORWARD-LOOKING INFORMATION
This Quarterly Report on Form 10-Q and other publicly available documents may include, and officers and representatives of American International Group, Inc. (AIG) may from time to time make, projections, goals, assumptions and statements that may constitute “forward-looking statements” within the meaning of the Private Securities Litigation Reform Act of 1995. These projections, goals, assumptions and statements are not historical facts but instead represent only our belief regarding future events, many of which, by their nature, are inherently uncertain and outside our control. These projections, goals, assumptions and statements include statements preceded by, followed by or including words such as "will," “believe,” “anticipate,” “expect,” “intend,” “plan,” “focused on achieving,” “view,” “target,” "goal" or “estimate.” These projections, goals, assumptions and statements may address, among other things, our:
• exposures to subprime mortgages, monoline insurers, the residential and commercial real estate markets, state and municipal bond issuers, sovereign bond issuers, the energy sector and currency exchange rates;
• exposure to European governments and European financial institutions;
• strategy for risk management;
• sales of businesses;
• restructuring of business operations;
• generation of deployable capital;
• strategies to increase return on equity and earnings per share;
• strategies to grow net investment income, efficiently manage capital, grow book value per common share, and reduce expenses;
• anticipated restructuring charges and annual cost savings;
• anticipated business or asset divestitures or monetizations;
• anticipated organizational and business changes;
• strategies for customer retention, growth, product development, market position, financial results and reserves; and
• subsidiaries' revenues and combined ratios.

75
It is possible that our actual results and financial condition will differ, possibly materially, from the results and financial condition indicated in these projections, goals, assumptions and statements. Factors that could cause our actual results to differ, possibly materially, from those in the specific projections, goals, assumptions and statements include:
• changes in market conditions;
• negative impacts on customers, business partners and other stakeholders;
• the occurrence of catastrophic events, both natural and man-made;
• significant legal proceedings;
• the timing and applicable requirements of any new regulatory framework to which we are subject as a nonbank systemically important financial institution (SIFI) and as a global systemically important insurer (G-SII);
• concentrations in our investment portfolios;
• actions by credit rating agencies;
• judgments concerning casualty insurance underwriting and insurance liabilities;
• our ability to successfully manage run-off insurance portfolios;
• our ability to successfully reduce costs and expenses and make business and organizational changes without negatively impacting client relationships or our competitive position;
• our ability to successfully dispose of, or monetize, businesses or assets;
• judgments concerning the recognition of deferred tax assets;
• judgments concerning estimated restructuring charges and estimated cost savings; and
• such other factors discussed in:
• Part I, Item 2. MD&A and Part II, Item 1A. Risk Factors of this Quarterly Report on Form 10-Q;
• Part I, Item 2. MD&A and Part II, Item 1A. Risk Factors of the Quarterly Report on Form 10-Q for the quarterly period ended March 31, 2016; and
• Part I, Item 1A. Risk Factors and Part II, Item 7. MD&A of our 2015 Annual Report.
We are not under any obligation (and expressly disclaim any obligation) to update or alter any projections, goals, assumptions or other statements, whether written or oral, that may be made from time to time, whether as a result of new information, future events or otherwise.

76
The MD&A is organized as follows:
INDEX TO ITEM 2
Page
USE OF NON-GAAP MEASURES 77
EXECUTIVE OVERVIEW 80 Executive Summary 81
Strategic Outlook 87
RESULTS OF OPERATIONS 96 Segment Results 99
Commercial Insurance 103
Consumer Insurance 119
Corporate and Other 137
INVESTMENTS 139 Overview 139
Investment Highlights 139
Investment Strategies 139
Investments 140
Credit Ratings 143
Available for Sale Investments 145
Impairments 153
INSURANCE RESERVES 159 Non-Life Insurance Companies 159
Life Insurance Companies DAC and Reserves 166
LIQUIDITY AND CAPITAL RESOURCES 172 Overview 172
Analysis of Sources and Uses of Cash 174
Liquidity and Capital Resources of AIG Parent and Subsidiaries 175
Credit Facilities 178
Contractual Obligations 179
Off-Balance Sheet Arrangements and Commercial Commitments 180
Debt 182
Credit Ratings 184
Regulation and Supervision 185
Dividends and Repurchases of AIG Common Stock 185 Dividend Restrictions 185
ENTERPRISE RISK MANAGEMENT 186 Overview 186
Credit Risk Management 186 Market Risk Management 187 Liquidity Risk Management 190
CRITICAL ACCOUNTING ESTIMATES 191
REGULATORY ENVIRONMENT 192
Glossary 193
Acronyms 196

I TEM 2 / USE OF NON-GAAP MEASURES
77
USE OF NON-GAAP MEASURES
Throughout this MD&A, we present our financial condition and results of operations in the way we believe will be most meaningful and representative of our business results. Some of the measurements we use are “non-GAAP financial measures” under SEC rules and regulations. GAAP is the acronym for “accounting principles generally accepted in the United States.” The non-GAAP financial measures we present may not be comparable to similarly-named measures reported by other companies.
Book Value Per Common Share Excluding Accumulated Other Comprehensive Income (AOCI) and Book Value Per Common Share Excluding AOCI and Deferred Tax Assets (DTA) are used to show the amount of our net worth on a per-share basis. We believe these measures are useful to investors because they eliminate items that can fluctuate significantly from period to period, including changes in fair value of our available for sale securities portfolio, foreign currency translation adjustments and U.S. tax attribute deferred tax assets. These measures also eliminate the asymmetrical impact resulting from changes in fair value of our available for sale securities portfolio wherein there is largely no offsetting impact for certain related insurance liabilities. We exclude deferred tax assets representing U.S. tax attributes related to net operating loss carryforwards and foreign tax credits as they have not yet been utilized. Amounts for interim periods are estimates based on projections of full-year attribute utilization. As net operating loss carryforwards and foreign tax credits are utilized, the portion of the DTA utilized is included in Book Value Per Common Share. Book Value Per Common Share Excluding AOCI is derived by dividing Total AIG shareholders’ equity, excluding AOCI, by Total common shares outstanding. Book Value Per Common Share Excluding AOCI and DTA is derived by dividing Total AIG shareholders’ equity, excluding AOCI and DTA, by Total common shares outstanding. The reconciliation to book value per common share, the most comparable GAAP measure, is presented in the Executive Overview section of this MD&A.
Return on Equity – After-tax Operating Income Excluding AOCI and Return on Equity – After-tax Operating Income Excluding AOCI and DTA are used to show the rate of return on shareholders’ equity. We believe these measures are useful to investors because they eliminate items that can fluctuate significantly from period to period, including changes in fair value of our available for sale securities portfolio, foreign currency translation adjustments and U.S. tax attribute deferred tax assets. These measures also eliminate the asymmetrical impact resulting from changes in fair value of our available for sale securities portfolio wherein there is largely no offsetting impact for certain related insurance liabilities. We exclude deferred tax assets representing U.S. tax attributes related to net operating loss carryforwards and foreign tax credits as they have not yet been utilized. Amounts for interim periods are estimates based on projections of full-year attribute utilization. As net operating loss carryforwards and foreign tax credits are utilized, the portion of the DTA utilized is included in Return on Equity. Return on Equity – After-tax Operating Income Excluding AOCI is derived by dividing actual or annualized after-tax operating income attributable to AIG by average AIG shareholders’ equity, excluding average AOCI. Return on Equity – After-tax Operating Income Excluding AOCI and DTA is derived by dividing actual or annualized after-tax operating income attributable to AIG by average AIG shareholders’ equity, excluding average AOCI and DTA. The reconciliation to return on equity, the most comparable GAAP measure, is presented in the Executive Overview section of this MD&A.
We use the following operating performance measures because we believe they enhance the understanding of the underlying profitability of continuing operations and trends of our business segments. We believe they also allow for more meaningful comparisons with our insurance competitors. When we use these measures, reconciliations to the most comparable GAAP measure are provided in the Results of Operations section of this MD&A on a consolidated basis.

I TEM 2 / USE OF NON-GAAP MEASURES
78
After-tax operating income attributable to AIG is derived by excluding the following items from net income attributable to AIG. These items generally fall into one or more of the following broad categories: legacy matters having no relevance to our current businesses or operating performance; adjustments to enhance transparency to the underlying economics of transactions; and measures that we believe to be common to the industry. For example, certain ratios and other metrics described below:
• deferred income tax valuation allowance releases and charges;
• changes in fair value of securities used to hedge guaranteed living benefits;
• changes in benefit reserves and deferred policy acquisition costs (DAC), value of business acquired (VOBA), and sales inducement assets (SIA) related to net realized capital gains and losses;
• other income and expense — net, related to Corporate and Other run-off insurance lines;
• loss on extinguishment of debt;
• net realized capital gains and losses;
• non-qualifying derivative hedging activities, excluding net realized capital gains and losses;
• income or loss from discontinued operations;
• income and loss from divested businesses, including:
• gain on the sale of International Lease Finance Corporation (ILFC); and
• certain post-acquisition transaction expenses incurred by AerCap Holdings N.V. (AerCap) in connection with its acquisition of ILFC and the difference between expensing AerCap’s maintenance rights assets over the remaining lease term as compared to the remaining economic life of the related aircraft and related tax effects;
• legacy tax adjustments primarily related to certain changes in uncertain tax positions and other tax adjustments;
• non-operating litigation reserves and settlements;
• reserve development related to non-operating run-off insurance business; and
• restructuring and other costs related to initiatives designed to reduce operating expenses, improve efficiency and simplify our organization.
Operating revenue excludes Net realized capital gains (losses), income from non-operating litigation settlements (included in Other income for GAAP purposes) and changes in fair value of securities used to hedge guaranteed living benefits (included in Net investment income for GAAP purposes).
We use the following operating performance measures within our Commercial Insurance and Consumer Insurance reportable segments as well as Corporate and Other.
• Commercial Insurance: Property Casualty and Mortgage Guaranty; Consumer Insurance: Personal Insurance
• Pre-tax operating income: includes both underwriting income and loss and net investment income, but excludes net realized capital gains and losses, other income and expense — net, and non-operating litigation reserves and settlements. Underwriting income and loss is derived by reducing net premiums earned by losses and loss adjustment expenses incurred, acquisition expenses and general operating expenses.
Ratios: We, along with most property and casualty insurance companies, use the loss ratio, the expense ratio and the combined ratio as measures of underwriting performance. These ratios are relative measurements that describe, for every $100 of net premiums earned, the amount of losses and loss adjustment expenses, and the amount of other underwriting expenses that would be incurred. A combined ratio of less than 100 indicates underwriting income and a combined ratio of over 100 indicates an underwriting loss. Our ratios are calculated using the relevant information calculated under GAAP, and thus may not be comparable to similar ratios calculated for regulatory reporting purposes.

I TEM 2 / USE OF NON-GAAP MEASURES
79
The underwriting environment varies across countries and products, as does the degree of litigation activity, all of which affect such ratios. In addition, investment returns, local taxes, cost of capital, regulation, product type and competition can have an effect on pricing and consequently on profitability as reflected in underwriting income and associated ratios.
• Accident year loss and combined ratios, as adjusted: both the accident year loss and combined ratios, as adjusted, exclude catastrophe losses and related reinstatement premiums, prior year development, net of premium adjustments, and the impact of reserve discounting. Natural catastrophe losses are generally weather or seismic events having a net impact in excess of $10 million each. Catastrophes also include certain man-made events, such as terrorism and civil disorders, that meet the $10 million threshold. We believe the as adjusted ratios are meaningful measures of our underwriting results on an on-going basis as they exclude catastrophes and the impact of reserve discounting which are outside of management’s control. We also exclude prior year development to provide transparency related to current accident year results.
Commercial Insurance: Institutional Markets; Consumer Insurance: Retirement and Life
• Pre-tax operating income is derived by excluding the following items from pre-tax income:
• changes in fair value of securities used to hedge guaranteed living benefits;
• changes in benefit reserves and DAC, VOBA and SIA related to net realized capital gains and losses; and
• net realized capital gains and losses; • non-operating litigation reserves and settlements.
• Premiums and deposits: includes direct and assumed amounts received and earned on traditional life insurance policies, group benefit policies and life-contingent payout annuities, as well as deposits received on universal life, investment-type annuity contracts and mutual funds.
Corporate and Other — Pre-tax operating income and loss is derived by excluding the following items from pre-tax income and loss:
• loss on extinguishment of debt;
• net realized capital gains and losses;
• changes in benefit reserves and DAC, VOBA and SIA related to net realized capital gains and losses;
• income and loss from divested businesses, including Aircraft Leasing;
• net gain or loss on sale of divested businesses, including:
gain on the sale of ILFC; and
certain post-acquisition transaction expenses incurred by AerCap in connection with its acquisition of ILFC and the difference between expensing AerCap’s maintenance rights assets over the remaining lease term as compared to the remaining economic life of the related aircraft and our share of AerCap’s income taxes;
• non-operating litigation reserves and settlements;
• reserve development related to non-operating run-off insurance business; and
• restructuring and other costs related to initiatives designed to reduce operating expenses, improve efficiency and simplify our organization.
Results from discontinued operations are excluded from all of these measures.

I TEM 2 / EXECUTIVE OVERVIEW
80
EXECUTIVE OVERVIEW
This overview of the MD&A highlights selected information and may not contain all of the information that is important to current or potential investors in AIG’s securities. You should read this Quarterly Report on Form 10-Q, together with the 2015 Annual Report, in its entirety for a complete description of events, trends, uncertainties, risks and critical accounting estimates affecting us.
We report our results of operations as follows:
Commercial Insurance – Commercial Insurance offers insurance products and services to commercial and institutional customers worldwide. Commercial Insurance product lines include Casualty, Property, Specialty, Financial, Mortgage Insurance and Institutional Markets. Commercial Insurance products are distributed through a diversified multichannel distribution network that includes independent insurance brokers, banks, mortgage lenders, and specialized marketing and consulting firms.
Consumer Insurance – Consumer Insurance offers a broad portfolio of retirement, life insurance and property casualty products and services to individuals and groups. Consumer Insurance products include term life, whole life, universal life, accident and health, variable and index annuities, fixed annuities, group retirement plans, mutual funds, financial planning, automobile and homeowners insurance, travel insurance, and warranty and service programs. Consumer Insurance offers its products and services through a diverse, multi-channel distribution network, which includes broker-dealers, agencies and independent marketing organizations, banks, brokers, partnerships, travel agents, affiliated financial advisors, and direct-to-consumer platforms.
Corporate and Other – Corporate and Other consists of income from assets held by AIG Parent and other corporate subsidiaries, general operating expenses not attributable to specific reportable segments and interest expense. It also includes run-off lines of insurance business.
On January 26, 2016, we announced several actions designed to create a leaner, more profitable and focused insurer. These actions include a plan to reorganize our operating model into “modular”, more self-contained business units to enhance transparency and accountability. Additionally, we are introducing a new Legacy Portfolio that aims to maximize value and release capital of certain run-off non-strategic assets and highlight progress on improving the return on equity (ROE) of our Operating Portfolio. When the new operating structure is finalized, the presentation of our segment results may be modified and prior periods’ presentation may be revised to conform to the new structure.

I TEM 2 / EXECUTIVE OVERVIEW
81
Executive Summary
Financial Performance
Commercial Insurance pre-tax operating income decreased in the three-month period ended June 30, 2016 compared to the same period in the prior year primarily due to an underwriting loss compared to underwriting income from Property Casualty in the same period in the prior year and lower returns on alternative investments which resulted in a decrease in net investment income in Property Casualty and Institutional Markets. The underwriting loss for Property Casualty was driven primarily by higher catastrophe losses and net loss reserve discount charge compared to a benefit in the prior year. This impact was partially offset by an improvement in the accident year loss ratio, as adjusted, lower net adverse prior year loss reserve development and lower general operating expenses as compared to the same period in the prior year. The decline in Property Casualty underwriting results was partially offset by an increase in underwriting income from Mortgage Guaranty resulting from an improved combined ratio.
Commercial Insurance pre-tax operating income decreased in the six-month period ended June 30, 2016 compared to the same period in the prior year primarily due to lower underwriting income in Property Casualty and lower returns on alternative investments which resulted in a decrease in net investment income partially offset by an increase in underwriting income from Mortgage Guaranty. The underwriting results for Property Casualty were impacted by significantly higher catastrophe losses and a net loss reserve discount charge compared to a benefit in the same period in the prior year as a result of decreases in the forward yield curve rates used for discounting. These results were partially offset by an improvement in the accident year loss ratio, as adjusted and lower net adverse prior year loss reserve development compared to the same period in the prior year.
Consumer Insurance pre-tax operating income increased in the three-month period ended June 30, 2016 compared to the same period in the prior year, due to higher underwriting income in Personal Insurance and improved mortality results in Life, partially offset by lower returns on alternative investments which resulted in a decrease in net investment income for Retirement, Life and Personal Insurance. Personal Insurance pre-tax operating income increased in the three-month period ended June 30, 2016 compared to the same period in the prior year, reflecting strategic actions to reduce expenses and refocus direct marketing activities, partially offset by higher current year accident losses, including a single large loss, and lower net investment income. Retirement pre-tax operating income decreased in the three-month period ended June 30, 2016 compared to the same period in the prior year, primarily due to lower net investment income from alternative investments, partially offset by a decrease in general operating expenses from lower employee-related expenses. Life pre-tax operating income increased in the three-month period ended June 30, 2016 compared to the same period in the prior year, primarily due to more favorable mortality experience and lower domestic general operating expenses due to reductions in employee-related expenses.
Consumer Insurance pre-tax operating income decreased in the six-month period ended June 30, 2016 compared to the same period in the prior year, primarily due to lower returns on alternative investments resulting in lower net investment income in Retirement, Life and Personal Insurance. The lower net investment income was partially offset by improved underwriting results in Personal Insurance due to an improved accident year loss ratio, as adjusted and lower general operating expenses, favorable mortality experience in Life and lower domestic general operating expenses in Retirement and Life.
Corporate and Other reported pre-tax operating losses in the three- and six-month periods ended June 30, 2016 compared to pre-tax operating income in the same periods in the prior year, primarily due to lower earnings on investments for which the fair value option was elected, including ABS CDOs and part of our holdings in People’s Insurance Company (Group) of China Limited (PICC Group) and PICC Property & Casualty Company Limited (PICC P&C) (collectively, our PICC Investment), as well as equity earnings from shares in AerCap in same period in the prior year, which was divested in 2015. Additionally, Run-off insurance lines reported pre-tax operating losses in the three- and six-month periods ended June 30, 2016 compared to pre-tax operating income in the same periods in the prior year. The pre-tax operating losses in Run-off insurance lines were driven by a charge for the discount on excess workers’ compensation reserves in the three- and six-month periods ended June

I TEM 2 / EXECUTIVE OVERVIEW
82
30, 2016 compared to a benefit in the same periods in the prior year, largely driven by decreases in the forward yield curve rates used for discounting.
Our investment portfolio performance declined in the three-month period ended June 30, 2016 compared to the same period in the prior year due to lower returns on alternative investments and lower reinvestment yields as we reinvest cash flows from investments, including increased calls and prepayments of fixed maturity securities and mortgage loans, at rates below the average yield of our existing portfolio. These decreases were partially offset by higher gains on securities for which the fair value option was elected. Our investment portfolio performance declined in the six-month period ended June 30, 2016 compared to the same period in the prior year due to lower income on alternative investments, primarily related to negative performance in hedge funds, and lower reinvestment yields, partially offset by an increase in invested assets and higher gains on securities for which the fair value option was elected.
Net realized capital gains increased in the three-month period ended June 30, 2016 compared to the same period in the prior year, due primarily to higher realized capital gains from sales of investments, primarily from the sale of a portion of our PICC Investment. In addition, other-than temporary impairment charges decreased due to an impairment charge on our previously held Aercap investment recognized in the second quarter of 2015.
We recorded net realized capital losses in the six-month period ended June 30, 2016 primarily due to foreign exchange losses and impairments, which were slightly higher than the gain recognized on the sale of a portion of our PICC Investment, compared to net realized capital gains in the same period in the prior year, which was driven primarily by foreign exchange gains and net gains on the sales of various securities such as the Class B shares of Prudential Financial. See MD&A – Investments – Net Realized Capital Gains and Losses for further discussion.
In keeping with our broad and on-going efforts to transform AIG for long-term competitiveness, results for the three- and six-month periods ended June 30, 2016 included approximately $0.1 billion and $0.3 billion, respectively, of pre-tax restructuring and other costs, primarily composed of employee severance and contract termination charges.
We continue to execute initiatives focused on organizational simplification, operational efficiency, and business rationalization, which are expected to result in pre-tax restructuring and other costs of approximately $1 billion (of which approximately $0.8 billion has been recognized) as well as generate pre-tax annualized savings of approximately $0.8 billion to $0.9 billion when fully implemented.

I TEM 2 / EXECUTIVE OVERVIEW
83
Our Performance – Selected Indicators Three Months Ended Six Months Ended June 30, June 30,
(in millions, except per share data and ratios) 2016 2015 2016 2015
Results of operations data:
Total revenues $ 14,724 $ 15,699 $ 26,503 $ 31,674
Income from continuing operations 1,934 1,775 1,778 4,251
Net income attributable to AIG 1,913 1,800 1,730 4,268
Net income per common share attributable to AIG (diluted) 1.68 1.32 1.49 3.10
After-tax operating income attributable to AIG $ 1,113 $ 1,893 $ 1,886 $ 3,584
After-tax operating income per common share
attributable to AIG (diluted) 0.98 1.39 1.62 2.60
Key metrics:
Commercial Insurance
Pre-tax operating income $ 1,088 $ 1,500 $ 1,977 $ 2,962
Property Casualty loss ratio 75.0 70.8 71.6 69.5
Property Casualty accident year loss ratio, as adjusted 62.4 66.6 63.4 65.5
Property Casualty combined ratio 102.1 98.8 99.6 97.9
Property Casualty accident year combined ratio, as adjusted 89.5 94.6 91.4 93.9
Property Casualty net premiums written $ 4,424 $ 5,583 $ 8,731 $ 10,630
Mortgage Guaranty domestic first-lien new insurance written 12,985 15,190 21,812 25,732
Institutional Markets premiums 215 643 450 739
Institutional Markets premiums and deposits 506 680 810 826
Consumer Insurance
Pre-tax operating income $ 1,104 $ 1,023 $ 1,892 $ 1,968
Personal Insurance loss ratio 55.7 52.7 54.1 55.8
Personal Insurance accident year loss ratio, as adjusted 55.0 52.8 54.1 54.6
Personal Insurance combined ratio 95.7 99.7 94.8 101.5
Personal Insurance accident year combined ratio, as adjusted 95.0 99.8 94.8 100.3
Personal Insurance net premiums written $ 2,922 $ 2,930 $ 5,734 $ 5,845
Retirement premiums 52 44 106 90
Retirement premiums and deposits 6,431 6,070 13,284 11,579
Life premiums 762 702 1,498 1,410
Life premiums and deposits 1,317 1,249 2,568 2,472
Life Insurance Companies assets under management 355,149 336,881 355,149 336,881

I TEM 2 / EXECUTIVE OVERVIEW
84
Common Stock Repurchases: Aggregate repurchases of common stock $ 2,762 $ 2,345 $ 6,248 $ 3,743
Total number of common shares repurchased 50 40 113 69 *
Aggregate repurchase of warrants 90 - 263 -
Total number of warrants repurchased 5 - 15 -
* The total number of shares of AIG Common Stock repurchased in the six-month period ended June 30, 2015 includes (but the aggregate purchase price
does not include) approximately 3.5 million shares of AIG Common Stock received in January 2015 upon the settlement of an ASR agreement executed in
the fourth quarter of 2014.
June 30, December 31,
(in millions, except per share data) 2016 2015
Balance sheet data: Total assets $ 510,349 $ 496,842
Long-term debt 33,329 29,249
Total AIG shareholders’ equity 89,946 89,658
Book value per common share 83.08 75.10
Book value per common share, excluding AOCI 75.45 72.97
Book value per common share, excluding AOCI and DTA 61.03 58.94
Three Months Ended Six Months Ended Year Ended June 30, June 30, December 31,
2016 2015 2016 2015 2015
Return on equity 8.6 % 6.8 % 3.9 % 8.0 % 2.2 %
Return on equity - after-tax operating income, excluding
AOCI 5.4 7.8 4.5 7.4 3.1
Return on equity - after-tax operating income, excluding
AOCI and DTA 6.7 9.3 5.6 8.8 3.7
The following table presents a reconciliation of Book value per common share to Book value per common share, excluding AOCI, and Book value per common share, excluding AOCI and DTA, which are non-GAAP measures. See Use of Non-GAAP Measures for additional information.
June 30, December 31,
(in millions, except per share data) 2016 2015
Total AIG shareholders' equity $ 89,946 $ 89,658
Accumulated other comprehensive income 8,259 2,537
Total AIG shareholders' equity, excluding AOCI 81,687 87,121
Deferred tax assets 15,614 16,751
Total AIG shareholders' equity, excluding AOCI and DTA $ 66,073 $ 70,370
Total common shares outstanding 1,082,689,362 1,193,916,617
Book value per common share $ 83.08 $ 75.10
Book value per common share, excluding AOCI 75.45 72.97
Book value per common share, excluding AOCI and DTA $ 61.03 $ 58.94

I TEM 2 / EXECUTIVE OVERVIEW
85
The following table presents a reconciliation of Return on equity to Return on equity, after-tax operating income, excluding AOCI, and Return on equity, after-tax operating income, excluding AOCI and DTA, which are non-GAAP measures. See Use of Non-GAAP Measures for additional information.
Three Months Ended Six Months Ended Year Ended June 30, June 30, December 31, (dollars in millions) 2016 2015 2016 2015 2015
Actual or annualized net income (loss) attributable to AIG $ 7,652 $ 7,200 $ 3,460 $ 8,536 $ 2,196
Actual or annualized after-tax operating income attributable to AIG 4,452 7,572 3,772 7,168 2,927
Average AIG Shareholders' equity 89,232 106,119 89,374 106,378 101,558
Average AOCI 6,892 9,139 5,440 9,631 7,598
Average AIG Shareholders' equity, excluding average AOCI 82,340 96,980 83,934 96,747 93,960
Average DTA 16,220 15,428 16,397 15,671 15,803
Average AIG Shareholders' equity, excluding average AOCI and DTA $ 66,120 $ 81,552 $ 67,537 $ 81,076 $ 78,157
ROE 8.6 % 6.8 % 3.9 % 8.0 % 2.2 %
ROE - after-tax operating income, excluding AOCI 5.4 7.8 4.5 7.4 3.1
ROE - after-tax operating income, excluding AOCI and DTA 6.7 9.3 5.6 8.8 3.7
TOTAL REVENUES
( in mi l l ions) INCOME FROM CONTINUING OPERATIONS
( in mi l l ions)
NET INCOME ATTRIBUTABLE TO AIG
( in mi l l ions) NET INCOME PER COMMON SHARE ATTRIBUTABLE
TO AIG (DILUTED)

I TEM 2 / EXECUTIVE OVERVIEW
86
AFTER-TAX OPERATING INCOME ATTRIBUTABLE TO AIG (excludes net realized capital gains and certain other items)
( in mi l l ions)
PRE-TAX OPERATING INCOME (LOSS) BY SEGMENT
( in mi l l ions)
TOTAL ASSETS (in millions)
LONG-TERM DEBT (in millions)
TOTAL AIG SHAREHOLDERS’ EQUITY (in millions)
BOOK VALUE PER COMMON SHARE, BOOK VALUE PER COMMON SHARE EXCLUDING AOCI AND BOOK VALUE PER COMMON SHARE EXCLUDING AOCI AND DTA
* Includes operating borrowings of other subsidiaries and consolidated investments and hybrid debt securities.
I TEM 2 / EXECUTIVE OVERVIEW
87
Investment Highlights
Net investment income decreased to $3.7 billion in the three-month period ended June 30, 2016 compared to $3.8 billion in the same period in the prior year due to lower income on alternative investments and lower reinvestment yields, partially offset by an increase in invested assets and higher gains on securities for which the fair value option was elected. Net investment income decreased to $6.7 billion in the six-month period ended June 30, 2016 compared to $7.7 billion in the same period in the prior year due to lower income on alternative investments, primarily related to negative performance in hedge funds, and lower reinvestment yields, partially offset by an increase in invested assets and higher gains on securities for which the fair value option was elected. While corporate debt securities represented the core of new investment allocations, we continued to make investments in structured securities, mortgage loans and other fixed income investments with favorable risk versus return characteristics to improve yields and increase net investment income.
Net unrealized gains in our available for sale portfolio increased to approximately $18.0 billion as of June 30, 2016, from approximately $8.8 billion as of December 31, 2015, due to a decline in interest rates and a narrowing of credit spreads.
The overall credit rating of our fixed maturity securities portfolio remains largely unchanged from December 31, 2015.
Liquidity and Capital Resources Highlights
We maintained financial flexibility at AIG Parent in the six-month period ended June 30, 2016 through $1.5 billion in dividends in the form of cash and fixed maturity securities from our Non-Life Insurance Companies and $1.4 billion in dividends and loan repayments in the form of cash and fixed maturity securities from our Life Insurance Companies. AIG Parent also received $1.6 billion in tax sharing payments in the form of cash and fixed maturity securities from our insurance businesses in the six-month period ended June 30, 2016, including $1.1 billion of such payments in the second quarter of 2016.
Our Board of Directors increased our previous share repurchase authorization of AIG Common Stock, par value $2.50 per share (AIG Common Stock), by an additional $3.0 billion on August 2, 2016, resulting in a remaining authorization on such date of approximately $4.0 billion. During the six-month period ended June 30, 2016, we repurchased approximately 113 million shares of AIG Common Stock for an aggregate purchase price of approximately $6.2 billion pursuant to this authorization, and we repurchased 15 million warrants to purchase shares of AIG Common Stock, for an aggregate purchase price of $263 million pursuant to this authorization. Pursuant to a Securities Exchange Act of 1934 (Exchange Act) Rule 10b5-1 repurchase plan, from July 1 to August 2, 2016, we have repurchased approximately $698 million of additional shares of AIG Common Stock.
We paid a cash dividend on AIG Common Stock of $0.32 per share on each of March 28, 2016 and June 27, 2016.
Our Board of Directors declared a cash dividend on AIG Common Stock on August 2, 2016 of $0.32 per share, payable on September 29, 2016 to shareholders of record on September 15, 2016.
Strategic Outlook
Industry Trends
Our business is affected by industry and economic factors such as interest rates, currency exchange rates, credit and equity market conditions, catastrophic claims events, regulation, tax policy, competition, and general economic, market and political conditions. We continued to operate under difficult market conditions in 2016, characterized by factors such as historically low interest rates, instability in the global equity markets, volatile energy markets, slowing growth in China and Euro-Zone economies and the United Kingdom (the UK) advisory referendum in which a majority voted for the UK to withdraw its membership in the European Union (the EU) (commonly referred to as Brexit). The recent Brexit vote has also affected the
I TEM 2 / EXECUTIVE OVERVIEW
88
U.S. dollar/British pound exchange rate, increased the volatility of exchange rates among the euro, British pound and the Japanese yen (the Major Currencies), and created volatility in the financial markets, which may continue for some time.
Interest rates remain low relative to historical levels, and certain markets in which we operate are experiencing negative interest rates. A sustained low interest rate environment negatively affects sales of interest rate sensitive products in our industry and may negatively impact the profitability of our existing business as we reinvest cash flows from investments, including increased calls and prepayments of fixed maturity securities and mortgage loans, at rates below the average yield of our existing portfolios. We actively manage our exposure to the interest rate environment through economic hedging of interest rate risk from guarantee features in our variable annuities and spread management strategies for our investment-oriented products.
For investment-oriented products in our Retirement, Life and Institutional Markets operating segments, our spread management strategies include disciplined pricing and product design for new business, limiting the sale of products that do not achieve targeted spreads, using asset-liability management to match assets to liabilities to the extent practicable, and actively managing crediting rates to help mitigate some of the pressure on investment spreads. Lowering interest crediting rates can help offset the impact of lower investment yields, but our ability to lower crediting rates may be limited by the competitive environment, contractual minimum crediting rates, and provisions that allow rates to be reset only at pre-established intervals. As a result, the timing and extent of crediting rate decreases may differ from the corresponding declines in investment yields, which could reduce our spreads and future profitability. A sustained low interest rate environment may favorably affect surrender activity of contract holders whose contractual minimum crediting rates are above those currently available in the marketplace. In addition, customers are currently seeking fixed annuities with longer surrender charge periods in pursuit of higher returns, which may help mitigate the increase of surrenders if interest rates rise rapidly in the future.
Spreads and surrender rates are important components of the future profit assumptions that drive the rate we use to amortize DAC and related reserves for investment-oriented products. If future profit assumptions change significantly, we may be required to recalculate DAC and related reserves, and reflect any resulting adjustments in current period income. Additionally, for certain traditional long-duration products for which we are unable to adjust interest rates, including structured settlements and other payout annuities, our future earnings may be reduced in a sustained low interest rate environment, and we may be required to record additional reserves.
The impact of low interest rates on our Property Casualty operating segment is primarily on our long-tail Casualty line of business. We expect limited impacts on our existing long-tail Casualty business as the duration of our assets is slightly longer than that of our liabilities. We do expect sustained low interest rates will impact new and renewal business for the long-tail Casualty line as we may not be able to adjust our future pricing to fully offset the impact of investing at lower rates. However, we will continue to maintain pricing discipline and risk selection.
For our Property Casualty operating segment, and run-off insurance lines reported within Corporate and Other, sustained low interest rates may unfavorably affect the net loss reserve discount for workers’ compensation, and to a lesser extent could favorably impact assumptions about future medical costs; the combined net effect of which could result in higher net loss reserves.
Additionally, sustained low interest rates on discounting of projected benefit cash flows for our pension plans may result in higher pension expense.
Currency volatility in the first half of 2016 was acute compared to recent years, as the euro and the British pound weakened considerably against the U.S. dollar, although the Japanese yen strengthened against the U.S. dollar in that period. Such volatility affected line item components of income for those businesses with substantial international operations. In particular, growth trends in net premiums written reported in U.S. dollars can differ significantly from those measured in original currencies. The net effect on underwriting results, however, is significantly mitigated, as both revenues and expenses are similarly affected.
These currencies may continue to fluctuate, in either direction, especially as a result of the UK’s potential exit from the EU, and such fluctuations will affect net premiums written growth trends reported in U.S. dollars, as well as financial statement line item comparability.

I TEM 2 / EXECUTIVE OVERVIEW
89
See Results of Operations – Foreign Currency Impact; Results of Operations – Segment Results – Quarterly and Year-to-date Pre-Tax Income Comparison for 2016 and 2015; Results of Operations – Commercial Insurance – Property Casualty Net Premiums Written by Region; and Results of Operations – Consumer Insurance – Personal Insurance Net Premiums Written by Region.
AIG Priorities for 2016
AIG is focused on the following priorities for 2016:
Improving our ROE
Creating a leaner, more profitable and focused insurer by reorganizing our operating model into “modular”, more self-contained business units to enhance transparency and accountability, including through the introduction of a new Legacy Portfolio that aims to maximize value and release capital from the run-off of non-strategic assets
Reducing general operating expenses
Improving the Commercial Insurance Property Casualty accident year loss ratio
Returning excess capital to shareholders
Growing book value per common share
Outlook for Our Operating Businesses
The outlook for each of our businesses and management initiatives to improve growth and performance in 2016 and over the longer term is summarized below. See our 2015 Annual Report for additional information concerning strategic initiatives and opportunities for each of our businesses.
COMMERCIAL INSURANCE OUTLOOK AND STRATEGIC INITIATIVES
Market Conditions and Industry Trends
Commercial Insurance expects the current low interest rate environment relative to historical levels, currency volatility, and ongoing uncertainty in global economic conditions will continue to limit growth and profitability in some markets and challenge growth of net investment income. Due to these conditions and overcapacity in the property casualty insurance industry, Commercial Insurance has continued to diversify its business focusing on growing profitable segments and geographies, exiting unprofitable lines and developing advanced data and analytics to improve profitability.
Property Casualty
Property Casualty has observed improving trends in certain key indicators that may partially offset the effect of current economic challenges. In the first half of 2016, the property casualty insurance industry experienced growth in certain classes of business in Property and Financial lines. Property Casualty also expects that expansion in certain growth economies will continue at a faster pace than in developed countries, but at levels lower than those previously expected due to revised economic assumptions. As a result of its ongoing strategy to optimize its portfolio and maintain underwriting discipline, Property Casualty expects that net premiums written for the U.S. Casualty line, and to a lesser extent, certain lines within Specialty and Property, will continue to decrease throughout the remainder of the year. In addition, the recent Brexit

I TEM 2 / EXECUTIVE OVERVIEW
90
referendum may negatively affect premium production in the European market, both on a reported basis and in original currency.
Overall, Property Casualty experienced a modest increase in rate pressure in the first half of 2016. Property Casualty expects that trend to continue in the near term, particularly in certain lines including in the U.S. Property Excess and Surplus market. Property Casualty continues to differentiate its underwriting capacity from its peers by leveraging its global footprint, diverse product offering, risk engineering expertise and significant underwriting experience.
In the U.S., Property Casualty’s exposure to terrorism risk is mitigated by the Terrorism Risk Insurance Program Reauthorization Act (TRIPRA) in addition to limited private reinsurance protections. For additional information on TRIPRA, see Item 1A. Risk Factors — Reserves and Exposures and Item 7. MD&A — Enterprise Risk Management — Insurance Operations Risks — Non-Life Insurance Companies Key Insurance Risks — Terrorism Risk in our 2015 Annual Report.
Mortgage Guaranty
During the first half of 2016, the U.S. market for purchase originations and refinance volume remained strong, favorably impacted by improving housing prices and low interest rates. In addition, the current economic environment has favorably impacted incurred losses through fewer new delinquencies and higher cure rates. If the current economic environment persists, Mortgage Guaranty expects to benefit through increased purchase volume and increased refinancing activity.
Mortgage Guaranty also expects that the delinquency rate and cure rate will remain near current levels throughout 2016. Mortgage Guaranty believes the combination of the factors described above will result in favorable operating results for 2016. These favorable trends may be partially offset by an increase in competitive pricing pressure.
On December 31, 2015, the Private Mortgage Insurer Eligibility Requirements (PMIERs) issued by Fannie Mae and Freddie Mac (collectively, the GSEs) became effective. Mortgage Guaranty met the PMIERs requirements as of June 30, 2016. Mortgage Guaranty’s minimum required assets under PMIERs were $2.9 billion as of June 30, 2016, and its estimated available assets were $3.3 billion, exceeding the required assets by $400 million. Available assets decreased from $3.6 billion at December 31, 2015, primarily as a result of dividend payments.
Institutional Markets
Institutional Markets is expected to continue growing its assets under management from the structured settlement business and the stable value wrap business, as well as from disciplined growth through the pursuit of select opportunities related to pension buyouts. Volatility in the earnings of our alternative investment portfolio will continue to affect Institutional Markets’ results. In addition, Institutional Markets could incur loss recognition reserve increases, if future yield assumptions were lowered on assets that support certain long-duration products, primarily structured settlements, for which Institutional Markets does not have the ability to adjust interest rates. Lower assumptions for future yields on such assets could result from reinvestment of portfolio cash flows in the sustained low interest rate environment, which may include proceeds from the strategic sale of alternative investments that currently support such products.

I TEM 2 / EXECUTIVE OVERVIEW
91
Strategic Initiatives
Customer — Strive to be our clients’ most valued insurer by offering innovative products, superior service and access to an extensive global network.
Sharpen Commercial Focus — Achieve ROE in excess of target across our businesses primarily through improvements in our loss ratio. Improve our business portfolio through risk selection by using enhanced data, analytics and the application of science to deliver superior risk-adjusted returns. Exit or remediate targeted sub-segments of underperforming portfolios that do not meet our risk acceptance or profitability objectives.
Drive Efficiency — Reorganize our operating model into “modular”, more self-contained business units to enhance decision making, transparency and accountability, driving performance improvement and strategic flexibility over time; increase capital fungibility and diversification, streamline our legal entity structure, optimize reinsurance, improve tax efficiency and reduce expenses.
Invest to Grow — Grow our higher-value businesses while investing in transformative opportunities, continuing initiatives to modernize our technology and infrastructure, advancing our engineering capabilities, innovating new products and client risk services and delivering a better client experience.
Customer
Our vision is to be our clients’ most valued insurer. We expect that investments in underwriting, claims services, client risk services, science and data will continue to differentiate us from our peers and drive a superior client experience. For example, during the fourth quarter of 2015, we increased global commercial property limits to $2.5 billion per occurrence from $1.5 billion, in response to increased demand for capacity and services from clients managing complex global risks and increasing property values. This increase was the result of recent investments in engineering and analytical capabilities, which in turn allowed us to secure meaningful support from a panel of long-standing reinsurers.
Sharpen Commercial Focus
Exit or remediate targeted underperforming portfolios
Commercial Insurance is focused on serving our clients by providing the products and services where we have the most potential to deliver value. Experience and emerging data indicate that there are consistently under-performing sub-segments of our business. We will invest and grow where we see opportunity and we will exit or remediate underperforming portfolios. For example, in 2015 we transferred approximately $1.2 billion of loss reserves to our run-off insurance lines and in the first half of 2016 we transferred another $1.3 billion. This enables us to focus on growth opportunities while allowing for more proactive management of the transferred reserves by run-off specialists. We also did not renew certain accounts that did not meet our profit objectives in our Casualty lines and, to a lesser extent, in our Property and Specialty lines.
We will continue to further enhance our risk selection process and refine technical pricing through enhanced tools and analytics to achieve this goal.

I TEM 2 / EXECUTIVE OVERVIEW
92
Drive Efficiency
Narrow geographic footprint while continuing to maintain and improve multinational capabilities
Commercial Insurance, along with our other businesses, continues to evaluate the markets and geographies that provide the greatest opportunities, while maintaining the global footprint that our multinational clients greatly value. Additionally, we will continue to leverage our various off-shore centers, taking advantage of opportunities to centralize and standardize processes and platforms. We believe there is great opportunity to further streamline our global operating model.
Expand and optimize the use of reinsurance and other risk mitigating strategies
Commercial Insurance continues to execute capital management initiatives by enhancing broad-based risk tolerance guidelines for its operating units, implementing underwriting strategies to increase ROE by line of business and reducing exposure to businesses with inadequate pricing and increased loss trends. Commercial Insurance remains focused on enhancing its global reinsurance strategy to improve overall capital efficiency, although this strategy may lead to periodic income statement volatility.
In accordance with our strategic plan, during the first quarter of 2016, we entered into a two-year reinsurance arrangement with the Swiss Re Group, under which a proportional share of our new and renewal U.S. Casualty portfolio is being ceded. This arrangement is reducing the impact of the U.S. Casualty loss ratio on our overall loss ratio.
Accelerate micro-segmentation of risks using internal and external data
Property Casualty continues to improve decision-making, risk acceptance and pricing based on its ongoing efforts to refine segmentation by customer, industry and geography. For example, after enhancing the segmentation of workers’ compensation, Property Casualty has observed different experience and trends, which helps inform its risk appetite, pricing and loss mitigation decisions.
Invest to Grow
Grow most profitable lines
Property Casualty continues to focus on growth in our higher-value businesses while investing in transformative opportunities, continuing initiatives to modernize our technology and infrastructure, advancing our engineering capabilities, innovating new products and client risk services and delivering a better client experience. Property Casualty expects to grow in businesses such as Financial lines, including D&O, Cyber and Mergers & Acquisitions, Large Limit and Middle Market Property, Multinational and certain areas internationally.
Mortgage Guaranty expects to continue as a leading provider of mortgage insurance and seeks to differentiate itself from its competitors by utilizing its proprietary risk-based pricing strategy. This pricing strategy provides Mortgage Guaranty’s customers with mortgage insurance products that are priced commensurate with the underwriting risk, which we believe will result in an appropriately priced, high-quality book of business. As announced on January 26, 2016, we plan to conduct an initial public offering of up to 19.9 percent of Mortgage Guaranty, subject to regulatory and GSE approval, as a first step towards a full separation. On March 30, 2016, an initial Form S-1 registration statement relating to Mortgage Guaranty was filed with the SEC. An amendment to the initial Form S-1 was filed on May 20, 2016.
Institutional Markets is expected to continue growing the structured settlement business and continue contributing to growth in assets under management with stable value wraps and utilizing a disciplined approach to growth and diversification of our business by pursuing select opportunities in areas such as the pension buyout business.

I TEM 2 / EXECUTIVE OVERVIEW
93
CONSUMER INSURANCE OUTLOOK AND STRATEGIC INITIATIVES
Market Conditions and Industry Trends
Retirement
Increasing life expectancy and reduced expectations for traditional retirement income from defined benefit programs and fixed income securities are leading Americans to seek additional financial security as they approach retirement. The strong demand for individual variable and fixed index annuities with guaranteed income features has attracted increased competition in this product space. In response to the continued low interest rate environment, which has added pressure to profit margins, we have developed guaranteed income benefits for both variable and fixed index annuities with margins that are less sensitive to the level of interest rates. In addition, higher tax rates and a desire for better investment returns have prompted less risk-averse investors to elect products without guaranteed living benefits.
The sustained low interest rate environment has a significant impact on the annuity industry. Low long-term interest rates put pressure on investment returns, which may negatively affect sales of interest rate sensitive products and reduce future profits on certain existing fixed rate products, although our disciplined rate setting has helped to mitigate some of the pressure on investment spreads. In addition, more highly leveraged competitors have entered the market offering higher crediting rates. As long as the low interest rate environment continues, conditions will be challenging for the fixed annuity market. Rapidly rising interest rates could create the potential for increased sales, but may also drive higher surrenders. Customers are, however, currently buying fixed annuities with longer surrender periods in pursuit of higher returns, which may help mitigate the rate of increase in surrenders in a rapidly rising rate environment. In addition, older contracts have higher minimum interest rates, which continue to be attractive to the contract holders, driving better than expected persistency. Low interest rates have also driven growth in our fixed index annuity products, which provide additional interest crediting tied to favorable performance in certain equity market indices.
Consumer Insurance provides products and services to certain employee benefit plans that are subject to restrictions imposed by ERISA and the Internal Revenue Code, including rules that generally restrict the provision of investment advice by a fiduciary to ERISA plans and participants and Individual Retirement Accounts (IRAs) if the investment recommendation results in fees paid to the fiduciary individual advisor, his or her firm or their affiliates that vary according to the investment recommendation chosen. On April 8, 2016, the DOL published its final fiduciary duty rule (the Final Rule), substantially expanding the definition of fiduciary investment advice. As a result, the circumstances under which financial services providers and financial advisors could be deemed a fiduciary under ERISA or the Internal Revenue Code when providing investment advice with respect to ERISA plans or IRAs are greatly expanded. For additional information on the Final Rule, see Part I, Item 2. MD&A – Regulatory Environment section of the Quarterly Report on Form 10-Q for the period ended March 31, 2016. We are analyzing the Final Rule’s potential impact on our customers, distribution partners, financial advisors and us, and preparing to implement the necessary adjustments to come into compliance with the Final Rule. The Final Rule could require us, and our competitors, to make material changes to certain of our business practices and product designs, and could materially affect our ability and the ability of our distribution partners and financial advisors to sell or service certain annuities and other investment products. The initial compliance date of the final rule is April 10, 2017, with full compliance required by January 1, 2018. Once we have completed our analysis of the Final Rule’s potential impact, we intend to strategically invest in the most attractive post-DOL opportunities across the market.
Life
Populations are living longer and have increased needs for financial protection for beneficiaries, estate planning and wealth creation. The Life operating segment addresses these needs with a broad spectrum of products, ranging from the pure protection focus of term life to indexed universal life and investment-oriented products such as variable universal life. Market factors, primarily low interest rates and regulatory changes, have caused the universal life market to shift its focus from guaranteed universal life to indexed universal life products that offer cash accumulation and living benefit options.

I TEM 2 / EXECUTIVE OVERVIEW
94
Personal Insurance
The need for full life cycle products and coverage, increases in personal wealth accumulation, and awareness of insurance protection and risk management continue to support the growth of the Personal Insurance industry. Our Personal Insurance operations focus on group and corporate clients, together with individual customers within national markets. We expect the demand for multinational cross-boundary coverage and services to increase due to the internationalization of clients and customers. Our global presence provides Personal Insurance a distinct competitive advantage.
In Japan, the competition for auto insurance has intensified, in part driven by a decline in new car sales and the existence of fewer but larger insurers. In addition, the overall market size in homeowners insurance contracted after the duration restriction on long-term fire insurance became effective in October 2015. In the U.S., we compete in the high net worth market and will continue to expand our innovative products and services to distribution partners and clients. Outside of Japan and the U.S., our Personal Insurance operating segment continues to invest selectively in markets where we believe higher potential for sustainable profitability exists.
Strategic Initiatives
Customer — Strive to be our clients’ most valued insurer. Through our unique franchise, which brings together a broad portfolio of retirement, life insurance and personal insurance products offered through multiple distribution networks, Consumer Insurance aims to provide customers with the products and services they desire, delivered through the channels they prefer.
Information-driven Strategy — Utilize customer insight, analytics and the application of science to optimize customer acquisition, product profitability, product mix, channel performance and risk management capabilities.
Sharpen Consumer Focus — Invest in areas where Consumer Insurance can grow profitably and sustainably. Target growth in select markets according to market size, growth potential, market maturity and customer demographics and narrow our footprint in less profitable markets with insufficient scale.
Operational Effectiveness — Simplify processes and enhance operating environments to increase competitiveness, improve service and product capabilities and facilitate delivery of our target customer experience.
Investment Strategy — Maintain a diversified, high quality portfolio of fixed maturity securities that largely matches the duration characteristics of the related insurance liabilities, and pursue selective yield-enhancement opportunities that meet liquidity, risk and return objectives.
Profitability and Capital Management — Deliver solid earnings through disciplined pricing, sustainable underwriting improvements, expense reductions and diversification of risk, and increase capital efficiency within insurance entities to enhance return on equity.
Customer
In striving to be our clients’ most valued insurer, we have implemented initiatives to better serve our target segments. Our focus on ease of doing business for consumers and producers includes enhancements to our platforms and services. We are working to expand relationships with key distribution partners to offer our products across multiple distribution channels.

I TEM 2 / EXECUTIVE OVERVIEW
95
Information-driven Strategy
We believe that strengthening our information-driven decision making and marketing capabilities through the use of enhanced analytics, stronger platforms and tools, a well-designed product portfolio and expanded relationships may allow us to bring more effective product solutions to our chosen markets.
We focus on rate adequacy through our global underwriting practices and tools and analytics, and seek to optimize the value of our business lines through product and portfolio management and refined technical pricing. We strive to deliver leading customer experience and efficiency through claims best practices, deployment of enhanced operating structures and standardized processes and systems, while managing claims-handling efficiency.
Sharpen Consumer Focus
Retirement Income Solutions intends to continue capitalizing on the opportunity to meet consumer demand for guaranteed income by maintaining competitive variable annuity product offerings, while managing risk from guarantee features through risk-mitigating product design and well-developed economic hedging capabilities. Retirement Income Solutions continues to invest in hedging and market risk management capabilities. Retirement Income Solutions has diversified its product portfolio by offering fixed index annuities that also offer guaranteed withdrawal features, which provide additional lifetime income solutions for consumers approaching retirement.
Fixed Annuities sales will continue to be challenged by the low interest rate environment. Sales of fixed annuities could improve if interest rates rise and the yield curve steepens, as these market conditions make fixed annuity products more attractive compared to alternatives such as bank deposits; however, they could also lead to higher surrender activity. During periods of equity market volatility, our fixed annuity products provide diversity in our annuity product suite by offering stable returns for retirement savings. The growing market for immediate and deferred income products, driven by customers seeking guaranteed income products, provides an opportunity for Fixed Annuities to increase the diversification of its product portfolio.
Life will continue to invest to position itself for growth, serve its customers more effectively, and maintain pricing discipline in its overall strategy. Life’s organization has been aligned to focus on the demographic, governmental and socioeconomic trends unique to each area in which we operate. In January 2016, we announced a plan to improve capital efficiency by using reinsurance to reduce certain statutory reserves that are above economic requirements in our domestic Life business.
Personal Insurance aims to provide clients with the products and services they desire, delivered through the channels they prefer. We continue to focus and invest in the most profitable markets and segments, while narrowing our footprint where appropriate. We are also leveraging our multinational capabilities to meet the increasing demand for cross-border coverage and services. Personal Insurance will continue to utilize its strong risk management and market expertise to foster growth by providing innovative and competitive solutions to its customers and distributors.
Operational Effectiveness
We are continuing to invest in initiatives that we believe will make our operating platforms simpler and more agile, enabling us to provide superior service and accommodate future growth. In Japan, we continue to invest in technology to improve operating efficiency and ease of doing business for our distribution partners and customers. In the U.S. Life business, we are focused on leveraging our most efficient systems and increasing automation of our underwriting process. We believe that simplifying our operating models will enhance productivity and support further profitable growth.

I TEM 2 / EXECUTIVE OVERVIEW
96
Investment Strategy
Our investment objective is to maintain a diversified, high quality portfolio of fixed maturity securities having weighted average durations that are matched to the duration and cash flow profile of our liabilities, to the extent practicable. Our investment strategy is to maximize net investment income and portfolio value, subject to liquidity requirements, capital constraints, diversification requirements, asset-liability matching and available investment opportunities. While a portfolio of alternative investments remains a fundamental component of the investment strategy of the Life Insurance Companies, we intend to reduce the overall size of the hedge fund portfolio, in light of changing market conditions and perceived market opportunities, and to continue reducing the size of the private equity portfolio. See Investments for additional discussion of investment strategies. If these reductions were to include the sale of alternative investments that support certain payout annuities, we could incur additional loss recognition expense on such products, due to updating assumptions to reflect reinvestment at lower future yields. See Critical Accounting Estimates — Insurance Liabilities — Future Policy Benefits for Life and Accident and Health Insurance Contracts (Life Insurance Companies) for discussion of assumptions related to loss recognition testing in our 2015 Annual Report.
Profitability and Capital Management
We are focused on enhancing profitability and capital efficiency within our insurance entities through disciplined pricing, in-force profitability management, effective management of risk and expense reductions. For product lines where we have significant equity market risk and exposure to changes in interest rates, we use risk management tools, such as the risk mitigation product features and hedging program in our Retirement Income Solutions and Group Retirement annuity businesses. Additionally, our scale and the breadth of our product offerings provide diversification of risk. Within our Non-Life Insurance Companies, we continue to increase capital efficiency.
In conjunction with our strategic divestiture program, in May 2016, we completed the sale of AIG Advisor Group, our network of independent broker-dealers, to investment funds affiliated with Lightyear Capital LLC and PSP Investments, and recognized a pre-tax gain of $225 million.
See Results of Operations — Consumer Insurance and Insurance Reserves for additional information about our Consumer Insurance businesses.
RESULTS OF OPERATIONS
The following section provides a comparative discussion of our Results of Operations on a reported basis for the three- and six-month periods ended June 30, 2016 and 2015. Factors that relate primarily to a specific business segment are discussed in more detail within that business segment discussion. For a discussion of the Critical Accounting Estimates that affect the Results of Operations, see the Critical Accounting Estimates section of this MD&A and Part II, Item 7. MD&A — Critical Accounting Estimates in the 2015 Annual Report.
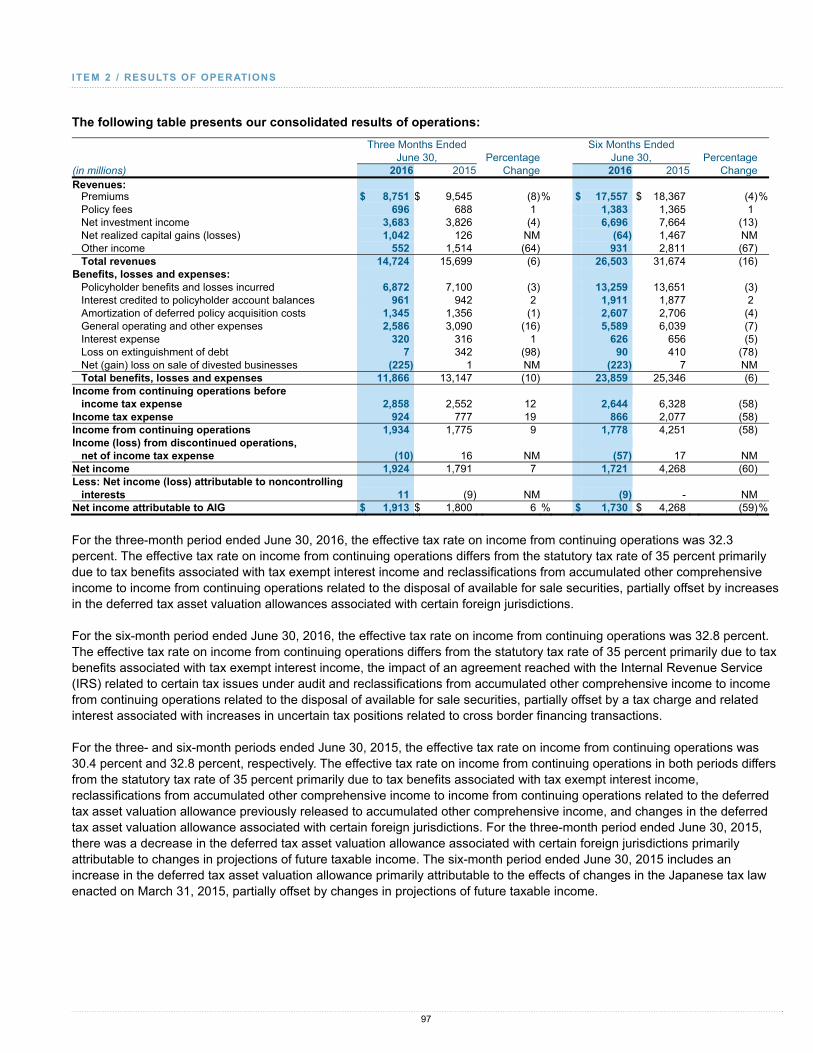
I TEM 2 / RESULTS OF OPERATIONS
97
The following table presents our consolidated results of operations:
Three Months Ended Six Months Ended June 30, Percentage June 30, Percentage (in millions) 2016 2015 Change 2016 2015 ChangeRevenues:
Premiums $ 8,751 $ 9,545 (8)% $ 17,557 $ 18,367 (4)%Policy fees 696 688 1 1,383 1,365 1Net investment income 3,683 3,826 (4) 6,696 7,664 (13)Net realized capital gains (losses) 1,042 126 NM (64) 1,467 NMOther income 552 1,514 (64) 931 2,811 (67)Total revenues 14,724 15,699 (6) 26,503 31,674 (16)
Benefits, losses and expenses: Policyholder benefits and losses incurred 6,872 7,100 (3) 13,259 13,651 (3)Interest credited to policyholder account balances 961 942 2 1,911 1,877 2Amortization of deferred policy acquisition costs 1,345 1,356 (1) 2,607 2,706 (4)General operating and other expenses 2,586 3,090 (16) 5,589 6,039 (7)Interest expense 320 316 1 626 656 (5)Loss on extinguishment of debt 7 342 (98) 90 410 (78)Net (gain) loss on sale of divested businesses (225) 1 NM (223) 7 NMTotal benefits, losses and expenses 11,866 13,147 (10) 23,859 25,346 (6)
Income from continuing operations before income tax expense 2,858 2,552 12 2,644 6,328 (58)
Income tax expense 924 777 19 866 2,077 (58)Income from continuing operations 1,934 1,775 9 1,778 4,251 (58)Income (loss) from discontinued operations,
net of income tax expense (10) 16 NM (57) 17 NMNet income 1,924 1,791 7 1,721 4,268 (60)Less: Net income (loss) attributable to noncontrolling
interests 11 )9( NM (9) - NMNet income attributable to AIG $ 1,913 $ 1,800 6 % $ 1,730 $ 4,268 (59)%
For the three-month period ended June 30, 2016, the effective tax rate on income from continuing operations was 32.3 percent. The effective tax rate on income from continuing operations differs from the statutory tax rate of 35 percent primarily due to tax benefits associated with tax exempt interest income and reclassifications from accumulated other comprehensive income to income from continuing operations related to the disposal of available for sale securities, partially offset by increases in the deferred tax asset valuation allowances associated with certain foreign jurisdictions.
For the six-month period ended June 30, 2016, the effective tax rate on income from continuing operations was 32.8 percent. The effective tax rate on income from continuing operations differs from the statutory tax rate of 35 percent primarily due to tax benefits associated with tax exempt interest income, the impact of an agreement reached with the Internal Revenue Service (IRS) related to certain tax issues under audit and reclassifications from accumulated other comprehensive income to income from continuing operations related to the disposal of available for sale securities, partially offset by a tax charge and related interest associated with increases in uncertain tax positions related to cross border financing transactions.
For the three- and six-month periods ended June 30, 2015, the effective tax rate on income from continuing operations was 30.4 percent and 32.8 percent, respectively. The effective tax rate on income from continuing operations in both periods differs from the statutory tax rate of 35 percent primarily due to tax benefits associated with tax exempt interest income, reclassifications from accumulated other comprehensive income to income from continuing operations related to the deferred tax asset valuation allowance previously released to accumulated other comprehensive income, and changes in the deferred tax asset valuation allowance associated with certain foreign jurisdictions. For the three-month period ended June 30, 2015, there was a decrease in the deferred tax asset valuation allowance associated with certain foreign jurisdictions primarily attributable to changes in projections of future taxable income. The six-month period ended June 30, 2015 includes an increase in the deferred tax asset valuation allowance primarily attributable to the effects of changes in the Japanese tax law enacted on March 31, 2015, partially offset by changes in projections of future taxable income.

I TEM 2 / RESULTS OF OPERATIONS
98
The following table presents a reconciliation of pre-tax operating income to pre-tax income and after-tax operating income to net income (loss) attributable to AIG:
Three Months Ended June 30, 2016 2015
Total After Total After
(in millions) Pre-tax Tax Tax Pre-tax Tax Tax
Operating income, excluding noncontrolling interests $ 1,620 $ 503 $ 1,117 $ 2,868 $ 985 $ 1,883
Noncontrolling interest (4) 10
Operating income, net of noncontrolling interests $ 1,620 $ 503 $ 1,113 $ 2,868 $ 985 $ 1,893
Uncertain tax positions and other tax adjustments (63) 63 (49) 49
Deferred income tax valuation allowance releases (charges) 35 (35) (40) 40
Changes in fair value of securities used to hedge guaranteed living benefits 120 42 78 (87) (30) (57)
Changes in benefit reserves and DAC, VOBA and SIA related to net realized
capital gains (losses) (64) (22) (42) (28) (10) (18)
Other (income) expense - net 5 2 3 - - -
Loss on extinguishment of debt (7) (2) (5) (342) (120) (222)
Net realized capital gains 1,042 380 662 126 46 80
Noncontrolling interest on net realized capital gains (7) (1)
Income (loss) from discontinued operations (10) 16
Income (loss) from divested businesses 225 79 146 (34) (23) (11)
Non-operating litigation reserves and settlements 7 2 5 49 18 31
Restructuring and other costs (90) (32) (58) - - -
Pre-tax income/net income attributable to AIG $ 2,858 $ 924 $ 1,913 $ 2,552 $ 777 $ 1,800
Weighted average diluted shares outstanding 1,140,045,973 1,365,390,431
Income per common share attributable to AIG (diluted) $ 1.68 $ 1.32After-tax operating income per common share attributable to AIG (diluted) $ 0.98 $ 1.39
Six Months Ended June 30, 2016 2015
Total After Total After
Pre-tax Tax Tax Pre-tax Tax Tax
Operating income, excluding noncontrolling interests $ 2,574 $ 686 $ 1,888 $ 5,395 $ 1,810 $ 3,585
Noncontrolling interest (2) (1)
Operating income, net of noncontrolling interests $ 2,574 $ 686 $ 1,886 $ 5,395 $ 1,810 $ 3,584
Uncertain tax positions and other tax adjustments 142 (142) (91) 91
Deferred income tax valuation allowance releases (charges) (2) 2 53 (53)
Changes in fair value of securities used to hedge guaranteed living benefits 253 89 164 (43) (15) (28)
Changes in benefit reserves and DAC, VOBA and SIA related to net realized
capital gains (losses) (24) (8) (16) (82) (29) (53)
Other (income) expense - net 12 4 8 - - -
Loss on extinguishment of debt (90) (32) (58) (410) (144) (266)
Net realized capital gains (losses) (64) (7) (57) 1,467 515 952
Noncontrolling interest on net realized capital gains (losses) 11 1
Income (loss) from discontinued operations (57) 17
Income (loss) from divested businesses 223 78 145 (55) (42) (13)
Non-operating litigation reserves and settlements 38 13 25 56 20 36
Restructuring and other costs (278) (97) (181) - - -
Pre-tax income/net income attributable to AIG $ 2,644 $ 866 $ 1,730 $ 6,328 $ 2,077 $ 4,268
Weighted average diluted shares outstanding 1,163,089,748 1,376,325,971
Income per common share attributable to AIG (diluted) $ 1.49 $ 3.10After-tax operating income per common share attributable to AIG (diluted) $ 1.62 $ 2.60
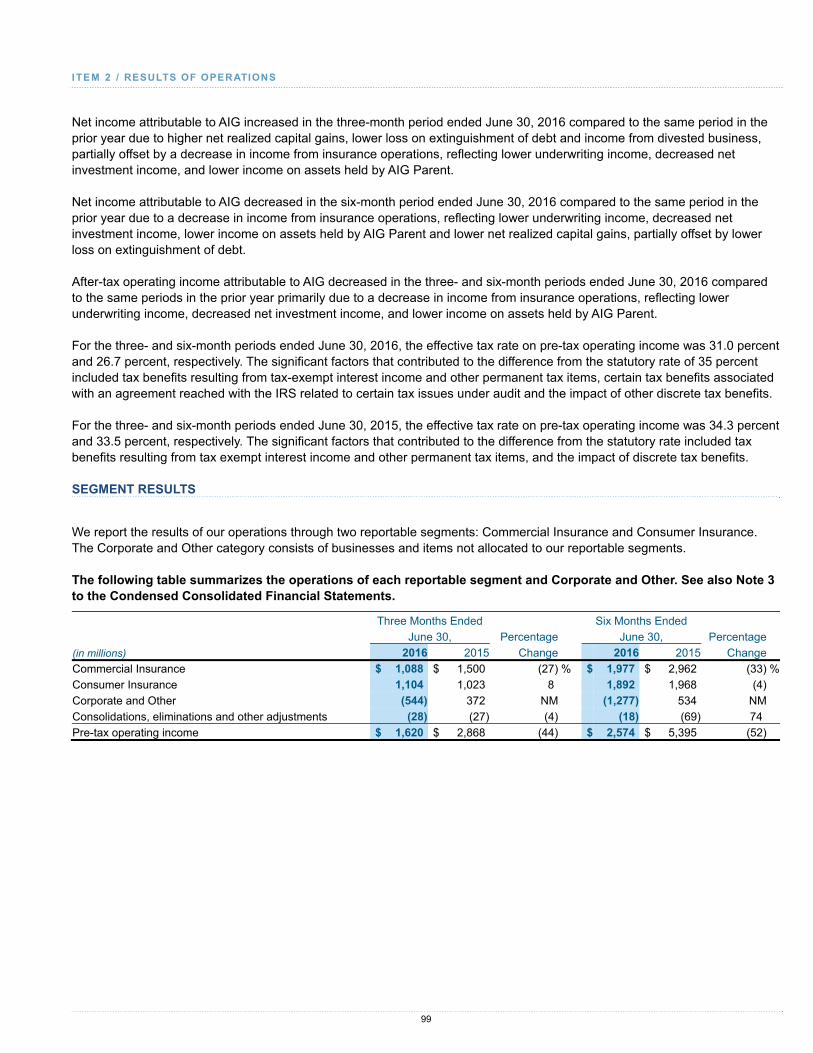
I TEM 2 / RESULTS OF OPERATIONS
99
Net income attributable to AIG increased in the three-month period ended June 30, 2016 compared to the same period in the prior year due to higher net realized capital gains, lower loss on extinguishment of debt and income from divested business, partially offset by a decrease in income from insurance operations, reflecting lower underwriting income, decreased net investment income, and lower income on assets held by AIG Parent.
Net income attributable to AIG decreased in the six-month period ended June 30, 2016 compared to the same period in the prior year due to a decrease in income from insurance operations, reflecting lower underwriting income, decreased net investment income, lower income on assets held by AIG Parent and lower net realized capital gains, partially offset by lower loss on extinguishment of debt.
After-tax operating income attributable to AIG decreased in the three- and six-month periods ended June 30, 2016 compared to the same periods in the prior year primarily due to a decrease in income from insurance operations, reflecting lower underwriting income, decreased net investment income, and lower income on assets held by AIG Parent.
For the three- and six-month periods ended June 30, 2016, the effective tax rate on pre-tax operating income was 31.0 percent and 26.7 percent, respectively. The significant factors that contributed to the difference from the statutory rate of 35 percent included tax benefits resulting from tax-exempt interest income and other permanent tax items, certain tax benefits associated with an agreement reached with the IRS related to certain tax issues under audit and the impact of other discrete tax benefits.
For the three- and six-month periods ended June 30, 2015, the effective tax rate on pre-tax operating income was 34.3 percent and 33.5 percent, respectively. The significant factors that contributed to the difference from the statutory rate included tax benefits resulting from tax exempt interest income and other permanent tax items, and the impact of discrete tax benefits.
SEGMENT RESULTS
We report the results of our operations through two reportable segments: Commercial Insurance and Consumer Insurance. The Corporate and Other category consists of businesses and items not allocated to our reportable segments.
The following table summarizes the operations of each reportable segment and Corporate and Other. See also Note 3 to the Condensed Consolidated Financial Statements.
Three Months Ended Six Months Ended
June 30, Percentage June 30, Percentage
(in millions) 2016 2015 Change 2016 2015 Change
Commercial Insurance $ 1,088 $ 1,500 (27) % $ 1,977 $ 2,962 (33) %
Consumer Insurance 1,104 1,023 8 1,892 1,968 (4)
Corporate and Other (544) 372 NM (1,277) 534 NM
Consolidations, eliminations and other adjustments (28) (27) (4) (18) (69) 74
Pre-tax operating income $ 1,620 $ 2,868 (44) $ 2,574 $ 5,395 (52)

I TEM 2 / RESULTS OF OPERATIONS
100
PRE-TAX OPERATING INCOME ( in mi l l ions)
COMMERCIAL INSURANCE
CONSUMER INSURANCE
QUARTERLY PRE-TAX INCOME COMPARISON FOR 2016 AND 2015
Pre-tax results increased in the three-month period ended June 30, 2016 compared to the same period in the prior year primarily due to:
• an increase in Consumer Insurance pre-tax operating income due to improved underwriting results in Personal Insurance, more favorable mortality experience in Life, and lower domestic general operating expenses in Retirement and Life due to reductions in employee-related expenses, partially offset by lower net investment income on alternative investments;
• lower loss on extinguishment of debt from ongoing liability management activities;
• higher income from divested businesses due to a gain of $225 million on the sale of AIG Advisor Group; and
• higher realized capital gains from sales of investments, primarily from the sale of a portion of our PICC Investment. In addition, other-than temporary impairment charges decreased due to an impairment charge on our previously held Aercap investment recognized in the second quarter of 2015.
These increases were partially offset by:
• a decrease in Commercial Insurance pre-tax operating income due to lower net investment income, reflecting lower income on alternative investment and fair market value declines on assets accounted for under the fair value option, as well as an underwriting loss in Property Casualty compared to underwriting income in the same period in the prior year, partially offset by higher underwriting income in Mortgage Guaranty;
• a net decrease of $246 million in consolidated pre-tax income related to guaranteed living benefits, net of hedges, primarily due to movement in the non-performance or “own credit” spread adjustment (NPA) component of the embedded derivative fair value measurement (see Insurance Reserves – Life Insurance Companies – Variable Annuity Guaranteed Benefit Features and Hedging Program);

I TEM 2 / RESULTS OF OPERATIONS
101
• a decrease in Corporate and Other pre-tax operating results, primarily due to lower earnings on investments for which the fair value option was elected, including ABS CDOs and part of our PICC Investment, as well as the absence of equity earnings from shares in AerCap, which was divested in 2015. Additionally, Run-off insurance lines reported a pre-tax operating loss in the three-month period ended June 30, 2016 compared to a pre-tax operating income in the same period in the prior year. The pre-tax operating loss in Run-off insurance lines was driven by a charge for the discount on excess workers’ compensation reserves in the three-month period ended June 30, 2016 compared to a benefit in the same period in the prior year, largely driven by interest rate movements; and
• restructuring and other costs incurred in the three-month period ended June 30, 2016 but not in the three-month period ended June 30, 2015.
YEAR-TO-DATE PRE-TAX INCOME COMPARISON FOR 2016 AND 2015
Pre-tax results decreased in the six-month period ended June 30, 2016 compared to the same period in the prior year primarily due to:
• a decrease in Commercial Insurance pre-tax operating income due to lower net investment income, reflecting lower income on alternative investments and fair market value declines on assets accounted for under the fair value option, as well as lower underwriting income from Property Casualty, partially offset by increases in underwriting income from Mortgage Guaranty;
• a decrease in Consumer Insurance pre-tax operating income, primarily due to lower net investment income, reflecting lower income on alternative investments, partially offset by favorable mortality experience in Life, lower domestic general operating expenses in Retirement and Life, and improved underwriting results in Personal Insurance due to lower accident year losses, more favorable net prior year development and strategic actions to reduce general operating expenses and refocus direct marketing activities;
• a loss in Corporate and Other pre-tax operating results, primarily due to lower earnings on investments for which the fair value option was elected, including ABS CDOs and part of our PICC Investment, as well as the absence of equity earnings from shares in AerCap, which was divested in 2015. Additionally, Run-off insurance lines reported a pre-tax operating loss in the six-month period ended June 30, 2016 compared to a pre-tax operating income in the same period in the prior year. The pre-tax operating loss in Run-off insurance lines was driven by a charge for the discount on excess workers’ compensation reserves in the six-month period ended June 30, 2016 compared to a benefit in the same period in the prior year, largely driven by interest rate movements. These declines were partially offset by lower interest expense from ongoing liability management activities described in Liquidity and Capital Resources;
• net realized capital losses due primarily to foreign exchange losses compared to net realized gains due to foreign exchange gains and the sale of Class B shares of Prudential Financial Inc. in the same period in the prior year;
• a net decrease of $317 million to consolidated pre-tax income related to guaranteed living benefits, net of hedges, primarily due to movement in the NPA component of the embedded derivative fair value measurement (see Insurance Reserves – Life Insurance Companies – Variable Annuity Guaranteed Benefit Features and Hedging Program); and
• restructuring and other costs incurred in the six-month period ended June 30, 2016 but not in the six-month period ended June 30, 2015.
These decreases were partially offset by lower loss on extinguishment of debt from ongoing liability management activities and higher income from divested businesses.

I TEM 2 / RESULTS OF OPERATIONS
102
Net Investment Income
Net investment income is attributed to the operating segments of Commercial Insurance and Consumer Insurance based on internal models consistent with the nature of the underlying businesses.
For Commercial Insurance — Property Casualty and Consumer Insurance — Personal Insurance, we estimate investable funds based primarily on loss reserves and unearned premiums. The net investment income allocation is calculated based on these estimated investable funds consistent with the approximate duration of the liabilities and the capital allocation for each operating segment.
For Commercial Insurance — Institutional Markets, Consumer Insurance — Retirement and Consumer Insurance — Life, net investment income is attributed based on invested assets from segregated product line portfolios held in our Life Insurance Companies. The fundamental investment strategy for these product line portfolios is to maintain primarily a diversified, high quality portfolio of fixed maturity securities and, to the extent practicable, to approximately match established duration targets based on characteristics of the underlying liabilities. All invested assets of the Life Insurance Companies in excess of liabilities are allocated based on internal estimates of target statutory capital for each product line.
Foreign Currency Impact
Property Casualty, International Life and Personal Insurance businesses are transacted in most major foreign currencies. The following table presents the average of the quarterly weighted average exchange rates of the currencies that have the most significant impact on our businesses:
Three Months Ended Six Months Ended June 30, Percentage June 30, Percentage Rate for 1 USD * 2016 2015 Change 2016 2015 ChangeCurrency: JPY 110.47 120.19 (8)% 114.31 119.51 (4)%EUR 0.89 0.91 (2)% 0.90 0.88 2 %GBP 0.70 0.66 6 % 0.70 0.66 6 %
* For the three-month period ended June 30, 2016, foreign currency rates are based on the fiscal quarterly weighted average rate for the three-month period
ended May 31, 2016.
Unless otherwise noted, references to the effects of foreign exchange in the Commercial Insurance and Consumer Insurance discussion of results of operations are with respect to movements in the three Major Currencies included in the preceding table.
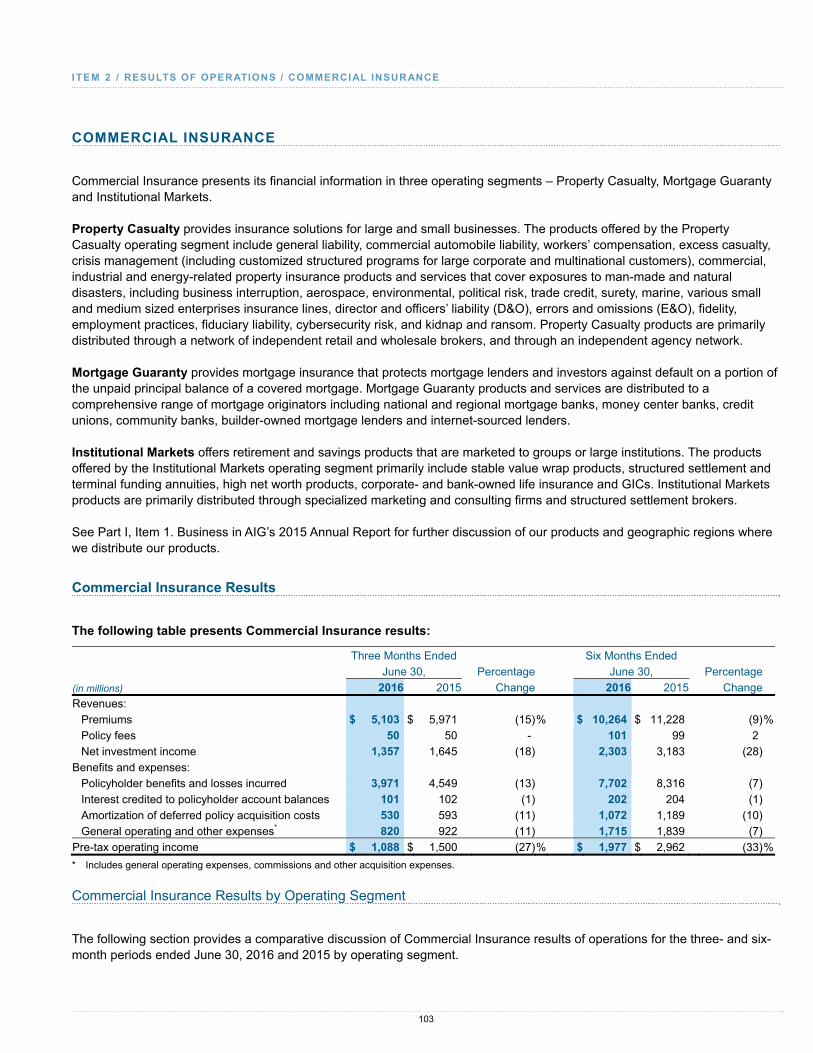
I TEM 2 / RESULTS OF OPERATIONS / COMMERCIAL INSURANCE
103
COMMERCIAL INSURANCE
Commercial Insurance presents its financial information in three operating segments – Property Casualty, Mortgage Guaranty and Institutional Markets.
Property Casualty provides insurance solutions for large and small businesses. The products offered by the Property Casualty operating segment include general liability, commercial automobile liability, workers’ compensation, excess casualty, crisis management (including customized structured programs for large corporate and multinational customers), commercial, industrial and energy-related property insurance products and services that cover exposures to man-made and natural disasters, including business interruption, aerospace, environmental, political risk, trade credit, surety, marine, various small and medium sized enterprises insurance lines, director and officers’ liability (D&O), errors and omissions (E&O), fidelity, employment practices, fiduciary liability, cybersecurity risk, and kidnap and ransom. Property Casualty products are primarily distributed through a network of independent retail and wholesale brokers, and through an independent agency network.
Mortgage Guaranty provides mortgage insurance that protects mortgage lenders and investors against default on a portion of the unpaid principal balance of a covered mortgage. Mortgage Guaranty products and services are distributed to a comprehensive range of mortgage originators including national and regional mortgage banks, money center banks, credit unions, community banks, builder-owned mortgage lenders and internet-sourced lenders.
Institutional Markets offers retirement and savings products that are marketed to groups or large institutions. The products offered by the Institutional Markets operating segment primarily include stable value wrap products, structured settlement and terminal funding annuities, high net worth products, corporate- and bank-owned life insurance and GICs. Institutional Markets products are primarily distributed through specialized marketing and consulting firms and structured settlement brokers.
See Part I, Item 1. Business in AIG’s 2015 Annual Report for further discussion of our products and geographic regions where we distribute our products.
Commercial Insurance Results
The following table presents Commercial Insurance results:
Three Months Ended Six Months Ended June 30, Percentage June 30, Percentage
(in millions) 2016 2015 Change 2016 2015 Change
Revenues:
Premiums $ 5,103 $ 5,971 (15)% $ 10,264 $ 11,228 (9)%
Policy fees 50 50 - 101 99 2
Net investment income 1,357 1,645 (18) 2,303 3,183 (28)
Benefits and expenses:
Policyholder benefits and losses incurred 3,971 4,549 (13) 7,702 8,316 (7) Interest credited to policyholder account balances 101 102 (1) 202 204 (1) Amortization of deferred policy acquisition costs 530 593 (11) 1,072 1,189 (10) General operating and other expenses* 820 922 (11) 1,715 1,839 (7)
Pre-tax operating income $ 1,088 $ 1,500 (27)% $ 1,977 $ 2,962 (33)%
* Includes general operating expenses, commissions and other acquisition expenses.
Commercial Insurance Results by Operating Segment
The following section provides a comparative discussion of Commercial Insurance results of operations for the three- and six-month periods ended June 30, 2016 and 2015 by operating segment.

I TEM 2 / RESULTS OF OPERATIONS / COMMERCIAL INSURANCE
104
Property Casualty Results
The following table presents Property Casualty results:
Three Months Ended Six Months Ended June 30, Percentage June 30, Percentage
(in millions) 2016 2015 Change 2016 2015 Change
Underwriting results:
Net premiums written $ 4,424 $ 5,583 (21)% $ 8,731 $ 10,630 (18)%
(Increase) decrease in unearned premiums 225 (481) NM 619 (597) NM
Net premiums earned 4,649 5,102 (9) 9,350 10,033 (7)
Losses and loss adjustment expenses incurred 3,489 3,614 (3) 6,697 6,974 (4)
Acquisition expenses:
Amortization of deferred policy acquisition costs 521 586 (11) 1,055 1,174 (10)
Other acquisition expenses 196 183 7 427 392 9
Total acquisition expenses 717 769 (7) 1,482 1,566 (5)
General operating expenses 543 658 (17) 1,128 1,287 (12)
Underwriting income (loss) (100) 61 NM 43 206 (79)
Net investment income 891 1,131 (21) 1,468 2,156 (32)
Pre-tax operating income $ 791 $ 1,192 (34)% $ 1,511 $ 2,362 (36)%
NET PREMIUMS WRITTEN ( in mi l l ions )
PRE-TAX OPERATING INCOME ( in mi l l ions )
Property Casualty Quarterly Results
Pre-tax operating income decreased in the three-month period ended June 30, 2016 compared to the same period in the prior year due to lower net investment income driven by lower returns on alternative investments, as well as an underwriting loss compared to underwriting income for the same period in the prior year. These underwriting results were primarily driven by:
• a net loss reserve discount charge in the three-month period ended June 30, 2016 compared to a net loss reserve discount benefit for the same period in the prior year;
• higher catastrophe losses compared to the same period in the prior year;

I TEM 2 / RESULTS OF OPERATIONS / COMMERCIAL INSURANCE
105
• lower net adverse prior year loss reserve development in the current year which reflected approximately $100 million reserve charge attributable to Florida court rulings in the second quarter of 2016 that have increased the potential liability for workers’ compensation claims in that state by reversing certain aspects of regulations in place since 2003;
• improvements in the accident year loss ratio, as adjusted, from our strategic actions to retain more profitable business; and
• lower general operating expenses resulting from lower employee-related expenses and our expense savings initiatives.
The current accident year losses for the three-month period ended June 30, 2016 included four severe losses totaling $130 million compared to eight severe losses totaling $184 million in the same period in the prior year. The net loss reserve discount charge was $191 million in the three-month period ended June 30, 2016, compared to a net loss reserve discount benefit of $270 million in the same period in the prior year, primarily reflecting a decrease in the reserve discount curve consisting of consisting of the U.S. Treasury forward yield curve and a liquidity margin. See Insurance Reserves – Non-Life Insurance Companies – Discounting of Reserves for further discussion. Net adverse prior year loss reserve development, including return premiums, was $58 million and $279 million in the three-month periods ended June 30, 2016 and 2015, respectively. See Insurance Reserves – Non-Life Insurance Companies –Net Loss Development for further discussion. Catastrophe losses were $353 million in the three-month period ended June 30, 2016, compared to $209 million in the same period in the prior year.
Acquisition expenses decreased in the three-month period ended June 30, 2016 compared to the same period in the prior year, primarily due to a decrease in net commission expense, particularly in Casualty and Specialty, reflecting lower production, the effect of reinsurance arrangements, as well as the strengthening of the U.S. dollar against the British pound. These decreases were partially offset by higher guaranty fund and other assessments primarily due to favorable guaranty fund and other assessment settlements in the prior year period.
General operating expenses decreased in the three-month period ended June 30, 2016 compared to the same period in the prior year, primarily due to lower employee-related expenses resulting from actions to streamline our management structure and general cost containment measures commenced in 2015 and continuing through June 30, 2016.
Net investment income decreased in the three-month period ended June 30, 2016 compared to the same period in the prior year, primarily due to lower income on alternative investments as well as fair market value declines on assets accounted for under the fair value option. In the same period in the prior year, Property Casualty recorded net investment income related to assets accounted for under the fair value option.
See MD&A — Investments for additional information on the Non-Life Insurance Companies invested assets, investment strategy, and asset-liability management process.
Property Casualty Year-to-Date Results
Pre-tax operating income decreased in the six-month period ended June 30, 2016 compared to the same period in the prior year due to lower net investment income driven by lower returns on alternative investments and a decrease in underwriting income. The decrease in underwriting income was primarily driven by:
• a net loss reserve discount charge in the six-month period ended June 30, 2016 compared to a net loss reserve discount benefit for the same period in the prior year;
• higher catastrophe losses compared to the same period in the prior year;
• lower net adverse prior year loss reserve development in the current year which reflected approximately $100 million reserve charge attributable to Florida court rulings in the second quarter of 2016 that have increased the potential liability for workers’ compensation claims in that state by reversing certain aspects of regulations in place since 2003;
• improvements in the accident year loss ratio, as adjusted, from our strategic actions to retain more profitable business; and
• lower general operating expenses resulting from lower employee-related expenses and our expense savings. Initiatives.
The current accident year losses for the six-month period ended June 30, 2016 included ten severe losses totaling $239 million compared to 16 severe losses totaling $318 million in the same period in the prior year. The net loss reserve discount

I TEM 2 / RESULTS OF OPERATIONS / COMMERCIAL INSURANCE
106
charge was $165 million in the six-month period ended June 30, 2016, compared to a benefit of $177 million in the same period in the prior year, primarily reflecting a decrease in the reserve discount curve consisting of the U.S. Treasury forward yield curve and a liquidity margin. See Insurance Reserves – Non-Life Insurance Companies – Discounting of Reserves for further discussion. Net adverse prior year loss reserve development, including return premiums, was $48 million and $307 million in the six-month periods ended June 30, 2016 and 2015, respectively. See Insurance Reserves – Non-Life Insurance Companies – Net Loss Development for further discussion. Catastrophe losses were $575 million in the six-month period ended June 30, 2016, compared to $280 million in the same period in the prior year.
Acquisition expenses decreased in the six-month period ended June 30, 2016 compared to the same period in the prior year, primarily due to a decrease in net commission expense, particularly in Casualty, reflecting lower production, the effect of reinsurance arrangements, as well as the strengthening of the U.S. dollar against the euro and British pound. These decreases were partially offset by higher guaranty fund and other assessments primarily due to favorable guaranty fund and other assessment settlements in the prior year period.
General operating expenses decreased in the six-month period ended June 30, 2016 compared to the same period in the prior year, primarily due to lower employee-related expenses resulting from actions to streamline our management structure and general cost containment measures commenced in 2015 and continuing through 2016.
Net investment income decreased in the six-month period ended June 30, 2016 compared to the same period in the prior year, primarily due to lower income on alternative investments as well as fair market value declines on assets accounted for under the fair value option. In the same period in the prior year, Property Casualty recorded net investment income related to assets accounted for under the fair value option, as well as gains related to hedge funds.
See MD&A — Investments for additional information on the Non-Life Insurance Companies invested assets, investment strategy, and asset-liability management process.
Property Casualty Net Premiums Written
The following table presents Property Casualty’s net premiums written by major line of business:
Three Months Ended Percentage Change in Six Months Ended Percentage Change in
June 30, U.S. Original June 30, U.S. Original (in millions) 2016 2015 dollars Currency 2016 2015 dollars Currency
Casualty $ 1,109 $ 1,812 (39)% (39)% $ 2,472 $ 3,694 (33)% (32)%
Property 1,442 1,628 (11) (11) 2,466 2,635 (6) (4)
Specialty 760 918 (17) (16) 1,650 1,872 (12) (10)
Financial lines 1,113 1,225 (9) (9) 2,143 2,429 (12) (10)
Total Property Casualty net
premiums written $ 4,424 $ 5,583 (21)% (20)% $ 8,731 $ 10,630 (18)% (16)%

I TEM 2 / RESULTS OF OPERATIONS / COMMERCIAL INSURANCE
107
PROPERTY CASUALTY NET PREMIUMS WRITTEN BY LINE OF BUSINESS
( in mi l l ions)
Property Casualty Quarterly and Year-to-Date Net Premiums Written
Property Casualty net premiums written decreased in all lines of business in the three- and six-month periods ended June 30, 2016, compared to the same periods in the prior year, in line with our planned portfolio optimization. This decrease was primarily due to the continued execution of our strategy to enhance risk selection in our Casualty and Property product portfolios, the non-renewal of certain underperforming classes of business, the increased use of reinsurance and adherence to our underwriting discipline in competitive market conditions, as well as the effect of foreign exchange, particularly the strengthening of the U.S. dollar against the British pound. Additionally, for the six-month period ended June 30, 2015, net premiums written benefited from the renewal of a multi-year E&O policy in U.S. Financial lines. The following paragraphs discuss the changes within our lines of business exclusive of the effect of foreign exchange.
Casualty net premiums written decreased, particularly in the U.S., in the three- and six-month periods ended June 30, 2016, compared to the same periods in the prior year reflecting the continued execution of our strategy to enhance risk selection and to optimize our product portfolio, which includes non-renewal of certain underperforming classes of business, revising rates, terms and conditions in certain underperforming portfolios, and the effect of the two-year reinsurance arrangement with the Swiss Re Group.
Property net premiums written decreased in the three- and six-month periods ended June 30, 2016, compared to the same periods in the prior year, primarily due to lower renewal retention and decreases in new business across all regions reflecting rate pressure and the effort to adhere to our underwriting discipline, partially offset by changes to our catastrophe reinsurance programs to retain more favorable risks.
Specialty net premiums written decreased in the three- and six-month periods ended June 30, 2016, compared to the same periods in the prior year, primarily due to the execution of our strategy to restructure the U.S environmental business, which includes non-renewal of certain pollution legal liability business in the U.S. and Canada, increased use of reinsurance, and a decline in EMEA Aerospace. These declines were partially offset by an increase in certain targeted growth products, particularly in the U.S. and Asia.

I TEM 2 / RESULTS OF OPERATIONS / COMMERCIAL INSURANCE
108
Financial lines net premiums written decreased in the three-month period ended June 30, 2016, compared to the same period in the prior year primarily due to lower renewal retention and decreases in new business across all regions reflecting rate pressure and efforts to adhere to our underwriting discipline. For the six-month period ended June 30, 2016, net premiums written decreased, compared to the same period in the prior year primarily due to lower renewal retention and decreases in new business, particularly in the U.S., partially offset by an increase in targeted growth products in EMEA and Asia. Additionally, in the first six months of 2015, net premiums written benefited from the renewal of a multi-year E&O policy in the U.S.
Property Casualty Net Premiums Written by Region
The following table presents Property Casualty’s net premiums written by region:
Percentage Percentage Percentage Percentage
Three Months Ended Change in Change in Six Months Ended Change in Change in
June 30, U.S. Original June 30, U.S. Original
(in millions) 2016 2015 dollars Currency 2016 2015 dollars Currency
Property Casualty:
Americas $ 2,867 $ 3,892 (26)% (26)% $ 5,190 $ 6,841 (24)% (24)%
Asia Pacific 456 460 (1) (2) 881 942 (6) (4)
EMEA 1,101 1,231 (11) (10) 2,660 2,847 (7) (3)
Total net premiums written $ 4,424 $ 5,583 (21)% (20)% $ 8,731 $ 10,630 (18)% (16)%
PROPERTY CASUALTY NET PREMIUMS WRITTEN BY REGION
( in mi l l ions)
The following paragraphs discuss the changes in net premiums written on a constant dollar basis, which exclude the effect of foreign exchange.
The Americas net premiums written decreased in the three- and six-month periods ended June 30, 2016, compared to the same periods in the prior year, primarily due to the continued execution of our strategy to optimize our product portfolio in the Casualty and Environmental businesses, increased use of reinsurance, and lower new and renewal business in Property and Financial lines. These declines were partially offset by an increase in certain targeted growth products in Specialty. Additionally, for the six-month period ended June 30, 2015, net premiums written benefited from the renewal of a multi-year E&O policy in U.S. Financial lines.

I TEM 2 / RESULTS OF OPERATIONS / COMMERCIAL INSURANCE
109
Asia Pacific net premiums written decreased in the three- and six-month periods ended June 30, 2016, compared to the same periods in the prior year, primarily due to lower new and renewal business, particularly in Property, reflecting rate pressure and the effort to adhere to our underwriting discipline, partially offset by an increase in certain targeted growth products in Specialty.
EMEA net premiums written decreased in the three-month period ended June 30, 2016, compared to the same period in the prior year, reflecting lower new and renewal business across all lines, particularly in Aerospace. Net premiums written decreased in the six-month period ended June 30, 2016, compared to the same period in the prior year, primarily due to lower new and renewal business, particularly in Specialty and Property, partially offset by an increase in certain targeted growth products in Financial lines.
Property Casualty Underwriting Ratios
Our Commercial Property Casualty business experiences period-to-period volatility, which may affect observable trends in key metrics, particularly underwriting ratios, and makes it difficult to predict future results by extrapolating movements in these metrics from quarter-to-quarter. Future results should not be extrapolated based on quarter-to-quarter movements in these metrics.
The following tables present the Property Casualty combined ratios based on GAAP data and reconciliation to the accident year combined ratio, as adjusted:
Three Months Ended Six Months Ended June 30, Increase June 30, Increase
2016 2015 (Decrease) 2016 2015 (Decrease)
Loss ratio 75.0 70.8 4.2 71.6 69.5 2.1
Catastrophe losses and reinstatement premiums (7.5) (4.1) (3.4) (6.1) (2.8) (3.3)
Prior year development net of premium adjustments (1.0) (5.3) 4.3 (0.3) (2.9) 2.6
Net reserve discount benefit (charge) (4.1) 5.2 (9.3) (1.8) 1.7 (3.5)
Accident year loss ratio, as adjusted 62.4 66.6 (4.2) 63.4 65.5 (2.1)
Acquisition ratio 15.4 15.1 0.3 15.9 15.6 0.3
General operating expense ratio 11.7 12.9 (1.2) 12.1 12.8 (0.7)
Expense ratio 27.1 28.0 (0.9) 28.0 28.4 (0.4)
Combined ratio 102.1 98.8 3.3 99.6 97.9 1.7
Catastrophe losses and reinstatement premiums (7.5) (4.1) (3.4) (6.1) (2.8) (3.3)
Prior year development net of premium adjustments (1.0) (5.3) 4.3 (0.3) (2.9) 2.6
Net reserve discount benefit (charge) (4.1) 5.2 (9.3) (1.8) 1.7 (3.5)
Accident year combined ratio, as adjusted 89.5 94.6 (5.1) 91.4 93.9 (2.5)
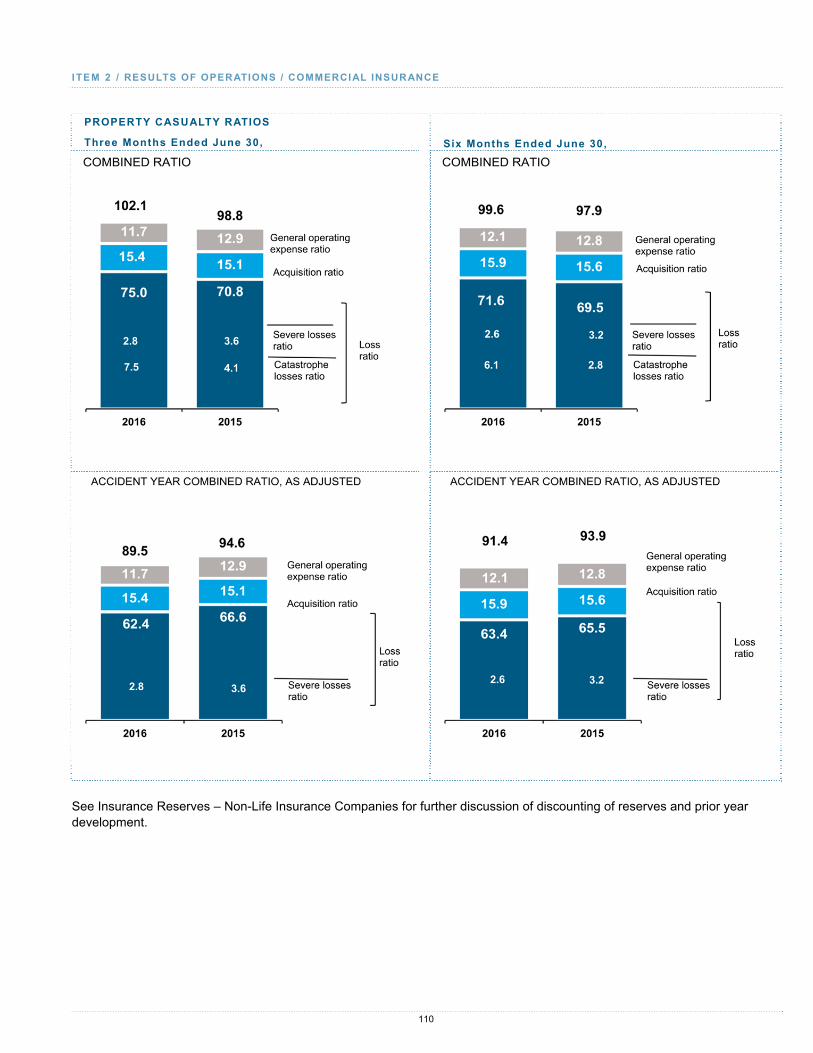
I TEM 2 / RESULTS OF OPERATIONS / COMMERCIAL INSURANCE
110
PROPERTY CASUALTY RATIOS
Three Months Ended June 30,
Six Months Ended June 30,
See Insurance Reserves – Non-Life Insurance Companies for further discussion of discounting of reserves and prior year development.

I TEM 2 / RESULTS OF OPERATIONS / COMMERCIAL INSURANCE
111
The following tables present Property Casualty’s accident year catastrophe and severe losses by region and number of events:
Catastrophes (a)
# of Asia (in millions) Events Americas Pacific EMEA TotalThree Months Ended June 30, 2016 Natural catastrophes:
Flooding 2 $ 37 $ - $ 46 $ 83Windstorms and hailstorms 4 117 8 1 126Wildfire 1 51 - 10 61Earthquakes 2 54 24 5 83
Total catastrophe-related charges 9 $ 259 $ 32 $ 62 $ 353Three Months Ended June 30, 2015 Natural catastrophes:
Flooding 2 $ 67 $ - $ 2 $ 69Windstorms and hailstorms 7 103 14 23 140
Total catastrophe-related charges 9 $ 170 $ 14 $ 25 $ 209Six Months Ended June 30, 2016 Natural catastrophes:
Flooding 2 $ 37 $ - $ 46 $ 83Windstorms and hailstorms 11 301 15 2 318Wildfire 1 51 - 10 61Earthquakes 2 54 24 5 83
Other events 1 - - 30 30Total catastrophe-related charges 17 $ 443 $ 39 $ 93 $ 575Six Months Ended June 30, 2015 Natural catastrophes:
Flooding 2 $ 67 $ - $ 2 $ 69Windstorms and hailstorms 8 174 14 23 211
Total catastrophe-related charges 10 $ 241 $ 14 $ 25 $ 280
(a) Natural catastrophe losses are generally weather or seismic events having a net impact on AIG in excess of $10 million each. Catastrophes also include certain man-made events, such as terrorism and civil disorders that meet the $10 million threshold.
Severe Losses(b) # of Asia (in millions) Events Americas Pacific EMEA TotalThree Months Ended June 30, 2016 4 $ 96 $ 12 $ 22 $ 1302015 8 $ 122 $ - $ 62 $ 184Six Months Ended June 30, 2016 10 $ 106 $ 12 $ 121 $ 2392015 16 $ 235 $ - $ 83 $ 318
(b) Severe losses are defined as non-catastrophe individual first party losses and surety losses greater than $10 million, net of related reinsurance and salvage and subrogation.

I TEM 2 / RESULTS OF OPERATIONS / COMMERCIAL INSURANCE
112
Property Casualty Quarterly and Year-to-Date Insurance Ratios
The combined ratio increased in the three- and six-month periods ended June 30, 2016, compared to the same periods in the prior year, primarily due to an increase in the loss ratio partially offset by a lower expense ratio.
The accident year combined ratio, as adjusted, decreased in the three- and six-month periods ended June 30, 2016, compared to the same periods in the prior year, primarily due to a decrease in the accident year loss ratio, as adjusted, as well as a lower expense ratio.
The loss ratio increased in the three- and six-month periods ended June 30, 2016, compared to the same periods in the prior year, primarily due to a net loss reserve discount charge compared to net loss reserve discount benefit in the same periods in the prior year and higher catastrophe losses. These increases were partially offset by an improvement in the accident year loss ratio, as adjusted, as well as lower net adverse prior year loss reserve development.
The accident year loss ratio, as adjusted, decreased in the three- and six-month periods ended June 30, 2016, compared to the same periods in the prior year, reflecting the continued execution of our strategy to enhance risk selection, improve underwriting discipline and manage exposures, including the use of reinsurance, and overall lower severe losses. The accident year loss ratio, as adjusted, improved in Casualty, reflecting the non-renewal of certain underperforming classes of business, as well as the effect of reinsurance. Financial lines improved across all regions due to our pricing discipline, and Specialty benefited from lower severe and attritional losses. These decreases were partially offset by higher attritional and severe losses in Property. Severe losses represented approximately 2.8 points and 2.6 points of the accident year loss ratio, as adjusted, in the three- and six-month periods ended June 30, 2016, respectively, compared to 3.6 points and 3.2 points, respectively, in the same periods in the prior year.
The acquisition ratio increased by 0.3 points in both the three- and six-month periods ended June 30, 2016, compared to the same periods in the prior year, primarily due to favorable guaranty fund and other assessments settlements in the same periods in the prior year, partially offset by lower net commission expenses, particularly in U.S. Casualty and U.S Specialty, reflecting the effect of reinsurance arrangements.
The general operating expense ratio decreased by 1.2 points and 0.7 points in the three- and six-month periods ended June 30, 2016, respectively, compared to the same periods in the prior year, primarily due to lower employee-related costs resulting from ongoing actions to streamline our management structure and general cost containment measures commenced in 2015 and continuing through June 30, 2016.

I TEM 2 / RESULTS OF OPERATIONS / COMMERCIAL INSURANCE
113
Mortgage Guaranty Results
The following table presents Mortgage Guaranty results:
Three Months Ended Six Months Ended June 30, Percentage June 30, Percentage
(dollars in millions) 2016 2015 Change 2016 2015 Change
Underwriting results:
Net premiums written $ 244 $ 277 (12)% $ 475 $ 535 (11)%
Increase in unearned premiums (5) (51) 90 (11) (79) 86
Net premiums earned 239 226 6 464 456 2
Losses and loss adjustment expenses incurred 25 44 (43) 67 102 (34)
Acquisition expenses:
Amortization of deferred policy acquisition costs 9 7 29 16 14 14
Other acquisition expenses 12 13 (8) 25 28 (11)
Total acquisition expenses 21 20 5 41 42 (2)
General operating expenses 42 40 5 78 79 (1)
Underwriting income 151 122 24 278 233 19
Net investment income 36 35 3 72 69 4
Pre-tax operating income 187 157 19 350 302 16
Key metrics:
Prior year loss reserve development (favorable)/
unfavorable $ (12) $ (17) (29)% $ (17) $ (17) - %
Domestic first-lien:
New insurance written $ 12,985 $ 15,190 (15) $ 21,812 $ 25,732 (15)
Combined ratio 38.1 48.4 41.7 50.9
Primary risk in force $ 47,719 $ 44,723 7
60+ day delinquency ratio on primary loans(a) 2.9 % 3.6 %
Domestic second-lien:
Risk in force(b) $ 359 $ 426 (16)
(a) Based on number of policies.
(b) Represents the full amount of second-lien loans insured reduced for contractual aggregate loss limits on certain pools of loans, which is usually 10 percent of the full amount of loans insured in each pool. Certain second-lien pools have reinstatement provisions, which will expire as the loan balances are repaid.
PRE-TAX OPERATING INCOME ( in mi l l ions)
DOMESTIC FIRST-LIEN NEW INSURANCE WRITTEN ON MORTGAGE LOANS ( in mi l l ions)

I TEM 2 / RESULTS OF OPERATIONS / COMMERCIAL INSURANCE
114
The following table presents Mortgage Guaranty first-lien results:
Three Months Ended Six Months Ended June 30, Percentage June 30, Percentage
(dollars in millions) 2016 2015 Change 2016 2015 Change
Underwriting results:
Net premiums written $ 231 $ 262 (12)% $ 450 $ 504 (11)%
Increase in unearned premiums (6) (51) 88 (11) (78) 86
Net premiums earned 225 211 7 439 426 3
Losses and loss adjustment expenses incurred 30 46 (35) 76 104 (27)
Acquisition expenses:
Amortization of deferred policy acquisition costs 9 7 29 16 14 14
Other acquisition expenses 12 13 (8) 25 27 (7)
Total acquisition expenses 21 20 5 41 41 -
General operating expenses 35 36 (3) 66 72 (8)
Underwriting income 139 109 28 256 209 22
Net investment income 33 32 3 66 63 5
Pre-tax operating income $ 172 $ 141 22 % $ 322 $ 272 18 %
Mortgage Guaranty Quarterly Results
Pre-tax operating income increased in the three-month period ended June 30, 2016 compared to the same period in the prior year, primarily due to a decline in incurred losses from lower delinquency rates and higher cure rates. The decline in net premiums written primarily reflected reductions in run-off business and in new insurance volume driven by the decline in mortgage refinances in 2016. Mortgage refinances were higher in 2015 due to lower mortgage interest rates in late 2014 and early 2015 resulting in a surge in refinancing activity.
First-Lien Results
First-lien pre-tax operating income increased in the three-month period ended June 30, 2016, compared to the same period in the prior year, reflecting an increase in underwriting income. First-lien net premiums earned increased in the three-month period ended June 30, 2016, compared to the same period in the prior year, primarily from an increase in the policies in-force. First-lien losses and loss adjustment expenses incurred in the three-month period ended June 30, 2016 decreased by $16 million compared to the same period in the prior year driven by lower frequency and severity in new delinquencies and an increase in cure rates. The combined ratio decreased by 10.3 points to 38.1 points in the three-month period ended June 30, 2016, compared to the same period in the prior year, reflecting an improvement in overall underwriting results.
Acquisition expenses increased slightly in the three-month period ended June 30, 2016 compared to the same period in the prior year, primarily as a result of increase in the amortization of deferred acquisition costs.
General operating expenses decreased slightly in the three-month period ended June 30, 2016 compared to the same period in the prior year, primarily due to a reduction in employee-related expenses compared to the same period in the prior year.
Other Business Results
Other business results include second-lien mortgage insurance, student loan insurance and non-domestic mortgage insurance operations.
The Other business’ pre-tax operating income for the three-month period ended June 30, 2016 remained unchanged compared to the same period in the prior year at approximately $15 million as a decrease in net premiums earned was entirely offset by a decrease in losses and loss adjustment expenses.

I TEM 2 / RESULTS OF OPERATIONS / COMMERCIAL INSURANCE
115
Mortgage Guaranty Year-to-Date Results
Pre-tax operating income increased in the six-month period ended June 30, 2016 compared to the same period in the prior year, primarily due to a decline in incurred losses from lower delinquency rates and higher cure rates. The decline in net premiums written primarily reflected lower new insurance written compared to the early part of 2015 when the housing market experienced increased refinancing activity.
First-Lien Results
First-lien pre-tax operating income increased in the six-month period ended June 30, 2016, compared to the same period in the prior year, reflecting an increase in underwriting income. First-lien net premiums earned increased in the six-month period ended June 30, 2016, compared to the same period in the prior year, primarily from an increase in in-force policies. First-lien losses and loss adjustment expenses incurred in the six-month period ended June 30, 2016 decreased by $28 million compared to the same period in the prior year due to a decline in newly reported delinquencies and an increase in cure rates. The combined ratio decreased by 9.2 points to 41.7 points in the six-month period ended June 30, 2016, compared to the same period in the prior year, reflecting an improvement in overall underwriting results.
Acquisition expenses remained unchanged at $41 million in the six-month period ended June 30, 2016 compared to the same period in the prior year, as reductions in expenses related to sales support activities were offset by amortization of deferred acquisition costs.
General operating expenses decreased in the six-month period ended June 30, 2016 compared to the same period in the prior year, primarily due to a reduction in employee-related expenses.
Other Business Results
The Other business’ pre-tax operating income for the six-month period ended June 30, 2016 was approximately $28 million compared to $30 million in the same period in the prior year. The slight decrease in pre-tax operating income was primarily due to a decrease in net premiums earned as these portfolios continued to run off, partially offset by a decrease in losses and loss adjustment expenses.
New Insurance Written on Domestic First-Lien Mortgage Loans
Mortgage Guaranty’s domestic first-lien new insurance written was $13.0 billion and $21.8 billion in the three- and six-month periods ended June 30, 2016, respectively, compared to $15.2 billion and $25.7 billion, respectively, in the same periods in the prior year, due to lower mortgage interest rates in late 2014 and early 2015 resulting in an increase in refinancing activity in early 2015.
Delinquency Inventory
The delinquency inventory for domestic first-lien business declined during the three-month period ended June 30, 2016 compared to the same period in the prior year as a result of cures and paid claims exceeding the number of newly reported delinquencies. Mortgage Guaranty’s first-lien primary delinquency ratio at June 30, 2016 was 2.9 percent compared to 3.6 percent at June 30, 2015. Over the last several years, Mortgage Guaranty has experienced a decline in newly reported delinquencies and an increase in cure rates.

I TEM 2 / RESULTS OF OPERATIONS / COMMERCIAL INSURANCE
116
The following table provides a summary of activity in Mortgage Guaranty’s domestic first lien delinquency inventory:
Six Months Ended June 30, (number of policies) 2016 2015*
Number of primary delinquencies at the beginning of the year 30,471 37,622Newly reported 17,450 19,063Cures (16,944) (19,487)Claims paid (3,209) (4,429)Other (1,508) (878)Number of primary delinquencies at the end of the period 26,260 31,891
* In the second quarter of 2016, Mortgage Guaranty’s number of delinquent loans was revised to remove modified pool policies and reflect primary first-lien only
policies. The prior period has been revised to conform to the current period presentation.
Mortgage Guaranty Quarterly and Year-to-Date Underwriting Ratios
The following tables present the Mortgage Guaranty combined ratios based on GAAP data:
Three Months Ended Six Months Ended June 30, Increase June 30, Increase 2016 2015 (Decrease) 2016 2015 (Decrease)Loss ratio 10.5 19.5 (9.0) 14.4 22.4 (8.0)
Acquisition ratio 8.8 8.8 - 8.8 9.2 (0.4)General operating expense ratio 17.6 17.7 (0.1) 16.8 17.3 (0.5)
Expense ratio 26.4 26.5 (0.1) 25.6 26.5 (0.9)Combined ratio 36.9 46.0 (9.1) 40.0 48.9 (8.9)
The combined ratio decreased by 9.1 points and 8.9 points in the three- and six-month periods ended June 30, 2016, respectively, compared to the same periods in the prior year, primarily due to a lower loss ratio. The decrease in the loss ratio in the three- and six-month periods ended June 30, 2016 was driven primarily by a decline in incurred losses driven by fewer new delinquencies and higher cure rates.
The acquisition ratio remained flat and decreased by 0.4 points in the three- and six-month periods ended June 30, 2016, respectively, compared to the same periods in the prior year. In the six-month period ended June 30, 2016, the acquisition ratio decreased primarily due to reduced expenses related to sales activities supporting lower new insurance written.
The general operating expense ratio decreased by 0.1 point and 0.5 points in the three- and six-month periods ended June 30, 2016, respectively, compared to the same periods in the prior year, primarily due to a decrease in employee-related expenses.

I TEM 2 / RESULTS OF OPERATIONS / COMMERCIAL INSURANCE
117
Institutional Markets Results
The following table presents Institutional Markets results:
Three Months Ended Six Months Ended
June 30, Percentage June 30, Percentage
(in millions) 2016 2015 Change 2016 2015 Change
Revenues:
Premiums $ 215 $ 643 (67)% $ 450 $ 739 (39)%
Policy fees 50 50 - 101 99 2
Net investment income 430 479 (10) 763 958 (20)
Benefits and expenses:
Policyholder benefits and losses incurred 457 891 (49) 938 1,240 (24)
Interest credited to policyholder account balances 101 102 (1) 202 204 (1)
Amortization of deferred policy acquisition costs - - NM 1 1 -
Other acquisition expenses 7 8 (13) 18 15 20
General operating expenses 20 20 - 39 38 3
Pre-tax operating income $ 110 $ 151 (27)% $ 116 $ 298 (61)%
INSTITUTIONAL MARKETS PRE-TAX OPERATING INCOME ( in mi l l ions)

I TEM 2 / RESULTS OF OPERATIONS / COMMERCIAL INSURANCE
118
Institutional Markets Quarterly Results
Pre-tax operating income decreased in the three-month period ended June 30, 2016 compared to the same period in the prior year, primarily due to lower net investment income on alternative investments. Variances in premiums and benefits and expenses are primarily due to premiums received and future policy benefit reserves established from the sale of terminal funding annuities and structured settlements. The decreases in premiums and in benefits and expenses, compared to the same period in the prior year, were due to a large terminal funding annuity issued in the three-month period ended June 30, 2015.
Net investment income in the three-month period ended June 30, 2016 decreased compared to the same period in the prior year, primarily due to lower income on alternative investments, which was positive in the current period but lower than the same period in the prior year. Base net investment income for the three-month period ended June 30, 2016 increased compared to the same period in the prior year, primarily due to growth in average base invested assets. Certain traditional long-duration products for which Institutional Markets does not have the ability to adjust interest rates, such as life-contingent structured settlements, are exposed to reduced earnings and potential loss recognition reserve increases in a sustained low interest rate environment. See MD&A – Investments – Life Insurance Companies for additional information on the investment strategy, asset-liability management process and invested assets of our Life Insurance Companies, which include the invested assets of the Institutional Markets business.
General operating expenses in the three-month period ended June 30, 2016 were comparable to the same period in the prior year.
Institutional Markets Year-to-Date Results
Pre-tax operating income decreased in the six-month period ended June 30, 2016 compared to the same period in the prior year, primarily due to lower net investment income on alternative investments. The decreases in premiums and benefits and expenses were primarily due to a large terminal funding annuity issued in the six-month period ended June 30, 2015.
Net investment income in the six-month period ended June 30, 2016 decreased compared to the same period in the prior year, primarily due to lower income on alternative investments, partially offset by higher base net investment income, primarily due to growth in average invested assets.
Base net investment income for the six-month period ended June 30, 2016 increased compared to the same period in the prior year, due to commercial mortgage loan prepayment income in the six-month period ended June 30, 2016 and growth in average base invested assets. See MD&A – Investments – Life Insurance Companies for additional information on the investment strategy, asset-liability management process and invested assets of our Life Insurance Companies, which include the invested assets of the Institutional Markets business.
General operating expenses in the six-month period ended June 30, 2016 increased slightly compared to the same period in the prior year, primarily due to higher interest expense related to real estate of consolidated partnerships, which was more than offset by related investment income.
Institutional Markets Premiums and Deposits
For Institutional Markets, premiums represent amounts received on traditional life insurance policies and life-contingent payout annuities or structured settlements. Premiums and deposits is a non-GAAP financial measure that includes direct and assumed premiums as well as deposits received on universal life insurance and investment-type annuity contracts, including GICs and stable value wrap funding agreements.

I TEM 2 / RESULTS OF OPERATIONS / COMMERCIAL INSURANCE
119
The following table presents a reconciliation of Institutional Markets premiums and deposits to GAAP premiums:
Three Months Ended Six Months Ended June 30, June 30, (in millions) 2016 2015 2016 2015Premiums and deposits $ 506 $ 680 $ 810 $ 826Deposits (288) (26) (349) (71)Other (3) (11) (11) (16)Premiums $ 215 $ 643 $ 450 $ 739
Premiums for the three- and six-month periods ended June 30, 2016 decreased compared to the same periods in the prior year, primarily due to a large single premium for a terminal funding annuity issued in the three-month period ended June 30, 2015. The decrease in premiums was offset by an increase in deposits in the three- and six-month periods ended June 30, 2016 compared to the same periods in the prior year, primarily due to a $254 million ten-year, floating-rate funding agreement issued to the Federal Home Loan Bank of Dallas in the three- and six-month periods ended June 30, 2016.
CONSUMER INSURANCE
Consumer Insurance presents its operating results in three operating segments – Retirement, Life and Personal Insurance.
Retirement provides a broad portfolio of retirement products and services to individual consumers. The primary products offered by the Retirement operating segment include individual fixed and variable annuities, group retirement plans, retail mutual funds and financial planning services. Retirement products are distributed through affiliated channels, including The Variable Annuity Life Insurance Company (VALIC) career financial advisors, and through non-affiliated channels, which include banks, wirehouses, regional and independent broker-dealers, independent marketing organizations and independent insurance agents.
Life products offered in the U.S. primarily include term life and universal life insurance. International products include term and whole life insurance, supplemental health, cancer and critical illness insurance. Life products are primarily distributed through independent marketing organizations, independent insurance agents, financial advisors and direct marketing. The Life operating segment also provides group products distributed through employers (both employer-paid and voluntary) and sponsored organizations, including basic and supplemental term life, universal life and disability insurance.
Personal Insurance provides accident and health and personal lines insurance products to individuals, organizations and families. The products offered by the Personal Insurance operating segment include voluntary and sponsor-paid personal accident and supplemental health products for individuals, employees, associations and other organizations as well as a broad range of travel insurance products and services for leisure and business travelers. Personal Lines products include automobile and homeowners insurance, extended warranty, and consumer specialty products, such as identity theft and credit card protection. Personal Insurance also provides insurance for high net worth individuals offered through AIG Private Client Group, including auto, homeowners, umbrella, yacht, fine art and collections insurance. Personal Insurance products and services are distributed through various channels, including agents, brokers, affinity partners, airlines and travel agents, as well as direct marketing.
See Part I, Item 1. Business in AIG’s 2015 Annual Report for further discussion of our products and geographic regions where we distribute our products.

I TEM 2 / RESULTS OF OPERATIONS / CONSUMER INSURANCE
120
Consumer Insurance Results
The following table presents Consumer Insurance results:
Three Months Ended Six Months Ended June 30, Percentage June 30, Percentage
(in millions) 2016 2015 Change 2016 2015 Change
Revenues:
Premiums $ 3,676 $ 3,552 3 % $ 7,236 $ 7,105 2 %
Policy fees 643 639 1 1,280 1,266 1
Net investment income 2,162 2,232 (3) 3,990 4,407 (9)
Other income 333 543 (39) 840 1,051 (20)
Benefits and expenses:
Policyholder benefits and losses incurred 2,668 2,561 4 5,188 5,240 (1)
Interest credited to policyholder account balances 849 837 1 1,694 1,670 1
Amortization of deferred policy acquisition costs 785 737 7 1,554 1,452 7
General operating and other expenses* 1,408 1,808 (22) 3,018 3,499 (14)
Pre-tax operating income $ 1,104 $ 1,023 8 % $ 1,892 $ 1,968 (4)%
* Includes general operating expenses, non deferrable commissions, other acquisition expenses, advisory fee expenses and other expenses.
Consumer Insurance Results by Operating Segment
The following section provides a comparative discussion of Consumer Insurance Results of Operations for the three- and six-month periods ended June 30, 2016 and 2015 by operating segment.
Retirement Results
The following table presents Retirement results:
Three Months Ended Six Months Ended
June 30, Percentage June 30, Percentage
(in millions) 2016 2015 Change 2016 2015 Change
Revenues:
Premiums $ 52 $ 44 18 % $ 106 $ 90 18 %
Policy fees 272 277 (2) 531 541 (2)
Net investment income 1,567 1,618 (3) 2,876 3,188 (10)
Advisory fee and other income 318 526 (40) 810 1,034 (22)
Benefits and expenses:
Policyholder benefits and losses incurred 114 116 (2) 238 208 14
Interest credited to policyholder account balances 728 715 2 1,451 1,424 2
Amortization of deferred policy acquisition costs 158 158 - 327 300 9
Non deferrable insurance commissions 74 69 7 146 138 6
Advisory fee expenses 173 341 (49) 490 673 (27)
General operating expenses 221 262 (16) 469 506 (7)
Pre-tax operating income $ 741 $ 804 (8)% $ 1,202 $ 1,604 (25)%

I TEM 2 / RESULTS OF OPERATIONS / CONSUMER INSURANCE
121
RETIREMENT PRE-TAX OPERATING INCOME ( in mi l l ions)
Retirement Quarterly Results
Pre-tax operating income in the three-month period ended June 30, 2016 decreased compared to the same period in the prior year, primarily due to lower returns on alternative investments resulting in lower net investment income, partially offset by a decrease in general operating expenses from lower employee-related expenses. The sale of AIG Advisor Group in May 2016 resulted in decreases in advisory fee income, advisory fee expense and general operating expenses in the three-month period ended June 30, 2016 compared to the same period in the prior year.
Net investment income for the three-month period ended June 30, 2016 decreased compared to the same period in the prior year, primarily due to income on alternative investments, which was positive in the current period but lower than the same period in the prior year. Base net investment income was lower in the three-month period ended June 30, 2016, due to lower reinvestment yields and lower accretion income, compared to the same period in the prior year. These decreases were partially offset by higher yield enhancements, which included higher bond call and tender income and gains on securities for which the fair value option was elected.
Base net investment income for the three-month period ended June 30, 2016 decreased compared to the same period in the prior year, and Retirement fixed maturity portfolio yields in the three-month period ended June 30, 2016 declined compared to the same period in the prior year, primarily as a result of investment purchases and investment of portfolio cash flows, which continued to be at rates below the weighted average yield of the existing portfolio in the sustained low interest rate environment, as well as additional accretion included in the three-month period ended June 30, 2015. The decrease in base net investment income due to lower yields was partially offset by growth in average invested assets due to positive net flows in the past twelve months. See Investments – Life Insurance Companies for additional information on the investment strategy, asset-liability management process and invested assets of our Life Insurance Companies, which include the invested assets of the Retirement business.
In Group Retirement, lower base yields resulted in spread compression in the three-month period ended June 30, 2016 compared to the same period in the prior year, as lower base net investment income due to lower yields and lower accretion income was only partially offset by lower average interest crediting rates. In Fixed Annuities, average crediting rates in the three-month period ended June 30, 2016 were comparable to the same period in the prior year, and base spreads decreased slightly due to lower base yields. See Spread Management below for additional discussion.

I TEM 2 / RESULTS OF OPERATIONS / CONSUMER INSURANCE
122
General operating expenses decreased in the three-month period ended June 30, 2016 compared to the same period in the prior year, due to decreases in employee-related expenses, as well as the sale of AIG Advisor Group in May 2016. General operating expenses in the three-month period ended June 30, 2016 also included interest expense related to real estate of consolidated partnerships, which was more than offset by related investment income.
Retirement Year-to-Date Results
Pre-tax operating income in the six-month period ended June 30, 2016 decreased compared to the same period in the prior year, primarily due to lower net investment income on alternative investments, partially offset by lower general operating expenses due to lower employee-related expenses. DAC amortization was higher in the six-month period ended June 30, 2016 compared to the same period in the prior year, due in part to a higher level of amortization in Fixed Annuities resulting from the update of actuarial assumptions in the third quarter of 2015, and growth in Retirement Income Solutions index annuities. The sale of AIG Advisor Group in May 2016 resulted in decreases in advisory fee income, advisory fee expense and general operating expenses in the six-month period ended June 30, 2016 compared to the same period in the prior year.
Net investment income for the six-month period ended June 30, 2016 decreased compared to the same period in the prior year, primarily due to lower income on alternative investments, which included losses in the first three months of 2016, compared to a strong performance in alternative investments in the six-month period ended June 30, 2015. The decrease in alternative investment income in the six-month period ended June 30, 2016 was partially offset by higher yield enhancement income, which included higher bond call and tender income, and higher base net investment income, compared to the same period in the prior year.
Base net investment income for the six-month period ended June 30, 2016 increased compared to the same period in the prior year, as a result of commercial mortgage loan prepayment income in the six-month period ended June 30, 2016, which more than offset overall continued lower base yields on investment purchases. Retirement fixed maturity portfolio yields in the six-month period ended June 30, 2016 declined compared to the same period in the prior year, primarily as a result of investment purchases and reinvestment of portfolio cash flows, which continued to be at rates below the weighted average yield of the existing portfolio in the sustained low interest rate environment. The decrease in base net investment income due to lower yields was partially offset by growth in average invested assets compared to the same period in the prior year, primarily due to positive net flows in the past twelve months. See Investments – Life Insurance Companies for additional information on the investment strategy, asset-liability management process and invested assets of our Life Insurance Companies, which include the invested assets of the Retirement business.
In Group Retirement, base spreads decreased in the six-month period ended June 30, 2016 compared to the same period in the prior year, due to lower yields on reinvestment of portfolio cash flows and additional accretion in the same period in the prior year, partially offset by lower average interest crediting rates, which are reset annually on January 1 for a large portion of Group Retirement’s fixed option account values. In Fixed Annuities, average crediting rates in the six-month period ended June 30, 2016 were comparable to the same period in the prior year, and base spreads decreased slightly due to lower base yields. See Spread Management below for additional discussion.
General operating expenses decreased in the six-month period ended June 30, 2016 compared to the same period in the prior year, due to decreases in employee-related expenses, as well as the sale of AIG Advisor Group in May 2016. General operating expenses in the six-month period ended June 30, 2016 also included interest expense related to real estate of consolidated partnerships, which was more than offset by related investment income.

I TEM 2 / RESULTS OF OPERATIONS / CONSUMER INSURANCE
123
Spread Management
The contractual provisions for renewal of crediting rates and guaranteed minimum crediting rates included in products may reduce spreads in a sustained low interest rate environment and thus reduce future profitability. Although this interest rate risk is partially mitigated through the Life Insurance Companies’ asset-liability management process, product design elements and crediting rate strategies, a sustained low interest rate environment may negatively affect future profitability.
Disciplined pricing on new business and active crediting rate management are used in the Retirement operating segment to partially offset the impact of a continued decline in base yields resulting from investment of available cash flows in the low interest rate environment.
Disciplined pricing on new business is used to pursue new sales of annuity products at targeted net investment spreads in the current rate environment. Retirement has an active product management process to ensure that new business offerings appropriately reflect the current interest rate environment. To the extent that Retirement cannot achieve targeted net investment spreads on new business, products are re-priced or no longer sold. Additionally, where appropriate, existing products that had higher minimum rate guarantees have been re-filed with lower crediting rates as permitted under state insurance laws for new sales. As a result, new sales of fixed annuity products generally have minimum interest rate guarantees of one percent.
Renewal crediting rate management is done under contractual provisions in annuity products that were designed to allow crediting rates to be reset at pre-established intervals in accordance with state and federal laws and subject to minimum crediting rate guarantees. Retirement will continue to adjust crediting rates on in-force business to mitigate the pressure on spreads from declining base yields. In addition to deferred annuity products, certain traditional long-duration products for which Retirement does not have the ability to adjust interest rates, such as payout annuities, are exposed to reduced earnings and potential loss recognition reserve increases in a sustained low interest rate environment.
As of June 30, 2016, Retirement’s fixed annuity reserves, which include fixed options offered within variable annuities sold in the Group Retirement and Retirement Income Solutions product lines as well as reserves of the Fixed Annuities product line, had minimum guaranteed interest rates ranging from 1.0 percent to 5.5 percent, with the higher rates representing guarantees on older in-force products. As indicated in the table below, approximately 72 percent of annuity account values were at their minimum crediting rates as of June 30, 2016, compared to 73 percent at December 31, 2015. As a result of disciplined pricing on new business and the run-off of older business with higher minimum crediting rates, fixed annuity account values having contractual minimum guaranteed rates above 1 percent decreased from 74 percent of total fixed annuity reserves at December 31, 2015 to 72 percent at June 30, 2016.
The following table presents fixed annuity account values by contractual minimum guaranteed interest rate and current crediting rates:
Current Crediting Rates June 30, 2016 1-50 Basis More than 50 Contractual Minimum Guaranteed At Contractual Points Above Basis PointsInterest Rate Minimum Minimum Above Minimum(in millions) Guarantee Guarantee Guarantee TotalFixed annuities *
1% $ 6,455 $ 5,851 $ 14,918 $ 27,224 > 1% - 2% 12,148 2,220 2,961 17,329 > 2% - 3% 30,302 431 569 31,302 > 3% - 4% 11,947 48 7 12,002 > 4% - 5% 7,716 - 4 7,720 > 5% - 5.5% 199 - 5 204
Total $ 68,767 $ 8,550 $ 18,464 $ 95,781 Percentage of total 72 % 9 % 19 % 100 %
* Fixed annuities shown include fixed options within variable annuities sold in Group Retirement and Retirement Income Solutions product lines.

I TEM 2 / RESULTS OF OPERATIONS / CONSUMER INSURANCE
124
Retirement Premiums and Deposits, Surrenders and Net Flows
Premiums
For Retirement, premiums primarily represent amounts received on life-contingent payout annuities. Premiums and deposits is a non-GAAP financial measure that includes, in addition to direct and assumed premiums, deposits received on investment-type annuity contracts and mutual funds.
The following table presents a reconciliation of Retirement premiums and deposits to GAAP premiums:
Three Months Ended Six Months Ended June 30, June 30, (in millions) 2016 2015 2016 2015Premiums and deposits* $ 6,431 $ 6,070 $ 13,284 $ 11,579Deposits (6,377) (6,046) (13,178) (11,537)Other (2) 20 - 48Premiums $ 52 $ 44 $ 106 $ 90
* Excludes activity related to closed blocks of fixed and variable annuities.
Premiums increased in the three- and six-month periods ended June 30, 2016 compared to the same periods in the prior year, primarily due to higher sales of immediate annuities in the Fixed Annuities product line.
Premiums and Deposits and Net Flows
The following table presents Retirement premiums and deposits and net flows by product line:
Three Months Ended Six Months Ended June 30, Percentage June 30, Percentage (in millions) 2016 2015 Change 2016 2015 ChangeFixed Annuities $ 1,208 $ 650 86 % $ 2,842 $ 1,334 113 %Retirement Income Solutions 1,976 2,936 (33) 4,014 5,393 (26)Retail Mutual Funds 1,410 922 53 2,735 1,779 54Group Retirement 1,837 1,562 18 3,693 3,073 20 Total Retirement premiums and deposits* $ 6,431 $ 6,070 6 % $ 13,284 $ 11,579 15 % Three Months Ended Six Months Ended June 30, June 30, (in millions) 2016 2015 2016 2015Net flows
Fixed Annuities $ (428) $ (940) $ (269) $ (1,686)Retirement Income Solutions 1,061 1,922 2,258 3,447Retail Mutual Funds 702 341 1,245 484Group Retirement 19 (391) 54 (1,031)
Total Retirement net flows* $ 1,354 $ 932 $ 3,288 $ 1,214
* Excludes activity related to closed blocks of fixed and variable annuities, which had reserves of approximately $4.3 billion and $5.2 billion at June 30, 2016 and 2015, respectively.

I TEM 2 / RESULTS OF OPERATIONS / CONSUMER INSURANCE
125
RETIREMENT PREMIUMS AND DEPOSITS BY PRODUCT LINE ( in mi l l ions)
Premiums and deposits for Retirement increased in the three- and six-month periods ended June 30, 2016, compared to the same periods in the prior year, primarily due to higher sales in Fixed Annuities, Retail Mutual Funds and Group Retirement, partially offset by lower sales in Retirement Income Solutions.
Net flows for annuity products included in Fixed Annuities, Retirement Income Solutions and Group Retirement represent premiums and deposits less death, surrender and other withdrawal benefits. Net flows from mutual funds, which are included in both Retail Mutual Funds and Group Retirement, represent deposits less withdrawals.
Total net flows for Retirement in the three- and six-month periods ended June 30, 2016 increased compared to the same periods in the prior year. Higher sales of Fixed Annuities, higher sales and lower surrenders in Group Retirement, and higher sales of Retail Mutual Funds were the primary drivers of the improvement in net flows compared to the same periods in the prior year.
Premiums and Deposits and Net Flows by Product Line
A discussion of the significant variances in premiums and deposits and net flows for each product line follows:
Fixed Annuities deposits increased significantly in the three- and six-month periods ended June 30, 2016 compared to the same periods in the prior year, partially offset by a slight increase in surrenders, resulting in net flows that were negative but improved compared to the same periods in the prior year.

I TEM 2 / RESULTS OF OPERATIONS / CONSUMER INSURANCE
126
Retirement Income Solutions premiums and deposits decreased in the three- and six-month periods ended June 30, 2016, compared to the same periods in the prior year, due to lower sales of variable annuities, which were partially offset by growth in index annuities. Positive net flows exceeded $1 billion per quarter in the six-month period ended June 30, 2016, but were significantly lower compared to the same periods in the prior year, due to the decrease in deposits. Surrenders were lower in the three- and six-month periods ended June 30, 2016, compared to the same periods in the prior year, and the improvement in surrender rates (see Surrender Rates below) also reflected the significant growth in account value driven by positive net flows over the past twelve months, which has increased the proportion of business that is within the surrender charge period.
Retail Mutual Fund net flows increased in the three- and six-month periods ended June 30, 2016 compared to the same periods in the prior year due to improvement in the level of deposits driven by activity within the Focused Dividend Strategy Fund.
Group Retirement net flows in the three- and six-month periods ended June 30, 2016 were positive and improved significantly compared to net outflows in the same periods in the prior year, due to higher premiums and deposits and lower surrender activity. The six-month period ended June 30, 2015 included large group surrenders of approximately $475 million. The large group market has been impacted by the consolidation of healthcare providers and other employers in our target markets.
Surrender Rates
The following table presents reserves for annuity product lines by surrender charge category:
June 30, 2016 December 31, 2015 Retirement Retirement Group Fixed Income Group Fixed Income (in millions) Retirement(a) Annuities Solutions Retirement(a) Annuities Solutions
No surrender charge(b) $ 61,993 $ 35,141 $ 14,883 $ 60,720 $ 34,331 $ 14,184 Greater than 0% - 2% 1,211 1,214 4,215 1,199 1,543 4,517 Greater than 2% - 4% 1,216 2,191 5,047 1,363 2,285 4,565 Greater than 4% 5,603 13,166 34,853 5,952 13,138 31,683 Non-surrenderable 773 3,801 371 676 3,723 358 Total reserves $ 70,796 $ 55,513 $ 59,369 $ 69,910 $ 55,020 $ 55,307
(a) Excludes mutual fund assets under management of $15.4 billion and $14.5 billion at June 30, 2016 and December 31, 2015, respectively.
(b) Group Retirement Products in this category include reserves of approximately $6.2 billion at both June 30, 2016 and December 31, 2015, that are subject to 20 percent annual withdrawal limitations.
The following table presents annualized surrender rates for deferred annuities by product line:
Three Months Ended Six Months Ended June 30, June 30,
2016 2015 2016 2015
Surrenders as a percentage of average account value Fixed Annuities 8.0 % 7.2 % 7.4 % 7.0 %Retirement Income Solutions 4.9 6.4 4.8 6.3 Group Retirement 7.8 8.4 7.8 8.9

I TEM 2 / RESULTS OF OPERATIONS / CONSUMER INSURANCE
127
Life Results
The following table presents Life results:
Three Months Ended Six Months Ended
June 30, Percentage June 30, Percentage
(in millions) 2016 2015 Change 2016 2015 Change
Revenues:
Premiums $ 762 $ 702 9 % $ 1,498 $ 1,410 6 %
Policy fees 371 362 2 749 725 3
Net investment income 542 551 (2) 1,010 1,093 (8)
Other income 15 17 (12) 30 17 76
Benefits and expenses:
Policyholder benefits and losses incurred 961 965 - 1,903 1,907 -
Interest credited to policyholder account balances 121 122 (1) 243 246 (1)
Amortization of deferred policy acquisition costs 120 89 35 240 175 37
Non deferrable insurance commissions 47 57 (18) 97 116 (16)
General operating expenses 257 250 3 515 481 7
Pre-tax operating income $ 184 $ 149 23 $ 289 $ 320 (10)
LIFE PRE-TAX OPERATING INCOME ( in mi l l ions)
Life Quarterly Results
Pre-tax operating income increased in the three-month period ended June 30, 2016 compared to the same period in the prior year, primarily due to more favorable mortality experience and lower domestic general operating expenses, partially offset by lower net investment income on alternative investments. The increase in DAC amortization was largely offset by higher amortization of unearned revenue reserves, reported in policy fees, and by reserve releases associated with increased lapses of term and traditional life products.
Net investment income decreased in the three-month period ended June 30, 2016 compared to the same period in the prior year, primarily due to lower income on alternative investments, partially offset by higher yield enhancement income, which included bond call and tender income. See Investments – Life Insurance Companies for additional discussion of the
I TEM 2 / RESULTS OF OPERATIONS / CONSUMER INSURANCE
128
investment strategy, asset-liability management process and invested assets of our Life Insurance Companies, which include the invested assets of the Life business.
General operating expenses increased in the three-month period ended June 30, 2016 compared to the same period in the prior year. A decrease in domestic employee-related expenses in the three-month period ended June 30, 2016 compared to the same period in the prior year was more than offset by higher expenses in Japan and interest expense related to real estate of consolidated partnerships; the latter was more than offset by related investment income.
Life Year-to-Date Results
Pre-tax operating income decreased in the six-month period ended June 30, 2016 compared to the same period in the prior year, due to lower net investment income on alternative investments and higher general operating expenses from international operations, partially offset by more favorable mortality experience, lower domestic employee-related expenses and an IBNR reserve release. Pre-tax operating income in the six-month period ended June 30, 2016 benefited from a $25 million reduction in the reserve for IBNR death claims related to enhanced claims practices, which was recorded in the three-month period ended March 31, 2016. The increase in DAC amortization was largely offset by higher amortization of unearned revenue reserves, reported in policy fees, and by reserve releases associated with increased lapses of term and traditional life products.
Net investment income decreased in the six-month period ended June 30, 2016 compared to the same period in the prior year, primarily due to lower income on alternative investments, partially offset by higher yield enhancement income, which included bond call and tender income. See Investments – Life Insurance Companies for additional discussion of the investment strategy, asset-liability management process and invested assets of our Life Insurance Companies, which include the invested assets of the Life business.
General operating expenses increased in the six-month period ended June 30, 2016 compared to the same period in the prior year, primarily due to an increase in international expenses from operations in Japan and Laya Healthcare, which was acquired on March 31, 2015, as well as interest expense related to real estate of consolidated partnerships; the latter was more than offset by related investment income. The increases were partially offset by a decrease in domestic operating expenses in the six-month period ended June 30, 2016 compared to the same period in the prior year, principally driven by lower employee-related expenses.
Spread Management
Disciplined pricing on new business is used to pursue new sales of life products at targeted net investment spreads in the current interest rate environment. Life has an active product management process to ensure that new business offerings appropriately reflect the current interest rate environment. To the extent that Life cannot achieve targeted net investment spreads on new business, products are re-priced or no longer sold. Additionally, where appropriate, existing products with higher minimum rate guarantees have been re-filed with lower crediting rates, as permitted under state insurance laws for new sales. Universal life insurance interest rate guarantees are generally two to three percent on new non-indexed products and zero to two percent on new indexed products, and are designed to meet targeted net investment spreads.
In-force Management. Crediting rates for in-force policies are adjusted in accordance with contractual provisions that were designed to allow crediting rates to be reset subject to minimum crediting rate guarantees.

I TEM 2 / RESULTS OF OPERATIONS / CONSUMER INSURANCE
129
The following table presents universal life account values by contractual minimum guaranteed interest rate and current crediting rates:
Current Crediting Rates June 30, 2016 1-50 Basis More than 50 Contractual Minimum Guaranteed At Contractual Points Above Basis PointsInterest Rate Minimum Minimum Above Minimum(in millions) Guarantee Guarantee Guarantee TotalUniversal life insurance
1% $ - $ - $ 7 $ 7 > 1% - 2% 31 168 237 436 > 2% - 3% 528 309 1,476 2,313 > 3% - 4% 1,996 492 1,063 3,551 > 4% - 5% 3,846 205 - 4,051 > 5% - 5.5% 322 - - 322
Total $ 6,723 $ 1,174 $ 2,783 $ 10,680 Percentage of total 63 % 11 % 26 % 100 %
Life Premiums and Deposits
Premiums for Life represent amounts received on traditional life insurance policies and group benefit policies. Premiums and deposits for Life is a non-GAAP financial measure that includes direct and assumed premiums as well as deposits received on universal life insurance.
The following table presents a reconciliation of Life premiums and deposits to GAAP premiums:
Three Months Ended Six Months Ended June 30, June 30, (in millions) 2016 2015 2016 2015Premiums and deposits $ 1,317 $ 1,249 $ 2,568 $ 2,472Deposits (372) (380) (736) (758)Other (183) (167) (334) (304)Premiums $ 762 $ 702 $ 1,498 $ 1,410
Life premiums grew 8 percent and 7 percent, excluding the effect of foreign exchange, in the three- and six-month periods ended June 30, 2016, respectively, compared to the same periods in the prior year, principally driven by growth in international life and health. The growth in premiums resulted in growth in premiums and deposits of 5 percent and 4 percent, excluding the effect of foreign exchange, in the three- and six-month periods ended June 30, 2016, respectively, compared to the same periods in the prior year.

I TEM 2 / RESULTS OF OPERATIONS / CONSUMER INSURANCE
130
Personal Insurance Results
The following table presents Personal Insurance results:
Three Months Ended Six Months Ended June 30, Percentage June 30, Percentage
(in millions) 2016 2015 Change 2016 2015 Change
Underwriting results:
Net premiums written $ 2,922 $ 2,930 - % $ 5,734 $ 5,845 (2)%
Increase in unearned premiums (60) (124) 52 (102) (240) 58
Net premiums earned 2,862 2,806 2 5,632 5,605 -
Losses and loss adjustment expenses incurred 1,593 1,480 8 3,047 3,125 (2)
Acquisition expenses:
Amortization of deferred policy acquisition costs 507 490 3 987 977 1
Other acquisition expenses 233 294 (21) 475 572 (17)
Total acquisition expenses 740 784 (6) 1,462 1,549 (6)
General operating expenses 403 535 (25) 826 1,013 (18)
Underwriting income (loss) 126 7 NM 297 (82) NM
Net investment income 53 63 (16) 104 126 (17)
Pre-tax operating income $ 179 $ 70 156 % $ 401 $ 44 NM%
NET PREMIUMS WRITTEN ( in mi l l ions )
PRE-TAX OPERATING INCOME ( in mi l l ions )
Personal Insurance Quarterly Results
Pre-tax operating income increased in the three-month period ended June 30, 2016 compared to the same period in the prior year due to improved underwriting results. The underwriting results reflected strategic actions to reduce expenses and refocus direct marketing activities, partially offset by higher catastrophe losses and a single large loss event, as discussed below, in the current quarter. Net favorable prior year loss reserve development was $39 million in the three-month period ended June 30, 2016, compared to $17 million in the same period in the prior year. Catastrophe losses were $59 million in the three-month period ended June 30, 2016, compared to $16 million in the same period in the prior year.
Acquisition expenses decreased in the three-month period ended June 30, 2016, compared to the same period in the prior year due to a decrease in non-deferred direct marketing expenses. The non-deferred direct marketing expenses, excluding

I TEM 2 / RESULTS OF OPERATIONS / CONSUMER INSURANCE
131
commissions, for the three-month period ended June 30, 2016, were approximately $32 million, and decreased by approximately $48 million from the same period in the prior year.
General operating expenses decreased in the three-month period ended June 30, 2016, compared to the same period in the prior year, primarily due to lower employee-related expenses arising from organization realignment activities together with lower strategic investment expenditures and the effect of foreign exchange.
Net investment income decreased in the three-month period ended June 30, 2016, compared to the same period in the prior year due to lower income on alternative investments, partially offset by higher interest income.
See MD&A — Investments for additional information on the Non-Life Insurance Companies invested assets, investment strategy, and asset-liability management process.
Personal Insurance Year-to-Date Results
Pre-tax operating income increased in the six-month period ended June 30, 2016 compared to the same period in the prior year due to improved underwriting results, partially offset by a decrease in net investment income. The underwriting results reflected strategic actions to reduce expenses and refocus direct marketing activities together with higher net favorable prior year loss reserve development. Net favorable prior year loss reserve development was $87 million in the six-month period ended June 30, 2016, compared to $13 million in the same period in the prior year. Catastrophe losses were $88 million in the six-month period ended June 30, 2016, compared to $77 million in the same period in the prior year.
Acquisition expenses decreased in the six-month period ended June 30, 2016, compared to the same period in the prior year due to a decrease in non-deferred direct marketing expenses and the effect of foreign exchange. The non-deferred direct marketing expenses, excluding commissions, for the six-month period ended June 30, 2016, were approximately $80 million, and decreased by approximately $69 million from the same period in the prior year.
General operating expenses decreased in the six-month period ended June 30, 2016, compared to the same period in the prior year, primarily due to lower employee-related expenses arising from organization realignment activities together with lower strategic investment expenditures and the effect of foreign exchange.
Net investment income decreased in the six-month period ended June 30, 2016, compared to the same period in the prior year due to lower income on alternative investments, partially offset by higher interest income.
See MD&A — Investments for additional information on the Non-Life Insurance Companies invested assets, investment strategy, and asset-liability management process.
Personal Insurance Net Premiums Written
The following table presents Personal Insurance net premiums written by major line of business:
Three Months Ended Percentage Change in Six Months Ended Percentage Change in
June 30, U.S. Original June 30, U.S. Original
(in millions) 2016 2015 dollars Currency 2016 2015 dollars Currency
Accident and Health $ 1,239 $ 1,238 - % (1)% $ 2,527 $ 2,586 (2)% (1)%
Personal Lines 1,683 1,692 (1) (1) 3,207 3,259 (2) 1
Total Personal Insurance
net premiums written $ 2,922 $ 2,930 - % (1)% $ 5,734 $ 5,845 (2)% - %
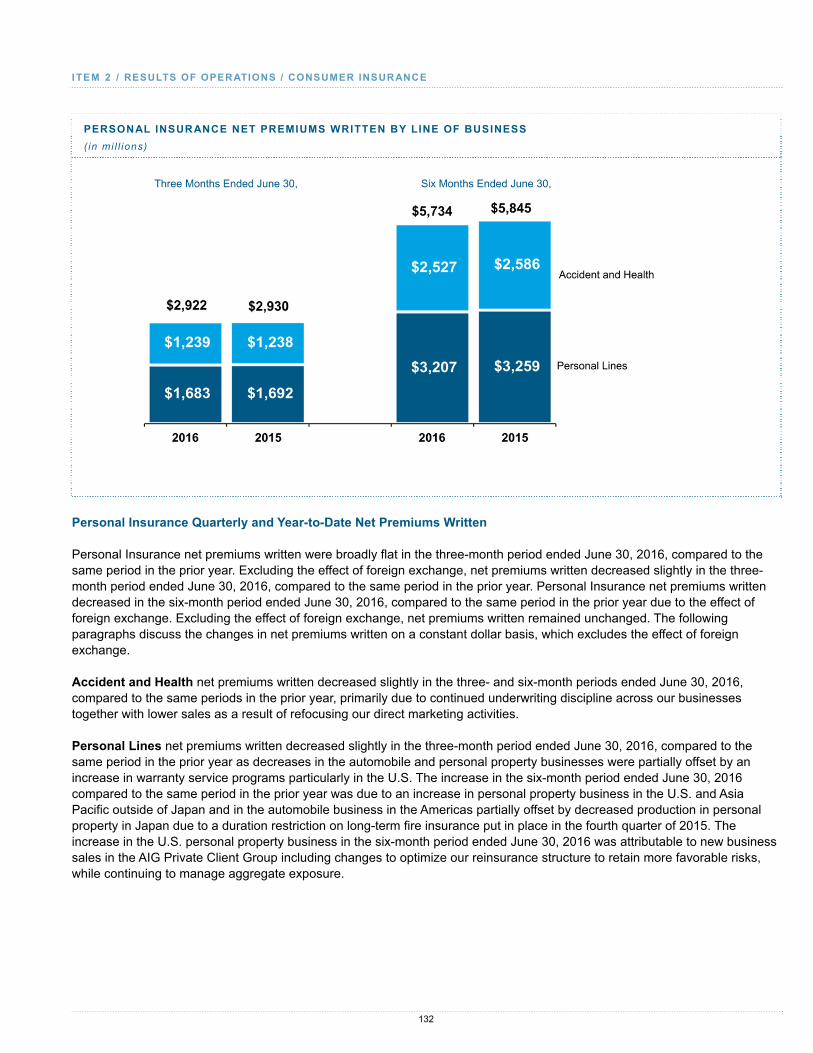
I TEM 2 / RESULTS OF OPERATIONS / CONSUMER INSURANCE
132
PERSONAL INSURANCE NET PREMIUMS WRITTEN BY LINE OF BUSINESS
( in mi l l ions)
Personal Insurance Quarterly and Year-to-Date Net Premiums Written
Personal Insurance net premiums written were broadly flat in the three-month period ended June 30, 2016, compared to the same period in the prior year. Excluding the effect of foreign exchange, net premiums written decreased slightly in the three-month period ended June 30, 2016, compared to the same period in the prior year. Personal Insurance net premiums written decreased in the six-month period ended June 30, 2016, compared to the same period in the prior year due to the effect of foreign exchange. Excluding the effect of foreign exchange, net premiums written remained unchanged. The following paragraphs discuss the changes in net premiums written on a constant dollar basis, which excludes the effect of foreign exchange.
Accident and Health net premiums written decreased slightly in the three- and six-month periods ended June 30, 2016, compared to the same periods in the prior year, primarily due to continued underwriting discipline across our businesses together with lower sales as a result of refocusing our direct marketing activities.
Personal Lines net premiums written decreased slightly in the three-month period ended June 30, 2016, compared to the same period in the prior year as decreases in the automobile and personal property businesses were partially offset by an increase in warranty service programs particularly in the U.S. The increase in the six-month period ended June 30, 2016 compared to the same period in the prior year was due to an increase in personal property business in the U.S. and Asia Pacific outside of Japan and in the automobile business in the Americas partially offset by decreased production in personal property in Japan due to a duration restriction on long-term fire insurance put in place in the fourth quarter of 2015. The increase in the U.S. personal property business in the six-month period ended June 30, 2016 was attributable to new business sales in the AIG Private Client Group including changes to optimize our reinsurance structure to retain more favorable risks, while continuing to manage aggregate exposure.

I TEM 2 / RESULTS OF OPERATIONS / CONSUMER INSURANCE
133
Personal Insurance Net Premiums Written by Region
The following table presents Personal Insurance net premiums written by region:
Three Months Ended Percentage Percentage Six Months Ended Percentage Percentage
June 30, Change in Change in June 30, Change in Change in
(in millions) 2016 2015 U.S. dollars Original Currency 2016 2015 U.S. dollars Original Currency
Americas $ 981 $ 947 4 % 8 % $ 1,933 $ 1,859 4 % 9 %
Asia Pacific 1,522 1,539 (1) (5) 2,850 2,969 (4) (4)
EMEA 419 444 (6) (5) 951 1,017 (6) (2)
Total net premiums written $ 2,922 $ 2,930 - % (1)% $ 5,734 $ 5,845 (2)% - %
PERSONAL INSURANCE NET PREMIUMS WRITTEN BY REGION
( in mi l l ions)
The following paragraphs discuss the changes in net premiums written on a constant dollar basis, which exclude the effect of foreign exchange.
Americas net premiums written increased across all lines in the three-month period ended June 30, 2016 compared to the same period in the prior year. The increase in the six-month period ended June 30, 2016 was primarily due to personal property and automobile businesses and the reinsurance optimization discussed above, partially offset by a small decrease in Accident and Health business.
Asia Pacific net premiums written decreased in three- and six-month periods ended June 30, 2016 compared to the same periods in the prior year, primarily due to decreased production in personal property reflecting the long-term fire insurance duration restriction in Japan discussed above.
EMEA net premiums written decreased in the three- and six-month periods ended June 30, 2016 compared to the same periods in the prior year, primarily due to decreases in both Accident and Health and Personal lines.

I TEM 2 / RESULTS OF OPERATIONS / CONSUMER INSURANCE
134
Personal Insurance Underwriting Ratios
The following tables present the Personal Insurance combined ratios based on GAAP data and reconciliation to the accident year combined ratio, as adjusted:
Three Months Ended Six Months Ended June 30, Increase June 30, Increase
2016 2015 (Decrease) 2016 2015 (Decrease)
Loss ratio 55.7 52.7 3.0 54.1 55.8 (1.7)
Catastrophe losses and reinstatement premiums (2.1) (0.5) (1.6) (1.6) (1.4) (0.2)
Prior year development net of premium adjustments 1.4 0.6 0.8 1.6 0.2 1.4
Accident year loss ratio, as adjusted 55.0 52.8 2.2 54.1 54.6 (0.5)
Acquisition ratio 25.9 27.9 (2.0) 26.0 27.6 (1.6)
General operating expense ratio 14.1 19.1 (5.0) 14.7 18.1 (3.4)
Expense ratio 40.0 47.0 (7.0) 40.7 45.7 (5.0)
Combined ratio 95.7 99.7 (4.0) 94.8 101.5 (6.7)
Catastrophe losses and reinstatement premiums (2.1) (0.5) (1.6) (1.6) (1.4) (0.2)
Prior year development net of premium adjustments 1.4 0.6 0.8 1.6 0.2 1.4
Accident year combined ratio, as adjusted 95.0 99.8 (4.8) 94.8 100.3 (5.5)
PERSONAL INSURANCE RATIOS
Three Months Ended June 30,
Six Months Ended June 30,

I TEM 2 / RESULTS OF OPERATIONS / CONSUMER INSURANCE
135
The following tables present Personal Insurance accident year catastrophe and severe losses by region and the number of events:
Catastrophes (a)
# of Asia (in millions) Events Americas Pacific EMEA TotalThree Months Ended June 30, 2016
Flooding 2 $ 3 $ - $ 2 $ 5Windstorms and hailstorms 3 10 (2) - 8Earthquakes 2 24 22 - 46
Total catastrophe-related charges 7 $ 37 $ 20 $ 2 $ 59Three Months Ended June 30, 2015
Flooding 2 $ 4 $ - $ - $ 4Windstorms and hailstorms 6 12 - - 12
Total catastrophe-related charges 8 $ 16 $ - $ - $ 16Six Months Ended June 30, 2016
Flooding 2 $ 3 $ - $ 2 $ 5Windstorms and hailstorms 10 32 5 - 37Earthquakes 2 24 22 - 46
Total catastrophe-related charges 14 $ 59 $ 27 $ 2 $ 88Six Months Ended June 30, 2015
Flooding 2 $ 4 $ - $ - $ 4Windstorms and hailstorms 7 73 - - 73
Total catastrophe-related charges 9 $ 77 $ - $ - $ 77
(a) Natural catastrophe losses are generally weather or seismic events having a net impact on AIG in excess of $10 million each. Catastrophes also include certain man-made events, such as terrorism and civil disorders that meet the $10 million threshold.

I TEM 2 / RESULTS OF OPERATIONS / CONSUMER INSURANCE
136
Severe Losses(b)
# of Asia (in millions) Events Americas Pacific EMEA TotalThree Months Ended June 30, 2016 1 $ 16 $ - $ - $ 162015 - $ - $ - $ - $ -Six Months Ended June 30, 2016 1 $ 16 $ - $ - $ 162015 1 $ 12 $ - $ - $ 12
(b) Severe losses are defined as non-catastrophe individual first party losses and surety losses greater than $10 million, net of related reinsurance and salvage and subrogation.
Personal Insurance Quarterly and Year-to-Date Insurance Ratios
The combined ratio decreased by 4.0 points and 6.7 points in the three- and six-month periods ended June 30, 2016, respectively, compared to the same periods in the prior year, reflecting an improvement in the expense ratio. The accident year combined ratio, as adjusted, decreased by 4.8 points and 5.5 points in the three- and six-month periods ended June 30, 2016, respectively, compared to the same periods in the prior year primarily due to improvement in the expense ratio.
The loss ratio increased by 3.0 points in the three-month period ended June 30, 2016 compared to the same period in the prior year. The increase reflected higher catastrophe losses and accident year losses, offset by net favorable prior year loss reserve development. The decrease in the loss ratio by 1.7 points in the six-month period ended June 30, 2016 compared to the same period in the prior year was primarily due to higher net favorable prior year loss reserve development.
The accident year loss ratio, as adjusted, increased by 2.2 points in the three-month period ended June 30, 2016, compared to the same period in the prior year primarily due to a single large loss event which totaled $33 million, of which $16 million was related to first party losses (meeting the definition of severe losses) and $17 million was related to third party losses, impacting the personal property business in the U.S. The accident year loss ratio, as adjusted, decreased by 0.5 points in the six-month period ended June 30, 2016, compared to the same period in the prior year primarily due to improved performance in warranty service programs and personal property.
The acquisition ratio decreased by 2.0 points and 1.6 points in the three- and six-month periods ended June 30, 2016, respectively, compared to the same periods in the prior year, which reflected lower Accident and Health direct marketing expenses as we refocused our activities.
The general operating expense ratio decreased by 5.0 points and 3.4 points in the three- and six-month periods ended June 30, 2016, respectively, compared to the same periods in the prior year, primarily due to lower employee-related expenses arising from organization realignment activities together with lower strategic investment expenditures.

I TEM 2 / RESULTS OF OPERATIONS / CORPORATE AND OTHER
137
CORPORATE AND OTHER
Corporate and Other Results
The following table presents AIG’s Corporate and Other results:
Three Months Ended Six Months Ended June 30, Percentage June 30, Percentage
(in millions) 2016 2015 Change 2016 2015 Change
Corporate and Other pre-tax operating income (loss):
Equity in pre-tax operating earnings of AerCap(a) $ - $ 127 NM% $ - $ 255 NM%
Fair value of PICC Investment(b) (44) 170 NM (119) 217 NM
Income from other assets, net(c) 215 509 (58) 77 1,073 (93)
Corporate general operating expenses (289) (268) (8) (583) (520) (12)
Interest expense (261) (278) 6 (518) (583) 11
Run-off insurance Lines (164) 110 NM (133) 91 NM
Consolidation and eliminations (1) 2 NM (1) 1 NM
Total Corporate and Other pre-tax operating income (loss) $ (544) $ 372 NM% $ (1,277) $ 534 NM%
(a) Represents our share of AerCap’s pre-tax operating income, which excludes certain post-acquisition transaction expenses incurred by AerCap in connection with its acquisition of ILFC and the difference between expensing AerCap’s maintenance rights assets over the remaining lease term as compared to the remaining economic life of the related aircraft.
(b) During the first quarter of 2015, Non-Life Insurance Companies sold a portion of their PICC Investment to AIG Parent.
(c) Consists of the results of investments held by AIG Parent to support various corporate needs as well as the remaining positions of AIGFP, life settlements, real estate, equipment leasing and lending and other secured lending investments held by AIG Parent and certain subsidiaries.
Corporate and Other Quarterly Results
Corporate and Other reported a pre-tax operating loss in the three-month period ended June 30, 2016, compared to pre-tax operating income in the same period in the prior year, primarily due to a decline in Income from other assets, net. Income from other assets, net, decreased primarily due to lower fair value gains on ABS CDOs and lower credit valuation adjustments on assets for which the fair value option was elected. The pre-tax operating results also reflected fair value losses on our PICC Investment compared to fair value gains in the same period in the prior year. In addition, the three-month period ended June 30, 2015 included our share of AerCap’s pre-tax income, which was accounted for under the equity method through the date of sale of most of our shares in the second quarter of 2015.
The underwriting loss in run-off insurance lines for the three months ended June 30, 2016 was driven by a charge for the discount on excess workers’ compensation reserves, compared to a benefit in the comparable prior year quarter, largely driven by interest rate movements. In addition, the underwriting loss for the three months ended June 30, 2016 included an $86 million out of period charge to reduce earned premium related to the substantiation of an opening balance brought forward from an earlier ledger conversion initiative prior to 2011. The inclusion of this adjustment in Corporate and Other is consistent with how our results of operations are reported to our chief operating decision makers.

I TEM 2 / RESULTS OF OPERATIONS / CORPORATE AND OTHER
138
Corporate and Other Year-to-Date Results
Corporate and Other reported a pre-tax operating loss in the six-month period ended June 30, 2016, compared to pre-tax operating income in the same period in the prior year, primarily due to a decline in Income from other assets, net. Income from other assets, net decreased primarily due to lower fair value gains on ABS CDOs and lower credit valuation adjustments on assets for which the fair value option was elected and gains recognized in the six-month period ended June 30, 2015 upon the unwinding of certain positions. The pre-tax operating results also reflected fair value losses on our PICC Investment compared to fair value gains in the same period in the prior year. In addition, the six-month period ended June 30, 2015 included our share of AerCap’s pre-tax income, which was accounted for under the equity method through the date of sale of most of our shares in the second quarter of 2015. These declines were partially offset by lower interest expense from ongoing liability management activities described in Liquidity and Capital Resources.
Run-off insurance lines reported a pre-tax operating loss of $131 million in the six-month period ended June 30, 2016 compared to pre-tax operating income of $91 million in the same period in the prior year primarily due to underwriting losses during the six-month period ended June 30, 2016 compared to underwriting income in the same period in the prior year, as well as an increase in the allocation of net investment income. The decrease in underwriting results primarily reflected:
excess workers’ compensation net loss reserve discount charges in the six-month period ended June 30, 2016 compared to a benefit in the same period in the prior year, reflecting a decrease in the reserve discount curve consisting of Treasury rates partially offset by an increase in credit spreads. See Insurance Reserves – Non-Life Insurance Companies – Discounting of Reserves for further discussion;
higher accident year losses, primarily reflecting the transfers of certain casualty lines, including environmental liability, excess casualty and healthcare coverage that ceased to be offered by Commercial Insurance; and
lower net adverse prior year loss reserve development.
In addition, in the six-month period ended June 30, 2016, the underwriting loss included an $86 million out of period charge that reduced earned premium discussed above.

I TEM 2 / INVESTMENTS
139
INVESTMENTS
OVERVIEW
Our investment strategies are tailored to the specific business needs of each operating unit. The investment objectives are driven by the respective business models for Non-Life Insurance Companies, Life Insurance Companies and AIG Parent. The primary objectives are generation of investment income, preservation of capital, liquidity management and growth of surplus to support the insurance products. The majority of assets backing our insurance liabilities consist of fixed maturity securities.
Investments Highlights during the Six Months Ended June 30, 2016
• A decline in interest rates resulted in an increase in our net unrealized gain position in our investment portfolio. Net unrealized gains in our available for sale portfolio increased to approximately $18.0 billion as of June 30, 2016 from approximately $8.8 billion as of December 31, 2015.
• We continued to make investments in structured securities and other fixed maturity securities and increased lending activities in mortgage loans with favorable risk versus return characteristics to improve yields and increase net investment income.
• Our alternative investments portfolio performance experienced a significant decline in the six-month period ended June 30, 2016 compared to the same period in the prior year due to increased volatility in equity markets, which affected the performance of our hedge fund portfolio primarily in the first quarter of 2016. During the six-months ended June 30, 2016, we reduced our hedge fund portfolio by $1.4 billion as a result of redemptions consistent with our planned reduction of exposure.
• Blended investment yields on new investments were lower than blended rates on investments that were sold, matured or called.
• Other-than-temporary impairments increased slightly due to higher impairments within the energy sector and in our structured securities portfolio.
• We recognized gains on sales of securities in the six-month period ended June 30, 2016, primarily due to the sale of a portion of our PICC Investment.
• The recent Brexit vote has created increased volatility in exchange rates as well as within the equity markets, which may continue for some time.
Investment Strategies
Investment strategies are based on considerations that include the local and general market conditions, liability duration and cash flow characteristics, rating agency and regulatory capital considerations, legal investment limitations, tax optimization and diversification.
Some of our key investment strategies are as follows:
• Fixed maturity securities held by the U.S. insurance companies included in Non-Life Insurance Companies consist of a mix of instruments that meet our current risk-return, tax, liquidity, credit quality and diversification objectives.

I TEM 2 / INVESTMENTS
140
• Outside of the U.S., fixed maturity securities held by Non-Life Insurance Companies consist primarily of high-grade securities generally denominated in the currencies of the countries in which we operate.
• While more of a focus is placed on asset-liability management in Life Insurance Companies, our fundamental strategy across all of our investment portfolios is to optimize the duration characteristics of the assets within a target range based on comparable liability characteristics, to the extent practicable.
• AIG Parent, included in Corporate and Other, actively manages its assets and liabilities in terms of products, counterparties and duration. AIG Parent’s liquidity sources are held primarily in the form of cash, short-term investments and publicly traded, investment-grade rated fixed maturity securities. Based upon an assessment of its immediate and longer-term funding needs, AIG Parent purchases publicly traded, investment-grade rated fixed maturity securities that can be readily monetized through sales or repurchase agreements. These securities allow us to diversify sources of liquidity while reducing the cost of maintaining sufficient liquidity.
Investments by Legal Entity Category
The following tables summarize the composition of AIG's investments:
Non-Life Life
Insurance Insurance Corporate
(in millions) Companies Companies and Other(b) Total
June 30, 2016
Fixed maturity securities(a):
Bonds available for sale, at fair value $ 87,657 $ 169,237 $ 5,195 $ 262,089
Other bond securities, at fair value 1,301 3,834 10,200 15,335
Equity securities:
Common and preferred stock available for sale, at fair value 1,954 156 (468) 1,642
Other Common and preferred stock, at fair value 189 2 470 661
Mortgage and other loans receivable, net of allowance 8,834 24,768 (2,341) 31,261
Other invested assets 10,314 10,535 6,496 27,345
Short-term investments 4,240 4,680 3,414 12,334
Total investments 114,489 213,212 22,966 350,667
Cash 1,211 482 91 1,784
Total invested assets $ 115,700 $ 213,694 $ 23,057 $ 352,451
December 31, 2015
Fixed maturity securities(a):
Bonds available for sale, at fair value $ 84,849 $ 157,150 $ 6,246 $ 248,245
Other bond securities, at fair value 1,463 3,589 11,730 16,782
Equity securities:
Common and preferred stock available for sale, at fair value 2,821 144 (50) 2,915
Other Common and preferred stock, at fair value 355 - 566 921
Mortgage and other loans receivable, net of allowance 8,278 23,979 (2,692) 29,565
Other invested assets 10,571 12,398 6,825 29,794
Short-term investments 3,189 2,877 4,066 10,132
Total investments 111,526 200,137 26,691 338,354
Cash 1,011 557 61 1,629
Total invested assets $ 112,537 $ 200,694 $ 26,752 $ 339,983
(a) At both June 30, 2016 and December 31, 2015, approximately 90 percent and 10 percent of investments were held by domestic and foreign entities, respectively.
(b) Includes the effect of eliminations and consolidations.

I TEM 2 / INVESTMENTS
141
The following table presents the components of Net Investment Income:
Three Months Ended Six Months Ended June 30, June 30, (in millions) 2016 2015 2016 2015Interest and dividends $ 3,242 $ 3,208 $ 6,485 $ 6,395Alternative investments(a) 310 658 (56) 1,244Other investment income(b) 240 77 490 294Total investment income 3,792 3,943 6,919 7,933Investment expenses 109 117 223 269Total net investment income $ 3,683 $ 3,826 $ 6,696 $ 7,664
(a) Beginning in the first quarter of 2016, the presentation of income on alternative investments has been refined to include only income from hedge funds, private equity funds and affordable housing partnerships. Prior period disclosures have been reclassified to conform to this presentation. Hedge funds for which we elected the fair value option are recorded as of the balance sheet date. Other hedge funds are generally reported on a one-month lag, while private equity funds are generally reported on a one-quarter lag.
(b) Includes changes in fair value of certain fixed maturity securities where the fair value option has been elected and which are used to economically hedge interest rate and other risks related to our variable annuity guaranteed living benefits. For the three-month periods ended June 30, 2016 and 2015, the net investment income (loss) recorded on these securities was $120 million and $(87) million, respectively. For the six-month periods ended June 30, 2016 and 2015, the net investment income (loss) recorded on these securities was $253 million and $(43) million, respectively.
Net investment income decreased for the three-month period ended June 30, 2016 compared to the same period in the prior year due to lower income on alternative investments and lower reinvestment yields, partially offset by higher gains on securities for which the fair value option was elected. Net investment income decreased for the six-month period ended June 30, 2016 compared to the same period in the prior year due to lower income on alternative investments, primarily related to negative performance in hedge funds, and lower reinvestment yields, partially offset by higher gains on securities for which the fair value option was elected.
Non-Life Insurance Companies
For the Non-Life Insurance Companies, the duration of liabilities for long-tail casualty lines is greater than that of other lines. As a result, the investment strategy within the Non-Life Insurance Companies focuses on growth of surplus and preservation of capital, subject to liability and other business considerations.
The Non-Life Insurance Companies invest primarily in fixed maturity securities issued by corporations, municipalities and other governmental agencies and also invest in structured securities collateralized by, among other assets, residential and commercial real estate and commercial mortgage loans. While invested assets backing reserves of the Non-Life Insurance Companies are primarily invested in conventional fixed maturity securities, we have continued to allocate a portion of our investment activity into asset classes that offer higher yields, particularly in the domestic operations. In addition, we continue to invest in both fixed rate and floating rate asset-backed investments for their risk-return attributes, as well as to manage our exposure to potential changes in interest rates. This asset diversification has maintained stable average yields while the overall credit ratings of our fixed maturity securities were largely unchanged. We expect to continue to pursue this investment strategy to meet the Non-Life Insurance Companies’ liquidity, duration and credit quality objectives as well as current risk-return and tax objectives.
In addition, the Non-Life Insurance Companies seek to enhance returns through selective investments in a diversified portfolio of alternative investments. Although these alternative investments are subject to periodic earnings fluctuations, they have historically achieved yields in excess of the fixed maturity portfolio yields and have provided added diversification to the broader portfolio.
Fixed maturity investments of the Non-Life Insurance Companies domestic operations, with a duration of 4.7 years, are currently comprised primarily of tax-exempt securities, which provide attractive risk-adjusted after-tax returns, as well as taxable municipal bonds, government and agency bonds, and corporate bonds. The majority of these high quality investments are rated A or higher based on composite ratings.

I TEM 2 / INVESTMENTS
142
Fixed maturity investments held in the Non-Life Insurance Companies foreign operations are of high quality, primarily rated A or higher based on composite ratings with a duration averaging 3.4 years.
Life Insurance Companies
The investment strategy of the Life Insurance Companies is to maximize net investment income and portfolio value, subject to liquidity requirements, capital constraints, diversification requirements, asset-liability management and available investment opportunities.
The Life Insurance Companies use asset-liability management as a primary tool to monitor and manage risk in their businesses. The Life Insurance Companies' fundamental investment strategy is to maintain a diversified, high quality portfolio of fixed maturity securities that, to the extent practicable, complements the characteristics of liabilities, including duration, which is a measure of sensitivity to changes in interest rates. The investment portfolio of each product line is tailored to the specific characteristics of its insurance liabilities, and as a result, certain portfolios are shorter in duration and others are longer in duration. An extended low interest rate environment may result in a lengthening of liability durations from initial estimates, primarily due to lower lapses, which may require us to further extend the duration of the investment portfolio.
The Life Insurance Companies invest primarily in fixed maturity securities issued by corporations, municipalities and other governmental agencies; structured securities collateralized by, among other assets, residential and commercial real estate; and commercial mortgage loans.
In addition, the Life Insurance Companies seek to enhance returns through investments in a diversified portfolio of alternative investments. Although these alternative investments are subject to periodic earnings fluctuations, they have historically achieved yields in excess of the fixed maturity portfolio yields. While a diversified portfolio of alternative investments remains a fundamental component of the investment strategy of the Life Insurance Companies, we intend to reduce the overall size of the hedge fund portfolio, in light of changing market conditions and perceived market opportunities, and to continue reducing the size of the private equity portfolio.
The Life Insurance Companies monitor fixed income markets, including the level of interest rates, credit spreads and the shape of the yield curve. The Life Insurance Companies frequently review their interest rate assumptions and actively manage the crediting rates used for their new and in-force business. Business strategies continue to evolve to maintain profitability of the overall business in a historically low interest rate environment. The low interest rate environment makes it more difficult to profitably price many of our products and puts margin pressure on existing products, due to the challenge of investing recurring premiums and deposits and reinvesting investment portfolio cash flows in the low rate environment while maintaining satisfactory investment quality and liquidity. In addition, there is investment risk associated with future premium receipts from certain in-force business. Specifically, the investment of these future premium receipts may be at a yield below that required to meet future policy liabilities.
Fixed maturity investments of the Life Insurance Companies domestic operations, with a duration of 6.8 years, are comprised of taxable corporate bonds, as well as taxable municipal and government bonds, and agency and non-agency structured securities. The majority of these investments are held in the available for sale portfolio and are rated investment grade based on its composite ratings.
Fixed maturity investments held in the Life Insurance Companies foreign operations are of high quality, primarily rated A or higher based on composite ratings with a duration averaging 15.3 years.
NAIC Designations of Fixed Maturity Securities
The Securities Valuation Office (SVO) of the National Association of Insurance Companies (NAIC) evaluates the investments of U.S. insurers for statutory reporting purposes and assigns fixed maturity securities to one of six categories called ‘NAIC Designations.’ In general, NAIC Designations of ‘1’ highest quality, or ‘2’ high quality, include fixed maturity securities considered investment grade, while NAIC Designations of ‘3’ through ‘6’ generally include fixed maturity securities referred to
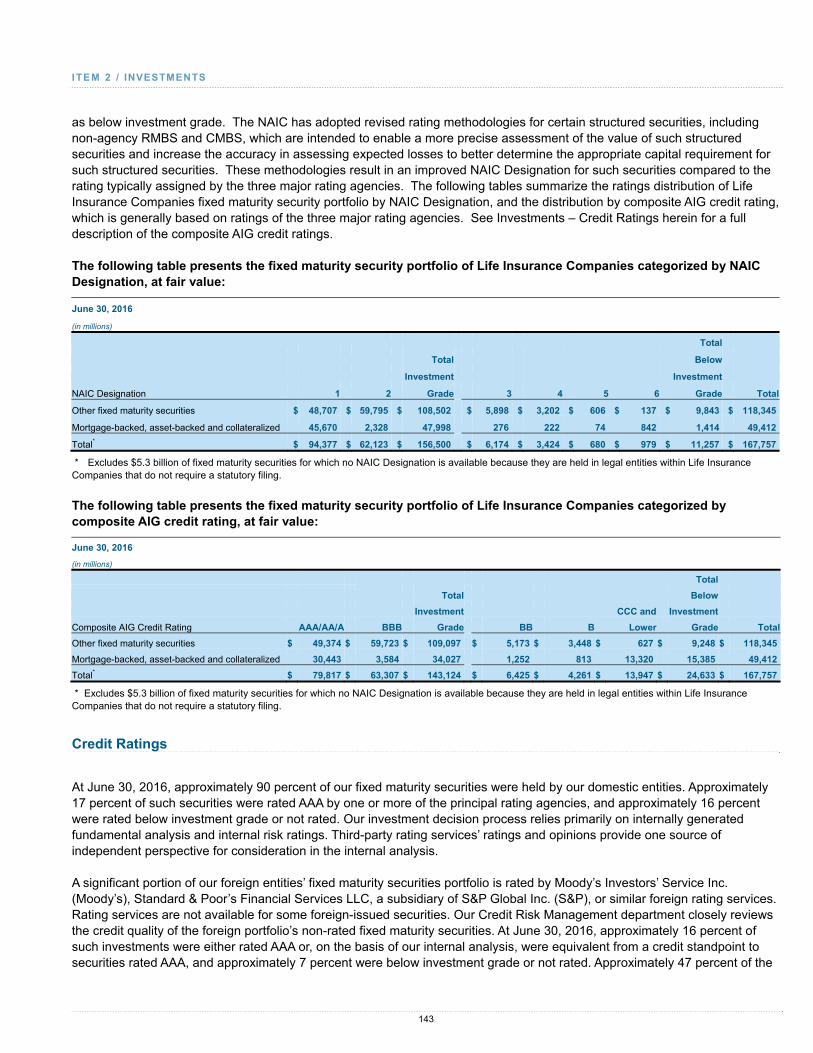
I TEM 2 / INVESTMENTS
143
as below investment grade. The NAIC has adopted revised rating methodologies for certain structured securities, including non-agency RMBS and CMBS, which are intended to enable a more precise assessment of the value of such structured securities and increase the accuracy in assessing expected losses to better determine the appropriate capital requirement for such structured securities. These methodologies result in an improved NAIC Designation for such securities compared to the rating typically assigned by the three major rating agencies. The following tables summarize the ratings distribution of Life Insurance Companies fixed maturity security portfolio by NAIC Designation, and the distribution by composite AIG credit rating, which is generally based on ratings of the three major rating agencies. See Investments – Credit Ratings herein for a full description of the composite AIG credit ratings.
The following table presents the fixed maturity security portfolio of Life Insurance Companies categorized by NAIC Designation, at fair value:
June 30, 2016
(in millions) Total
Total Below
Investment Investment
NAIC Designation 1 2 Grade 3 4 5 6 Grade Total
Other fixed maturity securities $ 48,707 $ 59,795 $ 108,502 $ 5,898 $ 3,202 $ 606 $ 137 $ 9,843 $ 118,345
Mortgage-backed, asset-backed and collateralized 45,670 2,328 47,998 276 222 74 842 1,414 49,412
Total* $ 94,377 $ 62,123 $ 156,500 $ 6,174 $ 3,424 $ 680 $ 979 $ 11,257 $ 167,757
* Excludes $5.3 billion of fixed maturity securities for which no NAIC Designation is available because they are held in legal entities within Life Insurance Companies that do not require a statutory filing.
The following table presents the fixed maturity security portfolio of Life Insurance Companies categorized by composite AIG credit rating, at fair value:
June 30, 2016
(in millions) Total
Total Below
Investment CCC and Investment
Composite AIG Credit Rating AAA/AA/A BBB Grade BB B Lower Grade Total
Other fixed maturity securities $ 49,374 $ 59,723 $ 109,097 $ 5,173 $ 3,448 $ 627 $ 9,248 $ 118,345
Mortgage-backed, asset-backed and collateralized 30,443 3,584 34,027 1,252 813 13,320 15,385 49,412
Total* $ 79,817 $ 63,307 $ 143,124 $ 6,425 $ 4,261 $ 13,947 $ 24,633 $ 167,757
* Excludes $5.3 billion of fixed maturity securities for which no NAIC Designation is available because they are held in legal entities within Life Insurance Companies that do not require a statutory filing.
Credit Ratings
At June 30, 2016, approximately 90 percent of our fixed maturity securities were held by our domestic entities. Approximately 17 percent of such securities were rated AAA by one or more of the principal rating agencies, and approximately 16 percent were rated below investment grade or not rated. Our investment decision process relies primarily on internally generated fundamental analysis and internal risk ratings. Third-party rating services’ ratings and opinions provide one source of independent perspective for consideration in the internal analysis.
A significant portion of our foreign entities’ fixed maturity securities portfolio is rated by Moody’s Investors’ Service Inc. (Moody’s), Standard & Poor’s Financial Services LLC, a subsidiary of S&P Global Inc. (S&P), or similar foreign rating services. Rating services are not available for some foreign-issued securities. Our Credit Risk Management department closely reviews the credit quality of the foreign portfolio’s non-rated fixed maturity securities. At June 30, 2016, approximately 16 percent of such investments were either rated AAA or, on the basis of our internal analysis, were equivalent from a credit standpoint to securities rated AAA, and approximately 7 percent were below investment grade or not rated. Approximately 47 percent of the

I TEM 2 / INVESTMENTS
144
foreign entities’ fixed maturity securities portfolio is comprised of sovereign fixed maturity securities supporting policy liabilities in the country of issuance.
Composite AIG Credit Ratings
With respect to our fixed maturity investments, the credit ratings in the table below and in subsequent tables reflect: (a) a composite of the ratings of the three major rating agencies, or when agency ratings are not available, the rating assigned by the NAIC SVO (over 99 percent of total fixed maturity investments), or (b) our equivalent internal ratings when these investments have not been rated by any of the major rating agencies or the NAIC. The “Non-rated” category in those tables consists of fixed maturity securities that have not been rated by any of the major rating agencies, the NAIC or us.
See Enterprise Risk Management herein for a discussion of credit risks associated with Investments.
The following table presents the composite AIG credit ratings of our fixed maturity securities calculated on the basis of their fair value:
Available for Sale Other Total
June 30, December 31, June 30, December 31, June 30, December 31,
(in millions) 2016 2015 2016 2015 2016 2015
Rating:
Other fixed maturity
securities
AAA $ 13,175 $ 12,274 $ 3,440 $ 3,222 $ 16,615 $ 15,496
AA 37,107 35,344 223 207 37,330 35,551
A 54,321 50,741 1,877 1,781 56,198 52,522
BBB 73,636 71,766 77 186 73,713 71,952
Below investment grade 14,142 12,305 - 133 14,142 12,438
Non-rated 916 920 - - 916 920
Total $ 193,297 $ 183,350 $ 5,617 $ 5,529 $ 198,914 $ 188,879
Mortgage-backed, asset-
backed and collateralized
AAA $ 28,781 $ 26,382 $ 1,296 $ 1,756 $ 30,077 $ 28,138
AA 5,544 5,003 507 708 6,051 5,711
A 8,935 7,462 314 416 9,249 7,878
BBB 4,776 4,394 395 497 5,171 4,891
Below investment grade 20,741 21,638 7,159 7,771 27,900 29,409
Non-rated 15 16 47 105 62 121
Total $ 68,792 $ 64,895 $ 9,718 $ 11,253 $ 78,510 $ 76,148
Total
AAA $ 41,956 $ 38,656 $ 4,736 $ 4,978 $ 46,692 $ 43,634
AA 42,651 40,347 730 915 43,381 41,262
A 63,256 58,203 2,191 2,197 65,447 60,400
BBB 78,412 76,160 472 683 78,884 76,843
Below investment grade 34,883 33,943 7,159 7,904 42,042 41,847
Non-rated 931 936 47 105 978 1,041
Total $ 262,089 $ 248,245 $ 15,335 $ 16,782 $ 277,424 $ 265,027

I TEM 2 / INVESTMENTS
145
Available for Sale Investments
The following table presents the fair value of our available for sale securities:
Fair Value at Fair Value at June 30, December 31,(in millions) 2016 2015Bonds available for sale:
U.S. government and government sponsored entities $ 2,267 $ 1,844Obligations of states, municipalities and political subdivisions 28,777 27,323Non-U.S. governments 20,092 18,195Corporate debt 142,161 135,988Mortgage-backed, asset-backed and collateralized:
RMBS 37,444 36,227CMBS 14,974 13,571CDO/ABS 16,374 15,097
Total mortgage-backed, asset-backed and collateralized 68,792 64,895Total bonds available for sale* 262,089 248,245Equity securities available for sale:
Common stock 1,117 2,401Preferred stock 23 22Mutual funds 502 492
Total equity securities available for sale 1,642 2,915Total $ 263,731 $ 251,160
* At June 30, 2016 and December 31, 2015, the fair value of bonds available for sale held by us that were below investment grade or not rated totaled $35.8 billion and $34.9 billion, respectively.
The following table presents the fair value of our aggregate credit exposures to non-U.S. governments for our fixed maturity securities:
June 30, December 31,(in millions) 2016 2015
Japan $ 6,058 $ 5,416Canada 1,341 1,453France 916 784Germany 886 832United Kingdom 764 661Mexico 725 563Netherlands 613 511Norway 490 503Chile 436 386Singapore 427 426Other 7,491 6,710
Total $ 20,147 $ 18,245

I TEM 2 / INVESTMENTS
146
The following table presents the fair value of our aggregate European credit exposures by major sector for our fixed maturity securities:
June 30, 2016 Non- December 31, Financial Financial Structured 2015(in millions) Sovereign Institution Corporates Products Total TotalEuro-Zone countries:
France $ 916 $ 1,091 $ 2,186 $ - $ 4,193 $ 4,018Germany 886 157 2,229 3 3,275 3,365Netherlands 613 891 1,488 161 3,153 3,404Ireland - 17 577 782 1,376 1,274Belgium 237 138 878 - 1,253 855Italy 2 124 873 12 1,011 1,009Spain 28 52 903 15 998 1,102Luxembourg - 11 445 18 474 496Finland 91 51 120 - 262 229Austria 97 3 13 - 113 124Other - EuroZone 856 36 167 3 1,062 929
Total Euro-Zone $ 3,726 $ 2,571 $ 9,879 $ 994 $ 17,170 $ 16,805Remainder of Europe
United Kingdom $ 764 $ 3,014 $ 8,362 $ 3,987 $ 16,127 $ 15,286Switzerland 47 1,251 1,299 - 2,597 2,519Sweden 137 430 186 - 753 827Norway 490 43 108 - 641 688Russian Federation 50 6 76 - 132 122Other - Remainder of Europe 320 138 115 - 573 443
Total - Remainder of Europe $ 1,808 $ 4,882 $ 10,146 $ 3,987 $ 20,823 $ 19,885Total $ 5,534 $ 7,453 $ 20,025 $ 4,981 $ 37,993 $ 36,690
Investments in Municipal Bonds
At June 30, 2016, the U.S. municipal bond portfolio was composed primarily of essential service revenue bonds and high-quality tax-backed bonds with over 95 percent of the portfolio rated A or higher.
The following table presents the fair values of our available for sale U.S. municipal bond portfolio by state and municipal bond type:
June 30, 2016 State Local Total December 31, General General Fair 2015(in millions) Obligation Obligation Revenue Value Total Fair ValueState:
New York $ 32 $ 638 $ 4,154 $ 4,824 $ 4,613California 752 628 2,688 4,068 3,841Texas 342 1,698 1,769 3,809 3,415Massachusetts 775 2 734 1,511 1,387Illinois 127 406 922 1,455 1,486

I TEM 2 / INVESTMENTS
147
Washington 523 119 706 1,348 1,359Florida 150 - 1,054 1,204 1,135Georgia 290 216 396 902 870Virginia 48 5 848 901 878Washington DC 193 - 576 769 705Pennsylvania 277 24 455 756 676Arizona - 96 504 600 576Ohio 98 - 461 559 531All other states(a) 1,070 585 4,416 6,071 5,851
Total(b)(c) $ 4,677 $ 4,417 $ 19,683 $ 28,777 $ 27,323
(a) We did not have material credit exposure to the government of Puerto Rico.
(b) Excludes certain university and not-for-profit entities that issue their bonds in the corporate debt market. Includes industrial revenue bonds.
(c) Includes $2.5 billion of pre-refunded municipal bonds.
Investments in Corporate Debt Securities
The following table presents the industry categories of our available for sale corporate debt securities:
Fair Value at Fair Value at Industry Category June 30, December 31, (in millions) 2016 2015 Financial institutions:
Money Center /Global Bank Groups $ 9,501 $ 9,104 Regional banks — other 665 568 Life insurance 3,312 3,295 Securities firms and other finance companies 367 380 Insurance non-life 5,726 5,421 Regional banks — North America 7,530 6,823 Other financial institutions 8,189 7,808
Utilities 18,557 18,497 Communications 10,900 10,251 Consumer noncyclical 16,547 15,391 Capital goods 9,085 8,973 Energy 14,560 13,861 Consumer cyclical 9,935 9,767 Basic 7,291 7,512 Other 19,996 18,337
Total * $ 142,161 $ 135,988
* At June 30, 2016 and December 31, 2015, approximately 90 percent and 91 percent, respectively, of these investments were rated investment grade.
Our investments in the energy category, as a percentage of total investments in available for sale fixed maturities, were 5.6 percent at both June 30, 2016 and December 31, 2015. While the energy investments are primarily investment grade and are actively managed, the category continues to experience volatility that could adversely affect credit quality and fair value.

I TEM 2 / INVESTMENTS
148
Investments in RMBS
The following table presents AIG’s RMBS available for sale investments by year of vintage:
Fair Value at Fair Value at June 30, December 31,(in millions) 2016 2015Total RMBS
2016 $ 1,962 $ -2015 2,671 2,2732014 1,205 1,0962013 2,259 2,1782012 1,699 1,9442011 and prior* 27,648 28,736
Total RMBS $ 37,444 $ 36,227Agency
2016 $ 1,223 $ -2015 2,400 2,0252014 1,102 1,0002013 2,173 2,0942012 1,687 1,8772011 and prior 4,977 5,555
Total Agency $ 13,562 $ 12,551Alt-A
2016 - -2015 - -2014 - -2013 - -2012 $ - $ -2011 and prior 12,582 12,831
Total Alt-A $ 12,582 $ 12,831Subprime
2016 - -2015 - -2014 - -2013 - -2012 - -2011 and prior $ 2,523 $ 2,376
Total Subprime $ 2,523 $ 2,376Prime non-agency
2016 $ 671 $ -2015 13 -2014 3 -2013 9 82012 - 532011 and prior 7,228 7,589
Total Prime non-agency $ 7,924 $ 7,650Total Other housing related $ 853 $ 819
* Includes approximately $13.0 billion and $13.2 billion at June 30, 2016, and December 31, 2015, respectively, of certain RMBS that had experienced deterioration in credit quality since their origination. See Note 5 to the Condensed Consolidated Financial Statements for additional discussion on Purchased Credit Impaired (PCI) Securities.

I TEM 2 / INVESTMENTS
149
The following table presents our RMBS available for sale investments by credit rating:
Fair Value at Fair Value at June 30, December 31,(in millions) 2016 2015Rating: Total RMBS
AAA $ 15,977 $ 14,884AA 449 389A 1,165 509BBB 607 661Below investment grade(a) 19,241 19,779Non-rated 5 5
Total RMBS(b) $ 37,444 $ 36,227Agency RMBS
AAA $ 13,558 $ 12,547AA 4 4
Total Agency $ 13,562 $ 12,551Alt-A RMBS
AAA $ 2 $ 5AA 67 17A 99 121BBB 251 216Below investment grade(a) 12,163 12,472
Total Alt-A $ 12,582 $ 12,831Subprime RMBS
AAA $ 14 $ 15AA 79 68A 223 247BBB 121 200Below investment grade(a) 2,086 1,846
Total Subprime $ 2,523 $ 2,376Prime non-agency
AAA $ 1,999 $ 1,986AA 181 188A 840 138BBB 200 209Below investment grade(a) 4,699 5,124Non-rated 5 5
Total prime non-agency $ 7,924 $ 7,650Total Other housing related $ 853 $ 819
(a) Includes certain RMBS that had experienced deterioration in credit quality since their origination. See Note 5 to the Condensed Consolidated Financial Statements for additional discussion on PCI Securities.
(b) The weighted average expected life was six years at both June 30, 2016 and December 31, 2015.
Our underwriting practices for investing in RMBS, other asset-backed securities and CDOs take into consideration the quality of the originator, the manager, the servicer, security credit ratings, underlying characteristics of the mortgages, borrower characteristics, and the level of credit enhancement in the transaction.

I TEM 2 / INVESTMENTS
150
Investments in CMBS
The following table presents our CMBS available for sale investments:
Fair Value at Fair Value at June 30, December 31,(in millions) 2016 2015CMBS (traditional) $ 12,459 $ 11,132Agency 1,674 1,622Other 841 817Total $ 14,974 $ 13,571
The following table presents the fair value of our CMBS available for sale investments by rating agency designation and by vintage year:
Below Investment (in millions) AAA AA A BBB Grade Non-Rated Total June 30, 2016 Year: 2016 $ 779 $ 158 $ 62 $ 131 $ - $ - $ 1,1302015 1,225 465 517 246 - - 2,4532014 1,749 247 11 - - - 2,0072013 2,711 433 98 25 - - 3,2672012 764 63 45 81 - 11 9642011 and prior 1,902 616 702 611 1,322 - 5,153Total $ 9,130 $ 1,982 $ 1,435 $ 1,094 $ 1,322 $ 11 $ 14,974December 31, 2015 Year: 2015 $ 824 $ 404 $ 465 $ 240 $ - $ - $ 1,9332014 1,604 183 11 - - - 1,7982013 2,611 433 89 54 - - 3,1872012 737 60 31 83 - 10 9212011 and prior 1,936 725 666 759 1,646 - 5,732Total $ 7,712 $ 1,805 $ 1,262 $ 1,136 $ 1,646 $ 10 $ 13,571

I TEM 2 / INVESTMENTS
151
The following table presents our CMBS available for sale investments by geographic region:
Fair Value at Fair Value at June 30, December 31, (in millions) 2016 2015 Geographic region:
New York $ 3,618 $ 3,149 California 1,391 1,244 Texas 899 791 Florida 572 520 New Jersey 479 433 Virginia 392 362 Illinois 366 323 Pennsylvania 336 295 Massachusetts 279 231 Georgia 271 253 Maryland 242 229 North Carolina 241 218 All Other* 5,888 5,523
Total $ 14,974 $ 13,571
* Includes Non-U.S. locations.
The following table presents our CMBS available for sale investments by industry:
Fair Value at Fair Value at June 30, December 31, (in millions) 2016 2015Industry:
Office $ 4,464 $ 3,896 Retail 4,265 3,978 Multi-family* 3,212 3,036 Lodging 1,133 1,005 Industrial 1,038 868 Other 862 788
Total $ 14,974 $ 13,571
* Includes Agency-backed CMBS.
The fair value of CMBS holdings remained stable during the second quarter of 2016. The majority of our investments in CMBS are in tranches that contain substantial protection features through collateral subordination. The majority of CMBS holdings are traditional conduit transactions, broadly diversified across property types and geographical areas.
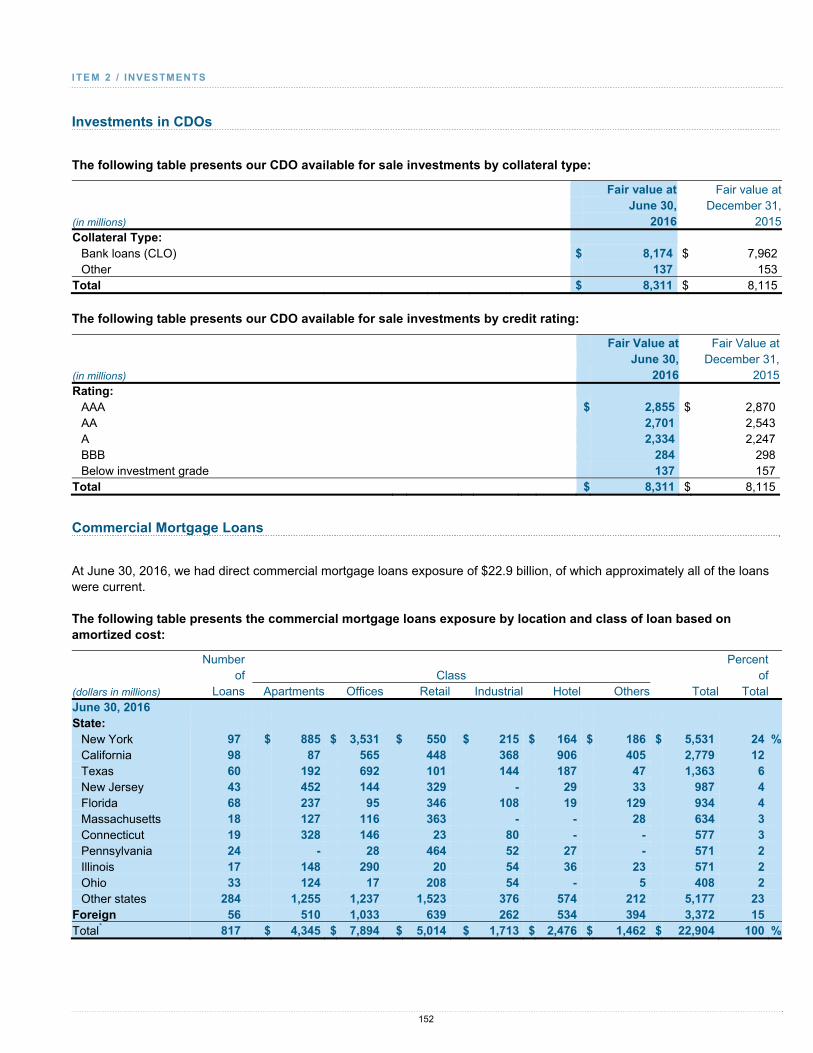
I TEM 2 / INVESTMENTS
152
Investments in CDOs
The following table presents our CDO available for sale investments by collateral type:
Fair value at Fair value at June 30, December 31,(in millions) 2016 2015Collateral Type:
Bank loans (CLO) $ 8,174 $ 7,962Other 137 153
Total $ 8,311 $ 8,115
The following table presents our CDO available for sale investments by credit rating:
Fair Value at Fair Value at June 30, December 31,(in millions) 2016 2015Rating:
AAA $ 2,855 $ 2,870AA 2,701 2,543A 2,334 2,247BBB 284 298Below investment grade 137 157
Total $ 8,311 $ 8,115
Commercial Mortgage Loans
At June 30, 2016, we had direct commercial mortgage loans exposure of $22.9 billion, of which approximately all of the loans were current.
The following table presents the commercial mortgage loans exposure by location and class of loan based on amortized cost:
Number Percent of Class of (dollars in millions) Loans Apartments Offices Retail Industrial Hotel Others Total TotalJune 30, 2016 State:
New York 97 $ 885 $ 3,531 $ 550 $ 215 $ 164 $ 186 $ 5,531 24 %California 98 87 565 448 368 906 405 2,779 12Texas 60 192 692 101 144 187 47 1,363 6New Jersey 43 452 144 329 - 29 33 987 4Florida 68 237 95 346 108 19 129 934 4Massachusetts 18 127 116 363 - - 28 634 3Connecticut 19 328 146 23 80 - - 577 3Pennsylvania 24 - 28 464 52 27 - 571 2Illinois 17 148 290 20 54 36 23 571 2Ohio 33 124 17 208 54 - 5 408 2Other states 284 1,255 1,237 1,523 376 574 212 5,177 23
Foreign 56 510 1,033 639 262 534 394 3,372 15Total* 817 $ 4,345 $ 7,894 $ 5,014 $ 1,713 $ 2,476 $ 1,462 $ 22,904 100 %

I TEM 2 / INVESTMENTS
153
December 31, 2015 State:
New York 97 $ 823 $ 2,968 $ 516 $ 301 $ 166 $ 186 $ 4,960 22 %California 95 87 547 433 533 788 308 2,696 12Texas 60 120 696 106 147 187 48 1,304 6New Jersey 45 441 338 324 - 29 33 1,165 5Florida 78 187 113 374 116 20 146 956 4Illinois 21 174 369 21 32 36 23 655 3Massachusetts 19 56 168 360 - - 33 617 3Connecticut 20 314 152 23 81 - - 570 3Pennsylvania 28 6 29 436 62 27 4 564 3Ohio 37 122 28 211 67 - 5 433 2Other states 302 1,118 1,203 1,514 414 595 229 5,073 23
Foreign 47 471 1,234 520 161 250 438 3,074 14Total* 849 $ 3,919 $ 7,845 $ 4,838 $ 1,914 $ 2,098 $ 1,453 $ 22,067 100 %
* Does not reflect allowance for credit losses.
See Note 6 to the Consolidated Financial Statements in the 2015 Annual Report for additional discussion on commercial mortgage loans.
Impairments
The following table presents impairments by investment type:
Three Months Ended Six Months Ended June 30, June 30, (in millions) 2016 2015 2016 2015Other-than-temporary Impairments: Fixed maturity securities, available for sale $ 92 $ 73 $ 292 $ 163 Equity securities, available for sale 2 79 4 86 Private equity funds and hedge funds 14 12 16 43Subtotal 108 164 312 292Other impairments: Investments in life settlements 92 72 249 142 Other investments 26 25 27 47 Real estate 3 2 4 5Total $ 229 $ 263 $ 592 $ 486

I TEM 2 / INVESTMENTS
154
Other-Than-Temporary Impairments
To determine other-than-temporary impairments, we use fundamental credit analyses of individual securities without regard to rating agency ratings. Based on this analysis, we expect to receive cash flows sufficient to cover the amortized cost of all below investment grade securities for which credit impairments were not recognized.
The following tables present other-than-temporary impairment charges recorded in earnings on fixed maturity securities, equity securities, private equity funds and hedge funds.
Other-than-temporary impairment charges by reportable segment and impairment type:
Non-Life Life CorporateInsurance Insurance and Other
(in millions) Companies Companies Operations TotalThree Months Ended June 30, 2016 Impairment Type:
Severity $ 3 $ - $ - $ 3Change in intent - 4 - 4Foreign currency declines 1 - - 1Issuer-specific credit events 27 66 2 95Adverse projected cash flows - 5 - 5
Total $ 31 $ 75 $ 2 $ 108Three Months Ended June 30, 2015 Impairment Type:
Severity $ - $ - $ - $ -Change in intent - 9 79 88Foreign currency declines 2 1 - 3Issuer-specific credit events 27 43 - 70Adverse projected cash flows 1 2 - 3
Total $ 30 $ 55 $ 79 $ 164Six Months Ended June 30, 2016 Impairment Type:
Severity $ 5 $ - $ - $ 5Change in intent 9 24 - 33Foreign currency declines 6 1 - 7Issuer-specific credit events 60 164 2 226Adverse projected cash flows 13 28 - 41
Total $ 93 $ 217 $ 2 $ 312Six Months Ended June 30, 2015 Impairment Type:
Severity $ 2 $ - $ - $ 2Change in intent 2 31 79 112Foreign currency declines 14 18 - 32Issuer-specific credit events 54 84 - 138Adverse projected cash flows 3 5 - 8
Total $ 75 $ 138 $ 79 $ 292

I TEM 2 / INVESTMENTS
155
Other-than-temporary impairment charges by investment type and impairment type:
Other Fixed Equities/Other(in millions) RMBS CDO/ABS CMBS Maturity Invested Assets* TotalThree Months Ended June 30, 2016 Impairment Type:
Severity $ - $ - $ - $ - $ 3 $ 3Change in intent - - - 4 - 4Foreign currency declines - - - 1 - 1Issuer-specific credit events 24 - 4 54 13 95Adverse projected cash flows 5 - - - - 5
Total $ 29 $ - $ 4 $ 59 $ 16 $ 108Three Months Ended June 30, 2015 Impairment Type:
Severity $ - $ - $ - $ - $ - $ -Change in intent 3 - - 7 78 88Foreign currency declines - - - 3 - 3Issuer-specific credit events 32 2 - 23 13 70Adverse projected cash flows 3 - - - - 3
Total $ 38 $ 2 $ - $ 33 $ 91 $ 164Six Months Ended June 30, 2016 Impairment Type:
Severity $ - $ - $ - $ - $ 5 $ 5Change in intent - - - 33 - 33Foreign currency declines - - - 7 - 7Issuer-specific credit events 60 1 12 138 15 226Adverse projected cash flows 41 - - - - 41
Total $ 101 $ 1 $ 12 $ 178 $ 20 $ 312Six Months Ended June 30, 2015 Impairment Type:
Severity $ - $ - $ - $ - $ 2 $ 2Change in intent 3 - - 31 78 112Foreign currency declines - - - 32 - 32Issuer-specific credit events 53 2 3 31 49 138Adverse projected cash flows 8 - - - - 8
Total $ 64 $ 2 $ 3 $ 94 $ 129 $ 292
* Includes other-than-temporary impairment charges on private equity funds, hedge funds and direct private equity investments.

I TEM 2 / INVESTMENTS
156
Other-than-temporary impairment charges by investment type and credit rating:
Other Fixed Equities/Other(in millions) RMBS CDO/ABS CMBS Maturity Invested Assets* TotalThree Months Ended June 30, 2016 Rating:
AAA $ - $ - $ - $ - $ - $ -AA - - - - - -A - - - - - -BBB 3 - - - - 3Below investment grade 26 - 4 59 - 89Non-rated - - - - 16 16
Total $ 29 $ - $ 4 $ 59 $ 16 $ 108Three Months Ended June 30, 2015 Rating:
AAA $ - $ - $ - $ - $ - $ -AA - - - - - -A 1 - - - - 1BBB 1 - - 8 - 9Below investment grade 36 2 - 24 - 62Non-rated - - - 1 91 92
Total $ 38 $ 2 $ - $ 33 $ 91 $ 164Six Months Ended June 30, 2016 Rating:
AAA $ - $ - $ - $ 2 $ - $ 2AA - - - 3 - 3A - - - 5 - 5BBB 5 - - 15 - 20Below investment grade 96 1 12 153 - 262Non-rated - - - - 20 20
Total $ 101 $ 1 $ 12 $ 178 $ 20 $ 312Six Months Ended June 30, 2015 Rating:
AAA $ - $ - $ - $ 4 $ - $ 4AA - - - 6 - 6A 1 - - 6 - 7BBB 1 - - 20 - 21Below investment grade 62 2 3 54 - 121Non-rated - - - 4 129 133
Total $ 64 $ 2 $ 3 $ 94 $ 129 $ 292
* Includes other-than-temporary impairment charges on private equity funds, hedge funds and direct private equity investments.
We recorded other-than-temporary impairment charges in the three- and six-month periods ended June 30, 2016 and 2015 related to:
• issuer-specific credit events;
• securities that we intend to sell or for which it is more likely than not that we will be required to sell;
• declines due to foreign exchange rates;
• adverse changes in estimated cash flows on certain structured securities; and
• securities that experienced severe market valuation declines.
In addition, impairments are recorded on real estate and investments in life settlements.

I TEM 2 / INVESTMENTS
157
In periods subsequent to the recognition of an other-than-temporary impairment charge for available for sale fixed maturity securities that is not foreign-exchange related, we generally prospectively accrete into earnings the difference between the new amortized cost and the expected undiscounted recoverable value over the remaining life of the security. The accretion that was recognized for these securities in earnings was $219 million and $180 million in the three-month periods ended June 30, 2016 and 2015, respectively, and $458 million and $368 million in the six-month periods ended June 30, 2016 and 2015, respectively. See Note 5 to the Consolidated Financial Statements in the 2015 Annual Report for a discussion of our other-than-temporary impairment accounting policy.
The following table shows the aging of the pre-tax unrealized losses of fixed maturity and equity securities, the extent to which the fair value is less than amortized cost or cost, and the number of respective items in each category:
June 30, 2016 Less Than or Equal Greater Than 20% Greater Than 50%
to 20% of Cost(b) to 50% of Cost(b) of Cost(b) Total
Aging(a) Unrealized Unrealized Unrealized Unrealized
(dollars in millions) Cost(c) Loss Items(e) Cost(c) Loss Items(e) Cost(c) Loss Items(e) Cost(c) Loss(d) Items(e)
Investment grade
bonds
0-6 months $ 7,985 $ 123 1,249 $ - $ - - $ - $ - - $ 7,985 $ 123 1,249
7-11 months 4,431 120 589 31 7 3 9 6 3 4,471 133 595
12 months or more 11,720 538 1,737 286 68 37 16 10 4 12,022 616 1,778
Total $ 24,136 $ 781 3,575 $ 317 $ 75 40 $ 25 $ 16 7 $ 24,478 $ 872 3,622
Below investment
grade bonds
0-6 months $ 4,805 $ 123 1,462 $ 78 $ 23 16 $ 1 $ 1 2 $ 4,884 $ 147 1,480
7-11 months 2,305 100 669 260 80 27 10 5 4 2,575 185 700
12 months or more 7,291 530 1,197 567 164 131 147 87 23 8,005 781 1,351
Total $ 14,401 $ 753 3,328 $ 905 $ 267 174 $ 158 $ 93 29 $ 15,464 $ 1,113 3,531
Total bonds
0-6 months $ 12,790 $ 246 2,711 $ 78 $ 23 16 $ 1 $ 1 2 $ 12,869 $ 270 2,729
7-11 months 6,736 220 1,258 291 87 30 19 11 7 7,046 318 1,295
12 months or more 19,011 1,068 2,934 853 232 168 163 97 27 20,027 1,397 3,129
Total(e) $ 38,537 $ 1,534 6,903 $ 1,222 $ 342 214 $ 183 $ 109 36 $ 39,942 $ 1,985 7,153
Equity securities
0-11 months $ 155 $ 8 120 $ 10 $ 2 16 $ - $ - - $ 165 $ 10 136
12 months or more 1 - 3 2 1 1 - - - 3 1 4
Total $ 156 $ 8 123 $ 12 $ 3 17 $ - $ - - $ 168 $ 11 140
(a) Represents the number of consecutive months that fair value has been less than cost by any amount.
(b) Represents the percentage by which fair value is less than cost at June 30, 2016.
(c) For bonds, represents amortized cost.
(d) The effect on Net income of unrealized losses after taxes will be mitigated upon realization because certain realized losses will result in current decreases in the amortization of certain DAC.
(e) Item count is by CUSIP by subsidiary.
Change in Unrealized Gains and Losses on Investments
The change in net unrealized gains and losses on investments in the second quarter of 2016 was primarily attributable to increases in the fair value of fixed maturity securities. For the six-month period ended June 30, 2016, net unrealized gains related to fixed maturity and equity securities increased by $9.2 billion due to a decrease in interest rates and narrowing of credit spreads.
The change in net unrealized gains and losses on investments in the second quarter of 2015 was primarily attributable to decreases in the fair value of fixed maturity securities. For the six-month period ended June 30, 2015, net unrealized gains
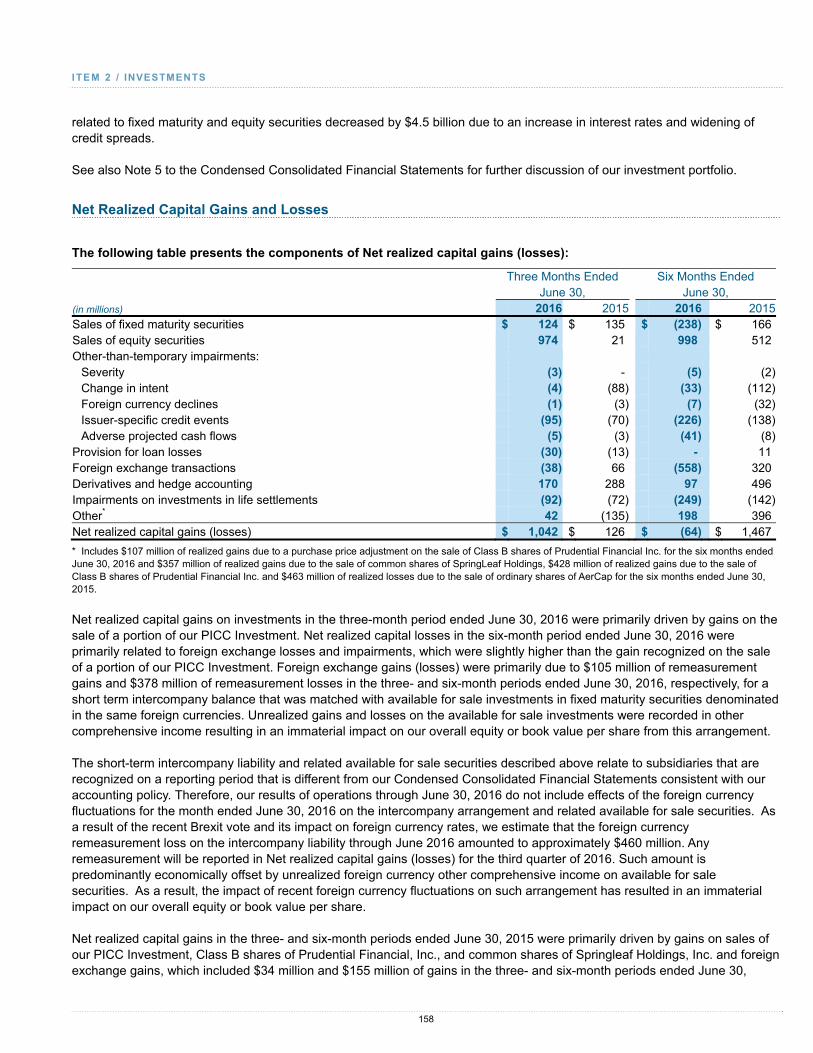
I TEM 2 / INVESTMENTS
158
related to fixed maturity and equity securities decreased by $4.5 billion due to an increase in interest rates and widening of credit spreads.
See also Note 5 to the Condensed Consolidated Financial Statements for further discussion of our investment portfolio.
Net Realized Capital Gains and Losses
The following table presents the components of Net realized capital gains (losses):
Three Months Ended Six Months Ended June 30, June 30, (in millions) 2016 2015 2016 2015Sales of fixed maturity securities $ 124 $ 135 $ (238) $ 166Sales of equity securities 974 21 998 512Other-than-temporary impairments:
Severity (3) - (5) (2)Change in intent (4) (88) (33) (112)Foreign currency declines (1) (3) (7) (32)Issuer-specific credit events (95) (70) (226) (138)Adverse projected cash flows (5) (3) (41) (8)
Provision for loan losses (30) (13) - 11Foreign exchange transactions (38) 66 (558) 320Derivatives and hedge accounting 170 288 97 496Impairments on investments in life settlements (92) (72) (249) (142)Other* 42 (135) 198 396Net realized capital gains (losses) $ 1,042 $ 126 $ (64) $ 1,467
* Includes $107 million of realized gains due to a purchase price adjustment on the sale of Class B shares of Prudential Financial Inc. for the six months ended June 30, 2016 and $357 million of realized gains due to the sale of common shares of SpringLeaf Holdings, $428 million of realized gains due to the sale of Class B shares of Prudential Financial Inc. and $463 million of realized losses due to the sale of ordinary shares of AerCap for the six months ended June 30, 2015.
Net realized capital gains on investments in the three-month period ended June 30, 2016 were primarily driven by gains on the sale of a portion of our PICC Investment. Net realized capital losses in the six-month period ended June 30, 2016 were primarily related to foreign exchange losses and impairments, which were slightly higher than the gain recognized on the sale of a portion of our PICC Investment. Foreign exchange gains (losses) were primarily due to $105 million of remeasurement gains and $378 million of remeasurement losses in the three- and six-month periods ended June 30, 2016, respectively, for a short term intercompany balance that was matched with available for sale investments in fixed maturity securities denominated in the same foreign currencies. Unrealized gains and losses on the available for sale investments were recorded in other comprehensive income resulting in an immaterial impact on our overall equity or book value per share from this arrangement.
The short-term intercompany liability and related available for sale securities described above relate to subsidiaries that are recognized on a reporting period that is different from our Condensed Consolidated Financial Statements consistent with our accounting policy. Therefore, our results of operations through June 30, 2016 do not include effects of the foreign currency fluctuations for the month ended June 30, 2016 on the intercompany arrangement and related available for sale securities. As a result of the recent Brexit vote and its impact on foreign currency rates, we estimate that the foreign currency remeasurement loss on the intercompany liability through June 2016 amounted to approximately $460 million. Any remeasurement will be reported in Net realized capital gains (losses) for the third quarter of 2016. Such amount is predominantly economically offset by unrealized foreign currency other comprehensive income on available for sale securities. As a result, the impact of recent foreign currency fluctuations on such arrangement has resulted in an immaterial impact on our overall equity or book value per share.
Net realized capital gains in the three- and six-month periods ended June 30, 2015 were primarily driven by gains on sales of our PICC Investment, Class B shares of Prudential Financial, Inc., and common shares of Springleaf Holdings, Inc. and foreign exchange gains, which included $34 million and $155 million of gains in the three- and six-month periods ended June 30,

I TEM 2 / INVESTMENTS
159
2015, respectively, related to the intercompany notional cash pooling arrangement, discussed above. These realized gains were partially offset by realized losses related to the sale of ordinary shares of AerCap.
See also Note 5 to the Condensed Consolidated Financial Statements for further discussion of our investment portfolio.
Insurance Reserves
The following section provides discussion of insurance reserves for both the Non-Life Insurance Companies and the Life Insurance Companies, including Eaglestone Reinsurance Company, which is reported in Corporate and Other.
Non-Life Insurance Companies
The following section provides discussion of the consolidated liability for unpaid losses and loss adjustment expenses for the Non-Life Insurance Companies.
The following table presents the components of AIG’s gross loss reserves by major lines of business on a U.S. statutory basis*:
June 30, December 31,(in millions) 2016 2015Other liability occurrence (including asbestos and environmental) $ 24,057 $ 24,856Workers' compensation (net of discount) 15,348 14,978Other liability claims made 13,132 14,006Property 6,235 5,823Auto liability 5,013 4,692Accident and health 1,873 1,783Products liability 1,644 1,681Medical malpractice 1,495 1,603Aircraft 1,283 1,286Mortgage guaranty / credit 643 733Other 3,420 3,501Total $ 74,143 $ 74,942Total U.S. & Canada $ 57,504 $ 58,890Total International $ 16,639 $ 16,052
* Presented by lines of business pursuant to statutory reporting requirements as prescribed by the NAIC.
Gross loss reserves represent the accumulation of estimates of ultimate losses, including estimates for IBNR and loss expenses, less estimated salvage and subrogation and applicable discount. The Non-Life Insurance Companies regularly review and update the methods and assumptions used to determine loss reserve estimates and to establish the resulting reserves. Any adjustments resulting from this review are reflected in pre-tax operating income. Because loss reserve estimates are subject to the outcome of future events, changes in estimates are unavoidable given that loss trends vary and time is often required for changes in trends to be recognized and confirmed. Reserve changes that increase prior years’ estimates of ultimate cost are referred to as unfavorable or adverse development or reserve strengthening. Reserve changes that decrease prior years’ estimates of ultimate cost are referred to as favorable development. See MD&A – Critical Accounting Estimates – Details of the Loss Reserving Process in the 2015 Annual Report.
Net loss reserves represent gross loss reserves reduced by reinsurance recoverable, net of an allowance for unrecoverable reinsurance.

I TEM 2 / INSURANCE RESERVES / NON-LIFE INSURANCE COMPANIES
160
The following table presents the components of net loss reserves:
June 30, December 31,(in millions) 2016 2015Gross loss reserves before reinsurance and discount $ 77,000 $ 78,090Less: discount (2,857) (3,148)Gross loss reserves, net of discount, before reinsurance 74,143 74,942Less: reinsurance recoverable* (14,520) (14,339)Net liability for unpaid losses and loss adjustment expenses $ 59,623 $ 60,603
* Includes $1.8 billion of reinsurance recoverable under a retroactive reinsurance agreement at both June 30, 2016 and December 31, 2015.
Gross loss reserves before reinsurance and discount are net of contractual deductible recoverable amounts due from policyholders of approximately $13.1 billion and $12.6 billion at June 30, 2016 and December 31, 2015, respectively. These recoverable amounts are related to certain policies with high deductibles (meaning, the policy attachment point is above high dollar amounts retained by the insured through self-insured retentions, deductibles, retrospective programs, or captive arrangements; each referred here generically as “deductibles”), primarily for U.S. commercial casualty business. With respect to the deductible portion of the claim the Non-Life Insurance Companies manage and pay the entire claim on behalf of the insured and are reimbursed by the insured for the deductible portion of the claim. The Non-Life Insurance Companies held collateral of approximately $9.6 billion at both June 30, 2016 and December 31, 2015 for these deductible recoverable amounts, consisting primarily of letters of credit and assets in trusts.
The following table classifies the components of net loss reserves by business unit:
June 30, December 31,(in millions) 2016 2015Commercial Property Casualty:
Casualty $ 30,662 $ 32,620Financial lines 9,273 9,265Specialty 4,781 5,197Property 4,152 4,013
Total Commercial Property Casualty 48,868 51,095Commercial Mortgage Guaranty 625 713Consumer Personal Insurance:
Personal lines 2,856 2,661Accident and health 1,730 1,662
Total Consumer Personal Insurance 4,586 4,323Other run-off insurance lines* 5,544 4,472Net liability for unpaid losses and loss adjustment expenses $ 59,623 $ 60,603
* In the six-month period ended June 30, 2016 and in the full year 2015, $1.3 billion and $1.2 billion, respectively, of loss reserves for certain environmental liability, casualty, healthcare, and specialty coverages, previously reported in Commercial Casualty and Specialty lines of business, were transferred to Other run-off insurance lines.

I TEM 2 / INSURANCE RESERVES / NON-LIFE INSURANCE COMPANIES
161
Discounting of Reserves
The following table presents the components of loss reserve discount included above:
June 30, 2016 December 31, 2015 Run-off Run-off Property Insurance Property Insurance(in millions) Casualty Lines Total Casualty Lines TotalU.S. workers' compensation:
Tabular $ 635 $ 218 $ 853 $ 635 $ 218 $ 853Non-tabular 1,377 622 1,999 1,542 746 2,288
Asbestos - 5 5 - 7 7Total reserve discount $ 2,012 $ 845 $ 2,857 $ 2,177 $ 971 $ 3,148
The following table presents the net reserve discount benefit (charge):
Three Months Ended June 30, Six Months Ended June 30,
2016 2015 2016 2015
Run-off Run-off Run-off Run-off
Property Insurance Property Insurance Property Insurance Property Insurance
(in millions) Casualty Lines Total Casualty Lines Total Casualty Lines Total Casualty Lines Total
Current accident year $ 33 $ - $ 33 $ 58 $ - $ 58 $ 81 $ - $ 81 $ 104 $ - $ 104
Accretion and other
adjustments to prior
year discount (47) (16) (63) (42) (19) (61) (61) (30) (91) (109) (43) (152)
Effect of interest rate
changes (177) (93) (270) 254 149 403 (185) (96) (281) 182 101 283
Net reserve discount
benefit (charge) $ (191) $ (109) $ (300) $ 270 $ 130 $ 400 $ (165) $ (126) $ (291) $ 177 $ 58 $ 235
Comprised of:
U.S. Workers'
compensation $ (191) $ (108) $ (299) $ 270 $ 131 $ 401 $ (165) $ (124) $ (289) $ 177 $ 60 $ 237
Asbestos $ - $ (1) $ (1) $ - $ (1) $ (1) $ - $ (2) $ (2) $ - $ (2)$ (2)
U.S. Workers’ Compensation
The Non-Life Insurance Companies discount certain workers’ compensation reserves in accordance with practices prescribed or permitted by New York, Pennsylvania and Delaware. New York rules generally do not permit non-tabular discounting on IBNR and prescribe a fixed 5 percent discount rate for application to case reserves. Pennsylvania permits non-tabular discounting of IBNR and approved variable discount rates determined using risk-free rates based on the U.S. Treasury forward yield curve plus a liquidity margin, applicable to IBNR and case reserves. Delaware has permitted discounting on the same basis as the Pennsylvania domiciled companies.
The net decreases in workers’ compensation discount in the amounts of $299 million and $289 million, respectively, in the three- and six-month periods ended June 30, 2016 compared to the prior year periods were primarily due to the decrease in forward yield curve rates used for discounting under the prescribed or permitted practices. The decrease in the forward yield curve component of the discount rates resulted in a $270 million and $281 million decrease in the loss reserve discount in the three- and six-month periods ended June 30, 2016 compared to the prior year periods, due to a decrease in both Treasury rates and credit spreads which generally decreased along the payout pattern horizon. In addition, there was a $62 million and $89 million reduction for accident years 2015 and prior for the three- and six-month periods ended June 30, 2016, respectively, primarily from accretion of discount on reserves for those periods. This decrease was partially offset by a $33 million and $81 million addition for newly established reserves for accident year 2016 in the three- and six-month periods ended June 30, 2016, respectively. The impact of changes in treasury rates and credit spreads on workers' compensation reserve discount generally is economically offset by unrealized gains and losses on available for sale securities backing these reserves

I TEM 2 / INSURANCE RESERVES / NON-LIFE INSURANCE COMPANIES
162
recorded in Other comprehensive income resulting in a modest impact on our overall equity and book value per common share.
Quarterly Reserving Conclusion
AIG net loss reserves represent our best estimate of the liability for net losses and loss adjustment expenses as of June 30, 2016. While we regularly review the adequacy of established loss reserves, there can be no assurance that our recorded loss reserves will not develop adversely in future years and materially exceed our loss reserves as of June 30, 2016. In our opinion, such adverse development and resulting increase in reserves are not likely to have a material adverse effect on our consolidated financial condition, although such events could have a material adverse effect on our consolidated results of operations for an individual reporting period.
The following table presents the rollforward of net loss reserves:
Three Months Ended Six Months Ended June 30, June 30, (in millions) 2016 2015 2016 2015Net liability for unpaid losses and loss adjustment expenses
at beginning of period $ 59,734 $ 60,143 $ 60,603 $ 61,612Foreign exchange effect 360 (162) 200 (966)Change due to retroactive asbestos reinsurance - 50 - 100Losses and loss adjustment expenses incurred:
Current year, undiscounted 5,023 5,185 9,935 10,138Prior years (favorable) unfavorable development, undiscounted* 7 317 (59) 341Change in discount 300 (400) 291 (235)
Losses and loss adjustment expenses incurred 5,330 5,102 10,167 10,244Losses and loss adjustment expenses paid 5,801 6,040 11,347 11,897Net liability for unpaid losses and loss adjustment expenses
at end of period $ 59,623 $ 59,093 $ 59,623 $ 59,093* See tables below for details of prior year development by business unit, accident year and major class of business.
The following table summarizes development, (favorable) or unfavorable, of incurred losses and loss expenses for prior years, net of reinsurance, by business unit and major class of business:
Three Months Ended Six Months Ended June 30, June 30, (in millions) 2016 2015 2016 2015Prior accident year development by major class of business: Commercial Property Casualty - U.S. & Canada:
Excess casualty $ - $ 211 $ - $ 318Financial lines including professional liability - (2) - 3Primary casualty: -
Loss-sensitive (offset by premium adjustments below)* (22) (12) (28) (23)Primary workers' compensation and other 98 103 98 118
Specialty - 32 - 46Property excluding catastrophes (42) (51) (54) (109)Catastrophes 45 (9) 125 (41)All other, net 3 18 2 44Total Commercial Property Casualty - U.S. & Canada 82 290 143 356
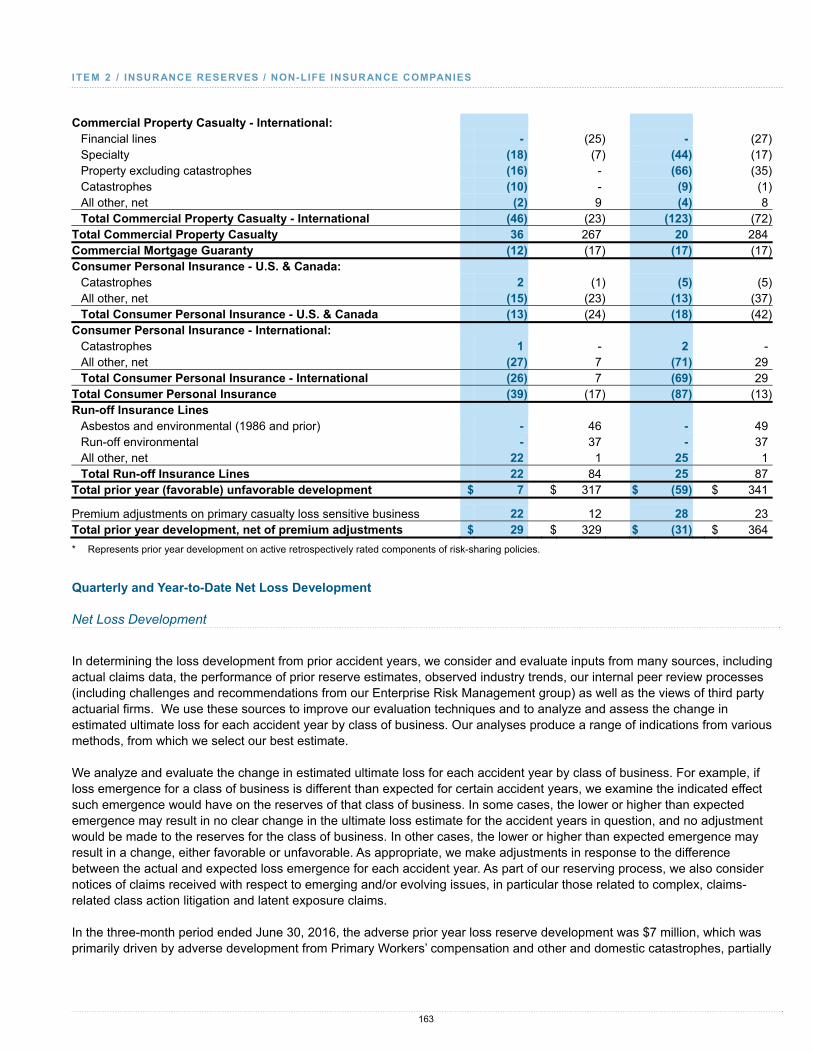
I TEM 2 / INSURANCE RESERVES / NON-LIFE INSURANCE COMPANIES
163
Commercial Property Casualty - International: Financial lines - (25) - (27)Specialty (18) (7) (44) (17)Property excluding catastrophes (16) - (66) (35)Catastrophes (10) - (9) (1)All other, net (2) 9 (4) 8Total Commercial Property Casualty - International (46) (23) (123) (72)
Total Commercial Property Casualty 36 267 20 284Commercial Mortgage Guaranty (12) (17) (17) (17)Consumer Personal Insurance - U.S. & Canada:
Catastrophes 2 (1) (5) (5)All other, net (15) (23) (13) (37)Total Consumer Personal Insurance - U.S. & Canada (13) (24) (18) (42)
Consumer Personal Insurance - International: Catastrophes 1 - 2 -All other, net (27) 7 (71) 29Total Consumer Personal Insurance - International (26) 7 (69) 29
Total Consumer Personal Insurance (39) (17) (87) (13)Run-off Insurance Lines
Asbestos and environmental (1986 and prior) - 46 - 49Run-off environmental - 37 - 37All other, net 22 1 25 1Total Run-off Insurance Lines 22 84 25 87
Total prior year (favorable) unfavorable development $ 7 $ 317 $ (59) $ 341
Premium adjustments on primary casualty loss sensitive business 22 12 28 23Total prior year development, net of premium adjustments $ 29 $ 329 $ (31) $ 364
* Represents prior year development on active retrospectively rated components of risk-sharing policies.
Quarterly and Year-to-Date Net Loss Development Net Loss Development
In determining the loss development from prior accident years, we consider and evaluate inputs from many sources, including actual claims data, the performance of prior reserve estimates, observed industry trends, our internal peer review processes (including challenges and recommendations from our Enterprise Risk Management group) as well as the views of third party actuarial firms. We use these sources to improve our evaluation techniques and to analyze and assess the change in estimated ultimate loss for each accident year by class of business. Our analyses produce a range of indications from various methods, from which we select our best estimate.
We analyze and evaluate the change in estimated ultimate loss for each accident year by class of business. For example, if loss emergence for a class of business is different than expected for certain accident years, we examine the indicated effect such emergence would have on the reserves of that class of business. In some cases, the lower or higher than expected emergence may result in no clear change in the ultimate loss estimate for the accident years in question, and no adjustment would be made to the reserves for the class of business. In other cases, the lower or higher than expected emergence may result in a change, either favorable or unfavorable. As appropriate, we make adjustments in response to the difference between the actual and expected loss emergence for each accident year. As part of our reserving process, we also consider notices of claims received with respect to emerging and/or evolving issues, in particular those related to complex, claims-related class action litigation and latent exposure claims.
In the three-month period ended June 30, 2016, the adverse prior year loss reserve development was $7 million, which was primarily driven by adverse development from Primary Workers’ compensation and other and domestic catastrophes, partially

I TEM 2 / INSURANCE RESERVES / NON-LIFE INSURANCE COMPANIES
164
offset by Property excluding catastrophes, both domestically and internationally, International Specialty lines, and International Consumer – Personal Insurance.
During the second quarter of 2016, the Florida Supreme Court issued two separate rulings that have increased the potential liability for workers’ compensation claims in that state by undoing certain aspects of regulations in place since 2003. The Castellanos ruling eliminated statutory caps on claimant attorney fees in certain cases, and the Westphal ruling eliminated the 104-week limitation on temporary total disability benefits. Also in the second quarter, the Florida Court of Appeals issued the Miles decision, declaring unconstitutional certain restrictions on claimant-paid attorney fees.
We have evaluated the potential impact of these decisions on our loss reserves, and have recognized adverse prior year development for primary workers’ compensation in the current quarter of approximately $100 million. We are continuing to monitor the impact of these decisions, and may adjust our estimate as new facts and data emerge.
In the six-month period ended June 30, 2016, the favorable prior year loss reserve development was $59 million, which was primarily driven by favorable development from Property excluding catastrophes, both domestically and internationally, International Specialty lines, and International Consumer - Personal Insurance, partially offset by domestic catastrophes, as well as Primary Workers’ compensation and other resulting from the Florida court rulings described above.
In the three- and six-month periods ended June 30, 2015, the adverse prior year loss reserve development was $317 million and $341 million, respectively, which was driven by increased automobile claim severity in Excess and Primary Casualty, as well as adverse development from Asbestos and Environmental (1986 and prior), and Run-off Environmental (1987 to 2004). This was partially offset by Property excluding catastrophes, both domestically and internationally.
We recognized return premiums on loss sensitive business of $22 million and $28 million for the three- and six-month periods ended June 30, 2016, respectively, which entirely offset favorable development in that business. We recognized return premiums on loss sensitive business of $12 million and $23 million for the three- and six-month periods ended June 30, 2015, respectively, which entirely offset favorable development in that business.
See Results of Operations — Commercial Insurance and Results of Operations — Consumer Personal Insurance Results herein for further discussion of net loss development.
The following table summarizes development, (favorable) or unfavorable, of incurred losses and loss adjustment expenses for prior years, net of reinsurance, by accident year:
Three Months Ended Six Months Ended June 30, June 30, (in millions) 2016 2015 2016 2015Prior accident year development by accident year: Accident Year
2015 $ (67) $ - $ (132) $ -2014 (25) 40 (68) (22)2013 (19) 70 (26) 652012 51 119 69 1522011 (10) 16 16 222010 7 (3) 3 22009 19 (20) 24 (30)2008 35 23 39 132007 7 (58) 7 (47)2006 1 (3) 2 (8)2005 16 (1) 22 (2)2004 and prior (see table below) (8) 134 (15) 196
Total prior year (favorable) unfavorable development $ 7 $ 317 $ (59) $ 341

I TEM 2 / INSURANCE RESERVES / NON-LIFE INSURANCE COMPANIES
165
The following table summarizes development, (favorable) or unfavorable, of incurred losses and loss adjustment expenses for accident year 2004 and prior by major class of business and driver of development:
Three Months Ended Six Months Ended June 30, June 30, (in millions) 2016 2015 2016 20152004 and prior accident year development by major class of
business and driver of development: Excess Casualty - all other $ - $ 1 $ - $ 1Primary Casualty - loss sensitive business(a) (7) (3) (8) (15)Primary Casualty - all other(b) 5 38 5 36Run-off environmental (1987 to 2004) - 47 - 47Asbestos and environmental (1986 and prior) - 46 - 49Commutations and arbitrations(c) - (25) - (1)All Other (6) 30 (12) 79
Total prior year (favorable) unfavorable development $ (8) $ 134 $ (15) $ 196
(a) Loss sensitive business that is offset by premium adjustments and has no income statement impact. Approximated based on prior accident year development recognized from policy year premium charges.
(b) Includes loss development on excess of deductible exposures in workers’ compensation, general liability and commercial auto.
(c) The effects of commutations are shown separately from the related classes of business, primarily excess workers’ compensation. Commutations are reflected for the years in which they were contractually binding.
Asbestos and Environmental Reserves
Loss Reserve Estimates - Asbestos and Environmental
The estimation of loss reserves relating to asbestos and environmental claims on insurance policies written many years ago is subject to greater uncertainty than other types of claims due to inconsistent court decisions as well as judicial interpretations and legislative actions that in some cases have tended to broaden coverage beyond the original intent of such policies and in others have expanded theories of liability.
As described more fully in the 2015 Annual Report, our reserves relating to asbestos and environmental claims reflect comprehensive ground-up and top-down analyses performed periodically. In the six-month period ended June 30, 2016, we increased our gross asbestos incurred losses by $3 million due to accretion of discount, while our net asbestos incurred losses increased by $1 million. For the same period, our gross and net environmental incurred losses remained unchanged. In the six-month period ended June 30, 2015, we increased our gross asbestos incurred losses by $14 million and our net asbestos reserves by $8 million due to minor changes in estimates, accretion of discount, and anticipated uncollectible reinsurance. For the same period, we increased our gross environmental incurred losses by $66 million and our net environmental reserves by $43 million to reflect the results of a top-down analysis of accident years 2004 and prior completed in the six-month ended June 30, 2015.
In addition to the U.S. asbestos and environmental reserve amounts shown in the tables below, the Non-Life Insurance Companies also have asbestos reserves relating to foreign risks written by non-U.S. entities of $117 million gross and $91 million net as of June 30, 2016. The asbestos reserves relating to non-U.S. risks written by non-U.S. entities were $121 million gross and $93 million net as of December 31, 2015.
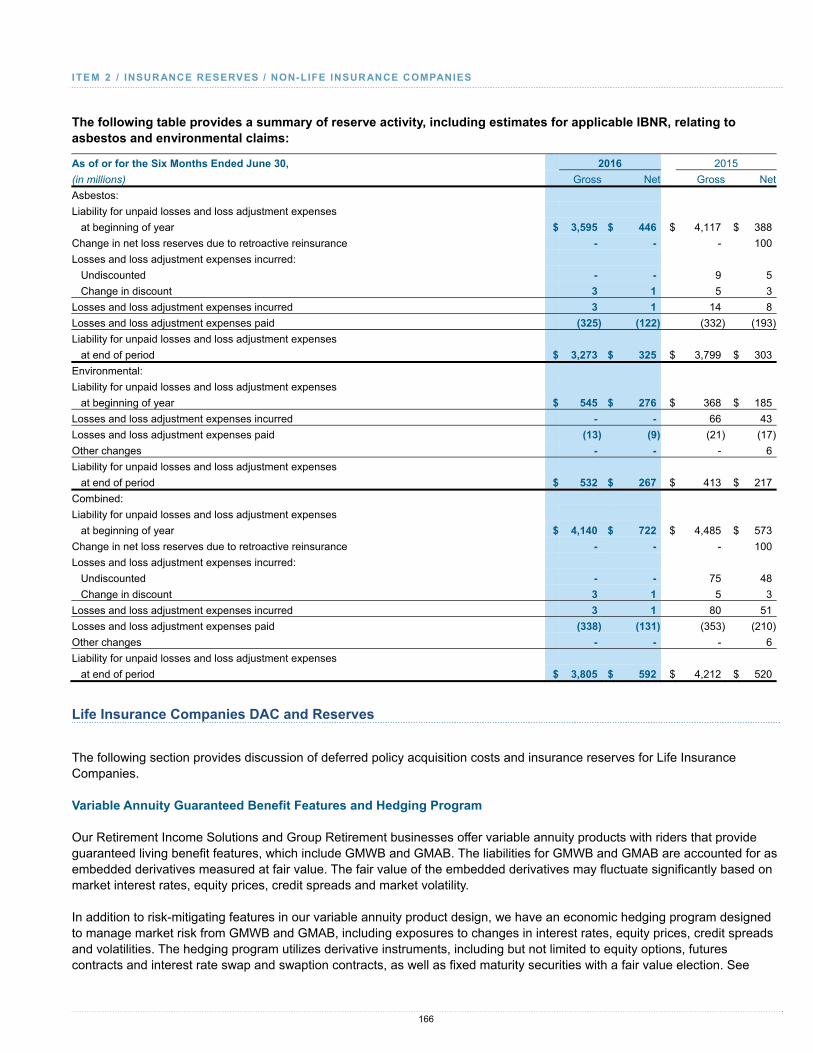
I TEM 2 / INSURANCE RESERVES / NON-LIFE INSURANCE COMPANIES
166
The following table provides a summary of reserve activity, including estimates for applicable IBNR, relating to asbestos and environmental claims:
As of or for the Six Months Ended June 30, 2016 2015
(in millions) Gross Net Gross Net
Asbestos:
Liability for unpaid losses and loss adjustment expenses
at beginning of year $ 3,595 $ 446 $ 4,117 $ 388
Change in net loss reserves due to retroactive reinsurance - - - 100
Losses and loss adjustment expenses incurred:
Undiscounted - - 9 5
Change in discount 3 1 5 3
Losses and loss adjustment expenses incurred 3 1 14 8
Losses and loss adjustment expenses paid (325) (122) (332) (193)
Liability for unpaid losses and loss adjustment expenses
at end of period $ 3,273 $ 325 $ 3,799 $ 303
Environmental:
Liability for unpaid losses and loss adjustment expenses
at beginning of year $ 545 $ 276 $ 368 $ 185
Losses and loss adjustment expenses incurred - - 66 43
Losses and loss adjustment expenses paid (13) (9) (21) (17)
Other changes - - - 6
Liability for unpaid losses and loss adjustment expenses
at end of period $ 532 $ 267 $ 413 $ 217
Combined:
Liability for unpaid losses and loss adjustment expenses
at beginning of year $ 4,140 $ 722 $ 4,485 $ 573
Change in net loss reserves due to retroactive reinsurance - - - 100
Losses and loss adjustment expenses incurred:
Undiscounted - - 75 48
Change in discount 3 1 5 3
Losses and loss adjustment expenses incurred 3 1 80 51
Losses and loss adjustment expenses paid (338) (131) (353) (210)
Other changes - - - 6
Liability for unpaid losses and loss adjustment expenses
at end of period $ 3,805 $ 592 $ 4,212 $ 520
Life Insurance Companies DAC and Reserves
The following section provides discussion of deferred policy acquisition costs and insurance reserves for Life Insurance Companies.
Variable Annuity Guaranteed Benefit Features and Hedging Program
Our Retirement Income Solutions and Group Retirement businesses offer variable annuity products with riders that provide guaranteed living benefit features, which include GMWB and GMAB. The liabilities for GMWB and GMAB are accounted for as embedded derivatives measured at fair value. The fair value of the embedded derivatives may fluctuate significantly based on market interest rates, equity prices, credit spreads and market volatility.
In addition to risk-mitigating features in our variable annuity product design, we have an economic hedging program designed to manage market risk from GMWB and GMAB, including exposures to changes in interest rates, equity prices, credit spreads and volatilities. The hedging program utilizes derivative instruments, including but not limited to equity options, futures contracts and interest rate swap and swaption contracts, as well as fixed maturity securities with a fair value election. See
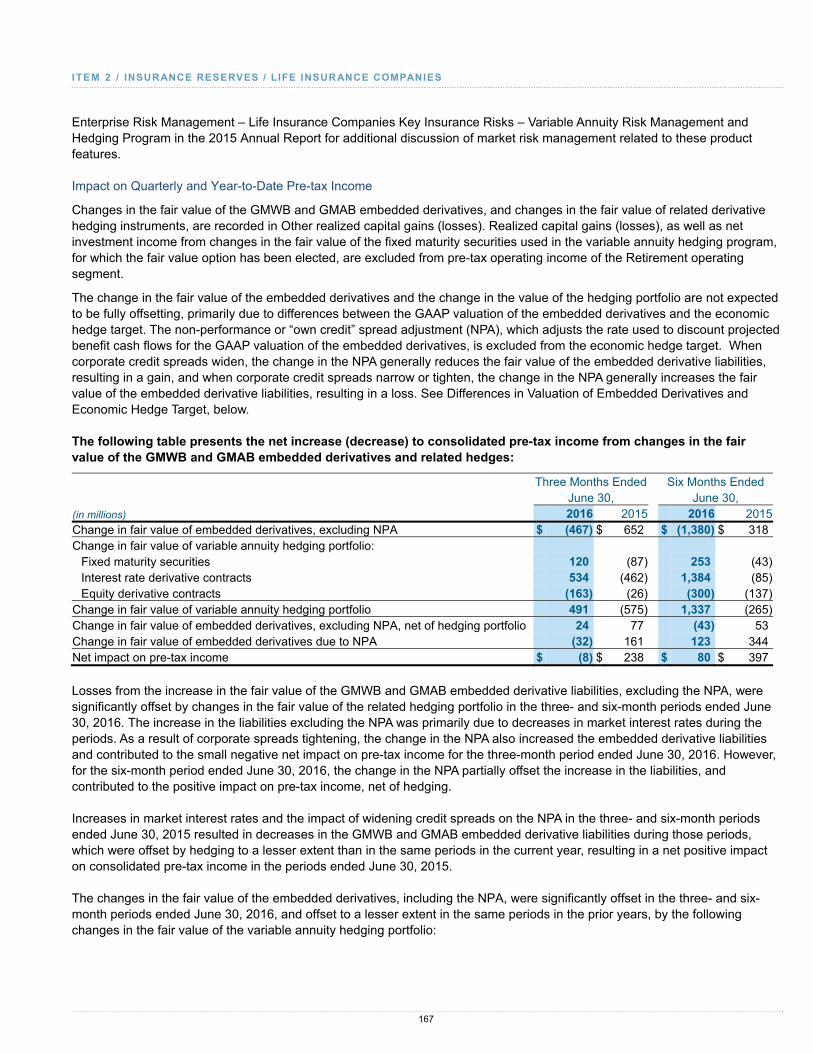
I TEM 2 / INSURANCE RESERVES / LIFE INSURANCE COMPANIES
167
Enterprise Risk Management – Life Insurance Companies Key Insurance Risks – Variable Annuity Risk Management and Hedging Program in the 2015 Annual Report for additional discussion of market risk management related to these product features.
Impact on Quarterly and Year-to-Date Pre-tax Income
Changes in the fair value of the GMWB and GMAB embedded derivatives, and changes in the fair value of related derivative hedging instruments, are recorded in Other realized capital gains (losses). Realized capital gains (losses), as well as net investment income from changes in the fair value of the fixed maturity securities used in the variable annuity hedging program, for which the fair value option has been elected, are excluded from pre-tax operating income of the Retirement operating segment.
The change in the fair value of the embedded derivatives and the change in the value of the hedging portfolio are not expected to be fully offsetting, primarily due to differences between the GAAP valuation of the embedded derivatives and the economic hedge target. The non-performance or “own credit” spread adjustment (NPA), which adjusts the rate used to discount projected benefit cash flows for the GAAP valuation of the embedded derivatives, is excluded from the economic hedge target. When corporate credit spreads widen, the change in the NPA generally reduces the fair value of the embedded derivative liabilities, resulting in a gain, and when corporate credit spreads narrow or tighten, the change in the NPA generally increases the fair value of the embedded derivative liabilities, resulting in a loss. See Differences in Valuation of Embedded Derivatives and Economic Hedge Target, below.
The following table presents the net increase (decrease) to consolidated pre-tax income from changes in the fair value of the GMWB and GMAB embedded derivatives and related hedges:
Three Months Ended Six Months Ended June 30, June 30, (in millions) 2016 2015 2016 2015Change in fair value of embedded derivatives, excluding NPA $ (467) $ 652 $ (1,380) $ 318Change in fair value of variable annuity hedging portfolio:
Fixed maturity securities 120 (87) 253 (43)Interest rate derivative contracts 534 (462) 1,384 (85)Equity derivative contracts (163) (26) (300) (137)
Change in fair value of variable annuity hedging portfolio 491 (575) 1,337 (265)Change in fair value of embedded derivatives, excluding NPA, net of hedging portfolio 24 77 (43) 53Change in fair value of embedded derivatives due to NPA (32) 161 123 344Net impact on pre-tax income $ (8) $ 238 $ 80 $ 397
Losses from the increase in the fair value of the GMWB and GMAB embedded derivative liabilities, excluding the NPA, were significantly offset by changes in the fair value of the related hedging portfolio in the three- and six-month periods ended June 30, 2016. The increase in the liabilities excluding the NPA was primarily due to decreases in market interest rates during the periods. As a result of corporate spreads tightening, the change in the NPA also increased the embedded derivative liabilities and contributed to the small negative net impact on pre-tax income for the three-month period ended June 30, 2016. However, for the six-month period ended June 30, 2016, the change in the NPA partially offset the increase in the liabilities, and contributed to the positive impact on pre-tax income, net of hedging.
Increases in market interest rates and the impact of widening credit spreads on the NPA in the three- and six-month periods ended June 30, 2015 resulted in decreases in the GMWB and GMAB embedded derivative liabilities during those periods, which were offset by hedging to a lesser extent than in the same periods in the current year, resulting in a net positive impact on consolidated pre-tax income in the periods ended June 30, 2015.
The changes in the fair value of the embedded derivatives, including the NPA, were significantly offset in the three- and six-month periods ended June 30, 2016, and offset to a lesser extent in the same periods in the prior years, by the following changes in the fair value of the variable annuity hedging portfolio:

I TEM 2 / INSURANCE RESERVES / LIFE INSURANCE COMPANIES
168
• Changes in the fair value of fixed maturity securities, for which the fair value option has been elected, are used as a capital-efficient way to economically hedge interest rate and credit spread-related risk. Effective June 30, 2015, we discontinued our U.S. Treasury bond interest rate hedging program and initiated a corporate bond hedging program, which is intended to provide the same capital efficiency as the previous U.S. Treasury bond hedging program. The three- and six-month periods ended June 30, 2016 reflected increases in the fair value of the corporate bond hedging program, due primarily to decreases in market interest rates, which partially offset the interest rate and credit spread-related increases in the embedded derivative liabilities. The three- and six-month periods ended June 30, 2015 reflected decreases in the fair value of the U.S. Treasury bond hedging program due to increases in market interest rates, which partially offset the interest rate-related decreases in the embedded derivative liabilities. The change in the fair value of these bonds is reported in net investment income on the Consolidated Statements of Income (Loss).
• Changes in the fair value of interest rate derivative contracts, which included swaps, swaptions and futures, resulted in gains in the three- and six-month periods ended June 30, 2016 due to decreasing market interest rates, compared to losses in the prior year resulting from increasing market interest rates.
• Losses from the change in the fair value of equity derivative contracts, which included futures and options, were relatively higher in the three- and six-month periods ended June 30, 2016 compared to the same periods in the prior year, due to more favorable equity market returns.
Differences in Valuation of Embedded Derivatives and Economic Hedge Target
The variable annuity hedging program utilizes an economic hedge target, which represents an estimate of the underlying economic drivers of the embedded derivatives. The economic hedge target differs from the GAAP valuation of the GMWB and GMAB embedded derivatives due to the following:
• Rider fees are 100 percent included in the economic hedge target present value calculations; the GAAP valuation reflects those collected fees attributed to the embedded derivative such that the initial value at contract issue equals zero;
• Actuarial assumptions for GAAP are adjusted to remove explicit risk margins, including margins for policyholder behavior and fund basis risk, and use best estimate assumptions for the economic hedge target; and
• NPA is excluded from the discount rates used for the economic hedge target.
The market value of the hedge portfolio compared to the economic hedge target at any point in time may be different and is not expected to be fully offsetting. In addition to the derivatives held in conjunction with the variable annuity hedging program, the Life Insurance Companies have cash and invested assets available to cover future claims payable under these guarantees. The primary sources of difference between the change in the fair value of the hedging portfolio and the economic hedge target include:
• Basis risk due to the variance between expected and actual fund returns, which may be either positive or negative;
• Realized volatility versus implied volatility;
• Actual versus expected changes in the hedge target related to items not subject to hedging, particularly policyholder behavior; and
• Risk exposures that we have elected not to explicitly or fully hedge.

I TEM 2 / INSURANCE RESERVES / LIFE INSURANCE COMPANIES
169
DAC
The following table summarizes the major components of the changes in Life Insurance Companies DAC, including VOBA:
Six Months Ended June 30, (in millions) 2016 2015Balance, beginning of year $ 8,467 $ 7,258
Acquisition costs deferred 623 596Amortization expense:
Related to realized capital gains and losses 22 (64)All other operating amortization (568) (476)
Increase (decrease) in DAC due to foreign exchange (1) (19)Change related to unrealized depreciation (appreciation) of investments (769) 363
Balance, end of period* $ 7,774 $ 7,658
* DAC balance excluding the amount related to unrealized depreciation (appreciation) of investments was $9.1 billion and $8.6 billion at June 30, 2016 and 2015, respectively.
Estimated Gross Profits for Investment-Oriented Products
Policy acquisition costs and policy issuance costs that are incremental and directly related to the successful acquisition of new or renewal of existing contracts for investment-oriented products are deferred and amortized, with interest, in relation to the incidence of estimated gross profits to be realized over a period that approximates the estimated lives of the contracts. Estimated gross profits include net investment income and spreads, net realized capital gains and losses, fees, surrender charges, expenses, and mortality gains and losses. If the assumptions used for estimated gross profits change significantly, DAC and related reserves (which may include VOBA, SIA, guaranteed benefit reserves and unearned revenue reserve) are recalculated using the new assumptions, and any resulting adjustment is included in income. Updating such assumptions may result in acceleration of amortization in some products and deceleration of amortization in other products.
DAC and Reserves Related to Unrealized Appreciation of Investments
DAC for universal life and investment-type products (collectively, investment-oriented products) is adjusted at each balance sheet date to reflect the change in DAC as if fixed maturity and equity securities available for sale had been sold at their stated aggregate fair value and the proceeds reinvested at current yields (shadow DAC). Shadow DAC generally moves in the opposite direction of the change in unrealized appreciation of the available for sale securities portfolio, reducing the reported DAC balance when market interest rates decline. In addition, significant unrealized appreciation of investments in a prolonged low interest rate environment may cause additional future policy benefit liabilities to be recorded (shadow loss reserves). Market interest rates decreased in the six-month period ended June 30, 2016. As a result, the Life Insurance Companies’ unrealized appreciation of investments in the six-month period ended June 30, 2016 increased by $5.0 billion compared to December 31, 2015, which resulted in an increase in the shadow DAC offset and an increase in shadow loss reserves. Shadow loss reserves increased by $1.5 billion at June 30, 2016 compared to December 31, 2015.

I TEM 2 / INSURANCE RESERVES / LIFE INSURANCE COMPANIES
170
Life Insurance Companies Reserves
The following table presents a rollforward of Life Insurance Companies’ insurance reserves, including separate accounts and mutual fund assets under management, by operating segment:
Three Months Ended Six Months Ended June 30, June 30, (in millions) 2016 2015 2016 2015Institutional Markets: Balance at beginning of period, gross $ 35,815 $ 35,120 $ 35,823 $ 35,080
Premiums and deposits 506 680 810 826Surrenders and withdrawals (102) (227) (279) (256)Death and other contract benefits (456) (418) (837) (797)Subtotal (52) 35 (306) (227)Change in fair value of underlying assets and reserve accretion, net of
policy fees 434 299 672 557Cost of funds 101 102 202 204Other reserve changes (101) (33) (194) (91)
Balance at end of period 36,197 35,523 36,197 35,523Reserves related to unrealized appreciation of investments 1,382 314 1,382 314Reinsurance ceded (5) (5) (5) (5)
Total insurance reserves $ 37,574 $ 35,832 $ 37,574 $ 35,832Retirement: Balance at beginning of period, gross $ 212,542 $ 207,679 $ 208,333 $ 204,627
Premiums and deposits 6,448 6,083 13,314 11,605Surrenders and withdrawals (4,198) (4,240) (8,277) (8,666)Death and other contract benefits (1,041) (1,041) (2,004) (1,968)Subtotal 1,209 802 3,033 971Change in fair value of underlying assets and reserve accretion, net of
policy fees 2,142 (1,296) 3,736 892Cost of funds 686 676 1,365 1,349Other reserve changes (2) 7 110 29
Balance at end of period 216,577 207,868 216,577 207,868Reserves related to unrealized appreciation of investments 109 9 109 9Reinsurance ceded (358) (364) (358) (364)
Total insurance reserves and mutual fund assets under management $ 216,328 $ 207,513 $ 216,328 $ 207,513

I TEM 2 / INSURANCE RESERVES / LIFE INSURANCE COMPANIES
171
Life: Balance at beginning of period, gross $ 34,393 $ 33,482 $ 34,170 $ 33,536
Premiums and deposits 1,292 1,249 2,528 2,472Surrenders and withdrawals (241) (164) (468) (386)Death and other contract benefits (231) (260) (489) (507)Subtotal 820 825 1,571 1,579Change in fair value of underlying assets and reserve accretion, net of
policy fees (241) (186) (419) (328)Cost of funds 121 122 243 246Other reserve changes (335) (610) (807) (1,400)
Balance at end of period 34,758 33,633 34,758 33,633Reserves related to unrealized appreciation of investments - 7 - 7Reinsurance ceded (1,363) (1,444) (1,363) (1,444)
Total insurance reserves $ 33,395 $ 32,196 $ 33,395 $ 32,196Total Life Insurance Companies: Balance at beginning of period, gross $ 282,750 $ 276,281 $ 278,326 $ 273,243
Premiums and deposits 8,246 8,012 16,652 14,903Surrenders and withdrawals (4,541) (4,631) (9,024) (9,308)Death and other contract benefits (1,728) (1,719) (3,330) (3,272)Subtotal 1,977 1,662 4,298 2,323Change in fair value of underlying assets and reserve accretion, net of
policy fees 2,335 (1,183) 3,989 1,121Cost of funds 908 900 1,810 1,799Other reserve changes (438) (636) (891) (1,462)
Balance at end of period 287,532 277,024 287,532 277,024Reserves related to unrealized appreciation of investments 1,491 330 1,491 330Reinsurance ceded (1,726) (1,813) (1,726) (1,813)
Total insurance reserves and mutual fund assets under management $ 287,297 $ 275,541 $ 287,297 $ 275,541
Life Insurance Companies’ insurance reserves including separate accounts and mutual fund assets under management were comprised of the following balances:
June 30, December 31,(in millions) 2016 2015Future policy benefits* $ 44,127 $ 41,820Policyholder contract deposits 132,092 127,704Other policy funds 1,591 1,503Separate account liabilities 80,563 79,564Total insurance reserves 258,373 250,591Mutual fund assets under management 30,650 27,735Total insurance reserves and mutual fund assets under management $ 289,023 $ 278,326
* Excludes certain intercompany assumed reinsurance.

I TEM 2 / LIQUIDITY AND CAPITAL RESOURCES
172
LIQUIDITY AND CAPITAL RESOURCES
Overview
Liquidity refers to the ability to generate sufficient cash resources to meet our payment obligations. It is defined as cash and unencumbered assets that can be monetized in a short period of time at a reasonable cost. We manage our liquidity prudently through various risk committees, policies and procedures, and a stress testing and liquidity risk framework established by Enterprise Risk Management (ERM). Our liquidity risk framework is designed to manage liquidity at both AIG Parent and subsidiaries to meet our financial obligations over a twelve-month period under a liquidity stress scenario. See Enterprise Risk Management — Risk Appetite, Limits, Identification, and Measurement in the 2015 Annual Report and Enterprise Risk Management — Liquidity Risk Management below for additional information.
Capital refers to the long-term financial resources available to support the operation of our businesses, fund business growth, and cover financial and operational needs that arise from adverse circumstances. Our primary source of ongoing capital generation is the profitability of our insurance subsidiaries. We must comply with numerous constraints on our minimum capital positions. These constraints drive the requirements for capital adequacy for both AIG and the individual businesses and are based on internally-defined risk tolerances, regulatory requirements, rating agency and creditor expectations and business needs. Actual capital levels are monitored on a regular basis, and using ERM’s stress testing methodology, we evaluate the capital impact of potential macroeconomic, financial and insurance stresses in relation to the relevant capital constraints of both AIG and our insurance subsidiaries.
We believe that we have sufficient liquidity and capital resources to satisfy future requirements and meet our obligations to policyholders, customers, creditors and debt-holders, including those arising from reasonably foreseeable contingencies or events.
Nevertheless, some circumstances may cause our cash or capital needs to exceed projected liquidity or readily deployable capital resources as was the case in 2008. Additional collateral calls, deterioration in investment portfolios or reserve strengthening affecting statutory surplus, higher surrenders of annuities and other policies, downgrades in credit ratings, or catastrophic losses may result in significant additional cash or capital needs and loss of sources of liquidity and capital. In addition, regulatory and other legal restrictions could limit our ability to transfer funds freely, either to or from our subsidiaries.
Depending on market conditions, regulatory and rating agency considerations and other factors, we may take various liability and capital management actions. Liability management actions may include, but are not limited to, repurchasing or redeeming outstanding debt, issuing new debt or engaging in debt exchange offers. Capital management actions may include, but are not limited to, paying dividends to our shareholders and share repurchases.

I TEM 2 / LIQUIDITY AND CAPITAL RESOURCES
173
Liquidity and Capital Resources Activity for the Six-Month Period Ended June 30, 2016
Sources
• AIG Parent Funding from Subsidiaries
During the six-month period ended June 30, 2016, AIG Parent received $2.9 billion in dividends and loan repayments from subsidiaries. Of this amount, $1.5 billion was dividends in the form of cash and fixed maturity securities from our Non-Life Insurance Companies and $1.4 billion was dividends and loan repayments in the form of cash and fixed maturity securities from our Life Insurance Companies.
AIG Parent also received $1.6 billion in tax sharing payments in the form of cash and fixed maturity securities from our insurance businesses in the six-month period ended June 30, 2016, including $1.1 billion of such payments in the second quarter of 2016. The tax sharing payments may be subject to adjustment in future periods.
The dividends and tax sharing payments from our Non-Life and Life Insurance Companies were funded, in part, by proceeds from the sale of 740 million ordinary H shares of PICC P&C for approximately $1.25 billion in May 2016 and by the sale of AIG Advisor Group in May 2016.
Debt Issuances
In February 2016, we issued $1.5 billion aggregate principal amount of 3.300% Notes due 2021.
In March 2016, we issued $1.5 billion aggregate principal amount of 3.900% Notes due 2026.
In June 2016, we issued €750 million aggregate principal amount of 1.500% Notes due 2023.
Legacy Assets
During the six-month period ended June 30, 2016, we monetized approximately $2.2 billion of legacy assets.
Uses
• Debt Reduction
In March 2016, we repurchased, through a cash tender offer, approximately $736 million aggregate principal amount of certain notes and debentures issued or guaranteed by AIG for an aggregate purchase price of approximately $825 million.
We also made other repurchases and repayments of approximately $2.2 billion during the six-month period ended June 30, 2016. AIG Parent made interest payments on our debt instruments totaling $515 million during the six-month period ended June 30, 2016.
• Dividend
We paid a cash dividend of $0.32 per share on AIG Common Stock during each of the first and second quarters of 2016.
• Repurchase of Common Stock(*)
We repurchased approximately 113 million shares of AIG Common Stock during the six-month period ended June 30, 2016, for an aggregate purchase price of approximately $6.2 billion.
• Repurchase of Warrants
We repurchased 15 million warrants to purchase shares of AIG Common Stock during the six-month period ended June 30, 2016, for an aggregate purchase price of $263 million.
• AIG Parent Funding to Subsidiaries
In January 2016, AIG Parent made a capital contribution of approximately $2.9 billion to our Non-Life Insurance Companies.
* Pursuant to an Exchange Act Rule 10b5-1 repurchase plan, from July 1 to August 2, 2016, we have repurchased approximately $698 million of additional shares of AIG Common Stock. As of August 2, 2016, approximately $4.0 billion remained under our share repurchase authorization.

I TEM 2 / LIQUIDITY AND CAPITAL RESOURCES
174
Analysis of Sources and Uses of Cash
The following table presents selected data from AIG's Condensed Consolidated Statements of Cash Flows:
Six Months Ended June 30,
(in millions) 2016 2015
Sources:
Net cash provided by operating activities $ 571 $ 493
Net cash provided by changes in restricted cash - 1,462
Net cash provided by (used in) other investing activities (186) 3,824
Changes in policyholder contract balances 2,752 316
Issuance of long-term debt 6,688 2,774
Total sources 9,825 8,869
Uses:
Change in restricted cash (78) -
Repayments of long-term debt (2,919) (3,701)
Purchases of AIG Common Stock (6,248) (3,743)
Net cash used in other financing activities (463) (1,212)
Total uses (9,708) (8,656)
Effect of exchange rate changes on cash 38 (34)
Increase in cash $ 155 $ 179
The following table presents a summary of AIG’s Condensed Consolidated Statements of Cash Flows:
Six Months Ended June 30,
(in millions) 2016 2015
Summary:
Net cash provided by operating activities $ 571 $ 493
Net cash provided by (used in) investing activities (264) 5,286
Net cash used in financing activities (190) (5,566)
Effect of exchange rate changes on cash 38 (34)
Increase in cash 155 179
Cash at beginning of year 1,629 1,758
Change in cash of businesses held-for-sale - -
Cash at end of period $ 1,784 $ 1,937
Operating Cash Flow Activities
Insurance companies generally receive most premiums in advance of the payment of claims or policy benefits. The ability of insurance companies to generate positive cash flow is affected by the frequency and severity of losses under their insurance policies, policy retention rates and operating expenses.
Interest payments totaled $650 million in the six-month period ended June 30, 2016 compared to $760 million in the same period in the prior year. Excluding interest payments, AIG generated positive operating cash flow of $1.2 billion for the six-month period ended June 30, 2016 compared to $1.3 billion for the six-month period ended June 30, 2015, primarily attributable to a greater increase in Other assets and Other liabilities, net.

I TEM 2 / LIQUIDITY AND CAPITAL RESOURCES
175
Investing Cash Flow Activities
Net cash provided by investing activities in the six-month periods ended June 30, 2016 and 2015 included approximately $143 million and $204 million, respectively, of cash collateral received in connection with our Life Insurance Companies’ securities lending program. In addition, the six-month period ended June 30, 2015 included approximately $3.7 billion of net cash proceeds from the sale of ordinary shares of AerCap.
Financing Cash Flow Activities
Net cash used in financing activities in the six-month period ended June 30, 2016 included:
• approximately $713 million in the aggregate to pay a dividend of $0.32 per share on AIG Common Stock in each of the first and second quarters of 2016;
• approximately $6.2 billion to repurchase approximately 113 million shares of AIG Common Stock;
• $263 million to repurchase 15 million warrants to purchase shares of AIG Common Stock; and
• approximately $2.9 billion to repay long-term debt.
Net cash used in financing activities in the six-month period ended June 30, 2015 included:
• approximately $335 million in the aggregate to pay a dividend of $0.125 per share on AIG Common Stock in each of the first and second quarters of 2015;
approximately $3.7 billion to repurchase approximately 69 million shares of AIG Common Stock; and
approximately $3.7 billion to repay long-term debt.
Liquidity and Capital Resources of AIG Parent and Subsidiaries
AIG Parent
As of June 30, 2016, AIG Parent had approximately $11.2 billion in liquidity sources. AIG Parent’s liquidity sources are primarily held in the form of cash, short-term investments and publicly traded, investment grade rated fixed maturity securities. Fixed maturity securities primarily include U.S. government and government sponsored entity securities, U.S. agency mortgage-backed securities, corporate and municipal bonds and certain other highly rated securities. AIG Parent actively manages its assets and liabilities in terms of products, counterparties and duration. Based upon an assessment of funding needs, the liquidity sources can be readily monetized through sales, repurchase agreements or contributed as admitted assets to regulated insurance companies. AIG Parent liquidity is monitored through the use of various internal liquidity risk measures. AIG Parent’s primary sources of liquidity are dividends, distributions, loans and other payments from subsidiaries and credit facilities. AIG Parent’s primary uses of liquidity are for debt service, capital and liability management, operating expenses and subsidiary capital needs.
We generally manage capital flows between AIG Parent and its subsidiaries through internal, Board-approved policies and standards. In addition, AIG Parent has unconditional capital maintenance agreements (CMAs) in place with certain subsidiaries. Nevertheless, regulatory and other legal restrictions could limit our ability to transfer capital freely, either to or from our subsidiaries.
We believe that we have sufficient liquidity and capital resources to satisfy our reasonably foreseeable future requirements and meet our obligations to our creditors, debt-holders and insurance company subsidiaries. We expect to access the debt markets from time to time to meet funding requirements as needed.

I TEM 2 / LIQUIDITY AND CAPITAL RESOURCES
176
We utilize our capital resources to support our businesses, with the majority of capital allocated to our insurance operations. Should we have or generate more capital than is needed to support our business strategies (including organic growth or acquisition opportunities) or mitigate risks inherent to our business, we may develop plans to distribute such capital to shareholders via dividends or share repurchase authorizations or deploy such capital towards liability management.
In the normal course, it is expected that a portion of the capital released by our insurance operations or through the utilization of AIG’s deferred tax assets may be available for distribution to shareholders. Additionally, it is expected that capital associated with businesses or investments that do not directly support our insurance operations may be available for distribution to shareholders or deployment towards liability management upon its monetization.
In developing plans to distribute capital, AIG considers a number of factors, including, but not limited to: the capital resources available to support our insurance operations and business strategies, AIG’s funding capacity and capital resources in comparison to internal benchmarks, expectations for capital generation, rating agency expectations for capital, as well as regulatory standards and internal stress tests for capital and capital distributions.
In January 2016, AIG Parent made a capital contribution of approximately $2.9 billion to our Non-Life Insurance Companies as a result of our fourth quarter 2015 reserve strengthening.
The following table presents AIG Parent's liquidity sources:
As of As of (In millions) June 30, 2016 December 31, 2015Cash and short-term investments(a) $ 1,970 $ 3,497Unencumbered fixed maturity securities(b) 4,719 5,723Total AIG Parent liquidity 6,689 9,220Available capacity under syndicated credit facility(c) 4,500 4,500Total AIG Parent liquidity sources $ 11,189 $ 13,720
(a) Cash and short-term investments include reverse repurchase agreements totaling $1.1 billion and $1.5 billion as of June 30, 2016 and December 31, 2015, respectively.
(b) Unencumbered securities consist of publicly traded, investment grade rated fixed maturity securities. Fixed maturity securities primarily include U.S. government and government sponsored entity securities, U.S. agency mortgage-backed securities, corporate and municipal bonds and certain other highly rated securities.
(c) For additional information relating to this syndicated credit facility, see Credit Facilities below.
Non-Life Insurance Companies
We expect that our Non-Life Insurance Companies will be able to continue to satisfy reasonably foreseeable future liquidity requirements and meet their obligations, including those arising from reasonably foreseeable contingencies or events, through cash from operations and, to the extent necessary, monetization of invested assets. Our Non-Life Insurance Companies’ liquidity resources are primarily held in the form of cash, short-term investments and publicly traded, investment grade rated fixed maturity securities.
Each of our Non-Life Insurance Companies’ liquidity is monitored through the use of various internal liquidity risk measures. The primary sources of liquidity are premiums, fees, reinsurance recoverables and investment income. The primary uses of liquidity are paid losses, reinsurance payments, dividends, expenses, investments and collateral requirements.
Our Non-Life Insurance Companies may require additional funding to meet capital or liquidity needs under certain circumstances. Large catastrophes may require us to provide additional support to our affected operations. Downgrades in our credit ratings could put pressure on the insurer financial strength ratings of our subsidiaries, which could result in non-renewals or cancellations by policyholders and adversely affect the subsidiary’s ability to meet its own obligations. Increases in market interest rates may adversely affect the financial strength ratings of our subsidiaries, as rating agency capital models may reduce the amount of available capital relative to required capital. Other potential events that could cause a liquidity strain include an economic collapse of a nation or region significant to our operations, nationalization, catastrophic terrorist acts, pandemics or other events causing economic or political upheaval.

I TEM 2 / LIQUIDITY AND CAPITAL RESOURCES
177
Certain Non-Life Insurance Companies are members of the Federal Home Loan Banks (FHLBs) in their respective districts. Borrowings from the FHLBs may be used to supplement liquidity or for other uses deemed appropriate by management. Our Non-Life Insurance Companies had outstanding borrowings from the FHLBs in an aggregate amount of approximately $1.2 billion and $0 as of June 30, 2016 and December 31, 2015, respectively. The outstanding borrowings are being used primarily for interest rate risk management purposes in connection with certain reinsurance arrangements, and the balances are expected to decline as underlying premiums are collected.
AIG Parent and Ascot Corporate Name Limited (ACNL), a Non-Life Insurance Company, are parties to a $725 million letter of credit facility. ACNL, as a member of the Lloyd’s of London insurance syndicate (Lloyd’s), is required to hold capital at Lloyd’s, known as Funds at Lloyds (FAL). Under the facility, the entire FAL capital requirement of $640 million as of June 30, 2016, which supports the 2016 and 2017 years of account, was satisfied with a letter of credit in that amount issued under the facility.
AIG generally manages capital between AIG Parent and our Non-Life Insurance Companies through internal, Board-approved policies and guidelines. In addition, AIG Parent is party to a CMA with its Mortgage Guaranty insurance company. Among other things, the CMA provides that AIG Parent will maintain capital and surplus of the Mortgage Guaranty insurance company at or above a specified minimum required capital based on a specified risk-to-capital ratio. In addition, the CMA provides that if capital and surplus of the Mortgage Guaranty insurance company is in excess of that same specified minimum required capital, subject to its board approval and compliance with applicable insurance laws, the Mortgage Guaranty insurance company would declare and pay ordinary dividends to its equity holders up to an amount necessary to reduce projected or actual capital and surplus to a level equal to or not materially greater than such specified minimum required capital. As structured, the CMA contemplates that the specified minimum required capital would be reviewed and agreed upon at least annually. As of June 30, 2016, the minimum required capital for the CMA with the Mortgage Guaranty insurance company is based on a risk-to-capital ratio of 19 to 1.
In the six-month period ended June 30, 2016, our Non-Life Insurance Companies paid approximately $1.5 billion to AIG Parent in dividends in the form of cash and fixed maturity securities. The fixed maturity securities primarily include U.S. government and government sponsored entity securities, U.S. agency mortgage-backed securities, corporate and municipal bonds and certain other highly rated securities.
Life Insurance Companies
We expect that our Life Insurance Companies will be able to continue to satisfy reasonably foreseeable future liquidity requirements and meet their obligations, including those arising from reasonably foreseeable contingencies or events, through cash from operations and, to the extent necessary, monetization of invested assets. Our Life Insurance Companies’ liquidity sources are primarily held in the form of cash, short-term investments and publicly traded, investment grade rated fixed maturity securities.
Each of our Life Insurance Companies’ liquidity is monitored through the use of various internal liquidity risk measures. The primary sources of liquidity are premiums, fees, reinsurance recoverables and investment income. The primary uses of liquidity are benefit claims, interest payments, surrenders, withdrawals, dividends, expenses, investments and collateral requirements.
Management believes that because of the size and liquidity of our Life Insurance Companies’ investment portfolios, normal deviations from projected claim or surrender experience would not create significant liquidity risk. Furthermore, our Life Insurance Companies’ products contain certain features that mitigate surrender risk, including surrender charges. However, as we saw in 2008, in times of extreme capital markets disruption, liquidity needs could outpace resources. As part of their risk management framework, our Life Insurance Companies continue to evaluate and, where appropriate, pursue strategies and programs to improve their liquidity position and facilitate their ability to maintain a fully invested asset portfolio.
Certain of our U.S. Life Insurance Companies are members of the FHLBs in their respective districts. Borrowings from the FHLBs are used to supplement liquidity or for other uses deemed appropriate by management. Our U.S. Life Insurance Companies had outstanding borrowings from the FHLBs in an aggregate amount of approximately $2 million at both June 30, 2016 and December 31, 2015.

I TEM 2 / LIQUIDITY AND CAPITAL RESOURCES
178
Certain of our U.S. Life Insurance Companies have programs, which began in 2012, that lend securities from their investment portfolio to supplement liquidity or for other uses as deemed appropriate by management. Under these programs, these U.S. Life Insurance Companies lend securities to financial institutions and receive cash as collateral equal to 102 percent of the fair value of the loaned securities. Cash collateral received is invested in short-term investments. Additionally, the aggregate amount of securities that a Life Insurance Company is able to lend under its program at any time is limited to five percent of its general account statutory-basis admitted assets. At June 30, 2016 and December 31, 2015, our U.S. Life Insurance Companies had $1.7 billion and $1.1 billion, respectively, of securities subject to these agreements and $1.8 billion and $1.1 billion, respectively, of liabilities to borrowers for collateral received.
AIG generally manages capital between AIG Parent and our Life Insurance Companies through internal, Board-approved policies and guidelines. In addition, AIG Parent is party to a CMA with AGC Life Insurance Company. Among other things, the CMA provides that AIG Parent will maintain the total adjusted capital of AGC Life Insurance Company at or above a specified minimum percentage of its projected NAIC Company Action Level Risk-Based Capital (RBC). As of June 30, 2016, the specified minimum percentage under this CMA was 250 percent.
In the six-month period ended June 30, 2016, our U.S. Life Insurance Companies paid approximately $1.4 billion to AIG Parent in dividends and loan repayments in the form of cash and fixed maturity securities. The fixed maturity securities primarily included U.S. government and government sponsored entity securities, U.S. agency mortgage-backed securities, corporate and municipal bonds and certain other highly rated securities.
Credit Facilities
We maintain a committed, revolving syndicated credit facility (the Five-Year Facility) as a potential source of liquidity for general corporate purposes. The Five-Year Facility provides for aggregate commitments by the bank syndicate to provide unsecured revolving loans and/or standby letters of credit of up to $4.5 billion without any limits on the type of borrowings and is scheduled to expire in November 2020.
As of June 30, 2016, a total of $4.5 billion remains available under the Five-Year Facility. Our ability to borrow under the Five-Year Facility is not contingent on our credit ratings. However, our ability to borrow under the Five-Year Facility is conditioned on the satisfaction of certain legal, operating, administrative and financial covenants and other requirements contained in the Five-Year Facility. These include covenants relating to our maintenance of a specified total consolidated net worth and total consolidated debt to total consolidated capitalization. Failure to satisfy these and other requirements contained in the Five-Year Facility would restrict our access to the Five-Year Facility and could have a material adverse effect on our financial condition, results of operations and liquidity. We expect to borrow under the Five-Year Facility from time to time, and may use the proceeds for general corporate purposes.

I TEM 2 / LIQUIDITY AND CAPITAL RESOURCES
179
Contractual Obligations
The following table summarizes contractual obligations in total, and by remaining maturity:
June 30, 2016 Payments due by Period Total Remainder 2017- 2019- (in millions) Payments of 2016 2018 2020 2021 ThereafterInsurance operations
Loss reserves $ 77,000 $ 9,733 $ 25,482 $ 14,064 $ 4,665 $ 23,056Insurance and investment contract liabilities 240,598 7,748 28,262 25,817 12,268 166,503Borrowings 982 - - 118 223 641Interest payments on borrowings 976 25 99 99 50 703Other long-term obligations 8 2 3 2 1 -
Total $ 319,564 $ 17,508 $ 53,846 $ 40,100 $ 17,207 $ 190,903Other
Borrowings $ 25,960 $ 882 $ 3,291 $ 2,472 $ 280 $ 19,035Interest payments on borrowings 16,138 534 2,131 1,891 839 10,743Other long-term obligations 246 19 92 92 - 43
Total $ 42,344 $ 1,435 $ 5,514 $ 4,455 $ 1,119 $ 29,821Consolidated
Loss reserves $ 77,000 $ 9,733 $ 25,482 $ 14,064 $ 4,665 $ 23,056Insurance and investment contract liabilities 240,598 7,748 28,262 25,817 12,268 166,503Borrowings 26,942 882 3,291 2,590 503 19,676Interest payments on borrowings 17,114 559 2,230 1,990 889 11,446Other long-term obligations(a) 254 21 95 94 1 43
Total(b) $ 361,908 $ 18,943 $ 59,360 $ 44,555 $ 18,326 $ 220,724
(a) Primarily includes contracts to purchase future services and other capital expenditures.
(b) Does not reflect unrecognized tax benefits of $4.5 billion, the timing of which is uncertain.
Loss Reserves
Loss reserves relate to our Non-Life Insurance Companies and represent future losses and loss adjustment expense payments estimated based on historical loss development payment patterns. Due to the significance of the assumptions used, the payments by period presented above could be materially different from actual required payments. We believe that our Non-Life Insurance Companies maintain adequate financial resources to meet the actual required payments under these obligations.
Insurance and Investment Contract Liabilities
Insurance and investment contract liabilities, including GIC liabilities, relate to our Life Insurance Companies. These liabilities include various investment-type products with contractually scheduled maturities, including periodic payments. These liabilities also include benefit and claim liabilities, of which a significant portion represents policies and contracts that do not have stated contractual maturity dates and may not result in any future payment obligations. For these policies and contracts (i) we are not currently making payments until the occurrence of an insurable event, such as death or disability, (ii) payments are conditional on survivorship or (iii) payment may occur due to a surrender or other non-scheduled event beyond our control.
We have made significant assumptions to determine the estimated undiscounted cash flows of these contractual policy benefits. These assumptions include mortality, morbidity, future lapse rates, expenses, investment returns and interest crediting rates, offset by expected future deposits and premiums on in-force policies. Due to the significance of the assumptions, the periodic amounts presented could be materially different from actual required payments. The amounts

I TEM 2 / LIQUIDITY AND CAPITAL RESOURCES
180
presented in this table are undiscounted and exceed the future policy benefits and policyholder contract deposits included in the Condensed Consolidated Balance Sheets.
We believe that our Life Insurance Companies have adequate financial resources to meet the payments actually required under these obligations. These subsidiaries have substantial liquidity in the form of cash and short-term investments. In addition, our Life Insurance Companies maintain significant levels of investment grade rated fixed maturity securities, including substantial holdings in government and corporate bonds, and could seek to monetize those holdings in the event operating cash flows are insufficient. We expect liquidity needs related to GIC liabilities to be funded through cash flows generated from maturities and sales of invested assets.
Borrowings
Our borrowings exclude those incurred by consolidated investments and include hybrid financial instrument liabilities recorded at fair value. We expect to repay the long-term debt maturities and interest accrued on borrowings by AIG through maturing investments and dispositions of invested assets, future cash flows from operations, cash flows generated from invested assets, future debt issuance and other financing arrangements. Borrowings supported by assets of AIG include various notes and bonds payable as well as GIAs that are supported by cash and investments held by AIG Parent and certain non-insurance subsidiaries for the repayment of those obligations.
Off-Balance Sheet Arrangements and Commercial Commitments
The following table summarizes Off-Balance Sheet Arrangements and Commercial Commitments in total, and by remaining maturity:
June 30, 2016 Amount of Commitment Expiring Total Amounts Remainder 2017- 2019 - (in millions) Committed of 2016 2018 2020 2021 ThereafterInsurance operations Guarantees:
Standby letters of credit $ 820 $ 180 $ 10 $ 627 $ - $ 3Guarantees of indebtedness 127 100 27 - - -All other guarantees(a) 3 - 1 - - 2
Commitments: Investment commitments(b) 3,014 1,778 849 292 - 95Commitments to extend credit 2,283 1,146 795 273 62 7Letters of credit 5 2 3 - - -
Total(c) $ 6,252 $ 3,206 $ 1,685 $ 1,192 $ 62 $ 107Other Guarantees:
Liquidity facilities(d) $ 74 $ - $ - $ - $ - $ 74Standby letters of credit 208 208 - - - -All other guarantees 490 478 12 - - -
Commitments: Investment commitments(b) 175 26 30 13 10 96Commitments to extend credit(e) 500 - - 500 - -Letters of credit 25 25 - - - -
Total(c)(f) $ 1,472 $ 737 $ 42 $ 513 $ 10 $ 170

I TEM 2 / LIQUIDITY AND CAPITAL RESOURCES
181
Consolidated Guarantees:
Liquidity facilities(d) $ 74 $ - $ - $ - $ - $ 74Standby letters of credit 1,028 388 10 627 - 3Guarantees of indebtedness 127 100 27 - - -All other guarantees(a) 493 478 13 - - 2
Commitments: Investment commitments(b) 3,189 1,804 879 305 10 191Commitments to extend credit(e) 2,783 1,146 795 773 62 7Letters of credit 30 27 3 - - -
Total(c)(f) $ 7,724 $ 3,943 $ 1,727 $ 1,705 $ 72 $ 277
(a) Includes construction guarantees connected to affordable housing investments by our Life Insurance Companies. Excludes potential amounts for indemnification obligations included in asset sales agreements. See Note 9 to the Condensed Consolidated Financial Statements for further information on indemnification obligations.
(b) Includes commitments to invest in private equity funds, hedge funds and other funds and commitments to purchase and develop real estate in the United States and abroad. The commitments to invest in private equity funds, hedge funds and other funds are called at the discretion of each fund, as needed for funding new investments or expenses of the fund. The expiration of these commitments is estimated in the table above based on the expected life cycle of the related fund, consistent with past trends of requirements for funding. Investors under these commitments are primarily insurance and real estate subsidiaries.
(c) Does not include guarantees, CMAs or other support arrangements among AIG consolidated entities.
(d) Primarily represents liquidity facilities provided in connection with certain municipal swap transactions and collateralized bond obligations.
(e) Includes a five-year senior unsecured revolving credit facility of up to $500 million between AerCap Ireland Capital Limited, as borrower, and AIG Parent, as lender (the AerCap Credit Facility) scheduled to mature in May 2019. The AerCap Credit Facility permits loans for general corporate purposes. At June 30, 2016, no amounts were outstanding under the AerCap Credit Facility.
(f) Excludes commitments with respect to pension plans. The remaining annual pension contribution for 2016 is expected to be approximately $17 million for U.S. and non-U.S. plans.
Arrangements with Variable Interest Entities
We enter into various arrangements with variable interest entities (VIEs) in the normal course of business, and we consolidate a VIE when we are the primary beneficiary of the entity. For a further discussion of our involvement with VIEs, see Note 7 to the Condensed Consolidated Financial Statements.
Indemnification Agreements
We are subject to financial guarantees and indemnity arrangements in connection with our sales of businesses. These arrangements may be triggered by declines in asset values, specified business contingencies, the realization of contingent liabilities, litigation developments, or breaches of representations, warranties or covenants provided by us. These arrangements are typically subject to time limitations, defined by contract or by operation of law, such as by prevailing statutes of limitation. Depending on the specific terms of the arrangements, the maximum potential obligation may or may not be subject to contractual limitations. For additional information regarding our indemnification agreements, see Note 9 to the Condensed Consolidated Financial Statements.
We have recorded liabilities for certain of these arrangements where it is possible to estimate them. These liabilities are not material in the aggregate. We are unable to develop a reasonable estimate of the maximum potential payout under some of these arrangements. Overall, we believe that it is unlikely we will have to make any material payments under these arrangements.

I TEM 2 / LIQUIDITY AND CAPITAL RESOURCES
182
Debt
The following table provides the rollforward of AIG’s total debt outstanding:
Balance at Maturities Effect of Balance at
Six Months Ended June 30, 2016 December 31, and Foreign Other June 30,
(in millions) 2015 Issuances Repayments Exchange Changes 2016
Debt issued or guaranteed by AIG:
AIG general borrowings:
Notes and bonds payable $ 17,047 $ 3,832 $ (960) $ (90) $ 10 $ 19,839
Junior subordinated debt 1,327 - (461) (10) 5 861
AIG Japan Holdings Kabushiki Kaisha 106 223 - 12 - 341
AIGLH notes and bonds payable 284 - (3) - - 281
AIGLH junior subordinated debt 420 - (60) - - 360
Total AIG general borrowings 19,184 4,055 (1,484) (88) 15 21,682
AIG borrowings supported by assets:(a)
MIP notes payable 1,372 - - 121 (16) 1,477
Series AIGFP matched notes and bonds payable 34 - - - 2 36
GIAs, at fair value 3,276 115 (260) - 244 (b) 3,375
Notes and bonds payable, at fair value 394 119 (145) - 4 (b) 372
Total AIG borrowings supported by assets 5,076 234 (405) 121 234 5,260
Total debt issued or guaranteed by AIG 24,260 4,289 (1,889) 33 249 26,942
Debt not guaranteed by AIG:
Other subsidiaries' notes, bonds, loans and
mortgages payable 2 2,035 (835) - - 1,202
Debt of consolidated investments(c) 4,987 364 (259) 15 78 (d) 5,185
Total debt not guaranteed by AIG 4,989 2,399 (1,094) 15 78 6,387
Total debt(e) $ 29,249 $ 6,688 $ (2,983) $ 48 $ 327 $ 33,329
(a) AIG Parent guarantees all such debt, except for MIP notes payable and Series AIGFP matched notes and bonds payable, which are direct obligations of AIG Parent. Collateral posted to third parties was $2.3 billion and $2.4 billion at June 30, 2016 and December 31, 2015, respectively. This collateral primarily consists of securities of the U.S. government and government sponsored entities and generally cannot be repledged or resold by the counterparties.
(b) Primarily represents adjustments to the fair value of debt.
(c) At June 30, 2016, includes debt of consolidated investment vehicles related to real estate investments of $2.7 billion, affordable housing partnership investments of $1.6 billion and other securitization vehicles of $845 million. At December 31, 2015, includes debt of consolidated investment vehicles related to real estate investments of $2.4 billion, affordable housing partnership investments of $1.5 billion and other securitization vehicles of $1.0 billion.
(d) Includes the effect of consolidating previously unconsolidated partnerships.
(e) Includes debt issuance costs of $92 million and $101 million at June 30, 2016 and December 31, 2015, respectively. See Note 2 to the Condensed Consolidated Financial Statements.

I TEM 2 / LIQUIDITY AND CAPITAL RESOURCES
183
TOTAL DEBT OUTSTANDING ( in mi l l ions)
Debt Maturities
The following table summarizes maturing debt at June 30, 2016 of AIG (excluding $5.2 billion of borrowings of consolidated investments) for the next four quarters:
Third Fourth First Second
Quarter Quarter Quarter Quarter
(in millions) 2016 2016 2017 2017 Total
AIG general borrowings $ - $ 308 $ - $ - $ 308
AIG borrowings supported by assets 202 372 29 659 1,262
Other subsidiaries' notes, bonds, loans and mortgages payable 575 - 313 314 1,202
Total $ 777 $ 680 $ 342 $ 973 $ 2,772

I TEM 2 / LIQUIDITY AND CAPITAL RESOURCES
184
The following table presents maturities of long-term debt (including unamortized original issue discounts and debt issuance cost, hedge accounting valuation adjustments and fair value adjustments, when applicable), excluding $5.2 billion in borrowings of consolidated investments:
June 30, 2016 Remainder Year Ending
(in millions) Total of 2016 2017 2018 2019 2020 2021 Thereafter
Debt issued or guaranteed by AIG:
AIG general borrowings:
Notes and bonds payable $ 19,839 $ 308 $ 178 $ 1,106 $ 997 $ 1,342 $ - $ 15,908
Junior subordinated debt 861 - - - - - - 861
AIG Japan Holdings Kabushiki Kaisha 341 - - - - 118 223 -
AIGLH notes and bonds payable 281 - - - - - - 281
AIGLH junior subordinated debt 360 - - - - - - 360
Total AIG general borrowings 21,682 308 178 1,106 997 1,460 223 17,410
AIG borrowings supported by assets:
MIP notes payable 1,477 273 804 400 - - - -
Series AIGFP matched notes and
bonds payable 36 - 10 - - - - 26
GIAs, at fair value 3,375 132 180 482 93 40 280 2,168
Notes and bonds payable, at fair value 372 169 9 122 - - - 72
Total AIG borrowings supported by assets 5,260 574 1,003 1,004 93 40 280 2,266
Total debt issued or guaranteed by AIG 26,942 882 1,181 2,110 1,090 1,500 503 19,676
Other subsidiaries' notes, bonds, loans
and mortgages payable 1,202 575 627 - - - - -
Total $ 28,144 $ 1,457 $ 1,808 $ 2,110 $ 1,090 $ 1,500 $ 503 $ 19,676
Credit Ratings
Credit ratings estimate a company’s ability to meet its obligations and may directly affect the cost and availability of financing to that company. The following table presents the credit ratings of AIG and certain of its subsidiaries as of July 28, 2016. Figures in parentheses indicate the relative ranking of the ratings within the agency’s rating categories; that ranking refers only to the major rating category and not to the modifiers assigned by the rating agencies.
Short-Term Debt Senior Long-Term Debt
Moody’s S&P Moody’s(a) S&P(b) Fitch(c)
AIG P-2 (2nd of 3) A-2 (2nd of 8) Baa 1 (4th of 9) A- (3rd of 8) BBB+ (4th of 9)
Stable Outlook Stable Outlook Negative Outlook Stable Outlook
AIG Financial Products Corp.(d) P-2 A-2 Baa 1 A- -
Stable Outlook Stable Outlook Negative Outlook
(a) Moody’s appends numerical modifiers 1, 2 and 3 to the generic rating categories to show relative position within the rating categories.
(b) S&P ratings may be modified by the addition of a plus or minus sign to show relative standing within the major rating categories.
(c) Fitch ratings may be modified by the addition of a plus or minus sign to show relative standing within the major rating categories.
(d) AIG guarantees all obligations of AIG Financial Products Corp.
These credit ratings are current opinions of the rating agencies. They may be changed, suspended or withdrawn at any time by the rating agencies as a result of changes in, or unavailability of, information or based on other circumstances. Ratings may also be withdrawn at our request.
We are party to some agreements that contain “ratings triggers.” Depending on the ratings maintained by one or more rating agencies, these triggers could result in (i) the termination or limitation of credit availability or a requirement for accelerated repayment, (ii) the termination of business contracts or (iii) a requirement to post collateral for the benefit of counterparties.

I TEM 2 / LIQUIDITY AND CAPITAL RESOURCES
185
In the event of adverse actions on our long-term debt ratings by the major rating agencies, AIGFP and certain other AIG entities would be required to post additional collateral under some derivative transactions or could experience termination of the transactions. Such requirements and terminations could adversely affect our business, our consolidated results of operations in a reporting period or our liquidity. In the event of a further downgrade of AIG’s long-term senior debt ratings, AIGFP and certain other AIG entities would be required to post additional collateral, and certain of the counterparties of AIGFP or of such other AIG entities would be permitted to terminate their contracts early.
The actual amount of collateral that we would be required to post to counterparties in the event of such downgrades, or the aggregate amount of payments that we could be required to make, depends on market conditions, the fair value of outstanding affected transactions and other factors prevailing at the time of the downgrade.
For a discussion of the effects of downgrades in the financial strength ratings of our insurance companies or our credit ratings, see Note 8 to the Condensed Consolidated Financial Statements herein and Part I, Item 1A. Risk Factors – Liquidity, Capital and Credit in our 2015 Annual Report.
Regulation and Supervision
For a discussion of our regulation and supervision by different regulatory authorities in the United States and abroad, including with respect to our liquidity and capital resources, see Item 1. Business — Regulation and Item 1A. Risk Factors — Regulation in our 2015 Annual Report and Item 2. MD&A – Regulatory Environment in this Quarterly Report on Form 10-Q.
Dividends and Repurchases of AIG Common Stock
On February 11, 2016, our Board of Directors declared a cash dividend on AIG Common Stock of $0.32 per share, payable on March 28, 2016 to shareholders of record on March 14, 2016. On May 2, 2016, our Board of Directors declared a cash dividend on AIG Common Stock of $0.32 per share, payable on June 27, 2016 to shareholders of record on June 13, 2016. On August 2, 2016, our Board of Directors declared a cash dividend on AIG Common Stock of $0.32 per share, payable on September 29, 2016 to shareholders of record on September 15, 2016. The payment of any future dividends will be at the discretion of our Board of Directors and will depend on various factors, including the regulatory framework applicable to us, as discussed further in Note 16 to the Consolidated Financial Statements in the 2015 Annual Report.
Our Board of Directors has authorized the repurchase of shares of AIG Common Stock through a series of actions. On August 2, 2016, our Board of Directors authorized an additional increase of $3.0 billion to the share repurchase authorization, resulting in an aggregate remaining authorization on such date of approximately $4.0 billion. Shares may be repurchased from time to time in the open market, private purchases, through forward, derivative, accelerated repurchase or automatic repurchase transactions or otherwise (including through the purchase of warrants). Certain of our share repurchases have been and may from time to time be effected through Exchange Act Rule 10b5-1 repurchase plans. The timing of any future share repurchases will depend on market conditions, our financial condition, results of operations, liquidity and other factors, including the regulatory framework applicable to us.
During the six-month period ended June 30, 2016, we repurchased approximately 113 million shares of AIG Common Stock for an aggregate purchase price of approximately $6.2 billion pursuant to this authorization, and we repurchased 15 million warrants to purchase shares of AIG Common Stock, for an aggregate purchase price of $263 million pursuant to this authorization. Pursuant to an Exchange Act Rule 10b5-1 repurchase plan, from July 1 to August 2, 2016, we have repurchased approximately $698 million of additional shares of AIG Common Stock.
Dividend Restrictions
Payments of dividends to AIG by its insurance subsidiaries are subject to certain restrictions imposed by regulatory authorities. See Note 18 to the Consolidated Financial Statements in the 2015 Annual Report for a discussion of restrictions on payments of dividends by our subsidiaries.

I TEM 2 / ENTERPRISE RISK MANAGEMENT
186
ENTERPRISE RISK MANAGEMENT
Risk management includes the identification and measurement of various forms of risk, the establishment of risk thresholds and the creation of processes intended to maintain risks within these thresholds while optimizing returns. We consider risk management an integral part of managing our core businesses and a key element of our approach to corporate governance.
Overview
We have an integrated process for managing risks throughout our organization in accordance with our firm-wide risk appetite. Our Board of Directors has oversight responsibility for the management of risk. Our Enterprise Risk Management (ERM) Department supervises and integrates the risk management functions in each of our business units, providing senior management with a consolidated view of the firm’s major risk positions. Within each business unit, senior leaders and executives approve risk-taking policies and targeted risk tolerance within the framework provided by ERM. ERM supports our businesses and management in the embedding of enterprise risk management in our key day-to-day business processes and in identifying, assessing, quantifying, managing, monitoring and reporting, and mitigating the risks taken by us and our businesses. Nevertheless, our risk management efforts may not always be successful and material adverse effects on our business, results of operations, cash flows, liquidity or financial condition may occur.
For a further discussion of AIG’s risk management program, see Part II, Item 7. MD&A ─ Enterprise Risk Management in the 2015 Annual Report.
Credit Risk Management
Overview
Credit risk is defined as the risk that our customers or counterparties are unable or unwilling to repay their contractual obligations when they become due. Credit risk may also result from a downgrade of a counterparty’s credit ratings or a widening of its credit spreads.
We devote considerable resources to managing our direct and indirect credit exposures. These exposures may arise from, but are not limited to, fixed income investments, equity securities, deposits, commercial paper investments, reverse repurchase agreements and repurchase agreements, corporate and consumer loans, leases, reinsurance recoverables, counterparty risk arising from derivatives activities, collateral extended to counterparties, insurance risk cessions to third parties, financial guarantees and letters of credit.
We monitor and control our company-wide credit risk concentrations and attempt to avoid unwanted or excessive risk accumulations, whether funded or unfunded. To minimize the level of credit risk in some circumstances, we may require mitigants, such as third-party guarantees, reinsurance or collateral, including commercial bank-issued letters of credit and trust collateral accounts. We treat these guarantees, reinsurance recoverables, and letters of credit as credit exposure and include them in our risk concentration exposure data. We also monitor closely the quality of any trust collateral accounts.
See Investments – Available for Sale Investments herein for further information on our credit concentrations and credit exposures.

I TEM 2 / ENTERPRISE RISK MANAGEMENT
187
Market Risk Management
Market risk is defined as the risk of adverse impact due to systemic movements in one or more of the following market risk drivers: equity and commodity prices, residential and commercial real estate values, interest rates, credit spreads, foreign exchange, inflation, and their levels of volatility.
We are engaged in a variety of insurance, investment and other financial services businesses that generate market risk, directly and indirectly. We are exposed to market risks primarily within our insurance and capital markets activities, on both the asset and liability side of our balance sheet through on and off-balance sheet exposures. The chief risk officer within each business is responsible for creating a framework to properly identify these risks, then ensuring that they are appropriately measured, monitored and managed in accordance with the risk governance framework established by the Chief Market Risk Officer (CMRO).
The scope and magnitude of our market risk exposures is managed under a robust framework that contains documented risk-taking authorities, defined risk limits and minimum standards for managing market risk in a manner consistent with our Risk Appetite Statement. Our market risk management framework focuses on quantifying the financial repercussions of changes in these broad market observables, as opposed to from the idiosyncratic risks associated with individual assets that are addressed through our credit risk management function.
Risk Identification
Market risk focuses on quantifying the financial repercussions of changes in broad, external, predominantly market observable risks. Financial repercussions can include an adverse impact on results of operations, financial condition, liquidity and capital.
Each of the following systemic risks is considered a market risk:
Equity prices. We are exposed to changes in equity market prices affecting a variety of instruments. Changes in equity prices can affect the valuation of publicly-traded equity shares, investments in private equity, hedge funds and mutual funds, exchange-traded funds, and other equity-linked capital market instruments as well as equity-linked insurance products, including but not limited to index annuities, variable annuities, universal life insurance and variable universal life insurance.
Residential and commercial real estate values. Our investment portfolios are exposed to the risk of changing values in a variety of residential and commercial real estate investments. Changes in residential/commercial real estate prices can affect the valuation of residential/commercial mortgages, residential/commercial mortgage-backed securities and other structured securities with underlying assets that include residential/commercial mortgages: trusts that include residential/commercial real estate and/or mortgages, residential mortgage insurance contracts and commercial real estate investments.
Interest rates. Interest rate risk can arise from a mismatch in the interest rate exposure of assets versus liabilities. Lower interest rates generally result in lower investment income and make certain of our product offerings less attractive to investors. Conversely, higher interest rates are typically beneficial for the opposite reasons. However, when rates rise quickly, there can be a temporary asymmetric GAAP accounting effect where the existing securities lose market value, which is largely reported in Other comprehensive income, and the offsetting decrease in the value of related liabilities may not be recognized. Changes in interest rates can affect the valuation of fixed maturity securities, financial liabilities, insurance contracts including but not limited to fixed rate annuities, variable annuities and derivative contracts.
Credit spreads. Credit spreads measure an instrument’s risk premium or yield relative to that of a comparable duration, default-free instrument. Changes in credit spreads can affect the valuation of fixed maturity securities, including but not limited to corporate bonds, ABS, mortgage-backed securities, AIG-issued debt obligations, credit derivatives and derivative credit valuation adjustments. Much like higher interest rates, wider credit spreads with unchanged default losses mean more investment income in the long-term. In the short term, quickly rising spreads will cause a loss in the value of existing fixed maturity securities, which is largely reported in Other comprehensive income. A precipitous rise in credit spreads may also signal a fundamental weakness in the credit-worthiness of bond obligors, potentially resulting in default losses.

I TEM 2 / ENTERPRISE RISK MANAGEMENT
188
Foreign exchange (FX) rates. We are a globally diversified enterprise with significant income, assets and liabilities denominated in, and significant capital deployed in, a variety of currencies. Changes in FX rates can affect the valuation of a broad range of balance sheet and income statement items as well as the settlement of cash flows exchanged in specific transactions.
Commodity Prices. Changes in commodity prices (the value of commodities) can affect the valuation of publicly-traded commodities, commodity indices and derivatives on commodities and commodity indices. We are exposed to commodity prices primarily through their impact on the prices and credit quality of commodity producers’ debt and equity securities in our investment portfolio.
Inflation. Changes in inflation can affect the valuation of fixed maturity securities, including AIG-issued debt obligations, derivatives and other contracts explicitly linked to inflation indices, and insurance contracts where the claims are linked to inflation either explicitly, via indexing, or implicitly, through medical costs or wage levels.
Risk Measurement
Our market risk measurement framework was developed with the main objective of communicating the range and scale of our market risk exposures. At the firm-wide level market risk is measured in a manner that is consistent with AIG’s Risk Appetite Statement. This is designed to ensure that we remain within our stated risk tolerance levels and can determine how much additional market risk taking capacity is available within our framework. Our risk appetite is currently defined in terms of capital and liquidity levels. At the market risk level, the framework measures our overall exposure to each systemic market risk change on an economic basis.
In addition, we continue to use enhanced economic, GAAP accounting and statutory capital-based risk measures at the market risk level, business-unit level and firm-wide levels. This process aims to ensure that we have a comprehensive view of the impact of our market risk exposures.
We use a number of approaches to measure our market risk exposure, including:
Sensitivity analysis. Sensitivity analysis measures the impact from a unit change in a market risk input. Examples of such sensitivities include a one basis point increase in yield on fixed maturity securities, a one basis point increase in credit spreads of fixed maturity securities, and a one percent increase in prices of equity securities.
Scenario analysis. Scenario analysis uses historical, hypothetical, or forward-looking macroeconomic scenarios to assess and report exposures. Examples of hypothetical scenarios include a 100 basis point parallel shift in the yield curve or a 20 percent immediate and simultaneous decrease in world-wide equity markets. Scenarios may also utilize a stochastic framework to arrive at a probability distribution of losses.
Stress testing. Stress testing is a special form of scenario analysis in which the scenarios are designed to lead to a material adverse outcome. Examples of such scenarios include the stock market crash of October 1987 or the widening of yields or spreads of RMBS or CMBS during 2008.

I TEM 2 / ENTERPRISE RISK MANAGEMENT
189
Market Risk Sensitivities
The following table provides estimates of our sensitivity to changes in yield curves, equity prices and foreign currency exchange rates:
Balance Sheet Exposure Balance Sheet Effect June 30, December 31, June 30, December 31, (dollars in millions) 2016 2015 2016 2015Sensitivity factor 100 bps parallel increase in all yield curvesInterest rate sensitive assets:
Fixed maturity securities 273,754 260,689 (16,273) (14,549)Mortgage and other loans receivable 23,802 18,878 (1,333) (1,092)Preferred stock 19 20 (2) (1)
Total interest rate sensitive assets $ 297,575 (a) $ 279,587 (a) $ (17,608) $ (15,642)Sensitivity factor 20% decline in stock prices and value of alternative investments Equity and alternative investments exposure:
Hedge funds 8,293 10,917 (1,659) (2,183)Private equity 6,680 7,233 (1,336) (1,447)Real estate investments 7,340 6,579 (1,468) (1,316)PICC Investment 600 2,239 (120) (448)Common equity 1,680 1,574 (336) (315)Aircraft asset investments 427 477 (85) (95)Other investments 527 472 (105) (94)
Total equity and alternative investments exposure $ 25,547 $ 29,491 $ (5,109) $ (5,898)
Sensitivity factor 10% depreciation of all foreign currency exchange rates against the U.S. dollar Foreign currency-denominated net asset position:
Japanese yen 2,274 1,745 (227) (174) Euro 2,062 2,053 (206) (205) Great Britain pound 1,991 2,158 (199) (216)
All other foreign currencies 3,579 4,703 (359) (471)Total foreign currency-denominated net
asset position(b) $ 9,906 $ 10,659 $ (991) $ (1,066)
(a) At June 30, 2016, the analysis covered $297.6 billion of $312.8 billion interest-rate sensitive assets. Excluded were $7.5 billion of loans and $3.6 billion of investments in life settlements. In addition, $4.1 billion of assets across various asset categories were excluded due to modeling limitations. At December 31, 2015, the analysis covered $279.6 billion of $298.7 billion interest-rate sensitive assets. Excluded were $10.7 billion of loans and $3.6 billion of investments in life settlements. In addition, $4.8 billion of assets across various asset categories were excluded due to modeling limitations.
(b) The majority of the foreign currency exposure is reported on a one quarter lag.
Foreign currency-denominated net asset position reflects our consolidated non-U.S. dollar assets less our consolidated non-U.S dollar liabilities on a GAAP basis. We use a bottom-up approach in managing our foreign currency exchange rate exposures with the objective of protecting statutory capital at the regulated insurance entity level. We manage cash flow risk on our foreign currency-denominated debt issued by AIG Parent and use a variety of techniques to mitigate this risk, including but not limited to the execution of cross-currency swaps and the issuance of new foreign currency-denominated debt to replace equivalent maturing debt. At the AIG Parent level, we monitor our foreign currency exposures against single currency and aggregate currency portfolio limits. As a matter of general practice, we do not typically hedge our foreign currency exposures to net investments in subsidiaries.
Our foreign currency-denominated net asset position at June 30, 2016, decreased by $753 million compared to December 31, 2015. The decrease was mostly due to a $1.3 billion decrease in our Hong Kong dollar position, primarily resulting from the

I TEM 2 / ENTERPRISE RISK MANAGEMENT
190
sale of our Non-Life Insurance Companies’ PICC Investment, partially offset by a $529 million increase in our Japanese yen position, primarily resulting from unrealized appreciation of investments.
For illustrative purposes, we modeled our sensitivities based on a 100 basis point increase in yield curves, a 20 percent decline in equities and alternative assets, and a 10 percent depreciation of all foreign currency exchange rates against the U.S. dollar. The estimated results presented in the table above should not be taken as a prediction, but only as a demonstration of the potential effects of such events.
Liquidity Risk Management
Liquidity risk is defined as the risk that our financial condition will be adversely affected by the inability or perceived inability to meet our short-term cash, collateral or other financial obligations. Failure to appropriately manage liquidity risk can result in insolvency, reduced operating flexibility, increased costs, reputational harm and regulatory action.
AIG and its legal entities seek to maintain sufficient liquidity during both the normal course of business and under defined liquidity stress scenarios to ensure that sufficient cash will be available to meet the obligations as they come due.
AIG liquidity risk tolerance levels are designed to allow it to meet its obligations over a twelve month horizon consistent with its risk appetite. We maintain target levels for required liquidity and/or minimum coverage ratios expected to ensure that our short-term financial obligations are met under varying market conditions. If we project that we will breach these tolerances, we will assess and determine appropriate liquidity management actions. However, the market conditions in effect at that time may not permit us to achieve an increase in liquidity sources or a reduction in liquidity requirements.
Risk Identification
The following sources of liquidity and funding risks could impact our ability to meet short-term financial obligations as they come due.
Market/Monetization Risk: Assets cannot be readily transformed into cash due to unfavorable market conditions. Market liquidity risk may limit our ability to sell assets at reasonable values to meet liquidity needs or cause us to realize losses exceeding our expectations.
Cash Flow Mismatch Risk: Discrete and cumulative cash flow mismatches or gaps over short-term horizons under both expected and adverse business conditions may create future liquidity shortfalls.
Event Funding Risk: Additional funding may be required as the result of a trigger event and may result from a downgrade in credit ratings, a market event, or some other event that creates a funding obligation or limits existing funding options.
Financing Risk: We may be unable to raise additional cash on a secured or unsecured basis due to unfavorable market conditions, AIG-specific issues, or any other issue that impedes access to additional funding.
Risk Measurement
Comprehensive cash flow projections under normal conditions are the primary component for identifying and measuring liquidity risk. We produce comprehensive liquidity projections over varying time horizons that incorporate all relevant liquidity sources and uses and include known and likely cash inflows and outflows. In addition, we perform stress testing by identifying liquidity stress scenarios and assessing the effects of these scenarios on our cash flow and liquidity.

I TEM 2 / ENTERPRISE RISK MANAGEMENT
191
We use a number of approaches to measure our liquidity risk exposure, including:
Target Liquidity Range: Target Liquidity Range specifies the amount of assets required to be maintained in specific liquidity portfolios to meet obligations as they arise over a twelve month horizon under stressed liquidity conditions.
Coverage Ratios: Coverage Ratios measure the adequacy of available liquidity sources, including the ability to monetize assets to meet the forecasted cash flows over a specified time horizon. The portfolio of potential assets to be monetized is selected based on our ability to convert those assets into cash under the assumed market conditions and within the specified time horizon.
Cash Flow Forecasts: Cash Flow Forecasts measure the liquidity needed for a specific legal entity over a specified time horizon.
Stress Testing: Coverage Ratios are re-measured under defined liquidity stress scenarios that will impact net cash flows, liquid assets and/or other funding sources.
Relevant liquidity reporting is produced and reported regularly to AIG Parent and business unit risk committees. The frequency, content, and nature of reporting will vary for each business unit and legal entity, based on its complexity, risk profile, activities and size.
CRITICAL ACCOUNTING ESTIMATES
The preparation of financial statements in accordance with GAAP requires the application of accounting policies that often involve a significant degree of judgment.
The accounting policies that we believe are most dependent on the application of estimates and assumptions, which are critical accounting estimates, are related to the determination of:
• income tax assets and liabilities, including recoverability of our net deferred tax asset and the predictability of future tax operating profitability of the character necessary to realize the net deferred tax asset;
• liability for unpaid losses and loss adjustment expenses;
• reinsurance assets;
• valuation of future policy benefit liabilities and timing and extent of loss recognition;
• valuation of liabilities for guaranteed benefit features of variable annuity products;
• estimated gross profits to value deferred acquisition costs for investment-oriented products;
• impairment charges, including other-than-temporary impairments on available for sale securities, impairments on other invested assets, including investments in life settlements, and goodwill impairment;
• liability for legal contingencies; and
• fair value measurements of certain financial assets and liabilities.

I TEM 2 / CRITICAL ACCOUNTING ESTIMATES
192
These accounting estimates require the use of assumptions about matters, some of which are highly uncertain at the time of estimation. To the extent actual experience differs from the assumptions used, our consolidated financial condition, results of operations and cash flows could be materially affected. For a complete discussion of our critical accounting estimates, you should read Part II, Item 7. MD&A — Critical Accounting Estimates in the 2015 Annual Report.
REGULATORY ENVIRONMENT
Our operations around the world are subject to regulation by many different types of regulatory authorities, including insurance, securities, derivatives, investment advisory and thrift regulators in the United States and abroad.
Our insurance subsidiaries are subject to regulation and supervision by the states and jurisdictions in which they do business. The insurance and financial services industries generally have been subject to heightened regulatory scrutiny and supervision in recent years.
On June 3, 2016, the Board of Governors of the Federal Reserve System (FRB) issued for public comment a notice of proposed rulemaking (NPR) on enhanced prudential standards that would require insurer nonbank SIFIs, such as AIG, to comply with a corporate governance and risk-management standard and a liquidity risk management standard. These proposed standards build on the FRB’s current guidance for large financial institutions supervised by the FRB and have been tailored to insurance companies. We are reviewing the proposals and analyzing how our current practices compare to those required by the NPR. We anticipate that the NPR will attract industry comment. Under the NPR, after the FRB evaluates all comments and adopts a final rule, the insurer nonbank SIFIs would have at least twelve months to comply.
On June 3, 2016, the FRB also released for public comment an advance notice of proposed rulemaking (ANPR) outlining two conceptual insurance group capital frameworks that could apply to insurance groups supervised by the FRB—a building block approach, proposed for insurance institutions that are savings and loan holding companies or bank holding companies by virtue of owning depository institutions, and a consolidated approach for insurer nonbank SIFIs, such as AIG. In general, the consolidated approach would consolidate an insurance company’s assets and insurance liabilities into risk segments tailored to account for the liability structure and unique features of the insurance company, apply risk factors to each segment and then set minimum capital requirements. The ANPR does not provide details on specific risk weights, risk factors, capital adequacy ratios and other important elements that could be applied to AIG under the consolidated approach, and we cannot predict how such an approach, if applied to AIG, would affect our business, results of operations, financial condition or capital requirements. We are currently reviewing the ANPR and expect it to be subject to significant industry comment.
On June 23, 2016, the UK held a referendum in which a majority voted for the UK to withdraw its membership in the EU, commonly referred to as Brexit. The referendum is advisory, and the terms of withdrawal are subject to a formal negotiation period that has not yet begun and could, by treaty, last up to two years. It is not clear at this stage (and may not be for some time) what form the UK’s future relationship with the remaining EU member states will take. We have significant operations and employees in the UK and other EU member states, including AIG Europe Ltd. (AEL), which enjoys certain benefits based on the UK’s membership in the EU. Depending on the final terms of the UK exit, we may be required to reorganize our operations and legal entity structure in the UK and the EU in a manner that could be less efficient and more expensive.
In addition to the information set forth in this Quarterly Report on Form 10-Q, our regulatory status is also discussed in Part I, Item 2. MD&A – Regulatory Environment and Part II, Item 1A. Risk Factors in the Quarterly Report on Form 10-Q for the quarterly period ended March 31, 2016 and in Part I, Item 1. Business – Regulation, Part I, Item 1A. Risk Factors – Regulation and Note 18 to the Consolidated Financial Statements in the 2015 Annual Report.

I TEM 2 / GLOSSARY
193
GLOSSARY
Accident year The annual calendar accounting period in which loss events occurred, regardless of when the losses are actually reported, booked or paid.
Accident year combined ratio, as adjusted The combined ratio excluding catastrophe losses and related reinstatement premiums, prior year development, net of premium adjustments, and the impact of reserve discounting.
Accident year loss ratio, as adjusted The loss ratio excluding catastrophe losses and related reinstatement premiums, prior year development, net of premium adjustments, and the impact of reserve discounting.
Acquisition ratio Acquisition costs divided by net premiums earned. Acquisition costs are those costs incurred to acquire new and renewal insurance contracts and also include the amortization of VOBA and DAC. Acquisition costs vary with sales and include, but are not limited to, commissions, premium taxes, direct marketing costs, certain costs of personnel engaged in sales support activities such as underwriting.
Base Spread Net investment income excluding income from alternative investments and enhancements, less interest credited excluding amortization of sales inducement assets.
Base Yield Net investment income excluding income from alternative investments and enhancements, as a percentage of average base invested asset portfolio, which excludes alternative investments, other bond securities and certain other investments for which the fair value option has been elected.
Book Value Per Common Share, Excluding AOCI and Book Value Per Common Share Excluding AOCI and DTA are non-GAAP measures and are used to show the amount of our net worth on a per-share basis. Book Value Per Common Share, Excluding AOCI is derived by dividing Total AIG shareholders’ equity, excluding AOCI, by Total common shares outstanding. Book Value Per Common Share, Excluding AOCI and DTA is derived by dividing Total AIG shareholders’ equity, excluding AOCI and DTA, by Total common shares outstanding.
Casualty insurance Insurance that is primarily associated with the losses caused by injuries to third persons, i.e., not the insured, and the legal liability imposed on the insured as a result.
Combined ratio Sum of the loss ratio and the acquisition and general operating expense ratios.
CSA Credit Support Annex A legal document generally associated with an ISDA Master Agreement that provides for collateral postings which could vary depending on ratings and threshold levels.
CVA Credit Valuation Adjustment The CVA adjusts the valuation of derivatives to account for nonperformance risk of our counterparty with respect to all net derivative assets positions. Also, the CVA reflects the fair value movement in AIGFP's asset portfolio that is attributable to credit movements only, without the impact of other market factors such as interest rates and foreign exchange rates. Finally, the CVA also accounts for our own credit risk in the fair value measurement of all derivative net liability positions and liabilities where AIG has elected the fair value option, when appropriate.
DAC Deferred Policy Acquisition Costs Deferred costs that are incremental and directly related to the successful acquisition of new business or renewal of existing business.
DAC Related to Unrealized Appreciation (Depreciation) of Investments An adjustment to DAC for investment-oriented products, equal to the change in DAC amortization that would have been recorded if fixed maturity and equity securities available for sale had been sold at their stated aggregate fair value and the proceeds reinvested at current yields (also referred to as “shadow DAC”).
Deferred Gain on Retroactive Reinsurance Retroactive reinsurance is a reinsurance contract in which an assuming entity agrees to reimburse a ceding entity for liabilities incurred as a result of past insurable events. If the amount of premium paid by the ceding reinsurer is less than the related ceded loss reserves, the resulting gain is deferred and amortized over the settlement period of the reserves. Any related development on the ceded loss reserves recoverable under the contract would increase the deferred gain if unfavorable, or decrease the deferred gain if favorable.
Expense ratio Sum of acquisition expenses and general operating expenses, divided by net premiums earned.
First-Lien Priority over all other liens or claims on a property in the event of default on a mortgage.

I TEM 2 / GLOSSARY
194
General operating expense ratio General operating expenses divided by net premiums earned. General operating expenses are those costs that are generally attributed to the support infrastructure of the organization and include but are not limited to personnel costs, projects and bad debt expenses. General operating expenses exclude losses and loss adjustment expenses incurred, acquisition expenses, and investment expenses.
GIC/GIA Guaranteed Investment Contract/Guaranteed Investment Agreement A contract whereby the seller provides a guaranteed repayment of principal and a fixed or floating interest rate for a predetermined period of time.
G-SII Global Systemically Important Insurer An insurer that is deemed globally systemically important (that is, of such size, market importance and global interconnectedness that the distress or failure of the insurer would cause significant dislocation in the global financial system and adverse economic consequences across a range of countries) by the Financial Stability Board, in consultation with and based on a methodology developed by the International Association of Insurance Supervisors.
IBNR Incurred But Not Reported Estimates of claims that have been incurred but not reported to us.
ISDA Master Agreement An agreement between two counterparties, which may have multiple derivative transactions with each other governed by such agreement, that generally provides for the net settlement of all or a specified group of these derivative transactions, as well as pledged collateral, through a single payment, in a single currency, in the event of a default on, or affecting any, one derivative transaction or a termination event affecting all, or a specified group of, derivative transactions.
LAE Loss Adjustment Expenses The expenses of settling claims, including legal and other fees and the portion of general expenses allocated to claim settlement costs.
Loss Ratio Losses and loss adjustment expenses incurred divided by net premiums earned. Loss adjustment expenses are directly attributed to settling and paying claims of insureds and include, but are not limited to, legal fees, adjuster’s fees, and claims department personnel costs.
Loss reserve development The increase or decrease in incurred losses and loss adjustment expenses as a result of the re-estimation of liability for unpaid losses and loss adjustment expenses at successive valuation dates for a given group of claims.
Loss reserves Liability for unpaid losses and loss adjustment expenses. The estimated ultimate cost of settling claims relating to insured events that have occurred on or before the balance sheet date, whether or not reported to the insurer at that date.
LTV Loan-to-Value Ratio Principal amount of loan amount divided by appraised value of collateral securing the loan.
Master netting agreement An agreement between two counterparties who have multiple derivative contracts with each other that provides for the net settlement of all contracts covered by such agreement, as well as pledged collateral, through a single payment, in a single currency, in the event of default on or upon termination of any one such contract.
Natural catastrophe losses are generally weather or seismic events having a net impact on AIG in excess of $10 million each. Catastrophes also include certain man-made events, such as terrorism and civil disorders that meet the $10 million threshold.
Net premiums written Represent the sales of an insurer, adjusted for reinsurance premiums assumed and ceded, during a given period. Net premiums earned are the revenue of an insurer for covering risk during a given period. Net premiums written are a measure of performance for a sales period, while Net premiums earned are a measure of performance for a coverage period.
Nonbank SIFI Nonbank Systemically Important Financial Institutions Financial institutions are deemed nonbank systemically important (that is, the failure of the financial institution could pose a threat to the financial stability of the United States) by the Financial Stability Oversight Council based on a three-stage analytical process.
Noncontrolling interest The portion of equity ownership in a consolidated subsidiary not attributable to the controlling parent company.
Operating revenue excludes Net realized capital gains (losses), income from non-operating litigation settlements (included in Other income for GAAP purposes) and changes in fair value of securities used to hedge guaranteed living benefits (included in Net investment income for GAAP purposes).
Policy fees An amount added to a policy premium, or deducted from a policy cash value or contract holder account, to reflect the cost of issuing a policy, establishing the required records, sending premium notices and other related expenses.

I TEM 2 / GLOSSARY
195
Pool A reinsurance arrangement whereby all of the underwriting results of the pool members are combined and then shared by each member in accordance with its pool participation percentage.
Premiums and deposits – Institutional Markets include direct and assumed amounts received and earned on group benefit policies and life-contingent payout annuities, and deposits received on investment-type annuity contracts, including GICs.
Premiums and deposits – Retirement and – Life include direct and assumed amounts received on traditional life insurance policies and group benefit policies, and deposits on life-contingent payout annuities, as well as deposits received on universal life, investment-type annuity contracts and mutual funds.
Prior year development Increase (referred to as unfavorable or adverse development or reserve strengthening) or decrease (referred to as favorable development) in estimates of losses and loss expenses for prior years that is included in earnings.
RBC Risk-Based Capital A formula designed to measure the adequacy of an insurer’s statutory surplus compared to the risks inherent in its business.
Reinstatement premium Additional premiums payable to reinsurers to restore coverage limits that have been exhausted as a result of reinsured losses under certain excess of loss reinsurance treaties.
Reinsurance The practice whereby one insurer, the reinsurer, in consideration of a premium paid to that insurer, agrees to indemnify another insurer, the ceding company, for part or all of the liability of the ceding company under one or more policies or contracts of insurance which it has issued.
Rescission Denial of claims and termination of coverage on loans related to fraudulent or undocumented claims, underwriting guideline violations and other deviations from contractual terms.
Retroactive Reinsurance See Deferred Gain on Retroactive Reinsurance.
Return on Equity – After-tax Operating Income Excluding AOCI and Return on Equity – After-tax Operating Income Excluding AOCI and DTA are non-GAAP measures and are used to show the rate of return on shareholders’ equity. Return on Equity – After-tax Operating Income Excluding AOCI is derived by dividing actual or annualized after-tax operating income attributable to AIG by average AIG shareholders’ equity, excluding average AOCI. Return on Equity – After-tax Operating Income Excluding AOCI and DTA is derived by dividing actual or annualized after-tax operating income attributable to AIG by average AIG shareholders’ equity, excluding average AOCI and DTA.
Salvage The amount that can be recovered by us for the sale of damaged goods for which our policyholder has been indemnified (and to which title was transferred to us).
Second-lien Subordinate in ranking to the first-lien holder claims on a property in the event of default on a mortgage.
Severe losses Individual non-catastrophe first party losses and surety losses greater than $10 million, net of related reinsurance and salvage and subrogation. Severe losses include claims related to satellite explosions, plane crashes, and shipwrecks.
SIA Sales Inducement Asset Represents enhanced crediting rates or bonus payments to contract holders on certain annuity and investment contract products that meet the criteria to be deferred and amortized over the life of the contract.
Solvency II Legislation in the European Union which reforms the insurance industry’s solvency framework, including minimum capital and solvency requirements, governance requirements, risk management and public reporting standards. The Solvency II Directive (2009/138/EEC) was adopted on November 25, 2009 and became effective on January 1, 2016.
Subrogation The amount of recovery for claims we have paid our policyholders, generally from a negligent third party or such party’s insurer.
Surrender charge A charge levied against an investor for the early withdrawal of funds from a life insurance or annuity contract, or for the cancellation of the agreement.
Surrender rate represents annualized surrenders and withdrawals as a percentage of average account value.
Unearned premium reserve Liabilities established by insurers and reinsurers to reflect unearned premiums, which are usually refundable to policyholders if an insurance or reinsurance contract is canceled prior to expiration of the contract term.
VOBA Value of Business Acquired Present value of projected future gross profits from in-force policies of acquired businesses.

I TEM 2 / ACRONYMS
196
ACRONYMS
ABS Asset-Backed Securities GMWB Guaranteed Minimum Withdrawal Benefits
CDO Collateralized Debt Obligations ISDA International Swaps and Derivatives Association, Inc.
CDS Credit Default Swap Moody's Moody's Investors’ Service Inc.
CMA Capital Maintenance Agreement NAIC National Association of Insurance Commissioners
CMBS Commercial Mortgage-Backed Securities NM Not Meaningful
FASB Financial Accounting Standards Board RMBS Residential Mortgage-Backed Securities
FRBNY Federal Reserve Bank of New York S&P Standard & Poor’s Financial Services LLC
GAAP Accounting principles generally accepted in the United States of America
SEC Securities and Exchange Commission
GMAB Guaranteed Minimum Accumulation Benefits VIE Variable Interest Entity
GMIB Guaranteed Minimum Income Benefits

I TEM 3 / QUANTITATIVE AND QUALITATIVE DISCLOSURES ABOUT MARKET RISK
197
ITEM 3. / QUANTITATIVE AND QUALITATIVE DISCLOSURES ABOUT MARKET RISK
Included in Part I, Item 2. Management's Discussion and Analysis of Financial Condition and Results of Operations – Enterprise Risk Management.
ITEM 4. / CONTROLS AND PROCEDURES
Disclosure controls and procedures are designed to ensure that information required to be disclosed in reports filed or submitted under the Securities Exchange Act of 1934 (the Exchange Act) is recorded, processed, summarized and reported within the time periods specified in SEC rules and forms and that such information is accumulated and communicated to management, including the Chief Executive Officer and Chief Financial Officer, to allow timely decisions regarding required disclosures. In connection with the preparation of this Quarterly Report on Form 10-Q, an evaluation was carried out by AIG’s management, with the participation of AIG’s Chief Executive Officer and Chief Financial Officer, of the effectiveness of AIG’s disclosure controls and procedures (as defined in Rules 13a-15(e) and 15d-15(e) under the Exchange Act). Based on that evaluation, AIG’s Chief Executive Officer and Chief Financial Officer have concluded that AIG’s disclosure controls and procedures were effective as of June 30, 2016.
There has been no change in AIG’s internal control over financial reporting (as defined in Rule 13a-15(f) under the Exchange Act) that occurred during the quarter ended June 30, 2016, that has materially affected, or is reasonably likely to materially affect, AIG’s internal control over financial reporting.

198
PART II – OTHER INFORMATION
ITEM 1 / LEGAL PROCEEDINGS
For a discussion of legal proceedings, see Note 9 to the Condensed Consolidated Financial Statements, which is incorporated herein by reference.
ITEM 1A./ RISK FACTORS
In addition to the other information set forth in this Quarterly Report on Form 10-Q, you should carefully consider the following risk factor as well as the other risk factors discussed in Part II, Item 1A. Risk Factors in our Quarterly Report on Form 10-Q for the quarterly period ended March 31, 2016 and in Part I, Item 1A. Risk Factors in our 2015 Annual Report.
Our foreign operations expose us to risks that may affect our operations. We provide insurance, investment and other financial products and services to both businesses and individuals in more than 100 countries and jurisdictions. A substantial portion of our business is conducted outside the United States, and we intend to continue to grow this business. Operations outside the United States may be affected by regional economic downturns, changes in foreign currency exchange rates, political upheaval, nationalization and other restrictive government actions, which could also affect our other operations.
The degree of regulation and supervision in foreign jurisdictions varies. AIG subsidiaries operating in foreign jurisdictions must satisfy local regulatory requirements and it is possible that local licenses may require AIG Parent to meet certain conditions. Licenses issued by foreign authorities to our subsidiaries are subject to modification and revocation. Consequently, our insurance subsidiaries could be prevented from conducting future business in some of the jurisdictions where they currently operate. Adverse actions from any single country could adversely affect our results of operations, depending on the magnitude of the event and our financial exposure at that time in that country.
On June 23, 2016, the UK held a referendum in which a majority voted for the UK to withdraw its membership in the EU, commonly referred to as Brexit. The referendum is advisory, and the terms of withdrawal are subject to a formal negotiation period that has not yet begun and could, by treaty, last up to two years. It is not clear at this stage (and may not be for some time) what form the UK’s future relationship with the remaining EU member states will take. We have significant operations and employees in the UK and other EU member states, including AEL, which enjoys certain benefits based on the UK’s membership in the EU. Depending on the final terms of the UK exit, we may be required to reorganize our operations and legal entity structure in the UK and the EU in a manner that could be less efficient and more expensive. Brexit has also affected the U.S. dollar/British pound exchange rate, increased the volatility of exchange rates among the Major Currencies, and created volatility in the financial markets, which may continue for some time.

199
ITEM 2 / UNREGISTERED SALES OF EQUITY SECURITIES AND USE OF PROCEEDS
The following table provides the information with respect to purchases made by or on behalf of AIG or any “affiliated purchaser” (as defined in Rule 10b-18(a)(3) under the Securities Exchange Act of 1934) of AIG Common Stock and warrants to purchase AIG Common Stock during the three months ended June 30, 2016:
Total Number Average Total Number of Shares Approximate Dollar Value of Shares
of Shares Price Paid Purchased as Part of Publicly that May Yet Be Purchased Under the
Period Repurchased per Share Announced Plans or Programs Plans or Programs (in millions)
April 1 - 30 15,118,335 $ 54.51 15,118,335 $ 3,826
May 1 - 31 17,199,663 56.09 17,199,663 2,772
June 1 - 30(a)
17,737,231 54.89 17,737,231 1,798(b)
Total(c)
50,055,229 $ 55.19 50,055,229 $ 1,798(b)
(a) During this period, we also repurchased 5 million warrants to purchase shares of AIG Common Stock, at an average purchase price per warrant of $18.00, for an aggregate purchase price of $90 million.
(b) Reflects the purchase of 5 million warrants to purchase shares of AIG Common Stock, which reduced the dollar value of AIG Common Stock that may yet be repurchased under the repurchase authorization.
(c) On August 2, 2016, our Board of Directors authorized an additional increase to the repurchase authorization of AIG Common Stock of $3.0 billion, resulting in an aggregate remaining authorization on such date of approximately $4.0 billion. Shares may be repurchased from time to time in the open market, private purchases, through forward, derivative, accelerated repurchase or automatic repurchase transactions or otherwise (including through the purchase of warrants). Certain of our share repurchases have been and may from time to time be effected through Exchange Act Rule 10b5-1 repurchase plans. The timing of any future share repurchases will depend on market conditions, our financial condition, results of operations, liquidity and other factors.
During the three-month period ended June 30, 2016, we repurchased approximately 50 million shares of AIG Common Stock under this authorization for an aggregate purchase price of approximately $2.8 billion. Pursuant to an Exchange Act Rule 10b5-1 plan, from July 1 to August 2, 2016, we have repurchased approximately $698 million of additional shares of AIG Common Stock. We also repurchased 5 million warrants to purchase shares of AIG Common Stock during the three-month period ended June 30, 2016 for an aggregate purchase price of $90 million.
ITEM 4 / MINE SAFETY DISCLOSURES
Not applicable.
ITEM 6 / EXHIBITS
See accompanying Exhibit Index.

200
SIGNATURES
Pursuant to the requirements of the Securities Exchange Act of 1934, the registrant has duly caused this report to be signed on its behalf by the undersigned thereunto duly authorized.
AMERICAN INTERNATIONAL GROUP, INC.
(Registrant)
/S/ SIDDHARTHA SANKARAN
Siddhartha Sankaran Executive Vice President Chief Financial Officer (Principal Financial Officer)
/S/ ELIAS F. HABAYEB Elias F. Habayeb Senior Vice President, Deputy Chief Financial Officer and Group Controller (Principal Accounting Officer)
Dated: August 2, 2016

201
EXHIBIT INDEX Exhibit
Number Description Location
4 Instruments defining the rights of security holders, including indentures
(1) Thirty-Third Supplemental Indenture, dated as of June 8, 2016, between AIG and The Bank of New York Mellon, as Trustee
Incorporated by reference to Exhibit 4.1 to AIG's Current Report on Form 8-K filed with the SEC on June 8, 2016 (File No. 1-8787).
(2) Form of the Notes (included in Exhibit 4(1))
10 (1) American International Group, Inc. 2012 Executive Severance Plan (as amended)*
Filed herewith.
(2) Amendment Letter to the Third Amended and Restated Credit Agreement, effective as of July 15, 2016, among AIG, the
subsidiary borrowers party thereto, the lenders party
thereto, JPMorgan Chase Bank, N.A., as Administrative
Agent, and each Several L/C Agent party thereto
Incorporated by reference to Exhibit 10.1 to AIG's Current Report on Form 8-K filed with the SEC on July 15, 2016 (File No. 1-8787).
11 Statement re: Computation of Per Share Earnings Included in Note 13 to the Condensed Consolidated Financial Statements.
12 Computation of Ratios of Earnings to Fixed Charges Filed herewith.
31 Rule 13a-14(a)/15d-14(a) Certifications Filed herewith.
32 Section 1350 Certifications** Filed herewith.
101 Interactive data files pursuant to Rule 405 of Regulation S-T: (i) the Condensed Consolidated Balance Sheets as of June 30, 2016 and December 31, 2015, (ii) the Condensed Consolidated Statements of Income for the three and six months ended June 30, 2016 and 2015, (iii) the Condensed Consolidated Statements of Equity for the three and six months ended June 30, 2016 and 2015, (iv) the Condensed Consolidated Statements of Cash Flows for the three and six months ended June 30, 2016 and 2015, (v) the Condensed Consolidated Statements of Comprehensive Income (Loss) for the three and six months ended June 30, 2016 and 2015 and (vi) the Notes to the Condensed Consolidated Financial Statements.
Filed herewith.
* This exhibit is a management contract or a compensatory plan or arrangement.
** This information is furnished and not filed for purposes of Sections 11 and 12 of the Securities Act of 1933 and Section 18 of the Securities Exchange Act of 1934.

202
COMPUTATION OF RATIOS OF EARNINGS TO FIXED CHARGES
Exhibit 12
Three Months Ended Six Months Ended June 30, June 30, (in millions, except ratios) 2016 2015 2016 2015Earnings: Pre-tax income(a): $ 2,725 $ 2,188 $ 2,771 $ 5,617
Add - Fixed charges 420 469 818 914Adjusted Pre-tax income $ 3,145 $ 2,657 $ 3,589 $ 6,531
Fixed charges: Interest expense $ 310 $ 306 $ 606 $ 619Portion of rent expense representing interest 36 44 55 89Interest credited to policy and contract holders 74 119 157 206
Total fixed charges $ 420 $ 469 $ 818 $ 914Total fixed charges, excluding interest credited to
policy and contract holders $ 346 $ 350 $ 661 $ 708Ratio of earnings to fixed charges 7.49 5.67 4.39 7.15Ratio of earnings to fixed charges, excluding interest
credited to policy and contract holders(b) 9.09 7.59 5.43 9.22
(a) From continuing operations, excluding undistributed earnings (loss) from equity method investments and capitalized interest.
(b) The Ratio of earnings to fixed charges, excluding interest credited to policy and contract holders, removes interest credited to guaranteed investment contract (GIC) policyholders and guaranteed investment agreement (GIA) contract holders. Such interest expenses are also removed from earnings used in this calculation. GICs and GIAs are entered into by our subsidiaries. The proceeds from GICs and GIAs are invested in a diversified portfolio of securities, primarily investment grade bonds. The assets acquired yield rates greater than the rates on the related policyholders obligation or contract, with the intent of earning a profit from the spread.

203
Exhibit 31
CERTIFICATIONS
I, Peter D. Hancock, certify that:
1. I have reviewed this Quarterly Report on Form 10-Q of American International Group, Inc.;
2. Based on my knowledge, this report does not contain any untrue statement of a material fact or omit to state a material fact necessary to make the statements made, in light of the circumstances under which such statements were made, not misleading with respect to the period covered by this report;
3. Based on my knowledge, the financial statements, and other financial information included in this report, fairly present in all material respects the financial condition, results of operations and cash flows of the registrant as of, and for, the periods presented in this report;
4. The registrant’s other certifying officer and I are responsible for establishing and maintaining disclosure controls and procedures (as defined in Exchange Act Rules 13a-15(e) and 15d-15(e)) and internal control over financial reporting (as defined in Exchange Act Rules 13a-15(f) and 15d-15(f)) for the registrant and have:
(a) Designed such disclosure controls and procedures, or caused such disclosure controls and procedures to be designed under our supervision, to ensure that material information relating to the registrant, including its consolidated subsidiaries, is made known to us by others within those entities, particularly during the period in which this report is being prepared;
(b) Designed such internal control over financial reporting, or caused such internal control over financial reporting to be designed under our supervision, to provide reasonable assurance regarding the reliability of financial reporting and the preparation of financial statements for external purposes in accordance with generally accepted accounting principles;
(c) Evaluated the effectiveness of the registrant’s disclosure controls and procedures and presented in this report our conclusions about the effectiveness of the disclosure controls and procedures, as of the end of the period covered by this report based on such evaluation; and
(d) Disclosed in this report any change in the registrant’s internal control over financial reporting that occurred during the registrant’s most recent fiscal quarter (the registrant’s fourth fiscal quarter in the case of an annual report) that has materially affected, or is reasonably likely to materially affect, the registrant’s internal control over financial reporting; and
5. The registrant’s other certifying officer and I have disclosed, based on our most recent evaluation of internal control over financial reporting, to the registrant’s auditors and the audit committee of the registrant’s board of directors (or persons performing the equivalent functions):
(a) All significant deficiencies and material weaknesses in the design or operation of internal control over financial reporting which are reasonably likely to adversely affect the registrant’s ability to record, process, summarize and report financial information; and
(b) Any fraud, whether or not material, that involves management or other employees who have a significant role in the registrant’s internal control over financial reporting.
Date: August 2, 2016
/S/ PETER D. HANCOCK Peter D. Hancock President and Chief Executive Officer
204
CERTIFICATIONS
I, Siddhartha Sankaran, certify that:
1. I have reviewed this Quarterly Report on Form 10-Q of American International Group, Inc.;
2. Based on my knowledge, this report does not contain any untrue statement of a material fact or omit to state a material fact necessary to make the statements made, in light of the circumstances under which such statements were made, not misleading with respect to the period covered by this report;
3. Based on my knowledge, the financial statements, and other financial information included in this report, fairly present in all material respects the financial condition, results of operations and cash flows of the registrant as of, and for, the periods presented in this report;
4. The registrant’s other certifying officer and I are responsible for establishing and maintaining disclosure controls and procedures (as defined in Exchange Act Rules 13a-15(e) and 15d-15(e)) and internal control over financial reporting (as defined in Exchange Act Rules 13a-15(f) and 15d-15(f)) for the registrant and have:
(a) Designed such disclosure controls and procedures, or caused such disclosure controls and procedures to be designed under our supervision, to ensure that material information relating to the registrant, including its consolidated subsidiaries, is made known to us by others within those entities, particularly during the period in which this report is being prepared;
(b) Designed such internal control over financial reporting, or caused such internal control over financial reporting to be designed under our supervision, to provide reasonable assurance regarding the reliability of financial reporting and the preparation of financial statements for external purposes in accordance with generally accepted accounting principles;
(c) Evaluated the effectiveness of the registrant’s disclosure controls and procedures and presented in this report our conclusions about the effectiveness of the disclosure controls and procedures, as of the end of the period covered by this report based on such evaluation; and
(d) Disclosed in this report any change in the registrant’s internal control over financial reporting that occurred during the registrant’s most recent fiscal quarter (the registrant’s fourth fiscal quarter in the case of an annual report) that has materially affected, or is reasonably likely to materially affect, the registrant’s internal control over financial reporting; and
5. The registrant’s other certifying officer and I have disclosed, based on our most recent evaluation of internal control over financial reporting, to the registrant’s auditors and the audit committee of the registrant’s board of directors (or persons performing the equivalent functions):
(a) All significant deficiencies and material weaknesses in the design or operation of internal control over financial reporting which are reasonably likely to adversely affect the registrant’s ability to record, process, summarize and report financial information; and
(b) Any fraud, whether or not material, that involves management or other employees who have a significant role in the registrant’s internal control over financial reporting.
Date: August 2, 2016
/S/ SIDDHARTHA SANKARAN Siddhartha Sankaran Executive Vice President and Chief Financial Officer

205
Exhibit 32
CERTIFICATION
In connection with this Quarterly Report on Form 10-Q of American International Group, Inc. (the “Company”) for the quarter ended June 30, 2016, as filed with the Securities and Exchange Commission on the date hereof (the “Report”), I, Peter D. Hancock, President and Chief Executive Officer of the Company, certify, pursuant to 18 U.S.C. Section 1350, that to my knowledge:
(1) The Report fully complies with the requirements of Section 13(a) or 15(d), as applicable, of the Securities Exchange Act of 1934; and
(2) The information contained in the Report fairly presents, in all material respects, the financial condition and results of operations of the Company.
Date: August 2, 2016
/S/ PETER D. HANCOCK Peter D. Hancock President and Chief Executive Officer
The foregoing certification is being furnished solely pursuant to 18 U.S.C. Section 1350 and is not being filed as part of the Report or as a separate disclosure document.

206
CERTIFICATION
In connection with this Quarterly Report on Form 10-Q of American International Group, Inc. (the “Company”) for the quarter ended June 30, 2016, as filed with the Securities and Exchange Commission on the date hereof (the “Report”), I, Siddhartha Sankaran, Executive Vice President and Chief Financial Officer of the Company, certify, pursuant to 18 U.S.C. Section 1350, that to my knowledge:
(1) The Report fully complies with the requirements of Section 13(a) or 15(d), as applicable, of the Securities Exchange Act of 1934; and
(2) The information contained in the Report fairly presents, in all material respects, the financial condition and results of operations of the Company.
Date: August 2, 2016
/S/ SIDDHARTHA SANKARAN Siddhartha Sankaran Executive Vice President and Chief Financial Officer
The foregoing certification is being furnished solely pursuant to 18 U.S.C. Section 1350 and is not being filed as part of the Report or as a separate disclosure document.