Embed Size (px)
Citation preview

UGANDACOUNTRY COFFEE PROFILE
UgandaTHE BIRTHPLACE OF
ROBUSTA COFFEE
Uganda Co�eeDevelopment Authority

Uganda Coffee Profileb
Uganda Coffee Profile 1
ICC-124-8 1
Uganda ICO Coffee Profile
COUNTRY COFFEE PROFILE UGANDA
UGANDACOFFEE PROFILE
UgandaTHE BIRTHPLACE OF
ROBUSTA COFFEE
Uganda Co�eeDevelopment Authority

Uganda Coffee Profile2
2 ICC-124-8
Uganda ICO Coffee Profile
CONTENTS Preface .......................................................................................................................... 7 Foreword .......................................................................................................................... 8 Summary ......................................................................................................................... 10 1. Background ................................................................................................................ 12 1.1. Geographical setting of the country .............................................................. 12 1.2. Economic setting ............................................................................................ 12 1.3 History of coffee in in the country ................................................................. 13 1.4 Geographic distribution of coffee production ............................................... 14 2. Coffee production ...................................................................................................... 16 2.1. Types of coffee and coffee-growing areas ..................................................... 16 2.2. Production systems ........................................................................................ 16 2.3. Coffee seasons ............................................................................................... 17 2.4. Smallholdings ................................................................................................. 17 2.5 Estate farms ................................................................................................... 17 2.6 Company farms .............................................................................................. 18 2.7 Yields .............................................................................................................. 18 2.8 Other characteristics of coffee growing ........................................................ 18 2.9 Volume of production .................................................................................... 18 2.10 Gender gap ..................................................................................................... 18 3. Production costs during the last five years ................................................................ 19 3.1. Establishment costs/initial investment .......................................................... 19 3.2. Crop losses due to pests and diseases ........................................................... 19 3.3. Crop losses due to adverse weather .............................................................. 20 4. Farmer’s income ........................................................................................................ 20 4.1. Farm gate prices ............................................................................................. 20 4.2. Net income by farm type ............................................................................... 21 5. Research and extension ............................................................................................. 21 5.1. Institutions responsible for research ............................................................. 21 5.2 Research on climate change and coffee ........................................................ 22 5.3 Organization of extension services ................................................................ 22 6. Coffee processing ....................................................................................................... 22 6.1 Field processing .............................................................................................. 22 6.2 Quality control ............................................................................................... 22

Uganda Coffee Profile 3
ICC-124-8 3
ICO Coffee Profile Uganda
7. Stakeholders in the coffee sector .............................................................................. 22 7.1 Farmers’ associations/cooperatives .............................................................. 22 7.2 National Coffee Authority .............................................................................. 22 7.3 Other government involvement .................................................................... 24 7.4 The private sector .......................................................................................... 24 7.5 Financial institutions ...................................................................................... 24 8. Marketing structure ................................................................................................... 24 8.1 Marketing channels ........................................................................................ 25 8.2 Farmers’ associations/cooperatives exporting coffee ................................... 26 8.3 Export taxes and duties levied on coffee ....................................................... 28 9. Coffee roasting and domestic consumption .............................................................. 29 9.1 Roasters and market size ............................................................................... 29 9.2 Distribution channels ..................................................................................... 29 9.3 Domestic coffee consumption ....................................................................... 29 10. Coffee exports performance ...................................................................................... 30 10.1 Volume and value of exports ......................................................................... 30 10.2 Exports by destination ................................................................................... 30 10.3 Shipping .......................................................................................................... 30 10.4 Exports of certified coffee .............................................................................. 30 10.5 Stocks ............................................................................................................. 31 11. Export regulations ...................................................................................................... 31 11.1 Regulations related to quality standard ........................................................ 31 11.2 Export duty and taxes .................................................................................... 31 11.3 Other levies .................................................................................................... 31 12. Macroeconomic aspects ............................................................................................ 31 12.1 Coffee and trade balance ............................................................................... 31 12.2 Share of coffee in Gross Domestic Product ................................................... 32 12.3 Employment generated by the coffee sector ................................................ 32 13. Environmental challenges .......................................................................................... 33 13.1 Impact of coffee production on the environment ......................................... 33 13.2 Contribution to carbon footprint ................................................................... 33 13.3 Environmentally sustainable coffee production ............................................ 33 14. Prospects for coffee production ................................................................................ 34

Uganda Coffee Profile4
4 ICC-124-8
Uganda ICO Coffee Profile
LIST OF ACRONYMS
ASSP Agriculture Sector Strategic Plan BCTB Black Coffee Twig Borer CAGR Compound Annual Growth Rate CBD Coffee Berry Disease CIF Cost Insurance and Freight CLR Coffee Leaf Rust CWDR Coffee Wilt Disease Resistant CY Coffee year EPRC Economic Policy Research Centre FOB Free on Board FOT Free on Truck GDP Gross Domestic Product GHA Gender Household Approach IACO Interafrican Coffee Organization ICC International Coffee Council ICO International Coffee Organization LDC Least Developed Country MAAIF Ministry of Agriculture, Animal Industry and Fisheries MoU Memorandum of Understanding NaCORI National Coffee Research Institute NARO National Agricultural Research Centre NCP National Coffee Policy NCS National Coffee Strategy NSC National Steering Committee SCA Specialty Coffee Association UCF Uganda Coffee Federation UCDA Uganda Coffee Development Authority UCP Uganda Coffee Platform UNBS Uganda National Bureau of Standards
Uganda Coffee Profile 5
4 ICC-124-8
Uganda ICO Coffee Profile
LIST OF ACRONYMS
ASSP Agriculture Sector Strategic Plan BCTB Black Coffee Twig Borer CAGR Compound Annual Growth Rate CBD Coffee Berry Disease CIF Cost Insurance and Freight CLR Coffee Leaf Rust CWDR Coffee Wilt Disease Resistant CY Coffee year EPRC Economic Policy Research Centre FOB Free on Board FOT Free on Truck GDP Gross Domestic Product GHA Gender Household Approach IACO Interafrican Coffee Organization ICC International Coffee Council ICO International Coffee Organization LDC Least Developed Country MAAIF Ministry of Agriculture, Animal Industry and Fisheries MoU Memorandum of Understanding NaCORI National Coffee Research Institute NARO National Agricultural Research Centre NCP National Coffee Policy NCS National Coffee Strategy NSC National Steering Committee SCA Specialty Coffee Association UCF Uganda Coffee Federation UCDA Uganda Coffee Development Authority UCP Uganda Coffee Platform UNBS Uganda National Bureau of Standards
ICC-124-8 5
ICO Coffee Profile Uganda
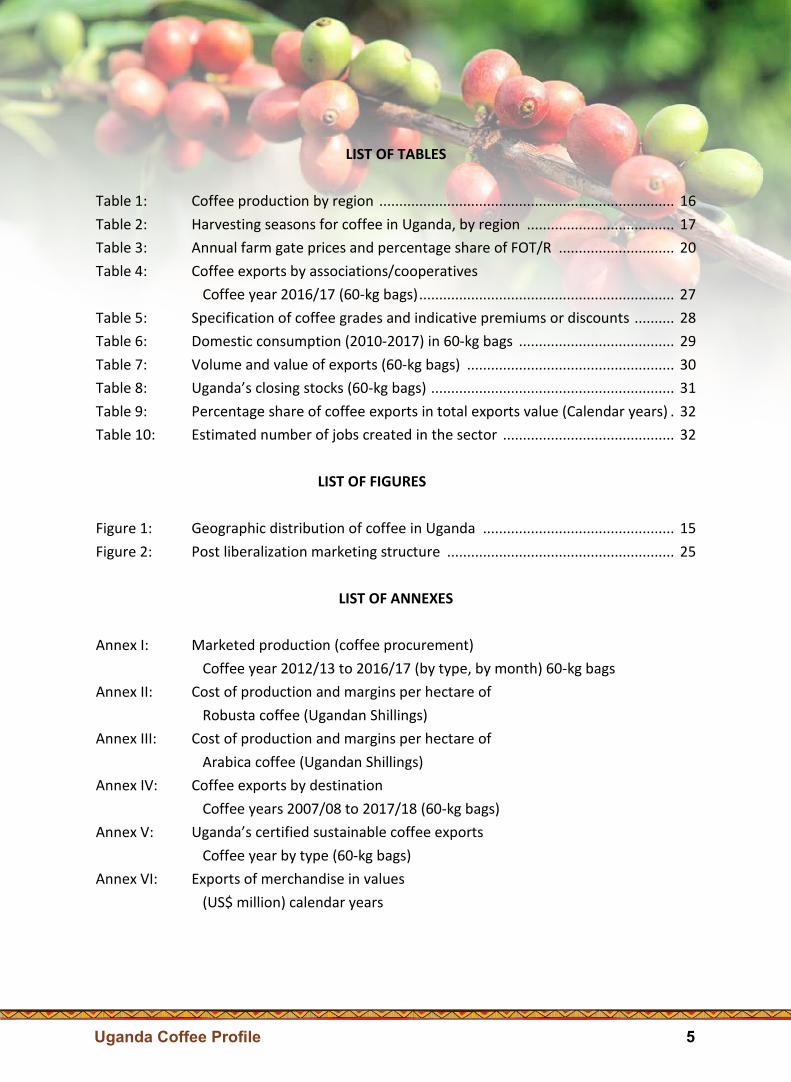
LIST OF TABLES
Table 1: Coffee production by region .......................................................................... 16 Table 2: Harvesting seasons for coffee in Uganda, by region ..................................... 17 Table 3: Annual farm gate prices and percentage share of FOT/R ............................. 20 Table 4: Coffee exports by associations/cooperatives Coffee year 2016/17 (60-kg bags) ................................................................ 27 Table 5: Specification of coffee grades and indicative premiums or discounts .......... 28 Table 6: Domestic consumption (2010-2017) in 60-kg bags ....................................... 29 Table 7: Volume and value of exports (60-kg bags) .................................................... 30 Table 8: Uganda’s closing stocks (60-kg bags) ............................................................. 31 Table 9: Percentage share of coffee exports in total exports value (Calendar years) . 32 Table 10: Estimated number of jobs created in the sector ........................................... 32
LIST OF FIGURES Figure 1: Geographic distribution of coffee in Uganda ................................................ 15 Figure 2: Post liberalization marketing structure ......................................................... 25
LIST OF ANNEXES Annex I: Marketed production (coffee procurement) Coffee year 2012/13 to 2016/17 (by type, by month) 60-kg bags Annex II: Cost of production and margins per hectare of Robusta coffee (Ugandan Shillings) Annex III: Cost of production and margins per hectare of Arabica coffee (Ugandan Shillings) Annex IV: Coffee exports by destination Coffee years 2007/08 to 2017/18 (60-kg bags) Annex V: Uganda’s certified sustainable coffee exports Coffee year by type (60-kg bags) Annex VI: Exports of merchandise in values (US$ million) calendar years

Uganda Coffee Profile6

Uganda Coffee Profile 7
6 ICC-124-8
Uganda ICO Coffee Profile
PREFACE
Despite recurrent fluctuations in world prices and the subsequent reduction in coffee production in many African countries, Uganda has successively managed to maintain coffee as the main engine of the national economy, exporting on average four million 60-kg bags per year. This is a demonstration that coffee remains the most important crop in Uganda, the birthplace of Robusta coffee. It’s worth remembering that coffee has played a role in Ugandan cultural practices, since it was traditionally used as a sign of friendship and hospitality. Sound liberalization and privatization policies undertaken by the Government in early 1990s has boosted the coffee sector through strong support to coffee growers as well as improving the business environment. I was therefore particularly pleased to receive a request from the Uganda Coffee Development Authority (UCDA) to prepare this country profile for Uganda.
The publication of a series of country profiles is one of the objectives of the International Coffee Agreement 2007, specifically collecting, disseminating and publishing economic, technical and scientific information, statistics and studies, as well as the results of research development in coffee matters. These objectives have been reinforced by the Five-year Action Plan approved by the International Coffee Council during its 120th Session held in Yamoussoukro (Côte d’Ivoire) in September 2017.
In this regard, Member countries have been provided with guidelines to be used as a framework for a comprehensive report on the coffee sector in specific countries. Therefore, these profiles are extremely important in improving the visibility of the world coffee economy and identifying key trade flows. They should also serve as a reference point from which policy can develop and further analysis can be undertaken.
I would like to thank Mr Perez S. Bukumunhe, Chairman of the Board of Directors of UCDA, and his technical staff for the preparation of this report. Thanks are also due to Dr Emmanuel L. Niyibigira, Managing Director of UCDA, for his continued and invaluable support to the work of the International Coffee Organization. It is my sincere hope that this profile will provide Members and other stakeholders with relevant information on the vibrant coffee sector of Uganda. Finally, the ICO Secretariat and I welcome any observations and suggestions that will contribute to improving future publications.
José Sette Executive Director International Coffee Organization

Uganda Coffee Profile8
ICC-124-8 7
ICO Coffee Profile Uganda
FOREWORD Global coffee production has seen a consistent growth in excess of 2% since the 1960s. Unfortunately, the consistent global growth has not been duplicated in the African region, where at a continental level production has been declining steadily at a rate averaging 2%, leading to Africa’s loss of global market share to close to 19% today. Globally, in terms of regional exports, the highest growth was in Asia, where exports tripled in the last 20 years. On the African continent, Uganda has experienced growth in the coffee industry, making it the largest exporter of coffee by volumes. Uganda is also the leading producer of Robusta and second largest producer of Arabica coffee, after Ethiopia, in Africa. Uganda grows 2 types of coffee: Robusta and Arabica in the ratio of 4:1. Arabica is grown at altitudes ranging between 1,300-2,300m above sea level; while Robusta is grown at altitudes ranging from 900-1,500m above sea level making Ugandan coffee to possess very good intrinsic qualities due to high altitude, soils and farming systems not easily found elsewhere in the world. Ugandan Robusta has a remarkably impressive cup when wet processed. It is commonly deemed to be of exceptional quality and retains its flavour qualities very well, which cannot always be said of other washed Robusta coffee. The variety of Wild Robusta Coffee still growing today in Uganda's rain forests is thought to be some of the rarest examples of naturally occurring coffee trees anywhere in the world. In Uganda, coffee remains among the traditional cash crops and is one of the foremost foreign exchange earners and the most important agricultural export, with a contribution of 19.1% to the total national formal export value in 2017. There is a huge opportunity for commercial coffee farming and other value addition opportunities in the coffee industry. Foreign investors can lease land for a period up to 99 years. Uganda, a natural habitat for coffee growing, offers a real opportunity for large-scale coffee production. A recently published report by IMARC Group forecasts the global instant coffee market as having grown at a CAGR of 3.6% during 2009-2016, worth US$9.9 billion, and it is expected to reach a value of US$13.1 billion by 2022, growing at a CAGR of 5% during the 2017-2022 period. The bulk of soluble coffee is derived from Robusta coffee, and Uganda is a large Robusta producer without its own soluble industry. Uganda is the only country in Africa with abundant raw materials: Robusta and Arabica coffee beans locally available throughout the year. Prevailing export prices offer enough margin to the soluble coffee plant to cover major costs for any intending investor in Uganda.
8 ICC-124-8
Uganda ICO Coffee Profile
This coffee profile is the result of coordinated work from a multidisciplinary team consisting of the public sector, institutional stakeholders of the coffee sector and coffee growers. It sets out to describe the economic and institutional underpinning of our coffee sector and was produced through cooperation between the sector’s various stakeholders in Uganda and the International Coffee Organization. It presents a description of the economic and institutional structure of our coffee sector and provides an overview of the sector in accordance with the country profile guidelines approved by the International Coffee Council (ICC) during its 116th Session in March 2016 in Addis Ababa, Ethiopia. In conclusion, I am happy and proud to note that this profile on the coffee sector of Uganda will be available to industry players both locally and at the international scene to grow the Uganda coffee value chain. Finally, on behalf of the Uganda Coffee Development Authority, I register my appreciation and gratitude to the Executive Director of the International Coffee Organization and his staff, as well as to all those who worked tirelessly to realise this publication. Any feedback on this maiden issue will enrich the publication of subsequent editions of this profile. Perez Bukumunhe Chairman, Board of Directors Uganda Coffee Development Authority

Uganda Coffee Profile 9
ICC-124-8 7
ICO Coffee Profile Uganda
FOREWORD Global coffee production has seen a consistent growth in excess of 2% since the 1960s. Unfortunately, the consistent global growth has not been duplicated in the African region, where at a continental level production has been declining steadily at a rate averaging 2%, leading to Africa’s loss of global market share to close to 19% today. Globally, in terms of regional exports, the highest growth was in Asia, where exports tripled in the last 20 years. On the African continent, Uganda has experienced growth in the coffee industry, making it the largest exporter of coffee by volumes. Uganda is also the leading producer of Robusta and second largest producer of Arabica coffee, after Ethiopia, in Africa. Uganda grows 2 types of coffee: Robusta and Arabica in the ratio of 4:1. Arabica is grown at altitudes ranging between 1,300-2,300m above sea level; while Robusta is grown at altitudes ranging from 900-1,500m above sea level making Ugandan coffee to possess very good intrinsic qualities due to high altitude, soils and farming systems not easily found elsewhere in the world. Ugandan Robusta has a remarkably impressive cup when wet processed. It is commonly deemed to be of exceptional quality and retains its flavour qualities very well, which cannot always be said of other washed Robusta coffee. The variety of Wild Robusta Coffee still growing today in Uganda's rain forests is thought to be some of the rarest examples of naturally occurring coffee trees anywhere in the world. In Uganda, coffee remains among the traditional cash crops and is one of the foremost foreign exchange earners and the most important agricultural export, with a contribution of 19.1% to the total national formal export value in 2017. There is a huge opportunity for commercial coffee farming and other value addition opportunities in the coffee industry. Foreign investors can lease land for a period up to 99 years. Uganda, a natural habitat for coffee growing, offers a real opportunity for large-scale coffee production. A recently published report by IMARC Group forecasts the global instant coffee market as having grown at a CAGR of 3.6% during 2009-2016, worth US$9.9 billion, and it is expected to reach a value of US$13.1 billion by 2022, growing at a CAGR of 5% during the 2017-2022 period. The bulk of soluble coffee is derived from Robusta coffee, and Uganda is a large Robusta producer without its own soluble industry. Uganda is the only country in Africa with abundant raw materials: Robusta and Arabica coffee beans locally available throughout the year. Prevailing export prices offer enough margin to the soluble coffee plant to cover major costs for any intending investor in Uganda.
8 ICC-124-8
Uganda ICO Coffee Profile
This coffee profile is the result of coordinated work from a multidisciplinary team consisting of the public sector, institutional stakeholders of the coffee sector and coffee growers. It sets out to describe the economic and institutional underpinning of our coffee sector and was produced through cooperation between the sector’s various stakeholders in Uganda and the International Coffee Organization. It presents a description of the economic and institutional structure of our coffee sector and provides an overview of the sector in accordance with the country profile guidelines approved by the International Coffee Council (ICC) during its 116th Session in March 2016 in Addis Ababa, Ethiopia. In conclusion, I am happy and proud to note that this profile on the coffee sector of Uganda will be available to industry players both locally and at the international scene to grow the Uganda coffee value chain. Finally, on behalf of the Uganda Coffee Development Authority, I register my appreciation and gratitude to the Executive Director of the International Coffee Organization and his staff, as well as to all those who worked tirelessly to realise this publication. Any feedback on this maiden issue will enrich the publication of subsequent editions of this profile. Perez Bukumunhe Chairman, Board of Directors Uganda Coffee Development Authority
8 ICC-124-8
Uganda ICO Coffee Profile
This coffee profile is the result of coordinated work from a multidisciplinary team consisting of the public sector, institutional stakeholders of the coffee sector and coffee growers. It sets out to describe the economic and institutional underpinning of our coffee sector and was produced through cooperation between the sector’s various stakeholders in Uganda and the International Coffee Organization. It presents a description of the economic and institutional structure of our coffee sector and provides an overview of the sector in accordance with the country profile guidelines approved by the International Coffee Council (ICC) during its 116th Session in March 2016 in Addis Ababa, Ethiopia. In conclusion, I am happy and proud to note that this profile on the coffee sector of Uganda will be available to industry players both locally and at the international scene to grow the Uganda coffee value chain. Finally, on behalf of the Uganda Coffee Development Authority, I register my appreciation and gratitude to the Executive Director of the International Coffee Organization and his staff, as well as to all those who worked tirelessly to realise this publication. Any feedback on this maiden issue will enrich the publication of subsequent editions of this profile. Perez Bukumunhe Chairman, Board of Directors Uganda Coffee Development Authority

Uganda Coffee Profile10
ICC-124-8 9
ICO Coffee Profile Uganda
SUMMARY Uganda, located in East Africa, lies across the Equator, about 800 kilometres inland from the Indian Ocean. It lies between 10 29’ South and 40 12’ North latitude, 290 34’ and 350 0’ East longitude. It has a total area of 241,551km2, of which 200,523 km2 is covered by land. The population of Uganda is currently estimated at 40,227,785 inhabitants. Uganda is sunny most of the year with temperatures rarely rising above 29° Celsius (84° Fahrenheit). The average annual temperature is about 26° Celsius (78° Fahrenheit). The rainy seasons are from March till May and October till November. Coffee accounts for the bulk of export revenues, contributing 15% of total goods exports. Uganda produces two types of coffee (Robusta and Arabica) in a ratio of 4:1. For Robusta, there are two varieties, Nganda and Erecta. High-yielding Clonal Robusta, which has yields almost four times greater than traditional varieties, is being planted to replace old diseased trees. For Arabica, there are a number of varieties, including SL 28 (high altitude), SL 14 (medium altitude), KP 423 (medium) and the traditional Nyasaland grown in the Mountain Elgon region, the Rwenzori Region and in the mountains of Zeu, in Zombo District (North-Western sub-Region). In Uganda, it is estimated that 1.7 million households grow coffee with a mean plot size of less than one acre. The proportion of female-headed coffee households is about 40%1 (680,000 females). The average yield is 232kg of clean coffee/acre for Traditional2 Robusta Coffee (573.3 kg/ha), 505kg/acre for improved3 farmers (1.2MT/ha) and 841kg/acre (2.1MT/ha) for Recommended4 farmers. The yield for Coffee Estates is 1,080 kg/acre5 (3.7 MT/ha). The initial cost of establishing one hectare of Robusta coffee is UGX2.3 million (US$627 at the current exchange rate) in year 1, UGX568,492 (US$427.5) in year 2, UGX3,010,430 (US$820.6) in year 3, UGX3,977,424 (US$1,084) in year 4 and UGX4,201,640 (US$1,145) in year 5. This translates into a total cost of UGX15,601,378 (US$4,252.5) over five years. The total revenue in the 3rd, 4th and 5th year is UGX20,853,000 (US$5,684) giving a net income of UGX5.25 million (US$1,431.1). 1 Quoted from unpublished report on the Pilot Coffee Farmers Registration exercise in Mukono and Buikwe Districts (2017). 2 A farmer who carries out basic agronomic practices exclusively use family labour and does not apply fertilizers (whether organic or inorganic) and neither uses any pest and disease management practices. 3 A farmer who significantly adopts recommended GAPs and also applies fertilizers as well as proper canopy management and effective pest and disease management. 4 Recommended farmer is one who adopts most GAPs and applies recommended amount of fertilizers (both inorganic and organic) and also carries out canopy management and pest and disease management. 5 Mugoya Tony (2017 Study Report “Establishing the Financial Viability of coffee farming in Uganda December 2017)” email:[email protected].

Uganda Coffee Profile 11
ICC-124-8 9
ICO Coffee Profile Uganda
SUMMARY Uganda, located in East Africa, lies across the Equator, about 800 kilometres inland from the Indian Ocean. It lies between 10 29’ South and 40 12’ North latitude, 290 34’ and 350 0’ East longitude. It has a total area of 241,551km2, of which 200,523 km2 is covered by land. The population of Uganda is currently estimated at 40,227,785 inhabitants. Uganda is sunny most of the year with temperatures rarely rising above 29° Celsius (84° Fahrenheit). The average annual temperature is about 26° Celsius (78° Fahrenheit). The rainy seasons are from March till May and October till November. Coffee accounts for the bulk of export revenues, contributing 15% of total goods exports. Uganda produces two types of coffee (Robusta and Arabica) in a ratio of 4:1. For Robusta, there are two varieties, Nganda and Erecta. High-yielding Clonal Robusta, which has yields almost four times greater than traditional varieties, is being planted to replace old diseased trees. For Arabica, there are a number of varieties, including SL 28 (high altitude), SL 14 (medium altitude), KP 423 (medium) and the traditional Nyasaland grown in the Mountain Elgon region, the Rwenzori Region and in the mountains of Zeu, in Zombo District (North-Western sub-Region). In Uganda, it is estimated that 1.7 million households grow coffee with a mean plot size of less than one acre. The proportion of female-headed coffee households is about 40%1 (680,000 females). The average yield is 232kg of clean coffee/acre for Traditional2 Robusta Coffee (573.3 kg/ha), 505kg/acre for improved3 farmers (1.2MT/ha) and 841kg/acre (2.1MT/ha) for Recommended4 farmers. The yield for Coffee Estates is 1,080 kg/acre5 (3.7 MT/ha). The initial cost of establishing one hectare of Robusta coffee is UGX2.3 million (US$627 at the current exchange rate) in year 1, UGX568,492 (US$427.5) in year 2, UGX3,010,430 (US$820.6) in year 3, UGX3,977,424 (US$1,084) in year 4 and UGX4,201,640 (US$1,145) in year 5. This translates into a total cost of UGX15,601,378 (US$4,252.5) over five years. The total revenue in the 3rd, 4th and 5th year is UGX20,853,000 (US$5,684) giving a net income of UGX5.25 million (US$1,431.1). 1 Quoted from unpublished report on the Pilot Coffee Farmers Registration exercise in Mukono and Buikwe Districts (2017). 2 A farmer who carries out basic agronomic practices exclusively use family labour and does not apply fertilizers (whether organic or inorganic) and neither uses any pest and disease management practices. 3 A farmer who significantly adopts recommended GAPs and also applies fertilizers as well as proper canopy management and effective pest and disease management. 4 Recommended farmer is one who adopts most GAPs and applies recommended amount of fertilizers (both inorganic and organic) and also carries out canopy management and pest and disease management. 5 Mugoya Tony (2017 Study Report “Establishing the Financial Viability of coffee farming in Uganda December 2017)” email:[email protected].
10 ICC-124-8
Uganda ICO Coffee Profile
The major actors in the coffee value chain range between researchers-seed suppliers-nursery operators-farmers (farmer organizations6)-traders-processors (processor & traders association7)-exporters (exporter association8) to Buyers Abroad-retail markets.
In terms of market channels, some farmers sell to small middlemen while others sell directly to coffee-buying storemen. Farmer organizations/cooperatives sell directly to exporters. However, many farmer organizations have become exporters themselves.
Agricultural research in Uganda is undertaken by the National Agricultural Research Organization (NARO) which is mandated to develop and release all new technologies, including coffee planting material. Under NARO, a National Coffee Research Institute (NaCORI) is responsible for biological research while socio-economic and policy research is conducted by the UCDA and the Economic Policy Research Centre (EPRC) respectively. Pests and diseases remain the main threats to coffee production in Uganda. Between 1997 and 2007, coffee wilt disease severely affected Robusta coffee trees in many producing areas in the country, causing accumulated losses estimated at US$580 million in ten years. An ICO-sponsored project amounting to US$8.9 million, which was implemented in seven African countries, contributed to alleviating the disease´s previous negative impact9. Through the project, considerable progress was made towards developing Robusta coffee varieties resistant to coffee wilt disease. However, the propagation and dissemination of these varieties to Robusta-growing regions remains a challenge
6 Major ones are NUCAFE (National Union of Coffee Agribusinesses and Farm Enterprises) and UCFA (Uganda Coffee Farmers Alliance). 7 Uganda Quality Coffee Processors and Traders Association (UQCPTA). 8 Uganda Coffee Federation (UCF), whose membership also includes banks, insurance companies, forwarders and shippers. 9 Following a request made by Uganda and other African countries affected, the ICO sent a consultant to assess the situation that resulted to a project proposal of US$8.9 million for seven countries (Uganda, Cameroon, Cote d’Ivoire, Democratic Republic of Congo, Ethiopia, Tanzania and Rwanda) over the period from October 2000 to December 2007.

Uganda Coffee Profile12
ICC-124-8 11
ICO Coffee Profile Uganda
1. BACKGROUND 1.1 Geographical setting of the country Uganda is located in East Africa and lies across the Equator, about 800 kilometres inland from the Indian Ocean. It lies between 10 29’ South and 40 12’ North latitude, and 290 34’, East and 350 0’ East longitude. The country is landlocked and bordered by Kenya in the East; South Sudan in the North; Democratic Republic of Congo in the West; Tanzania in the South; and Rwanda in South West. It has a total area of 241,551km2, of which the land area covers 200,523km2. The population of Uganda is currently 40,227,785 people. Children below the age of 18 years constitute 55% of the population, youths (18-30 years old) constitute a further 23% and the Age Dependency Ratio is 103%10. Uganda is sunny most of the year with temperatures rarely rising above 29° Celsius (84° Fahrenheit). The average annual temperature is about 26° Celsius (78° Fahrenheit). The rainy season is from March till May and October till November. Light rain season falls in November and December. Dry seasons are from December to February and June to August. Most of the areas receive between 750mm and 2,100mm of rain annually. The country has loamy soils with varying proportions of sand and clay. In addition, it has a varied vegetation, with tropical rain forest vegetation in the South and savannah woodlands and semi-arid vegetation in the North. Typically, the harvesting seasons for coffee vary according to the region (see section 2.3 below). 1.2 Economic setting Uganda has substantial natural resources, including fertile soils, regular rainfall, small deposits of copper, gold and other minerals, and recently discovered oil. Agriculture is the most important sector of the economy contributing 42% to GDP (MAAIF ASSP) and employing over two-thirds of Ugandans. Coffee accounts for the bulk of export revenues, contributing 15% to the country’s total exports. Though coffee farming is still dominated by small-scale producers, the government’s intention is to transform the economy from its current level to a middle income status by 2040 through agricultural transformation in what is termed as Uganda’s Vision 2040. The domestic currency in Uganda is the Uganda Shilling and was trading at Sh. 3,676 per dollar at the end of February 2019.
10 National Population and Housing Census 2014.
12 ICC-124-8
Uganda ICO Coffee Profile
1.3 History of coffee in the country Coffee is the oldest, most significant commercial agricultural commodity and major foreign exchange earner, contributing an annual average of 15%11 to Uganda’s total export revenue in the last ten years. Uganda is the fourth largest Robusta producer in the world, after Vietnam, Brazil and Indonesia. Some Arabica is also grown in different highland areas of the country, most notably on the slopes of Mount Elgon on the border with Kenya and on the slopes of the Mount Rwenzori, popularly known as the ‘Mountains of the Moon’, on the border with the Democratic Republic of the Congo. Some Arabica coffee is also grown in the West Nile region in the northwestern part of the country. Uganda is the origin of Robusta coffee, which was cultivated along the Lake Victoria crescent. While the milder Arabica varieties originated in Ethiopia, the Robusta species are indigenous to the Nganda regions of Uganda. Wild varieties are still found in the foothills of the Rwenzori Mountains in western Uganda, where they are harvested as a specialty ECO coffee and marketed as the "Kibaale wild". Robusta makes up 80% (by weight) of the coffee exported by Uganda. Arabicas came late to East Africa, introduced from Malawi (then Nyasaland) in the early 1920s, long after they had become an established crop in Central and South America. In the equatorial heat, Arabica coffee requires cool, moist and higher altitudes, so the bushes thrive on Uganda's mountain fringes, on Mount Elgon in the East and on the Rwenzoris and West Nile (Nebbi and Okoro Districts) on the border with Congo. The main varieties are SL14, SL28, KP162, KP423 and the Bugisu local. Arabica is from Bugisu, on the western slopes of Mount Elgon region, where it was first introduced in 1912. It grows as high as 2,300 metres. There are plans to extend Arabicas into the lowland Robusta areas using newly developed varieties. Robusta, which is native to the humid rainforests on the Western borders of Uganda, is grown at altitudes of 1,200 to 1,500 meters above sea level throughout the country. As a result of the high altitudes at which it is grown, it is often classed amongst the world’s finest Robusta coffees. By 1914, European and Asian farmers had established 135 plantations, occupying 58,000 acres of land, but the crop was abandoned when prices fell in the 1920s. It was left to African smallholders to continue growing coffee, though at first the acreage was insignificant. By 1931, only 17,000 acres were under cultivation. The Coffee Board was set up in 1929, later becoming the Coffee Industry Board in 1943 and then the Coffee Marketing Board in 1959. The colonial government, eager to see the development of a cash crop economy, divided the country into agro-ecological zones, each specializing in particular
11 Statistics Department, Bank of Uganda (https://www.bou.or.ug/bou/rates_statistics/Statistics_overview.html).

Uganda Coffee Profile 13
ICC-124-8 11
ICO Coffee Profile Uganda
1. BACKGROUND 1.1 Geographical setting of the country Uganda is located in East Africa and lies across the Equator, about 800 kilometres inland from the Indian Ocean. It lies between 10 29’ South and 40 12’ North latitude, and 290 34’, East and 350 0’ East longitude. The country is landlocked and bordered by Kenya in the East; South Sudan in the North; Democratic Republic of Congo in the West; Tanzania in the South; and Rwanda in South West. It has a total area of 241,551km2, of which the land area covers 200,523km2. The population of Uganda is currently 40,227,785 people. Children below the age of 18 years constitute 55% of the population, youths (18-30 years old) constitute a further 23% and the Age Dependency Ratio is 103%10. Uganda is sunny most of the year with temperatures rarely rising above 29° Celsius (84° Fahrenheit). The average annual temperature is about 26° Celsius (78° Fahrenheit). The rainy season is from March till May and October till November. Light rain season falls in November and December. Dry seasons are from December to February and June to August. Most of the areas receive between 750mm and 2,100mm of rain annually. The country has loamy soils with varying proportions of sand and clay. In addition, it has a varied vegetation, with tropical rain forest vegetation in the South and savannah woodlands and semi-arid vegetation in the North. Typically, the harvesting seasons for coffee vary according to the region (see section 2.3 below). 1.2 Economic setting Uganda has substantial natural resources, including fertile soils, regular rainfall, small deposits of copper, gold and other minerals, and recently discovered oil. Agriculture is the most important sector of the economy contributing 42% to GDP (MAAIF ASSP) and employing over two-thirds of Ugandans. Coffee accounts for the bulk of export revenues, contributing 15% to the country’s total exports. Though coffee farming is still dominated by small-scale producers, the government’s intention is to transform the economy from its current level to a middle income status by 2040 through agricultural transformation in what is termed as Uganda’s Vision 2040. The domestic currency in Uganda is the Uganda Shilling and was trading at Sh. 3,676 per dollar at the end of February 2019.
10 National Population and Housing Census 2014.
12 ICC-124-8
Uganda ICO Coffee Profile
1.3 History of coffee in the country Coffee is the oldest, most significant commercial agricultural commodity and major foreign exchange earner, contributing an annual average of 15%11 to Uganda’s total export revenue in the last ten years. Uganda is the fourth largest Robusta producer in the world, after Vietnam, Brazil and Indonesia. Some Arabica is also grown in different highland areas of the country, most notably on the slopes of Mount Elgon on the border with Kenya and on the slopes of the Mount Rwenzori, popularly known as the ‘Mountains of the Moon’, on the border with the Democratic Republic of the Congo. Some Arabica coffee is also grown in the West Nile region in the northwestern part of the country. Uganda is the origin of Robusta coffee, which was cultivated along the Lake Victoria crescent. While the milder Arabica varieties originated in Ethiopia, the Robusta species are indigenous to the Nganda regions of Uganda. Wild varieties are still found in the foothills of the Rwenzori Mountains in western Uganda, where they are harvested as a specialty ECO coffee and marketed as the "Kibaale wild". Robusta makes up 80% (by weight) of the coffee exported by Uganda. Arabicas came late to East Africa, introduced from Malawi (then Nyasaland) in the early 1920s, long after they had become an established crop in Central and South America. In the equatorial heat, Arabica coffee requires cool, moist and higher altitudes, so the bushes thrive on Uganda's mountain fringes, on Mount Elgon in the East and on the Rwenzoris and West Nile (Nebbi and Okoro Districts) on the border with Congo. The main varieties are SL14, SL28, KP162, KP423 and the Bugisu local. Arabica is from Bugisu, on the western slopes of Mount Elgon region, where it was first introduced in 1912. It grows as high as 2,300 metres. There are plans to extend Arabicas into the lowland Robusta areas using newly developed varieties. Robusta, which is native to the humid rainforests on the Western borders of Uganda, is grown at altitudes of 1,200 to 1,500 meters above sea level throughout the country. As a result of the high altitudes at which it is grown, it is often classed amongst the world’s finest Robusta coffees. By 1914, European and Asian farmers had established 135 plantations, occupying 58,000 acres of land, but the crop was abandoned when prices fell in the 1920s. It was left to African smallholders to continue growing coffee, though at first the acreage was insignificant. By 1931, only 17,000 acres were under cultivation. The Coffee Board was set up in 1929, later becoming the Coffee Industry Board in 1943 and then the Coffee Marketing Board in 1959. The colonial government, eager to see the development of a cash crop economy, divided the country into agro-ecological zones, each specializing in particular
11 Statistics Department, Bank of Uganda (https://www.bou.or.ug/bou/rates_statistics/Statistics_overview.html).

Uganda Coffee Profile14
ICC-124-8 13
ICO Coffee Profile Uganda
crops: tobacco in Acholi (Kitgum and Gulu), cotton in West Nile and coffee in the central region. In the 1950s, extension workers promoted a coffee-planting campaign that saw production reach two million 60-kg bags by the early 1960s, and more than three million by 1969/70. The subsequent years of civil strife in Uganda saw economic life stagnate and coffee production fall back. The National Resistance Movement (NRM) government returned some stability to the country after taking power in 1986, but the collapse of the International Coffee Agreement three years later prompted world prices to crash to a little more than half their previous level. Prices recovered briefly following the frost in June 1994, which destroyed much of the Brazilian crop for that and the following year. Ugandan production increased in response to higher prices, with exports reaching four million bags in 1995-96 and 1996-97. In the 2013/14 coffee year, 3.6 million bags of coffee were exported. Current levels of production place Uganda about 8th in total world production of coffee and 3rd, after Vietnam and Indonesia, in Robusta exports. 1.4 Geographic distribution of coffee production Coffee is grown in five areas: the Central, Western, South-Western, Northern and Eastern regions. The last one comprises Busoga regions (Robusta) and Mountain Elgon region (Arabica). The Northern Region comprises the Mid-North (Robusta) and North-Western region (Arabica & Robusta). The South-western and Western regions produce both Robusta and Arabica (Figure 1). For Robusta, there are two varieties, Nganda and Erecta. High-yielding Clonal Robusta Coffee, which yields almost four times as much as traditional varieties, is being planted to replace old and diseased trees. For Arabica, there are a number of varieties, SL 28 (high altitude), SL 14 (medium altitude), KP 423 (medium) and the traditional Nyasaland grown in Mountain Elgon region, Rwenzori Region and in the mountains of Zeu in Zombo District.

Uganda Coffee Profile 15
ICC-124-8 13
ICO Coffee Profile Uganda
crops: tobacco in Acholi (Kitgum and Gulu), cotton in West Nile and coffee in the central region. In the 1950s, extension workers promoted a coffee-planting campaign that saw production reach two million 60-kg bags by the early 1960s, and more than three million by 1969/70. The subsequent years of civil strife in Uganda saw economic life stagnate and coffee production fall back. The National Resistance Movement (NRM) government returned some stability to the country after taking power in 1986, but the collapse of the International Coffee Agreement three years later prompted world prices to crash to a little more than half their previous level. Prices recovered briefly following the frost in June 1994, which destroyed much of the Brazilian crop for that and the following year. Ugandan production increased in response to higher prices, with exports reaching four million bags in 1995-96 and 1996-97. In the 2013/14 coffee year, 3.6 million bags of coffee were exported. Current levels of production place Uganda about 8th in total world production of coffee and 3rd, after Vietnam and Indonesia, in Robusta exports. 1.4 Geographic distribution of coffee production Coffee is grown in five areas: the Central, Western, South-Western, Northern and Eastern regions. The last one comprises Busoga regions (Robusta) and Mountain Elgon region (Arabica). The Northern Region comprises the Mid-North (Robusta) and North-Western region (Arabica & Robusta). The South-western and Western regions produce both Robusta and Arabica (Figure 1). For Robusta, there are two varieties, Nganda and Erecta. High-yielding Clonal Robusta Coffee, which yields almost four times as much as traditional varieties, is being planted to replace old and diseased trees. For Arabica, there are a number of varieties, SL 28 (high altitude), SL 14 (medium altitude), KP 423 (medium) and the traditional Nyasaland grown in Mountain Elgon region, Rwenzori Region and in the mountains of Zeu in Zombo District.
14 ICC-124-8
Uganda ICO Coffee Profile
Figure 1: Geographic distribution of coffee in Uganda
14 ICC-124-8
Uganda ICO Coffee Profile
Figure 1: Geographic distribution of coffee in Uganda

Uganda Coffee Profile16
ICC-124-8 15
ICO Coffee Profile Uganda
2. Coffee production Coffee is produced by an estimated 1.7 million coffee farmers from 108 districts. The altitude ranges from 800 to 1,400 meters above sea level for Robusta and 2,300 to 6,000 metres above sea level for Arabica. The high altitude, especially for Ugandan Robusta, makes it very unique and characterised by intrinsic quality characteristics/attributes. Sustainable and specialty12 coffees are being sold to niche markets at high premiums compared to conventional grades. 2.1 Types of coffee and of coffee-growing areas There are two types of coffee grown in Uganda, Robusta and Arabica, in the ratio of 4:1. Table 1 shows coffee acreage, number of trees and number of coffee households by region. By 2014, the total tree stock was 295 million trees covering an acreage of 353,907ha. Uganda is in the process of carrying out a coffee farmers’ registration that will ascertain the actual acreage under coffee and the tree density.
Table 1: Coffee production by region
Region Area in ha Number of trees
Trees in production
Number of households (hh) Trees/hh Percentage
Western 79,773 94,155,423 61,342,735 265,144 231 23%
Eastern 77,709 86,332,784 73,305,543 486,079 151 22%
Northern 19,886 27,498,178 20,519,580 92,336 222 6%
Central 136,247 151,082,141 109,993,307 611,782 180 38%
South-West 40,292 49,549,569 29,430,081 258,182 114 11%
Total 353,907 408,618,095 294,591,246 1,713,523 238 100%
Source: UCDA 2.2 Production Systems In Uganda, apart from a few coffee plantations which are monocrop, the rest of the farms are mixed where coffee is intercropped with bananas and beans in what is referred to as the coffee banana zone. A very small proportion (0.1%) of farms use irrigation. Shade-grown coffee is being promoted under the Rainforest Alliance initiative spearheaded by Kyagalanyi Coffee Ltd, a member of the Volcafe Group.
12 Specialty coffee premium is based on the cup quality as assessed by the SCA scale.
16 ICC-124-8
Uganda ICO Coffee Profile
2.3 Coffee seasons Planting is normally between March and May (first rains) and September to November (second rains). In Northern Uganda, the region experiences one long rainy season from March to August. The harvesting seasons alternate as main and minor harvest depending on whether the region is in the Northern or Southern hemisphere (see Table 2).
Table 2: Harvesting seasons for coffee in Uganda, by region.
Regions Oct. Nov. Dec. Jan Feb. Mar. Apr. May Jun. Jul. Aug. Sep.
Central Main crop
(Robusta) Fly crop (Robusta)
Masaka Fly crop (robusta)
Main crop (Robusta)
Eastern Main crop
(Robusta) Fly crop (Robusta)
Bugisu/sebei Main crop
(Arabica) Fly crop (Arabica)
Western
Fly crop (Robusta)
Main crop (Robusta)
Fly crop (Arabica)
Main crop (Arabica)
West nile Main crop (Arabica)
Fly crop (Arabica)
Source: UCDA website (www.ugandacoffee.go.ug 2.4 Smallholdings In Uganda, it is estimated that 1.7 million households grow coffee with a mean plot size of less than one acre. The proportion of female headed coffee households is about 40%13 (680,000 females) . 2.5 Estate farms Uganda boasts of a number of estate farms led by the Kaweri Coffee Plantation in Mubende District, which has an area of 2,500ha under Robusta coffee. Others include Dr Ian Clark’s farm in Kabarole District, with 320 acres of Robusta. Estate farms are estimated to account for about 5% of the total area under coffee.
13 Quoted from unpublished report on the Pilot Coffee Farmers Registration exercise in Mukono and Buikwe Districts (2017).

Uganda Coffee Profile 17
ICC-124-8 15
ICO Coffee Profile Uganda
2. Coffee production Coffee is produced by an estimated 1.7 million coffee farmers from 108 districts. The altitude ranges from 800 to 1,400 meters above sea level for Robusta and 2,300 to 6,000 metres above sea level for Arabica. The high altitude, especially for Ugandan Robusta, makes it very unique and characterised by intrinsic quality characteristics/attributes. Sustainable and specialty12 coffees are being sold to niche markets at high premiums compared to conventional grades. 2.1 Types of coffee and of coffee-growing areas There are two types of coffee grown in Uganda, Robusta and Arabica, in the ratio of 4:1. Table 1 shows coffee acreage, number of trees and number of coffee households by region. By 2014, the total tree stock was 295 million trees covering an acreage of 353,907ha. Uganda is in the process of carrying out a coffee farmers’ registration that will ascertain the actual acreage under coffee and the tree density.
Table 1: Coffee production by region
Region Area in ha Number of trees
Trees in production
Number of households (hh) Trees/hh Percentage
Western 79,773 94,155,423 61,342,735 265,144 231 23%
Eastern 77,709 86,332,784 73,305,543 486,079 151 22%
Northern 19,886 27,498,178 20,519,580 92,336 222 6%
Central 136,247 151,082,141 109,993,307 611,782 180 38%
South-West 40,292 49,549,569 29,430,081 258,182 114 11%
Total 353,907 408,618,095 294,591,246 1,713,523 238 100%
Source: UCDA 2.2 Production Systems In Uganda, apart from a few coffee plantations which are monocrop, the rest of the farms are mixed where coffee is intercropped with bananas and beans in what is referred to as the coffee banana zone. A very small proportion (0.1%) of farms use irrigation. Shade-grown coffee is being promoted under the Rainforest Alliance initiative spearheaded by Kyagalanyi Coffee Ltd, a member of the Volcafe Group.
12 Specialty coffee premium is based on the cup quality as assessed by the SCA scale.
16 ICC-124-8
Uganda ICO Coffee Profile
2.3 Coffee seasons Planting is normally between March and May (first rains) and September to November (second rains). In Northern Uganda, the region experiences one long rainy season from March to August. The harvesting seasons alternate as main and minor harvest depending on whether the region is in the Northern or Southern hemisphere (see Table 2).
Table 2: Harvesting seasons for coffee in Uganda, by region.
Regions Oct. Nov. Dec. Jan Feb. Mar. Apr. May Jun. Jul. Aug. Sep.
Central Main crop
(Robusta) Fly crop (Robusta)
Masaka Fly crop (robusta)
Main crop (Robusta)
Eastern Main crop
(Robusta) Fly crop (Robusta)
Bugisu/sebei Main crop
(Arabica) Fly crop (Arabica)
Western
Fly crop (Robusta)
Main crop (Robusta)
Fly crop (Arabica)
Main crop (Arabica)
West nile Main crop (Arabica)
Fly crop (Arabica)
Source: UCDA website (www.ugandacoffee.go.ug 2.4 Smallholdings In Uganda, it is estimated that 1.7 million households grow coffee with a mean plot size of less than one acre. The proportion of female headed coffee households is about 40%13 (680,000 females) . 2.5 Estate farms Uganda boasts of a number of estate farms led by the Kaweri Coffee Plantation in Mubende District, which has an area of 2,500ha under Robusta coffee. Others include Dr Ian Clark’s farm in Kabarole District, with 320 acres of Robusta. Estate farms are estimated to account for about 5% of the total area under coffee.
13 Quoted from unpublished report on the Pilot Coffee Farmers Registration exercise in Mukono and Buikwe Districts (2017).

Uganda Coffee Profile18
ICC-124-8 17
ICO Coffee Profile Uganda
2.6 Company farms Kaweri Coffee Plantation is a Neumann Foundation investment. It has created 200 permanent jobs. 2.7 Yields The average yield is 232kg of clean coffee/acre for traditional14 Robusta coffee (573.3 kg/ha), 505kg/acre for improved15 farmers (1.2 MT/ha) and 841kg/acre (2.1MT/ha) for Recommended16 farmers . The yield for coffee estates is 1,080kg/acre17[3.7 MT/ha]. 2.8 Other characteristics of coffee growing Inorganic fertilizer use is extremely low, although use of organic fertilizers (farmyard manure) is relatively higher. This justifies the increasing number of farmers who are certified as organic or Fairtrade farmers. Nonetheless, the proportion of farmers who are using inorganic fertilizers is changing. 2.9 Volume of Production Coffee procurement i.e. coffee that is procured by exporters and graded into exportable green coffee, is used as a proxy for production. Annex I shows the monthly coffee procurement by exporters. There is an increase of 29% from 3.9 million 60-kg bags procured in crop year 2012/13 to 5.0 million bags in crop Year 2016/17. This was on account of coffee that was planted in crop year 2013/14 and started yielding in 2016/17, coupled with favourable weather during the year. 2.10 Gender Gap Most Ugandan farmers are ‘bibanja’ holders i.e. they have land holdings that basically belonging to a landlord and are obligated to pay a small rental fee to the latter. Some households have started using the Gender Household Approach (GHA) which addresses gender equity at the household level. This is however practiced in a few districts and has not
14 A farmer who carries out basic agronomic practices exclusively use family labour and does not apply fertilizers (whether organic or inorganic) and neither uses any pest and disease management practices. 15 A farmer who significantly adopts recommended GAPs and also applies fertilizers as well as proper canopy management and effective pest and disease management. 16 Recommended farmer is one who adopts most GAPs and applies recommended amount of fertilizers (both inorganic and organic) and also carries out canopy management and pest and disease management. 17 Mugoya Tony Study Report “Establishing the Financial Viability of coffee farming in Uganda (December 2017)” email:[email protected].
18 ICC-124-8
Uganda ICO Coffee Profile
yet been rolled out in other coffee-growing areas. Due to the government’s intervention, females are also receiving coffee seedlings and now own their coffee plots, as recorded in the pilot districts of Mukono and Buikwe. 3.0 Production costs during the last five years 3.1 Establishment costs/initial investment Appendix 2 shows the cost of production of Robusta coffee. The initial cost of establishing 1 hectare of Robusta coffee is UGX2.3 million (US$627 at the current exchange rate) in year 1, UGX568,492 (US$427.5) in year 2, UGX3,010,430 (US$820.6) in year 3, UGX3,977,424 (US$1,084) in year 4 and UGX4,201,640 (US$1,145) in year 5. This translates into a total cost of UGX15,601,378 (US$4,252.5) over five years. The total revenue in the 3rd, 4th and 5th year is UGX20,853,000 (US$5,684), giving a net income of UGX5.25 million (US$1,431.1). The next five-year production cycle’s costs will be lower, since only maintenance costs and application of agro-inputs will be borne by the farmer. In the 7th year, the trees would be stumped and will start yielding again in the 9th year. For Arabica, the costs and margins are shown in Appendix 3. Detailed annual production costs are shown in Appendices 2 and 3. 3.2 Crop losses due to pests and diseases Pests and diseases remain the main threats to coffee production in Uganda. Between 1997 and 2007 coffee wilt disease severely affected Robusta coffee trees in many producing areas in the country, causing accumulated losses estimated at US$580 million. The ICO-sponsored project with total value of US$8.9 million implemented in seven African countries contributed to alleviating the previous negative impact of the disease18. Through the project, considerable progress was made towards developing Robusta coffee varieties resistant to coffee wilt disease. However, the propagation and dissemination of these varieties to the Robusta-growing regions remain a challenge. Black coffee twig borer is another threat to coffee production in Uganda as its incidence has been registered at 8.6% of coffee farms, causing a loss of 40% in affected areas. Financial losses were estimated at US$40.1 million in 2014. Following a concern expressed by the head of the Ugandan delegation regarding the outbreak of the black coffee twig borer, the International Coffee Council approved Resolution Number 453 at its 111th Session in September 2013, which calls on members of the international community, through relevant
18 Following a request made by Uganda and other African countries affected, the ICO sent a consultant to assess the situation that resulted in a project proposal of US$8.9 million dollar for seven countries, namely Uganda, Cameroon, Cote d’Ivoire, Democratic Republic of the Congo, Ethiopia, Tanzania and, Rwanda over the period from October 2000 to December 2007.

Uganda Coffee Profile 19
ICC-124-8 17
ICO Coffee Profile Uganda
2.6 Company farms Kaweri Coffee Plantation is a Neumann Foundation investment. It has created 200 permanent jobs. 2.7 Yields The average yield is 232kg of clean coffee/acre for traditional14 Robusta coffee (573.3 kg/ha), 505kg/acre for improved15 farmers (1.2 MT/ha) and 841kg/acre (2.1MT/ha) for Recommended16 farmers . The yield for coffee estates is 1,080kg/acre17[3.7 MT/ha]. 2.8 Other characteristics of coffee growing Inorganic fertilizer use is extremely low, although use of organic fertilizers (farmyard manure) is relatively higher. This justifies the increasing number of farmers who are certified as organic or Fairtrade farmers. Nonetheless, the proportion of farmers who are using inorganic fertilizers is changing. 2.9 Volume of Production Coffee procurement i.e. coffee that is procured by exporters and graded into exportable green coffee, is used as a proxy for production. Annex I shows the monthly coffee procurement by exporters. There is an increase of 29% from 3.9 million 60-kg bags procured in crop year 2012/13 to 5.0 million bags in crop Year 2016/17. This was on account of coffee that was planted in crop year 2013/14 and started yielding in 2016/17, coupled with favourable weather during the year. 2.10 Gender Gap Most Ugandan farmers are ‘bibanja’ holders i.e. they have land holdings that basically belonging to a landlord and are obligated to pay a small rental fee to the latter. Some households have started using the Gender Household Approach (GHA) which addresses gender equity at the household level. This is however practiced in a few districts and has not
14 A farmer who carries out basic agronomic practices exclusively use family labour and does not apply fertilizers (whether organic or inorganic) and neither uses any pest and disease management practices. 15 A farmer who significantly adopts recommended GAPs and also applies fertilizers as well as proper canopy management and effective pest and disease management. 16 Recommended farmer is one who adopts most GAPs and applies recommended amount of fertilizers (both inorganic and organic) and also carries out canopy management and pest and disease management. 17 Mugoya Tony Study Report “Establishing the Financial Viability of coffee farming in Uganda (December 2017)” email:[email protected].
18 ICC-124-8
Uganda ICO Coffee Profile
yet been rolled out in other coffee-growing areas. Due to the government’s intervention, females are also receiving coffee seedlings and now own their coffee plots, as recorded in the pilot districts of Mukono and Buikwe. 3.0 Production costs during the last five years 3.1 Establishment costs/initial investment Appendix 2 shows the cost of production of Robusta coffee. The initial cost of establishing 1 hectare of Robusta coffee is UGX2.3 million (US$627 at the current exchange rate) in year 1, UGX568,492 (US$427.5) in year 2, UGX3,010,430 (US$820.6) in year 3, UGX3,977,424 (US$1,084) in year 4 and UGX4,201,640 (US$1,145) in year 5. This translates into a total cost of UGX15,601,378 (US$4,252.5) over five years. The total revenue in the 3rd, 4th and 5th year is UGX20,853,000 (US$5,684), giving a net income of UGX5.25 million (US$1,431.1). The next five-year production cycle’s costs will be lower, since only maintenance costs and application of agro-inputs will be borne by the farmer. In the 7th year, the trees would be stumped and will start yielding again in the 9th year. For Arabica, the costs and margins are shown in Appendix 3. Detailed annual production costs are shown in Appendices 2 and 3. 3.2 Crop losses due to pests and diseases Pests and diseases remain the main threats to coffee production in Uganda. Between 1997 and 2007 coffee wilt disease severely affected Robusta coffee trees in many producing areas in the country, causing accumulated losses estimated at US$580 million. The ICO-sponsored project with total value of US$8.9 million implemented in seven African countries contributed to alleviating the previous negative impact of the disease18. Through the project, considerable progress was made towards developing Robusta coffee varieties resistant to coffee wilt disease. However, the propagation and dissemination of these varieties to the Robusta-growing regions remain a challenge. Black coffee twig borer is another threat to coffee production in Uganda as its incidence has been registered at 8.6% of coffee farms, causing a loss of 40% in affected areas. Financial losses were estimated at US$40.1 million in 2014. Following a concern expressed by the head of the Ugandan delegation regarding the outbreak of the black coffee twig borer, the International Coffee Council approved Resolution Number 453 at its 111th Session in September 2013, which calls on members of the international community, through relevant
18 Following a request made by Uganda and other African countries affected, the ICO sent a consultant to assess the situation that resulted in a project proposal of US$8.9 million dollar for seven countries, namely Uganda, Cameroon, Cote d’Ivoire, Democratic Republic of the Congo, Ethiopia, Tanzania and, Rwanda over the period from October 2000 to December 2007.

Uganda Coffee Profile20
ICC-124-8 19
ICO Coffee Profile Uganda
cooperation mechanisms, to offer assistance to the affected countries by, among other things, technical knowledge, exchange of information, best practices and management of the pest. 3.3 Crop losses due to adverse weather The major manifestation of adverse weather is drought, which affects yields and farm incomes and leads to an increase in poverty levels. For example, the poverty levels of subsistence farmers who reported farming as a major source of income increased from 23% in the 2012/13 to 36% in 2016/17 on account of severe drought and associated pests like army worms. Recent report indicates that the pest is devastating food crops in many coffee-producing countries in Africa, including Malawi, Uganda, Kenya, Tanzania and Angola19. 4. Farmer’s income 4.1 Farmgate prices
Table 3: Annual farmgate prices and percentage share of FOT/R20 price
Month
Annual average
exchange rate
UGX/US$
Robusta Kiboko
(US$/Kilo)
Robusta FAQ
(US $/Kg)
Arabica Parchment
(US$/Kg)
Robusta weighted
export price
(US$/Kg
Arabica weighted
export price
(US$/Kg
Percentage of farm gate price to FOB (export) price
Robusta Arabica21
CY 2009/10 2,076.23 0.57 1.14 1.79 1.39 2.42 75 74
CY 2010/11 2,436.93 0.77 1.58 3.05 1.98 3.86 71 79
CY 2011/12 2,502.32 0.74 1.58 2.38 1.96 3.42 69 70
CY 2012/13 2,612.33 0.79 1.58 1.66 1.9 2.39 76 69
CY 2013/14 2,548.63 0.65 1.47 1.98 1.74 2.36 68 84
CY 2014/15 3,053.62 0.71 1.41 2.03 1.77 2.78 73 73
CY-2015/16 3,406.20 0.65 1.30 1.51 1.53 1.95 77 77
CY-2016/17 3,589.29 0.65 1.39 1.73 1.86 2.36 64 73
CY 2017/18 3,699.41 0.58 1.31 1.52 1.68 2.49 63 77
Source: Computed from data from UCDA database and Bank of Uganda
19 FAO, Sustainable management of the fall Army worm in Africa, 2017. 20 FOT/R-Free on Truck/Rail Kampala/Mbale (Inland ports). 21 To obtain the clean coffee equivalent, the parchment price for Arabica is divided by 0.8 (out-turn from dry parchment to clean coffee and for Robusta, the Kiboko (unprocessed coffee) is divided by 0.55 (the average outturn from Kiboko coffee) to FAQ.
20 ICC-124-8
Uganda ICO Coffee Profile
4.2 Net income by farm type Net income is UGX5.25 million for Clonal Robusta per hectare (after five years) and UGX1.78 million/ha for Arabica (also after five years). Refer to Annex II and III. 5. Research and Extension Agricultural research in Uganda is undertaken by the National Agricultural Research Organization (NARO), which is mandated to develop and release all new technologies, including coffee planting material. 5.1 Institutions responsible for research The National Coffee Research Institute (NaCORI) under NARO is responsible for biological research, while socio-economic and policy research is conducted by the UCDA and the Economic Policy Research Centre (EPRC). NaCORI has developed tenb Coffee Wilt Disease Resistant (CWDr) lines that have been released to be multiplied by specific farmers under the supervision of the UCDA and NaCORI. During the CWDr mapping exercise carried out in October 2017, the mother gardens established which had started yielding were 167. The number of established CWDR mother gardens is more than 400 currently. Research programmes include:
• Enhancing availability of planting materials-establishment of a coffee tissue culture and molecular laboratory.
• Variety development-expansion of CWDr-mother garden at NaCORI, Kituza; expanding capacity to generate Arabica seeds and seedlings; determination of molecular characteristics of CWDr lines; determination of morphological diversity of close to 300 Robusta coffee germplasm materials; development and promotion of Arabica coffee varieties with desired quality and resistance to Coffee Leaf Rust (CLR) and Coffee Berry Disease (CBD) .
• Pests and Disease management-profiling Black Coffee Twig Borer (BCTB) infestation by altitude and slope orientation; BCTB infestation in nurseries; determination of optimum application rates and frequencies of selected pesticides for managing BCTB and other coffee pests.
• Promotion of technologies and Innovations-BCTB IPM package; availing extension materials to clients; training lead farmers and provision of Coffee Season Management Calendar in different regions.
• Evaluation of competitiveness of coffee enterprises in the mid-eastern (Busoga) region.

Uganda Coffee Profile 21
ICC-124-8 19
ICO Coffee Profile Uganda
cooperation mechanisms, to offer assistance to the affected countries by, among other things, technical knowledge, exchange of information, best practices and management of the pest. 3.3 Crop losses due to adverse weather The major manifestation of adverse weather is drought, which affects yields and farm incomes and leads to an increase in poverty levels. For example, the poverty levels of subsistence farmers who reported farming as a major source of income increased from 23% in the 2012/13 to 36% in 2016/17 on account of severe drought and associated pests like army worms. Recent report indicates that the pest is devastating food crops in many coffee-producing countries in Africa, including Malawi, Uganda, Kenya, Tanzania and Angola19. 4. Farmer’s income 4.1 Farmgate prices
Table 3: Annual farmgate prices and percentage share of FOT/R20 price
Month
Annual average
exchange rate
UGX/US$
Robusta Kiboko
(US$/Kilo)
Robusta FAQ
(US $/Kg)
Arabica Parchment
(US$/Kg)
Robusta weighted
export price
(US$/Kg
Arabica weighted
export price
(US$/Kg
Percentage of farm gate price to FOB (export) price
Robusta Arabica21
CY 2009/10 2,076.23 0.57 1.14 1.79 1.39 2.42 75 74
CY 2010/11 2,436.93 0.77 1.58 3.05 1.98 3.86 71 79
CY 2011/12 2,502.32 0.74 1.58 2.38 1.96 3.42 69 70
CY 2012/13 2,612.33 0.79 1.58 1.66 1.9 2.39 76 69
CY 2013/14 2,548.63 0.65 1.47 1.98 1.74 2.36 68 84
CY 2014/15 3,053.62 0.71 1.41 2.03 1.77 2.78 73 73
CY-2015/16 3,406.20 0.65 1.30 1.51 1.53 1.95 77 77
CY-2016/17 3,589.29 0.65 1.39 1.73 1.86 2.36 64 73
CY 2017/18 3,699.41 0.58 1.31 1.52 1.68 2.49 63 77
Source: Computed from data from UCDA database and Bank of Uganda
19 FAO, Sustainable management of the fall Army worm in Africa, 2017. 20 FOT/R-Free on Truck/Rail Kampala/Mbale (Inland ports). 21 To obtain the clean coffee equivalent, the parchment price for Arabica is divided by 0.8 (out-turn from dry parchment to clean coffee and for Robusta, the Kiboko (unprocessed coffee) is divided by 0.55 (the average outturn from Kiboko coffee) to FAQ.
20 ICC-124-8
Uganda ICO Coffee Profile
4.2 Net income by farm type Net income is UGX5.25 million for Clonal Robusta per hectare (after five years) and UGX1.78 million/ha for Arabica (also after five years). Refer to Annex II and III. 5. Research and Extension Agricultural research in Uganda is undertaken by the National Agricultural Research Organization (NARO), which is mandated to develop and release all new technologies, including coffee planting material. 5.1 Institutions responsible for research The National Coffee Research Institute (NaCORI) under NARO is responsible for biological research, while socio-economic and policy research is conducted by the UCDA and the Economic Policy Research Centre (EPRC). NaCORI has developed tenb Coffee Wilt Disease Resistant (CWDr) lines that have been released to be multiplied by specific farmers under the supervision of the UCDA and NaCORI. During the CWDr mapping exercise carried out in October 2017, the mother gardens established which had started yielding were 167. The number of established CWDR mother gardens is more than 400 currently. Research programmes include:
• Enhancing availability of planting materials-establishment of a coffee tissue culture and molecular laboratory.
• Variety development-expansion of CWDr-mother garden at NaCORI, Kituza; expanding capacity to generate Arabica seeds and seedlings; determination of molecular characteristics of CWDr lines; determination of morphological diversity of close to 300 Robusta coffee germplasm materials; development and promotion of Arabica coffee varieties with desired quality and resistance to Coffee Leaf Rust (CLR) and Coffee Berry Disease (CBD) .
• Pests and Disease management-profiling Black Coffee Twig Borer (BCTB) infestation by altitude and slope orientation; BCTB infestation in nurseries; determination of optimum application rates and frequencies of selected pesticides for managing BCTB and other coffee pests.
• Promotion of technologies and Innovations-BCTB IPM package; availing extension materials to clients; training lead farmers and provision of Coffee Season Management Calendar in different regions.
• Evaluation of competitiveness of coffee enterprises in the mid-eastern (Busoga) region.

Uganda Coffee Profile22
ICC-124-8 21
ICO Coffee Profile Uganda
5.2 Research on climate change and coffee
• Quantifying the effect of shade tree species on soil fertility and coffee yield • UCDA, in conjunction with Makerere University, commissioned a study on the
effect of drought on coffee mortality in 2016. A number of recommendations to address climatic change effects were made.
• UCDA and other stakeholders carried out a quick appraisal on newly planted coffee seedlings survivability in two seasons (August 2016 Report)
5.3 Organization of extension services The Ministry of Agriculture, Animal Industry and Fisheries (MAAIF) is responsible for agricultural extension services guided by the Agricultural Extension Policy and Strategy. UCDA has five regional offices and 55 field extension workers providing coffee-specific extension services. 6. Coffee processing 6.1 Field processing Types of coffee processing methods (wet or dry), processing on farm or in factories. 6.2 Quality control Quality measures at farm level, grading and cup-tasting. 7. Stakeholders in the coffee sector 7.1 Farmers’ associations/cooperatives The number of coffee associations/cooperatives and community-based organizations is estimated at 1,600, according to the Uganda Coffee Alliance. 7.2 National Coffee Authority
Uganda Coffee Development Authority (UCDA) is mandated by the UCDA Statute 1991 (amended in 1994) to oversee the development, regulation and promotion of the coffee industry in Uganda. It is an agency under the Ministry of Agriculture, Animal Industry and
22 ICC-124-8
Uganda ICO Coffee Profile
Fisheries. Its vision is “A sustainable coffee industry with high stakeholder value for social economic transformation”. Its mission is “To facilitate increase in quality coffee production, productivity, and consumption”. Its core values are:
• Leadership • Integrity • Teamwork • Client Focus • Accountability • Professionalism
The statutory objectives of the Authority are to:
1. Promote, improve and monitor marketing of coffee to optimize foreign exchange and farmers’ earnings;
2. Guarantee that the quality of coffee exports meets international standards; 3. Develop and promote the coffee and other related industries through
research and extension arrangements; 4. Promote the marketing of coffee as a value added product; 5. Promote domestic consumption of Uganda coffee; 6. Harmonize activities of coffee sub-sector associations in line with industry
objectives; and 7. Formulate policies related to the coffee industry 8. Monitor and evaluate coffee projects and programmes in the sub-sector
UCDA clients are:
• Farmers • Processors • Exporters • Roasters • Consumers • International agencies • Government • Media • Academia

Uganda Coffee Profile 23
ICC-124-8 21
ICO Coffee Profile Uganda
5.2 Research on climate change and coffee
• Quantifying the effect of shade tree species on soil fertility and coffee yield • UCDA, in conjunction with Makerere University, commissioned a study on the
effect of drought on coffee mortality in 2016. A number of recommendations to address climatic change effects were made.
• UCDA and other stakeholders carried out a quick appraisal on newly planted coffee seedlings survivability in two seasons (August 2016 Report)
5.3 Organization of extension services The Ministry of Agriculture, Animal Industry and Fisheries (MAAIF) is responsible for agricultural extension services guided by the Agricultural Extension Policy and Strategy. UCDA has five regional offices and 55 field extension workers providing coffee-specific extension services. 6. Coffee processing 6.1 Field processing Types of coffee processing methods (wet or dry), processing on farm or in factories. 6.2 Quality control Quality measures at farm level, grading and cup-tasting. 7. Stakeholders in the coffee sector 7.1 Farmers’ associations/cooperatives The number of coffee associations/cooperatives and community-based organizations is estimated at 1,600, according to the Uganda Coffee Alliance. 7.2 National Coffee Authority
Uganda Coffee Development Authority (UCDA) is mandated by the UCDA Statute 1991 (amended in 1994) to oversee the development, regulation and promotion of the coffee industry in Uganda. It is an agency under the Ministry of Agriculture, Animal Industry and
22 ICC-124-8
Uganda ICO Coffee Profile
Fisheries. Its vision is “A sustainable coffee industry with high stakeholder value for social economic transformation”. Its mission is “To facilitate increase in quality coffee production, productivity, and consumption”. Its core values are:
• Leadership • Integrity • Teamwork • Client Focus • Accountability • Professionalism
The statutory objectives of the Authority are to:
1. Promote, improve and monitor marketing of coffee to optimize foreign exchange and farmers’ earnings;
2. Guarantee that the quality of coffee exports meets international standards; 3. Develop and promote the coffee and other related industries through
research and extension arrangements; 4. Promote the marketing of coffee as a value added product; 5. Promote domestic consumption of Uganda coffee; 6. Harmonize activities of coffee sub-sector associations in line with industry
objectives; and 7. Formulate policies related to the coffee industry 8. Monitor and evaluate coffee projects and programmes in the sub-sector
UCDA clients are:
• Farmers • Processors • Exporters • Roasters • Consumers • International agencies • Government • Media • Academia

Uganda Coffee Profile24
ICC-124-8 23
ICO Coffee Profile Uganda
7.3 Other government involvement As per the National Coffee Policy 2013, UCDA collaborates with a number of government agencies, including the Ministry of Agriculture, Animal Industry and Fisheries; Ministry of Trade, Industry and Cooperatives; Ministry of Finance, Planning and Economic Development; Ministry of Water for Environment; Ministry of Tourism and Antiquities; National Planning Authority; and academia in public and private universities. 7.4 The private sector Number of coffee farmers: 1.7 million households (estimate) Number of primary processors: 537 Number of exporters: 72 Number of roasters: 17 Number of cafés: Over 100 7.5 Financial institutions Commercial banks offer letters of credit to exporters. Some commercial banks execute export performance bonds with Ugandan exporters. The majority of exporters execute export performance bonds with insurance companies. Development banks, such as the Uganda Development Bank (UDB), offer medium-term credit to coffee businessmen and women at very low interest rates (12% compared to those offered by commercial banks). UCDA has signed an MOU with UDB to update this. The Bank of Uganda (central bank) also has an Agricultural Credit Facility (ACF) where SMEs can access credit facilities at an interest rate of 12%. This facility has however benefitted mostly large companies. 8. Marketing structure The major actors in the coffee value chain range from researchers-seed suppliers-nursery operators-farmers (farmer organizations22)-traders-processors (processor & traders association23)- exporters (exporter association24)- Buyers Abroad-retail markets- consumers. Local roasters and numerous cafes also exist. Other service providers include agro-inputs suppliers, banks, insurance companies, transporters, forwarders and shippers who undertake value adding activities to make Uganda more competitive globally.
22 Major ones are NUCAFE (National Union of Coffee Agribusinesses and Farm Enterprises) and UCFA (Uganda Coffee Farmers Alliance). 23 Uganda Quality Coffee Processors and Traders Association (UQCPTA). 24 Uganda Coffee Federation (UCF) whose membership also includes banks, insurance companies, forwarders and shippers.
24 ICC-124-8
Uganda ICO Coffee Profile
8.1 Marketing channels Figure 2 shows the different marketing channels of the Ugandan coffee sector. Some farmers sell to small middlemen while others sell directly to coffee-buying storemen. Farmer organizations sell directly to exporters while 120 other farmer organizations have integrated upwards and are exporters.
Figure 2: Post-liberalization marketing structure
Exporter Agent
Exporter
Merchant
Primary Processing
Merchant
Buying store/Society
Farmer
Ddebe Boys (Small
middlemen)
BUYER
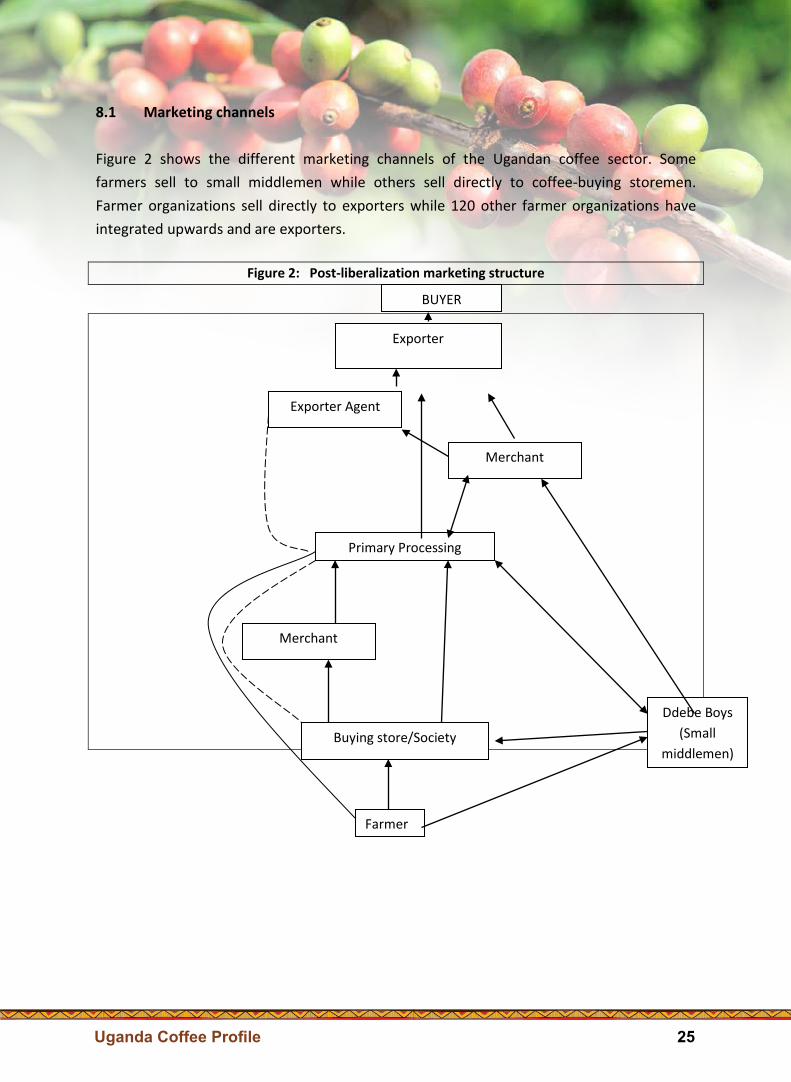
Uganda Coffee Profile 25
ICC-124-8 23
ICO Coffee Profile Uganda
7.3 Other government involvement As per the National Coffee Policy 2013, UCDA collaborates with a number of government agencies, including the Ministry of Agriculture, Animal Industry and Fisheries; Ministry of Trade, Industry and Cooperatives; Ministry of Finance, Planning and Economic Development; Ministry of Water for Environment; Ministry of Tourism and Antiquities; National Planning Authority; and academia in public and private universities. 7.4 The private sector Number of coffee farmers: 1.7 million households (estimate) Number of primary processors: 537 Number of exporters: 72 Number of roasters: 17 Number of cafés: Over 100 7.5 Financial institutions Commercial banks offer letters of credit to exporters. Some commercial banks execute export performance bonds with Ugandan exporters. The majority of exporters execute export performance bonds with insurance companies. Development banks, such as the Uganda Development Bank (UDB), offer medium-term credit to coffee businessmen and women at very low interest rates (12% compared to those offered by commercial banks). UCDA has signed an MOU with UDB to update this. The Bank of Uganda (central bank) also has an Agricultural Credit Facility (ACF) where SMEs can access credit facilities at an interest rate of 12%. This facility has however benefitted mostly large companies. 8. Marketing structure The major actors in the coffee value chain range from researchers-seed suppliers-nursery operators-farmers (farmer organizations22)-traders-processors (processor & traders association23)- exporters (exporter association24)- Buyers Abroad-retail markets- consumers. Local roasters and numerous cafes also exist. Other service providers include agro-inputs suppliers, banks, insurance companies, transporters, forwarders and shippers who undertake value adding activities to make Uganda more competitive globally.
22 Major ones are NUCAFE (National Union of Coffee Agribusinesses and Farm Enterprises) and UCFA (Uganda Coffee Farmers Alliance). 23 Uganda Quality Coffee Processors and Traders Association (UQCPTA). 24 Uganda Coffee Federation (UCF) whose membership also includes banks, insurance companies, forwarders and shippers.
24 ICC-124-8
Uganda ICO Coffee Profile
8.1 Marketing channels Figure 2 shows the different marketing channels of the Ugandan coffee sector. Some farmers sell to small middlemen while others sell directly to coffee-buying storemen. Farmer organizations sell directly to exporters while 120 other farmer organizations have integrated upwards and are exporters.
Figure 2: Post-liberalization marketing structure
Exporter Agent
Exporter
Merchant
Primary Processing
Merchant
Buying store/Society
Farmer
Ddebe Boys (Small
middlemen)
BUYER

Uganda Coffee Profile26
ICC-124-8 25
ICO Coffee Profile Uganda
Export marketing certification requirements
Coffee exporter requirement Time spent in acquiring the same
An export licence 5 working days
Register a coffee sale 30 minutes
Phytosanitary certificate 1 day
Obtain a quality certificate 1 day
Obtain International Coffee Organization Certificate of Origin 1 day Other regulatory requirements to comply with: In order to qualify for the export of coffee, traders are required to meet the following guidelines:
1. Provide full name of applicant and physical address. 2. Company profile indicating Memorandum and Articles of Association, Shareholders
and Management set–up. 3. Provide a performance bond in Uganda shillings equivalent to US$25,000 (not cash). 4. Provide evidence of access to a reprocessing factory capable of producing export
grades. 5. Pay registration/license fee of UGX 1.5m per annum (US$405)
Means of exporting Ugandan coffee Coffee can be exported through different means, including:
1. By air. 2. FOT (Free on Truck)-Kampala or Mbale is the commonly used pricing where the
transport, insurance and freight costs are borne by export coffee to any destination 3. FOB (Free on Board)-Mombasa. 4. CIF (Cost Insurance and Freight).
8.2 Farmers’ associations/cooperatives exporting coffee The number of farmer associations/cooperatives exporting coffee is estimated at 11 as shown in the table 4 below with their exports in Coffee Year 2016/17.
26 ICC-124-8
Uganda ICO Coffee Profile
Table 4: Coffee exports by associations/cooperatives Coffee year 2016/17 (60-kg bags)
Exporter Robusta Arabica Total
Ankole Coffee Processors Cooperative Society 45,846 1,780 47,626
Ankole Coffee Producers Coop Union 45,424 613 46,037
Banyankole Kweterana Cooperative Union 10,712 1,780 12,492
Kibinge Coffee Farmers’ Cooperative Society 5,920 5,920
Bukonzo Joint Cooperative Union 5,680 5,680
Bugisu Cooperative Union 640 640
National Union of Coffee Agribusinesses and Farm Enterprises (NUCAFE) Ltd
3,492 1,134 4,626
United Organic 1,250 1,250
Nsangi Coffee Farmers Association 988 988
Nile Highlands Arabica Coffee Farmers Association 700 700
Bukonzo Organic 154 154
Total Cooperatives 112,382 13,731 126,113
Grand Total Exports for CY 2016/17 3,618,631 986,527 4,605,158
%age Market share 3

Uganda Coffee Profile 27
ICC-124-8 25
ICO Coffee Profile Uganda
Export marketing certification requirements
Coffee exporter requirement Time spent in acquiring the same
An export licence 5 working days
Register a coffee sale 30 minutes
Phytosanitary certificate 1 day
Obtain a quality certificate 1 day
Obtain International Coffee Organization Certificate of Origin 1 day Other regulatory requirements to comply with: In order to qualify for the export of coffee, traders are required to meet the following guidelines:
1. Provide full name of applicant and physical address. 2. Company profile indicating Memorandum and Articles of Association, Shareholders
and Management set–up. 3. Provide a performance bond in Uganda shillings equivalent to US$25,000 (not cash). 4. Provide evidence of access to a reprocessing factory capable of producing export
grades. 5. Pay registration/license fee of UGX 1.5m per annum (US$405)
Means of exporting Ugandan coffee Coffee can be exported through different means, including:
1. By air. 2. FOT (Free on Truck)-Kampala or Mbale is the commonly used pricing where the
transport, insurance and freight costs are borne by export coffee to any destination 3. FOB (Free on Board)-Mombasa. 4. CIF (Cost Insurance and Freight).
8.2 Farmers’ associations/cooperatives exporting coffee The number of farmer associations/cooperatives exporting coffee is estimated at 11 as shown in the table 4 below with their exports in Coffee Year 2016/17.
26 ICC-124-8
Uganda ICO Coffee Profile
Table 4: Coffee exports by associations/cooperatives Coffee year 2016/17 (60-kg bags)
Exporter Robusta Arabica Total
Ankole Coffee Processors Cooperative Society 45,846 1,780 47,626
Ankole Coffee Producers Coop Union 45,424 613 46,037
Banyankole Kweterana Cooperative Union 10,712 1,780 12,492
Kibinge Coffee Farmers’ Cooperative Society 5,920 5,920
Bukonzo Joint Cooperative Union 5,680 5,680
Bugisu Cooperative Union 640 640
National Union of Coffee Agribusinesses and Farm Enterprises (NUCAFE) Ltd
3,492 1,134 4,626
United Organic 1,250 1,250
Nsangi Coffee Farmers Association 988 988
Nile Highlands Arabica Coffee Farmers Association 700 700
Bukonzo Organic 154 154
Total Cooperatives 112,382 13,731 126,113
Grand Total Exports for CY 2016/17 3,618,631 986,527 4,605,158
%age Market share 3

Uganda Coffee Profile28
ICC-124-8 27
ICO Coffee Profile Uganda
Table 5: Specification of coffee grades and indicative premiums or discounts (Natural) (Natural) (Natural) Washed Sustainable
Robusta Robusta grades Screen 18 Screen 15 Screen 12 Robusta (Certified: UTZ,
RFA, Organic, Fairtrade)
Screen size & Max. defects (%age) Moisture content <12.5%
18/64=92% 17/64=7%
<17/64=1% Def. count 7%
17/64=7% 15/64=90% <15/64=3% Def. count
12%
14/64=13% 12/64=85% <12/64=2%
Def. count 15%
Ungraded Def. count
10%
Ungraded Def. count 10%
Indicative price premiums/discounts
1.99 0
1.91 -0.08
1.81 -0.18
2.14 0.15
2.23 0.24
Washed Arabica graded (Bugisu) Moisture content <12.5%
AA A B PB C
Screen size & Max. defects %age
17/64=90% 16/64=8% 15/64=2%
Def. count 5%
16/64=90% 15/64=8% 12/64=2% Def. count
7%
15/64=90% 14/64=8% 12/64=2%
Def. count 10%
15/64=80% 14/64=15%
12/64=5% Def. count
12%
14/64=90% 13/64=8% 12/64=2%
Def. count 10%
Indicative premiums discounts
2.67
0
2.32
-0.35
2.42
-0.25
2.82
0.15
-
- Washed Arabica
Mt. Rwenzori
Organic Okoro ungraded
(Wugar) Organic Drugar
Dry/Natural Arabica
2.35
2.86
2.44 2.72
Drugar (Kasese, Ibanda) Ungraded
2.30 (-0.05)
2.30 (-0.56)
2.30 (-0.14) 2.30 (0.28)
Screen size & Max. defects %age
Def. count 10% - Def. count 10%
Note. Prices are in US$/kilo 8.3 Export taxes and duties levied on coffee Uganda coffee exports are not taxed, however a 1% CESS (export tax) is collected monthly from export proceeds and is used to fund coffee development activities.

Uganda Coffee Profile 29
ICC-124-8 27
ICO Coffee Profile Uganda
Table 5: Specification of coffee grades and indicative premiums or discounts (Natural) (Natural) (Natural) Washed Sustainable
Robusta Robusta grades Screen 18 Screen 15 Screen 12 Robusta (Certified: UTZ,
RFA, Organic, Fairtrade)
Screen size & Max. defects (%age) Moisture content <12.5%
18/64=92% 17/64=7%
<17/64=1% Def. count 7%
17/64=7% 15/64=90% <15/64=3% Def. count
12%
14/64=13% 12/64=85% <12/64=2%
Def. count 15%
Ungraded Def. count
10%
Ungraded Def. count 10%
Indicative price premiums/discounts
1.99 0
1.91 -0.08
1.81 -0.18
2.14 0.15
2.23 0.24
Washed Arabica graded (Bugisu) Moisture content <12.5%
AA A B PB C
Screen size & Max. defects %age
17/64=90% 16/64=8% 15/64=2%
Def. count 5%
16/64=90% 15/64=8% 12/64=2% Def. count
7%
15/64=90% 14/64=8% 12/64=2%
Def. count 10%
15/64=80% 14/64=15%
12/64=5% Def. count
12%
14/64=90% 13/64=8% 12/64=2%
Def. count 10%
Indicative premiums discounts
2.67
0
2.32
-0.35
2.42
-0.25
2.82
0.15
-
- Washed Arabica
Mt. Rwenzori
Organic Okoro ungraded
(Wugar) Organic Drugar
Dry/Natural Arabica
2.35
2.86
2.44 2.72
Drugar (Kasese, Ibanda) Ungraded
2.30 (-0.05)
2.30 (-0.56)
2.30 (-0.14) 2.30 (0.28)
Screen size & Max. defects %age
Def. count 10% - Def. count 10%
Note. Prices are in US$/kilo 8.3 Export taxes and duties levied on coffee Uganda coffee exports are not taxed, however a 1% CESS (export tax) is collected monthly from export proceeds and is used to fund coffee development activities.
28 ICC-124-8
Uganda ICO Coffee Profile
9. Coffee roasting and domestic coffee consumption 9.1 Roasters and market size Local processing is carried out by 18 roasters with a total market size estimated at 216 tonnes (3,600 bags) of roasted coffee per year. 9.1.1 Distribution channels Distribution channels includes supermarkets and direct to cafes and hotels. 9.3 Domestic coffee consumption
Table 6: Domestic consumption (2010-2017) in 60-kg bags
Coffee Year Robusta Arabica Total
2009/10 147,900 40,800 188,700
2010/11 159,120 44,880 204,000
2010/12 164,400 45,600 210,000
2012/13 168,000 48,000 216,000
2013/14 171,600 49,200 220,800
2014/15 175,200 54,000 229,200
2015/16 178,800 57,600 236,400
2016/17 180,000 60,000 240,000
2017/18 183,600 61,200 244,800 Source: UCDA

Uganda Coffee Profile30
ICC-124-8 29
ICO Coffee Profile Uganda
10. Coffee exports performance 10.1 Volume and value of exports Table 7 shows Uganda’s coffee exports over the last 10 years.
Table 7: Volume and value of exports (60-kg bags and US$)
Coffee Year Robusta Arabica Total
Quantity Value Quantity Value Quantity Value
2008/09 2,405,137 212,848,980 648,551 78,912,759 3,053,688 291,761,739
2009/10 1,957,400 163,484,690 711,571 103,230,931 2,668,971 266,715,621
2010/11 2,484,013 294,606,045 665,410 154,284,625 3,149,423 448,890,669
2011/12 1,904,176 223,976,023 822,073 168,722,105 2,726,249 392,698,138
2012/13 2,781,478 317,728,861 801,151 114,965,197 3,582,629 432,694,059
2013/14 2,735,020 285,614,846 764,809 108,307,489 3,499,829 393,922,335
2014/15 2,722,636 288,389,791 733,216 122,160,149 3,455,852 410,549,941
2015/16 2,435,160 223,655,972 880,407 103,020,278 3,315,567 326,676,251
2016/17 3,618,631 404,858,546 986,527 139,729,082 4,605,158 544,587,628
2017/18 3,202,881 325,032,630 1,102,716 137,796,277 4,305,597 462,828,907
10.2 Exports by destination The majority of Uganda’s Coffee is destined for the European Union, followed by Sudan. See Annex IV for details. 10.3 Shipping A minimum of 45 days are required to transport coffee from Kampala/Mbale inland port to any port in Europe, by road/rail to Mombasa and sea thereafter. 10.4 Exports of certified coffees Appendix 5 provides the details of sustainable coffees (including washed Robusta) for the last ten years.
30 ICC-124-8
Uganda ICO Coffee Profile
10.5 Stocks
Table 8: Uganda's closing stocks (60-kg bags) Coffee Year Robusta Arabica Total
2008/09 399,923 76,110 476,033
2009/10 371,180 141,058 512,238
2010/11 350,427 74,953 425,380
2011/12 506,153 97,341 603,494
2012/13 561,438 156,299 717,737
2013/14 563,649 166,326 729,975
2014/15 409,952 181,029 590,981
2015/16 561,537 149,198 710,735
2016/17 664,439 243,100 907,539
Source: UCDA Annual Reports 11. Export Regulations 11.1 Regulations related to quality standards Uganda’s coffee marketing is guided by the 1994 Coffee Regulations and the UCDA Statute 1991 (amended in 1994). At roaster level, coffee is certified under the East African Standard on Roast and Ground Coffee in line with the Uganda National Bureau of Standards (UNBS). 11.2 Export duty and taxes In Uganda, no export tax is levied on coffee exports. The only levy is a 1% tax of total export value charged to exporters on a monthly basis. 11.3 Other levies 1% withholding tax on all coffee transactions which are UGX 1 million and above. This tax started to be levied in 2018. Its effect on the profitability of coffee has not yet been ascertained. 12. Macro-economic aspects 12.1 Coffee and trade balance For the last 10 years, coffee has contributed a percentage of exports goods ranging from 12% to 19% (Table 9 and Annex VI for details).

Uganda Coffee Profile 31
ICC-124-8 29
ICO Coffee Profile Uganda
10. Coffee exports performance 10.1 Volume and value of exports Table 7 shows Uganda’s coffee exports over the last 10 years.
Table 7: Volume and value of exports (60-kg bags and US$)
Coffee Year Robusta Arabica Total
Quantity Value Quantity Value Quantity Value
2008/09 2,405,137 212,848,980 648,551 78,912,759 3,053,688 291,761,739
2009/10 1,957,400 163,484,690 711,571 103,230,931 2,668,971 266,715,621
2010/11 2,484,013 294,606,045 665,410 154,284,625 3,149,423 448,890,669
2011/12 1,904,176 223,976,023 822,073 168,722,105 2,726,249 392,698,138
2012/13 2,781,478 317,728,861 801,151 114,965,197 3,582,629 432,694,059
2013/14 2,735,020 285,614,846 764,809 108,307,489 3,499,829 393,922,335
2014/15 2,722,636 288,389,791 733,216 122,160,149 3,455,852 410,549,941
2015/16 2,435,160 223,655,972 880,407 103,020,278 3,315,567 326,676,251
2016/17 3,618,631 404,858,546 986,527 139,729,082 4,605,158 544,587,628
2017/18 3,202,881 325,032,630 1,102,716 137,796,277 4,305,597 462,828,907
10.2 Exports by destination The majority of Uganda’s Coffee is destined for the European Union, followed by Sudan. See Annex IV for details. 10.3 Shipping A minimum of 45 days are required to transport coffee from Kampala/Mbale inland port to any port in Europe, by road/rail to Mombasa and sea thereafter. 10.4 Exports of certified coffees Appendix 5 provides the details of sustainable coffees (including washed Robusta) for the last ten years.
30 ICC-124-8
Uganda ICO Coffee Profile
10.5 Stocks
Table 8: Uganda's closing stocks (60-kg bags) Coffee Year Robusta Arabica Total
2008/09 399,923 76,110 476,033
2009/10 371,180 141,058 512,238
2010/11 350,427 74,953 425,380
2011/12 506,153 97,341 603,494
2012/13 561,438 156,299 717,737
2013/14 563,649 166,326 729,975
2014/15 409,952 181,029 590,981
2015/16 561,537 149,198 710,735
2016/17 664,439 243,100 907,539
Source: UCDA Annual Reports 11. Export Regulations 11.1 Regulations related to quality standards Uganda’s coffee marketing is guided by the 1994 Coffee Regulations and the UCDA Statute 1991 (amended in 1994). At roaster level, coffee is certified under the East African Standard on Roast and Ground Coffee in line with the Uganda National Bureau of Standards (UNBS). 11.2 Export duty and taxes In Uganda, no export tax is levied on coffee exports. The only levy is a 1% tax of total export value charged to exporters on a monthly basis. 11.3 Other levies 1% withholding tax on all coffee transactions which are UGX 1 million and above. This tax started to be levied in 2018. Its effect on the profitability of coffee has not yet been ascertained. 12. Macro-economic aspects 12.1 Coffee and trade balance For the last 10 years, coffee has contributed a percentage of exports goods ranging from 12% to 19% (Table 9 and Annex VI for details).

Uganda Coffee Profile32
ICC-124-8 31
ICO Coffee Profile Uganda
Table 9: Percentage of coffee exports in total exports value (calendar years)
2008 2009 2010 2011 2012 2013 2014 2015 2016 2017
18 12 13 19 13 15 15 15 13 17 Source: Computed from Exports Data from Bank of Uganda Statistics Department 12.2 Share of coffee in Gross Domestic Product Coffee exports contribute 1.5% to Gross Domestic Product. It is estimated that 45% of dry Robusta (Kiboko) coffee is transformed into coffee husks, which are either taken back to farms for use as mulch or sold to brickette manufacturers. 12.3 Employment generated by the coffee sector Active population generated by the coffee sector is indicated in table 10 below:
Table 10: Estimated number of jobs created in coffee sector
Category Estimated number (CY 2017/18) Total estimated number of people depending on coffee
Seed suppliers25 21 (2 Permanent26; 3 casual) 105
Nursery operators 2,546 (2 Permanent27; 5 casual) 17,822
Farmers 1,700,000 (3 permanent28 & 4 casuals per farmer)
11,900,000
Store men 715 (3 per store) 2,145
Washing stations 22 (5 per washing station) 110
Primary processors 537 (5 permanent29 & 4 casual factory)
4,833
Exporters 72 (10 permanent30 & 210 casual workers)
151,200
Roasters 17 (5 per roaster) 85
Cafes/coffee shops 120 (10 per café) 1,200
Total 12,077,500 Source: Derived from field interviews with coffee value chain actors.
25 12 Robusta Seed gardens & 9 Arabica seed gardens. 26 Permanent: owner & pruning; Casual: weeding. 27 Permanent: owner & watering; Casual: potting. 28 Permanent: Farmer, Wife, one permanent staff Casual: 4. 29 Permanent: Owner/Director, machine operators, Accountant/cashier & security guard Casual: off loaders). 30 Permanent: General Manager, Asst. General Manager, Procurement Manager, Export Manager, quality analysts, Security man, Accountant/cashier & receptionist, casual: Gang boys (offload, weighing and stuck at the hopper) and hand pickers.

Uganda Coffee Profile 33
ICC-124-8 31
ICO Coffee Profile Uganda
Table 9: Percentage of coffee exports in total exports value (calendar years)
2008 2009 2010 2011 2012 2013 2014 2015 2016 2017
18 12 13 19 13 15 15 15 13 17 Source: Computed from Exports Data from Bank of Uganda Statistics Department 12.2 Share of coffee in Gross Domestic Product Coffee exports contribute 1.5% to Gross Domestic Product. It is estimated that 45% of dry Robusta (Kiboko) coffee is transformed into coffee husks, which are either taken back to farms for use as mulch or sold to brickette manufacturers. 12.3 Employment generated by the coffee sector Active population generated by the coffee sector is indicated in table 10 below:
Table 10: Estimated number of jobs created in coffee sector
Category Estimated number (CY 2017/18) Total estimated number of people depending on coffee
Seed suppliers25 21 (2 Permanent26; 3 casual) 105
Nursery operators 2,546 (2 Permanent27; 5 casual) 17,822
Farmers 1,700,000 (3 permanent28 & 4 casuals per farmer)
11,900,000
Store men 715 (3 per store) 2,145
Washing stations 22 (5 per washing station) 110
Primary processors 537 (5 permanent29 & 4 casual factory)
4,833
Exporters 72 (10 permanent30 & 210 casual workers)
151,200
Roasters 17 (5 per roaster) 85
Cafes/coffee shops 120 (10 per café) 1,200
Total 12,077,500 Source: Derived from field interviews with coffee value chain actors.
25 12 Robusta Seed gardens & 9 Arabica seed gardens. 26 Permanent: owner & pruning; Casual: weeding. 27 Permanent: owner & watering; Casual: potting. 28 Permanent: Farmer, Wife, one permanent staff Casual: 4. 29 Permanent: Owner/Director, machine operators, Accountant/cashier & security guard Casual: off loaders). 30 Permanent: General Manager, Asst. General Manager, Procurement Manager, Export Manager, quality analysts, Security man, Accountant/cashier & receptionist, casual: Gang boys (offload, weighing and stuck at the hopper) and hand pickers.
32 ICC-124-8
Uganda ICO Coffee Profile
13. Environmental challenges Environmental challenges of coffee sector include drought31, erratic rainfall, soil erosion and deforestation. Increased incidences of pests and diseases are caused by rising temperatures. It should also be noted frequent flooding and mudslides occur across the country. 13.1 Impact of coffee production on the environment Coffee has a positive impact on environmental conservation, especially when it is grown under shade. In Uganda, coffee is intercropped with bananas which has a positive effect on the soil nutrients, especially when cover crops such as beans or pulses are intercropped as well. Research carried out in Uganda by the International Institute of Tropical Agriculture (IITA) (Piet, 2016) showed that bananas, besides providing additional income to farmers, act as a provider of shade when the coffee is still young. Coffee yields under this system are almost the same as in a monocrop. 13.2 Contribution to carbon footprint In Uganda the contribution of coffee to Green House Gases (GHG) has not yet been ascertained. However, literature from other countries, such as Costa Rica, indicates that it does so and significantly too. 13.3 Environmentally sustainable coffee production The National Coffee Policy (NCP) and National Coffee Strategy (NCS) emphasize sustainable coffee production. The NCS’s Strategy 1.18: Promote and support climatic change adaptation and environmentally responsible practices. Strategy 1.1.8: Promote and support climate change adaptation and
environmentally responsible. The related activities are:
(a) Develop and implement reward systems for farmers who practice good conservation practices.
(b) Promote climate and environmentally SMART agriculture (use of shade trees, mulching, water management, etc.)
31 Bagamba F, ‘’Drought and Mortality Assessment in the Coffee Sub-sector”, Report commissioned by Uganda Coffee Development Authority, March 2016 (unpublished).

Uganda Coffee Profile34
ICC-124-8 33
ICO Coffee Profile Uganda
(c) Promote use of alternative energy sources that reduce pressure on trees. (d) Strengthen the dissemination mechanism for weather forecast information
to reach the farmers. (e) Assess and document the use of indigenous knowledge and early warning signals.
14. Prospects for coffee production In addition to oil exploration and production, which would benefit Uganda substantially, the Ugandan coffee industry is very vibrant with government and development partners treating it as a priority and major driver of the country’s transformation from a Least Developed Country (LDC) to a Middle Income one by 2040. A number of policies and strategies have been developed to transform this into reality. These include the Uganda Vision 2040 and its framework: National Development Plan 2 (2015/16-2019/20); the National Agriculture Policy and its implementation framework-the Agriculture Sector Strategic Plan (ASSP) 2015/16-2019/20; the National Coffee Policy 2013 and its Implementation Framework-National Coffee Strategy 2015/16-2019/20; and, more recently, the Coffee Roadmap. These three frameworks are spearheaded by the National Planning Authority, the Ministry of Agriculture, Animal Industry and Fisheries and the Uganda Coffee Development Authority respectively. Government has invested and continues to invest in coffee production through provision of clean planting material and rehabilitation of old trees through stumping. This is also supported by increments in farmer outreach and the provision of agro-inputs, such as fertilizers (both inorganic and organic), pesticides, herbicides and insecticides. An e-voucher system is being piloted to ensure timely delivery of inputs to farmers. This is also supported by investment in rainwater harvesting technologies and irrigation systems. The Uganda Coffee Platform (UCP) was established in 2006 to champion the Coffee Production Campaign 2006-2015 to revamp coffee exports, which had hitherto declined from over 4.2 million 60-kg bags in coffee year 2006/07 to just 2 million bags in 2005/06 to 4.5 million bags by 2015. This target was achieved. Within the GCP, the public and the private sectors as well as the development partners and the National Coffee Research Institute (NaCORI) identified four thematic areas to revamp production: Research; Extension; Inputs and Credit; and Farmer Organizations. A 3-months intensive programme was undertaken with a series of meetings to identify the critical success factors in the four thematic areas, the lead agency and associated budget. This was spearheaded by UCDA and Café Africa. A National Steering Committee (NSC), chaired by UCDA and having Café Africa as Secretariat, was constituted. The NSC informs the Uganda Coffee Platform (UCP) and was (and is still) charged with ensuring that the activities identified by the UCP are ably undertaken. District Coffee Platforms or District Steering Committees were later established which fed into the National Steering Committee.
34 ICC-124-8
Uganda ICO Coffee Profile
The Uganda Coffee Platform has been instrumental in producing harmonized coffee extension materials, including You-tubes videos and DVDs to enhance accessibility, held District Coffee Extension Pilot training with 180 agronomists, 180 community-based facilitators and 60 youth model farmers who have acted as change agents in ensuring the adoption of Good Agricultural Practices by farmers. The National Coffee Platform also supported the Ministry of Agriculture, Animal Industry and Fisheries in the development of the Agricultural Extension Policy and Strategy.

Uganda Coffee Profile 35
ICC-124-8 33
ICO Coffee Profile Uganda
(c) Promote use of alternative energy sources that reduce pressure on trees. (d) Strengthen the dissemination mechanism for weather forecast information
to reach the farmers. (e) Assess and document the use of indigenous knowledge and early warning signals.
14. Prospects for coffee production In addition to oil exploration and production, which would benefit Uganda substantially, the Ugandan coffee industry is very vibrant with government and development partners treating it as a priority and major driver of the country’s transformation from a Least Developed Country (LDC) to a Middle Income one by 2040. A number of policies and strategies have been developed to transform this into reality. These include the Uganda Vision 2040 and its framework: National Development Plan 2 (2015/16-2019/20); the National Agriculture Policy and its implementation framework-the Agriculture Sector Strategic Plan (ASSP) 2015/16-2019/20; the National Coffee Policy 2013 and its Implementation Framework-National Coffee Strategy 2015/16-2019/20; and, more recently, the Coffee Roadmap. These three frameworks are spearheaded by the National Planning Authority, the Ministry of Agriculture, Animal Industry and Fisheries and the Uganda Coffee Development Authority respectively. Government has invested and continues to invest in coffee production through provision of clean planting material and rehabilitation of old trees through stumping. This is also supported by increments in farmer outreach and the provision of agro-inputs, such as fertilizers (both inorganic and organic), pesticides, herbicides and insecticides. An e-voucher system is being piloted to ensure timely delivery of inputs to farmers. This is also supported by investment in rainwater harvesting technologies and irrigation systems. The Uganda Coffee Platform (UCP) was established in 2006 to champion the Coffee Production Campaign 2006-2015 to revamp coffee exports, which had hitherto declined from over 4.2 million 60-kg bags in coffee year 2006/07 to just 2 million bags in 2005/06 to 4.5 million bags by 2015. This target was achieved. Within the GCP, the public and the private sectors as well as the development partners and the National Coffee Research Institute (NaCORI) identified four thematic areas to revamp production: Research; Extension; Inputs and Credit; and Farmer Organizations. A 3-months intensive programme was undertaken with a series of meetings to identify the critical success factors in the four thematic areas, the lead agency and associated budget. This was spearheaded by UCDA and Café Africa. A National Steering Committee (NSC), chaired by UCDA and having Café Africa as Secretariat, was constituted. The NSC informs the Uganda Coffee Platform (UCP) and was (and is still) charged with ensuring that the activities identified by the UCP are ably undertaken. District Coffee Platforms or District Steering Committees were later established which fed into the National Steering Committee.
34 ICC-124-8
Uganda ICO Coffee Profile
The Uganda Coffee Platform has been instrumental in producing harmonized coffee extension materials, including You-tubes videos and DVDs to enhance accessibility, held District Coffee Extension Pilot training with 180 agronomists, 180 community-based facilitators and 60 youth model farmers who have acted as change agents in ensuring the adoption of Good Agricultural Practices by farmers. The National Coffee Platform also supported the Ministry of Agriculture, Animal Industry and Fisheries in the development of the Agricultural Extension Policy and Strategy.

Uganda Coffee Profile36
ICC-124-8 35
ICO Coffee Profile Uganda
References 1. Bagamba F and Kirinya J, ‘’Drought and Mortality Assessment in the Coffee Sub-
sector”, Report commissioned by Uganda Coffee Development Authority, March 2016 (unpublished).
2. CABI (2017), Crop pests and disease management in Uganda: status and investment needs
3. Citizen’s Guide to the Uganda Vision 2040 ‘A Transformed Ugandan Society from a Peasant to a Modern and Prosperous Country within 30 years’, National Planning Authority,
4. National Agricultural Policy 2013 5. National Coffee Policy 2013 6. National Coffee Strategy 2015/16-2019/20 7. National Development Plan 2015/16-2019/20 8. Uganda National Household Survey 2016/17 9. Uganda Population and Housing Census 2014 Report, Uganda Bureau of Statistics,
March 2016
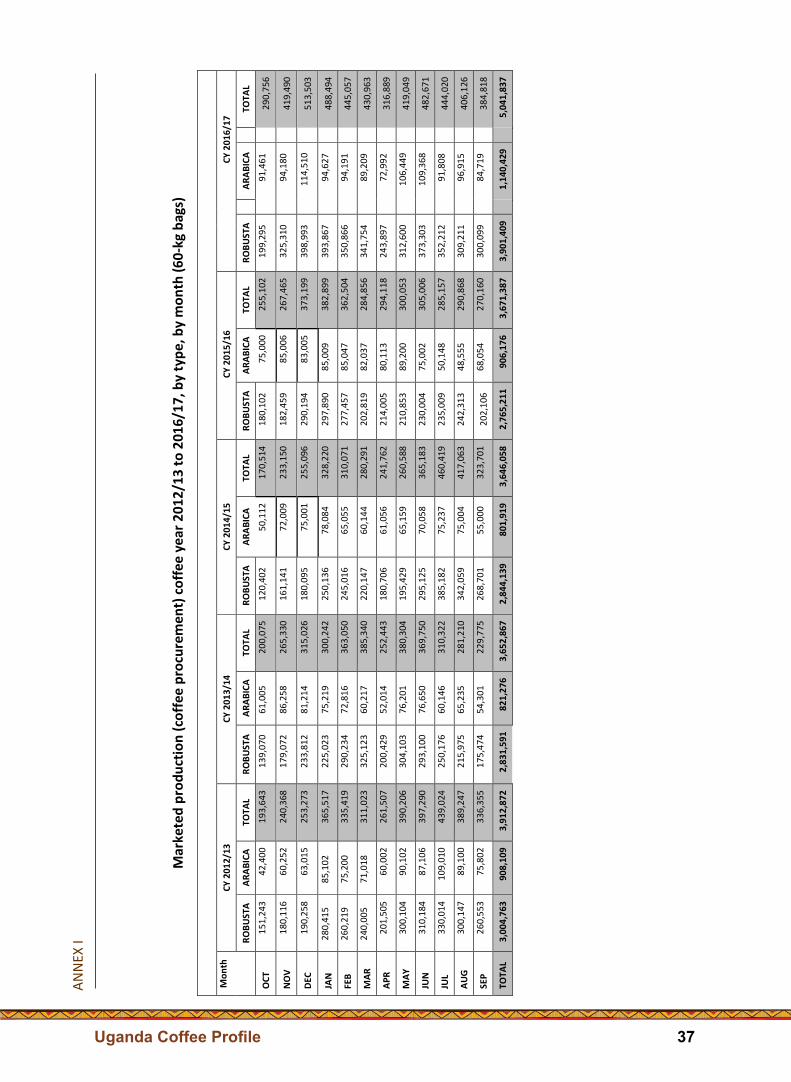
Uganda Coffee Profile 37
ICC-124-8 35
ICO Coffee Profile Uganda
References 1. Bagamba F and Kirinya J, ‘’Drought and Mortality Assessment in the Coffee Sub-
sector”, Report commissioned by Uganda Coffee Development Authority, March 2016 (unpublished).
2. CABI (2017), Crop pests and disease management in Uganda: status and investment needs
3. Citizen’s Guide to the Uganda Vision 2040 ‘A Transformed Ugandan Society from a Peasant to a Modern and Prosperous Country within 30 years’, National Planning Authority,
4. National Agricultural Policy 2013 5. National Coffee Policy 2013 6. National Coffee Strategy 2015/16-2019/20 7. National Development Plan 2015/16-2019/20 8. Uganda National Household Survey 2016/17 9. Uganda Population and Housing Census 2014 Report, Uganda Bureau of Statistics,
March 2016
ICC-
124-
8
AN
NEX
I U
gand
a
IC
O C
offe
e Pr
ofile
ICO Annual Review 2007/08 – 1
Mar
kete
d pr
oduc
tion
(cof
fee
proc
urem
ent)
cof
fee
year
201
2/13
to 2
016/
17, b
y ty
pe, b
y m
onth
(60-
kg b
ags)
Mon
th
CY 2
012/
13
CY 2
013/
14
CY 2
014/
15
CY
2015
/16
CY 2
016/
17
ROBU
STA
ARAB
ICA
TOTA
L RO
BUST
A AR
ABIC
A TO
TAL
ROBU
STA
ARAB
ICA
TOTA
L RO
BUST
A AR
ABIC
A TO
TAL
ROBU
STA
AR
ABIC
A
TOTA
L
OCT
15
1,24
3 42
,400
19
3,64
3
139
,070
6
1,00
5
200,
075
12
0,40
2
50,1
12
170,
514
18
0,10
2
75,0
00
255,
102
19
9,29
5
91,
461
290,
756
NO
V
180,
116
60,2
52
240,
368
1
79,0
72
86,
258
26
5,33
0
161,
141
72
,009
23
3,15
0
182,
459
85
,006
26
7,46
5
325,
310
9
4,18
0
41
9,49
0
DEC
19
0,25
8 63
,015
25
3,27
3
233
,812
8
1,21
4
315,
026
18
0,09
5
75,0
01
255,
096
29
0,19
4
83,0
05
373,
199
39
8,99
3
114,
510
513,
503
JAN
2
80,4
15
85,
102
36
5,51
7
225
,023
7
5,21
9
300,
242
25
0,13
6
78,
084
32
8,22
0
297,
890
8
5,00
9
382,
899
39
3,86
7
94,
627
488,
494
FEB
2
60,2
19
75,
200
33
5,41
9
290
,234
7
2,81
6
363,
050
24
5,01
6
65,
055
31
0,07
1
277,
457
8
5,04
7
362,
504
35
0,86
6
94,
191
445,
057
MAR
2
40,0
05
71,
018
31
1,02
3
325
,123
6
0,21
7
385,
340
22
0,14
7
60,
144
28
0,29
1
202,
819
8
2,03
7
284,
856
34
1,75
4
89,
209
430,
963
APR
201,
505
60,0
02
261,
507
2
00,4
29
52,
014
25
2,44
3
180,
706
6
1,05
6
241,
762
21
4,00
5
80,
113
29
4,11
8
243,
897
7
2,99
2
31
6,88
9
MAY
30
0,10
4 90
,102
39
0,20
6
304
,103
7
6,20
1
380,
304
19
5,42
9
65,
159
26
0,58
8
210,
853
8
9,20
0
300,
053
31
2,60
0
106,
449
419,
049
JUN
31
0,18
4 87
,106
39
7,29
0
293
,100
7
6,65
0
369,
750
29
5,12
5
70,
058
36
5,18
3
230,
004
7
5,00
2
305,
006
37
3,30
3
109,
368
482,
671
JUL
330,
014
109,
010
439,
024
2
50,1
76
60,
146
31
0,32
2
385,
182
7
5,23
7
460,
419
23
5,00
9
50,
148
28
5,15
7
352,
212
9
1,80
8
44
4,02
0
AUG
30
0,14
7 89
,100
38
9,24
7
215
,975
6
5,23
5
281,
210
34
2,05
9
75,
004
41
7,06
3
242,
313
4
8,55
5
290,
868
30
9,21
1
96,
915
406,
126
SEP
26
0,55
3 75
,802
33
6,35
5
175
,474
5
4,30
1
229,
775
26
8,70
1
55,
000
32
3,70
1
202,
106
6
8,05
4
270,
160
30
0,09
9
84,
719
384,
818
TOTA
L 3,
004,
763
908,
109
3,91
2,87
2 2,
831,
591
821,
276
3,65
2,86
7 2,
844,
139
801,
919
3,64
6,05
8 2,
765,
211
906,
176
3,67
1,38
7 3,
901,
409
1,
140,
429
5,
041,
837

Uganda Coffee Profile38
ANN
EX II
IC
C-12
4-8
ICO
Cof
fee
Prof
ile
Uga
nda
ICO Annual Review 2007/08 – Error! Main Document Only.
Cost
of p
rodu
ctio
n an
d m
argi
ns p
er h
ecta
re o
f Rob
usta
cof
fee
(Uga
ndan
shill
ings
)
ACTI
VITY
Su
b ac
tivity
YE
AR 1
YE
AR 2
YE
AR 3
YE
AR 4
YE
AR 5
TO
TALS
Esta
blis
hmen
t Bu
sh C
lear
ing,
Lan
d O
peni
ng
Di
ggin
g ho
les
550,
000
550,
000
Pl
antin
g in
to h
oles
22
0,00
0
22
0,00
0
Man
ure
300,
000
300,
000
300,
000
300,
000
300,
000
1,50
0,00
0
Cost
of s
eedl
ings
33
0,00
0
33
0,00
0
Fert
igat
ion
tren
ches
20
0,00
0 50
,000
50
,000
50
,000
50
,000
40
0,00
0
Mul
chin
g -
- 30
0,00
0 30
0,00
0 30
0,00
0 90
0,00
0
Tool
s (ho
es, p
anga
s etc
) 40
0,00
0
40
0,00
0
800,
000
Su
b to
tal
2,00
0,00
0 35
0,00
0 65
0,00
0 1,
050,
000
650,
000
4,70
0,00
0
M
aint
enan
ce
Wee
ding
, tra
inin
g, p
runi
ng, a
pplic
atio
ns
360,
000
720
,000
7
20,0
00
720
,000
7
20,0
00
3,2
40,0
00
Su
b to
tal
360,
000
720,
000
720,
000
720,
000
720,
000
3,24
0,00
0
In
puts
Fe
rtili
zer
287
,892
2
87,8
92
479,
820
5
75,7
84
1,
200,
000
2,
831,
388
Pe
stic
ides
50,0
00
100,
000
100,
000
100,
000
350,
000
He
rbic
ides
72,0
00
72,0
00
72,0
00
72,0
00
288,
000
Su
b to
tal
2
87,8
92
409,
892
651,
820
747,
784
1,37
2,00
0 3,
469,
388
Harv
estin
g La
bour
43
2,00
0 92
4,00
0 92
4,00
0 2,
280,
000
Ta
rpau
lins
225,
000
225,
000
225,
000
675,
000
Dr
ying
18
0,00
0 36
0,00
0 36
0,00
0 90
0,00
0
Sub
Tota
l
83
7,00
0 1,
284,
000
1,28
4,00
0 3,
855,
000
Cont
inge
ncie
s
195,
500
88,6
00
151,
610
175,
640
175,
640
786,
990
TOTA
L CO
STS
2
,843
,392
1
,568
,492
3
,010
,430
3
,977
,424
4
,201
,640
15
,601
,378
PR
ODU
CTIO
N
Yiel
d (K
g/ha
)
3,
000
3,30
0 3,
630
Av. f
arm
gat
e P
rice
(Kib
oko)
2,
100
2,10
0 2,
100
G
ROSS
INCO
ME
0
0 6,
300,
000
6,93
0,00
0 7,
623,
000
20,8
53,0
00
NET
INCO
ME
(UG
X)
-2
,843
,392
-1
,568
,492
3,
289,
570
2,95
2,57
6 3,
421,
360
5,25
1,62
2
Sour
ce: U
CDA

Uganda Coffee Profile 39
ICC-
124-
8
AN
NEX
III
Uga
nda
ICO
Cof
fee
Prof
ile
Cost
of p
rodu
ctio
n an
d m
argi
ns p
er h
ecta
re o
f Ara
bica
cof
fee
(Uga
ndan
shill
ings
) AC
TIVI
TY
Sub
activ
ity
YEAR
1
YEAR
2
YEAR
3
YEAR
4
YEAR
5
TOTA
LS
Esta
blis
hmen
t Bu
sh C
lear
ing,
Lan
d O
peni
ng
550,
000
550,
000
Di
ggin
g ho
les
820,
000
820,
000
Pl
antin
g in
to h
oles
32
8,00
0
32
8,00
0
Man
ure
300,
000
300,
000
300,
000
300,
000
300,
000
1,50
0,00
0
Cost
of s
eedl
ings
49
2,00
0
49
2,00
0
Fert
igat
ion
tren
ches
20
0,00
0 50
,000
50
,000
50
,000
50
,000
40
0,00
0
Mul
chin
g -
- 30
0,00
0 30
0,00
0 30
0,00
0 90
0,00
0
Tool
s (ho
es, p
anga
s etc
) 15
0,00
0 20
,000
20
,000
20
,000
20
,000
23
0,00
0
Sub
tota
l 2,
840,
000
370,
000
670,
000
670,
000
670,
000
5,22
0,00
0
Mai
nten
ance
W
eedi
ng, t
rain
ing,
pru
ning
, app
licat
ions
36
0,00
0 72
0,00
0 72
0,00
0 72
0,00
0 72
0,00
0 3,
240,
000
Su
b to
tal
360,
000
720,
000
720,
000
720,
000
720,
000
3,24
0,00
0 In
puts
Fe
rtili
zer
- -
480,
000
480,
000
480,
000
1,44
0,00
0
Pest
icid
es
200,
000
200,
000
200,
000
200,
000
200,
000
1,00
0,00
0
Herb
icid
es
72
,000
72
,000
72
,000
72
,000
28
8,00
0
Sub
tota
l 20
0,00
0 27
2,00
0 75
2,00
0 75
2,00
0 75
2,00
0 2,
728,
000
Harv
estin
g La
bour
43
2,00
0 92
4,00
0 92
4,00
0 2,
280,
000
Ta
rpau
lins
225,
000
225,
000
Pu
lpin
g an
d Dr
ying
18
0,00
0 36
0,00
0 36
0,00
0 90
0,00
0
Sub
Tota
l 0
0 83
7,00
0 1,
284,
000
1,28
4,00
0 3,
405,
000
Cont
inge
ncie
s
170,
000
68,1
00
148,
950
171,
300
171,
300
729,
650
TOTA
L CO
STS
3,
570,
000
1,43
0,10
0 3,
127,
950
3,59
7,30
0 3,
597,
300
15,3
22,6
50
PRO
DUCT
ION
Yi
eld
-Par
chm
ent(
Kg/h
a)
- -
600
1,20
0 1,
200
Av
. far
m g
ate
Pric
e
5
,700
5,
700
5,70
0
GRO
SS IN
COM
E
0 0
3,42
0,00
0 6,
840,
000
6,84
0,00
0 17
,100
,000
NET
INCO
ME
-3
,570
,000
-1
,430
,100
29
2,05
0 3,
242,
700
3,24
2,70
0 1,
777,
350
*Ara
bica
Cof
fee
prof
itabi
lity
is hi
ghly
pric
e se
nsiti
ve si
nce
the
cost
of p
rodu
ctio
n is
high
er th
an th
at o
f Rob
usta
. Pro
fitab
ility
will
be
ensu
red
in th
e ne
xt p
rodu
ctio
n cy
cle
Sour
ce: U
CDA

Uganda Coffee Profile40
ANN
EX IV
IC
C-12
4-8
Uga
nda
ICO
Cof
fee
Prof
ile
Coffe
e ex
port
s by
dest
inat
ion ‒
Coffe
e ye
ars 2
007/
08 to
201
7/18
(60-
kg b
ags)
Dest
inat
ions
20
07/0
8 20
08/0
9 20
09/1
0 20
10/1
1 20
11/1
2 20
12/1
3 20
13/1
4 20
14/1
5 20
15/1
6 20
16/1
7 20
17/1
8 EU
2,4
98,3
97
2,31
2,10
4 1,
939,
235
2,36
5,15
9 1,
828,
300
2,46
8,89
0
2
,373
,392
2,
403,
547
2,25
4,51
2 2,
846,
675
2,72
5,08
5 Su
dan
440
,834
42
9,98
1 49
9,75
5 46
0,03
2 42
7,57
3 45
4,00
7
577
,348
50
8,50
6 45
5,97
0 66
3,81
6 59
7,71
4 Sw
itzer
land
73,
089
16
,525
98
,626
11
9,79
7 42
,130
33
,903
5
8,95
2
55,7
67
22,1
08
71,2
82
29,7
23
USA
27,
065
90
,455
79
,485
95
,168
10
6,48
9 19
5,56
1
7
7,10
5
106,
939
117,
985
152,
821
178,
605
Indi
a
70,
560
50
,104
-
- 72
,868
90
,080
9
9,60
4
94,7
20
131,
532
233,
072
222,
956
Russ
ia
-
- 5,
186
26,2
80
34,1
01
22,1
48
20,
891
32
,192
32
,710
28
,975
30
,777
U
AE
1,
313
2,24
0
654
836
Isra
el
1
4,17
0
12,6
40
22,6
50
23,7
41
20,3
47
12,8
58
18,
279
18
,650
25
,609
21
,764
36
,319
Eg
ypt
2,5
69
3,73
5 67
0 10
,476
8,
973
-
9
60
320
2,58
0 32
0 1,
298
Aust
ralia
4
,770
3,
820
4,48
0 9,
370
7,04
0 5,
130
8,
998
8,
417
4,38
0 7,
003
9,04
7 Er
itrea
3
,436
-
- -
- -
1,
380
Ch
ina
3,3
49
- -
0 7,
815
4,71
0
1
0,69
6
20,9
68
13,2
27
18,2
05
15,9
10
Alge
ria
4,6
76
- -
9,35
2 7,
988
2,28
0
1,67
0
6,
065
99,5
51
85,9
93
Keny
a -
1,
628
320
8,56
1 17
,584
1,
364
2,
652
2,
490
660
2,93
7 8,
438
Mor
occo
9
,998
4,
730
4,61
4 7,
900
- 36
,112
6
1,47
5
34,5
90
44,1
97
134,
663
132,
471
Japa
n
26,
678
7,
920
2,89
0 5,
937
7,05
9 19
,130
2
4,03
2
42,6
85
19,9
80
39,9
55
21,3
56
Cana
da
-
1,78
7 5,
450
5,38
2 -
1,47
0
1,49
0
5,47
0 1,
606
30,8
54
22,2
13
Nor
way
-
-
- 96
0
-
Sing
apor
e
27,
708
9,
018
5,61
0 66
8 1,
540
24,2
41
25,
274
35
,639
9,
708
9,12
0 2,
577
Hong
-Kon
g -
-
- 64
0 32
0 32
0
3
20
66
0
640
Syria
-
10
,606
-
- -
1,28
0
1,93
4
Ecua
dor
-
2,56
0 -
- 65
,291
44
,052
3
0,09
0
Sout
h-Af
rica
-
1,27
8 -
- 18
,931
5,
610
18,
425
26
,425
26
,421
32
,808
30
,747
Vi
etna
m
-
- -
- 17
,974
96
0
7,
323
1,60
0 6,
183
Mid
dle
East
-
-
- -
1555
9 2,
240
M
exic
o -
-
- -
960
1,
280
6,08
0 35
,200
15
,053
15
,400
U
K
10
,760
10
,872
32
,601
Ta
iwan
-
-
- -
2,80
0 1,
340
3,
000
2,
400
3,90
0 3,
965
7,07
0 S.
Kor
ea
-
- -
- -
18,1
18
63,
507
32
,833
40
,819
19
,965
23
,704
Tu
nisia
-
-
- -
14,6
07
125,
814
36,5
50
133,
210
N
ew Z
eala
nd
890
11
,736
4,
130
13,7
34
648
Ukr
aine
2,
240
6,
634
Mad
agas
car
43,9
24
Turk
ey
889
6,29
9 3,
432
Cape
Ver
de
1,60
0 1,
280
2,56
0 O
ther
s 3,
304
94,7
97
11
,011
1
6,80
6 3,
238
2,24
6 2,
771
10,7
36
Gra
nd-T
otal
3,
210,
603
3,05
3,68
8 2,
668,
971
3,14
9,42
3 2,
726,
249
3,58
2,62
9
3
,499
,829
3,
455,
852
3,31
5,56
7 4,
605,
158
4,30
5,59
7

Uganda Coffee Profile 41
ANN
EX IV
IC
C-12
4-8
Uga
nda
ICO
Cof
fee
Prof
ile
Coffe
e ex
port
s by
dest
inat
ion ‒
Coffe
e ye
ars 2
007/
08 to
201
7/18
(60-
kg b
ags)
Dest
inat
ions
20
07/0
8 20
08/0
9 20
09/1
0 20
10/1
1 20
11/1
2 20
12/1
3 20
13/1
4 20
14/1
5 20
15/1
6 20
16/1
7 20
17/1
8 EU
2,4
98,3
97
2,31
2,10
4 1,
939,
235
2,36
5,15
9 1,
828,
300
2,46
8,89
0
2
,373
,392
2,
403,
547
2,25
4,51
2 2,
846,
675
2,72
5,08
5 Su
dan
440
,834
42
9,98
1 49
9,75
5 46
0,03
2 42
7,57
3 45
4,00
7
577
,348
50
8,50
6 45
5,97
0 66
3,81
6 59
7,71
4 Sw
itzer
land
73,
089
16
,525
98
,626
11
9,79
7 42
,130
33
,903
5
8,95
2
55,7
67
22,1
08
71,2
82
29,7
23
USA
27,
065
90
,455
79
,485
95
,168
10
6,48
9 19
5,56
1
7
7,10
5
106,
939
117,
985
152,
821
178,
605
Indi
a
70,
560
50
,104
-
- 72
,868
90
,080
9
9,60
4
94,7
20
131,
532
233,
072
222,
956
Russ
ia
-
- 5,
186
26,2
80
34,1
01
22,1
48
20,
891
32
,192
32
,710
28
,975
30
,777
U
AE
1,
313
2,24
0
654
836
Isra
el
1
4,17
0
12,6
40
22,6
50
23,7
41
20,3
47
12,8
58
18,
279
18
,650
25
,609
21
,764
36
,319
Eg
ypt
2,5
69
3,73
5 67
0 10
,476
8,
973
-
9
60
320
2,58
0 32
0 1,
298
Aust
ralia
4
,770
3,
820
4,48
0 9,
370
7,04
0 5,
130
8,
998
8,
417
4,38
0 7,
003
9,04
7 Er
itrea
3
,436
-
- -
- -
1,
380
Ch
ina
3,3
49
- -
0 7,
815
4,71
0
1
0,69
6
20,9
68
13,2
27
18,2
05
15,9
10
Alge
ria
4,6
76
- -
9,35
2 7,
988
2,28
0
1,67
0
6,
065
99,5
51
85,9
93
Keny
a -
1,
628
320
8,56
1 17
,584
1,
364
2,
652
2,
490
660
2,93
7 8,
438
Mor
occo
9
,998
4,
730
4,61
4 7,
900
- 36
,112
6
1,47
5
34,5
90
44,1
97
134,
663
132,
471
Japa
n
26,
678
7,
920
2,89
0 5,
937
7,05
9 19
,130
2
4,03
2
42,6
85
19,9
80
39,9
55
21,3
56
Cana
da
-
1,78
7 5,
450
5,38
2 -
1,47
0
1,49
0
5,47
0 1,
606
30,8
54
22,2
13
Nor
way
-
-
- 96
0
-
Sing
apor
e
27,
708
9,
018
5,61
0 66
8 1,
540
24,2
41
25,
274
35
,639
9,
708
9,12
0 2,
577
Hong
-Kon
g -
-
- 64
0 32
0 32
0
3
20
66
0
640
Syria
-
10
,606
-
- -
1,28
0
1,93
4
Ecua
dor
-
2,56
0 -
- 65
,291
44
,052
3
0,09
0
Sout
h-Af
rica
-
1,27
8 -
- 18
,931
5,
610
18,
425
26
,425
26
,421
32
,808
30
,747
Vi
etna
m
-
- -
- 17
,974
96
0
7,
323
1,60
0 6,
183
Mid
dle
East
-
-
- -
1555
9 2,
240
M
exic
o -
-
- -
960
1,
280
6,08
0 35
,200
15
,053
15
,400
U
K
10
,760
10
,872
32
,601
Ta
iwan
-
-
- -
2,80
0 1,
340
3,
000
2,
400
3,90
0 3,
965
7,07
0 S.
Kor
ea
-
- -
- -
18,1
18
63,
507
32
,833
40
,819
19
,965
23
,704
Tu
nisia
-
-
- -
14,6
07
125,
814
36,5
50
133,
210
N
ew Z
eala
nd
890
11
,736
4,
130
13,7
34
648
Ukr
aine
2,
240
6,
634
Mad
agas
car
43,9
24
Turk
ey
889
6,29
9 3,
432
Cape
Ver
de
1,60
0 1,
280
2,56
0 O
ther
s 3,
304
94,7
97
11
,011
1
6,80
6 3,
238
2,24
6 2,
771
10,7
36
Gra
nd-T
otal
3,
210,
603
3,05
3,68
8 2,
668,
971
3,14
9,42
3 2,
726,
249
3,58
2,62
9
3
,499
,829
3,
455,
852
3,31
5,56
7 4,
605,
158
4,30
5,59
7
ICC-
124-
8
AN
NEX
V
Uga
nda
ICO
Cof
fee
Prof
ile
Uga
nda’
s cer
tifie
d/su
stai
nabl
e co
ffee
expo
rts b
y co
ffee
year
, by
type
(60-
kg b
ags)
G
RADE
20
07/0
8 20
08/0
9 20
09/1
0 20
10/1
1 20
11/1
2 20
12/1
3 20
13/1
4 20
14/1
5 20
15/1
6 20
16/1
7 Ro
bust
a
Org
anic
6
,505
5,
657
10,
264
5,
480
6,7
70
5
,494
6
,780
21,
428
8
,230
13
,545
O
rgan
ic R
obus
ta U
tz
950
13
,545
Ro
bust
a U
tz
990
2,3
10
1,6
70
700
1,05
0
Was
hed
17
,330
13,
495
19,
709
14,2
47
10,
239
2
5,73
0
29,7
15
2
1,50
0
1
8,95
6
21,9
46
SC 1
5 U
tz
9
90
1,4
40
Ro
bust
a TO
TAL
23,8
35
1
9,15
2
2
9,97
3
19
,727
1
7,99
9
34,
524
40
,555
42,
928
27,
886
50
,086
Ar
abic
a
Mt.
Elgo
n A+
Utz
2
,100
Mt.
Elgo
n U
tz
640
M
t. El
gon
A+
1
2,36
1
37,1
61
2,3
95
2
0,28
8
12,8
51
Mt.
Elgo
n A
1
,630
2
,650
25,
305
9
,834
43
,194
M
t Elg
on A
A
150
690
2,00
7
Mt.
Elgo
n CP
B
7
00
M
t. El
gon
16,
019
2
,840
1
,110
700
Rwen
zori
AA
5
86
333
Rw
enzo
ri A+
3
10
Rw
enzo
ri
1,0
20
320
21
36
0
Rwen
zori
A
4,5
36
2,
440
Ki
soro
PB
4
Bu
gisu
UTZ
1,
770
O
RGAN
IC
31,9
51
2
1,42
6
Sipi
Fal
ls
3,5
36
4,7
80
9,0
55
6,6
10
9,
121
W
hite
Nile
2,
570
O
rgan
ic B
ugisu
13,
500
18,7
40
33,
854
1,2
80
4,1
60
1
7,36
1
1
1,78
0
11,1
93
Bugi
su R
FA
1,1
20
Org
anic
Oko
ro
1
0,58
5
19
,408
3,4
14
17,
810
8
,200
12,
480
9
,120
7,18
0
Oko
ro R
FA
3
20
Org
anic
Dru
gar
6
,478
4,9
10
4,3
60
1,3
40
1
1,23
3
5,
094
O
rgan
ic W
ugar
2,4
48
2
,398
1
,031
2
,880
2,43
0
Arab
ica
Tota
l
31
,951
21,
426
24,
085
38,1
48
46,
194
6
0,00
6
68,9
69
7
0,86
7
7
8,98
1
1
00,5
57
GRA
ND
TOTA
L
55
,786
40,
578
54,
058
57,8
75
64,
193
9
4,53
0
1
09,5
24
113
,795
1
06,8
67
1
50,6
43
* W
ashe
d Ro
bust
a is
take
n as
a s
usta
inab
le c
offe
e

Uganda Coffee Profile42
ANN
EX V
I
IC
C-12
4-8
Uga
nda
ICO
Cof
fee
Prof
ile
Valu
e of
exp
orts
of m
erch
andi
se (U
S$ m
illio
ns),
by c
alen
dar y
ear
Trad
able
s 20
08
2009
20
10
2011
20
12
2013
20
14
2015
20
16
2017
Tota
l Exp
orts
(in
US$
mill
ion)
1. C
offe
e (V
alue
) 39
8.12
28
0.21
28
4.64
46
6.66
37
2.50
42
5.41
40
7.40
40
2.63
37
1.65
55
5.44
Volu
me
('000
,000
60-
Kg b
ags)
3.
31
3.02
2.
66
3.14
2.
69
3.69
3.
45
3.60
3.
54
4.78
Av. u
nit v
alue
2.
00
1.54
1.
78
2.48
2.
31
1.91
1.
99
1.86
1.
75
1.94
2.
Non
-Cof
fee
form
al e
xpor
ts
1,25
5.42
1,
242.
81
1,35
1.00
1,
696.
63
1,98
4.25
1,
982.
05
1,90
2.79
1,
865.
43
2,13
0.36
2,
245.
44
Elec
tric
ity
11.6
6 13
.13
12.5
3 16
.32
15.6
2 17
.28
34.2
0 17
.03
21.3
2 56
.10
Gold
50
.27
23.0
7 30
.08
7.54
7.
82
3.25
0.
24
35.7
5 33
9.54
31
7.93
Cott
on
17.5
3 19
.64
21.1
9 85
.88
76.0
0 31
.42
21.8
3 20
.57
31.4
3 50
.70
Tea
47.3
5 58
.61
68.2
6 71
.81
73.9
0 85
.62
84.7
0 69
.94
71.5
8 79
.72
Toba
cco
72.7
3 61
.70
69.3
5 54
.52
61.5
9 11
4.94
65
.27
73.1
3 61
.73
46.2
2
Fish
& it
s pro
d. (e
xcl.
regi
onal
) 13
1.14
11
3.03
13
3.82
14
2.47
12
1.30
10
6.99
13
4.09
11
7.56
12
1.80
13
7.07
Hide
s & sk
ins
13.0
1 6.
17
17.1
5 33
.05
41.4
1 63
.75
73.3
4 62
.71
51.6
6 53
.22
Sim
sim
14.1
5 11
.50
12.8
7 17
.28
11.5
6 28
.61
55.1
1 52
.20
14.5
2 17
.27
Mai
ze
18.1
2 26
.54
35.4
2 27
.34
59.1
6 42
.09
47.2
6 90
.97
70.1
7 95
.91
Bean
s 12
.78
10.8
7 7.
96
18.8
6 12
.68
16.0
2 25
.12
53.8
8 38
.26
84.2
1
Flow
ers
46.4
8 46
.90
46.5
5 52
.48
52.6
7 56
.80
57.4
9 51
.44
51.6
5 57
.72
Oil
re-e
xpor
ts
54.1
7 10
2.77
10
6.97
10
6.86
13
2.96
13
6.77
14
9.11
13
1.25
11
9.86
12
9.37
Coba
lt 20
.23
15.4
3 16
.75
17.6
4 14
.24
10.1
1 0.
00
0.00
0.
00
0.00
Oth
ers
745.
80
733.
47
772.
13
1,04
4.58
1,
303.
34
1,26
8.39
1,
155.
02
1,08
9.00
1,
136.
84
1,12
0.00
So
urce
: Ban
k of
Uga
nda
Stat
istic
s Dep
artm
ent

Uganda Coffee Profile 43
Uganda Coffee Profile44

Uganda Coffee Profile 01

Uganda Coffee Development AuthorityCoffee House,
Plot 35 Jinja Road,P.O.Box 7267, Kampala, Uganda
Tel: (+256) -312-260470Email: [email protected]
Website: www. ugandaCoffee.go.ugTwitter: @CoffeeUganda