Embed Size (px)
Citation preview

© The Treasury/code
Individual Net Worth in New Zealand: A Preliminary Analysis of a New Survey
John K Gibson & Grant M Scobie Conference of the NZ Society of Actuaries
Rotorua, November 13-15, 2002

© The Treasury/code
Acknowledgements
• Statistics NZ
• Office of the Retirement Commissioner

© The Treasury/code
Outline
• New Survey
• Some Basic Results
• What Determines Net Wealth
• Are there Ethnic differences?
• Do Student Loans matter?
• Human capital – a hidden asset?
• Conclusions and Unfinished Business

© The Treasury/code
Household Saving Survey
• Net wealth of NZ households
• 2001 – first time; assets & liabilities
• Background: Retirement Income Act 1993
• Periodic Review Group
• 6,600 households approached
• Plus Maori “booster” sample
• 74% response rate : n = 5374

© The Treasury/code
Coverage
• Households (not institutions)
• 18+ age
• Resident of NZ
• One individual per household – randomly selected.
• If couple present, then both included – assumed wealth was split 50:50

© The Treasury/code
Sample Size
2 ,392In d ivid u a ls
2 ,982C o u p les
n = 5 ,3 74

© The Treasury/code
Assets & Liabilities
• House 36%• Farms & Business 18%• Super. & Life Ins 8%• Trusts 6%• Shares & Funds 6%• Bank deposits 6%• Rental Prop 4%• M/Vehicles 4%• TOTAL $444bn
• Mortgage 80%• Bank Debt 10%• Student Loan 5%• Credit Card/ HP 4%
• TOTAL $68bn

© The Treasury/code
Structure of liabilities: individuals
Type of Liability
Median Value
Percentage of all individuals reporting holding this asset (%)
Mortgage $68,000 17.0Student Loan $9,000 20.6
Credit Card $800 33.7Bank debt $2,000 21.5
Hire purchase $1,000 14.9
© The Treasury/code
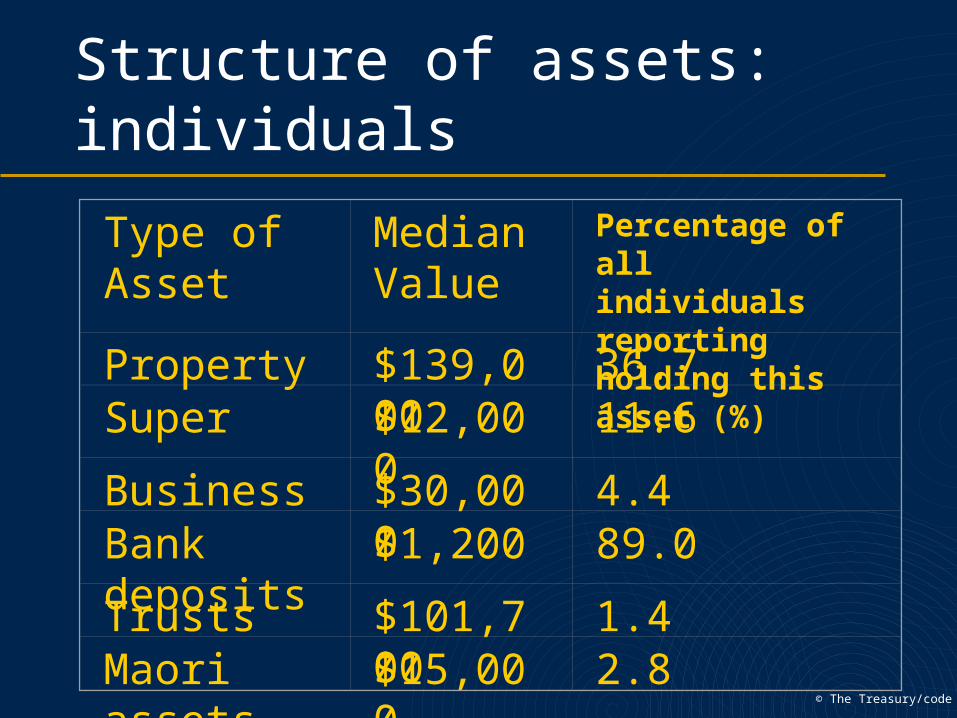
Structure of assets: individuals
Type of Asset Median Value
Percentage of all individuals reporting holding this asset (%)
Property $139,000 36.7Super $12,000 11.6
Business $30,000 4.4Bank deposits $1,200 89.0
Trusts $101,700 1.4Maori assets $15,000 2.8

© The Treasury/code
Structure of assets: international
Type Canada
%
USA
%
NZ
%
Residence 38 28 36
Other property 8 10 10
Superannuation 15 11 6
Shares & Funds 6 18 6

© The Treasury/code
Distribution of Net Worth
Negative 23
$0 - $20,000 34
$20,001 - $100,000 16
$100,001 - $500,000 23
$500,001 and more 4
Level of Net Worth Percentage of Individuals
Total 100

© The Treasury/code
Inequality in the Distribution of Income and Wealth
Proportion of individuals
Share of Income or Wealth
Perfect Equality
50%
HDI
NW
0100
100

© The Treasury/code
Gini Coefficients:
0
EQUAL
1
UNEQUAL
0.322 0.689
Household Disoposable Income
Net Worth

© The Treasury/code
Net Worth by age: individuals
-50,000
0
50,000
100,000
150,000
200,000
250,000
18 24 30 36 42 48 54 60 66 72 78 84 90 96
Age
Net
Wor
th

© The Treasury/code
What matters for net worth?…1
Variable Impact
Age Significant
Gender NS
Marital status NS
Maori NS
Pac Is NS
Asian + ($45,500)
Other NS

© The Treasury/code
What matters for net worth?…2
Variable Impact
Migrant NS
Rural + ($66,800)
Metro + ($18,800)
Region 10 + ($80,000)
Yrs Sec. Schooling + ($7,500)
Rec’d Inheritance + ($45,500)
Amount of Inheritance + 56 cents per $1
Expect Inheritance + ($23,200)

© The Treasury/code
What matters for net worth?…3
Variable Impact
Age first bought property Significant (-$2,100/yr)
Property as share of NW Significant (-$36,000/yr)
Shares as share of NW NS

© The Treasury/code
What matters for net worth?…4
Variable Impact
Main income self-emp Sig (+$250,000)
Main income NZ Super Sig (-$54,000)
Main income other pension NS
Main income other support Sig (+$26,000)
Main income investment Sig (+$270,00)
Main income other Sig (+$111,000)
Main income not spec. Sig (+$58,900)

© The Treasury/code
What matters for net worth?…5
Variable Impact
Age at first employment NS
Number of years employed Sig (+$1,250)
Full time NS
Unemployed NS
Not in labour force NS
Labour Force status relative to part-time

© The Treasury/code
What matters for net worth?…6
Variable Impact
Occupation: Managers NS
Occupation: Professionals NS
Occupation:Technical NS
Occupation:Clerical Sig (+$39,000)
Occupation: Service & Sales NS
Occupation: Agric. & fisheries Sig (+$83,000)

© The Treasury/code
What matters for net worth?…7
Variable Impact
Occupation: Trades NS
Occupation: P&M Operators NS
Occupation: Elementary NS
Occupation: Not specified NS
Unemployed NS
Occupation relative to not in labour force

© The Treasury/code
Individual Net Worth by Ethnicity
Ethnic Group Mean Median
European/Pakeha 119,900 21,700
Maori 38,900 800
Pacific Islands 46,400 0
Asian 59,900 3,000
Total 97,900 10,300

© The Treasury/code
Effect of Ethnicity on Individual Net Worth: Conditional Estimates
Ethnic Group Coefficient t-value
Maori -350 -0.04
Pacific Islands 16,900 +1.06
Asian 52,900 +3.17
Constant 118,500

© The Treasury/code
Factors explaining Maori-Pakeha differences in net worth
-90,000-80,000-70,000-60,000-50,000-40,000-30,000-20,000-10,000
010,000
Ag
e
Ma
le
Ne
ve
r
Ma
rri
ed
Mig
ra
nt
Lo
ca
tio
n
Ed
uc
ati
on
Ag
e p
urc
h
pr
op
Inh
er
ita
nc
e
Po
rtfo
lio
Inc
om
e
So
urc
eIn
co
me
Le
ve
l
To
tal

© The Treasury/code
Human Capital?
• Plumber: – Assets: $120,000– Liabilities: $60,000 NET = +$60,000
• Dental Student: – Assets: Nil– Liabilities: $60,000 NET = - $60,000
• Something is missing?

© The Treasury/code
Estimating human capital
kRtP
kty
kug
ktH
,1)1()1)(1(
Present value of future labour earnings
Allow for unemployment, real growth and survival
Recursive
Allows for market based labour income to age 65
No change of status - conservative
© The Treasury/code
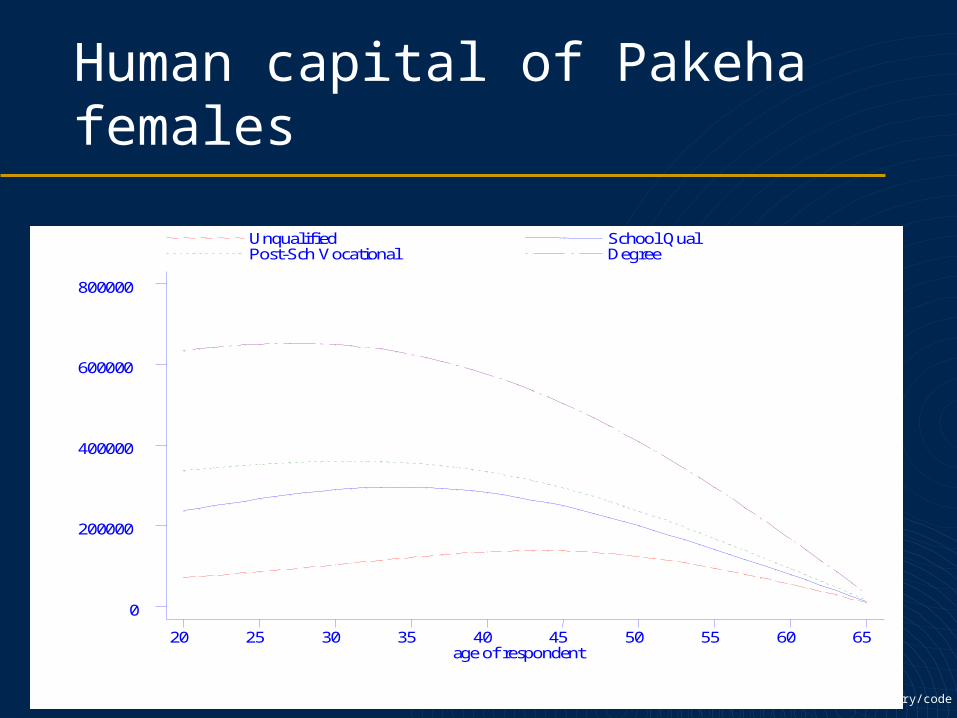
Human capital of Pakeha females
age of respondent
Unqualified School Qual Post-Sch Vocational Degree
20 25 30 35 40 45 50 55 60 65 0
200000
400000
600000
800000

© The Treasury/code
Human capital of Pakeha males
age of respondent
Unqualified School Qual Post-Sch Vocational Degree
20 25 30 35 40 45 50 55 60 65 0
500000
1.0e+06
© The Treasury/code
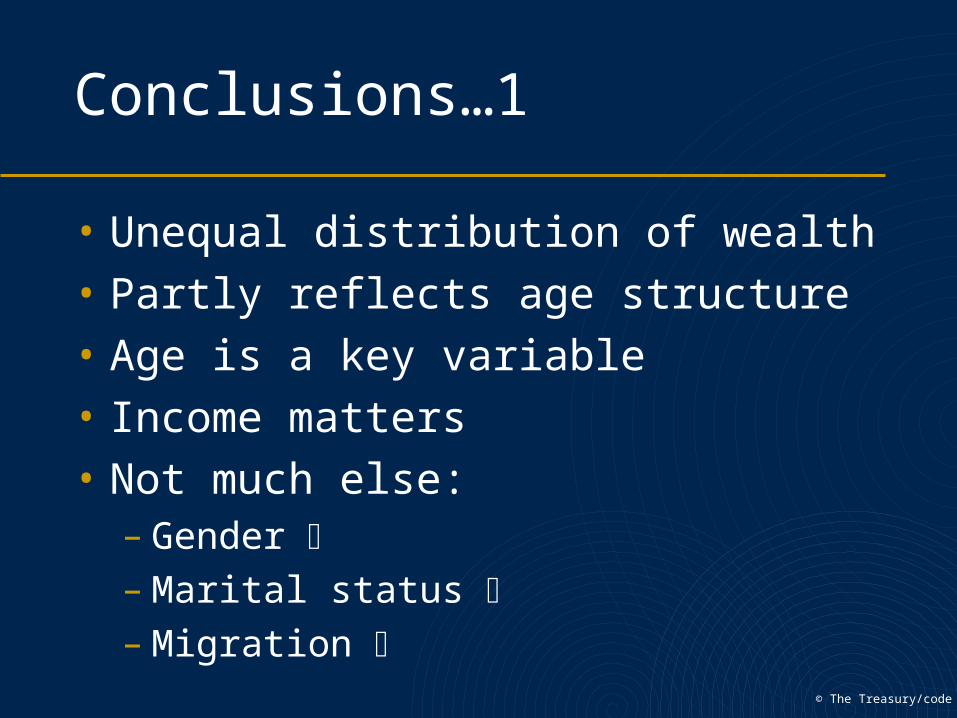
Conclusions…1
• Unequal distribution of wealth
• Partly reflects age structure
• Age is a key variable
• Income matters
• Not much else:– Gender – Marital status – Migration

© The Treasury/code
Conclusions…2
• Inheritances matter
• Secondary schooling matters
• Buying property matters
• Years employed matters
• Student loans – some modest effect
• No ethnic effect
• Human capital – could be very important

© The Treasury/code
Caveats
• Only for individuals – not couples
• No cohort effects
• Incorporate human capital
• Retirement income adequacy
• Still 60% unexplained variation