Embed Size (px)
Citation preview
© The McGraw-Hill Companies, Inc., 2000
Chapter 13Chapter 13
NonparametricNonparametric
StatisticsStatistics
© The McGraw-Hill Companies, Inc., 2000
State the advantages and disadvantages of nonparametric methods.
Test hypotheses using the Sign test. Test hypotheses using the Wilcoxon
rank sum test. Test hypotheses using the Wilcoxon
signed-rank test.
ObjectivesObjectives
© The McGraw-Hill Companies, Inc., 2000
Test hypotheses using the Kruskal-Wallis test.
Compute the Spearman rank correlation coefficient.
ObjectivesObjectives
© The McGraw-Hill Companies, Inc., 2000
IntroductionIntroduction
Nonparametric statistics or distribution-free statistics are used when the population from which the samples are selected is not normally distributed.
© The McGraw-Hill Companies, Inc., 2000
Advantages of Nonparametric Advantages of Nonparametric MethodsMethods
They can be used to test population parameters when the variable is not normally distributed.
They can be used when the data are nominal or ordinal.
They can be used to test hypotheses that do not involve population parameters.
© The McGraw-Hill Companies, Inc., 2000
Advantages of Nonparametric Advantages of Nonparametric MethodsMethods
In most cases, the computations are easier than those for the parametric counterparts.
They are easier to understand.
© The McGraw-Hill Companies, Inc., 2000
Disadvantages of Nonparametric Disadvantages of Nonparametric MethodsMethods
They are less sensitive than their parametric counterparts when the assumptions of the parametric methods are met. Therefore, larger differences are needed before the null hypothesis can be rejected.
They tend to use less information than the parametric tests. For example, the sign test requires the researcher to determine only whether the data values are above or below the median, not how much above or below the median each value is.
© The McGraw-Hill Companies, Inc., 2000
Disadvantages of Nonparametric Disadvantages of Nonparametric MethodsMethods
They are less efficient than their parametric counterparts when the assumptions of the parametric methods are met; that is, larger sample sizes are needed to overcome the loss of information. For example, the nonparametric sign test is about 60% as efficient as its parametric counterpart, the z- test. Thus, a sample size of 100 is needed for use of the sign test, compared with a sample size of 60 for use of the z test to obtain the same results.
© The McGraw-Hill Companies, Inc., 2000
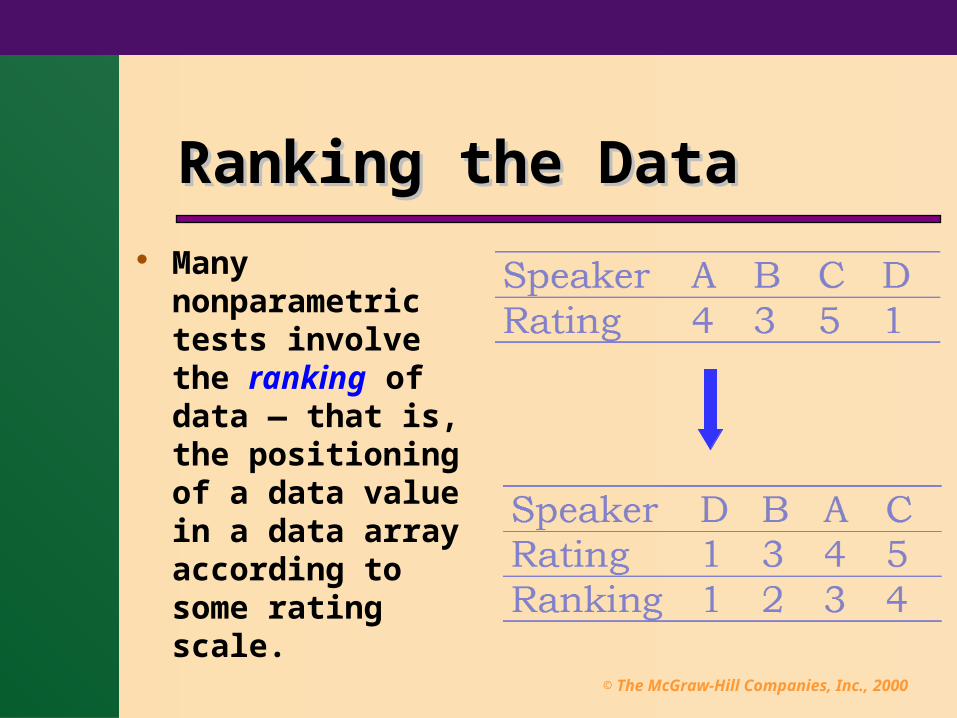
Ranking the DataRanking the Data
Many nonparametric tests involve the ranking of data — that is, the positioning of a data value in a data array according to some rating scale.
© The McGraw-Hill Companies, Inc., 2000
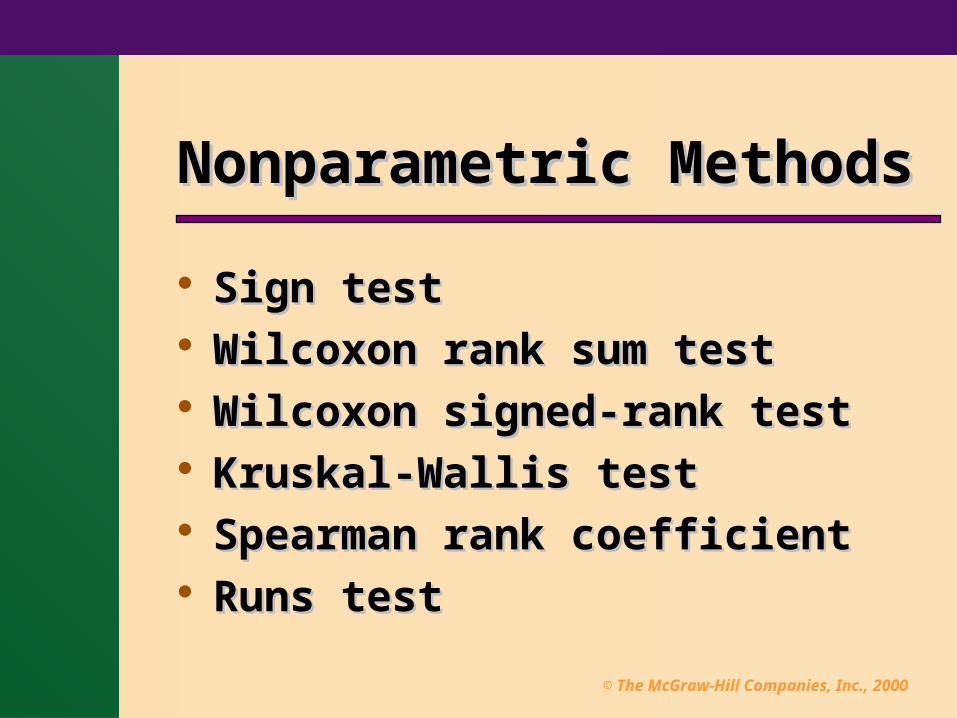
Nonparametric MethodsNonparametric Methods
Sign testSign test Wilcoxon rank sum testWilcoxon rank sum test Wilcoxon signed-rank testWilcoxon signed-rank test Kruskal-Wallis testKruskal-Wallis test Spearman rank coefficientSpearman rank coefficient Runs testRuns test
© The McGraw-Hill Companies, Inc., 2000
Single-sample Sign TestSingle-sample Sign Test
The sign test is the simplest of the nonparametric tests and is used to test the value of a median for a specific sample.
When using the sign test, the researcher hypothesizes the specific value for the median of a population; then he or she selects a sample of data and compares each value with the conjectured median.
© The McGraw-Hill Companies, Inc., 2000
Single-sample Sign TestSingle-sample Sign Test
If the data value is above the conjectured median, it is assigned a “+” sign.
If it is below the conjectured median, it is assigned a “–” sign.
If it is exactly the same as the conjectured median, it is assigned a “0”.
© The McGraw-Hill Companies, Inc., 2000
Single-sample Sign TestSingle-sample Sign Test
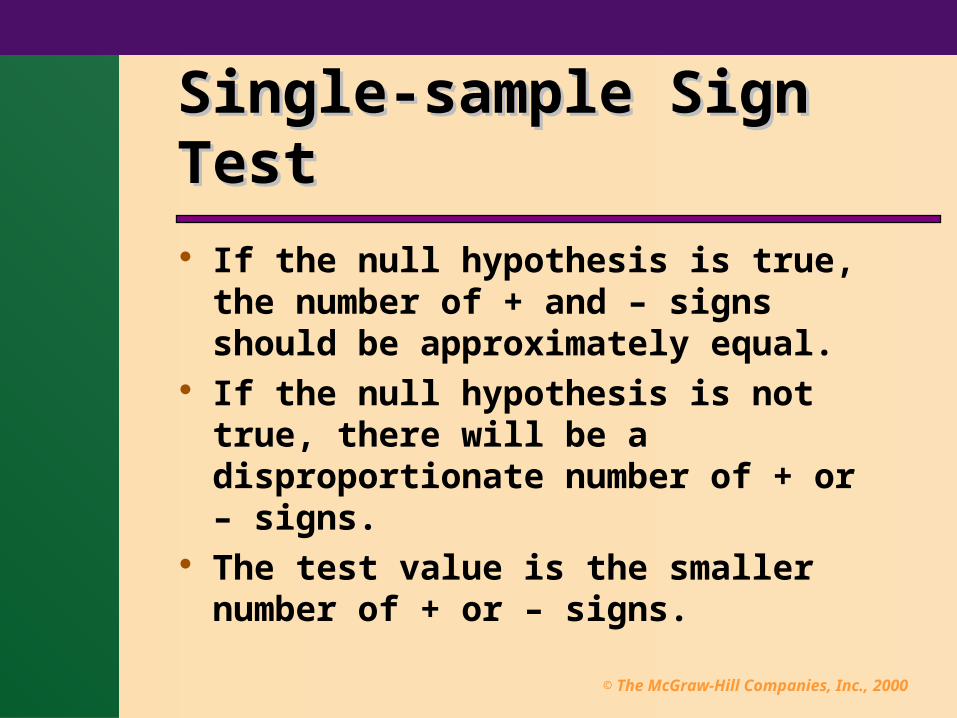
If the null hypothesis is true, the number of + and – signs should be approximately equal.
If the null hypothesis is not true, there will be a disproportionate number of + or – signs.
The test value is the smaller number of + or – signs.
© The McGraw-Hill Companies, Inc., 2000
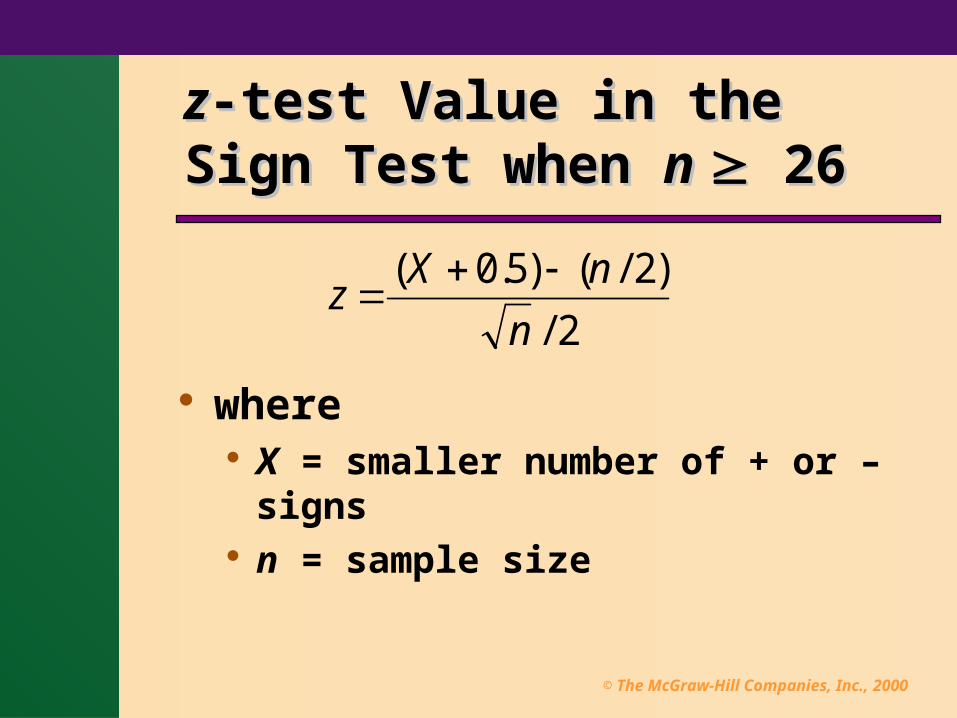
zz-test Value in the Sign Test -test Value in the Sign Test when when n n 26 26
where X = smaller number of + or – signs n = sample size
2/
)2/()5.0(
n
nXz
© The McGraw-Hill Companies, Inc., 2000
Wilcoxon Rank Sum TestWilcoxon Rank Sum Test
The Wilcoxon rank sum test is used for independent samples.
Both sample sizes must be 10.
© The McGraw-Hill Companies, Inc., 2000
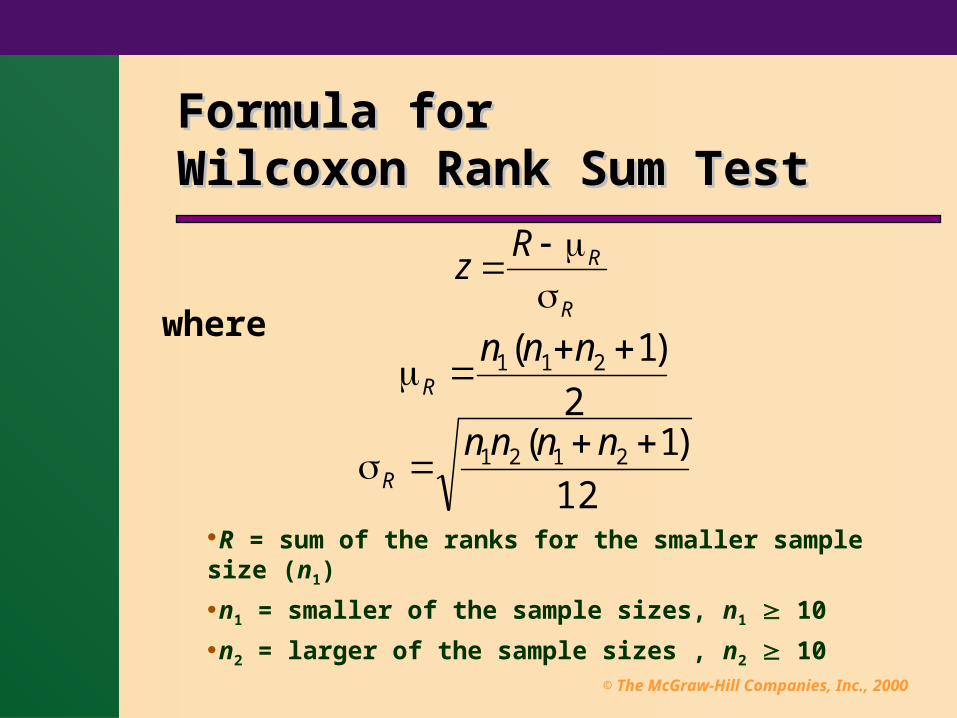
Formula for Formula for Wilcoxon Rank Sum TestWilcoxon Rank Sum Test
where
R = sum of the ranks for the smaller sample size (n1)
n1 = smaller of the sample sizes, n1 10
n2 = larger of the sample sizes , n2 10
R
RRz
2
)1( 211
nnnR
12
)1( 2121
nnnnR
© The McGraw-Hill Companies, Inc., 2000
Wilcoxon Signed-Rank TestWilcoxon Signed-Rank Test
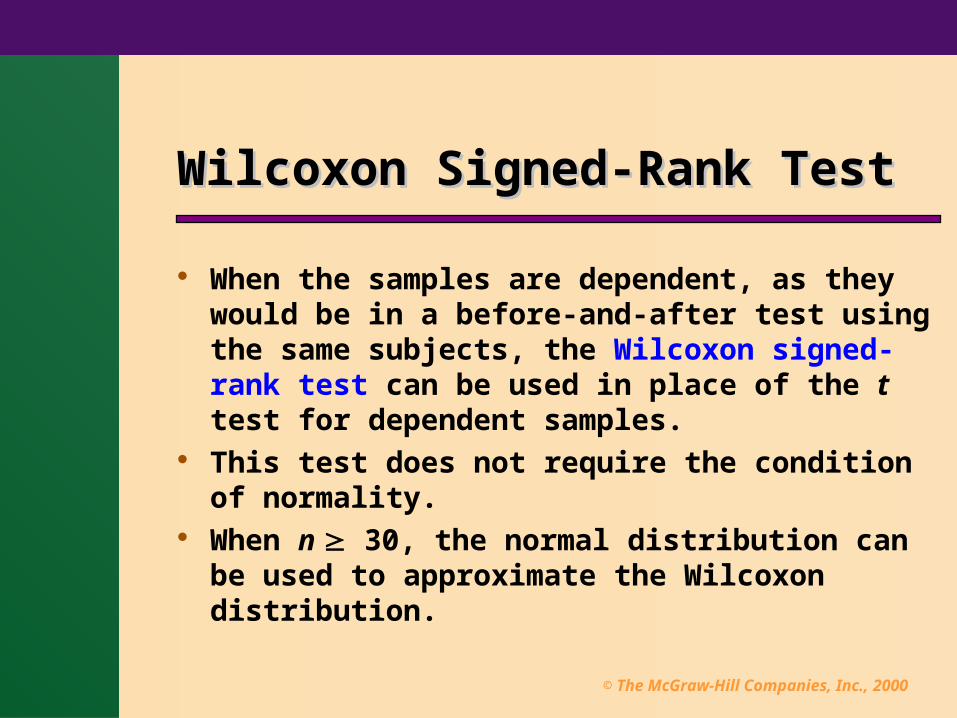
When the samples are dependent, as they would be in a before-and-after test using the same subjects, the Wilcoxon signed-rank test can be used in place of the t test for dependent samples.
This test does not require the condition of normality.
When n 30, the normal distribution can be used to approximate the Wilcoxon distribution.
© The McGraw-Hill Companies, Inc., 2000
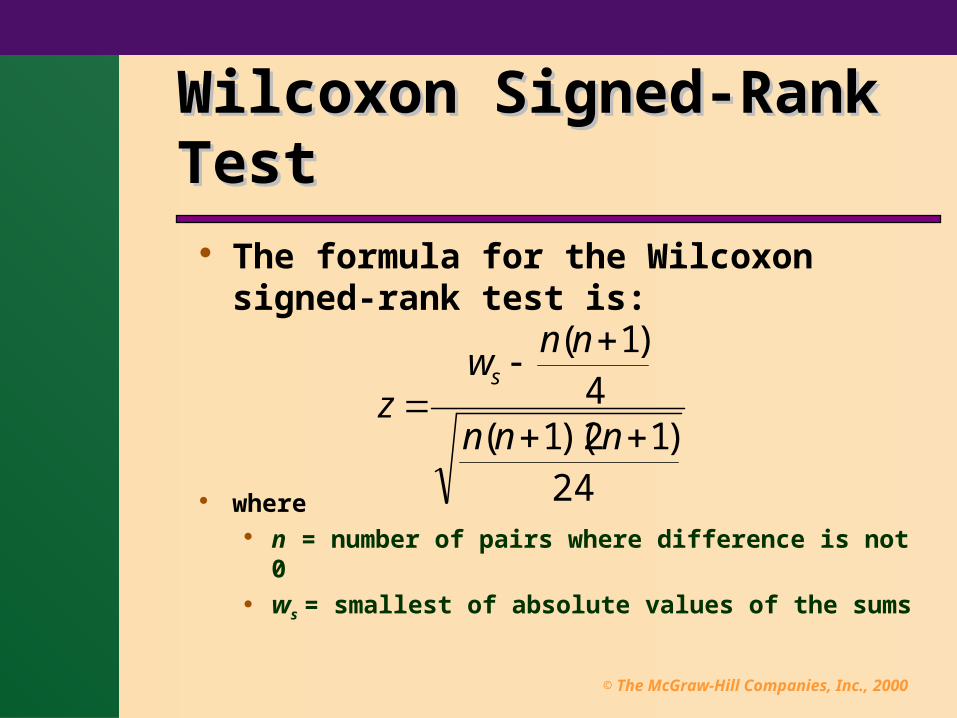
Wilcoxon Signed-Rank TestWilcoxon Signed-Rank Test The formula for the Wilcoxon signed-
rank test is:
where n = number of pairs where difference is not 0 ws = smallest of absolute values of the sums
24)12)(1(
4)1(
nnn
nnw
zs
© The McGraw-Hill Companies, Inc., 2000
Kruskal-Wallis TestKruskal-Wallis Test
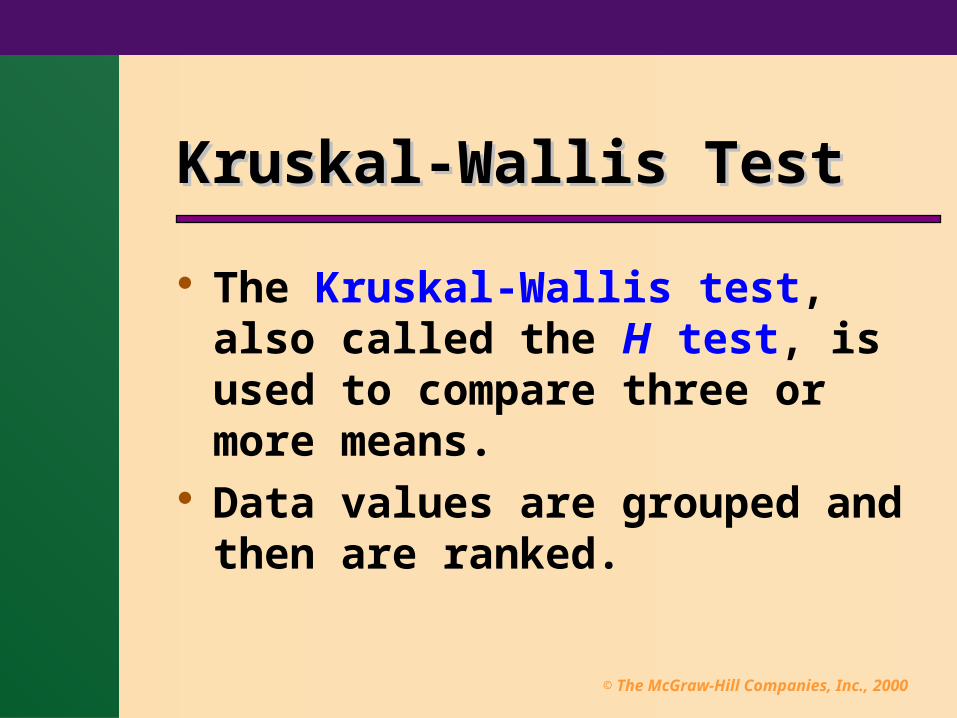
The Kruskal-Wallis test, also called the H test, is used to compare three or more means.
Data values are grouped and then are ranked.
© The McGraw-Hill Companies, Inc., 2000
Formula for the Kruskal-Wallis TestFormula for the Kruskal-Wallis Test
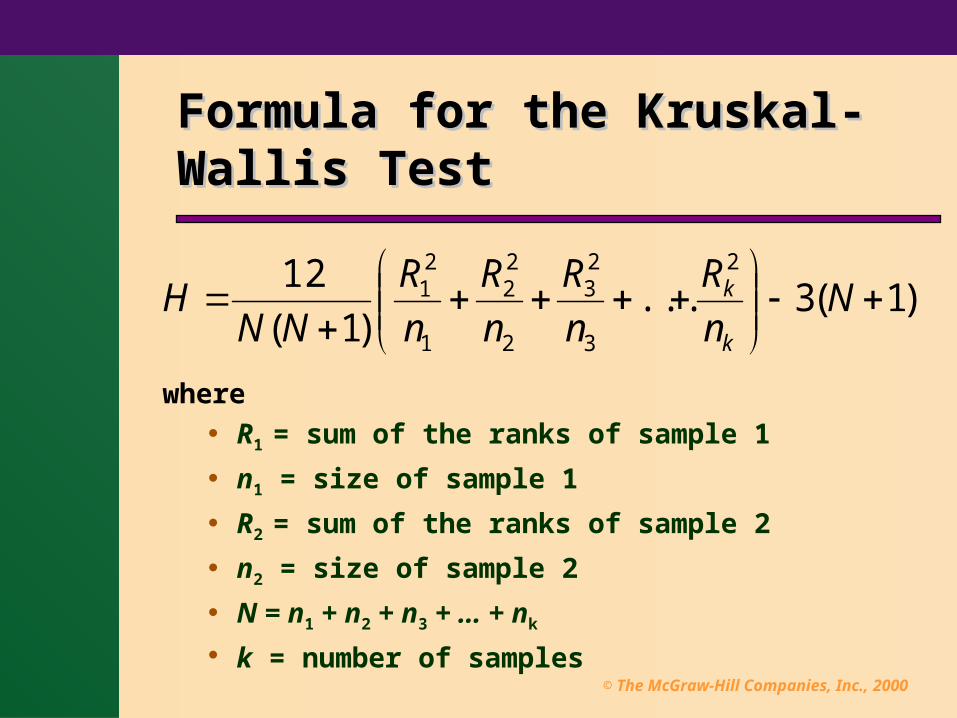
where R1 = sum of the ranks of sample 1
n1 = size of sample 1
R2 = sum of the ranks of sample 2
n2 = size of sample 2
N = n1 + n2 + n3 + … + nk
k = number of samples
)1(3...)1(
12 2
3
23
2
22
1
21
N
n
R
n
R
n
R
n
R
NNH
k
k
© The McGraw-Hill Companies, Inc., 2000
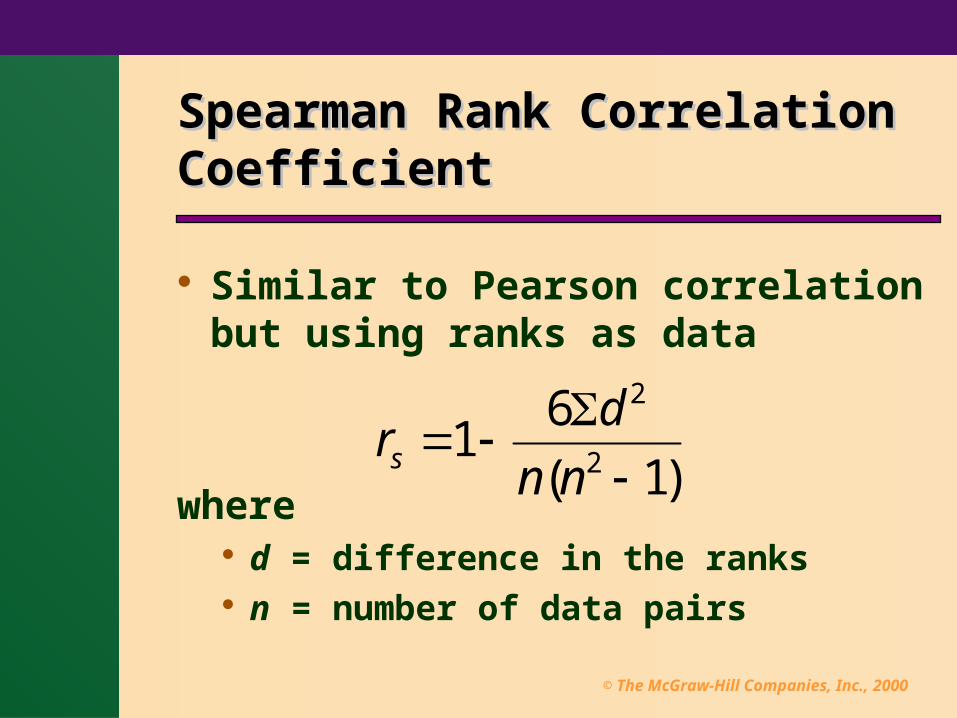
Spearman Rank Correlation Spearman Rank Correlation Coefficient Coefficient
Similar to Pearson correlation but using ranks as data
where d = difference in the ranks n = number of data pairs
)1(
61
2
2
nn
drs
© The McGraw-Hill Companies, Inc., 2000
SummarySummary
In many research situations, the assumptions for the use of parametric statistics cannot be met, e.g., normality.
Some statistical studies do not involve parameters such as means, variances, and proportions.
For both situations, statisticians have developed nonparametric statistical methods, also called distribution-free methods.
© The McGraw-Hill Companies, Inc., 2000
SummarySummary
There are several advantages to the use of nonparametric methods — the most important one is that no knowledge of the population distribution is required.
The major disadvantage is that they are less efficient than their parametric counterparts when the assumptions for the parametric methods are met. This means larger samples are needed.
© The McGraw-Hill Companies, Inc., 2000
SummarySummary
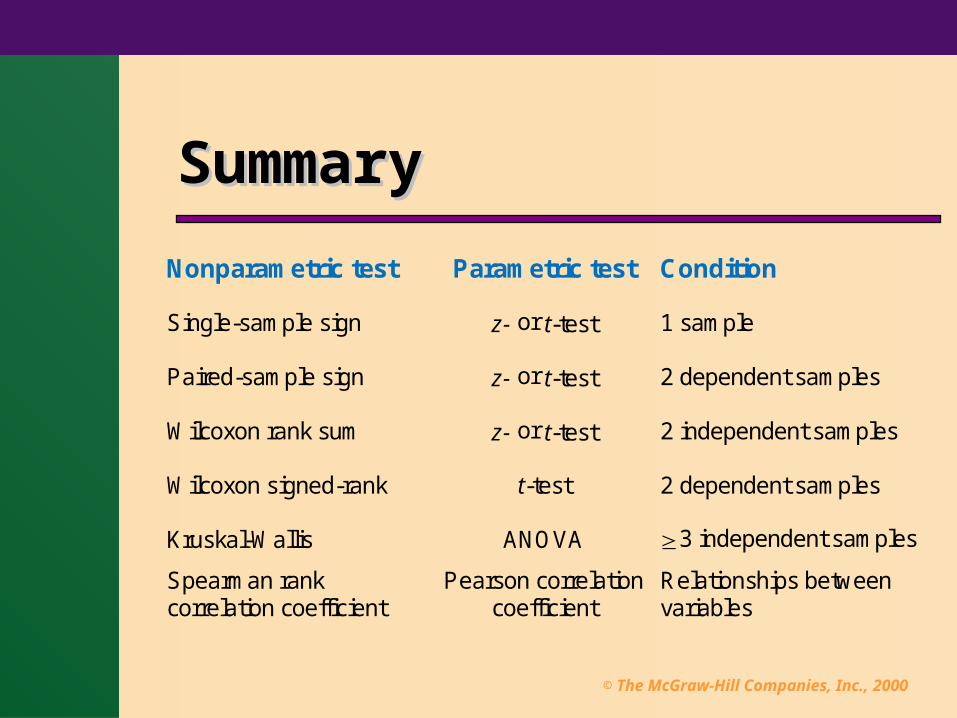
Nonparametric test Parametric test Condition
Single-sample sign z- or t-test 1 sample
Paired-sample sign z- or t-test 2 dependent samples
Wilcoxon rank sum z- or t-test 2 independent samples
Wilcoxon signed-rank t-test 2 dependent samples
Kruskal-Wallis ANOVA 3 independent samples
Spearman rank correlation coefficient
Pearson correlation coefficient
Relationships between variables
© The McGraw-Hill Companies, Inc., 2000
ConclusionsConclusions
Nonparametric or distribution-free tests are used when situations are not normally distributed.
A sportswriter may wish to know whether there is a relationship between the rankings of two Olympic swimming judges.
A sociologist may wish to determine whether men and women enroll at random for a specific rehabilitation program.