Embed Size (px)
Citation preview
©The McGraw-Hill Companies, 2002
Week 7Issues in
Microeconomics
©The McGraw-Hill Companies, 2002
The labour market
3©The McGraw-Hill Companies, 2002
Demand for factors in the long run
• The optimum mix of capital and labour depends on the relative prices of these factors– This helps to explain why more labour-intensive means
of production are used in some countries where labour is relatively abundant.
• A change in the price of one factor will have both output and substitution effects
• A rise in the wage rate leads to – substitution towards more capital-intensive techniques
– but also leads to lower total output
4©The McGraw-Hill Companies, 2002
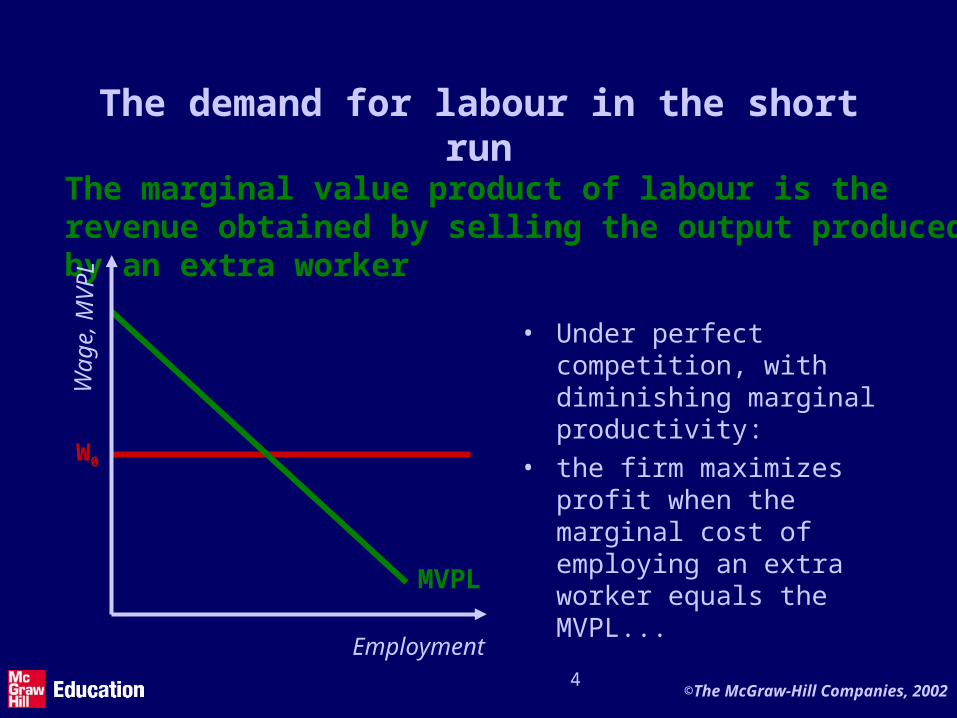
The demand for labour in the short run
• Under perfect competition, with diminishing marginal productivity:
• the firm maximizes profit when the marginal cost of employing an extra worker equals the MVPL...
The marginal value product of labour is the revenue obtained by selling the output producedby an extra worker
W0
MVPL
Employment
Wag
e, M
VP
L
5©The McGraw-Hill Companies, 2002
The demand for labour in the short run
W0
MVPL
Employment
Wag
e, M
VP
L
L*
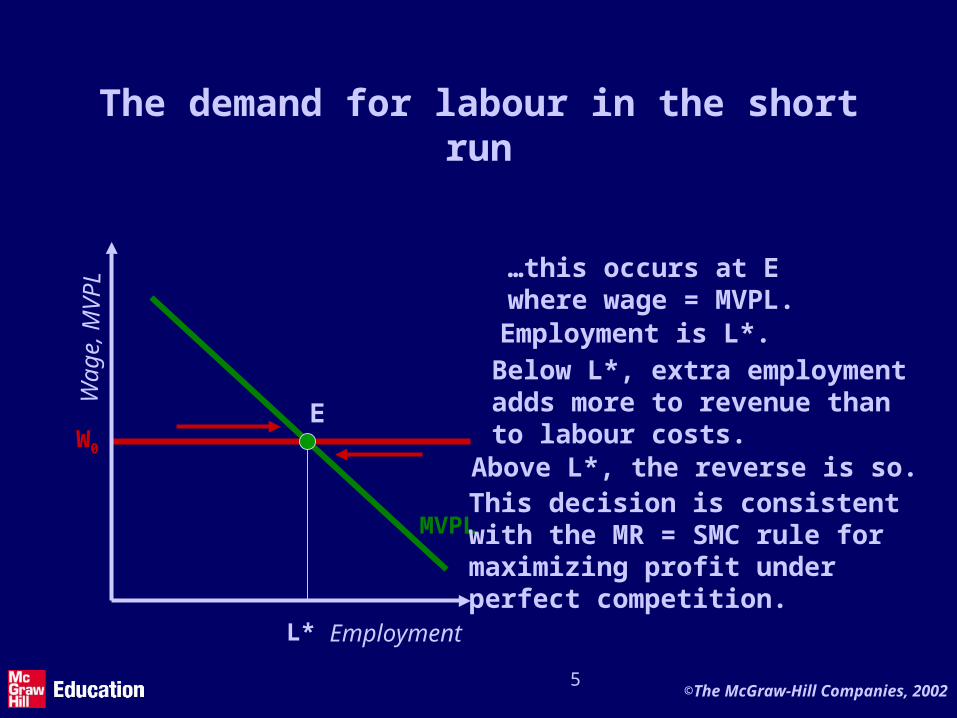
Employment is L*.
This decision is consistent with the MR = SMC rule formaximizing profit underperfect competition.
Below L*, extra employmentadds more to revenue thanto labour costs.Above L*, the reverse is so.
…this occurs at Ewhere wage = MVPL.
E
6©The McGraw-Hill Companies, 2002
The supply of labour
• The LABOUR FORCE:– all individuals in work or seeking employment
• Labour supply– for an individual, the decision on how many
hours to offer to work depends on the real wage
– an individual’s attitude towards leisure and income determines if more or less hours of work are supplied at a higher real wage rate.
7©The McGraw-Hill Companies, 2002
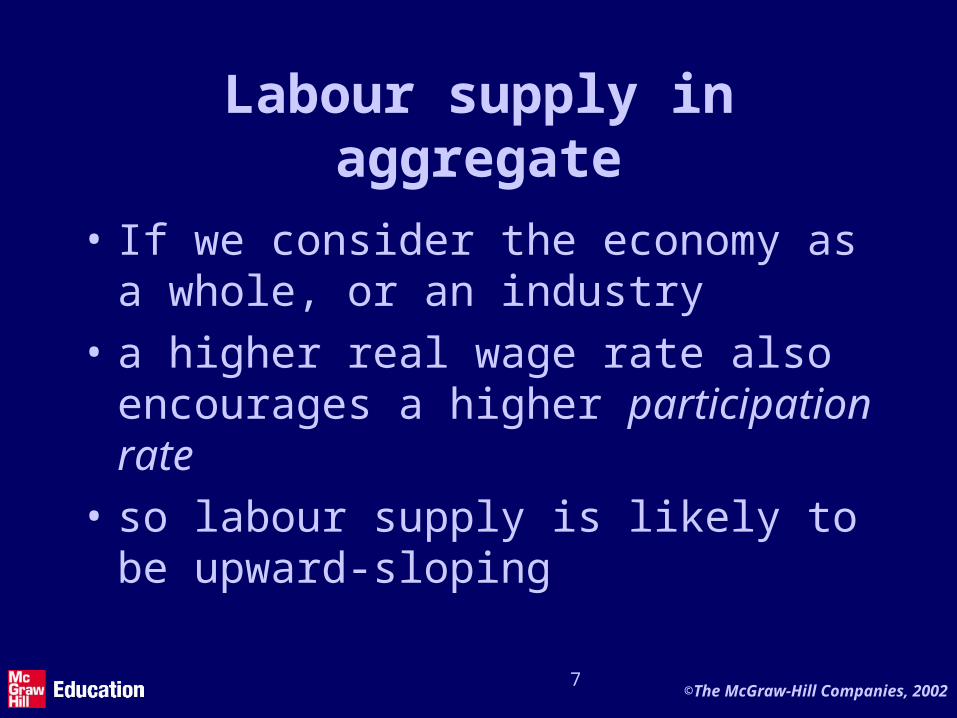
Labour supply in aggregate
• If we consider the economy as a whole, or an industry
• a higher real wage rate also encourages a higher participation rate
• so labour supply is likely to be upward-sloping
8©The McGraw-Hill Companies, 2002
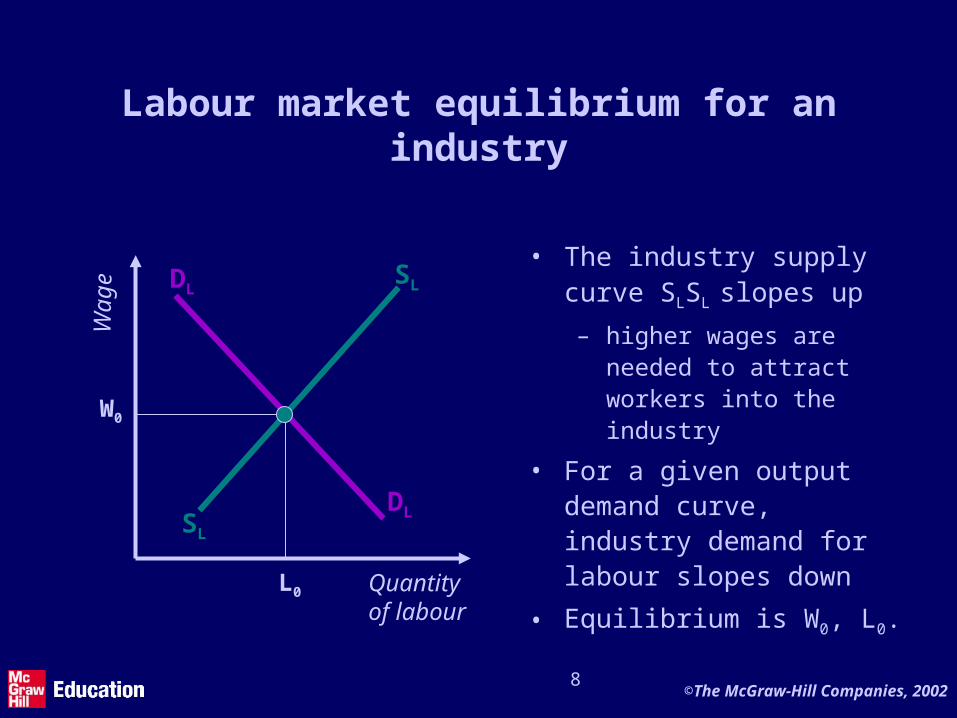
Labour market equilibrium for an industry
• The industry supply curve SLSL slopes up
– higher wages are needed to attract workers into the industry
• For a given output demand curve, industry demand for labour slopes down
• Equilibrium is W0, L0.Quantityof labour
Wag
e DL
DLSL
SL
W0
L0
9©The McGraw-Hill Companies, 2002
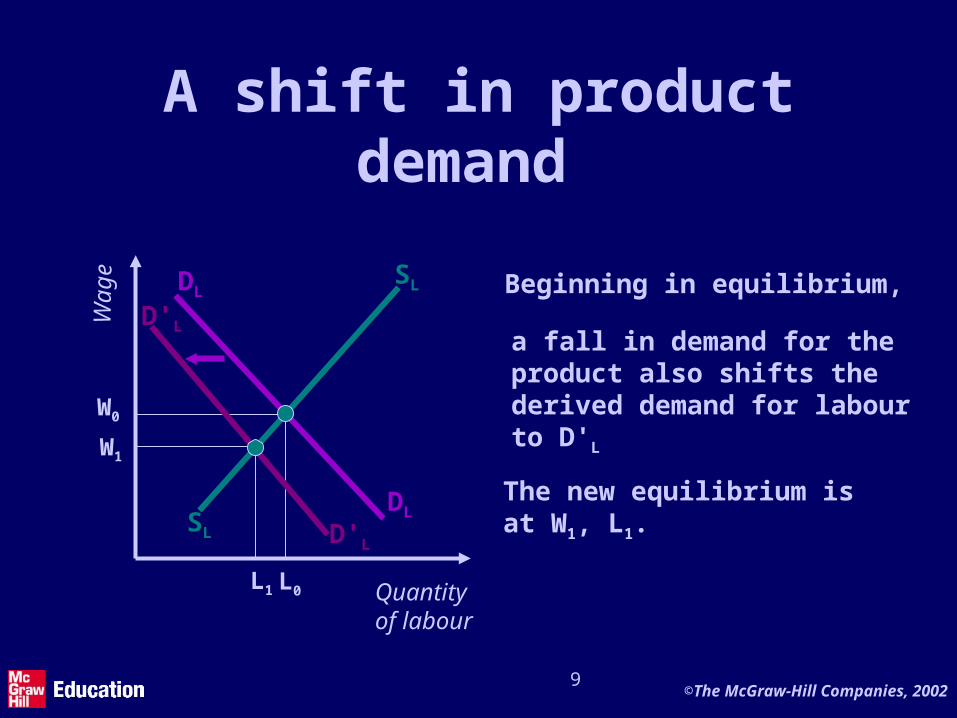
A shift in product demand
Quantityof labour
Wag
e DL
DLSL
SL
W0
L0
Beginning in equilibrium,
a fall in demand for theproduct also shifts the derived demand for labourto D'L
D'L
D'L
The new equilibrium is at W1, L1.
L1
W1
10©The McGraw-Hill Companies, 2002
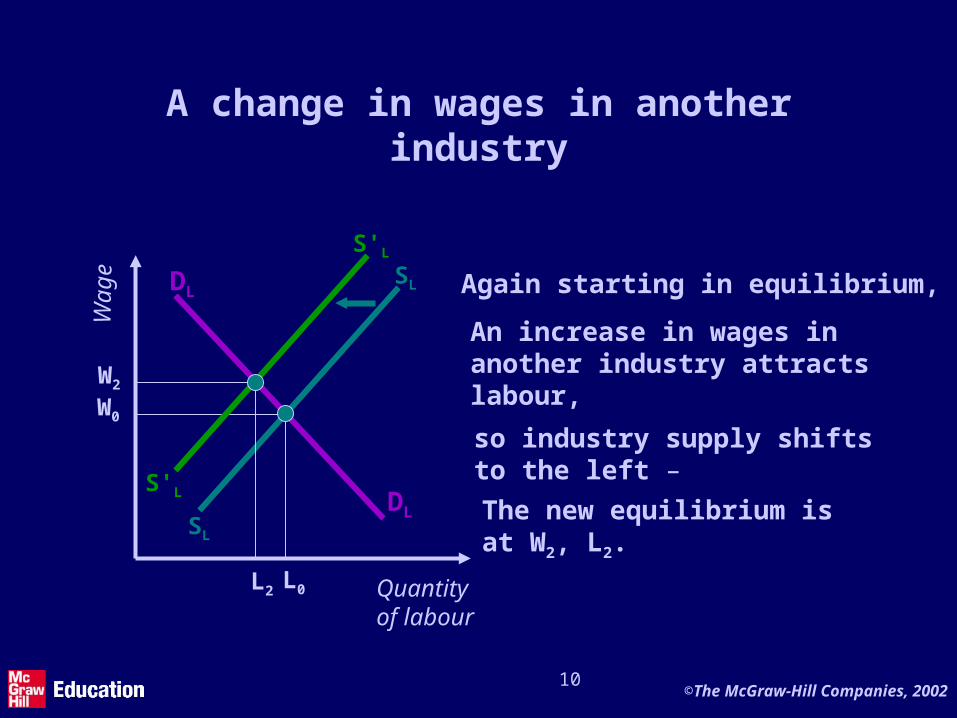
A change in wages in another industry
Quantityof labour
Wag
e DL
DLSL
SL
W0
L0
Again starting in equilibrium,
An increase in wages in another industry attracts labour,
so industry supply shifts to the left –
S'L
S'LThe new equilibrium is at W2, L2.
L2
W2

©The McGraw-Hill Companies, 2002
The information economy

12©The McGraw-Hill Companies, 2002
13©The McGraw-Hill Companies, 2002
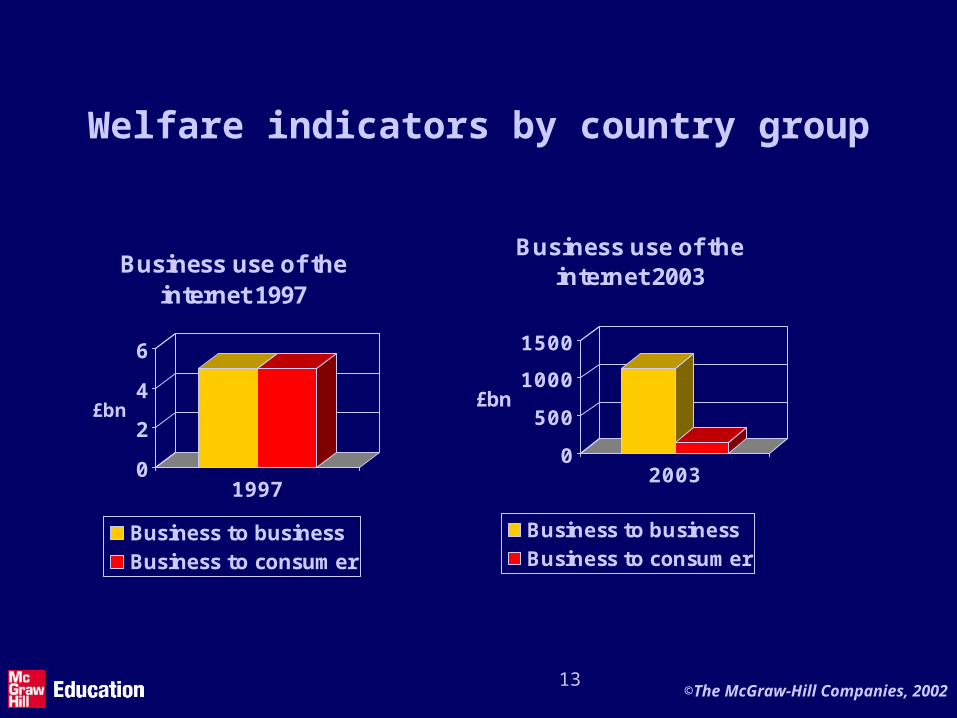
Welfare indicators by country group
0
500
1000
1500
£bn
2003
Business use of the internet 2003
Business to businessBusiness to consumer
0
2
4
6
£bn
1997
Business use of the internet 1997
Business to businessBusiness to consumer
14©The McGraw-Hill Companies, 2002
e-products
• An e-product:– can be digitally encoded then transmitted
rapidly, accurately and cheaplye.g. music, films, books, sport …
• Fixed costs of producing e-products are huge …
• … but marginal costs of distribution are tiny
• implying vast economies of scale
15©The McGraw-Hill Companies, 2002
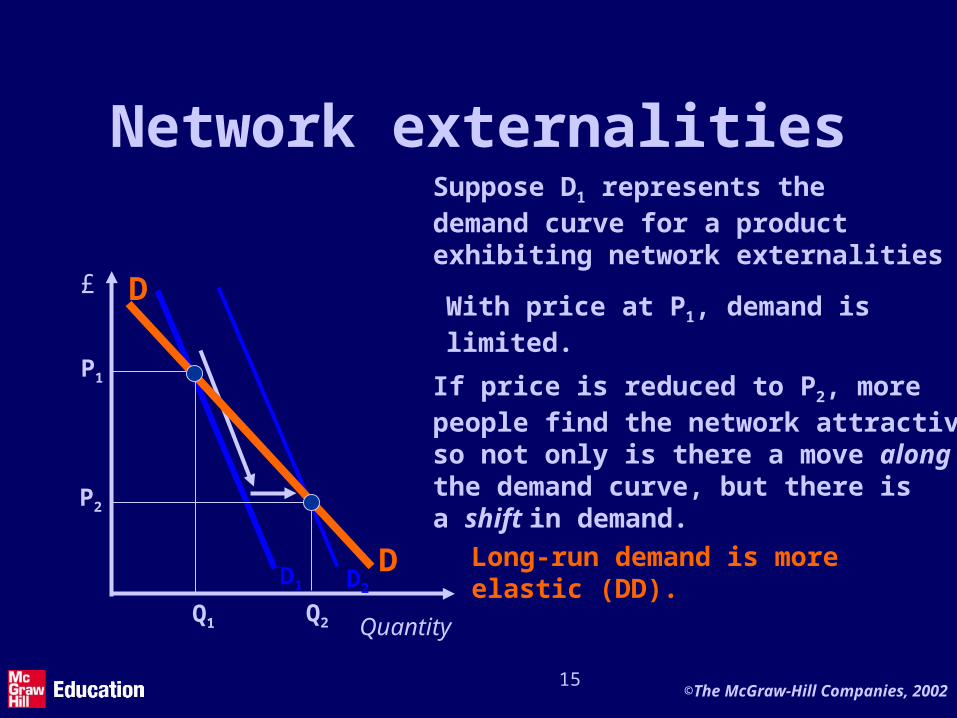
Network externalitiesSuppose D1 represents the demand curve for a product exhibiting network externalities
£
Quantity
D1
P1
Q1
With price at P1, demand is limited.
If price is reduced to P2, morepeople find the network attractiveso not only is there a move alongthe demand curve, but there is a shift in demand.
P2
D2
Q2
Long-run demand is moreelastic (DD).
D
D
16©The McGraw-Hill Companies, 2002
Information: the supply side
• Given substantial economies of scale, we expect monopoly suppliers of information products:
• Dominant firm with competitive fringee.g. Microsoft
• Niche market monopolies
17©The McGraw-Hill Companies, 2002
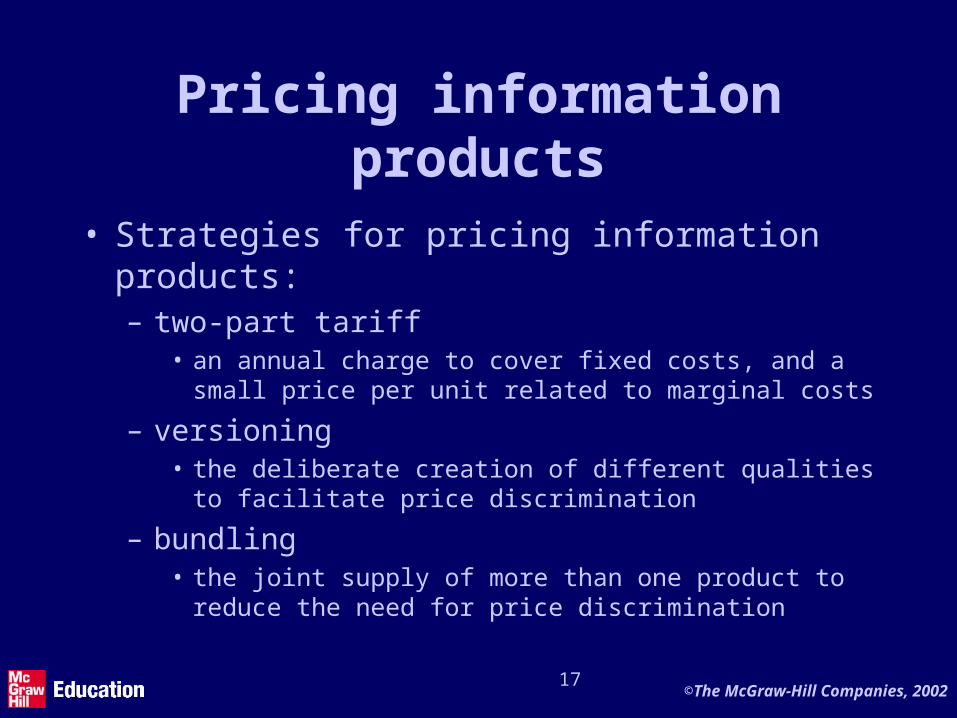
Pricing information products
• Strategies for pricing information products:– two-part tariff
• an annual charge to cover fixed costs, and a small price per unit related to marginal costs
– versioning• the deliberate creation of different qualities to
facilitate price discrimination
– bundling• the joint supply of more than one product to reduce
the need for price discrimination
18©The McGraw-Hill Companies, 2002
Competition vs. collaboration
• A strategic alliance is a blend of co-operation and competition, in which a group of suppliers provide a range of products that partly complement one another– e.g. Microsoft and Intel– airline alliances: One World, Star
19©The McGraw-Hill Companies, 2002
Understanding the e-economy
• 1 The information revolution is changing our lives– but few of its activities or market
tactics are unprecedented• 2 The revolution in technology has
not required a corresponding revolution in economic theory

©The McGraw-Hill Companies, 2002
Government spending and Revenue
21©The McGraw-Hill Companies, 2002
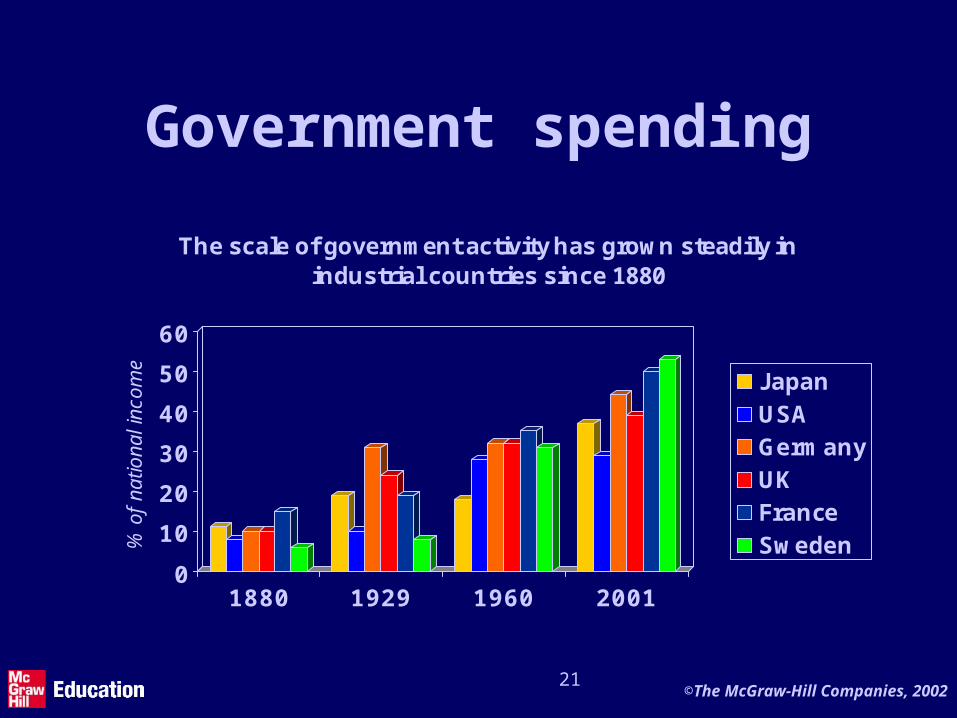
Government spending
0
10
20
30
40
50
60
% o
f na
tiona
l inc
ome
1880 1929 1960 2001
The scale of government activity has grown steadily in industrial countries since 1880
JapanUSAGermanyUKFranceSweden

22©The McGraw-Hill Companies, 2002
Private and public goods• A private good
– if consumed by one person, cannot be consumed by another person.
e.g. dental treatment
• A public good– even if consumed by one person, can still be
consumed by other people.e.g. street lighting
The strong externalities associated with public goods, meanthat government intervention may be justified to ensure appropriate provision.
23©The McGraw-Hill Companies, 2002
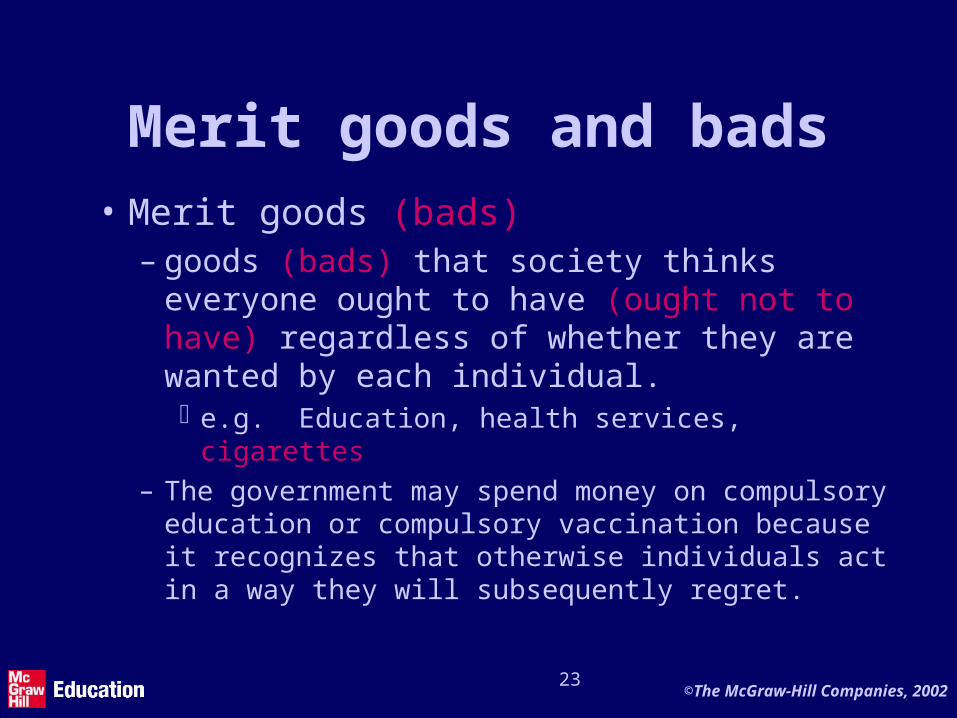
Merit goods and bads• Merit goods (bads)
– goods (bads) that society thinks everyone ought to have (ought not to have) regardless of whether they are wanted by each individual.e.g. Education, health services, cigarettes
– The government may spend money on compulsory education or compulsory vaccination because it recognizes that otherwise individuals act in a way they will subsequently regret.
24©The McGraw-Hill Companies, 2002
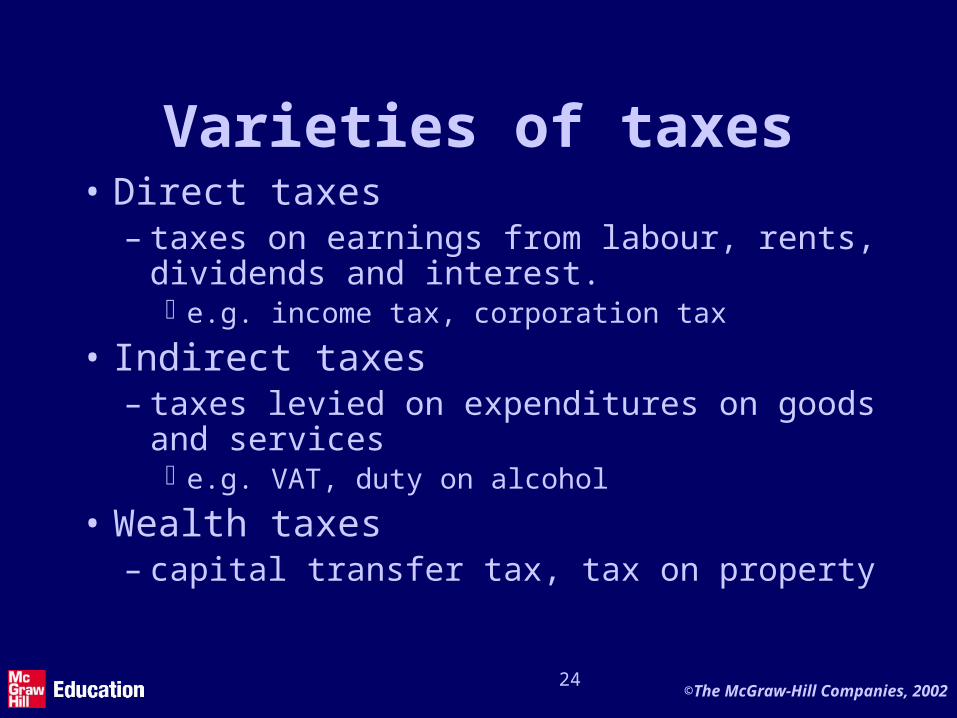
Varieties of taxes• Direct taxes
– taxes on earnings from labour, rents, dividends and interest.e.g. income tax, corporation tax
• Indirect taxes– taxes levied on expenditures on goods
and servicese.g. VAT, duty on alcohol
• Wealth taxes– capital transfer tax, tax on property
25©The McGraw-Hill Companies, 2002
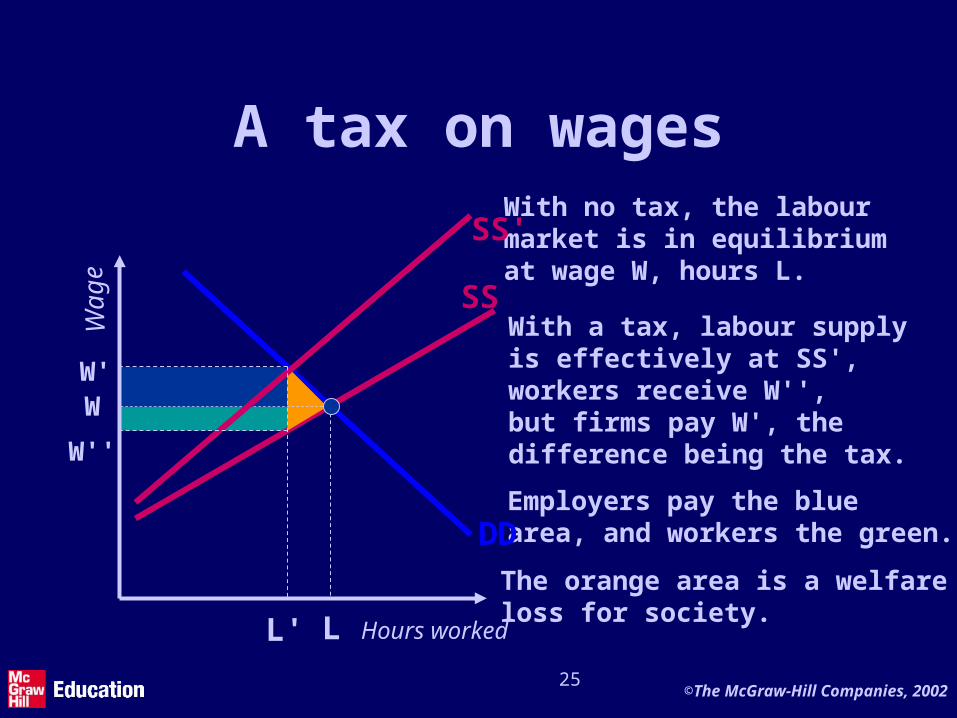
Employers pay the bluearea, and workers the green.
A tax on wages
Hours worked
Wa
ge
L
W
DD
SS
With no tax, the labourmarket is in equilibrium at wage W, hours L.
The orange area is a welfare loss for society.
L'
SS'
W'
W''
With a tax, labour supplyis effectively at SS',workers receive W'',but firms pay W', thedifference being the tax.
26©The McGraw-Hill Companies, 2002
The incidence of a tax
• Who pays a tax depends upon the elasticity of demand and supply for the product.
• This also affects the size of distortion caused by the imposition of a tax.
27©The McGraw-Hill Companies, 2002
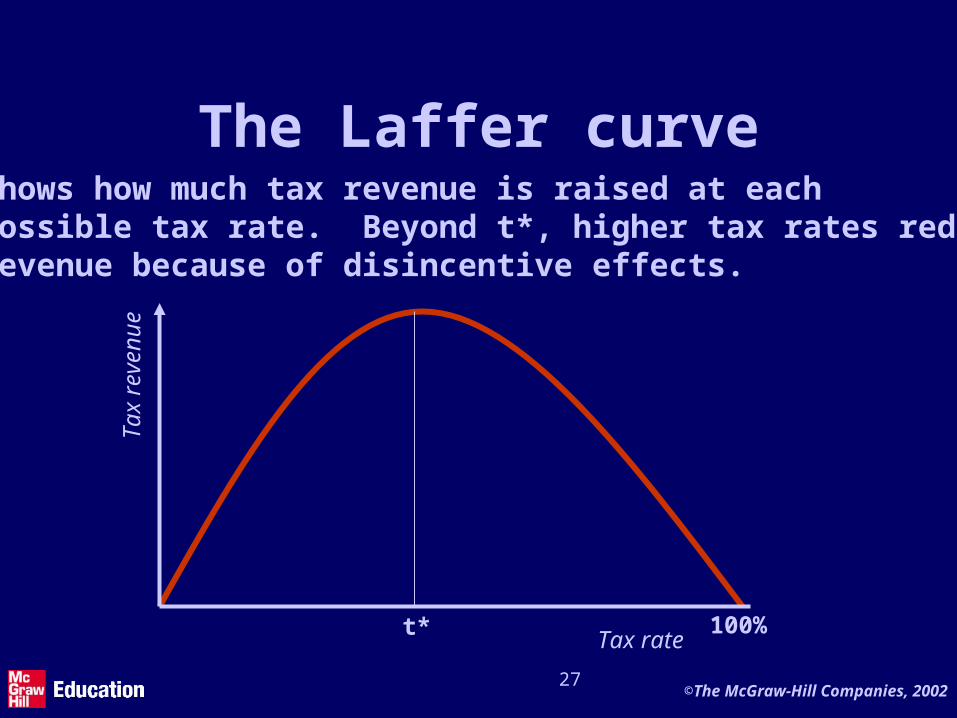
The Laffer curveshows how much tax revenue is raised at each possible tax rate. Beyond t*, higher tax rates reduce revenue because of disincentive effects.
t* 100%Tax rate
Tax
rev
enu e
©The McGraw-Hill Companies, 2002
Industrial policy and competition policy
29©The McGraw-Hill Companies, 2002
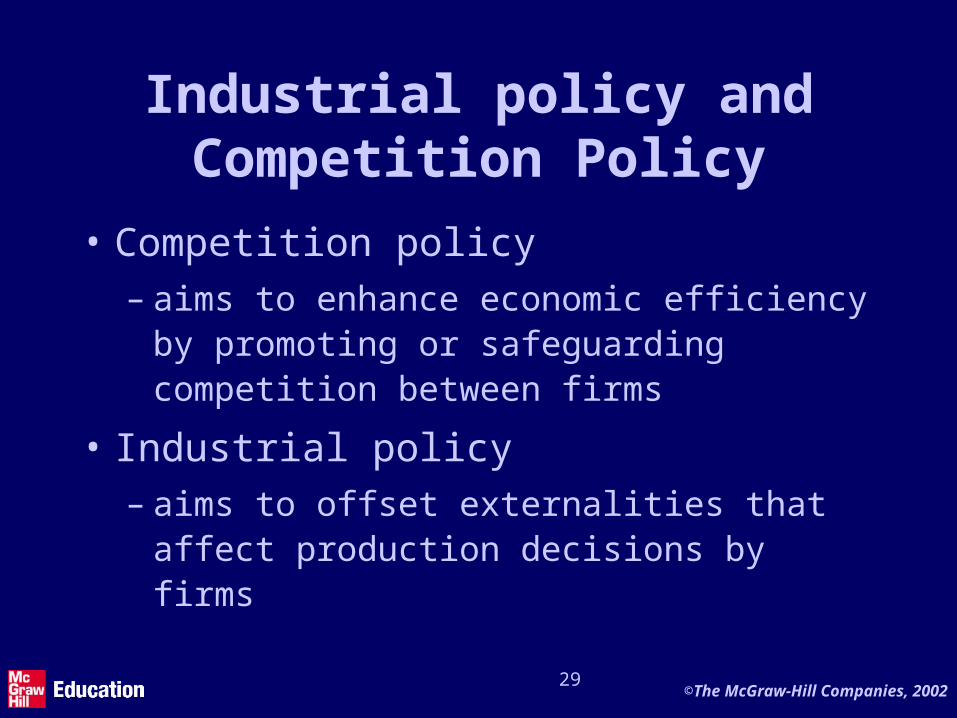
Industrial policy andCompetition Policy
• Competition policy– aims to enhance economic efficiency
by promoting or safeguarding competition between firms
• Industrial policy – aims to offset externalities that affect
production decisions by firms
30©The McGraw-Hill Companies, 2002
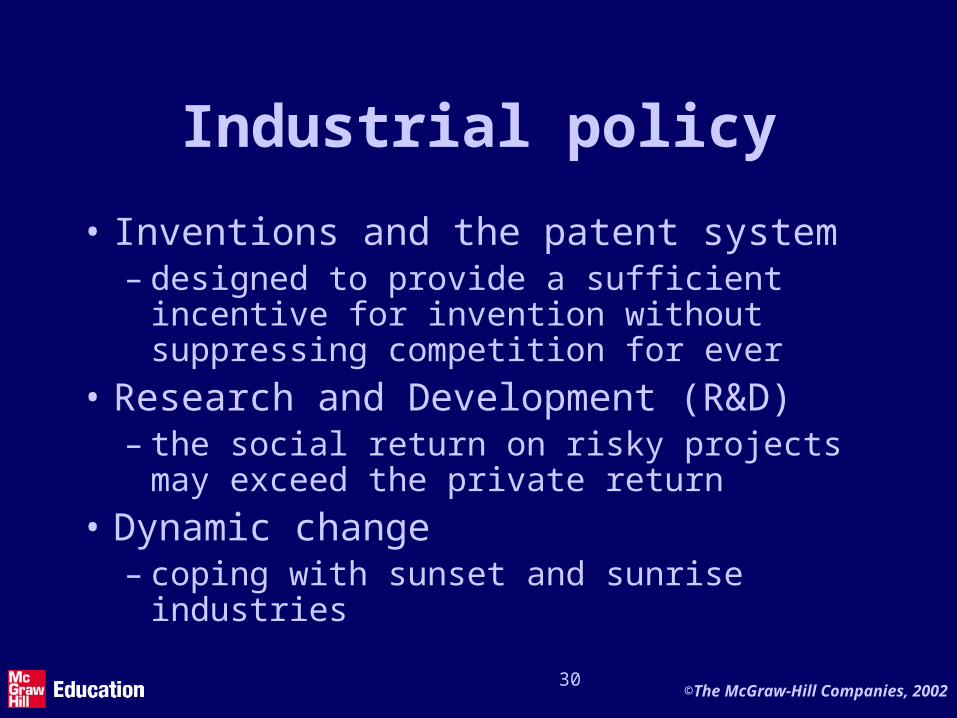
Industrial policy
• Inventions and the patent system– designed to provide a sufficient incentive
for invention without suppressing competition for ever
• Research and Development (R&D)– the social return on risky projects may
exceed the private return• Dynamic change
– coping with sunset and sunrise industries
31©The McGraw-Hill Companies, 2002
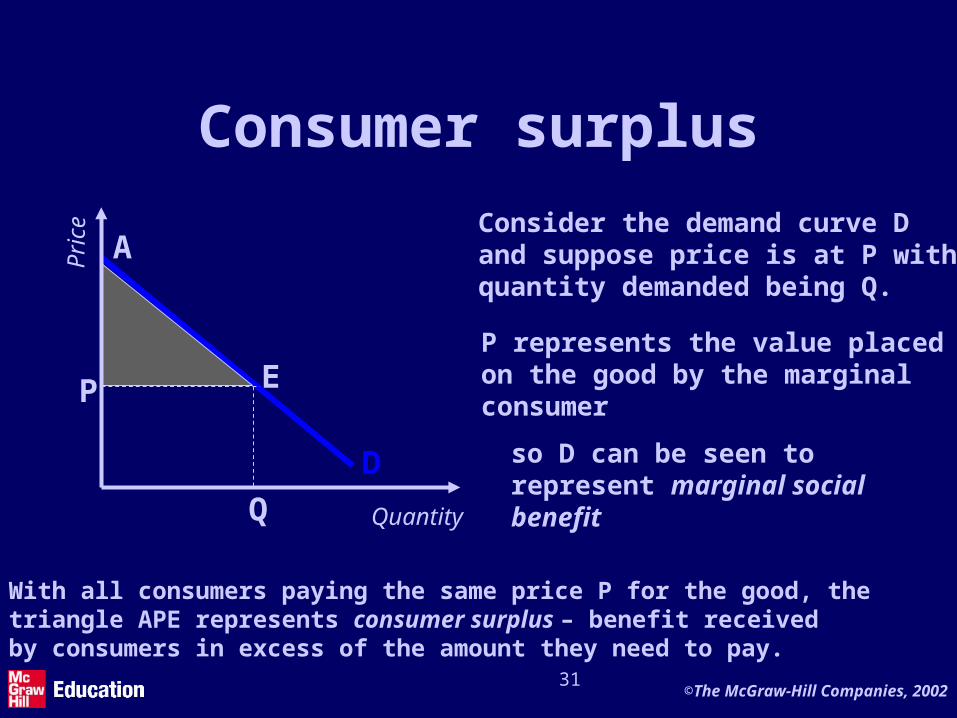
Consumer surplus
Consider the demand curve Dand suppose price is at P withquantity demanded being Q.
P represents the value placedon the good by the marginalconsumer
so D can be seen torepresent marginal social benefit
D
Q
P
Quantity
Pric
e
A
E
With all consumers paying the same price P for the good, the triangle APE represents consumer surplus – benefit received by consumers in excess of the amount they need to pay.
32©The McGraw-Hill Companies, 2002
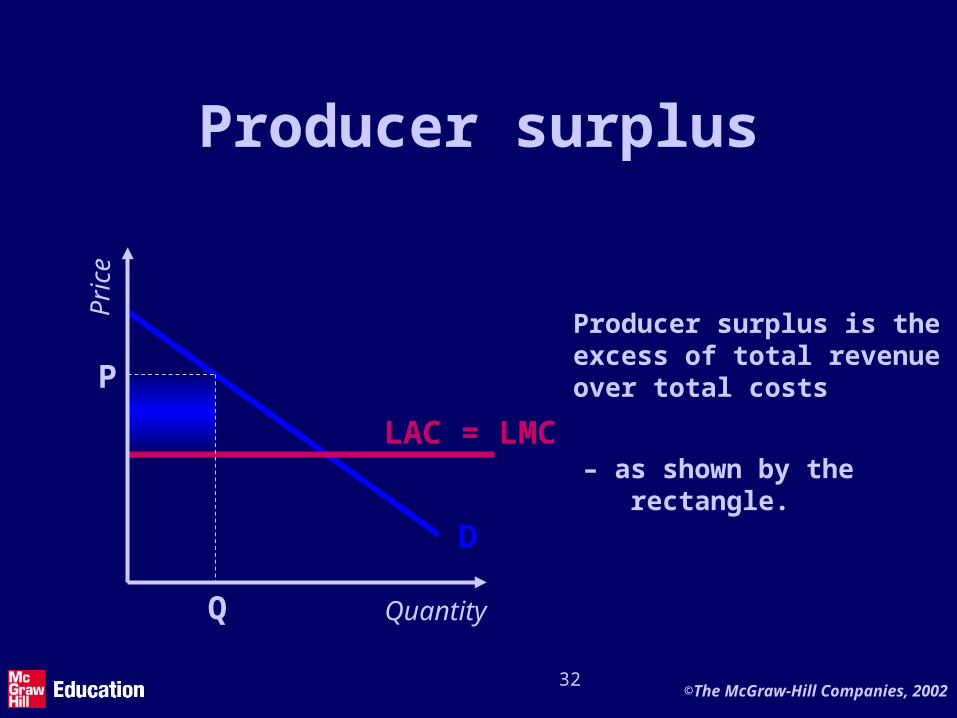
– as shown by the rectangle.
Producer surplus
D
LAC = LMC
Quantity
Pri
ce
Q
P
Producer surplus is theexcess of total revenueover total costs
33©The McGraw-Hill Companies, 2002
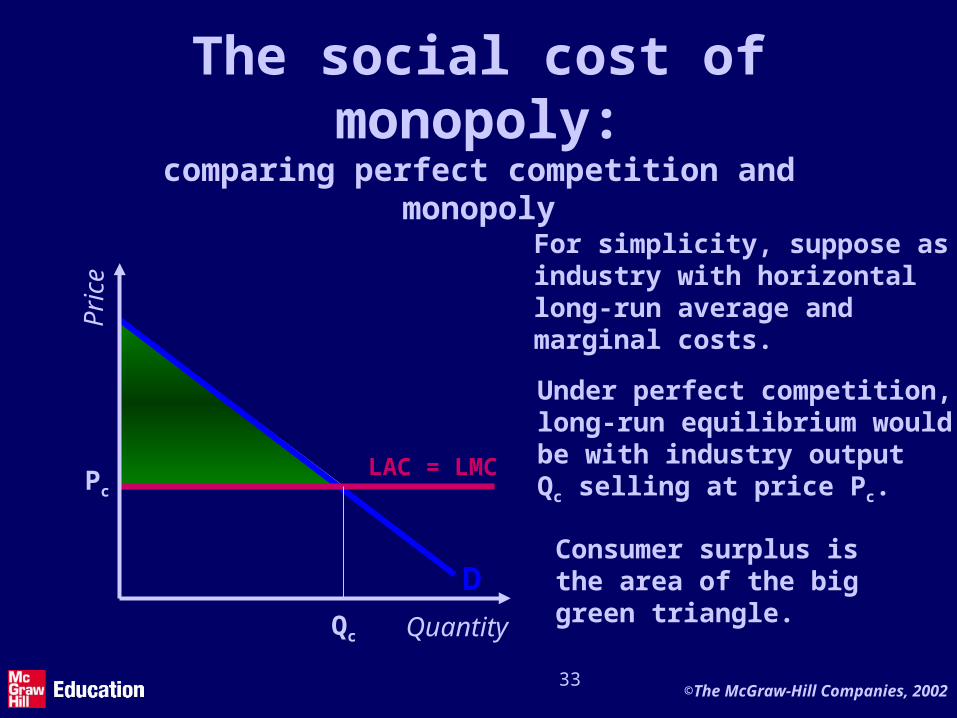
Consumer surplus isthe area of the biggreen triangle.
The social cost of monopoly:
comparing perfect competition and monopoly
For simplicity, suppose asindustry with horizontallong-run average and marginal costs.
Under perfect competition,long-run equilibrium wouldbe with industry outputQc selling at price Pc.
D
LAC = LMC
Qc
Pc
Quantity
Pri
ce
34©The McGraw-Hill Companies, 2002
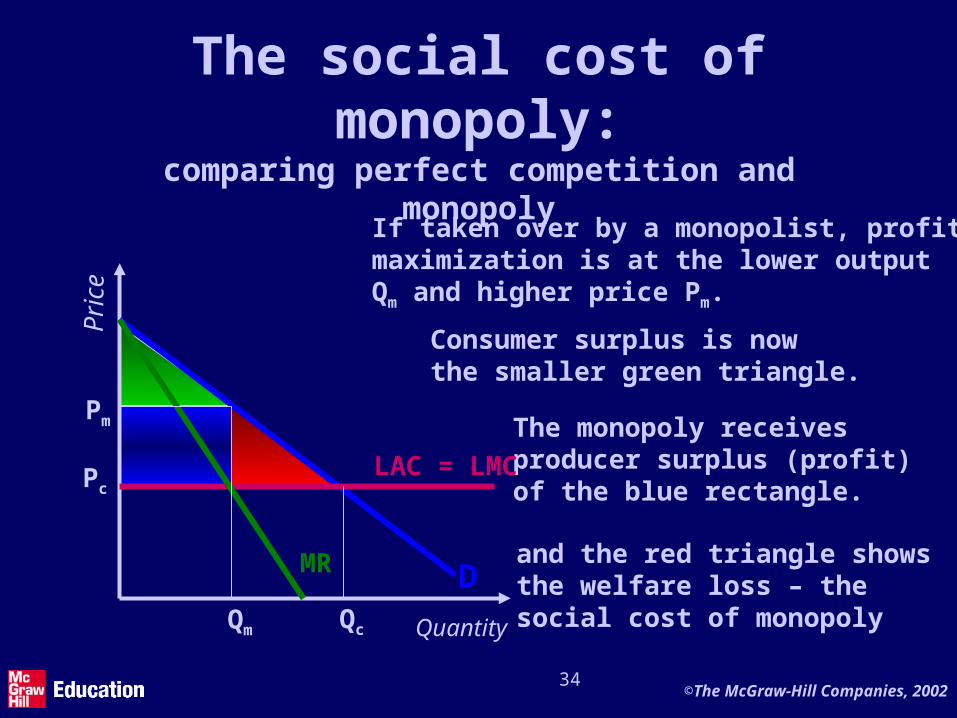
and the red triangle showsthe welfare loss – the social cost of monopoly
The monopoly receivesproducer surplus (profit)of the blue rectangle.
Consumer surplus is nowthe smaller green triangle.
The social cost of monopoly:
comparing perfect competition and monopoly
D
LAC = LMC
Qc
Pc
Quantity
Pri
ce
MR
Qm
Pm
If taken over by a monopolist, profitmaximization is at the lower output Qm and higher price Pm.
35©The McGraw-Hill Companies, 2002
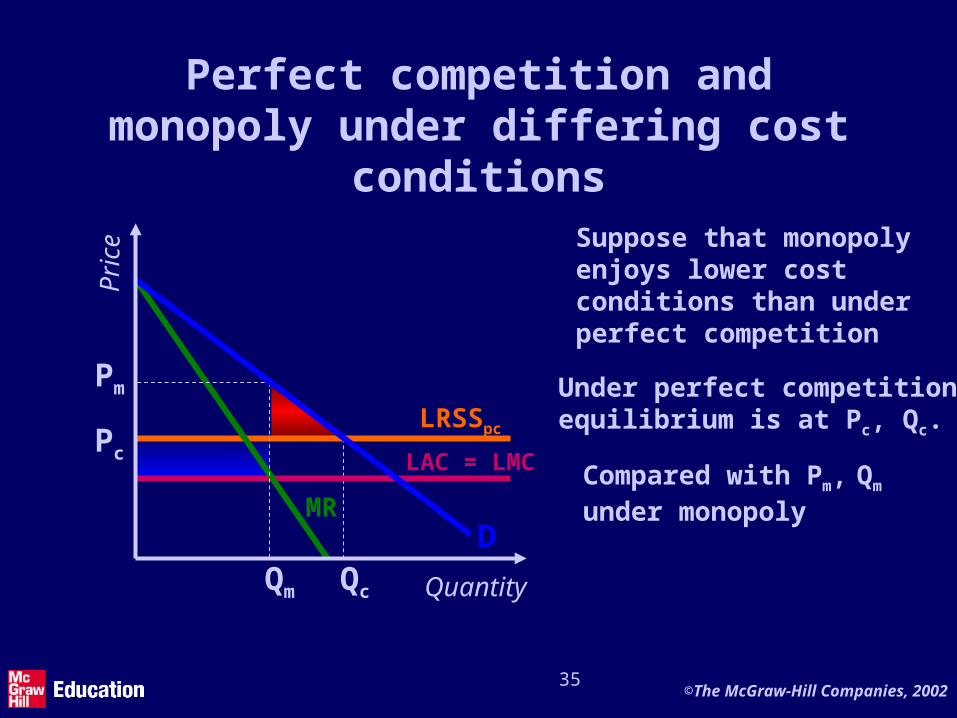
Perfect competition and monopoly under differing cost
conditionsSuppose that monopolyenjoys lower costconditions than underperfect competition
Qc
Pc
LRSSpc
Under perfect competitionequilibrium is at Pc, Qc.
LAC = LMC
MR
Pm
Qm
Compared with Pm, Qm
under monopolyD
Quantity
Pri
ce
36©The McGraw-Hill Companies, 2002
Welfare implications
• In comparing the two situations, the loss of consumer surplus under monopoly (the red triangle)
• must be balanced against the gains from efficiency (the blue rectangle)

37©The McGraw-Hill Companies, 2002
Counting the cost of monopoly
• The size of the social cost of monopoly is difficult to evaluate– in part it depends upon the elasticity of demand
– which influences the size of the ‘red triangle’ of welfare loss