Embed Size (px)
Citation preview

1 23
European Radiology ISSN 0938-7994 Eur RadiolDOI 10.1007/s00330-012-2396-3
Quantification of diffusion tensor imagingin normal white matter maturation of earlychildhood using an automated processingpipeline
K. B. Loh, N. Ramli, L. K. Tan,M. Roziah, K. Rahmat & H. Ariffin

1 23
Your article is protected by copyright and
all rights are held exclusively by European
Society of Radiology. This e-offprint is for
personal use only and shall not be self-
archived in electronic repositories. If you
wish to self-archive your work, please use the
accepted author’s version for posting to your
own website or your institution’s repository.
You may further deposit the accepted author’s
version on a funder’s repository at a funder’s
request, provided it is not made publicly
available until 12 months after publication.

NEURO
Quantification of diffusion tensor imaging in normalwhite matter maturation of early childhoodusing an automated processing pipeline
K. B. Loh & N. Ramli & L. K. Tan & M. Roziah &
K. Rahmat & H. Ariffin
Received: 16 October 2011 /Revised: 29 November 2011 /Accepted: 18 December 2011# European Society of Radiology 2012
AbstractObjectives The degree and status of white matter myelina-tion can be sensitively monitored using diffusion tensorimaging (DTI). This study looks at the measurement offractional anistropy (FA) and mean diffusivity (MD) usingan automated ROI with an existing DTI atlas.Methods Anatomical MRI and structural DTI were per-formed cross-sectionally on 26 normal children (newbornto 48 months old), using 1.5-T MRI. The automated pro-cessing pipeline was implemented to convert diffusion-weighted images into the NIfTI format. DTI-TK softwarewas used to register the processed images to the ICBM DTI-81 atlas, while AFNI software was used for automated atlas-based volumes of interest (VOIs) and statistical valueextraction.Results DTI exhibited consistent grey–white matter con-trast. Triphasic temporal variation of the FA and MD valueswas noted, with FA increasing and MD decreasing rapidlyearly in the first 12 months. The second phase lasted 12–24 months during which the rate of FA and MD changes wasreduced. After 24 months, the FA and MD values plateaued.
Conclusion DTI is a superior technique to conventional MRimaging in depicting WM maturation. The use of the auto-mated processing pipeline provides a reliable environmentfor quantitative analysis of high-throughput DTI data.Key Points• Diffusion tensor imaging outperforms conventional MRI indepicting white matter maturation.
• DTI will become an important clinical tool for diagnosingpaediatric neurological diseases.
• DTI appears especially helpful for developmental abnor-malities, tumours and white matter disease.
• An automated processing pipeline assists quantitativeanalysis of high throughput DTI data.
Keywords White matter myelination . Diffusion tensorimaging . Paediatric brain
Introduction
White matter (WM) myelination is an important process inthe maturation of the human brain. The ability to monitorthe process of white matter myelination is crucial for theunderstanding and diagnosis of diseases or disorders affect-ing the developing brain. For the past 3 decades, variousimaging techniques have been used to assess it. Magneticresonance imaging (MRI) emerges as the investigation ofchoice in assessing myelination of the brain because itsurpasses both computed tomography (CT) and ultrasoundin contrast sensitivity [1].
The process of myelination in a developing brain ischaracterised by the signal changes seen on imaging of theWM [2]. These changes in relation to the grey matter occurduring the different phases of development and are observedon both T1W and T2W images [3, 4]. In clinical practice,
K. B. Loh :N. Ramli : L. K. Tan :M. Roziah :K. RahmatDepartment of Biomedical Imaging, University Malaya ResearchImaging Centre (UMRIC), Faculty of Medicine,University of Malaya,50603, Kuala Lumpur, Malaysia
H. AriffinDepartment of Paediatrics, Faculty of Medicine,University of Malaya,50603, Kuala Lumpur, Malaysia
K. Rahmat (*)Biomedical Imaging Department, University Malaya,50603, Kuala Lumpur, Malaysiae-mail: [email protected]
Eur RadiolDOI 10.1007/s00330-012-2396-3
Author's personal copy

however, differentiation of the signal changes is difficult, asthe brain undergoes substantial myelination progress in thefirst 24 months of life, which significantly affects the MRrelaxation parameters. In newborn brains, the T1 and T2 ofthe grey matter are shorter than those of the white matter,but after myelination, the contrast reverses [2]. During thecontrast transition period, the T1 and T2 signal composi-tions may render the brain featureless. This limitation can beovercome by diffusion tensor imaging (DTI) [5].
Diffusion tensor imaging is one of the recent advances inMRI that have made it possible to reveal the anatomy ofwhite matter tracts. Normal standards of reference for pae-diatric white matter development have been developed by a
study using 1.5-TMRI [5]. However, quantification of FA/MDvalues of the different tracts is usually done by manual ROI,which poses the problem of inter-observer variability [6]. Thisstudy aims to explore the possibility of automated quantifica-tion of FA/MD values on developing tracts.
Materials and methods
Subjects
Twenty-six normal subjects, with ages ranging from birth to48 months, were recruited and underwent cross-sectionalDTI. All the subjects had been born at full term and wereassessed to be developmentally appropriate for age using theDenver Developmental Screening Test. There was no pre-vious history or clinical findings of neurological abnormal-ities. The patients’ findings were grouped into 3-month ageintervals from 0 to 24 months and 6 monthly thereafter. Thepatients’ demographic details are demonstrated in Fig. 1.The study was approved by the institutional Medical EthicsCommittee (MEC ref. no.: 690.17) and written informedconsent was obtained from each subject’s parents.
Imaging acquisition protocol
Diffusion-tensor images were acquired by a 1.5-T GE SignaHDxt MRI equipped with a standard eight-channel head coilusing single-shot spin echo-echo planar imaging (SSSE-EPI)
Fig. 1 Number of normal paediatric subjects in each age group and sex
Fig. 2 Axial colour-codeddirectional map showing theregion of interest (ROI) basedon the International Consortiumof Brain Mapping (ICBM) DTI-81 atlas (for lower caseabbreviations, see text)
Eur Radiol
Author's personal copy

sequence and diffusion-sensitising gradients applied along32 non-collinear directions with TE090 ms, diffusion-weighted factor, b0700 s/mm2, acquisition matrix0256×256pixels, field of view 260×260 mm2 and slice thickness03 mmwith no gap. For each encoding direction, around 45axial images parallel to the anterior commissural–poste-rior commissural plane were acquired to cover the entire brain.A T2-weighted sequence was acquired as anatomicalguidance.
Data processing and analysis
The acquired images were processed with the followingneuroimaging processing software to compute the diffusiontensor elements, spatial fractional anisotropy (FA) and meandiffusivity (MD).
1. MRIConvert version 2.0 (developed by Jolinda Smith atLewis Center for Neuroimaging, University of Oregon,Eugene, OR, USA);
2. FSL version 4.1 (developed by Analysis Group, FMRIB,University of Oxford, UK);
3. DTI-TK version 20090430 (developed by Hui Zhang atPenn Image Computing & Science Laboratory, Univer-sity of Pennsylvania, Philadelphia, PA, USA); and
4. AFNI version 2010_10_19_1028 (developed by NationalInstitute ofMental Health (NIMH), Bethesda,MD, USA).
The image processing pipeline consists of preprocessing,image registration and analysis.
For preprocessing, the DTI source data in DICOM(Digital Imaging and Communications in Medicine) for-mat is converted to NIFTI (Neuroimaging InformaticsTechnology Initiative) format using MRIConvert. Thisis necessary because the FSL, DTI-TK and AFNI areunable to process the DTI dataset in the DICOM formatdirectly. Then, eddy current correction is applied to cor-rect the artefacts introduced by the eddy current in theEPI sequence. FSL:bet is used to remove non-brain tis-sue from the DTI dataset and to create the brain mask forsubsequent processing. Tensor fitting, which fits the dif-fusion data into a diffusion tensor ellipsoid that repre-sents the fibre orientation, is performed on the extractedDTI dataset by using FSL:dtifit before it is further pro-cessed by DTI-TK. With DTI-TK, the diffusivity units
Fig. 3 A diagram showing theautomated image processingand analysis pipeline for theDTI data. DTI diffusion tensorimaging, FA fractionalanistropy, MD mean diffusivity
Eur Radiol
Author's personal copy
are first standardised, then the previously created brainmask is applied to the dataset, and outlier voxels are removedusing a threshold of 100 10-3mm2s-1.
For image registration, DTI-TK is used to resampleand register the DTI dataset of each individual subjectto match the International Consortium of Brain Map-ping (ICBM) DTI-81 atlas [6]. The registration processuses an initial rigid registration for bootstrapping, fol-lowed by a final affine registration. For this study, onlylinear image registration methods were used to avoidthe bias introduced by non-linear image registrationmethods.
For analysis, the post-registration DTI dataset of all sub-jects are passed to AFNI for further processing. DTI-TK:
pbrgb is used to generate the colour-coded directional map,while AFNI:3dDTeig is used to generate the FA and MDvolumes for each individual subject. Using the ICBMDTI-81 atlas as an anatomical guide, 16 white mattertracts were identified as regions of interest (ROIs). In Fig. 2,they are:
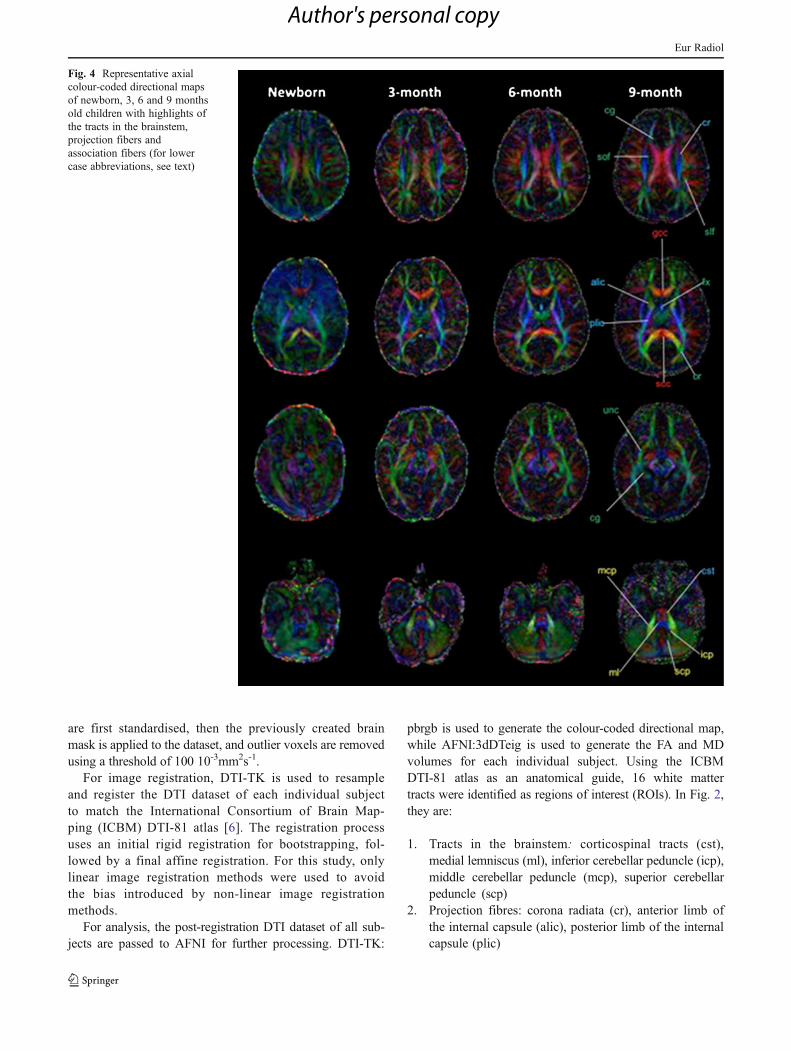
1. Tracts in the brainstem: corticospinal tracts (cst),medial lemniscus (ml), inferior cerebellar peduncle (icp),middle cerebellar peduncle (mcp), superior cerebellarpeduncle (scp)
2. Projection fibres: corona radiata (cr), anterior limb ofthe internal capsule (alic), posterior limb of the internalcapsule (plic)
Fig. 4 Representative axialcolour-coded directional mapsof newborn, 3, 6 and 9 monthsold children with highlights ofthe tracts in the brainstem,projection fibers andassociation fibers (for lowercase abbreviations, see text)
Eur Radiol
Author's personal copy

3. Association fibres: fornix (fx), cingulum (cg), superiorlongitudinal fasciculus (slf), superior occipitofrontal fas-ciculus (sof), uncinate fasciculus (unc), optic radiation(or), genu of the corpus callosum (gcc), splenium of thecorpus callosum (scc)
The median FA and MD values for each ROI are com-puted using the atlas-based auto-segmentation method withthe ICBM DTI-81 atlas as a template. The atlas-based meth-od is chosen for analysis because it avoids the bias intro-duced by the manual ROI method. The time courses ofmedian FA and MD were presented on the scatter plots.
The summary of the processing pipeline is illustrated inFig. 3.
Results
Overview of white matter maturation
Consistent evolutional changes were observed in the DTIcolour-coded directional maps during the white mattermaturation as shown in Figs. 4, 5 and 6. Representativeaxial colour-coded directional maps are shown every3 months for the first 2 years of life, every 6 monthsup to 3 years and thereafter yearly in older children.Visually, the most significant changes occur in the 1styear of life.
All the selected 16 white matter tracts could be differen-tiated throughout the entire age range (0–48 months). In the
Fig. 5 Representative axialcolour-coded directional mapsof 12, 15, 18 and 21 months oldchildren with highlights of thetracts in the brainstem,projection fibers andassociation fibers (for lowercase abbreviations, see text)
Eur Radiol
Author's personal copy

lower age range, these tracts appear fainter with lower FA.There is an increase in the sizes and FA of entire whitematter tracts throughout the 48 months with rapid changesoccurring in the first 12 months.
Tract-specific observations based on colour-codeddirectional maps
Brainstem
The superior, middle and inferior cerebellar peduncle, cor-ticospinal tract (CST) and medial lemniscus (ML) can beclearly identified in the newborn brain, although their sizeand intensity are much lower than in older brains.
Projection fibres
The corona radiata and internal capsule that contains projectionfibres are among the most prominent white matter tracts ob-served in newborns. During the first 2 years of life, progressivethickening and increased intensity of the tracts were observed.
Association fibres
The corpus callosum (CC) and uncinate fasciculus (UNC)are prominent and easily identified in the newborn brain.However, the superior longitudinal fasciculus (SLF) is lesswell visualised in newborns. It is well delineated only after6 months of life.
Fig. 6 Representative axialcolour-coded directional mapsof 24, 30, 36 and 48 months oldchildren with highlights of thetracts in the brainstem,projection fibers andassociation fibers (for lowercase abbreviations, see text)
Eur Radiol
Author's personal copy
Limbic fibres
The cingulum and fornix can be clearly identified in thenewborn brain, suggesting formation of early limbicfibres.
Comparison of DTI and relational MRI
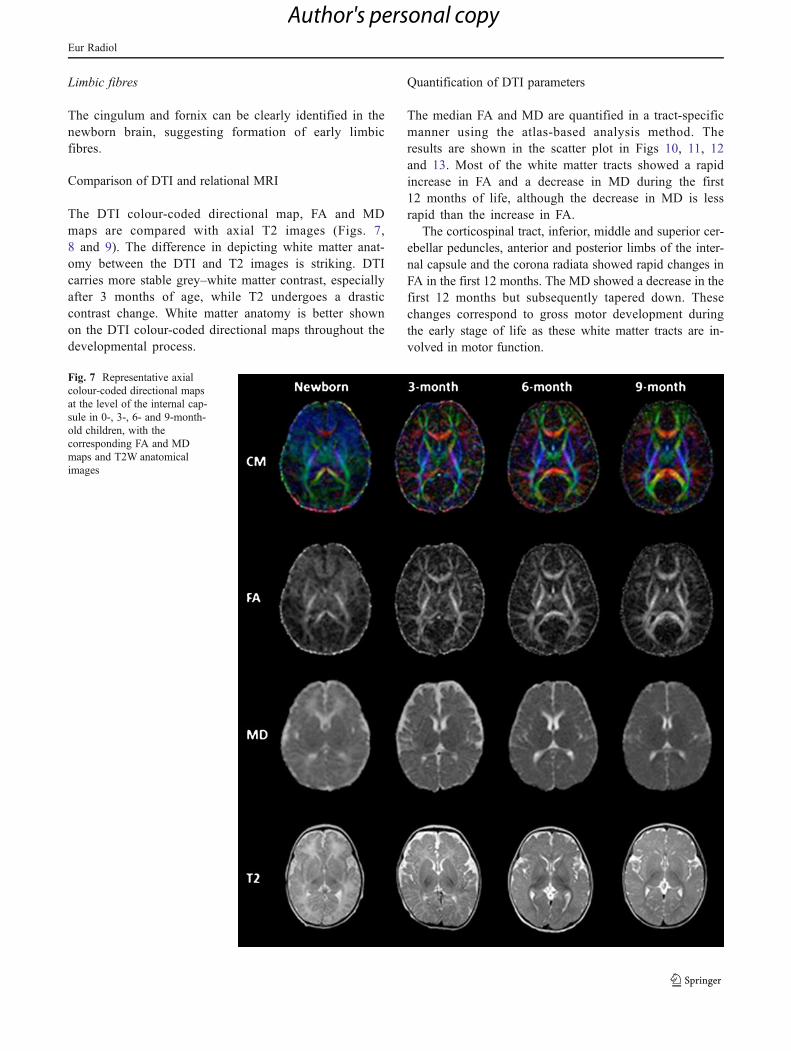
The DTI colour-coded directional map, FA and MDmaps are compared with axial T2 images (Figs. 7,8 and 9). The difference in depicting white matter anat-omy between the DTI and T2 images is striking. DTIcarries more stable grey–white matter contrast, especiallyafter 3 months of age, while T2 undergoes a drasticcontrast change. White matter anatomy is better shownon the DTI colour-coded directional maps throughout thedevelopmental process.
Quantification of DTI parameters
The median FA and MD are quantified in a tract-specificmanner using the atlas-based analysis method. Theresults are shown in the scatter plot in Figs 10, 11, 12and 13. Most of the white matter tracts showed a rapidincrease in FA and a decrease in MD during the first12 months of life, although the decrease in MD is lessrapid than the increase in FA.
The corticospinal tract, inferior, middle and superior cer-ebellar peduncles, anterior and posterior limbs of the inter-nal capsule and the corona radiata showed rapid changes inFA in the first 12 months. The MD showed a decrease in thefirst 12 months but subsequently tapered down. Thesechanges correspond to gross motor development duringthe early stage of life as these white matter tracts are in-volved in motor function.
Fig. 7 Representative axialcolour-coded directional mapsat the level of the internal cap-sule in 0-, 3-, 6- and 9-month-old children, with thecorresponding FA and MDmaps and T2W anatomicalimages
Eur Radiol
Author's personal copy

The superior longitudinal fasciculus, superior occipito-frontal fasciculus and optic radiation also showed a rapidincrease in FA during the first 12 months of life. The MDagain showed a decrease in the first 12 months and subse-quently tapered down. This is parallel to the development ofvisual and auditory functions.
Similar trends are also observed in the corpus callosumand cingulum.
However, the fornix and uncinate fasciculus do notshow similar trends. They showed fluctuating anisotropyand diffusivity throughout the 48 months. This suggeststhat myelination may not be the only determining factorfor white matter tract anisotropy. Other factors may alsocontribute to the change of anisotropy in these whitematter tracts.
Discussion
Magnetic resonance imaging is an essential tool forstudying abnormalities of paediatric brains. However, inthe early phase of brain development, the relaxationalMRI such as T1 and T2 imaging is incapable of depict-ing white matter anatomy satisfactorily due to rapidchanges in relaxation properties of the brain that affectthe contrast resolution. Conversely, DTI is capable ofshowing sharp contrast between grey and white matter,even at birth, and it remains stable throughout the devel-opmental process. Therefore, DTI allows for study of thematuration process of individual tracts and is an idealtool for characterising both normal and abnormal paediatricbrain anatomy [7].
Fig. 8 Representative axialcolour-coded directional mapsat the level of the internal cap-sule in 12-, 15-, 18- and 21-month-old children, with thecorresponding FA and MDmaps and T2W anatomicalimages
Eur Radiol
Author's personal copy
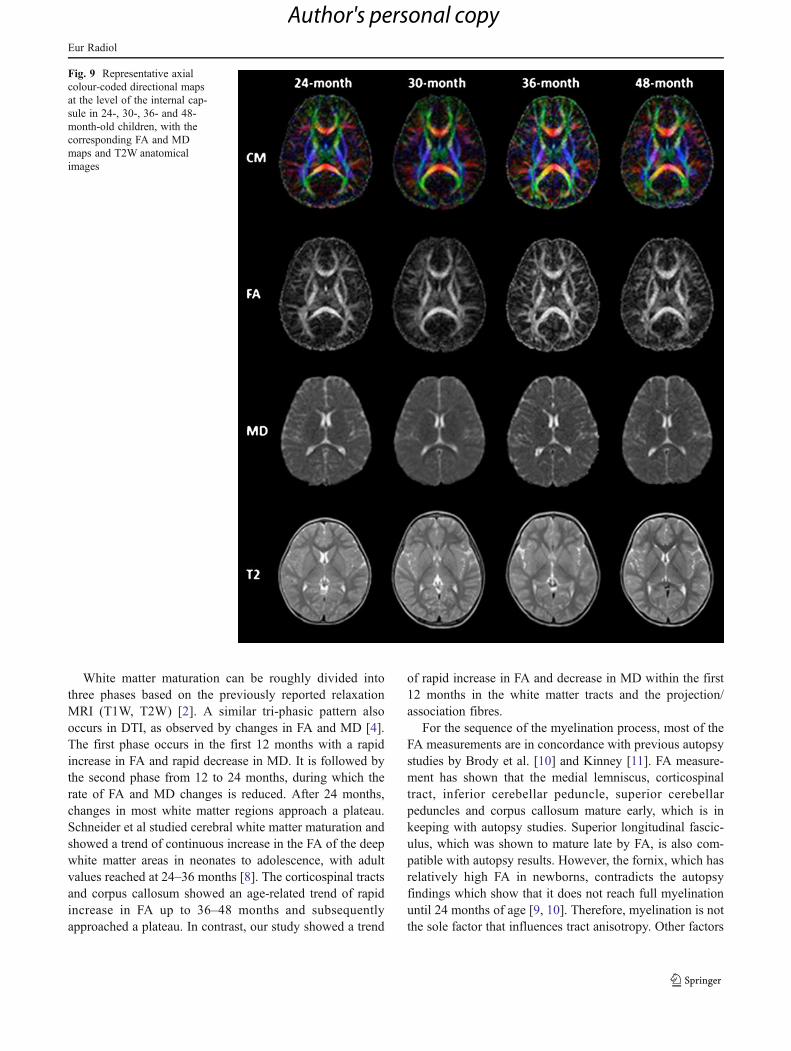
White matter maturation can be roughly divided intothree phases based on the previously reported relaxationMRI (T1W, T2W) [2]. A similar tri-phasic pattern alsooccurs in DTI, as observed by changes in FA and MD [4].The first phase occurs in the first 12 months with a rapidincrease in FA and rapid decrease in MD. It is followed bythe second phase from 12 to 24 months, during which therate of FA and MD changes is reduced. After 24 months,changes in most white matter regions approach a plateau.Schneider et al studied cerebral white matter maturation andshowed a trend of continuous increase in the FA of the deepwhite matter areas in neonates to adolescence, with adultvalues reached at 24–36 months [8]. The corticospinal tractsand corpus callosum showed an age-related trend of rapidincrease in FA up to 36–48 months and subsequentlyapproached a plateau. In contrast, our study showed a trend
of rapid increase in FA and decrease in MD within the first12 months in the white matter tracts and the projection/association fibres.
For the sequence of the myelination process, most of theFA measurements are in concordance with previous autopsystudies by Brody et al. [10] and Kinney [11]. FA measure-ment has shown that the medial lemniscus, corticospinaltract, inferior cerebellar peduncle, superior cerebellarpeduncles and corpus callosum mature early, which is inkeeping with autopsy studies. Superior longitudinal fascic-ulus, which was shown to mature late by FA, is also com-patible with autopsy results. However, the fornix, which hasrelatively high FA in newborns, contradicts the autopsyfindings which show that it does not reach full myelinationuntil 24 months of age [9, 10]. Therefore, myelination is notthe sole factor that influences tract anisotropy. Other factors
Fig. 9 Representative axialcolour-coded directional mapsat the level of the internal cap-sule in 24-, 30-, 36- and 48-month-old children, with thecorresponding FA and MDmaps and T2W anatomicalimages
Eur Radiol
Author's personal copy
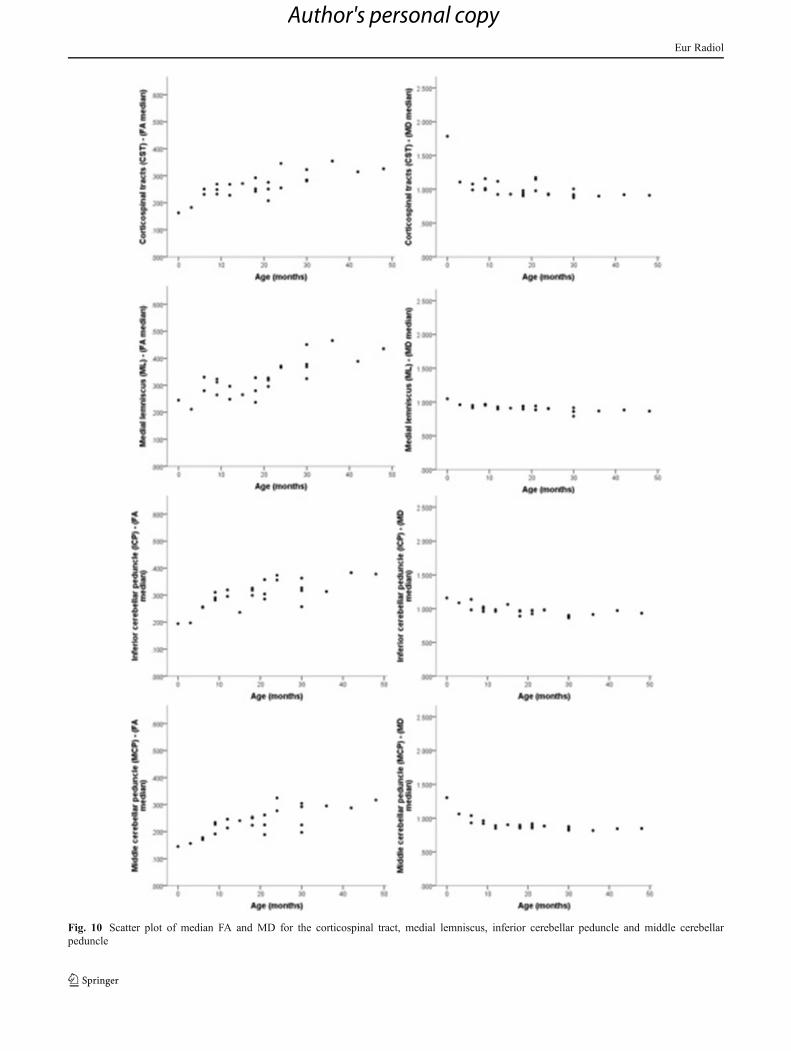
Fig. 10 Scatter plot of median FA and MD for the corticospinal tract, medial lemniscus, inferior cerebellar peduncle and middle cerebellarpeduncle
Eur Radiol
Author's personal copy

Fig. 11 Scatter plot of median FA and MD across the different ages for the superior cerebellar peduncle, corona radiata, and the anterior andposterior limbs of the internal capsule
Eur Radiol
Author's personal copy
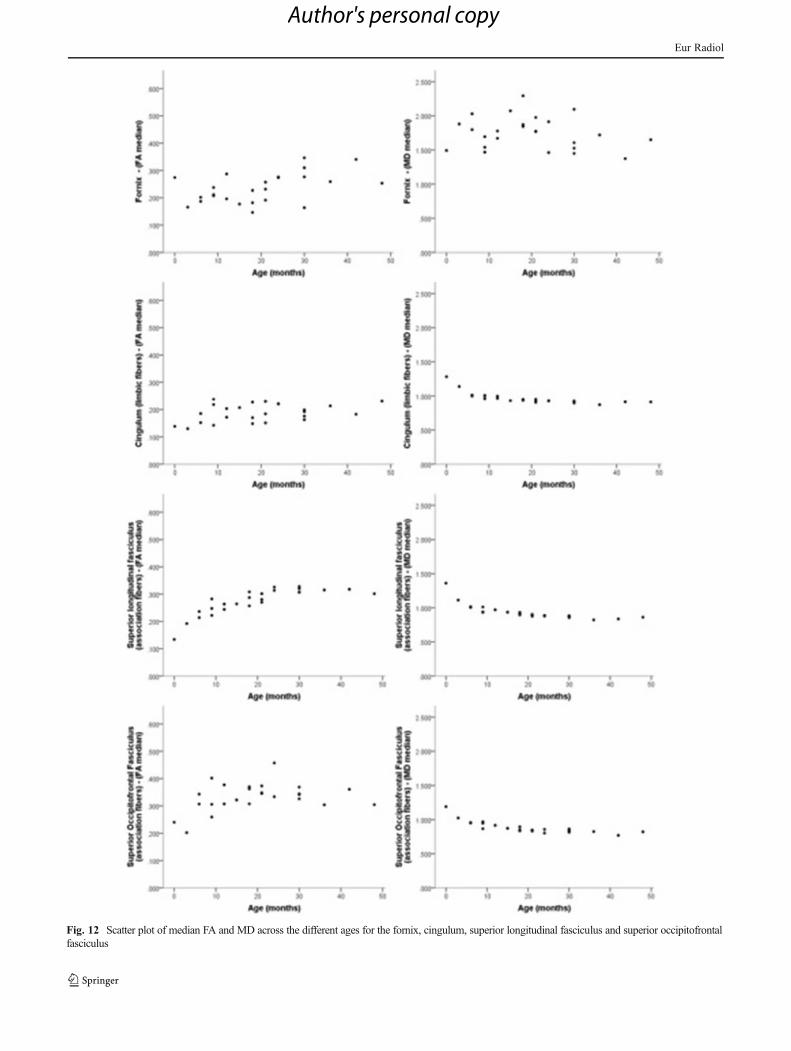
Fig. 12 Scatter plot of median FA and MD across the different ages for the fornix, cingulum, superior longitudinal fasciculus and superior occipitofrontalfasciculus
Eur Radiol
Author's personal copy

Fig. 13 Scatter plot of median FA and MD across the different ages for the uncinate fasciculus, optic radiation, genu and splenium of the corpus callosum
Eur Radiol
Author's personal copy

that can influence tract anisotropy, like reduction in watercontent, reduced extra-axonal space [11] and increased co-hesiveness and compactness of the fibre tracts [12], need tobe considered when there is discordance between the FAmeasurement and autopsy studies.
The DTI atlas produced from this study has the followinglimitations:
1. The dataset may not be representative of true populationnormative data owing to the limited number of subjectsthat were recruited for the study.
2. Possibility of misregistration of the ROIs by the atlas-based auto-segmentation technique in FA and MD anal-ysis. Because of a lack of a paediatric DTI atlas, theadult-based ICBM DTI-81 atlas was used. Therefore,there was a possibility that the ROIs derived may notaccurately represent the whole actual white matter tractof interest because of the differences in size between thepaediatric brain and the adult brain.
3. This study was unable to verify whether there is agender difference in terms of the rate of white mattermaturation, as some age groups in the study only had asingle subject from either gender.
4. The normal healthy subjects recruited were from fami-lies with different socio-economic backgrounds. In thisstudy, the rate of normal white matter maturation wasassumed to be the same and not affected by the differ-ences in the socio-economic status of the family.
In conclusion, DTI is superior to conventional MR im-aging techniques in depicting white matter maturation.There is a good correlation between the FA and MD changeswith white matter maturation. With the availability of nor-mative DTI data, DTI is expected to become a standardclinical tool in the diagnosis of paediatric neuropathology,most notably developmental abnormalities, tumours andwhite matter disease. The use of an automated processing
pipeline provides a reliable environment for quantitativeanalysis of high throughput DTI data.
References
1. Gilman S (1998) Imaging the brain. N Engl J Med 338:812–8202. Barkovich A, Kjos B, Jackson D Jr, Norman D (1988) Normal
maturation of the neonatal and infant brain: MR imaging at 1.5 T.Radiology 166:173
3. Knaap M, Valk J (1990) MR imaging of the various stages ofnormal myelination during the first year of life. Neuroradiology31:459–470
4. Mukherjee P, Miller J, Shimony J et al (2001) Normal brainmaturation during childhood: developmental trends characterizedwith diffusion-tensor MR imaging. Radiology 221:349
5. Hermoye L, Saint-Martin C, Cosnard G et al (2006) Pediatricdiffusion tensor imaging: normal database and observation of thewhite matter maturation in early childhood. Neuroimage 29:493–504
6. Ozturk A, Sasson AD, Farrell JAD et al (2008) Regional differ-ences in diffusion tensor imaging measurements: assessment ofintrarater and interrater variability. Am J Neuroradiol 29:1124–1127
7. Mori S, Oishi K, Jiang H et al (2008) Stereotaxic white matter atlasbased on diffusion tensor imaging in an ICBM template. Neuro-image 40:570–582
8. Schneider JFL, Il’yasov KA, Hennig J, Martin E (2004) Fastquantitative diffusion-tensor imaging of cerebral white matter fromthe neonatal period to adolescence. Neuroradiology 46:258–266
9. Lee SK, Kim DI, Kim J et al (2005) Diffusion-tensor MR imagingand fiber tractography: a new method of describing aberrant fiberconnections in developmental CNS anomalies. Radiographics25:53
10. Brody B, Kinney H, Kloman A, Gilles F (1987) Sequence ofcentral nervous system myelination in human infancy. I. An au-topsy study of myelination. J Neuropathol Exp Neurol 46:283
11. Kinney H (1988) Sequence of central nervous system myelinationin human infancy. II. Patterns of myelination in autopsied infants. JNeuropathol Exp Neurol 47:217
12. Beaulieu C (2002) The basis of anisotropic water diffusion in thenervous system – a technical review. NMR Biomed 15:435–455
Eur Radiol
Author's personal copy