Embed Size (px)
Citation preview

Technical Note:
Three-Point Method for EvaluatingCorrosion Current and Tafel SlopesFrom a Single Polarization Curve*
S. BARNARTT* and M. DONALDSON**
IntroductionClassically, both anodic and cathodic polarization measure-ments are required to evaluate the corrosion current (I*) aswell as the two Tafel slopes (ba , bc). These three quantities aresufficient to characterize the corrosion kinetics of most cor-roding metal systems. It is possible, however, to evaluate thethree parameters from anodic polarization measurementsonly, or from cathodic polarization measurements only. Anovel method of doing this is presented here. Experimentally,the method is a quick one in that it requires current measure-ments at only three applied anodic potentials, or alternativelyat three cathodic potentials.
A majority of corroding electrodes obey the current/po-tential relation,
2.303 (E — E*) 2.303 (E — E*)I/I * _ ± exp — exp
ba bc (1)
where 1* is the corrosion current (at potential E*), b a and bc be-ing the Tafel slopes for the anodic and cathodic reactions. Theplus sign in front of the braces refers to anodic polarization(E> E*), the negative sign to cathodic (E< E*). Recentreviews12 summarize experimental methods for evaluating I',ba , and bc , the parameters needed to fix the anodic andcathodic polarization curves given by Equation (1). There is aminimum requirement of three current measurements at threevalues of DE (= E—E*) for determination of theseparameters.
A three-point method previously described 3 makes use ofcurrent measurements at three interrelated potentials, twoanodic and one cathodic (or vice versa), such as AE, 2 AE, and—2 E. In that "quadratic" method, the experimental data arecombined into a single quadratic equation, the two roots ofwhich yield numerical values for b a , bc , and 1*.
In this report, we describe a new three-point method thatpermits either cathodic polarization measurements only oranodic only. Restriction to cathodic measurements only isuseful where anodic current causes surface etching. Anodicpolarization only can be beneficial where cathodic hydrogenevolution is accompanied by hydride precipitation in the elec-trode surface. It should be noted that the second term on theright hand side of Equation (1) becomes negligible for large
*Submitted for publication April, 1982; revised May, 1982.*Westinghouse Electric Corporation, Bettis Atomic PowerLaboratory, West Mifflin, Pennsylvania.
**CIBAR Incorporated, Colorado Springs, Colorado.
values of AE, roughly AE >2.3 RTIF, where R is the gas con-stant, T absolute temperature, and F the Faraday. Currentsmeasured at large positive values of AE give no informationabout bc , hence at least one of the three experimental currentsmust be measured at IAEI <2.3 RT/F.
A "linear least squares" method of analyzing polarizationdata that has the capability of evaluating b a, bc , and 1* from asingle polarization curve has been described by Mansfeld. 4
That method makes use of the welt-known linear-polarizationapproximation, and requires measurements at small NAEI todetermine the polarization resistance (dE/dl)E = E•. The newthree-point method described here is more direct in that itutilizes Equation (1) without changing variables, it requiresfewer experimental measurements, and it is rigorous, i.e.,polarization resistance or other approximations are not in-volved.
The new method is a direct search analysis of the genera)type described by Hooke and Jeeves. 5 It operates on threeequations obtained from Equation (1) by inserting numericalvalues of currents I 1 , 1 2 , and 1 3 measured at potential changesL E 1 , DE2 , and AE3, respectively. These nonlinear relations canbe solved by the minimization procedure described below.First they are combined to yield a function equal to zero for thecorrect values of ba , bc , and 1*. Starting with initial guesses ofthese three "unknowns," the minimization routine is appliedby computer to change the unknowns by increments andgradually bring the function as close to zero as desired.
Description of the MethodWe label the unknowns x 1 , x2 , and x3 , and the function of x
to be minimized F(X). Making direct use of Equation (1) in theform shown for left and right hand sides (LHS and RHS), wefind that a useful expression for the function to be minimizedis
1
—^LHS
RHS \2F(X) _ i//1 (2)
To determine the minimum of a function which can not besolved explicitly, it is necessary to determine an initial approx-imation Xo = (X° X21...XO) and a method of improving the ap-proximation. In addition, a technique to determine con-vergence is required. Define
0010.9312183/000011 /$3.00/0Vol. 39, No. 1, January, 1983 c, 1983, National Association of Corrosion Engineers 33
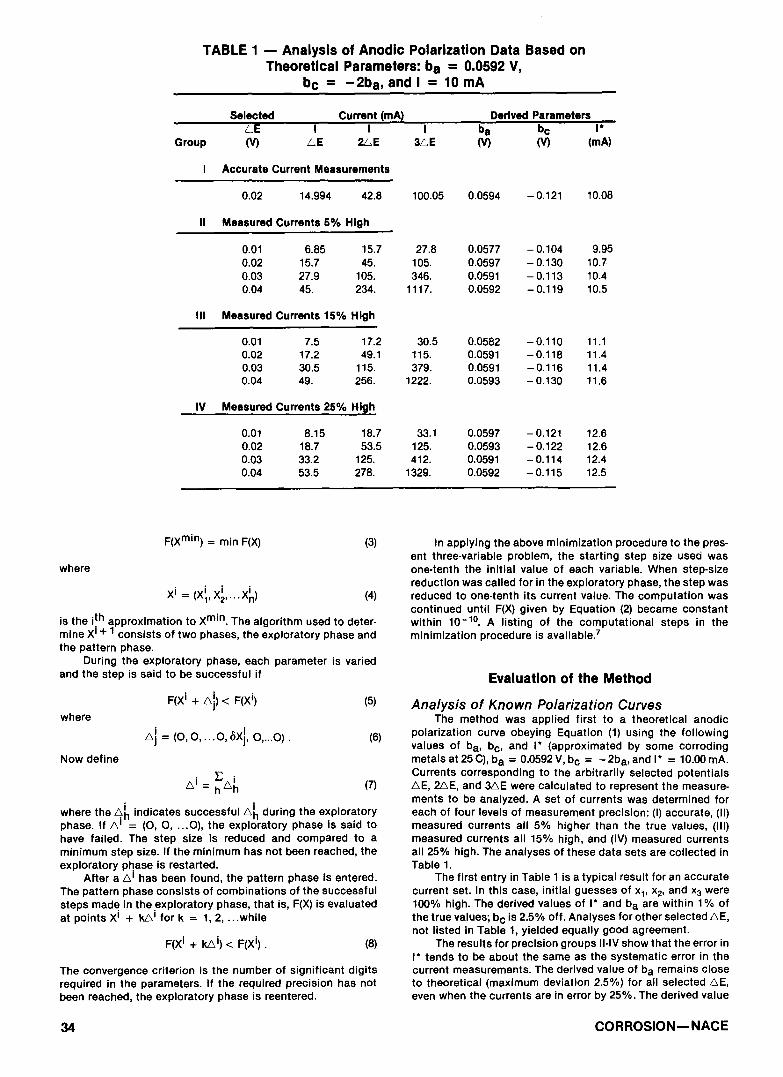
TABLE 1 - Analysis of Anodic Polarization Data Based onTheoretical Parameters: b a = 0.0592 V,
bc = - 2ba, and 1 = 10 mA
Selected Current (mA) Derived ParametersLE 1 1 1 be bc 1•
Group (V) L,E 2LE 3LE (V) (V) (mA)
1 Accurate Current Measurements
0.02 14.994 42.8 100.05 0.0594 -0.121 10.08
II Measured Currents 5% High
0.01 6.85 15.7 27.8 0.0577 -0.104 9.950.02 15.7 45. 105. 0.0597 -0.130 10.70.03 27.9 105. 346. 0.0591 -0.113 10.40.04 45. 234. 1117. 0.0592 -0.119 10.5
III Measured Currents 15% High
0.01 7.5 17.2 30.5 0.0582 -0.110 11.10.02 17.2 49.1 115. 0.0591 -0.118 11.40.03 30.5 115. 379. 0.0591 -0.116 11.40.04 49. 256. 1222. 0.0593 -0.130 11.6
IV Measured Currents 25% High
0.01 8.15 18.7 33.1 0.0597 -0.121 12.60.02 18.7 53.5 125. 0.0593 -0.122 12.60.03 33.2 125. 412. 0.0591 -0.114 12.40.04 53.5 278. 1329. 0.0592 -0.115 12.5
F(Xmin) = min F(X) (3)
X i
where
= (X1, XZ,...Xn) (4)
is the ith approximation to Xmin . The aigorithm used to deter-mine Xi + 1 consists of two phases, the exploratory phase andthe pattern phase.
During the exploratory phase, each parameter is variedand the step is said to be successful if
F(X' + Aj) < F(X') (5)
where
= (0, 0, ...0, SX], 0,...0) . (6)
Now define
= h ^h (7)
where the Ah indicates successful th during the exploratoryphase. If A' = (0, 0, ...0), the exploratory phase is said tohave failed. The step size is reduced and compared to aminimum step size. ff the minimum has not been reached, theexploratory phase is restarted.
After a Ai has been found, the pattern phase is entered.The pattern phase consists of combinations of the successfulsteps made in the exploratory phase, that is, F(X) is evaluatedat points Xi + k0' for k = 1, 2, ...while
F(X + kAi) < F(Xi) . (8)
The convergence criterion is the number of significant digitsrequired in the parameters. If the required precision has notbeen reached, the exploratory phase is reentered.
In applying the above minimization procedure to the pres-ent three-variable problem, the starting step size used wasone-tenth the initial value of each variable. When step-sizereduction was called for in the exploratory phase, the step wasreduced to one-tenth its current value. The computation wascontinued until F(X) given by Equation (2) became constantwithin 10 -10. A listing of the computational steps in theminimization procedure is available. 7
Evaluation of the Method
Analysis of Known Polarization CurvesThe method was applied first to a theoretical anodic
polarization curve obeying Equation (1) using the followingvalues of ba, bc, and 1* (approximated by some corrodingmetals at 25 C), b a = 0.0592 V, bc = - 2ba , and 1* = 10.00 mA.Currents corresponding to the arbitrarily selected potentialsAE, 2,nE, and 30E were calculated to represent the measure-ments to be analyzed. A set of currents was determined foreach of four levels of measurement precision: (1) accurate, (II)measured currents all 5% higher than the true values, (III)measured currents all 15% high, and (IV) measured currentsall 25% high. The analyses of these data sets are collected inTable 1.
The first entry in Table 1 is a typical result for an accuratecurrent set. In this case, initial guesses of x 1 , x2 , and x3 were100% high. The derived values of 1* and ba are within 1% ofthe true values; b c is 2.5% off. Analyses for other selected AE,not listed in Table 1, yielded equally good agreement.
The results for precision groups II-IV show that the error in1* tends to be about the same as the systematic error in thecurrent measurements. The derived value of b a remains closeto theoretical (maximum deviation 2.5%) for all selected AE,even when the currents are in error by 25%. The derived value
34 CORROSION-NACE
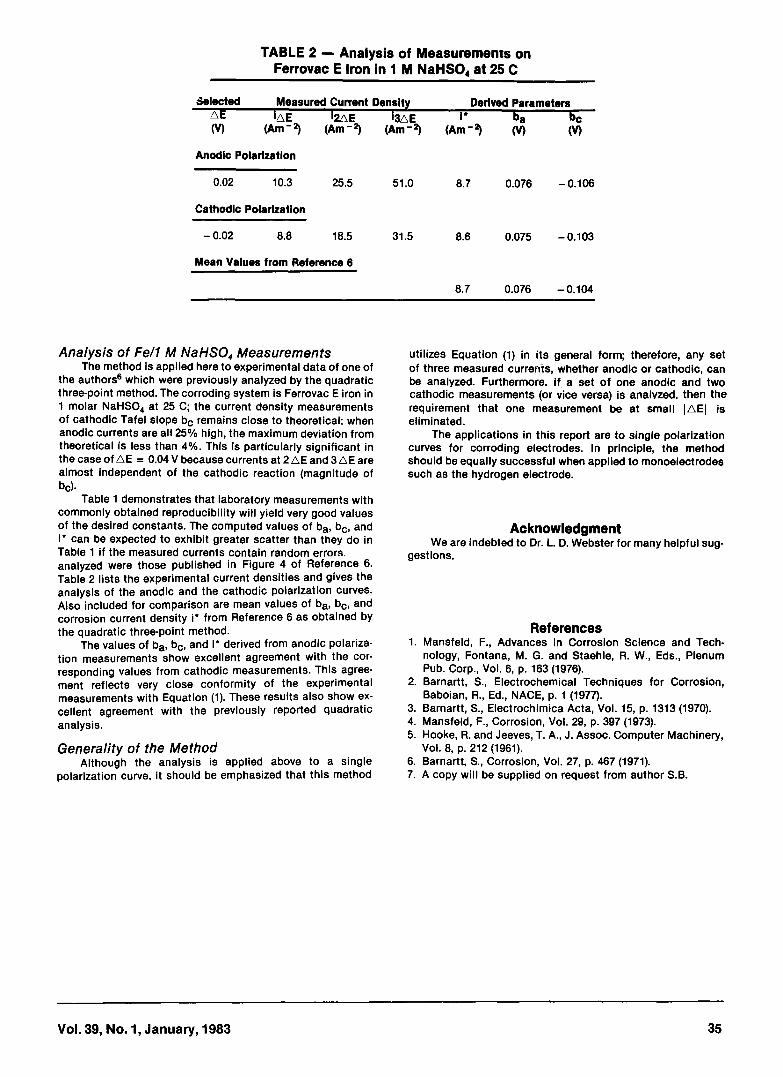
TABLE 2 — Analysis of Measuremenis onFerrovac E Iron in 1 M NaHSO 4 at 25 C
Selected Measured Current Density Derived ParametersAE oE 12LE 13AE 1' ba bc(V) (Am) (Am') (Am) (Am) (V) (V)
Anodic Polarization
0.02 10.3 25.5 51.0 8.7 0.076 —0.106
Cathodic Polarization
—0.02 8.8 18.5 31.5 8.6 0.075 —0.103
Mean Values from Reference 6
8.7 0.076 —0.104
Analysis of Fe/1 M NaHSO, MeasurementsThe method is applied here to experimental data of one of
the authors6 which were previously analyzed by the quadraticthree-point method. The corroding system is Ferrovac E iron in1 molar NaHSO4 at 25 C; the current density measurementsof cathodic Tafel slope bc remains close to theoretical: whenanodic currents are all 25% high, the maximum deviation fromtheoretical is less than 4%. This is particularly significant inthe case of oE = 0.04 V because currents at 2,nE and 30E arealmost independent of the cathodic reaction (magnitude ofbc).
Table 1 demonstrates that laboratory measurements withcommonly obtained reproducibility wilt yield very good valuesof the desired constants. The computed values of ba , bc , and1* can be expected to exhibit greater scatter than they do inTable 1 if the measured currents contain random errors.analyzed were those published in Figure 4 of Reference 6.Table 2 lists the experimental current densities and gives theanalysis of the anodic and the cathodic polarization curves.Also included for comparison are mean values of b a, bc , andcorrosion current density i from Reference 6 as obtained bythe quadratic three-point method.
The values of ba, bc , and i' derived from anodic polariza-tion measurements show excellent agreement with the cor-responding values from cathodic measurements. This agree-ment reflects very close conformity of the experimentalmeasurements with Equation (1). These results also show ex-cellent agreement with the previously reported quadraticanalysis.
Generality of the MethodAlthough the analysis is applied above to a single
polarization curve, it should be emphasized that this method
utilizes Equation (1) in its general form; therefore, any setof three measured currents, whether anodic or cathodic, canbe analyzed. Furthermore. if a set of one anodic and twocathodic measurements (or vice versa) is analvzed, then therequirement that one measurement be at small JAEI iseliminated.
The applications in this report are to single polarizationcurves for corroding electrodes. In principle, the methodshould be equally successful when applied to monoelectrodessuch as the hydrogen electrode.
AcknowledgmentWe are indebted to Dr. L. D. Webster for many helpful sug-
gestions.
References1. Mansfeld, F., Advances in Corrosion Science and Tech-
nology, Fontana, M. G. and Staehle, R. W., Eds., PlenumPub. Corp., Vol. 6, p. 163 (1976).
2. Barnartt, S., Electrochemical Techniques for Corrosion,Baboian, R., Ed., NACE, p. 1 (1977).
3. Barnartt, S., Electrochimica Acta, Vol. 15, p. 1313 (1970).4. Mansfeld, F., Corrosion, Vol. 29, p. 397 (1973).5. Hooke, R. and Jeeves, T. A., J. Assoc. Computer Machinery,
Vol. 8, p. 212 (1961).6. Barnartt, S., Corrosion, Vol. 27, p. 467 (1971).7. A copy will be supplied on request from author S.B.
Vol. 39, No. 1, January, 1983 35


![Studies on Corrosion of Annealed and Aged 18 Ni 250 Grade ...T. Poornima et al. / Port. Electrochim. Acta 28 (2010) 173-188 176 [13] and the R p values obtained from Tafel polarization](https://img.pdfslide.us/doc/110x75/6044f38759b2cb10416d99a5/studies-on-corrosion-of-annealed-and-aged-18-ni-250-grade-t-poornima-et-al.jpg)