Embed Size (px)
Citation preview

Oregon 2013 Visitor Report

Table of Contents
2
Introduction….....………………………………………………………………………………... 3
Methodology….…………………………………………………………………………………. 4
U.S. Travel Market Size & Structure …..…………………..………………………………. 5
Oregon Travel Market Size & Structure ……………………………………………………... 9
Overnight Trip Detail…......……………………..……...……………...………………………. 17
Overnight Trip Characteristics……………..……………………………………………. 18
Day Trip Detail………………………………………………..…………………………......….. 36
Day Trip Characteristics……….……………………………..………...……………….. 37
Demographic Profile of Visitors to Oregon……….....………………………..…………….. 49
Appendix: Key Terms Defined…………………………………………...………..…………... 61

Introduction
3
Longwoods International began tracking American travelers in 1985, and
has conducted large-scale syndicated visitor research quarterly since
1990.
In 2007, our proprietary Longwoods Travel USA® program was migrated
from mail to online, with the benefits of rapid turnaround, enhanced
flexibility and interactivity, as well as greater respondent involvement.
It is currently the largest ongoing study ever conducted of American
travelers, providing our clients with more reliable data and greater ability
to home in on key market segments of interest.
This report provides an overview of Oregon’s domestic tourism business
in 2013.

Methodology
4
Each quarter, a random cross-section of online sample is sent an e-
mail invitation to participate in the survey. A reminder is e-mailed
several days later to non-responders.
For the 2013 travel year, this yielded:
229,726 trips for analysis nationally:
153,730 overnight trips
75,996 day trips
For Oregon, the following sample was achieved in 2013:
4,748 trips:
2,995 overnight trips, of which 1,308 were marketable trips
1,753 day trips, of which 1,013 were marketable trips
For analysis, data were weighted on key demographics to correct for
any differences between the sample and U.S. population targets.

U.S. Travel Market Structure & Trends

Total Size of the U.S. Travel Market — 2009-2013
1,312 1,367 1,413 1,451 1,480
0
500
1,000
1,500
2,000
2009 2010 2011 2012 2013
Mill
ion
s o
f Tr
ips
6
Base: Total Overnight Trips
2.0%

Structure of the U.S. Travel Market — 2013 Overnight Trips
7
Visits to Friends/Relatives
44%
Marketable 43%
Business 10%
Business-Leisure 4%
Base: Adult Overnight Trips

U.S. Market Trends for Overnight Trips — 2013 vs. 2012
2
3
2
-3
-1
-10 -5 0 5 10
All Overnight Trips
Visiting Friends/Relatives
Marketable Trips
Business-Leisure Trips
Business Trips
Percent Change
8
Base: Total Overnight Trips

Oregon Travel Market
Size & Structure
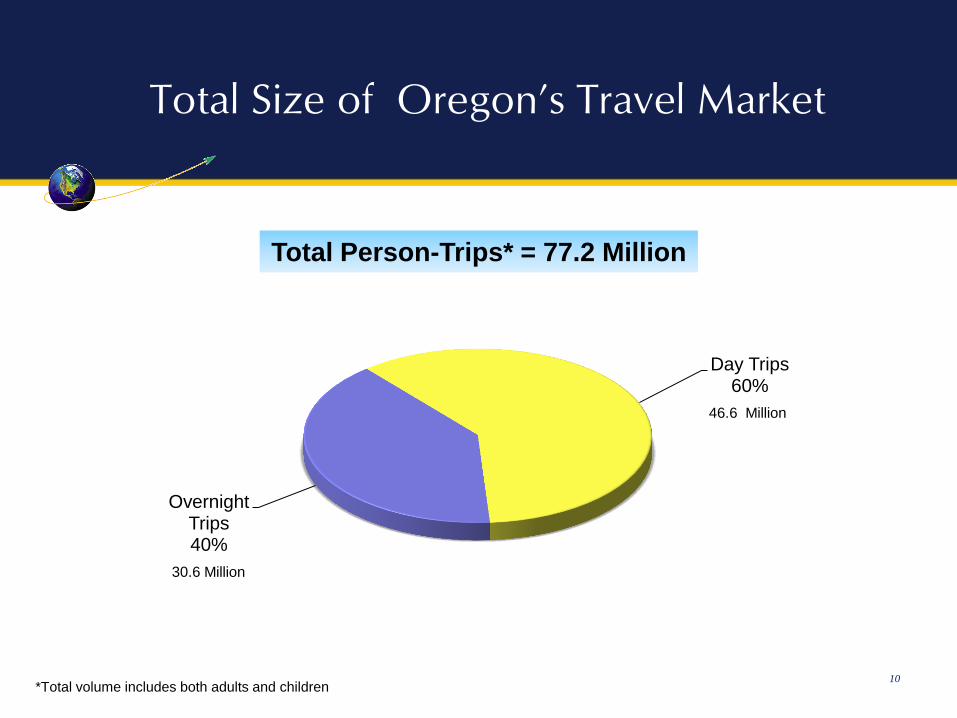
Total Size of Oregon’s Travel Market
10
Total Person-Trips* = 77.2 Million
Day Trips 60%
Overnight Trips 40%
30.6 Million
46.6 Million
*Total volume includes both adults and children

Oregon’s Share of Adult Domestic Trips
11
Base: Adult Person-Trips
2.2% 2.3% 1.9% 2.0%
0%
1%
2%
3%
4%
2011 2013
Perc
ent
Day Overnight
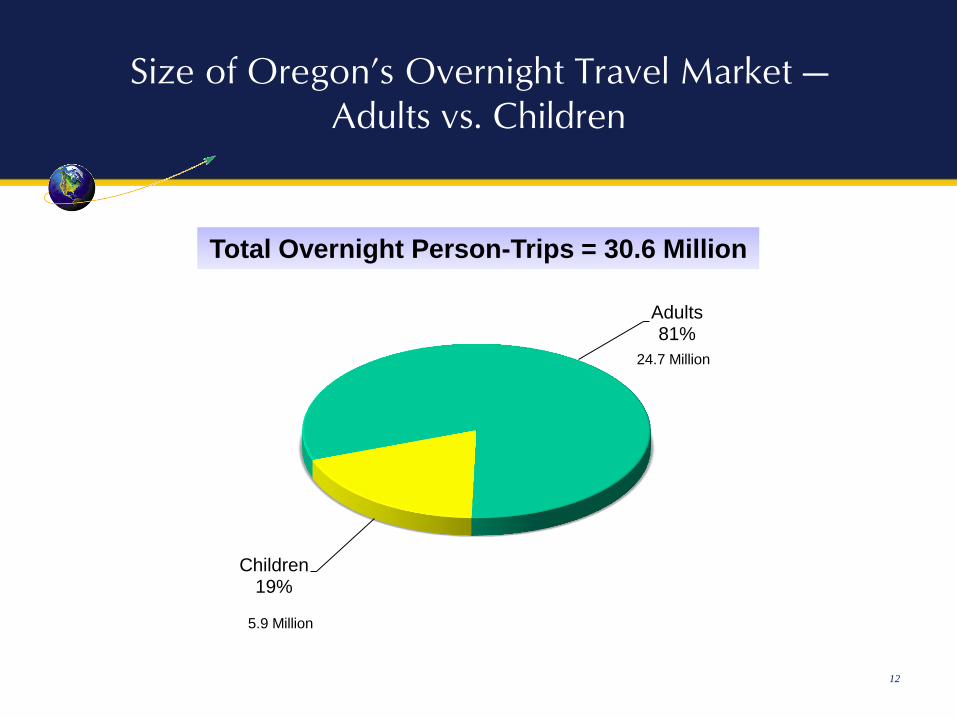
Size of Oregon’s Overnight Travel Market — Adults vs. Children
12
Total Overnight Person-Trips = 30.6 Million
Adults 81%
Children 19%
5.9 Million
24.7 Million

Oregon’s Overnight Travel Market — by Trip Purpose
13
Marketable 47%
VFR 44%
Business 9%
Base: Adult Overnight Person-Trips to Oregon
*Marketable includes Business-Leisure
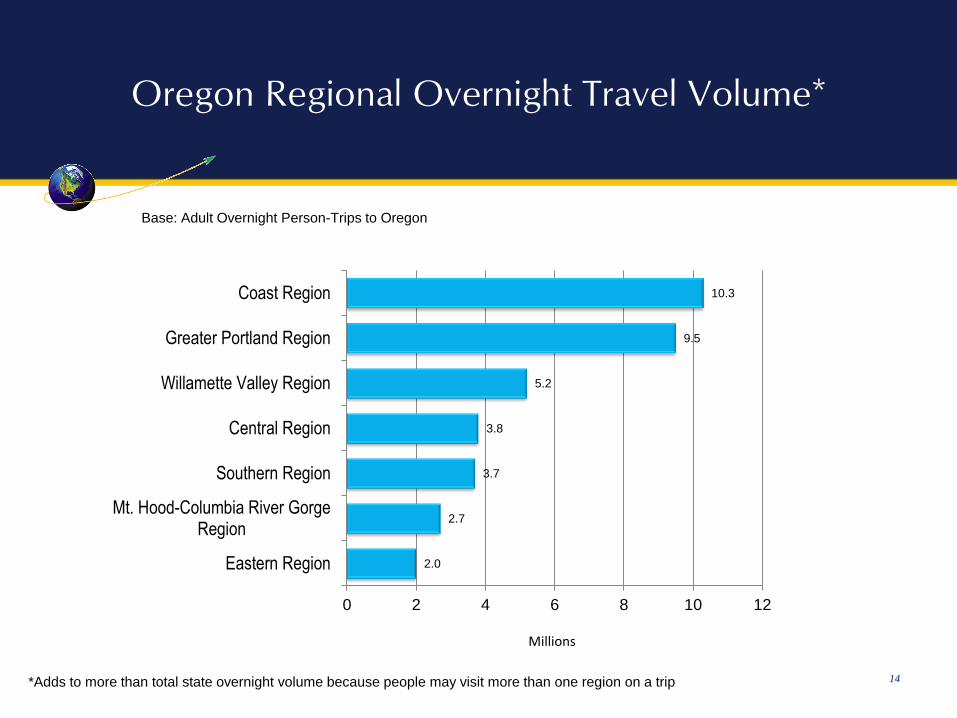
Oregon Regional Overnight Travel Volume*
14
10.3
9.5
5.2
3.8
3.7
2.7
2.0
0 2 4 6 8 10 12
Coast Region
Greater Portland Region
Willamette Valley Region
Central Region
Southern Region
Mt. Hood-Columbia River GorgeRegion
Eastern Region
Millions
Base: Adult Overnight Person-Trips to Oregon
*Adds to more than total state overnight volume because people may visit more than one region on a trip

Size of Oregon’s Day Travel Market — Adults vs. Children
15
Total Day Person-Trips = 46.6 Million
Adults 79%
Children 21%
9.6 Million
37 Million

Oregon’s Day Travel Market — by Trip Purpose
16
Marketable 59%
VFR 33%
Business 8%
Base: Adult Day Person-Trips to Oregon
*Marketable includes Business-Leisure

Overnight Trip Detail
Overnight Trip Characteristics

Main Purpose of Marketable Trip – Oregon vs. National Norm
19
Base: Overnight Marketable Trips
24
23
15
13
11
8
2
2
2
1
17
14
17
10
13
13
4
9
2
2
0 10 20 30
Touring
Outdoors
Special Event
Resort
City Trip
Casino
Cruise
Theme Park
Ski/Snowboarding
Golf
Percent
Oregon US Norm

State Origin Of Trip
20
Base: Overnight Marketable Trips
51
16
11
2
2
2
2
0 20 40 60
Oregon
Washington
California
Texas
New York
Idaho
Illinois
Percent

DMA Origin Of Trip
21
Base: Overnight Marketable Trips
36
11
10
5
4
3
3
2
2
2
2
2
0 10 20 30 40
Portland, OR
Eugene, OR
Seattle-Tacoma, WA
Medford-Klamath Falls, CA/OR
San Francisco-Oakland-San Jose, CA
Los Angeles, CA
Bend, OR
Yakima, WA
Sacramento-Stockton-Modesto, CA
New York City, NY
Spokane, ID/WA
Washington, DC
Percent

Season of Trip
22
20
25
34
21
0 10 20 30 40
January-March
April-June
July-September
October-December
Percent
Base: Overnight Marketable Trips

Method of Planning Trip
23
Base: Overnight Marketable Trips
63
9
39
65
9
35
0
20
40
60
80
Internet Travel Agent Other/None
Perc
ent
Oregon US Norm

Method of Booking Trip
24
59
8
39
64
9
32
0
20
40
60
80
Internet Travel Agent Other/None
Perc
ent
Oregon US Norm
Base: Overnight Marketable Trips

Total Nights Away on Trip
25
23
30
23
10
10
4
24
28
26
10
10
3
0 10 20 30 40
1 night
2 nights
3-4 nights
5-6 nights
7-13 nights
14+ nights
Percent
Oregon US Norm
Average
Oregon
= 3.9 Nights
Base: Overnight Marketable Trips
Average
US Norm
= 3.5 Nights

Number of Nights Spent in Oregon
26
Average Nights Spent in Oregon = 2.9
Base: Overnight Marketable Trips with 1+ Nights Spent In Oregon
29
35
22
8
6
0 10 20 30 40 50
1 night
2 nights
3-4 nights
5-6 nights
7+ nights
Percent

Size of Travel Party
27
2.5
2.5
0.8
0.8
0 1 2 3 4
Oregon
US Norm
Average No. of People
Adults Children
Total = 3.3
Total = 3.3
Base: Overnight Marketable Trips

Transportation
28
77
14
9
3
3
15
7
7
6
3
68
18
5
2
2
20
6
11
8
4
0 20 40 60 80 100
Own car/truck
Rental car
Camper, R.V
Motorcycle
Bicycle
Plane
Train
Taxi Cab
Bus
Ship/Boat
Percent
Oregon US Norm
Base: Overnight Marketable Trips
Personal
Vehicles
Commercial
Vehicles
Responses to question: “What types of transportation did you use on this trip?”

Accommodation
29
Base: Overnight Marketable Trips
27
26
19
17
10
7
7
7
6
6
5
4
16
26
29
8
7
4
4
5
6
4
3
3
0 10 20 30 40
Motel
Hotel
Resort hotel
Campground/trailer park/RV park
Friend/relative's dwelling (not paid)
Rented home/condo/apartment
Rented cottage/cabin
Time share
Bed & breakfast
Country inn/lodge
Own home/condo/apartment/cabin
Boat/cruise ship
Percent
Oregon US Norm

Activities and Experiences
30
35
30
24
23
21
21
19
18
16
14
13
11
10
10
9
35
19
14
25
17
10
22
8
19
5
13
13
8
6
6
0 10 20 30 40 50
Shopping
Beach/Waterfront
National/State park
Fine dining
Landmark/Historic site
Hiking/Backpacking
Swimming
Camping
Casino
Brewery
Museum
Bar/Disco/Nightclub
Fishing
Art gallery
Fair/Exhibition/Festival
Percent
Oregon US Norm
Base: Overnight Marketable Trips

Activities and Experiences (Cont’d)
31
8
7
7
6
6
6
6
6
6
5
5
5
4
4
4
5
5
7
8
7
6
13
5
6
5
2
2
3
2
2
0 10 20 30 40 50
Winery
Biking
Boating/Sailing
Theater
Spa
Zoo
Theme park
Golf
Dance
Rock/Pop concert
Rafting
Hunting
Mountain climbing
Motorcycle touring
Tennis
Percent
Oregon US Norm
Base: Overnight Marketable Trips

Activities and Experiences (Cont’d)
32
4
4
4
3
3
3
3
3
3
3
3
2
2
3
2
2
3
2
1
2
4
1
2
2
2
1
0 10 20 30 40 50
Attend/Part in kids sports event
Birding
Skiing/Snowboarding
Part in adult sports event
Business meeting
Rodeo
Convention/conference
Pro/College sports event
Opera
Watch Amateur/Youth Sports
Part. In Amateur/Youth Sports
Trade show
Symphony
Percent
Oregon US Norm
Base: Overnight Marketable Trips

Activities of Special Interest
33
38
30
20
11
11
9
32
29
19
9
9
7
0 10 20 30 40
Historic places
Cultural activities/attractions
Exceptional culinary experiences
Eco-tourism
Winery tours/Wine tasting
Traveling with grandchildren
Percent
Oregon US Norm
Base: Overnight Marketable Trips

Online Social Media Use by Travelers
34
79
44
32
31
22
20
14
13
77
43
30
28
22
19
14
13
0 20 40 60 80 100
Used any social media for travel
Used Smartphone while traveling
Posted travel photos/video online
Read travel reviews
Looked at travel photos/video online
Accessed travel news/events/deals/promotions
Connected with others interested in travel
Read a travel blog
Percent
Oregon US Norm
Base: Overnight Marketable Trips

Online Social Media Use by Travelers (Cont’d)
35
79
13
10
10
10
8
7
6
77
12
10
10
11
7
9
6
0 20 40 60 80 100
Used any social media for travel
Got travel advice
"Followed" a destination/attraction
Gave travel advice
Contributed travel reviews
Subscribed to a travel e-newsletter
Tweeted about a trip
Blogged about a trip
Percent
Oregon US Norm
Base: Overnight Marketable Trips
Day Trip Detail

Day Trip Characteristics

Main Purpose of Marketable Trip – Oregon vs. National Norm
38
Base: Day Marketable Trips
26
22
16
10
10
6
5
2
2
1
1
20
12
16
14
15
10
3
1
1
7
1
0 10 20 30
Touring
Outdoors
Shopping
City Trip
Special Event
Casino
Resort
Ski/Snowboarding
Cruise
Theme Park
Golf
Percent
Oregon US Norm

State Origin Of Trip
39
Base: Day Marketable Trips
67
17
7
2
0 20 40 60 80
Oregon
Washington
California
Idaho
Percent

DMA Origin Of Trip
40
Base: Day Marketable Trips
50
13
9
7
2
2
2
2
0 20 40 60
Portland, OR
Eugene, OR
Seattle-Tacoma, WA
Medford-Klamath Falls, CA/OR
Bend, OR
San Francisco-Oakland-San Jose, CA
Boise, ID
Los Angeles, CA
Percent

Season of Trip
41
23
24
32
22
0 10 20 30 40
January-March
April-June
July-September
October-December
Percent
Base: Day Marketable Trips

Size of Travel Party
42
2.2
2.3
0.6
0.7
0 1 2 3 4
Oregon
US Norm
Average No. of People
Adults Children
Total = 2.8
Total = 3
Base: Day Marketable Trips

Activities and Experiences
43
33
23
16
15
14
12
11
7
7
7
6
5
5
5
4
32
9
7
8
11
12
13
9
5
8
3
6
2
3
6
0 10 20 30 40
Shopping
Beach/waterfront
Hiking/backpacking
National/state park
Landmark/historic site
Casino
Fine dining
Museum
Fishing
Swimming
Camping
Zoo
Brewery
Winery
Fair/exhibition/festival
Percent
Oregon US Norm
Base: Day Marketable Trips

Activities and Experiences (Cont’d)
44
4
4
3
3
3
3
3
3
2
2
2
2
2
2
2
4
4
3
1
1
3
2
1
2
2
2
8
3
1
1
0 10 20 30 40
Bar/disco/nightclub
Theater
Art gallery
Birding
Rafting
Boating/sailing
Skiing/snowboarding
Hunting
Biking
Golf
Dance
Theme park
Pro/college sports event
Mountain climbing
Rodeo
Percent
Oregon US Norm
Base: Day Marketable Trips

Activities and Experiences (Cont’d)
45
1
1
1
1
1
1
1
1
1
1
1
1
<1
2
1
3
1
1
1
2
1
1
1
1
1
1
0 10 20 30 40
Spa
Watch Amateur/Youth Sports
Rock/pop concert
Symphony
Trade show
Tennis
Attended/Part in kids sports event
Part. In Amateur/Youth Sports
Participate in adult sports event
Motorcycle Touring
Opera
Convention/Conference
Business Meeting
Percent
Oregon US Norm
Base: Day Marketable Trips

Activities of Special Interest
46
30
20
15
10
9
5
25
22
12
7
6
5
0 10 20 30 40
Historic places
Cultural activities/attractions
Exceptional culinary experiences
Eco-Tourism
Winery tours/Wine tasting
Traveling with grandchildren
Percent
Oregon US Norm
Base: Day Marketable Trips

Social Media Use by Travelers
47
74
41
31
30
24
17
14
12
71
41
25
28
21
18
12
12
0 20 40 60 80
Used any social media for travel
Used Smartphone while traveling
Read travel reviews online
Posted travel photos/video online
Looked at travel photos/video online
Accessed travel deals/news/promotions
Read a travel blog
Connected to others interested in travel
Percent
Oregon US Norm
Base: Day Marketable Trips

Social Media Use by Travelers (Cont’d)
48
74
11
9
8
7
7
7
6
71
10
8
9
8
6
8
5
0 20 40 60 80
Used any social media for travel
Got travel advice via social networking
Contributed travel reviews online
"Followed" a destination/attraction
Tweeted about a trip
Subscribed to a travel e-newsletter
Gave travel advice via social networking
Blogged about a trip
Percent
Oregon US Norm
Base: Day Marketable Trips

Demographic Profile of Visitors to Oregon

Region of Residence
50
90
3
2
1
1
1
1
0
0
79
6
4
3
3
2
1
2
1
0 20 40 60 80 100
Pacific
Mountain
South Atlantic
East North Central
Middle Atlantic
West South Central
West North Central
East South Central
New England
Percent
Day Overnight
Base: Total Marketable Trips

Gender
51
47
53
52
48
0 20 40 60 80 100
Male
Female
Percent
Day Overnight
Base: Total Marketable Trips

Age
52
13
40
31
16
11
42
29
18
0 20 40 60
18-24 years
25-44 years
45-64 years
65+ years
Percent
Day Overnight
Base: Total Marketable Trips
Average Day = 44.8 Average ON = 45

Household Size
53
22
36
16
15
11
18
35
17
15
15
0 10 20 30 40 50
1 member
2 members
3 members
4 members
5+ members
Percent
Day Overnight
Base: Total Marketable Trips
Average Day =
2.8 members
Average ON =
3 members

Household Income
54
Base: Total Marketable Trips
3
9
14
24
50
4
14
16
24
42
0 10 20 30 40 50
$150K+
$100K-$149.9K
$75K-99.9k
$50K-$74.9K
Under $49.9K
Percent
Day Overnight
Average Day =
$54,030
Average ON =
$62,620

Marital Status
55
62
22
16
65
22
13
0 20 40 60 80 100
Married/Withpartner
Never married
Divorced/Widowed/Separated
Percent
Day Overnight
Base: Total Marketable Trips

Children in Household
56
56
19
20
20
54
20
24
21
0 20 40 60 80
No Children Under 18
Any child between 13-17
Any child between 6-12
Any child under 6
Percent
Day Overnight
Base: Total Marketable Trips

Education
57
15
36
32
16
1
17
36
28
17
2
0 10 20 30 40
Post-graduate
College graduate
Some college
High school or less
Other
Percent
Day Overnight
Base: Total Marketable Trips

Employment
58
43
15
42
43
13
44
0 20 40 60
Full-time/Self-employed
Part-time
Not employed/Retired/ Other
Percent
Day Overnight
Base: Total Marketable Trips

Race
59
87
3
10
85
3
12
0 20 40 60 80 100
White
African-American
Other
Percent
Day Overnight
Base: Total Marketable Trips
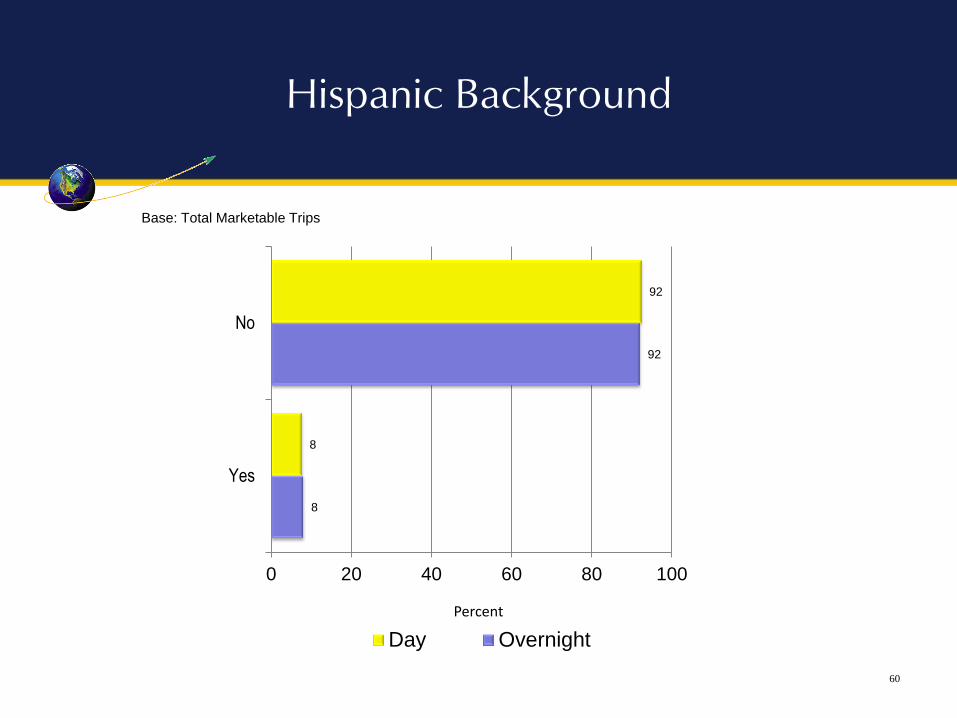
Hispanic Background
60
92
8
92
8
0 20 40 60 80 100
No
Yes
Percent
Day Overnight
Base: Total Marketable Trips

Appendix A: Key Terms Defined

Key Terms Defined
62
An Overnight Trip is any journey for business or pleasure, outside
your community and not part of your normal routine, where you spent
one more nights away from home.
A Day Trip is any journey for business or pleasure, outside your
community and not part of your normal routine, that did not include
an overnight stay. Day trips involve travel of more than 50 miles from
home.
A Person-Trip is one trip taken by one visitor
Person-trips are the key unit of measure for this report.

Trip-Type Segments
63
Leisure Trips: includes all trips where the main purpose was one of the following:
Visiting friends/relatives
Touring through a region to experience its scenic beauty, history and culture
Outdoors trip to enjoy activities such as camping, hunting, fishing, hiking, and boating
Special event, such as a fair, festival, or sports event
City trip
Cruise
Casino
Theme park
Resort (ocean beach, inland or mountain resort)
Skiing/snowboarding
Golf trip
Business Trips: includes
Conference/convention
Other business trip
Business-Leisure: a trip for business where, on the same trip, the visitor stayed for at least one
additional day to experience the same place or nearby area simply for leisure.
Marketable
Trips:
Includes all
leisure trips,
with the
exception of
visits to
friends/relatives
Total Trips = Leisure + Business + Business-Leisure