Embed Size (px)
Citation preview

Greka Company Wells Schedule at GSS in 2011 The Combined Main Gas Header & 5km Pipeline Projects Strategy Planning
0
Wells Schedule at GSS in 2011
Combined MainGas Header & 5km Pipeline Projects
Strategy Planning Report
June, 2011~ 2012
2011/3/8
GREKA Company
Compiler: Yang Lu
Check: Alex Lee Guo xiuquan
Approve: S.W.Leung

Greka Company Wells Schedule at GSS in 2011 The Combined Main Gas Header & 5km Pipeline Projects Strategy Planning
1
Catalog
1. Narrative description
2. GSS Strategy Planning Report- Average Report of Per Month for Gas Production
3. GSS Strategy Planning Report- Diviation of Peak Value Report of Per Month for Gas Production
4. GSS Strategy Planning Report-Impact factors Report of Gas Production
5. Analysis of report
6. Estimation of Probability of schedule
7. Compartion by analysis of schedule
8. Illustration and Diagram-Attachment and Exhibit
9. Risk and Warning
10. Conclusion and Suggestion
11. Questions and remain opinions
Note: You can hold “ctrl+the left button of mouse “to switch to the underline position
relative and you also can hold “ctrl+the left button of mouse “to come back the previous
position.

Greka Company Wells Schedule at GSS in 2011 The Combined Main Gas Header & 5km Pipeline Projects Strategy Planning
2
Content
1. Narrative description
The expect quantity of total gas is 18BFC,the duration from 2011.Jan.1 to 2012.Dec.31.We have already about 28 wells until
Dec.2011 and each well produce 8,500 M3 /day,according to the anticipative estimation , we calculated and got some results. It can
be seen from item 2-GSS Strategy Planning Report- Average Report of Per Month for Gas Production and item 3-GSS Strategy
Planning Report- Diviation of Peak Value Report of Per Month for Gas Production. We can knew the analysis results from the item 4-
GSS Strategy Planning Report-Impact factors Report of Gas Production, item 5- Analysis of report,item 6- Estimation of Probability of
schedule and item 7- Compartion by analysis of schedule.We can predict the risk and warn the relative the major character &
department in charge .We can know the details of schedule frome the attachment- ( 5 KM pipeline project ).The attachment-5 KM
pipeline project report can be devided into 2 parts.
1.1. The 1st part is 5km pipelines project(Max capacity 500,000 M3/day)
1.1.1. Project completion (2011.6.30-2011.12.30)
1.1.2. Mandate design institute (2011.2.11)
1.1.3. Design work & drawings (2011.3.15-2011.4.15)
1.1.4. Installation drawings (2011.4.18-2011.5.18)
1.1.5. Tendering of contracting work (2011.5.19-2011.5.26)
1.1.6. Installation (2011.5.30-2011.7.26)
1.1.7. Regulatory procedure (2011.3.11-2011.7.28)
1.1.8. Project application & Feasibility study report (2011.3.11-2011.4.15)
1.2. The 2nd part is Main gas header project(250,000 m3/day)
1.2.1. Project completion (2011.7.4)

Greka Company Wells Schedule at GSS in 2011 The Combined Main Gas Header & 5km Pipeline Projects Strategy Planning 2011-3-8
3
1.2.2. Mandate design institute (2011.3.14-2011.3.18)
1.2.3. Design work & drawings (2011.3.21-2011.5.10)
1.2.4. Purchase of booster pump (2011.3.14-2011.5.31)
1.2.5. Tendering of contracting work (2011.5.9-2011.5.16)
1.2.6. Installation (2011.5.11-2011.7.1)
1.2.7. Testing & Commissioning (2011.6.20-2011.7.1)
1.2.8. Drilling plan 2011(28 of 93 only) (2011.2.1-2011.12.30)
2. GSS Strategy Planning Report- Average Report of Per Month for Gas Production
Narrative description:When the two sp manager finished their work , I supplement these description for the paragraph.
Diagram: See the attachment 1
3. GSS Strategy Planning Report- Diviation of Peak Value Report of Per Month for Gas Production
Narrative description:When the two sp manager finished their work , I supplement these description for the paragraph.
Diagram: See the attachment 2
4. GSS Strategy Planning Report-Impact factors Report of Gas Production
Narrative description: The impact factors include as follow:
4.1 Labor / Drilling rigs /Funding cost / Funding risk / Project Schedule / Climate of local area / Contractor power / Human impacts /
Chiniese holiday / Bumper harvest festival / and so on
4.2 According the right weight of each impact factors stipulate the percentage,we can see the scale of each impact factors
Diagram: See the attachment 3

Greka Company Wells Schedule at GSS in 2011 The Combined Main Gas Header & 5km Pipeline Projects Strategy Planning 2011-3-8
4
5. Analysis of report
5.1 According to the illustration and diagram and statistic datas ,we can see the variance and difference,we know the quantity of total gas of daily ,
the prior 6 months of 2011 year is 680000 , we know the the quantity of total gas of daily which from July.2011 to Dec.2012 is 17127500 , Our
total expect value of coal gas is 18 BFC . We suppose the production of each well is 8500 M3 /day .
5.2 We can see each well is how to distributed during the period of each month by the illustration and diagram 1). We can see the impact factors
is how to impact the project schedule and the production of coal gas of each well by the illustration and diagram 2) & 3).We can see the The variance
of production of gas between 2011 and 2012 by the following diagram.
The variance of production of gas between 2011 and 2012
New production well Jan Feb Mar Apr May Jun Jul Aug Sep Oct Nov Dec Total
Existing Pdn rate
(M3/day)
New inseam laterals 24 22 20 20 20 20 20 18 15 11 3 2 195
Cum.laterals of the
year 24 46 66 86 106 126 146 164 179 190 193 195 195
Total cum.laterals 104 126 146 166 186 206 226 244 259 270 273 275 275
Sales and production
(M3)
Daily Prod M3 314,50
0
425,00
0
603,50
0
790,50
0
994,50
0
1,181,50
0
1,351,50
0
1,521,50
0
1,691,50
0
1,861,50
0
2,031,50
0
2,184,50
0
14,951,50
0

Greka Company Wells Schedule at GSS in 2011 The Combined Main Gas Header & 5km Pipeline Projects Strategy Planning 2011-3-8
5
5.3 We know the actual production of per month of wells by the illustration and diagram 1) and we know if we want to increase the production of
area,we have to wait about four months.It means each well the productive duration on average is four months,we don’t know whether we have
enough labor,drilling rigs,funds and sufficient ,allowable and approved outer construction situation.We can see the effective impact by the
resources curves ,although it is only a mathematic models , I think it is still have reference significance when we distribute the resources.
6. Estimation of Probability of schedule (E.G. Only limit those activitys which have logic relationship)
6.1 Reference formula
The probability chart =p

Greka Company Wells Schedule at GSS in 2011 The Combined Main Gas Header & 5km Pipeline Projects Strategy Planning 2011-3-8
6
б n2=Dispersion (n=1,2,3…)
б = Standard Variance
λ = Probable Value
Tr = Requirment Duration
Ti = The sum of duration for all critical paths
6.2 The critical path
6.2.1 The principle: the path which has the longest time is defined as the critical path.
6.2.2 The format is Activity name ( Activity duration ; a-the shortest time ; c-the probable time ; b-the longest time)
6.2.3 The critical path is
Design Work & Drawings (20-24-30) Civil Work Drawings(20-23-30) Civil Contractor(5-6-10) Civil
Work(30-35-40) Testing & Commissioning(4-5-10) Connection to Main Gas Header & PertroChina's Facility
(1-2-3) Project Completion (Finish milestone)
6.2.4 The activity code:
6.3 The result of the probability for this program
б=3.184 Tr = 127 (days) Ti =95(days)
λ=10.05 so P= 99.87%
6.4 The deviation depend on the the longest time and the shortest time of each activity,if the two kinds of time is not exact,the
finally result of probability is also inaccurate. The deviation depend on the precise of process of calculation at the same time.
6.5 The Gantt bars see the item 7 in the next page

Greka Company Wells Schedule at GSS in 2011 The Combined Main Gas Header & 5km Pipeline Projects Strategy Planning 2011-3-8
7
7. Compartion by analysis of schedule (This difference and variance report can be shown in next weekly report,it can be seen from
the baseline and this weekly schedule .The variance of weekly report is zero )

Greka Company Wells Schedule at GSS in 2011 The Combined Main Gas Header & 5km Pipeline Projects Strategy Planning 2011-3-8
8

Greka Company Wells Schedule at GSS in 2011 The Combined Main Gas Header & 5km Pipeline Projects Strategy Planning 2011-3-8
9
Illustration and Diagram--Attachment and Exhibit
1) GSS Strategy Planning Diagram Report-Average Report of Per Month
2011 production target plan
New production
well Jan Feb Mar Apr May Jun Jul Aug Sep Oct Nov Dec Total
Existing Pdn
rate (M3/day)
New inseam
laterals 2 4 4 4 4 4 6 9 13 21 22 93
Cum.laterals of
the year 2 6 10 14 18 22 28 37 50 71 93 93
Total
cum.laterals 13 15 19 23 27 31 35 41 50 63 84 106 106
Sales and
production
(M3)
Daily Prod M3 110,500 110,500 110,500 110,500 110,500 127,500 161,500 195,500 229,500 263,500 297,500 348,500 2,176,000
Greka Company Wells Schedule at GSS in 2011 The Combined Main Gas Header & 5km Pipeline Projects Strategy Planning 2011-3-8
10

Greka Company Wells Schedule at GSS in 2011 The Combined Main Gas Header & 5km Pipeline Projects Strategy Planning 2011-3-8
11
2012 production target plan
New production
well Jan Feb Mar Apr May Jun Jul Aug Sep Oct Nov Dec Total
Existing Pdn
rate (M3/day)
New inseam
laterals 24 24 24 24 24 24 24 24 24 24 24 24 288
Cum.laterals of
the year 24 48 72 96 120 144 168 192 216 240 264 288 288
Total
cum.laterals 117 141 165 189 213 237 261 285 309 333 357 381 381
Sales and
production
(M3)
Daily Prod M3 425,000 535,500 714,000 901,000 1,105,0
00
1,309,0
00
1,513,0
00
1,717,0
00
1,921,0
00
2,125,0
00
2,329,0
00
2,533,0
00 17,127,500

Greka Company Wells Schedule at GSS in 2011 The Combined Main Gas Header & 5km Pipeline Projects Strategy Planning 2011-3-8
12

Greka Company Wells Schedule at GSS in 2011 The Combined Main Gas Header & 5km Pipeline Projects Strategy Planning 2011-3-8
13
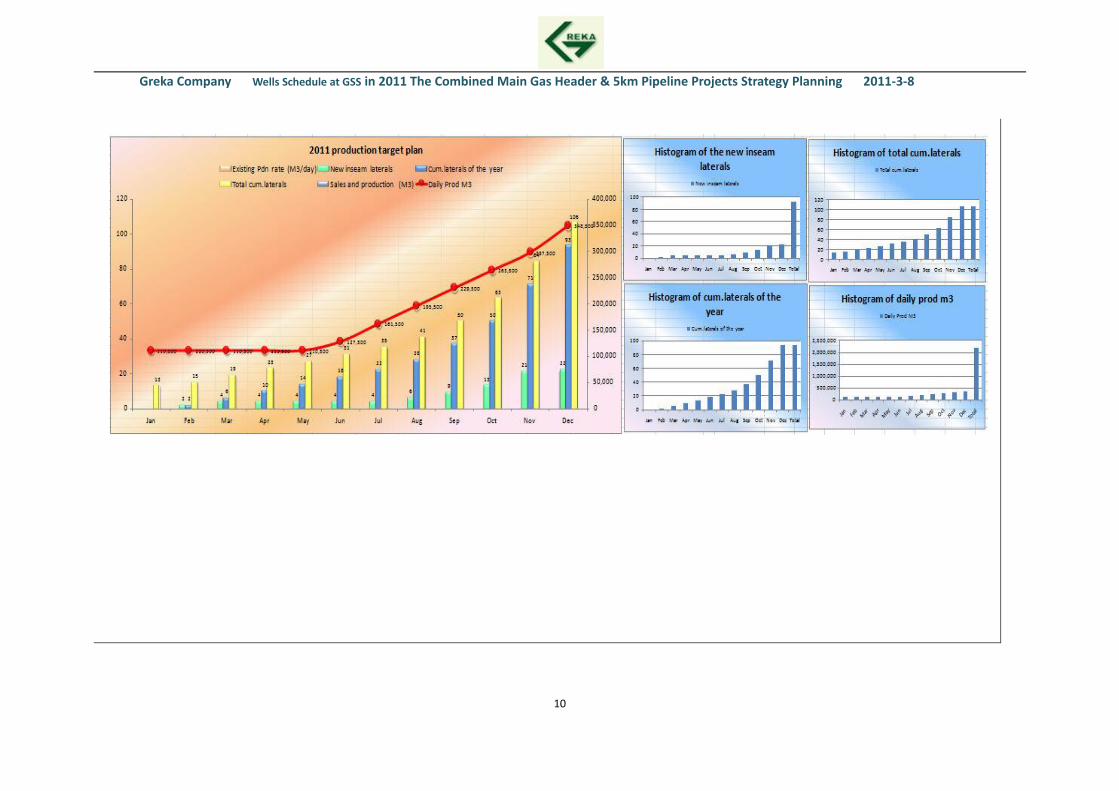
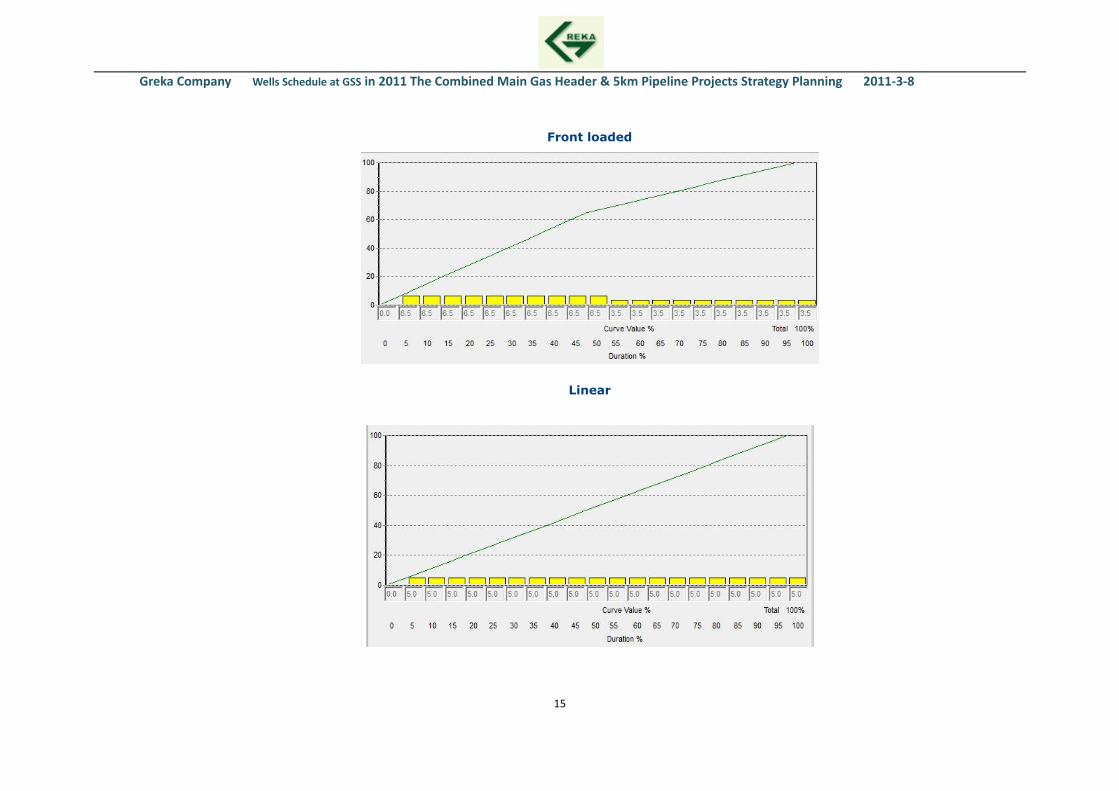
2) GSS Strategy Planning Diagram Report-Diviation of Peak Value Report of Per Month
Note:There are 12 kinds of resouces curves according to the mathematic model .We can increase or decrease and distribuite the
resouces(include labor,drilling rigs,other equipments,funds,drawings ,other resouces and so on according to the actual situation
of site.
Back loaded
Bell shaped

Greka Company Wells Schedule at GSS in 2011 The Combined Main Gas Header & 5km Pipeline Projects Strategy Planning 2011-3-8
14
Double peak
Early peak
Greka Company Wells Schedule at GSS in 2011 The Combined Main Gas Header & 5km Pipeline Projects Strategy Planning 2011-3-8
15
Front loaded
Linear

Greka Company Wells Schedule at GSS in 2011 The Combined Main Gas Header & 5km Pipeline Projects Strategy Planning 2011-3-8
16
Offset triangular
Three step

Greka Company Wells Schedule at GSS in 2011 The Combined Main Gas Header & 5km Pipeline Projects Strategy Planning 2011-3-8
17
Tranigular decrease
Trapezoidal

Greka Company Wells Schedule at GSS in 2011 The Combined Main Gas Header & 5km Pipeline Projects Strategy Planning 2011-3-8
18
Triangular
Triangular increase

Greka Company Wells Schedule at GSS in 2011 The Combined Main Gas Header & 5km Pipeline Projects Strategy Planning 2011-3-8
19
3) GSS Strategy Planning Diagram Report-Impact factors Report of Gas Production
Item 1 2 3 4 5 6 7 8 9 10 11
Display Labor
Drilling
rigs(drawi
ngs and
accessorie
s)
Funding
risk(fundin
g
diversion)
Funding
cost(marke
t vary)
Project
Schedule
Climate of
local area
Contractor
power
Human
impacts
Chiniese
holiday
Bumper
harvest
festival
Other
factors
Percentage 10% 10% 10% 10% 20% 5% 5% 20% 5% 5% Waiting adjust
after continue
Manpower
Drilling rigs
Funding risk Funding cost
Project ScheduleClimate of local area
Contractor powerHuman impacts
Chiniese holidayBumper harvest festival
0%
5%
10%
15%
20%
Percentage
10%
10%10%
10%
20%
5%5%
20%
5%5%
Pe
rce
nta
ge
The 3 D graphic of the percentage of each activities
Manpower Drilling rigs Funding risk Funding cost Project Schedule
Climate of local area Contractor power Human impacts Chiniese holiday Bumper harvest festival

Greka Company Wells Schedule at GSS in 2011 The Combined Main Gas Header & 5km Pipeline Projects Strategy Planning 2011-3-8
20
9. Risk and Warning
From the above item 1-8,we know the major risk arising following items.
The Project Schedule ,Human impacts ,Funding risk (funding diversion ) and Funding cost(market vary) ,the four impact factors
account for 60% of the right weight. The Labor and Drilling rigs account for 20% of the right weight.The others factors account
for remaining 20% of the right weight. So we know the sequence of the risk for each factors,we can used a diagram to show it.
10. Conclusion and Suggestion
We will focus our energy on supervising the process of schedule of the program, especially concern the arrival time of each
drilling rigs (involved the drawings,certifications and others accessories) and the situation of funding expensed. We will remind
our management team of pay close attention to the variance that between the actual situation and the plan situation and
further forcast the next step and solve ways.
0%
20%
40%
60%
80%
100%
Percentage
The scale of the priority Bumper harvest festival
Chiniese holiday
Human impacts
Contractor power
Climate of local area
Project Schedule
Funding cost
Funding risk
Drilling rigs
Manpower

Greka Company Wells Schedule at GSS in 2011 The Combined Main Gas Header & 5km Pipeline Projects Strategy Planning 2011-3-8
21
11. Questions and remain opinions
Waiting for add opinions in future during the project executing.
Qusetion one
There are two kinds of results according to the different calculation formulas,these illustrations and diagrams are calculated by
the 1st kind of mathematic formula,if we calculate according to the 2nd kind of mathematic formula maybe get another result.
According to the 2nd kind of mathematic formula The quantity of average gas wells per month in the 2012 is 18×109×
0.0283/12/30/8500/12=14
But according to the 2nd kind of mathematic formula the quantity of average gas wells per month in the 2012 is 24 gas wells per
month,they are different at all.I don’t know why and where’s wrong.