Embed Size (px)
Citation preview

- Sensitivity of biogeochemical models to the
treatment of particle dynamics �
Marion Gehlen
LSCE (CEA/CNRS/UVSQ), Gif sur Yvette, France
3rd GEOTRACES DATA-MODEL SYNERGY WORKSHOP
Barcelona, November 14-17, 2011

Approach n° 1
identical circulation, sensitivity to process parameterization
short simulations => dissolved tracers not adjusted
observations:
global integrated numbersderived quantitiesparticle flux
Q1 : How should models of ocean biogeochemistry
represent particles?

Sensitivity to model parameterizations
PISCES =>
model of intermediate
complexity
24 tracers
standard version
2 particle size classes;
prescribed sinking speed
Exp.1: resolving size
prognostic sinking speed
Exp.2: role of zooplankton

PISCES STD version
Settling flux: big POCsmall POCbiogenic SiCaCO3
2 size classes: « small », « big »
Aggregation due to turbulence and differential settling
� sinking speed is prescribed
DOM
POCs
POCb
particlebreak-upby zoo-planktonfeeding
Flux-feeding
conc. big POC
FF in
tensity

PISCES STD version: validation
Chlorophyll in mgChl/m3
May November
SeaW
ifsPIS
CES
Gehlen et al. (2006)

PISCES STD version: validation
Chlorophyll in mgChl/m3
May November
SeaW
ifsPIS
CES
Gehlen et al. (2006)
� PP: independent estimate: 40-60 Gt C per year
after Carr et al. (2006)
� this model version: 26 Gt C per year

PISCES STD version: validation
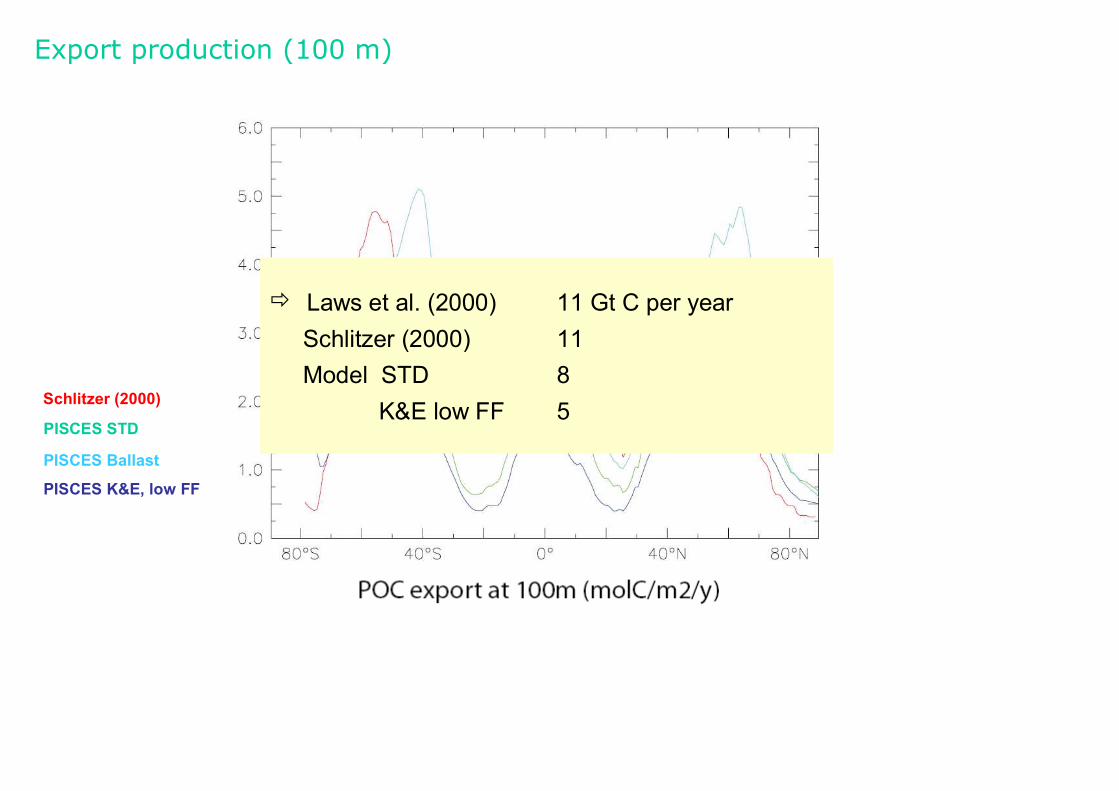
Export production (100 m)

PISCES STD version: validation
Export production (100 m)

0
0.2
0.4
0.6
0.8
pe-ra
tio m
od
el
0 0.2 0.4 0.6 0.8
PISCES STD
r2 = 0.0863
pe-ratio data
PISCES STD version: validation
Dunne et al. 2005
PE-ratio (depth of euphotic zone)
Gehlen et al. (2006)

PISCES STD version: validation
modeled POC flux (mmol C/m2/yr)
observ
ed P
OC flu
x (m
mol C
/m2/y
r)
http://www.pangea.de
Deep fluxes (>1000 m)
Gehlen et al. (2006)
PISCES STD version: validation
modelJahnke (1996)
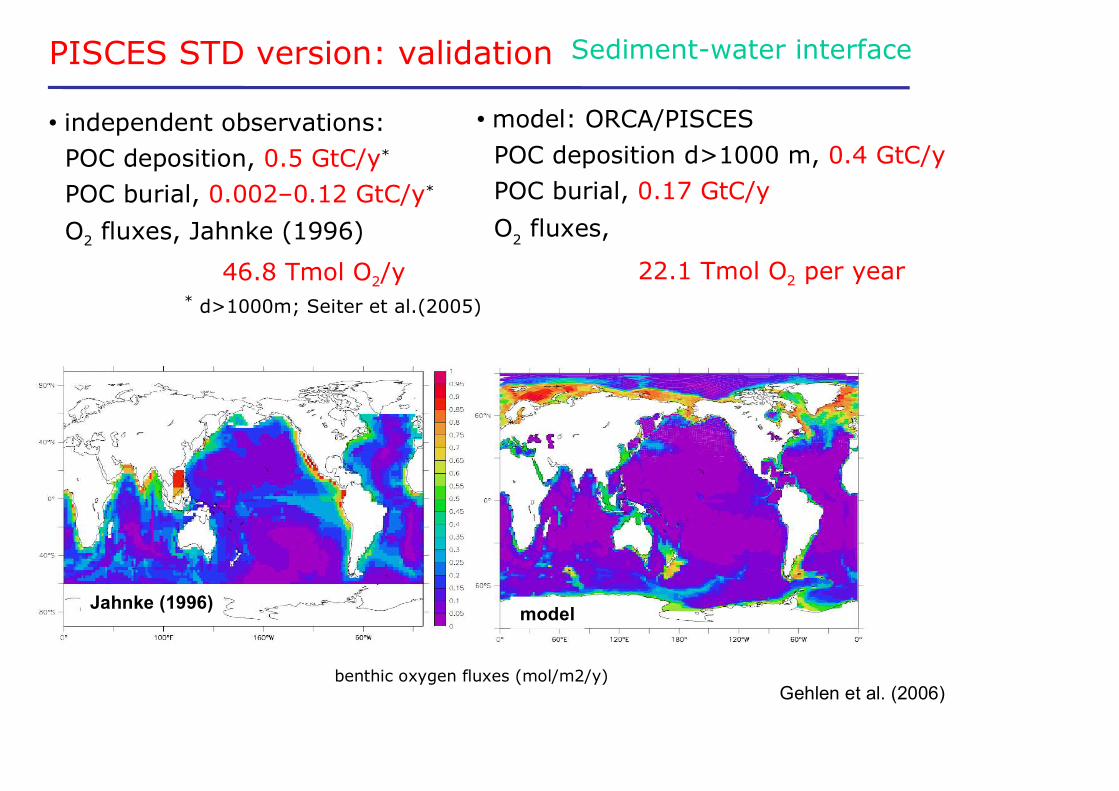
Sediment-water interface
� independent observations:
POC deposition, 0.5 GtC/y*
POC burial, 0.002�0.12 GtC/y*
O2 fluxes, Jahnke (1996)
46.8 Tmol O2/y
* d>1000m; Seiter et al.(2005)
� model: ORCA/PISCES
POC deposition d>1000 m, 0.4 GtC/y
POC burial, 0.17 GtC/y
O2 fluxes,
22.1 Tmol O2 per year
Gehlen et al. (2006)benthic oxygen fluxes (mol/m2/y)

PISCES STD version: validation
modelJahnke (1996)
Sediment-water interface
� independent observations:
POC deposition, 0.5 GtC/y*
POC burial, 0.002�0.12 GtC/y*
O2 fluxes, Jahnke (1996)
46.8 Tmol O2/y
* d>1000m; Seiter et al.(2005)
� model: ORCA/PISCES
POC deposition d>1000 m, 0.5 GtC/y
POC burial, 0.19 GtC/y
O2 fluxes,
26.1 Tmol O2 per year
Gehlen et al. (2006)benthic oxygen fluxes (mol/m2/y)
� Model underestimates diffusive oxygen fluxes:
low deep POC fluxes or low re-mineralization intensity?

Preliminary conclusions: PISCES STD vs data
� It appears difficult to reconcile surface ocean observations
� particles fluxes and oxygen profiles
� Probing model « performance » with different data sets
yields contrasting results => data sets integrate varying
spatio-temporal information
� Constrains on model results decrease with increasing
depth: data from mid- to deep water column are needed,
but not without connexion to surface ocean processes
Testing alternative parameterisations �

EXP1 : Testing the importance of size
�
PHypothesis : 1. Distribution of particles sizes P(θ) = A θ −ε
2. Mass of a particle m(θ) = C θ ξ
3. Sinking speed w(θ) = B θ η
B,C, η and ξ are constant
Aggregation and disaggregation due to turbulent shear and differential settling
Model traces evolution of particle mass and number distributions
=> sinking speed of particles is predictedKriest and Evans (1999, 2000)

Testing the importance of size
�
PHypothesis : 1. Distribution of particles sizes P(θ) = A θ −ε
2. Mass of a particle m(θ) = C θ ξ
3. Sinking speed w(θ) = B θ η
B,C, η and ξ are constant
Aggregation and disaggregation due to turbulent shear and differential settling
Model traces evolution of particle mass and number distributions
=> sinking speed of particles is predictedKriest and Evans (1999, 2000)
sinking exponent (� ) dimensionless 1.17
sinking factor (B) m-0.17/d 942
particle mass-diameter exponent (�)
dimensionless 2.28
stickiness dimensionless 0.5
size of single cell cm 0.0002
upper limit of size cm 1.0
shear (ML, below ML) 1/s 1.0, 0.01

Export production (100 m)
Schlitzer (2000)
PISCES STD
PISCES Ballast
PISCES K&E, low FF
Export production (100 m)
Schlitzer (2000)
PISCES STD
PISCES Ballast
PISCES K&E, low FF
� Laws et al. (2000) 11 Gt C per year
Schlitzer (2000) 11
Model STD 8
K&E low FF 5

Dunne et al. 2005 PE-ratio

modeled POC flux (mmol C/m2/yr)
observ
ed P
OC flu
x (m
mol C
/m2/y
r)
benthic oxygen fluxes (mol/m2/y)
PISCES/K&E
� independent observations:
POC deposition, 0.5 GtC/y *
POC burial, 0.002�0.12 GtC/y *
FO2, Jahnke (1996) 46.8 Tmol O2/y * d>1000m; Seiter et al.(2005)
� model: PISCES/K&E
POC deposition d>1000m, 0.5 GtC/y
POC burial, 0.19 GtC/y
FO2, 26.1 Tmol O2 per year

Preliminary conclusions: resolving size
� Difficulties in reconciling surface ocean observations � particles
fluxes and oxygen profiles: rapid decrease below surface, close to
constant fluxes at depth � What is missing?
� Probing model « performance » with different data sets yields
contrasting results :
PE-ratios:
� resolution of particle size spectrum is needed
Deep POC fluxes (trap data):
� model capability to reproduce yearly mean POC fluxes
below 2000m and benthic oxygen demand does at first
order not dependent on the resolution of the particle size
spectrum

Exploring the role of mesopelagic biological processes
Flux feeding =MesozooplanktonFeeding type
controls deep fluxes �
low = as in STD version
EXP2 : the role of zooplankton
low
high
Flu
x fe
edin
g in
tensity
POC Flux

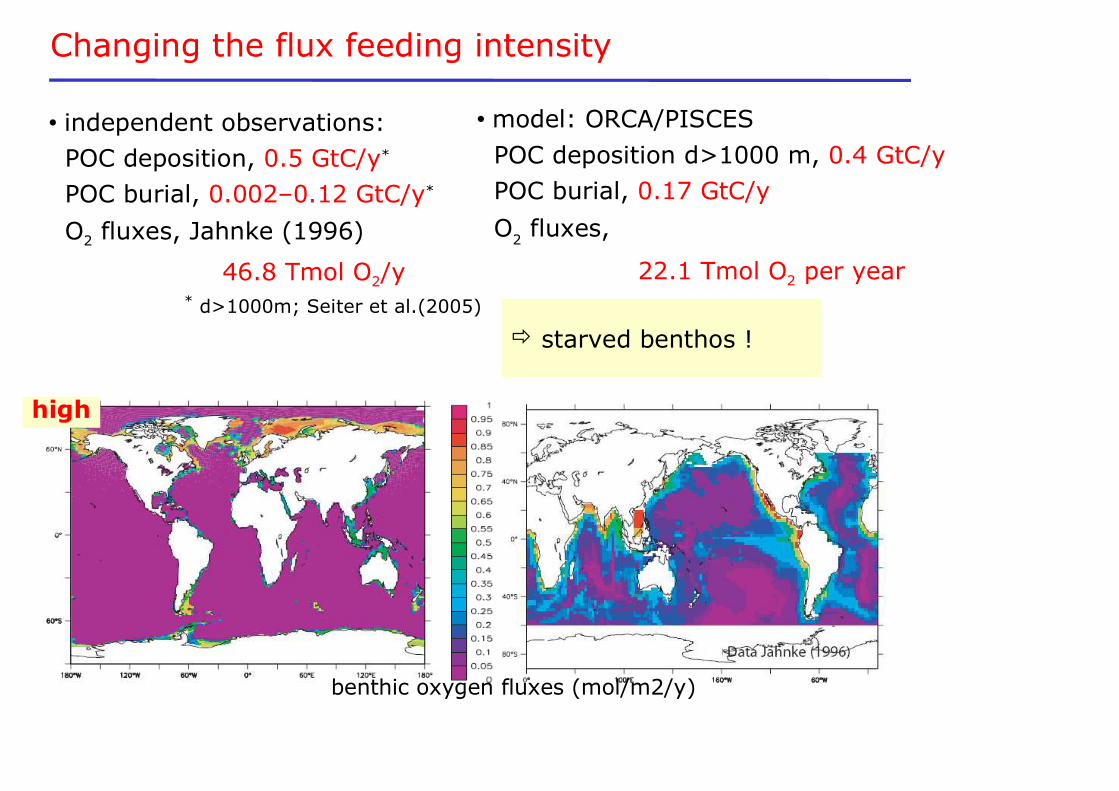
Changing the flux feeding intensity
high
low
Chlorophyll in mgChl/m3

Changing the flux feeding intensity
high
low
Chlorophyll in mgChl/m3
Schlitzer
Pisces low
Pisces high
� PP: independent estimate: 40-60 Gt C per year
after Carr et al. (2006)
� STD low FF 26 Gt C per year
STD high FF 43
� EP: Schlitzer (2000) 11 Gt C per year
STD low FF 8
STD high FF 11

Changing the flux feeding intensity
large impact of fluxes
low
observ
ed P
OC flu
x (m
mol C
/m2/y
r)
high
modeled POC flux (mmol C/m2/yr)
Low flux feeding intensity
High flux feeding intensity
Changing the flux feeding intensity
benthic oxygen fluxes (mol/m2/y)
low
high
� independent observations:
POC deposition, 0.5 GtC/y*
POC burial, 0.002�0.12 GtC/y*
O2 fluxes, Jahnke (1996)
46.8 Tmol O2/y
* d>1000m; Seiter et al.(2005)
� model: ORCA/PISCES
POC deposition d>1000 m, 0.4 GtC/y
POC burial, 0.17 GtC/y
O2 fluxes,
22.1 Tmol O2 per year
� starved benthos !

Zooplankton
PISCES
2 size classes :
micro- and
mesozooplankton
limitations
+ no life stages, biomass varies
instantaneously with preys
+ no vertical migrations
+ mortality of mesozoo is a closure term

NMFS global mesozooplankton distribution
(�molCm-3), 0-200 m
CPR mesozooplankton distribution
(�molCm-3), 0-10 m
Zonal averaged mesozooplankton distribution ( molCm� -3)
modeled and observed

28
Time of development in days (Log scale) of mid-trophic
(micronekton) organisms until age at maturity (tm) in
relation to their ambiant habitat temperature Tc
The model has:
Zooplankton: 1 functional group
Micronekton 6 functional groups in 3 vertical
layers; 3 groups with daily vertical migrations
Forcing: Temperature, currents and Primary
Production.
Relationship between temperature and development time
of post-embryonic (hatching to adult) zooplankton species
(rotifers, copepods and cladocerans) incubated at different
constant temperatures. From Gillooly et al. (2002)
2010, 84: 69�84
P. Lehodey (CLS)
Zooplankton in SEAPODYM

1. Link between surface ocean productivity and POC export at the
base of the euphotic zone : particle size spectrum has to be
resolved (PISCES-K&E) yielding a prognostic sinking speed
2. Fate of POC fluxes in the twilight zone : evolution of fluxes most
sensitive to the intensity of zooplankton flux feeding (composition of
zooplankton community)
3. Capability of model to reproduce yearly averaged POC fluxes
below 1000 m and benthic oxygen demand : independent of the
resolution of the particle size spectrum
Q1 : How should models of ocean biogeochemistry
represent particles?

Approach n° 2
extending standard biogeochemical model to TEIlong simulations => dissolved tracers in equilibrium
observations:
dissolved distributionsparticle fields
Q2 : What measurements of particles should
GEOTRACES make?
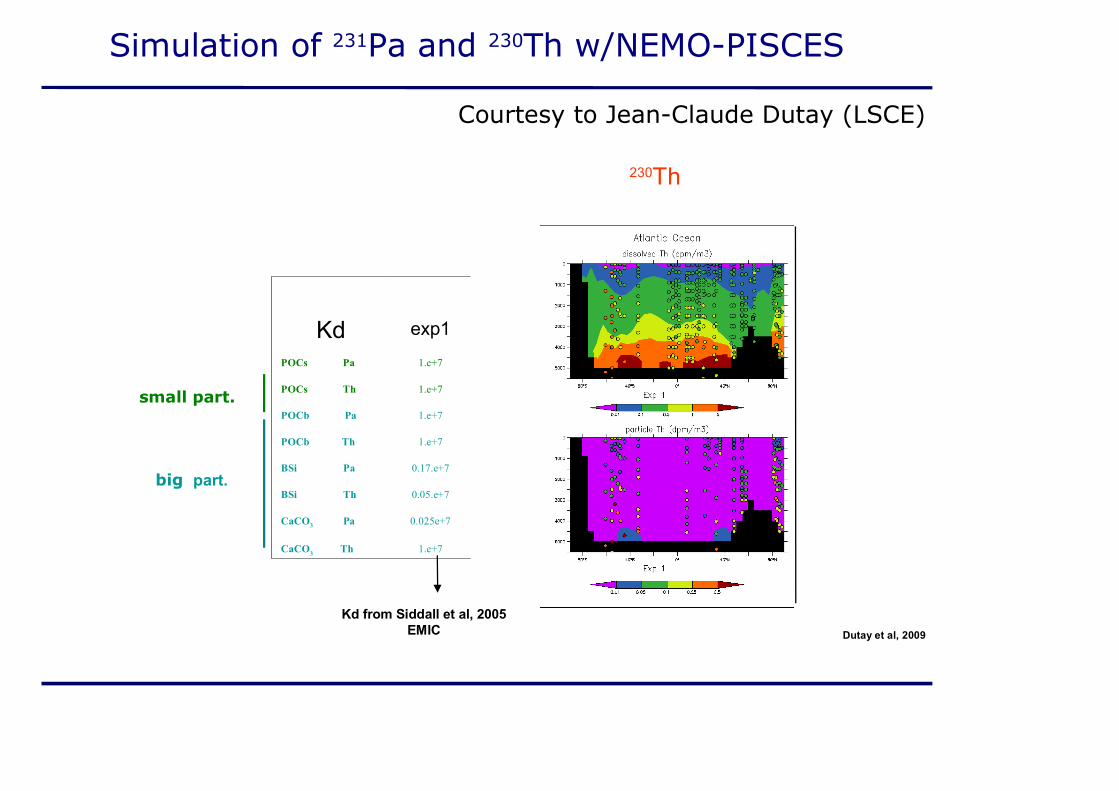
Kd exp1
POCs Pa 1.e+7
POCs Th 1.e+7
POCb Pa 1.e+7
POCb Th 1.e+7
BSi Pa 0.17.e+7
BSi Th 0.05.e+7
CaCO3 Pa 0.025e+7
CaCO3 Th 1.e+7
Simulation of 231Pa and 230Th w/NEMO-PISCES
230Th
Kd from Siddall et al, 2005
EMIC
small part.
big part.
Dutay et al, 2009
Courtesy to Jean-Claude Dutay (LSCE)

Kp=Ap/(Ad.Cp)
Observations: Ap/Ad~1/10
PISCES Model : Cp ~ 10-8 gr/gr(sea water)
� Kp ~ 109
. zoc
. surf = Ap (bottom) . Ws surf
Constraint from Observations: Ap (Th) (0.1) dpm/m3 � ws ~ 1000 m/an
Global Source = Global Sink
[ � � � (Ad+Ap )dv ] = �(w s A p) fond ds
Small particles are controlling the vertical profile
Constraints from global budget
Constraint on Kd from Observations

Kd Exp.1 Exp. 2
POCs Pa 1.e+7 1.e+9
KPOCs Th 1.e+7 1.e+9
KPOCb Pa 1.e+7 1.e+6
POCb Th 1.e+7 1.e+6
BSi Pa 0.17.e+7 0.17.e+7
BSi Th 0.05.e+7 0.05.e+7
CaCO3 Pa 0.025e+7 0.025e+7
CaCO3 Th 1.e+7 1.e+7
Kd as a function of particle size classes
Exp1 Exp2
Thorium 230
Siddall et al, 2005
EMIC
Petites part.
grosses part.
notre
étude
Dutay et al, 2009
improved model fit, but Kd values are too large compared to obs.
Simulation of 231Pa and 230Th w/NEMO-PISCES

ORCA - PISCES
Estimation derived from satellite data, loisel et al, 2007
Data along the W.Atlantic GEOSECS section
(brewer et al., 1976), units µg/kg.
ORCA - PISCES
Total particles concentration
Simulation of 231Pa and 230Th w/NEMO-PISCES
Assessment of model particle fields
Q2 : What measurements of particles should
GEOTRACES make?
Every measurement is valuable!
1. particle concentration from surface to deep
2. particle characterization (e.g. size, composition,
specific surface)
3. particle flux and sinking speed
4. lab experiments needed in order to constrain reaction rates !
if possible integrated data sets ...
be aware of match/mismatch between scales when comparing
model output to data