Embed Size (px)
Citation preview

Ri p ,rt N i. Ii 1 '-SI \'
St. Vincent and the Grenadines:Issues and Options in the Energy Sector
Sep-mbelllr I'344
Report of the joint UNDP/World Bank Energy Sector Assessment ProgramThis document has a restricted distribution. Its contents may not be disclosedwithout authorization trom the Government, the UNDP or the World Bank.
- 7 * - . . .
Pub
lic D
iscl
osur
e A
utho
rized
Pub
lic D
iscl
osur
e A
utho
rized
Pub
lic D
iscl
osur
e A
utho
rized
Pub
lic D
iscl
osur
e A
utho
rized

JOINT UNDP/WORLD BANK ENERGY SECTOR ASSESSMENT PROGRAMREPORTS ALREADY ISSUED
Countrv Date Number
Indonesia November 1981 3543-INDMauritius December 1981 3510-MASKenya Nay 1982 3800-KESri Lanka May 1982 3792-CEZimbabwe June 1982 3765-ZIMHaiti June 1982 3672-HAPapua New Guinea June 1982 3882-PNCBurundi June 1932 3778-BURwanda June 1982 3779-RWMalawi August 1982 3903-4ALBangladesh October 1982 3873-BDZambia January 1983 4110-ZATurkey February 1983 3877-TUBolivia April 1983 4213-BOFiji June 1983 4462-FIJSolomon Islands June 1983 4404-SOLSenegal July 1983 4182-SESud n July 1983 4511-SUUganda July 1983 4453-UGNigeria August 1983 4440-UN!Nepal August 1983 4474-NEPCambia November 1983 4743-GMPeru January 1984 4677-PECosta Rica January 1984 4655-CRLesotho January 1984 4676-'SOSeyche'les January 1984 &693-SEYNiger March 1984 4642-NIRPortugal April 1984 4824-POMorocco March 1984 4157-MOREthiopia July 1984 4741-ETBotswana August 1984 4998-BTCape Verde August 198A 5073-CVGuinea-3issa, August 1984 5083-CUBSt. Vincent ancThe Grenadines September 1984 5103-STV

FOR OFFICIAL USE ONLY
Report No. 5103-STV
ST. VINCENT AND THE GRgNADINES
ISSUES AND OPTIONS IN THE ENERGY SECTOR
SEPTEMBER 1984
This is one of a series of reports of the Joint UNDP/World Bank EnergySector Assessment Program. Finance for this work has been provided, inpart, by the UNDP Energy Account, and the work has been carried out bythe World Bank. This report has a restricted distribution. Its contentsmay not be disclosed without authorization from the Government, the UNDPor the World Bank.

Aucr
St. Vincent is a small, open island economy with a limited mar-ket size and a large volume of external trade. Its future growth pros-pects depend on productive investments in agriculture, light industriesand tourism, from which the economy is expected to show real growth ofabout 5Z a year. Outstanding petroleum issues concern the country'scomplete dependence on imports, and high freight costs. .!ajor powersector issues include high losses, the deveLopment of indigenous hydro-power resources, power tariffs, and institutional arrangements. Theseissues are discussed at both a country and regional level with theresulting priority recommendations: (a) a study to determine a regionalstrategy to lower petroleum supply and transportation costs; (b) developa petroleum pricing policy; (c) establish a forestry program to meetfuelwood shortages; and (d) implement a fuel substitution program incopra drying and tobacco curing operations. The Government already hasagreed to implement the recommendations of the power loss reductionstudy.

ABBREVIATIONS AND ACRONYKS
Ag American gallonbbl barreLCAESP Caribbean Alternative Energy Systems ProjectCCS Caribbean Community (CARICOM) SecretariatCDB Caribbean Development BankCDC Commonwealth DeveLopment CorporationCIDA Canadian International Development Agencyc.i.f. cost, insurance and freightECOs Energy Conservation Opportunitiesf.o.b. free on boardGATE German Appropriate Technology ExchangeGDP Gross Domescic ProductGWh gigawatt hourha hectaresH-T high tensionIBRD International Bank for Reconstruction and
DevelopmentIg Imperial gallonkcal kilocaloriekg kilogramkgoe kilograms of oil eqivalentkW kilowattkWh kilowatt hourLPG Liquefied Petroleum GasL-T low tensionM3 cubic meterMCw Ministry of Communications and WorksXTIA Ministry of Trade, Industry and Agriculturempg miles per gallonMW megawattMVA megavoLt ampereOAS Organization of Amercian StatesOECS Organization of the Eastern Caribbean Statesp.a. per annumREAP Regional Energy Action Plan (Caribbean)SPC safe plant capacityT&D Transmission and DistributionT&T .rinidad and Tobagotoe tonne of oil equivalentTORs Terms of ReferenceUSAID United States Agency for International
DevelopmentVINLEC St. Vincent Electricity Services

CURRENCY EQUIVALES
Currency units = Eastern Caribbean dollar (EC$)EC$l.00 = 100 cents = US$0.37US$1.00 = EC$2.70
ENERGY CONVERSION FACTORS
Fuel toe per Physical Unit a/
Petroleum Products (tonnes) b/LPG 1.08Gasoline 1.05Kerosene/Jet Fuel 1.03Diesel Oil (LDO) 1.02
Electricity 3,142 BtuIkWh c/
Biomass Fuels (tonnes)
Charcoal 0.69
Firewood 0.33-0.35Groundnut Husk/Shell 0.37
a/ L toe = 10 million kcal= 6.61 boe= 39.68 million Btu
b/ LPG = 1,730 liters/tonneGasoline = 1,357 liters/tonneKerosene/Jet Fuel = 1,229 liters/tonneDiesel (LDO) = 1,187 liters/tonne
c/ Converted at end use thermal efficiency of 3,412 Btu/kWh.
This report is bssed on the findings of an energy sector assessmentmission comprising Messrs. Zia Mian (Mission Chief), Trevor Byer (PowerSector - CDB), Ernesto Terrado (Biomass and Renewables), Sveinn Einarsson(Geothermal Specialist-UNDTCD), Robbert van Duin (Conservation Consul-tant) and Michael Morrison (Researcher), which visited St. Vincentbetween October 31 and November 14, 1983. Secretarial assistance wasprovided by Mr. Jagdish Lal. The report was discussed with theGovernment in August 1984.
TABLE OF CONTENTSPage
SUMKARY OF FINDINGS AND RECOMMENDATIONS . . iOverview . . iPetroleum Subsector Issues ............................ , iPower Sector Issues .. iiOther Issues ....................... v
I. ENERGY AND THE ECONOMY ........................... : .1Country Situation . . . 1Energy BaLance ... 3Energy Demand Projections .. . ............... 3Investment Implications . . . 3
II. PETROLEUM ................................................. 6HistoricaL Demand ....................................... 6Petroleum Supplies and Distribution ..................... 7Petroleum Prices ........................................ 9Demand Projections ...................................... 12Outlook for Petroleum Exploration ....................... 13
III. ELECTRICITY ............................................... 14Supply/Demand ............. . . ..... , .. ...... 14Electricity Tariffs . . . 16Hydropower .............................................. 18Geothermal .............................................. 20Issues in Power Sector . . . 21Electricity Demand Forecast and System
Expansion Program . . . 25Power Sector Investment Program . . . 30Power Tariff and VINLEC's Financial Performance ......... 30Institutional Issues . ...................... , 32
IV. BIOMASS, OTHER RENEWABLES AND CONSERVATIONS ISSUES ........ 34Biomass Consumption .. 34Biomass Supplies .. ............. 35Fuelwood Issues ......................................... 36Interfuel Substitution .... 38Coconut Residues .. 39Sugar Industry Residues .. 39Biogas ....... 0....,,.............. 40Solar and Wind Energy .. 42Energy Conservation ..................................... 42Institutional Issues .. 44

Page
ANNEXES
1. Regional Issues .................... ....... ..... ..... 45A. Petroleum Supply Arrangements ......................... 45B. Common Services for OECS Utilities .................... 49C. Petroleum Pricing Specialist .......................... 52
2. Table 1: St. Vincent Electricity Statistics, 1977-82 ....... 53Table 2: St. Vincent and the Grenadines:
Power Generating Capacity (kNW) ................. . 54Table 3: St. Vincent - Power Capacity Balance,
1983-90 (kW) ... ................................. 55
MAPS
IBRD 17593 St. Vincent and the Crenadines Energy ResourcesIBRD 17800 Eastern Caribbean Refineries and Transportation Routes

SUMMARY OF FINDINGS AND RECOMMENDATIONS
Overview
1. St. Vincent suffers from the problems faced by many small openeconomies: a limited domestic markeE and heavy reLiance on external trade(1.2). Tourism and banana production dominate economic activities. Asin che other LDC's of the Eastern Caribbean, there are major energyissues which also arise from the small size and openness of the economyas well as from the dependence of St. Vincent on developments in theregion as a whole. 1/
2. Economic growth averaged about 7% p.a. between 1975 and 1978.The country then experienced two successive years of secbacks due to avolcanic eruption (1979) and a hurricane (1980). Economic growch fluc-tuared widely; in 1981 it was 12%, led by increases in agricultural andindustrial production, but in 1982 it was 2.32. Future growth prospectsdepend on productive investments in agriculture, light industries andtourism. 2/ In agreement with the Government, the mission has adopted aGDP growth rate of 5% p.a. through 1990 as a basis for energy demandprojections. 3/
Petroleum Subsector Issues
supplies
3. St. Vincent is totally dependent on imported petroleum productsfrom Trinidad and Tobago, the Netherlands, Antilles and Venezuela. Asmall market of 370 barrels/day (BD) is shared between Shell and Texaco.The current freight cost of liquid petroleum products is estimated atUS$2.93/bbl, which compares with the estimated Worldscale/AFRA freight
1/ The LDCs (Lesser Developed Countries) of -he Eastern Caribbeaninclude seven small island economies witn populations ranging from12,000 in Montserrat to L22,000 in St. Lucia. They all (Antigua andBarbuda, Dominica, Grenada, Montserrat, St. Kitts-Nevis, St. Lucia,and St. Vincent and the Grenadines) belong to the Organization ofEastern Caribbean States-OECS.
2/ During the green cover review in Augusc, 1984, the mission was in-formed that the new Covernment was investigating the possibilitiesfor conscructing an international airport.
3/ Also see IBRD Report No. 4370-CRG, St. Vincent and the GrenadinesEconomic Situation and Medium-Term Prospects, April 1, 1983.
rate of US$0.45/bbl. The freighc charged by the companies reflects thenotional cost of moving small cargoes on a single destination loading/off-loading voyage basis. In che mission's view, it is possible to Lowerthese costs by developing a regional supply, transport and storagestrategy. The mission recommends a study to:
(a) establish the least-cosc strategy for the supply, transport andstorage of petroleum products to St. Vincent; and
(b) develop specific recommendations on a regional basis.
The terms of reference for this study are shown in Annex 1, Part A. Theproposal was discussed with Esso, Shell, Texaco and Trintoc, who haveindicated their willingness to provide cooperation and support. Themission recommends that independent consultants be used to do the studywhich is expected to cost US$120,000. The UNDP Caribbean RegionalPetroleum Exploration Promotion Project has agreed to provide US$50,000for the first phase of the study.
Petroleum Prices
4. Although the Government. follows a sound policy of passing allcosts to the consumer, it Lacks the appropriate information and expertiseto develop a petroleum pricing policy. A complex pricing structure hasevolved over the years and che mission recommends that this be changedand cost elements be monitored to keep the costs within reasonablelimits. A technical capability should be developed within the EnergyDesk of the Central Planning Unit in the Ministry of Finance, to analyzeand handle petroleum pricing matters. The mission recommends that theassistance (Annex L, Part C) of a regional pricing/petroleum policyspecialist should be used to develop this capability. The specialiststarted work with the OECS in Julv, 1984.
Power Sector Issues
Supplies
5. The St. Vincent Electricity Services Ltd. (VINLEC) is the solesupplier of commercial electric power in St. Vincent and the island ofBequia in the Grenadines. It also manages a small government-owned powerstation on Union Island. The system is integrated, with all generationtied into a common distribution system. Currently, thermal generation isdiesel-based (62% of generation in 1982). In 1983, the safe plant capa-city (SPC) was below peak dem nd which resulted in daily load shedding ofup to 12 hours/day. VINLEC has acquired, on an emergency basis, threeskid-mounted units of 600 kW each to solve this short-term problem.
6. The causes of this situation were:

- iii -
(a) the breakdown of all four of the old diesel units at theKingstown station;
(b) extensive outages on cwo of the three diesel units at the CaneHall stations, which have experienced severe thermal stress andcrankshaft problems; and
(c) an 18 month delay in procuring and commissioning a new 2,900 kWmedium-speed diesel unit (Cane Hall No. 4).
The purchase of three new units wilL provide some relief until the CaneHall No. 4 Unit is commissioned in 1984. During 1985, units one, two andthree at the Cane Hall station will undergo major overhaul (50,000 hours)and rehabilitation. At that time, only two of these units would beavailable. It therefore will be necessary to keep all four unics of theKingstown station in service. These units are about 25 years old, fuelinefficient and can only be called on sparingly for peaking duty. How-ever, they wiLl provide a critical reserve for the system over the periodto 1987 when che first phase of the Cumberland hydro project (Cumberland1 and 2) should come on-stream.
Power Losses
7. VINLEC's transmission and distribution losses during 1982amounted to about 23.32 of net generatior; and increased to 26.3% for theperiod ending March 1983 (12 months). This loss level is consideredexcessive for a utility whose sub-transmission and distribution systemsare relatively small. Theft, obsolete sub-transmission/distributionfacilities, overloaded equipment (transformers, conductors), lack ofcapacitor banks (required co reduce losses and to improve the system'spower factor), and deficient metering equipment are the main causes ofthe high level of the system's losses. In 1983, CAESP financed a studyto recommend measures to reduce these losses. The study has recommendedan investment program of US$3.9 million (1983 prices) over the period1985-88 to reduce non-technical and technical losses to 0.5% and 6.5% ofnet generation, from levels in 1982 of 10.8% and 12.5%, respectively. En1982, technicaL Losses represented foregone income to Vinlec of aboutEC$1.0 million p.a. compared to Vinlec's net income after tax ofEC$859,000. The mission supports these targets and the Government hasagreed with the Bank to impLement the recommendations of this studyduring the construction of the CumberLand project. Some of the measuresincluded in the investment program to reduce losses are:
(a) capacitor instaLlation on the H-T system;
(b) restructuring the L-T system by overlaying it with H-T,reducing the area of coverage by each cransformer, and the useof small, high-efficiency transformers;
(c) application of new standards incorporating larger conductorsizes and defining maximum lengths of L-T cons-ruction;

(d) productivity improvement measures in the Transmission andDistribution Department (T&DD); and
(e) new meter installation standards, replacement and sealing ofmeters and improvement of the meter testing facility.
Hydropower Resources
8. Although hydropower has played an important role, informacionon the hydrological characteristics of the island is poor. A rainfalland steam gauging network would be established on the important riversduring the Cumberland project. For this purpose, about US$181,000 hasbeen provided in the Cumberland hydropower project.
9. The island's hydro potential was assessed in 1981/82, andschemes were identified 4/ with a combined installed capacity of about 15MW and an annual average generation capability of some 80 GWh. As it isnot possible to build storage reservoirs to regulate river flows, allpotential projects are run-of-river and have only a few hours' storage.The investment cost for most of these schemes is excessively high. TheCumberland project has allocated US$340,000 to evaluate the feasibilityof new hydroelectric schemes.
Power Tariffs and Investment Program
10. VINLEC experienced significant financial losses in 1979 and1980. After some tariff adjustments, the situation improved in 1981 and1982 at which point the company earned EC$859,000 (US$318,000) in netincome after taxes. VINLEC continues to remain in a cash-starved posi-tion while it needs capital for the power sector investment program. Thecash shortage also has affected maintenance programs. For example, onthe H-T and L-T distribution systems, the lack of spare parts has Led tofuses being bypassed, and improper connections are made which result inincreased technical losses.
11. The company is about to embark on its largest ever expansionprogram over a five-year period (1984-88). This investment program isestimated at about US$21 million (1983 prices). When price and physicalcontingencies are accounted for this amounts to some US$30 million (cur-rent prices). Of this, VINLEC is expected to finance about 10% (US$3million). The remainder of the financing would be provided by fiveagencies: CIDA, USAID, IDA, CDB and EIB.
12. Measures to reduce losses (especially non-technical ones) andto improve the efficiency of service and operations will need to be
4/ On the Cumberland, Buccament, Colonaire, Colonaire/Union, Yambou,Rabacca and Wallibon Rivers. In addition, expansion of the existingschemes on the Richmond and South Rivers.

supplemented by a series of annual cariff increases over the next fiveyears, with increases of not less than the rate of infla,:ion in eachyear. Such increases are essential both to improve the company's short-term cash position as well as to contribute towards financing its shareof the investment program. Over and above this issue of the tarifflevel, the question of tariff structure needs urgent attention. A lor.g-run marginal tariff study recently has been completed (May 1984) and willbe reviewed by the Bank. As a part of the loan agreement on the Cumber-land project, the Government agrees that it will approve the increases intariffs to meet the agreed rate of return requirements.
Management Services
13. Under a 1973 agreement, the Commonwealth Development Corpora-tion (CDC) provides VINLEC such advice as it requires on the managementand operation of the company. CDC has informed the Government of itsdesire to sell its shares (51Z) in VINLEC and to terminace the managementagreement with VINLEC. The withdrawal of CDC would weaken the planning,training, technical and financial capabilities of VINLEC. The missionsupports a study which has been proposed by the Regional Energy ActionPlan (REAP) 5/ to determine management and other common services neededby the small island countries' utilities and establish common servicesarrangements.
Other Issues
Biomass
14. The country has a fueLwood supply deficit which is being metthrough clearings of secondary forest lands and illegal cuttings. Inwatershed areas, encroachment and deforestation may cause erosion in thelong term and result in siltation at hydro development sites. Themission recommends the establishment of plantations of short-rotationfizelwood species in conjunction with a management program of existingforests to increase fuelwood yieLds. On the demand side there should bestrict regulation of charcoal makers and forest tenants. Wood cutting'permit fees' should be increased to reflect the economic costs. Duringthe green cover review, the mission was informed that substantialdevelopments in forestry have been made. CIDA and OAS are expected tofinance forestry projects, and the Cumberland project includes US$500,000to finance a watershed management program.
5/ The plan was prepared by the CDB/CARICOM for consideration by theCaribbean Group for Cooperation in Economic Development (CGCED).

- vi -
Fuel Substitution
15. Regarding the possible substitution of petroleum fuels bybiomass resources in the agro-industrial sector, adequace supplies ofcoconut husks and shells are available locally to replace the use ofdiesel and LPG in copra drying and tobacco curing. 6/ The mission'sfindings also confirm the potential for biogas production from arrow -otwasce, or 'bittie', generated in starch recovery operations. However,any major investment in this area must await the results of the proposeddemonstration plant at Wallilabou.
Geothermal
16. Geothermal manifestations oucside the cracer of the activeSoufriere voLcano are scarce or non-existent. Although the outsideslopes of the volcano might have some thermal potential, the recurringvolcanic eruptions inhibit developmenc of such resources close to thevolcano. The mission is uncertain abour the geothermal potential andbelieves that no major investment in exploration should be made at thistime. However, it would be useful, though not urgent, to do a recon-naissance survey.
Energy Conservation
17. Due to the small volume of energy use, old equipment, financialconstraints and a major concern for secure electricity supplies (due topower outages), the establishment of a large investment program in energyconservation is not a priority issue. However, the mission recommendsthat the Government introduce a housekeeping and equipment maintenanceprogram, particularly in the transport sector.
18. In summary, priority recommendations for the energy sector areto:
(a) implement a study to determine a regional strategy to LowerpetroLeum, supply and transport costs;
(b) develop a petroleum pricing policy;
(c) implement a power Loss reduction program;
(d) establish and restructure tariffs based on the results of along-run marginal tariff study;
(e) establish a forestry program to meet fuelwood shortages; and
(f) implement fuel substitution in copra drying and tobacco curing.
6/ Tobacco is grown on the coconut plantations so there is Little needto transport coconut wastes.

I. ENEGY AND THE ECONOIY
Country Situation
1.1 St. Vincent, situated in the Windward Islands of the Caribbean,has a :otal land area of 388 km2, including the Grenadines, a band ofnine small island dependencies (IBRD Map No. 17593). A range of volcanicmounrains dominates the center of the island forcing almost all of the113,400 inhabitants (1982 estimate) to live near the coast. St.Vincent's adult literacy rate is 82% (1981) and ic is 2 member of threemajor regional organizations: the Organization of Eastern CaribbeanStates (OECS); the Caribbean Commnity and Common Market (CARICOM); andthe Caribbean Development Bank (CDB).
1.2 St. Vincent is one of the Less-developed countries in theEastern Caribbean, with a per capita GDP of US$731 in 1982 (GDP wasUS$82.9 million in 1982). It suffers from the usual small economyproblems of heavy dependence on a single sector, a small internal market,and vulnerability to variations in the size and structure of its externaltrade. The small size of the market makes it imperative that some of itseconomic and energy sector issues be addressed in a regional context.Exports of goods and services represent 63% of GDP; imports account for87%. As a result of this openness and trade imbaLance, the baLance ofpayments on current account recorded a deficit of US$12 million in 1982(14% of GDP). Tourism is a major source of foreign exchange earnings,providing half of the total in 1982. 7/ The principal crop, bananas,accounts for 18% of total exports, while the major manufacturing acri-vity, flour production, contributed 12%. Consumer goods (food, beveragesand manufactured goods) account for 57Z of imports (1982) and the fuelbill for 7%. 81
1.3 Ecanomic growth between 1975 and 1978 was impressive (7X p.a.).Agricultural output rose significantly, 91 a small manufacturing sector
7/ Total foreign exchange earnings amounted to US$25.9 million; nearLy40% of this was derived from the Grenadines islands of Bequia,Mustique and Union.
8/ In 1981, fuel imports (US$5 million) represented about 8X of totalimports and 16% of exports.
91 In 1978 the output of bananas, the main export crop, reached itshighest Level in 10 years.

emerged, 10/ and tourist receipts doubled. However, in 1979 and 1980,the country experienced two successive natural disasters; eruption of theSoufriere volcano and massive damage caused by Hurricane Allen. Agricul-tural output declined by 18Z in 1979 and a further 14% in 1980. Bananaexports were particularly hard hit, falling by nearly 40% in volume.
Table 1.1: GDP TRENDS, 1975-82(1977 prices)
1975 1978 1979 1980 1981 1982
GDP (million EC$) 72.0 89.0 91.7 93.7 L04.7 107.1
Z Growth p.a. - 7.3 3.0 2.2 11.7 2.3
Source: IBRD - St. Vincent and the Grenadines: Economic Situ-ation and Medium-Term Prospects, April 1983.
1.4 The economy, following a strong recovery in 1981 (12% growth),exhibited signs of a slowdown in 1982, with GDP growing by only 2.3%.The slowdown reflected weak performance in agriculture due to a droughtin the early part of the year, a decline in tourism and only modestgrowth in the other economic sectors. Gross domestic savings which werepositive in 1981 turned negative in 1982 as consumption expenditures grewby almost 9%. The level of gross domestic investment was maintained,however, at 25% of GDP as a result of the continuing high inflows ofproject-related external public assistance.
1.5 The slowdown in 1982 may persist in 1983. The growth rate c -erthe medium-term is expected to average around 5%, led by a strong expan-sion in industry and a slower recovery in both agriculture and tourism.Public sector finances should be expected to improve as cost reductionand tariff measures are adopted to strengthen the relatively weakfinances of non-financial public enterprises. The expansion in project-related activities suggests that imports of capital goods are likely torise rapidly. Exports are projected to recover, especially during thesecond half of the 1980s, as new manufacturing establishments becomefully operational and export agriculture becomes competitive, assumingcost reduction measures are implemented. The current account deficit ofthe balance of payments is thus projected to increase initially anddecline later on.
10/ A new flour mill and a boxing plant completed their first full yearof operation in 1978.

- 3 -
Energy Balance
1.6 Table 1.2 shows that in 1982, total primary energy supply was39,300 toe, of which 24,960 toe were used in final consumption. Percapita final energy use was about 220 kilograms of oil equivaient (kgoe),while per capica commercial energy was only 156 kgoe. Petroleum importsaccounted for 53X of inland (excluding aviation and bunkers) primaryenergy supply. However, this represents only 7% of the total import billand 9% of foreign exchange earnings from goods and non-factor services.Hydro power accounted for 22 of tocal energy supply and 4% of commercialenergy supply. Fuelwood and bagasse account for the other 45% of primaryenergy, but these resources only concribute 30% of final consumption dueto the low conversion efficiency of charcoal production in the country.Electricity generation consumes 25Z of imported petroleum (all diesel).Within the power sector, hydro accounts for 38% of supply, with dieselmaking up the remainder. The household sector is the largest category ofenergy end-use (36%). followed by transport (35%). Industry and agricul-ture account for 16%, while the government and commercial sector consumethe remaining 13%.
Energy Demand Projections
1.7 Between 1982 and 1985, energy demand is projected to grow at2.1% p.a., assuming that the power loss reduction program will be inplace and that petroLeum demand increases at 2.3% p.a. During thisperiod, the demand for kerosene will fall to a 2.7% p.a. growth rate, andgrowth in gasoline demand will be 2% p.a., reflecting the replacement ofthe old vehicles with a fuel-efficient fleet, wider use of the publictransport system, and implementation of an efficient maintenance program.
1.8 Biomass resource use wilL approximate the population growthrate. By 1988, the Cumberland hydropower project will come on-stream,and hydro will provide 812 of totaL power generation (2.15). Diesel oiluse in the power sector will decline to some 1,800 toe, from 5,160 toe in1982, because of: (a) a shift in power source; (b) a reduction in trans-mission and distribution losses; and (c) a reduction in conversion lossesdue to a decline in diesel generation. Energy demand growth will declineto 0.7Z p.a. between L985 and 1990. This decrease reflects a reductionin the conversion losses for power generacion.
Investment Implications
1.9 Besides USS32.5 milLion (EC$87.8 million) in the power sector,an investment of US$1.0 million (EC$2.7 million) would be required for afive-year initiaL program co establish 250 ha of short-rotation spe'`esfor fuelwood supplies. Additional investment may be required dependingon the results of regional studies on petroleum supplies and arrangementsfor common services for the utility company.
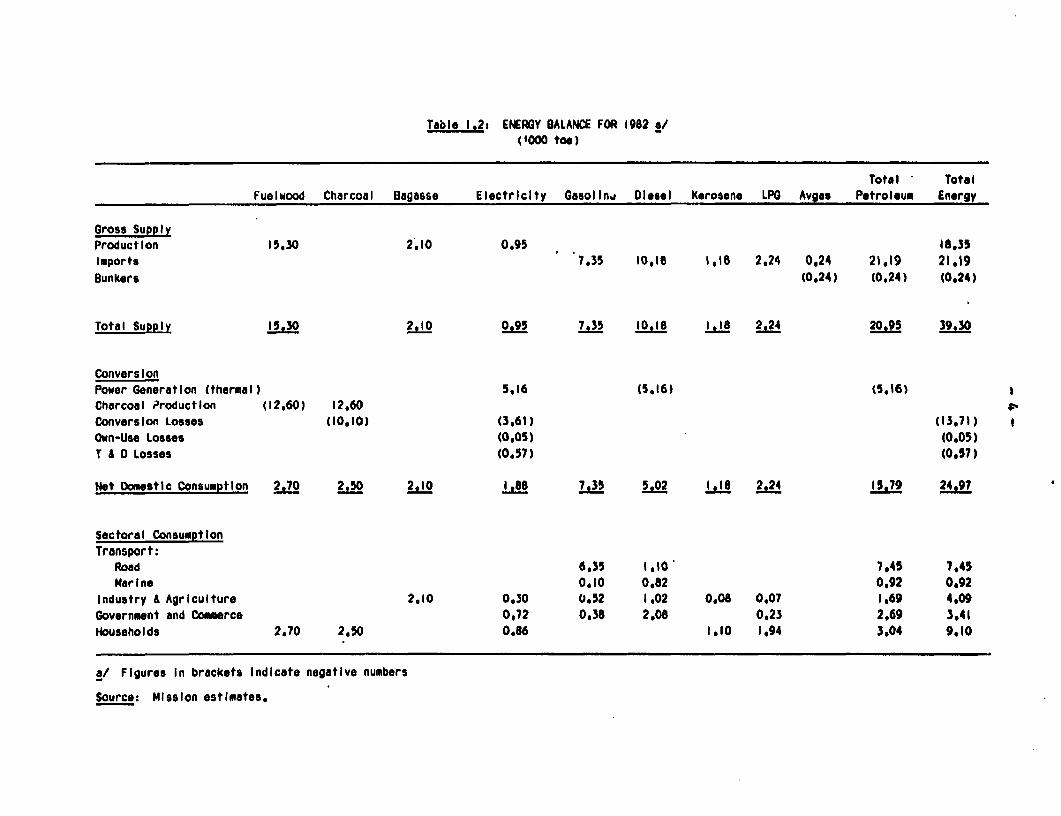
Table 1.2a ENERGY BALANCE FOR 1982 a/('000 toe)
Total TotalFuelwood Charcoal Dagasse Electricity Gasolin. Dlesel Kerosene LPG Avgas Petroleum Energy
Gross SupplyProduction 15.30 2.10 0,95 18935Imports 7,35 10,18 1,18 2,24 0,24 21,19 21,19
Bunkers (0,24) (0.24) (0.24)
Total Supply 15.30 2.10 0.95 7.35 10.18 1.18 2.24 20.95 39.30
ConversionPower Generation (thermal) 5.16 (5.16) (5.16)Charcoal Productlon (12.60) 12,60Conversion Losses (10.10) (3o61) (13,71)Own-Use Losses (0,05) (0.05)T & 0 Losses (0.57) (0.57)
Net Domestic Consumption 2.70 2,50 2.0 1,88 7.35 5.02 1.18 2.24 15.79 24.97
Sectoral ConsumptionTransport:
Road 6.35 1,10 7,45 7.45Marine 0,10 0,82 0.92 0.92
Industry & Agriculture 2,10 0.30 0.52 1,02 0,08 0.07 1.69 4.09Government and Comerce 0,72 0.38 2,08 0,23 2.69 3,41Households 2,70 2,50 0,86 1,10 1,94 3,04 9,10
a/ Flgures In brackets Indicate negative numbers
Source: Mission estimates,

-5-
Table 1.3: PRIMARY ENERGY DEMAND PROJECTIONS('000 toe)
1982 1985 1990 1982-90
(Growth Z p.a.)
Petroleum Products 21.2 22.7 20.8 (0.2)Biomass L7.4 18.5 20.4 2.0Hydropower 1.0 0.9 2.4 12.3
Total 39.6 42.1 43.6
Growth Z p.a. - 2.1 0.7 1.2
Source: Mission estimates.

-6-
II. PETROLEUM
Hiscorical Demand
2.1 Between 1977 and 1982, totaL demand for petroleum productsincreased from L4.4 thousand toe to 21.2 thousand toe -- an averagegrowth rate of 8.LX p.a. (TabLe 2.1). Diesel oil (12.6% p.a.) and LPG(12.5% p.a.) experienced the highest growth in demand during this period.
2.2 In 1977, dieseL oil accounced for 39% of total petroleum con-sumption, increasing to 48% by 1982. About 50Z of diesel oil (and 24% oftotal petroleum demand in 1982) is used by the power company (Table 2.1).A deterioration in the operation of existing diesel generation has causeduncertainty in the power supply situation. This has led to the instal-lation of small, private standby diesel units to generate power duringoutages (which at times have lasted for 12 hours). Extensive use ofthese standt_ power generators in the industrial and commercial sectorshas also caused an increase in diesel use. LPG demand increased dueto: (a) households substituting for kerosene (2.9% p.a. decline 11/between 1977-82) in cooking; (b) growth in the tourist sector (hotels andrestaurants) 12/; and (c) the emergence of a tobacco industry which usesLPG for leaf-curing. 13/
Table 2.1: PETROLEUM PRODUCT DEMAND, 1977-82('000 toe)
L977 1978 L979 1980 1981 1982 Growth
C p.a.)Avgas 0.24 0.17 0.30 0.24 0.38 0.24 --Gasoline 5.91 6.10 6.58 6.47 6.59 7.35 4.5Diesel 5.62 6.40 8.83 8.98 9.94 10.18 12.6Kerosene 1.37 1.43 1.L7 0.95 1.15 L.18 (2.9)LPG 1.24 1.21 1.73 1.85 1.85 2.24 12.5
Total 14.38 15.31 18.61 L8.49 19.91 21.L9 8.1
Source: OiL industry.
11/ The decline in kerosene also has been due to an increase in thenumber of households which have been eLectrified over the period.
12/ 3etueen 1977 and 1982, the tocal number of visitors staying inhotels and guest houses increased by 1,% p.a.
13/ Commercial production of Virginia tobacco began in L978, and by 1982it had reached a production leveL of about 70 tonnes p.a. of curedLeaf.

2.3 Between L977 and L982, the number of cars and buses increasedat 7.2% p.a., while gasoline consumption only increased at 4.5% p.a.There are two underlying trends which can account for this: (a) increas-ing imports of fuel-efficient vehicles (below 2000 cc); and (b) animproving public transport system. 14/
2.4 Table 2.2 shows pecroleum demand by economic sectors (1982).Transport, in alL forms, is the Largest consumer (41%), followed by thepower sector (24Z). Direct household use is about 14%, the productivesectors (industry and agriculture) use only 8%, while the Government andcommercial users account for the remaining 13%.
Table 2.2: PETROLEUM PRODUCT DEMAND BY ECONOMIC SECTOR, 1982
('000 toe)
Sector Avgas Gasoline Diesel Kerosene LPG rotal Percent
Aviation 0.24 0.24 1.1
Power Generation 5.f6 5.16 24.4
Industry 0.05 0.82 0.87 4.1
Agriculture 0.47 0.20 0.08 0.07 0.82 3.9
Government 0.38 0.45 0.83 3.9
Comnerce ,.63 0.23 1.86 8.8
Road TransDort 6.35 '.10 7.45 35.2
Marine 0.10 0.82 0.92 4.3
Households 1.10 .-94 3.04 14.3
Total 0.24 7.35 ;0.18 .:8 2.24 21.19 100.0
I 1.1 34,7 48.0 5.6 10.6 100.0
Source: Oil industry and Custom's records.
Petroleum Supplies and Distribution
2.5 In August 1981, Esso decided to pull out of the small marketsin the Eastern Caribbean, selling all its assets to Shell. Two com-panies, Shell and Texaco, now share the 370 barrels per day (BD) market.All refined petroleum products are imported, mainly in 15,000 bbl capa-city tankers which arrive, on average, every two weeks. The c.-goes are
14/ The number of mini-buses has increased ac a rate of 28% p.a. since1977. These predominancly consist of imports which have a fuelefficiency of 18-20 mpg.

shared with other islands in the region. For example, a tanker loadingat Texaco's Point-a-Pierre refinery in Trinidad may partly off-load inthe British Virgin islands, Saba, Nevis, Montserrat, and Marie GaLante,taking about five days before arriving in St. Vincent.
2.6 Currently, Trinidad and Tobago (T&T) and Curacao are the twomain suppliers of petroleum products, with the former enjoying an advan-tage due co the common tariffs policy arrangement under the CARICOMTreaty. T&T had initiated an oil-financing facility 15/ to insulateCARICOM trading partners from short-term petroleum price increases. How-ever, most of the Eastern Caribbean States have yet to receive financialassistance under this arrangement. Considering recent political and eco-nomic developments, the facility is not expected to continue. In 1982,about 80Z of product imports originated from Trinidad and the balancefrom Shell's refinery in Curacao. The Government has no freight policy,and the costs are based on submissions from the oil industry. Currently,freight costs are estimated at US$2.93 per bbL, which compares with esti-mated World Scale/AFRA freight rates of US$0.45/bbl. 16/ The freightcharged by the companies appears to reflect the notional cost of movingsmall cargoes on a single voyage basis from the point of loading, to eachof the islands taken separaceLy (IBRD Map No. 17800). The system oper-ated by the companies differs from this in that cargoes are moved on amultiple destination voyage basis from the poinc of Loading (2.5). Inthis way, freight costs are lowered to the companies. An important issueis: what is the difference in freight costs for small cargoes of thesingle versus multiple destination operationaL mode? Secondly, are thereany economies to be gained by the use of larger tankers (given port lim-itations in certain destinations) moving larger cargoes to each island,on a multi-destinacion basis, more infrequently, and hence requiring themaintenance of higher inventories in each island? If there are economiesin such a mode, what is the size of the potencial savings? Finally, inthe case of LPG, these issues are quite critical given that currentfreight costs (US$14/bbl) are about 50Z of the f.o.b. price. The missionbelieves that these costs can be brought down by developing a least-costregional transportation and supply strategy operated by the oil industryand has developed terms of reference for such a study (Annex 1-A).
15/ The faciLity which became retroactively effective on January L, 1980provided loans (15 years maturity, incLuding 3 years grace at 2%p.a. interest) to meet the incremental cost of petroleum productsover a base price obtained on January 1, 1979.
16/ These rates, however, apply to 16,000 DWT and larger tankers whichcannot call at alL terminaLs in the region. The calculations arebased on World Scale quotacions for the nearest Caribbean off-load-ing port and currenc WorLd Scale/AFRA.
- 9 -
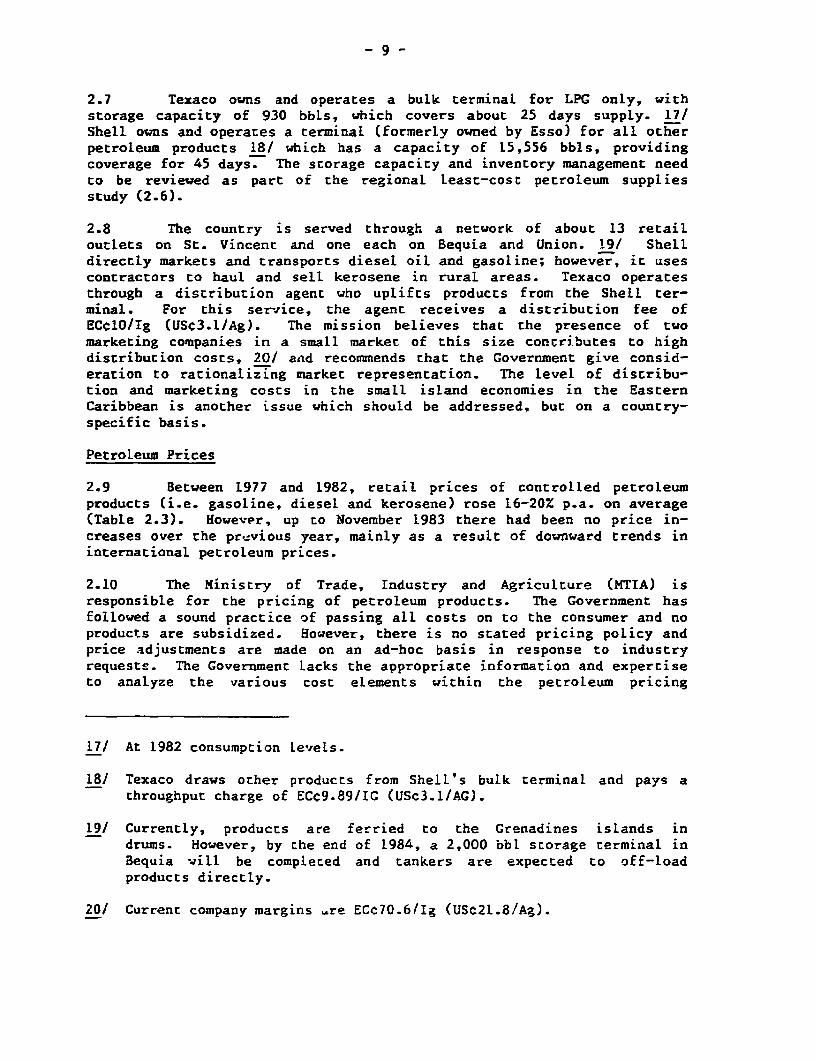
2.7 Texaco owns and operates a bulk terminal for LPG only, withstorage capacity of 930 bbls, which covers about 25 days suppLy. 17/Shell owns and operates a terminal (formerly owned by Esso) for all otherpetroleum products 18/ which has a capacity of 15,556 bbls, providingcoverage for 45 days. The storage capacity and inventory management needto be reviewed as part of the regional least-cost petroleum suppliesstudy (2.6).
2.8 The country is served through a network of about 13 retailoutlets on St. Vincent and one each on Bequia and Union. 19/ Shelldirectly markets and transports diesel oil and gasoline; however, it usescontractors to haul and sell kerosene in rural areas. Texaco operatesthrough a distribution agent who uplifts products from the Shell ter-minal. For this service, the agent receives a distribution fee ofECcIO/Ig (USC3.I/Ag). The mission believes that the presence of twomarketing companies in a small market of this size contributes to highdistribution costs, 20/ and recommends that the Government give consid-eration to rationalizing market representation. The level of distribu-tion and marketing costs in the small island economies in the EasternCaribbean is another issue vhich should be addressed. but on a country-specific basis.
Petroleum Prices
2.9 Between 1977 and 1982, retail prices of controlled petroleumproducts (i.e. gasoline, diesel and kerosene) rose 16-20% p.a. on average(Table 2.3). Howevpr, up to November 1983 there had been no price in-creases over the previous year, mainly as a result of downward trends ininternational petroleum prices.
2.10 The Ministry of Trade, Industry and Agriculture (MTIA) isresponsible for the pricing of petroleum products. The Government hasfollowed a sound practice of passing all costs on to the consumer and noproducts are subsidized. However, there is no stated pricing policy andprice adjustments are made on an ad-hoc basis in response to industryrequests. The Governmenc lacks the appropriate information and expertiseto analyze the various cost elements within the petroleum pricing
17/ At 1982 consumption Levels.
18/ Texaco draws other products from ShelL's bulk terminal and pays athroughput charge of ECc9.89/IG (USc3.1/AG).
19/ Currently, products are ferried to the Grenadines islands indrums. However, by the end of 1984, a 2,000 bbl storage terminal inBequia will be compleced and tankers are expected to off-loadproducts directly.
20/ Current company margins Are ECc7O.6/1g (USc21.8/Ag).

- 10 -
structures. A complex pricing structure has evolved which includes sixtypes of taxes (Table 2.4) which are levied in response to Governmentrevenue needs. 21/
Table 2.3: RETAIL PRICES OF CON,pLLED PETROLEUMPRODUCTS, 1977-82 a
(ECS/Ig)
1977 1978 1979 1980 1981 1982 Growth
(Z p.a.)
Gasoline 2.66 2.85 3.95 4.86 5.21 5.62 16.1Diesel 1,99 2.13 3.32 4.10 4.36 4.85 19.5Kerosene 1.90 2.07 3.66 4.15 4.30 4.71 19.9
a/ Prices on Bequia and Union Island In the Grenadines are ECf20-40/lghigher. This represents the transport cost to these islands from St.Vincent.
Source: Government of St. Vincent.
Table 2.4: RETAIL PRICE STRUCTURE OFCONTROLLED PETROLEUM PRODUCTS /
Price Elements Gasoline Diesel Oil Kerosene
F.OS, . 274.08 84.59 278.98 86.10 300.18 92.65Freigbt 19.81 6.11 19.81 6.11 19.81 6.11Insurance 0.15 0.05 0.15 0.05 0.15 0.05C,I.F. 294.04 90.75 298.95 92.27 320.16 98.81Import Duty 30.00 9.25 6.00 1.85 6.00 1.85Consumption Tax 33,00 10.19 12.00 3.70 5.00 1.54Remittance Tax 5.88 1.81 5.98 1.85 6.40 1.98Stamp Duty 22.05 6.80 22.42 6.92 24.01 7.41Tax Paid Cost 384.97 118.82 345.35 106.59 361.57 111.60Excess Margin 10.00 3.09 - -
Company Margin 67.61 20.87 67.61 20.87 67.61 20.873% Traders Tax 13.88 4.28 12.39 3.82 12.88 3.98Wholesale Price 476.46 147.06 425.35 131.28 442.06 136.44Retailers Margin 41.00 12.65 25.00 7.72 25.00 7.723% Traders Tax 15.52 4.79 13.51 4.17 - __
Retail Price 533.00 164.51 443.00 136.73 456.00 140.70
a/ Price elements are for illustrative purposes only and do not add to the controlledretail price prevailing at the time of the mission.
Source: Calculated on the basis of data from the Government and oil industry.
21/ However, the CoveraLment, the power company and a number of othermajor consumers are exempted from paying taxes for petroleum pur-chases. Furthermore, there is a history of certain taxes beingwaived when implementation problems have been encountered.

- 11 -
2.11 The relative tax levels are highest on gasoline (22.6% ofretail price), followed by dieseL (16.3%) and kerosene (11.9%). The mis-sion recommends that in order to remove complexities in the pricingstructure and monitor various cost elements, petroleum products should betreated as a special commodity (for tax purposes). A long-term pricingpolicy should aim to present consumers with the correct signals regardingrelative economic value of various products and encourage energy conser-vation and interfuel substitution. The price of LPC is not controlled,but the Government is informed of changes by the industry. This productis also subject to five categories of taxes (Table 2.5).
Table 2.5: PRICE STRUCTURE OF LPG a'
Pricing Elements ECc/lb USC/lb
F.O.B. 41.18 L5.25Freight 19.86 7.36Insurance 0.03 0.01
C.I.F. 61.07 22.62Consumption Tax 3.00 1.11Stamp Duty 4.58 1.70Remittance Tax 1.62 0.60Traders Tax 0.46 0.17
Duty Paid Cost 70.73 26.20Marketers Margin 45.56 16.87Traders Tax 3.60 1.33
Current Selling PriceZ0 lb bottle 110.50 40.93
LOG lb bottle 108.45 40.17
a! Price elements may not add up to totals and are onlyfor illustrative purposes.
Source: Mission estimates based on data from the oilindustry.
2.12 Marketers' and retailers' margins are high because of low salesvolume and hence high allocated expenses. In the mission's view, thecost of distribution can be reduced if internal marketing is rational-ized. 22/ As an example, Texaco claims and receives ECC10/Tg in extramargin to cover its marketing costs stated to be over that of Shell, 23/even though it operates through a distributor and does not maintain local
22/ Import costs may also be reduced if a regional petroleum suppliesprocurement/transportation system is established (Annex 1).
23/ Shell collects ECCIO/Ig extra from customers but pays it to theGovernment.

- 12 -
office. This preferential treatment may have resulted because Texaco isthe sole supplier of banana spray oil (Spraytex) and the Government isconcerned about the continued supply of this product.
2.13 The mission recommends that the Government create technicalcapabilities within the Energy Unit in the Ministry of Planning to handlepetroleum pricing matters, establish files of relevant data and developappropriate pricing policies and strategies. The mission also recomendsthat technical assistance be arranged on a regional basis (Annex I-C) todevelop petroleum pricing capabilities in all Eastern Caribbean islands.
Demand Projections
2.14 The mission projects the petroleum product demand to increaseat 2.3% p.a. during the next three years. Diesel oil use in the powersector is expected to increase to some 5,700 toe by 1985, implying a 3.4Zp.a. growth between 1982 and 1?985 with use in the non-power sector in-creasing at about 2.3% p.a. Between 1985 and 1990, total petroleumdemand is projected to decline at 1.7% p.a. (Table 2.6). Avgas demandshould remain static. Any marginal increase in aviation fuels will beabsorbed by kerosene (jet fuel). Gasoline demand should increase atabout 2% p.a. or less than half the recent historic growth rate. Thisreflects a replacement of the old vehicle fleet by fuel-efficient carsand buses, and a higher utilization of the expanding and possibly moreefficient public transport system and a change in the GDP growth trend.Considering the condition of the roads, the mission recommends that aconcerted effort be made to improve road maintenance as well as car main-tenance. 24/
Table 2.6: PETROLEUM DEMAND PROJECTIONS TO 1990
Growth Growth1982 1985 1982-85 1990 1985-90
(n000 toe) ('000 toe) (Z p.a.) ('000 toe) (Z p.a.)
Avgas 0.2 0.2 - 0.2 -Gasoline 7.4 7.8 2.0 8.6 2.0Diesel 10.2 11.1 3.0 7.8 (6.8)Kerosene 1.2 1.1 (2.7) 1.3 (3.0)LPG 2.2 2.5 3.L 2.9 3.1
Total 21.2 22.7 2.3 20.8 (1.7)
24/ The issue of whether to use diesel or gasoline to fueL a mini-bustransport system will be addressed by CAESP through a study which isbeing financed by USAID.

- 13 -
2.15 A dramatic change will occur in the pover sector's use ofdiesel oil in 1989 when the Cumberland hydro project comes on-stream. In1990, hydro would supply 82% (27.5 GWh) of generation. This is in con-trast to 38% (11 GWh) in 1982. Diesel oil use in the power sector by1990 will decline therefore to some 1,600 toe from 5,i60 toe in 1982.With non-power sector use of diesel oil expected to grow between 1985 and1990 at about 2% p.a., consumption outside of the power sector in 1990will be about 6,000 toe. This implies that total consumption of dieseloil will drop to some 7,800 toe in 1990 tompared to 11,100 toe in 1985, adecline of 6.8% p.a.
2.16 The downturn in kerosene demand is expected to continue, so by1990 demand should stabilize at about 6,000 barrels per year by 1990.LPG demand is believed to be reaching a maturity point and will not con-tinue to grow at recent historic rates. Lower future growth (3.1Z p.a.in the long term) wilL mainly reflect improvements in income and also thepossible substitution of LPG by biomass resources in the tobacco indus-try. By 1990, total demand for petroleum will be about 20,800 toe -
about 2Z below that in 1982. The Cumberland project would have enabledthe country to end the decade with roughly no increase in oil userelative to 1982.
Ovitlook for Petroleum Exploration
2.17 Like most of the Eastern Caribbean area, St. Vincent is con-sidered by the oil industry to be a high-risk country for exploration. AWorld Bank exploration consultant confirmed this general conclusion in1980 after reviewing the geology of the region, which is largely vol-canic. Since less is known about the subsurface offshore, some interestin this area has been shown by a small foreign oil company in recentyears. To date, however, no exploration contracts have been concluded.
2.18 In the winter of 1983/84, the Petro Canada Internr ionalAssistance Corporation (PCIAC), an official entity of the Government ofCanada, undertook on a grant basis an offshore seismic survey in thewaters of the Tobago Basin, adjacent to St. Vincent, Barbados, Grenada,and St. Lucia. The data acquired is now being interpreted in Canada. Inthis connection, the World Bank, as executing agency for a UNDP project(Regional Caribbean Petroleum Exploration Promotion), will foLlow up onthis. The Caribbean Regional Petroleum Exploration Project has beenapproved by Lhe member States and the UNDP and is now in operation. ThePCIAC project is expected to complement the scope of the UNDP project.Under the UNDP project, seminars will be designed to familiarize smallgroups in the governments of the Caribbean countries, including St.Vincent, with the basic activities and skills required to monitor oilexploration programs. There is no assurance that the results of theseismic survey will warrant exploration drilling in this area, or forthat matter, anywhere in the Eastern Caribbean. If the results are posi-tive, however, the UNDP project wouLd, at low cost, prepare governmentpersonnel to monitor company exploration activities in an efficientmanner.

- 14 -
III. ELECTRICITY
Supply/Demand
3.1 St. Vincent Electricity Services Ltd. (VINLEC) is the solesupplier of commercial electric power in St. Vincenc and the island ofBequia in the Grenadines. The St. Vincent system is integrated, with allgeneration tied into a common distribution system. Currently, thermalgeneration is diesel oil-based. providing 62X of generation in L982through cwo stations (Kingstown and Cane Hall). Kingstown has a rocalinstalled capacity of 2,075 ki (four units: 1 x 315 kW, 1 x 460 kW, and 2x 650 kW), while Cane Hall has 3,650 kW (1 s 1,126 kW, and 2 x 1,262 kW).There are two hydroelectric stations which contribute the other 38% ofgeneration (1982); South Rivers (870 kW) on the eastern side of theisland, and Richmond (1,100 ki) on the western side.
3.2 VINLEC delivers electricity to its customers through an ll-kVand 6-kV sub-transmission system of about 130 km in length covering thesouthern, western and eastern parts of the island. A total of 10 NVAstep-down transformer capacity at several substations and 650 km of 415 Vand 240 V distribution lines account for the distribution part of thesystem.
3.3 Bequia is supplied by a single generating station equipped withfour 200-kM diesel units. Dependable available capacity at this stationis about 525 kW due to the de-rating of these units below their nominalcapacities. Units 1-3 were commissioned in 1968 and unit 4 in 1982. Thedistribution consists of 415 volts, three phase lines direct from chegenerating unit busbars to Eamilton and Port Elizabeth and 3.3111 kVlines to St. Hilary. From the 3.3J11 kV line, secondary distribution isthree phase at 415 volts.
3.4 Table 3.1 shows that total gross generation increased from 18.6GWh in 1977 to 29.0 GWh in L982 (9.3Z p.a.). Between 1979 and 1982,growth was lower (5.7%) than between 1977 and 1979 (14.9% p.a.), reflect-ing the damage caused by a hurricane and a volcano eruption and the factthat between 1977 and 1979 a flour mill began operations. There was alsoa significant rise in line losses, load shedding increased due to forcedoutages, and economic conditions deteriorated. Line losses increasedfrom 16% of net generation in 1979 to 23X in 1982. 25/ A power lossreduction study has recently been completed by consultants and theirrecommendations are discussed in paras 3.L6-3.17.
25/ Line losses are estimated as the difference between net generationand sales; therefore, both technical and non-technical (faultymetering, power theft, etc.) losses are included.

- 15 -
3.5 Maximum demand registered lower growth (4.8% p.a.) than genera-tion since 1977, indicating an improving system load factor. 26/ In-creased industrial sales have been a major factor in this trend; however,high load shedding aLso may be responsible for artificially inflating thesystem load factor. During November l983, load shedding was at a levelof about 12 hours/day, because of forced outages involving all fourdiesel units at Kingstown and one unit at Cane Hall. It has been esti-mated that between January and November of 1983, about 1 GWh of genera-tion (3.5%) has been lost due to load shedding, with an average of 800 kiof load being truncated during the evening peaks and also during the daytime. The collapse of the supply system has been the most serious prob-lem facing the sector and has become worse since 1981, cuLminating inNovember 1983 with the loss of one of the Cane Hall units and the entireKingstown station. Indeed, the chief concern of electricity consumers(especially in the industriaL and commercial sectors) has been withsupply and not at all with price. This low level of supply security hasgiven rise to a Large increase in captive power generation with importsof these sets increasing significantly in 1983.
TaDle 3.1: ST. VINCENT FOWER GENERATION, 1977-82
Growth1977 1978 1979 1980 1981 1982 % p.a.
Gross Generation (GWh) 18.6 22.1 24.6 25.8 26.3 29.0 9.3Diesel (GWh) 10.2 12.2 14.9 15.7 15,8 18.0 11.9Hydro (GWh) 8.4 9.9 9.7 10.0 10.5 11.0 5.6
Maximum Demand (MW) 4.1 4.8 4.9 4.6 5.0 5.2 4.8
System Load Factor (S) 51.7 53.2 57.4 63.5 64.3 63.7 4,3
Source: VINLEC.
3.6 Total sales to final consumers grew from 15.2 GWh in 1977 to21.8 GWh in 1982, an average rate of 7.5% p.a. (Table 3.2). There is aneven more pronounced difference in growth between the two sub-periods1977-79 (15Z p.a.) and L979-82 (2.7% p.a.) for sales than for genera-tion. The high growth in the earlier period largely reflects the flourmill commencing operations in L978. The milL accounts for nearly 70% ofindustrial sales, with four ther establishments, a dairy, feed mill, acontainer plant, and copra fa:tory accounting for a further 15%. Growthin domestic sales has averaged 5.5% p.a. between 1977 and 1982. Thisappears to reflect only increases in population (1.8% p.a.) and thenumber of new connections (4.5% p.a.), since average consumption has onlyincreased from 73 kWhlmonth in 1977 to 76 kWh/month in 1982. In 1982,
26/ From 51.7% in 1977 to 63.7% in 1982.

- 16 -
commercial sales accounted for 37% of total sales, consisting of approxi-mately 1,200 customers with an average consumption of 540 kWh/month.Growth averaged 6Z p.a. between 1977 and 1982, with popuLation and GDPbeing the main determinants. 27/
Table 3.2: ST. VINCENT ELECTRICITY SALES, 1977-82(Gwh)
Growth1977 1978 1979 1980 1981 1982 Z p.a.
Total sales 15.18 17.67 20.09 19.65 20.40 21.78 7.5
Domestic 7.64 8.05 8.76 8.93 9.17 9.97 5.5Commercial 5.95 6.74 7.11 7.11 7.60 7.97 6.0Industrial 1.26 2.58 3.91 3.23 3.24 3.44 22.2Street Lights 0.32 0.31 0.31 0.39 0.39 0.40 4.6
Source: VINLEC.
3.7 Total sales to consumers in Bequia increased at an averageannual rate of 3.1% between 1977 and 1983, from 703 MWh in 1977 to 843MWh in 1983. Domestic sales account for about two-thirds of total sales.This relativeLy slow rate of growth in electricity sales contrasts withthat of peek demand, which rose from 268 kW in 1977 to 375 kW in 1983 -an average rate of 5.8Z p.a.
Electricity Tariffs
3.8 Under the Electricity Supply Act of 1973, applications for rateincreases are submitted to the Ministry of Communication and Works (MCW),which in turn makes recommnendations to the Cabinet. If the request for arate increase is rejected by the Cabinet, then the Act allows for arbi-tration.
3.9 The tariff structure has two basic components: a base tariff(of which there are four categories - domestic, commercial, industrial
27/ Based on analysis done by Shawinigan Engineering Company Limited forthe World Bank in 1982.

- 17 -
and street lighting) and a fuel surcharge. 28/ The fuel surchargerepresents increases in diesel fuel costs since October 1973. Table 3.3shows that the fuel surcharge has been the major source of electricityprice increases in recent years. Whereas in L979 the surcharge accountedfor 25% of total revenues, by 1982 it had climbed to 35%. However, theseincreases have been insufficient to offset rising generation costs and,as a result, VINLEC experienced operating losses in 1979 and 1980.Furthermore, since VINLEC became operational as a limited company in1973, few dividends have been paid and the company has been unable tomake repayments of principal on loans to the CDC. 29/ Tariffs increasedat about 1.4% p.a. in real terms over the 1972-82 period, essentially tomeet increased fuel costs.
Table 3.3: AVERAGE REVENUE AND FUEL SURCHARGE, 1979-82(ECc/kWh)
1979 1980 1981 1982 Growth(Z p.a.)
Average Revenue 19.5 24.9 26.8 30.5 16.2(excluding fuel surcharge)Percentage Growth -- 27.7 7.6 14.2 -
Fuel Surcharge 6.5 12.1 16.2 16.5 36.4Percentage Growth - 86.2 33.9 1.9
Source: VINLEC.
3.10 The last tariff increase became effective from January 1, 1983,am! the current rate structure for each class of consumers is shown inTable 3.4. The Government enjoys a OZ discount on all its bills, 30/and a £ev of VINLEC's largest customers, including the flour mill, aregiven a 5% discount if bills are settled within seven days. 31/ It seems
28/ The fuel surcharge is calculated by dividing the total cost of fuelabove the base price (EC$0.5284 per IG) by total electricity saleseach month. The major deficiency with this approach is that no tar-get heat rates are included, nor are system losses accounted for,thereby providing the utility with little incentive to reduce these.These issues are to be addressed in a tariff study initiated underthe CAESP.
29/ These were rescheduled on three occasions: 1975-89, 1978-92 and1983-96.
30/ The justification of which is unclear.
31/ The possibility of extending this incentive to other users should beexamined as a means of reducing accounts receivable.

- 18 -
that this incentive has impr.oved the cash flow posicion of the powercompany. Currently, a long rur. marginal cost tariff study is being doneby consultants financed under the Caribbean Alternative Energy SystemsProject (CAESP) which will recommend changes in the structure and leveLof tariffs to reflect the economic costs of supply.
Hydropower
3.11 In 1981/82, a UNDP-financed study 32/ examined the hydropowerpotential of five rivers: Cumberland, Colonaire, Colonaire/Union,Buccament and Yambou. In addition, the potential of expanding the twoexisting hydro schemes; South Rivers and Richmond, was also assessed, aswell as a tentative review of the two northern rivers - the Wallibou andRabacca.
3.12 Among the rivers studied, there is little variation in topogra-phical and geological conditions. There is no economic possibility ofsignificant storage reservoirs being built to regulate the river flows sothat all hydro projects are of the run-of-the river mode with a maximumstorage of a few hours. ALthough hydro has formed an important part ofthe St. Vincent power system for several years, the hydrological charac-teristics of the isLand percinent to hydropower development are poorlyunderstood. Rainfall data are adequate, but virtually no useable data onriver flows exist save for one record at the existing South Rivers andRichmond plants. Average river flows had to be estimated from rainfalldata over the drainage area less evapo-transpiration. Indeed, one of thecritical investments that must be undertaken to ensure an adequate database for hydro development in the 1990s is the establishment of a rain-fall and stream gauging network on the rivers of potential importance.Some US$225,000 is provided for this in the Cumberland project.
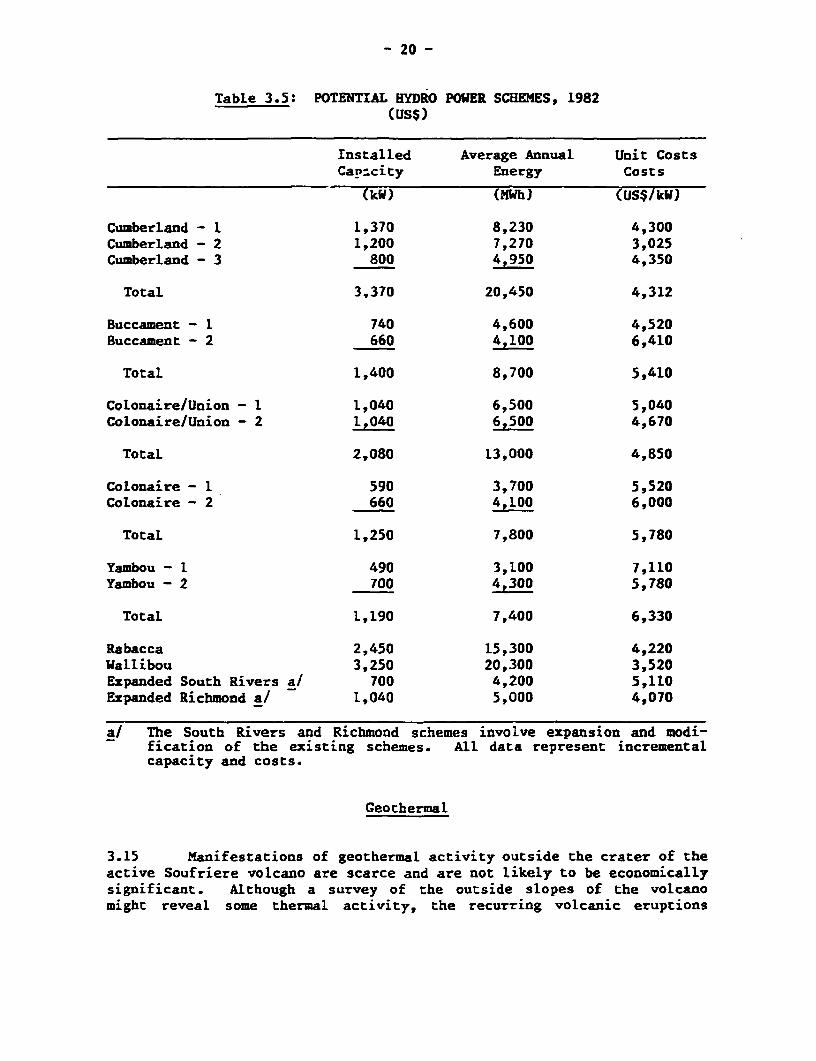
3.13 In the case of the Wallibou and Rabacca Rivers, the consultantsdid not undertake any site reconnaissance. Hence estimates for theserivers must be viewed with caution. The flow pattern of these rivers isuncertain due to the loss of vegetative cover in the watershed areacaused by the eruption of the volcano in 1979. Table 3.5 summarizes theestimated investment costs of developing the different schemes in 1982prices.
32/ "St. Vincent Hydroelectric Scheme - Inception Report" (October1982), Shawinigan Engineering Co.

- 19 -
3.14 Three main conclusions are:
(a) Developing St. Vincenc's hydro potential would involve highcost schemes with investment costs ranging from US$4,000-7,100/kW. 33/
(b) The total installed potential of all schemes is about 15 MWwith an annual average energy generation capability of some 80GWh.
(c) Though the hydro resources are significant relative to currentand projected power requirements, the economics of developing alarge number of these schemes (Yambou, Colonaire and Colonaire/Union and Buccament-2) is marginal at current petroleum prices.These schemes would need careful evaluation before development.The Cumberland project has made financial provisions for thispurpose.
Table 3.4: ELECTRICITY TARIFFS FOR ST. VINCENT, 1983 a!
Charge(EC$/kWh)
DomesticMonthly minimum charge 5.85Unit charge (EC$/kWh) 0.325
CommercialMonthly charge based on floor area b/ 0.42Unit charge (EC$/kWh) c/ 0.34
IndustrialDemand charge per kW d/ 6.00Unit charge (EC$/kWh) 0.28
Street LightingUnit charge (EC$/kWh) 0.36
a/ Does not include Bequia. Rates there are 6-8% higher.EI Based on floor area in square feet divided by 50.c/ Does not include surcharge, which averaged EC$0.155/kWh dur-
ing 1983.d/ Based on the installed capacity of connected motors and
appliances.Source: VINLEC.
33/ The WalLibou scheme is tentatively estimated to cost US$3,520/kW.
- 20 -
Table 3.5: POTENTIAL HYDRO POWER SCHEMES, 1982(us$)
Installed Average Annual Unit CostsCan:city Energy Costs
(kW) (MWh) (US$7kw-)
CumberLand - I L,370 8,230 4,300CumberLand - 2 1,200 7,270 3,025Cumberland - 3 800 4,950 4,350
Total 3.370 20,450 4,312
Buccament - L 740 4,600 4,520Buccament - 2 660 4,100 6,410
Total 1,400 8,700 5,410
Colonaire/Union - 1 1,040 6,500 5,040Colonaire/Union - 2 1,040 6,500 4,670
Total 2,080 13,000 4,850
Colonaire - 1 590 3,700 5,520Colonaire - 2 660 4?100 6,000
Total 1,250 7,800 5,780
Yambou - 1 490 3,100 7,110Yambou - 2 700 4,300 5,780
TotaL 1,190 7,400 6,330
Rabacca 2,450 15,300 4,220Wallibou 3,250 20,300 3,520Expanded South Rivers a/ 700 4,200 5,110Expanded Richmond a/ 1,040 5,000 4,070
a/ The South Rivers and Richmond schemes involve expansion and modi-fication of the existing schemes. All data represent incrementalcapacity and costs.
Geothermal
3.15 Manifestations of geothermal activity outside the crater of theactive Soufriere volcano are scarce and are not likely to be economicallysignificant. Although a survey of the outside slopes of the volcanomight reveal some thermal activity, the recurring volcanic eruptions

- 21 -
inhibit development of such potential in any area around the Soufriere.The mission is not optimistic about the geothermal potential in thecountry and believes that exploration expenditures are not warranted atthis time. However, it might be useful to do a reconnaissance survey toconfirm these findings.
Power Sector Issues
Power Losses
3.16 Losses over the period 1977 to first quarter 1983 on the VINLECsystem show an increasing trend (Table 3.6). System losses increasedfrom 16.4% of net generation in 1977 to 23.3% in 1982. By first quarter1983, they rose to about 29% of net generation, with losses over the 12-month period -- April 1982 to March 1983 - being 26.3%. The new highlevel of losses in 1980 (above 20% of net generation) coincided with ahurricane which damaged equipment, a fire which destroyed company re-cords, and the effects of a volcano eruption in 1979.
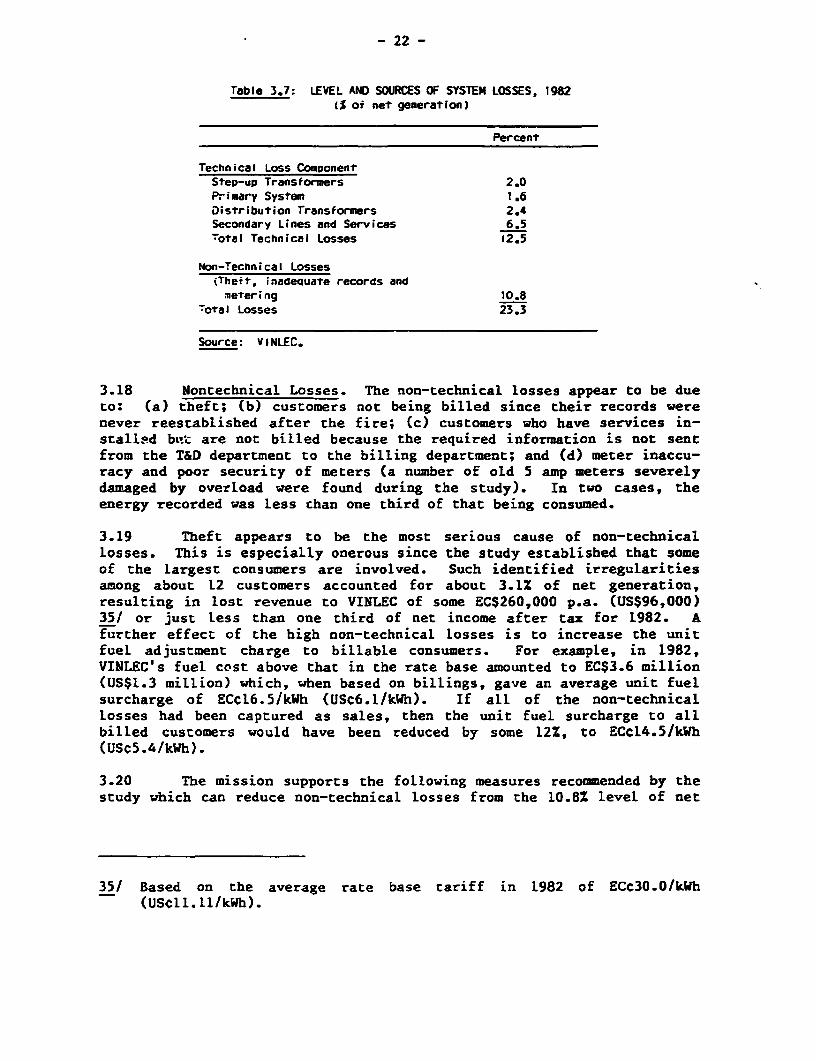
3.17 Recognizing the need to reduce losses, a power loss reductionstudy was done 34/ in 1983. The study identified the level and source oftechnical losses on the system and by difference estimated the size ofnon-technical losses. Table 3.7 shows that both the technical and non-technical losses are excessive. The non-technical losses are of immedi-ate concern to VINLEC in that they represent foregone income of aboutEC$l million p.a. (US$370,000) and are reflected in the current cashshortage. Indeed, to place this in its proper perspective, VINLEC's netincome after tax in 1982 was EC$859,000 (US$318,000).
Table 3.6: VINLEC POWER LOSSES, 1977 - FIRST QUARTER 1983
1977 1978 1980 1982 1983 at 1983
Total Energy Generated (GWh) 16.6 22.1 25.8 29.0 7.4 29.1Utility's Own Use (GWh) 0.5 0.6 0.6 0.6 0.2 0.7Net Generation (GWh) 18.2 21.6 25.1 28.4 7.2 28.8Sales (GWh) 15.2 17.7 19.6 21.8 5.1 21.2System Losses (GWh) 3.0 3.9 5.5 6.6 2.1 7.6System Losses (% of netgeneration) 16.4 18.2 21.7 23.3 29.0 26.3
a/ First quarter 1983 results.b/ 12-month period to March 1983.
34/ "Power Transmission and Distribution Loss Reduction Study - St.Vincent, Bequia and Union Island" (February 1984) by Adair and BradyInternational Inc., financed under Lhe CAESP.
- 22 -
Table 3.7: LEVEL AND SOURCES OF SYSTEM LOSSES, 1982(X or net generatlon)
Percent
Technical Loss ComponentStep-up Transformers 2.0Primary System 1.6Distribution Transformers 2.4Secondary Lines and Services 6.5-otal Technical Losses i2.5
Non-Technical Losses(Theft, inadecuaTe records andmetrering 10.8
Total Losses 23.3
Source: VINLEC.
3.18 Nontechnical Losses. The non-technical losses appear to be due
co: (a) theft; (b) customers not being billed since their records were
never reestablished after the fire; (c) customers who have services in-
stallnd bt.c are not billed because the required information is not sent
from the T&D department to the billing department; and (d) meter inaccu-
racy and poor security of meters (a number of old 5 amp meters severelydamaged by overLoad were found during the study). In two cases, the
energy recorded -was less chan one third of that being consumed.
3.19 Theft appears to be the most serious cause of non-technical
losses. This is especially onerous since the study established that some
of the largest consumers are involved. Such identified irregularities
among about 12 customers accounted for about 3.1% of net generation,
resulting in lost revenue to VINLEC of some EC$260,000 p.a. (US$96,000)
35/ or just less than one third of net income after tax for 1982. A
further effect of the high non-technical losses is to increase the unit
fuel adjustment charge to billable consumers. For example, in 1982,
VINLEC's fuel cost above that in the rate base amounted to EC$3.6 million
(US$1.3 million) which, when based on billings, gave an average unit fuel
surcharge of ECC16.5/kWh (USC6.1/kWh). If all of the non-technical
losses had been captured as sales, then the unit fuel surcharge to all
billed customers would have been reduced by some 12%, to ECCl4.5/kWh
(USC5.4/kWh).
3.20 The mission supports the following measures recoomended by the
study which can reduce non-technical losses from the 10.8% level of net
35/ Based on the average rate base tariff in 1982 of ECC30.0/kWh
(USll.l1/kWh).

- 23 -
generation in 1982 to 0.5% by 1988. An investment of EC$3.0 million(US$1.1 million) is required to achieve this target (in 1983 prices).
(a) Move all industrial and large commercial meter installationsoutside of the building immediately to clearly visible loca-tions. The remaining commercial and then domest!ic meter in-stallations should also be moved outside.
(b) Use kWh and kVA demand meters on all industrial and large com-mercial customers. This is linked to a tariff restructuringwhich would require kVA meters for such users. In this con-text, large consumers should be considered those having ademand of 5 kVA or more.
(c) Replace all old 5 and 10 amp meters on the system starting withthe high use areas. This step should be combined with movingthe new meters outside.
(d) Require all new meter installations to conform to standards setby VINLEC, defining outdoor location, socket type and mounting,etc.
(e) Survey all street lights to provide an appropriate database. 36/
(f) Seal all meters on the system and routinely check for brokenseals.
(g) Provide adequate staff and transport for checking defects re-ported by meter readers, taking out meters for testing andinvestigating immediately suspected cases of theft of service.
(h) Examine the introduction of an incentive system for the companyfor improving on current losses.
(i) Survey all customer connections to reestablish any accountsthat may have been lost in the 1980 fire and to detect un-metered services.
(j) Improve the meter testing facility and staff to ensure a highthroughput of meters.
(k) Streamline information flow between departments to ensure thatwhen customers are connected, they are entered on the billingsystem.
36/ Unless these sales are accurately measured, some of them couldappear under un-billed sales, thus adding to non-technical losses.

- 24 -
3.21 The target ser for non-technical losses by the end of thedecade is 19% of net generation and that for technicaL losses is about6.5Z. With VINLEC's own use of electricty it expected to be about 2.5%of gross generation; chis implies that by 1989, total system lossesincluding own use should be reduced to about 1%. These targets appearachievable based on the recommended investment program.
3.22 Technical Losses. Technical losses in L982 were estimated tobe 12.5%. These losses on a syscem the size of VINLEC's should be in therange of 6-7Z. The major cause is the use of large transformers andextensive secondary lines for the low tension (L-T) system (Table 3.7).The secondary system is extensive. In some Locations sampled it extendedto points over 3,000 feet from the transformer, with the main conductorbeing No. 10 AWG copper in some sections. Both the high and Low tensionsystems require maintenance: on the former bypassing of fuses due tospares shortages, and on the latter, problems related to poor connectionsdue to the absence of spares were observed. The main projects proposedto reduce technical losses are: (a) capacitor installation on the hightension (H-T) system; (b) restructuring the L-T system by overlaying itwith H-T, reducing the area of coverage by each transformer, and usingsmall high-efficiency transformers; and (c) application of new standardsincorporating larger conductor size and defining maximum length for L-Tconstruction.
3.23 A total of 3,600 KVAR of fixed bank capacitors are proposed tobe added to the H-T system between 1984-88 to improve che present systempower factor from 75% to about 95%. Overcorrection is not expected to bea problem using fixed banks because the evening peak is due to incandes-cent lighting while the low power factor during the day is due-to air-conditioning loads. The benefit/cost ratios of these investments rangefrom about 4.6 to 16.5 depending on the feeder in question. 37/
3.24 In the case of the L-T system, it is estimated that overlayingwith H-T would require an investment of some EC$3.7 milliGn (US$1.4 mil-Lion) over a three-year period resulting in a benefit/cost ratio of 1.4while reducing energy losses on the L-T system by about 5.5% of net gen-eration. The overall effect of lowering technical losses would be toreduce peak losses by 290 kW in 1986 and by about 450 kW in 1988, withenergy losses reduced by some 2.3 GWh in 1988.
3.25 The investment program proposed to reduce losses (Table 3.8)includes an item for improving the productivity of the T&D departmentwhich is critical if set targets are to be achieved. It includes re-structuring of line crews, provision of necessary vehicles and tools,workshop facilities and offices, and training and updating of line con-struction standae-ds.
37/ Increasing invesrment costs by 25% and reducing the vaLue of energyby one-third does not affect the results of these measures.

- 25 -
3.26 The mission considers this program to be of high priority toVINLEC as it will have a major impact on improving the company's financesand quality of service and ameliorate the rate of tariff increases neededby the company during the 1980s to remain financially sound. Totalinvestments (in 1983 prices) to reduce non-technical and technical lossesamount to EC¢3.0 million (US$1.1 million) and EC$3.8 million (US$1.4million), respectively, with that for productivity improvement beingEC$3.7 million (US$1.4 million).
Table 3.8: INVESTMENT PROGRAM - POWER LOSS REDUCTION, 1985-88 a?(1983 EC$'O00)
Nontechnical TechnicaL ProductionYear Losses Losses Improvement Total
1985 1,198 1,302 1,624 4,1241986 623 1,231 1,975 3,8291987 597 1,217 41 1,8551988 597 7 41 645
Total 3,015 3,757 3,681 10,453
a/ The net present value of investments in non-technical losses ofEC$2.5 million results in a net present value of savings of EC$5.5million up to 1990.
Electricity Demand Forecast and System Expansion Program
3.27 A major UNDP financed study 38/ of St. Vincent's hydro develop-ment possibilities made a detailed assessment of future power sales.Load forecasts were developed using three methodologies: (a) extrrpola-tion of historical trends; (b) econometric correlation between electrici-ty consumption and projected socio-economic indicators; and (c) detailedanalyses of consumption by different customer categories. The forecastsbased on the econometric approach were adopted by the consultants. Themission reviewed this forecast and endorses the approach followed and theunderlying assumptions, which included 5Z p.a. GDP growth to 1986 and amoderate growth in the late 1930s. Table 3.9 summarizes demand projec-tions for the years 1982 and 1990.
3.28 Electricity sales are expected to increase at about 4.3% p.a.(1982-90), with sales to the industrial sector increasing at 10X p.a.
38/ "St. Vincent Hydroelectric Scheme" - by Shawinigan Engineering -Inception Report (October 1982).

- 26 -
Non-coincidental peak demand should increase modestly at 2.8% p.a., from5,300 kW in 1982 to 6,600 kW in 1990. However, generation is projectedto grow slowly at 2.0% p.a., from 29 CWh in 1982 to 34 GWh in 1990. Bothrelatively low rates of growth are due essentially to the effects reduc-ing technical Losses which is estimated to cut at least 450 kW off thepeak by the late 1980s.
Table 3.9: ST. VINCENT SALES GENERATION AND PEAK DEMANDFORECAST, 1982-90
Average AnnualIncreases
Sales Category 1982 1990 1982-90(GWh) tZ) (GWh) (%) (U)
Residential 10.0 34.5 12.1 35.6 2.4Commercial 8.0 27.6 10.6 31.2 3.6Industrial 3.4 11.7 7.3 21.4 10.0Street Lighting 0.4 1.4 0.6 1.8 5.2Total Sales 21.8 75.2 30.6 90.0 4.3Total Losses a/ 7.2 24.8 3.4 10.0 (9.0)Total Generation 29.0 100.0 34.0 100.0 2.0Maximum Demand (MW) 5.3 -- 6.6 -- 2.8
a/ Includes own-use and system losses.
3.29 From the demand standpoint, the reduction in losses (more thanhalving) and the increasing share of industrial sector sales (almostdoubling) are the most significant structural effects expected to occurin the power sector during the second half of the 1980s. From the supplystandpoint, two important charges should occur. First, and most impor-tant, the severe supply crisis should begin to abate somewhat from aroundFebruary 1984 when the 3 x 600 kW diesel units sh-:iid be commissioned(Kingstown). These were purchased on an emergency basis in 1983. Thedepth and frequency of load shedding should be further reduced from thelast quarter 1984 when the CDB-financed 2,900 kW diesel unit comes on-stream. The second important supply development would be the commission-ing of the Cumberland hydroelectric project in L987l:i, which should addsome 3,370 kW of capacity to the system. The existing and planned addi-tions to generating plant capacity during the 1980i are summarized inAnnex Table 2.
3.30 As part of the studies financed by the UNDP, selection of theleast-cost power generation expansion plan for 1983-92 was undertaken.The expansion program for the period 1981-84 was covered by a previousCDB-financed study which recommended the addition of a 2,500 kW medium-speed, four-stroke diesel unit by early 1983. As no arrangements existedfor heavy fueL oil delivery to St. Vincent, this unit was designed to

- 27 -
burn diesel and not 1,500 second' fuel oil. VINLEC eventually purchaseda 2,900 MW set, because of attractive financial terms, though the largesize of the unit relative to the system would have placed severe reserverequirements on the system if the 3 x 600 kW Cummings units were notpurchased at the end of 1983.
3.31 In determining the least-cost options, five different hydropower schemes were examined (Cumberland, Colonaire/Union, Buccament,Yambou and CoLonaire), as well as a urogram be led on the addition ofdiesel units burning both distillate and resiL al fuels. To encompassthe latter option, it was considered that, since the level of residualconsumption would rise rapidly, arrangements would be made to deliverchis fuel to St. Vincent. Among the hydro options, Cumberland was shownto be the best (Table 3.10).
Table 3.10: COMPARATIVE HYDRO SCHEMES
Discount Rates at Present Value of Capitalwhich Cumberland Operation & Maintenance
Hydro Alternative is least cost Costs at lOX Discount Rate
(US$ million)
Cumberland 10.5Colonaire & YambouPlus Buccament All discount rates 14.4
Colonaire/Unionplus Yambou For all discount 13.4
Colonaire/JUnionplus Buccament All discount 12.6
Source: World Bank Staff Appraisal Report (December 1983) - "FirstPower Project - St. Vincent and the Grenadines."t
3.32 In the case of the thermal expansion options, Cumberland wasshown to be the best when based on c.i.f. residual fuel oil prices ofUS$28/bbl and US$35/bbl for distillate fuel with no escalation in realterms. The present value of capital, operations and maintenance costs at0l discount rate was about US$12.4 million in the Lase of the heavy fueloption, with Cumberland being least-cost for all discount rates below 12%(the opportunity cost of capital in St. Vincent is currently estimated at10%). This difference is not significant.
3.33 The details of the power capacity balance between 1983 and 1990are shown in Annex Table 3. The underlying assumptions regarding avail-able capacity over this period are:

- 28 -
(a) firm (dry season) capacity of the existing run-of-the-riverhydro plants remains at 1,200 k.W;
(b) the new 3 x 600 kW Cummings diesels are commissioned by early1984 at Cane Hall;
(c) the Kingstown power starion should be maintained in serviceover the period until the Cumberland project comes on stream.As the four high-speed units at this station are old (about 25years) and fuel inefficient, they can only be called on to dopeaking duty. In the case of units 1 and 4 their ability to domerely 800 hours p.a. duty over the next four years is by nomeans certain. The station would be de-coamissioned in 1989.It is assumed that only 900 kW of dependable capacity exists atthis station;
(d) Cane Ball (No. 4), the 2,900 kW medium speed diesel unit wouldbe commissioned by last quarter 1984;
(e) the Cumberland project would be in operation by 1989;
(f) during 1985 units 1, 2 and 3 at Cane Hall will have to undergomajor overhaul (50,000 hours) and rehabilitation, resulting inonly two of these three units, on average, being available dur-ing that year. Following this, units 2 and 3 (which have expe-rienced severe thermal stress and crankshaft problems) arelikely to be de-rated to operate at a maximum of 1,100 kW each;and
(g) the safe plant capacity (SPC) is defined as the firm peaking391 capacity minus the capacity of the two largest diesel units(Cane Hall Nos. 4 and 2) from 1984 onwards.
3.34 The following conclusions can be drawn from the capacity bal-ance over the 1983-90 period:
(a) with the commissioning in earLy 1984 of the 3 x 600 kW Cummingsdiesels and the 2,900 kW medium speed unit towards the end of1984, the system's generation security should improve, especi-ally in the last quarter of 1984. This increased securitywould not, however, have been achieved unless the 3 x 600 kWdiesels had been procured on an emergency basis in late 1983;
(b) the necessity of keeping the Kingstown station in service isevident especially in 1985, when major overhaul and rehabilita-tion of units 1-3 at Cane Hall will be undertaken. Annex Table
39/ Only to be consistent with the IDA Appraisal Report (April, 1984)No. 4854b-SV.

- 29 -
3 shows that in that year the SPC is estimated to be 100 kWbelow peak demand. Retirement of any of the Kingstown unitsbefore completion of this rehabilitation would require load-shedding to be reintroduced in 1985. Any such deterioration ofservice again should be avoided, especially since consumerswill be facing escalating tariffs in this period due to thefinancing needs of the expansion program and the fact that theywould only just have emerged from an extreme period of load-shedding between 1981-83; 40/
(c) the Kingstown station would be decommissioned during 1989 afterthe Cumberland project is completed. There would then be ade-quate capacity in the system to allow such decommissioningwithout affecting system security;
The above conclusions and Annex Table 3 highlight the importance of theKingstown station over the short to medium-term.
3.35 In this regard, it is clear that if the Kingstown station isretired before Cumberland is commissioned additional diesel capacitywould have to be purchased. The key question to be addressed thereforeis the benefit/cost of such "early" retirement versus procuring addi-tional diesel plant. Among the benefits claimed for early retirementare:
(a) elimination of overhead costs associated with running 2 thermalstations (estimated to be about USCO.9/kWh higher than for anew replacement set of Cane Hall);
(b) reduced fuel costs due to higher efficiency of new units (abenefit of some 0.7 kWh1IG due to this effect); and
(c) reduced operations and maintenance costs (including lubeoil). Tnis is estimated to be about USC2.2/kWh aboveequivalent costs for a new unit.
3.36 The Kingstown station is not expected to generate more thanabout 800 MWh p.a. up to 1988. The incremental costs outlined above ofkeeping the station in operation should not exceed about USS30,000 p.a.It would appear that even if ic requires an additional US$30,000 p.a. inrepairs and rehabilitation over and above these incremental costs thatits decommissioning and replacement by a new set would not be justifiedon economic grounds. After 1988, when the Cumberland project comes onstream, diesel units would not be needed except during periods of peakdemand because hydro would satisfy more than 80X of electrical energyneeds. Therefore, if Kingstown Station is decommissioned prior to 1989,
40/ At the time of the green cover review in August, 1984, reguLar loadshedding was still prevalent.

- 30 -
new, repLacement diesel units would have little use from 1988 until wellinto the 1990s. In other words, such an investment in new diesels wouldhave to be recovered within a very short period, 1985-88.
3.37 The change in the role of hydro is illustrated in Table 3.11.Whereas hydro only met 38% of generation (11 CWh) in 1982 and its sharedeteriorated to 34Z (10.5 GWh) in 1986, with Cumberland on-stream in 1990the situation is reversed and hydro would satisfy about 82% of totalsystem supply. Diesel oil consumption in the power sector would increasefrom some 5,160 toe in 1'82 to about 5,700 toe in 1986; however, by 1990diesel demand would decLine co only about 1,600 toe. Relative to 1982-diesel consumption Levels in St. Vincent, this would represent about a6.8% annual reduction in diesel use (2.15).
Power Sector Investmenc Program
3.38 VINLEC will be embarking on its largest ever expansion programover the period 1984-88. An estimated investment of about US$21 million,excluding price and physical contingencies, 41/ is needed over the restof the decade to undertake the expansion program. Of this, VINLEC wouldbe expected to finance about US$3 million. This raises the issue ofVINLEC's financial performance.
TabLe 3.11: POWER GENERATION BY SOURCE, 1971-90(CWh)
Source/Year 1971 1982 1986 1990
(Actual)
Gross Generation (GWh) 14.1 29.0 30.9 33.6(1OO) (100%) (100%) (100%)
of which:
Hydro 9.9 11.0 10.5 27.5(70%) (38%) (34%) (82%)
Diesel 4.2 18.0 20.4 6.1(30%) (62%) (66%) (18%)
Power Tariff and VINLEC's Financial Performance
3.39 VINLEC experienced significant losses in 1979 and 1980. Aftersome tariff adjustments, the situation improved in 1981 and 1982, at
41/ These could account for up to an additional US$10 million.

- 31 -
which time the company made an EC$894,000 profit. VINLEC has been andremains in a cash starved position with small accumulated earnings tomeet the massive investment program. Efforts to improve efficiencies ofservice and operations which are incorporated in the investment programneed to be augmented by a series of annual tariff increases at least notless than inflation rates. As of end-1982, VINLEC's debt to equicy ratiowas 18:82 after including revaluation of its assets. Total equity stoodat EC$12.1 million. With an investment program over the next five yearsin excess of four times the company's 1982 total assets, significantequicy injection will be required to ensure that the increased debtburden remains at a manageable level. To achieve this, CIDA is providingEC$9.0 million equity financing within the framework of the Cumberlandproject.
Table 3.12: ESTIMATED POWER SECTOR INVESTMENTPROCRAM, 1984-90
(USS 1983)
Item USS Million
Cumberland Hydro Scheme 13.5Rainfall and Stream Gauging Networks 0.2Upgrading of Diesel Units 0.9Power Loss Reduction Program 3.9Transmission and Distribution 0.8Managerial Services 0.9Training and Hydro Studies 0.9Water Shed Management 0.5
Total 21.6
3.40 Added to the issue of the level of the tariff is the questionof its structure. Present tariffs are based on the "accounting" approachwhich bears little relation to economic efficiency criteria for resourceallocation. To reflect this, a long run marginal cost (LRMC) tariffstudy was completed in May 1984. The mission and the Bank are reviewingthis study. The Government has agreed with the Bank to implement therecommendations of the study. Some of the issues addressed by this studyare:
(a) the need for kVA demand metering for large customers;
(b) the structure of tariffs for high and low voltage customers,especially given the current structure in which commercialconsumers pay a higher rate than domestic customers;
(c) restructuring of the fuel adjustment cLause; and
- 32 -
(d) assessment of current arrangements for setting utility tariffsand recommend appropriate modifications.
Institutional Issues
3.41 The asin institutions involved with the power sector areVINLEC, the Ministry of Communications and Works (MCW), the Ministry ofTrade, Industry and Agriculture (MTIA), and the Central Planning Unit(CPU) in the Ministry of Finance (MF). VINLEC operates under an exclu-sive license granted in 1973 for 60 years to operate aLl generation anddistribution facilities in the country as well as sell electricity. TheMCW is responsible in the area of tariffs while the MTIA regulates fuelprices. The CPU, through its Energy Desk, is responsible for overallcoordination of matters pertaining to energy as well as energy policyformulation. Given the limited skilled manpower available and the sizeof the power and energy sectors as a whole, these arrangements appearadequate. Under the framework of the Caribbean REAP, efforts are plannedto assist in strengthening the coordinating, policy formulation andmonitoring functions of the Energy Desk in the CPU. These measures areunlikely to materialize before 1985 when the REAP should be underway.
3.42 VINLEC is jointly owned by CDC (holding 51X of the shares) andthe Government of St. Vincent (49%). Arrangements have been made for theGovernment to purchase CDC's shares. When this occurs, VINLEC wouldbecome a fully owned state company. This ownership transfer has resultedfrom CDC's expressed wish to withdraw from its historical role in thepower sector in the Eastern Caribbean islands. VINLEC has 82,484 issuedshares at EC$5 each.
3.43 There are three areas which are vital to the company and forwhich special efforts need to be made to ensure that effective newarrangements are made to cover the gap that CDC's withdrawal willcreate. These are:
(a) Procurement services. Provision for contracting a procurementagent would be required and benefits could occur if this wasdone jointly with other utilities in the OECS.
(b) Engineering services. The biannual visits of a CDC engineerprovided a useful service to obtain an independent opinion andreview of current issues as welL as providing an opportunityfor referring matters if additional expertise were needed.Here, too, the possibiLity of establishing common servicesarrangements with other OECS utilities needs assessment.
(c) Training function. This has principally focussed on fieldpersonnel, linemen, etc. It is best for technical training tobe done locally by bringing in experts to work on the job withtrainees. This does not deprive the company of staff during

- 33 -
training (which would occur if they are sent abroad) and alsoenables training to be better geared to local issues (such asmetering and theft).
3.44 The major constraint is the low number of skilled personnel inthe company. This tends to result in senior management having littletime to focus on system and operational planning functions; day-to-dayoperational issues have to take precedence. Despite these constraints,the management of the company is to be commended on the way it has copedwith the rapidly deteriorating power supply over the past two years.Given the small size of the company and the country, it is difficult tojustify a level of specialist staffing which would cover aLl of VINLEC'sneeds. To address this- issue, the mission endorses the proposal in theCaribbean REAP for a regional study to assess what long-term commonservices can be provided to the OECS power utilities and through whatinstitutional mechanism this can be achieved (Annex 1). The mission isfully aware of the problems likely to be encountered in establishing sucha common services entity among the Eastern Caribbean states. However, itfeels that the potential benefits relative to the costs co each companyof "tgoing-it-alone" warrant a serious effort.
3.45 In order to address the problem of specialist and managementsupport to VINLEC over the medium term to deal with planning and tech-nical problems beyond day-to-day issues, the Cumberland project has pro-vided support:
(a) a project manager and support staff to administer the project;
(b) consultant services for providing managerial, administrative,financial and technical assistance;
(c) a training program;
(d) a specialist to assist in the implementation of the lossreduction program; and
(e) consultative services for studies related to the development ofnew hydroelectric schemes.

- 34 -
IV. BIOHASS, OTHER RENEIABLES AND CONSERVATION ISSUES
Biomass Consumption
4.1 A preliminary analysis of the recently completed CARICOM house-hold energy survey shows that in 1981 St. Vincent used about 3,600 tonnescf charcoal and 8,000 tonnes of firewood for co3king, which translates toa total national domestic demand of 63,000 m of wood or 15,000 toe.Assuming a 10Z conversion efficiency (by weight) for the traditionalearth kilns used in the country, some 46,000 n of wood were lost duringcharcoal production. These figures indicate a national deficit rangingfrom 13,000-50,000 m3 fuelwood p.a. based on yields of the unmanagedforests.
4.2 Charcoal is produced in various parts of the island but mostlyin the northern areas of Owia, Sandy Bay and Fancy. A significant pro-portion of charcoal is produced by farmers who own woodlands. There isapparently no organized collection and transport by middlemen or traders;most producers are also sellers. 42/ Pricing of charcoal is not relatedto costs or a pricing formula. In the public markets, charcoal is cur-rently sold at approximately EC$15-25 (US$5.50-9.25) per 50 pound bag(US$242-407/tonne) and EC$1.25 (US$0.46) for a tin which contains roughly1 kg (about US$460/tonne). Firewood is not sold and users simply gatherwhatever they need from nearby scrubwood. There is no information on howmuch time is spent in firewood collection but for the present this gener-ally does not appear to be a difficult task for rural households.
Table 4.1: COMPARATIVE COOKING COSTS a/
End-UseFuel Unit EC$ Unit Kcal/Unit Efficiency EC$/1,000
(kcal)
Charcoal kg 0.5-1.25 7,000 20 0.36-0.89Kerosene It 1.04 8,800 35 0.34LPG kg 2.41 10,800 55 0.41Electricity kWh 0.50 860 65 0.89
a/ Firewood is excluded as data on its prices and gathering time is notavailable.
42/ Records indicate a small export of 1-3 tonnes a year to Barbadosvalued at EC$1,000-3,000 (US$370-1,111).

- 35 -
4.3 As a cooking fuel, kerosene is probably the cheapest on a use-ful energy basis under the current pricing structure (Table 4.1). Char-coal bought by the bag, however, is comparable with kerosene. The costper useful kilocalorie increases by about 2-1/2 times when charcoal isbought by the tin and becomes comparable to cooking with electricity.
4.4 Wood is also used in the commercial (bakeries, restaurants,etc.) and industrial (mainly the sugar factory) sectors, but the amountis negligible relative to household demand. Coconut shells and husks areused in limited quantities as supplemental fuel in households nearestates where copra is processed. This is not likely to exceed 100tonnes per year. Copra drying is done in diesel-fired dryers and bydirect sun drying. Less than lDZ of copra is dried in kilns fired withcoconut residues, consuming only about 50 tonnes out of a total 930tonnes of coconut shells generated by the industry. At present, there islittle use of coconut stemwood. Despite its high potential, there aretwo major constraints to wider use. First, the charcoal produced isinferior to wood charcoal because it is lighter and fragile, and secondlyit is more difficult to arrange large-scale felling and carbonizing thenon-bearing trees.
Biomass Supplies
4.5 St. Vincent's biomass fuel resources consist of wood fromnatural forests and plantations, agricultural residues from the coconut,arrowroot, bagasse and animal wastes. Wood resources are in approxi-mately 12,900 ha of forests and woodlands, which is roughly 381 of thetotal land area (Table 4.2).
Table 4.2: ESTIMATES OF FOREST AREAS
Hectares
('000)
State ForestsPrimary Forests 1.6Secondary Forests 10.5Plantations 0.2
Private Forests and Woodlands 0-o
Total 12.9
Source: Forest Division, and Mission estimates.

- 36 -
4.6 Wood for fuelwood and charcoal is obtained from private landsand secondary forests. Population pressure, expansion of commercialagricultural lands and shifting cultivation have rapidly reduced theamount of forested areas. The leasing of smaLl areas for cultivation bylandless farmers is practiced; about 1,700 ha of land is now leased inthis manner. Due to the mountainous topography, cultivation has extendedover the slopes and mountain tops, contributing heavily to soil erosionin many places.
4.7 Historically, reforestation rates have been low, although in1980 financial assistance was provided for the establishment of 80 ha oftimber plantations in three watershed areas as part of the USAID BasicHuman Needs Program. Mostly commercial species have been planted, al-though Limited plot trials of fast-growing fuelwood species such asleucaena, eucalyptus and caliandra were recently started.
4.8 No comprehensive forest inventory has been prepared and offi-cial estimates of annual increments and rate of loss of forest cover arenot available. Assuming that the average increment is between 1-4 m3/hap.a., 43/ totai annual yields of the unmanaged forests would range from13,000-50,000 m . However, the available fuelwood supply is less thanthis figure due to the limited accessibility of the primary forests.
Fuelwood Issues
Forestry
4.9 The major issue in biomass is to ensure the adequacy of fuel-wood supplies while minimizing the deterioration of the country's remain-ing forest resources. Continued pressure for agricultural Land, combinedwith lack of control over forest encroachment and illegal cuttings, isendangering future fuelwood supplies and the protective role of theforest areas. In the north windward areas, for example, where much ofpresent charcoal supplies originate, deforestation and soil erosion onthe slopes and watershed areas are considered to be approaching criticallevels. There is particular concern in watershed areas where encroach-ment and deforestation may lead, in the longer term, to erosion problemsand siltation at hydro developments on the island. 44/
4.10 A lack of resources and institutional constraints have limitedthe ability of the Forest Division to do its normal protective functions,
43/ No official estimates are available for St. Vincent. These figuresare based on estimates for St. Lucia's forests.
44/ The Cumberland project has allocated USS500,000 for a watershedmanagement program.

- 37 -
let alone develop effective forest management procedures and establishplantations. No other indigenous energy supply couLd significantly dis-place fuelwood for domestic use in the foreseeable future. The onlycourse of action is to embark on a program co establish plantations offast-growing species and to properly manage existing forest areas.
4.11 The mission sees an urgent need to formulate a new forest po-licy for the country, and to deveLop a workable forest management plan inconjunction with an overall land use strategy. For this purpose, tech-nical assistance similar to that extended by CIDA to the Government ofSt. Lucia should be sought. A fuelwood plantation program at the rate ofabout 50 ha/yr is recommended and should be within the capability of theForest Division to implement, if appropriately strengthened. Prioritysites would be Sandy Bay/Fancy (north windward) and Richmond/WindsorForest (north leeward), where significant deforestation and soil erosionalready have occurred. Two other sites in the Crenadines (Bequia andUnion islands) should also be on the priority list, due to forest deteri-oration in these islands caused by charcoal-making, boat building andovergrazing. Some of the possible species are leucaena leucocephala (K8,K?8), eucalyptus spp and casuarina. External assistance should be soughtfor a five-year initial program to establish 250 ha of short-rotationspecies in the areas. 45/ The Forest Division estimates that the totalcost of thia activity will be about EC$2.7 million (US$1.0 million),which not only covers plantation establishment expenditures but alsoshort-term training, procurement of portable metal kilns for demonstra-tion and two vehicles. At an average yield of 50 m /ha p.a. for giantleucaena, some 12,500 m3 p.a. would be added to the fuelwood supplystarting from the fifth year. The equivalent charcoal production usingimproved kilns would be about 2,000 tonnes. The high cost per hectare ofthis initial program is justifiable onLy as an instrument for the streng-thening of the Forest Division and the potential demonstration effect ofthe managed plantation.
Charcoal
4.12 As in neighboring St. Lucia, the extensive use of charcoal(rather than wood) in this small island country where transport distancesare short makes little energy sense. The strong preference for charcoalas a cooking fuel, however, is deeply ingrained in local culture andwould be extremely difficult to change. On the demand side, efforts toreduce wood consumption should instead be directed towards: (a) dis-couraging excessive charcoal production by substantially raising thepermit fees for wood cutting which, since 1945, have remained at ECC46(USC17) per cord; (b) introducing improved techniques of charcoal-making;
45/ At the time of green cover review in August 1984, the mission wasinformed that the Government had already started discussions withCIDA and OAS for a forestry development program. Terms of referencefor these projects have been developed.

- 38 -
and (c) promotion of higher etficiency 'coal-pots.' The use of TPI metalkilns, for example, could save up to five tonnes of wood for every tonneof charcoal produced. Other less capital intensive techniques could bepromoted, such as the modification of traditional earth kilns by addingmetal linings and chimneys made out of used oil drums ('Casamance'method). Progress in the development of improved coal pots has beenreported in Montserrat and should be investigated for trials in St.Vincent. Theoretical wood savings resulting from improved wood and char-coal stoves are even larger than those from improved characoal kilns.However, stove dissemination is a much more extensive and problematicactivity than introduction of improved charcoal kilns and should beaccorded lower priority.
Interfuel Substitution
4.13 A third issue relates to the continued use of petroleum fuelsfor thermal purposes in estates where indigenous fuel substitutes in theform of agricultural residues are generated in substantial quantities.Orange Hill Estate, for example, which accounts for about half of copraproduction in St. Vincent, exclusively uses diesel-fired dryers for copraprocessing. 46/ Some 12,500 Ig of diesel oil were used for this purposein 1982 to produce about 530 tonnes of copra. Of a total industry produc-tion of 1,150 tonnes copra, it is estimated that 750 tonnes were driedusing diesel fuel (the rest by direct sun-drying and a minimal amount inkilns fueled by residues), consuming about 26,000 gallons or 86 toe ayear.
4.14 The tobacco industry uses LPG and kerosene in curing-barns.Some 70 connes of cured leaf were produced in 1982/83 which used anestimated 60,000 kg of LPC and about 8,000 Ig of kerosene, or a total of94 toe. Based on the produccion rate of coconut residues in most ofthese estates, there may be significant opportunities for economic fuelsubstitution. Available energy from shells and husks alone total 460 toeyearly, roughly 2.5 times the current annual consumption of petroleumfuels for agricultural drying.
4.15 Various well-developed biomass-based options are available.For copra drying, there are two options:
(a) retrofitting existing diesel-fired dryers with producer gassystems (e.g., the New Zealand hot air generators) fueled withraw or carbonized shells; and
(b) using steam engines fuelled by coconut residues (husks, shellsand/or stemwood) to cogenerate process heat and electricity.
46/ A prefeasibility-study -was done under the CAESP project in 1981.

- 39 -
The tobacco fuel-curing barns could be modified by replacing the gas orkerosene burners with appropriately designed biomass-fired furnaces.
4.16 The feasibility of these options should be prepared estate-by-estate. The economics will depend on production levels, Local availabil-ity of residues and the type of facilities already in pLace. Conversionprojects of this nature, if economic, should be encouraged by the Govern-ment through loan assistance and import incentives for the necessaryequipment.
Coconut Residues
4.17 Coconut residues offer a significant potential. The averageproduction between 1977 and 1979 was 7,900 tonnes of dry nuts, of which4,450 were converted to about 1,150 tonnes of copra. The mission esti-mates that 930 tonnes of shells and 2,790 tonnes of husks are produced ayear from copra processing with a combined energy equivalent of 1,050 toe(Table 4.3).
Table 4.3: FUEL POTENTIAL OF COCONUT RESIDUES
Residues Production Availability Heating Value Total
(tonnes p.a.) (tonnes p.a.) (Kcal/kg) (toe)
Shells 930 790 3,250 (30Z MC) 85Husks 2,790 1,395 - 2,700 (40% MCJ 377Stemwood _ 1,000-2,000 750-1500 3,500 (25% MC) 263-525
a/ Assumes 50% availability.b/ Exploitation rate of 1,500-3,000 trees p.a. over 5-10 years.
Source: Mission estimates.
4.18 Coconut stemwood use could increase the biomass supply by about250-500 toe p.a.. This could be obtained by organized felling of unpro-ductive trees which are about 15% of total stands in the country's 5,700ha of coconut plantations. Assuming a cycle of 5-10 years, some 1,500-3,000 trees per year could be available either for direct use or forconversion to charcoal. The potential energy yield, if used directly, isabout 250-500 toe, while Losses in charcoal production would reduce thisto 105-210 toe a year.
SuarInustrZ esidues
4.19 During 1983, the sugar factory located near Georgetown produced2,100 tonnes of raw sugar, generating in the process some 9,200 tonnes ofbagasse. The bagasse is used as boiler fuel, but is insufficient for themill's needs. During start-up, the bagasse is supplemented with

- 40 -
undetermined quantities of wood, including coconut logs. Over 100,000gallons of diesel oil also were used in 1983.
4.20 The main reason for the insufficient bagasse supply is lowfiber concent (12.9Z) in the cane varieties planted. New cane varietieswith at least 14Z fiber are now planted and are expected to improve thebagasse fuel situation in subsequent milling seasons. However, due tothe mill's small size (30 tonnes/hour of cane grinding rate), it isunlikely that investment for producing excess bagasse for export electri-city generation would be economic. A recent Bank study 47/ concludedthat for a "typical" sugar mill, capital investments for increasingbagasse production such as flue-gas bagasse dryers, higher pressureboilers, pre-evaporators, etc. can only be economic if the grindingcapacity of the mill is at least 100-150 tonnes cane per hour. However,it obviously would be beneficial for the mill to pursue specific energyconservation activities that could reduce the consumption of diesel oiland other supplementary fuels but which do not require major capitaloutlays.
4.21 About 300,000 gallons of moLasses by-product has resulted sofar from the mill's 2-3 year's operation. The molasses is currentlystored and is intended to be used as raw material to produce potablealcohol in an expanded distillery near the mill scheduled for 1984.
Biogas
4.22 The livestock population in the country is relatively small andhas remained fairly constant in recent years (Table 4.4). Manure genera-tion is estimated at 80 tonnes p.a. 48/ Converted to biogas, the theore-tical energy potential is only about 1.7 toe. The Diamond Farm, withabout 50 cattle now and intending to expand to about 300 heads, may bethe only place where the installation of a manure-based biogas digesteris worth considering, primarily as a waste disposal/fertilizer productionoption and only secondarily for its potential fuel benefits.
4.23 The arrowroot industry has some potential for biogas produc-tion. Starch recovery operations in the country's five major plants gen-erate enough cellulosic wasce material or "bittie" that is suitable forbiodigestion. A CDB-financed laboratory study in 1981 to determineanaerobic digestion parameters for "bittie" showed that between 300 and
47/ "Identifying the 8asic Conditions for Economic Generation of PublicElectricity from Surplus Bagasse in Sugar Mills", 1983.
48/ Excluding goats and sheep manure. for which there is littLebiodigestion experience.
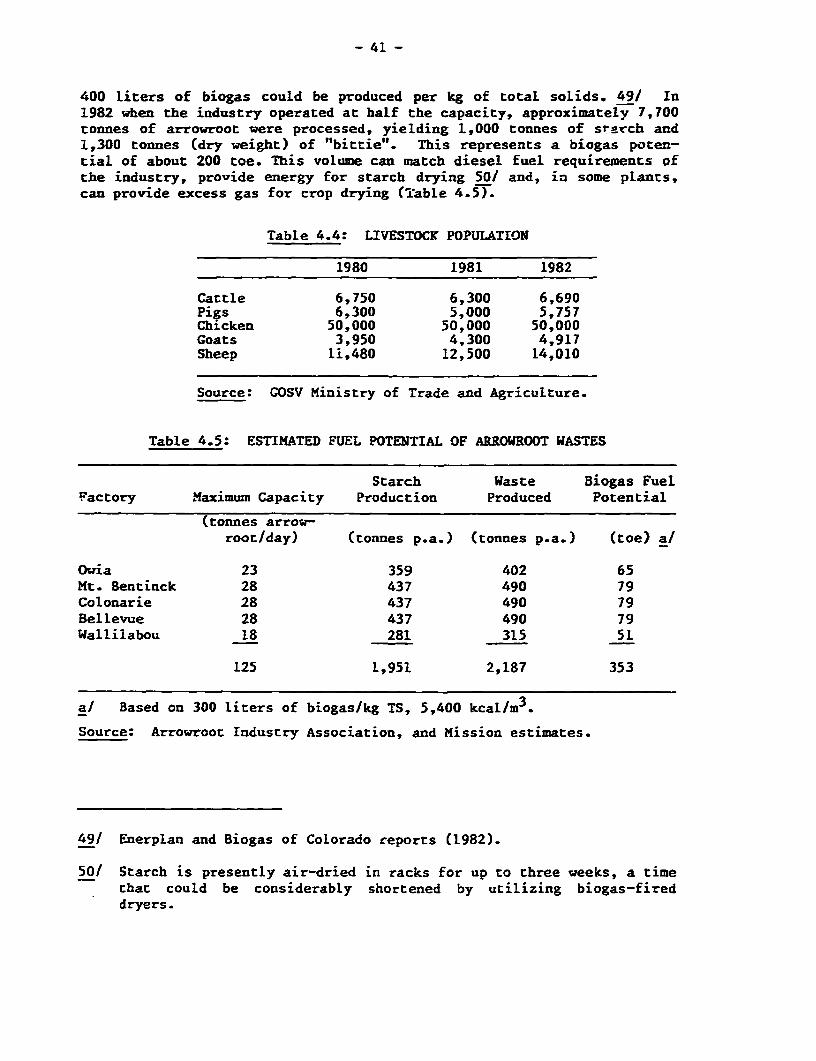
- 41 -
400 liters of biogas could be produced per kg of total solids. 49/ In1982 when the industry operated at half the capacity, approximately 7,700tonnes of arrowroot were processed, yielding L,000 tonnes of srarch and1,300 tonnes (dry weight) of "bittie". This represents a biogas poten-tial of about 200 toe. This volume can match diesel fuel requirements ofthe industry, provide energy for starch drying 50/ and, in some plants,can provide excess gas for crop drying (Table 4.5).
Table 4.4: LIVESTOCK POPULATION
1980 1981 1982
Cattle 6,750 6,300 6,690Pigs 6,300 5,000 5,757Chicken 50,000 50,000 50,000Goats 3,950 4,300 4,917Sheep 11,480 12,500 14,010
Source: GOSV Ministry of Trade and Agriculture.
Table 4.5: ESTIMATED FUEL POTENTIAL OF ARROWROOT WASTES
Starch Waste Biogas FuelFactory Maximum Capacity Production Produced Potential
(tonnes arrow-root/day) (tonnes p.a.) (tonnes p.a.) (toe) a/
Owia 23 359 402 65Mt. Bentinck 28 437 490 79Colonarie 28 437 490 79Bellevue 28 437 490 79Wallilabou 18 281 315 51
125 1,951 2,187 353
a/ Based on 300 liters of biogas/kg TS, 5,400 kcal/m3.
Source: Arrowroot Industry Association, and Mission estimates.
49/ Enerplan and Biogas of CoLorado reports (1982).
50/ Starch is presently air-dried in racks for up to three weeks, a timethat could be considerably shortened by utilizing biogas-fireddryers.

- 42 -
4.24 A demonstration biogas plant with about 500 m3/day capacity isplanned for the Wallilabou factory under the CDB/CATE Regional Biogas Ex-tension Program. The mission supports the objectives of this activity.Experience with the piLot facility should provide a firmer basis fordeciding whether "bittie" use as a fuel could reduce production costs andhelp the recovery of this ailing industry.
Solar and Wind Energy
4.25 At present there are no significant solar or wind energy acci-vities in the country. A solar water heater has been installed atKingstown Hospital and some solar stills are reportedly in use in PetitSt. Vincent. A number of demonstration projects for the Grenadines(Bequia, Union and Canouan islands) have been proposed for OAS grantfunding. These proposals are primarily relevant to the fishing industryand to a limited extent to water and electricity supplies. They includenatural-convection solar food dryers, wind-powered cold stores, windpumps, wind turbines up to 50 kW, and solar stills for converting brack-ish water to potable water. Although potentially useful. the applica-tions are small and will have little impact on the national energypicture.
4.26 St. Vincent is also one of the six countries slated for re-source measurements in the second phase of the Caribbean Regional Windand Solar Energy Assessment and Wind Energy Demonstration project pro-posed by the CDB for 1984. Results of these measurements will be usefulin determining the potential contribution of wind and solar energy to thecountry, and in pinpointing suitable sites for large-scale applications.
Energy Conservation
4.27 The major energy conservation measures recommended by themission essentially cover two "supply-side" areas: (a) the power trans-mission and distribution loss reduction programme, and (b) the efforts toimprove the efficiency of charcoal production. In this latter case,these measures would have an impact on reducing wood use to produce char-coal consumed in the household sector. The mission visited major energyusers and reviewed some energy audit-; previously undertaken by the CAESP.The mission's conclusion is that, other than the above two conservationprogrammes, energy conservation opportunities are limited by severalfactors:
(a) the stock of equipment in many companies in the country is old,and consumers cannot afford the high costs needed to replaceit. However, replacement of old equipment is vital on groundsof productivity, quite apart from energy conservation, thoughit is not undertaken because of the poor financial state ofindustries;
(b) due to the serious electricity suppLy problems, investments inincreasing supply security are of high priority due to the highcost associated with lost production; and

- 43 -
(c) there are only a few large energy consumers, most are small anddispersed where an investment program in energy conservationwould be difficult to implement and less attractive.
The mission visited a number of establishments to identify if any poten-tial energy conservation opportunities (ECOs) existed in the variouseconomic sectors. The mission's findings were:
4.28 Tourist Sector. Air conditioning, lighting and refrigerationare the most important end-uses of energy in hotels. Only one third ofthe 40 hotels and guest houses have air conditioned rooms. Moreover, thehotels are small (less than 30 rooms), with electricity consumption vary-ing from 1,000 kWh per year per room in modest hotels to 9,000 kWh inthose with air conditioning. There currently appears to be little enthu-siasm to implement an energy conservation program.
4.29 Commercial Sector. This sector consists principally of smalloffices and shops, with lighting being the major use of energy. Energycosts make up only a small proportion of total expenditures and thereforethere is Little knowledge of or motivation for energy conservation.
4.30 Industry. This sector is dominated by the East Caribbean FlourMill, consuming about 60Z of all electricity in the sector. The sugarfactory is also a major consumer, accounting for roughly 70X of dieselconsumption. Both firms have started some conservation activities. In1983 the sugar factory installed an air pre-heater for the boiler, cost-ing EC$500,000 (US$185,000). This investment has paid for itself in thesame year by halving diesel consumption. The flour mill purchased acapacitor bank for power factor correction. The larger and newer firmsappear able to take energy conservation measures by themselves, but thesmaller firms, with low energy consumption, are reluctant.
4.31 Government Sector. The Government is a large consumer ofelectricity (using more than 1.5 million kWh), mainly for air condition-ing and lighting. These are excellent candidates for energy conservationefforts. An energy conservation project for government buildings wouldset a good example, especially when accompanied with the proper publi-city. The mission recommends that the Government develop an energyconservation program gor buildings, together with a publicity campaign.For this purpose, a small steering group should be formed consisting ofthe energy officer in the Central Planning Unit and personnel who areresponsible for maintenance of air conditioning and lighting in govern-ment buildings. Responsibility for the entire program should be concen-trated in one location. At present, maintenance of air conditioning andlighting are the responsibility of two different departments. Consoli-dation of the two services should be considered.
4.32 Transport Sector. In St. Vincent, the transport sector is thelargest consumer of commercial energy. Most energy conservation measuresin transport are effective only in the medium- and long-term. In theLouger term, infrastructural measures (road maintenance, repair and
- 44 -
construction), transport planning and mode shifts (towards public trans-port) should be considered. In the medium term, attention should be paidto the stock of vehicles. A positive development is the choice forsmall, energy-efficient vehicles. Fuel taxatiou and import duties couldreinforce this trend. Finally, maintenance is of great importance.Obligatory inspection 51/ and improved training of car mechanics arelikely to be effective measures.
Institutional Issues
4.33 The recommendation made to establish short-rotation fuelwoodplantations and to intensify forest management activities in order toincrease sustainable yieLds imply the adopcion of measures to institu-tionally strengthen the Forest Division and to substantially increase theamount of resources allocated to it. Due to the long-term nature offorestry work, it has perennially ranked low in the allocation of govern-ment resources. The result is a poorly motivated and inadequatelystaffed Forest Division that appears unable to cope with even the basicresponsibilities formally assigned to it.
4.34 The CDB is currently financing a regional study of the forestrysector. This should provide evidence on the crucial nature of forestmanagement in the Caribbean island economies. To ensure adequate fuel-wood supplies without jeapardizing the country's ecological future is acontinuing priority task that requires an appropriately supportedforestry group. The mission strongly recommends that the Governmentimmediately review the condition of the Forest Division with a view todetermine appropriate measures needed to strengthen it institutionally,as well as to identify the type and magnitude of resources required.
51/ The current inspection program only covers the issue of roadworthiness and should be expanded to include fuel efficiency aspectsalso. The mission recommends that the proposed CAESP transportstudy evaluate the merits of such a program.

- 45 -
Annex 1Page 1 of 8
A. Regional Issues: Petroleum Supply Arrangements
Regional Petroleum Study - Terms of Reference
Title: A Regional Study of Petroleum Product Supplies, TankerSize, Transportation and Storage in the Caribbean.
Objective: To review the existing systems, and develop and recomenda least-cost 51/ regional strategy with regard to secu-rity and continuity of supplies, tanker size, transporta-tion logistics and storage facilities for petroleumproducts of appropriate quality over the medium and longterm in the Caribbean. 52/ The study will be done in twophases.
Cost: Phase I - Approximately US$50,000Phase II - Approximately US$70,000
Funding: Phase II - to be determined.Phase I - UNDP Caribbean Regional Petroleum Exploration
Promotion Project
Introduction
1. The current pattern of petroleum supply and distributionevolved during the pre-1973 era when oil companies competed for largershares of an expanding petroleum product market. To meet the require-ments of this project scenario, large investments were made in refinerycapacities, tankers and storage facilities. This was the appropriatestrategy at that time because of the high profit margins associated withcrude oil production. However, with crude production passing from thehAnds of the multinationals to the oil producing countries in 1973 andthe oil price increases of 1973 and 1979, the outlook has changedradically. Many refineries are operating well below optimum capacity.The increased product demand growth pattern has changed, and marketingoverhead costs have increased. The Caribbean Region has been noexception. Indeed, several features of the regional mode of operatingexacerbate the situation:
(a) refining capacity which is ill-adapted to present demand;
(b) high freight costs as compared with world standards;
51/ Subject to security and continuity-of-supply objectives.
52/ A sub-option for the Eastern Caribbean CARICOM countries also needsto be evaluated.
- 46 -
Annex 1Page 2 of 8
(c) inappropriate petroleum product pricing and taxation policies;and
(d) high marketing costs in small country economies.
Study Objective
2. The principal objective of the study is to develop a least-coststrategy for the suppLy and distribution of petroleum products of appr-opriate quality over the medium- and long- term in the oil-importingcountries of the Region while maximizing the economic utilization ofexisting facilities and infrastructure and recognizing the need forsecurity and continuity of supply.
Methodology
3. The consultants will be required to specify the methodologywhich they intend to use. This should be justified based on its advan-tages over other methodologies. Weaknesses should also be clarified.The framework should include an analysis of the costs and benefits of themain study recommendations and should facilitate sensitivity analysis ofthe least-cost solution, both to variations in critical parameters and toadjustments reflecting other objectives such as security and continuityof supply, and political, social and economic factors within the variouscountries in the Region. These conditions are essential to developing arobust and realistic set of recommendations with regard to the least-coststrategy for the Region.
Scope of Work
4. The consultants should develop a detailed picture of existingpetroleum product supply and distribution in the Caribbean region,including in particular:
(a) infrastructure
refineries - review of configuration, capabilities, capa-city utilization and reliability;
port facilities - review of draft limitations and tankerloading and unloading facilities and actual performanceincluding documents;
storage capacities - review of storage capacities byproduct (including crude), company and country, and ofcurrent fuel inventory management practices; and
product handling facilities - review of product and crudepipelines, transfer pumps, utilities and relatedinfrastucture.

- 47 -
Annex 1Page 3 of 8
(b) transportation
- review of ranker characteristics (including bunker con-sumption and cost), scheduling and actual performance;
- review of role of chartered versus oil-company-ownedvessels;
- review of freight rates by product, tanker size, oilcompany, and country served;
- estimate of freight costs based on current tanker schedul-ing, inventory practices and storage capabilities; and
- in reviewing che existing transport system, the consul-tants should develop estimates of the freight costs forsmall cargoes being delivered on a single versus amultiple-destination bas.s. Since the current systemoperated by the companies is multiple-destination, thedifferential between these cost estimates and those forthe single voyage mode would provide an indication of thesavings of the present mode compared to the singlecountry, single voyage option.
5c) supply
- review the existing petroleum product supply patterns tothe market area in question from the refineries in thefollowing terrritories:
ArubaCuracaoTrinidad (Port Fort in and Point-a-Pierre)MartiniqueBarbadosAntiguaVenezuela
- this review should highlight: which petroleum products(in what amounts, at what frequencies and prices) aresupplied from each of the above refineries to theindividual demand centers; and associated risks ofstockouts.
(d) demand
- analysis of demand by product, company and country; reviewof marketing margin and description of distribution sys-tem; identification of interfuel competition; and reviewof petroleum taxation and supply security policies.

- 48 -
Annex 1Page 4 of 8
5. In the light of the data gathered under 4, the consultants shouldexamine each part of the regional product supply and distribution systemto pinpoint areas where costs are unusually high and where inefficienciesappear to exist.
6. Regarding refineries in the Region, the consultants need notundertake an independent examination of their technical configuration,operational efficiency, or source of the crude supply, as these mattersare outside the scope of this study. The consultants should, however,include in their analysis potential efficiencies or cost savings in theexport destination of refinery output, if any, in excess of domesticrequirements.
7. Regarding product transportation and storage, the consultantsshould examine the benefits/costs of constructing a centrally-situatedproduct transshipment terminal to enable large cargoes to be moved fromsupply centers, with smaller tankers being routed from the terminal totheir ultimate destination, particularly in the case of LPG where trans-portation costs amount to up to 40% of final product cost. The consul-tants should propose an efficient system of tanker scheduling to minimizefreight costs based on optimal inventory levels and associated storagecapacities. The consultants should also examine ways to achieve ration-alization of marketing and distribution, particularly in the small islandeconomies, in the light of freight rates for movement of crude and pro-ducts to the Region and between the countries of the Region. The consul-tants should indicate the potential savings from adopting their proposedleast-cost mode of supply over the current system. In determining theoptimal mode the consultants need to assess the costs/benefits of usinglarger tankers (given port limitations in certain destinations), movinglarger cargoes to each island, on a multi-destination basis, more infre-quently, and hence maintaining higher inventories on each island.
8. Regarding market demand, the consultants should formulateappropriate petroleum pricing policies reflecting economic costs ofsupply, incorporating inter-fuel substitution and energy conservationobjectives and including an assessment of the impact of petroleum producttaxation and import duties and fees.
9. Based on the data gathered and analysis undertaken as above,the consultants should formulate the least-cost option for supply anddistribution of petroleum products to each country in the Region con-sistent with security of supply. The study recommendations should con-sist of an action programme, on both a regional and individual countrybasis, to achieve the least-cost allocation objective, incorporating bothshort- and longer-term adjustments to the supply, transport, distributionsystems and without threatening reliability of supplies to the area.
Reports
10. The study is expected to take not more than 20 man-weeks over aperiod of 3 calendar months.

- 49 -
Annex 1Page 5 of 8
11. Not later than one calendar month after commencement of thestudy, the consultants should submit to the Bank for comment an interimreport smmanrizing the results of the data gathered by them under para. 4above, the main issues identified to that point, and a preliminary indi-cation of the overall scope and contents of their final report.
12. Not later than two and one-half calendar months after commence-ment of the study, the consultants should submit to the Bank a draftfinal report for review with the Bank. The Final Study Report should be?roduced within two calendar weeks from concluding the review.
13. Throughout the study period, the consultants should maintainregular contact with Bank staff in Washington, D.C., and with CaribbeanDevelopment Bank staff in Barbados (where the consultants are expected tobe based during the study period), submitting monthly progress reports toeach. They should also ensure that all meetings with Government and oilcompany representatives are arranged by Bank or CDB staff on the basis ofan agreed advance agenda.
Composition of Study Team
14. The Study team should consist of two or three specialists,including a supply and transportation specialist, and a petroleum market-ing analyst.
B. Common Services for OECS Utilities
Title: Feasibility Study for Prodiding Common Services for LDC PowerUtility Companies and Enhanced Cooperation Amongst CARICOMUtilities
Objectives: The overall objectives of the study are:
(a) to review current arrangements in the LDC power utilitycompanies in the areas of operational, and financial systemplanning, training, technical and financial management andprocurement services;
(b) to propose how these requirements can best be met so thatwhatever corporate arrangements are recommended are self-financing; and
(c) to assess the role, if any, which the larger utiLity companiesin the region can play towards meeting these objectives, aswell as in enhancing cooperation amongst CARICOM utilitycompanies.
Cost: Approximately US$80,000 - 100,000.

- 50 -
Annex 1Page 6 of 8
Terms and Scope of Work:
15. There is a need for strengthening the areas of planning, train-ing, technical and financial management and establishing planned mainten-ance programs in the power utility companies in the region, especially inthe Lesser Developed Countries 53/ (LDC's). In recent years, a deteri-oration of service, including electrical outages and extensive load shed-ding, has occurred due to financial, technical and managerial problems.Tariff increases have been prevented from keeping pace with increasedoperating and financial costs; as a result, maintenance programs anddevelopment plans have suffered. The very high incidence of power systemlosses (especially non-technical losses) is but another symptom of thisdecline. Some of the large utilities in the region have enough tech-nical, financial and managerial resources to enable them to address someof these issues. This is, howevpr, not the case in most of the smallerutility companies in the LDC's and the situation may worsen with the ex-pected disengagement of the Commonwealth Development Corporation (CDC)from their shareholding and management involvement in those EasternCaribbean utilities 54/ where they operate at present.
16. In general, the agreements between CDC and the utilities inwhich it owns controlling interest cover two main areas:
(a) General Agent - under which CDC provides technical and otheradvice as needed and reviews the management of the company. Inaddition, important training functions of technical and finan-cial personnel are undertaken.
(b) Buying Agent - CDC procures plant, machinery and equipment onbehalf of the utility and examines all shipping documents re-lated to purchases.
17. The first task of the study team therefore is to review currentarrangements in each of the LDC utilities in the areas of operational,system and financial planning, training, technical and financial manage-ment and procurement services. Specifically, operations need to be re-viewed from the standpoint of the adequacy of current arrangements andthen areas identified which are amenable to a common services approach,focusing on the costs and benefits of pursuing such a path. The studyteam in this context should focus on the following, inter-alia:
(a) Training - especially of technical personnel;
53/ Antigua/Barbuda, Dominica, Grenada, Montserrat, St. Kitts/Nevis, St.Lucia, St. Vincent (the OECS countries), and Belize.
54/ Montserrat, St. Lucia and St. Vincent.
- 51 -
Annex 1Page 7 of 8
(b) Engineering - the role of a small engineering service group;and
(c) Procurement - possibility of common procurement agent.
18. The study team would need next to assess what role, if any, thelarger utility companies in the CARICOM region could play towards sup-porting the provision of common services.
19. The study team will work closely with the CARICOM utility com-panies and Governments in undertaking this work; the team should consistof about three specialists: a power engineer, financial analyst, and anorganizational specialist.
20. The principal objective of the study is to propose how therequirements, defined, above can best be met so that the corporatearrangements recommended, if any, will be self-financing.
Specific Tasks
21. In summary, some of the specific tasks to be undertaken in thestudy include:
(a) Review of the corporate management control exercised and thecommon service provided by CDC in those utilities where it hasequity interests and management control. Undertaking a similarreview for those LDC utilities in which CDC does not operate.
(b) Determine the degree to which these requirements will changeafter CDC's withdrawal.
(c) Review current management procedures, technical and accountingcapabilities in those OECS utilities in which CDC does not holdequity interests and assess those areas in which capabilityneeds to be strengthened.
(d) Assess what actions and policies would need to be instituted tostimulate private sector interest in acquiring some equity inthe power utility companies, as well as in any new regionalcommon services corporation.
(e) Assess the common services which any new regional corporatebody would be expected to provide, inter-alia:
- appointment of agents for the supply of spare parts andother commodities f.om overseas suppliers;
- provision of and arranging for engineering services asneeded;
- assistance for the utility companies in assessing theirtraining needs, preparing programs to fulfill those needs,

- 52 -
Annex 1Page 8 of 8
arranging training courses regionally and extra-regionally,and monitoring the results of such training;
- advice on management, engineering, financial and accountingmatters; and
- assistance in preparing capital development programs.
(f) Propose the type of regional organization required to cater tothese requirements and recommend the measures needed to estab-lish such a body incLuding its consitution, control, financing,staffing and contractual relationships with the power com-panies.
(g) Prepare estimates of the operational budget for such an entityfor the first two years of its existence.
(h) Assess the extent to which the organization could solicitassistance, on a cost-of-service basis, from other, largerpower companies in the region.
C. Petroleum Pricing Specialist
22. One man-year of advice and assistance to the Eastern CaribbeanIsland covernments on a reginal basis to set up a petroleum pricingmechanism.
Scope of Work:
23. Will work closely with the ministries/departments responsiblefor petroleum prices/policy. Main tasks would include review of domesticenergy pricing structures, pricing policy in relation to development ofindigenous energy resources, and preparation of guidelines and developinganalytical ability in the ministries/departments establishing petroleumpricing policy and montoring systems. Terms of reference cover:
(a) development of strategy and guidelines for monitoring andreviewing domestic energy prices;
(b) economic evaluation of energy project proposals or options; and
(c) training of local counterparts in energy pricing and monitoringmethods.

- 53 -
Annex 2Page 1 of 3
Table 1: ST. VINCENT ELECTRICITY STATISTICS. 1977-82
1977 i978 !979 :980 981 '982 Growth
( a.a.)Gross Generation (GWh) '8.62 22.22 24.60 25.75 26.26 29.03 9.3
Diesel (GWh) iO.24 12.22 14.92 15.73 15.75 18.00 11.9Hydro (GWh) 8.38 9.92 9.68 10.02 10.51 11.03 5.6
Fuel Consumption ('000 Ig) 652.2 '97.5 950.3 970.8 1028.9 1152.2
(kWh/Ig) i5.7 5.3 !5.7 16.2 15.3 15.6
Maximum Demand 1MW) 4.11 4.75 1.89 4.66 5.0' 5.52 6.1
System Load Forecast (%) 571.7 533 57.4 63.1 64.3 60.0 -
Own-Use (GWh) a/ 0.47 0.55 0.62 0.64 0.66 0.65 --
1% Gross Generation) 2.5 2.5 2.5 2.5 2.5 2.3 --
Line Losses (GWh) 2.97 3.92 3.90 5.46 5.20 6.60 18.2(% Net Generation) 16.4 18.2 !6.2 21.7 20.3 23.3 __
Final Sales (GWh) 15.18 17.67 20.09 19.65 20.40 21.78 7.5
Domestic 7.64 8.05 8.76 8.93 9g 7 9.97 5.5
Commerciai 5.95 6.74 7.11 7.11 7.60 7.97 6.0
Industrial 1.26 2.58 3.91 3.23 3.24 3.44 22.2
Street Lights 0.32 0.31 0.31 0.39 0.39 0.40 4.6
a/ Includes station service and office use. Utility's own use was previous!y estimated
at 5%. Actual value ;n 1982 was 2.25% of gross generation. Losses for Drevious years
have been revised isrng an estimate of 2.51 of gross generation.
Source: VINLEC and Adair and Brady (Power Transmission and Distribution LOSS Reduction
Stud y).

- 54 -
Annex 2Page 2 of 3
Table 2: ST. VINCENT - POWER GENERATING CAPACITY, 1983-90(kW)
Number Nominal Firm a/Station/Unit Type of Units Capacity Capacity
(A) Existing PlantSouth Rivers Hydro 3 870 700Richmond Hydro 2 1,100 500Cane Hall Diesel 3 3,650 3,300K.bngstown Diesel b/ 4 2,075 900Cane Hall Diesel c/ 3 1,800 1,800
Total VINLEC 15 9,495 7,200
Captive Plant d/ 13 1,800 1,500
Total ExistingPlant 28 11,295 8,700
(B) Future PlantCane HallNo. 4 Diesel L 2,900 2,900
Cumberland(1987/88) Hydro 5 3,370 2,335
Total FuturePlant 6 6,270 5,235
a/ Power plant peak output realizeable at any time. Basedon maximum continuous output for hydro, and for olderdiesel plant maximum output less than nominal rating.
b/ Due to the state of the units at this station, annualavailable energy cannot be expected to be better thanindicated.
c/ This represents 3 x 600 kW Cummings diesel unitsinstalled at Cane Hall in January 1984, essentially forpeaking duty use.
d/ Estimated by VINLEC, some of these plants not connectedto the grid.

- 55 -
Annex 2Page 3 of 3
Table 3: ST. VINCENT - POWER CAPACITY BALANCE, 1983-1990
(kW)
8983 1984 .985 1986 1987 1988 1989 1990
1. System Demand (kW) 5.500 5,700 5,800 6.000 6,100 6.300 6,4W 6,600
2. Existing Plant
(l3 HydroSouth Rivers 700 700 700 700 700 700 700 700Richmona 500 500 300 500 500 500 500 500TOtal Hydra a/ 1,200 1200 1,200 .200 1.200 1,200 i,200 1,200
(b) DieselCane Hall bI 5,100 4,200 5,100 5,100 5,100 5,100 5,100 5,100Kingstown cJ 900 900 900 900 900 500 -
Total Diesel 6,000 5,100 6,000 6,000 6,000 5,600 5,100 5,10
3. Future Plant
Cane HalI(No.4) Diesel - 2.900 2.900 2,900 2,900 2,900 2,900 2,900
Cumberland (Hydro) dl - - - - --- -- 2,335Total Future Plant - 2,900 2,900 2,900 2,900 2,900 5,235 5,235
4. Firm PeakingCapacity (2+3) 7,200 10,100 9,200 10,100 10,100 9,700 11,535 11,535
5. Reserve Require-ments e/ 1,800 3,500 3,500 3,500 3,500 3,500 3,500 3,500
6. Safe Plant
Capacity (4-5) 5,400 6,600 5,700 6,600 6,600 6,200 8,035 9,035
7. Balance (6-1) -100 4900 -100 .600 *500 -100 +1,635 +1,435
a/ Based on the firm (dry season) capecity of the run-of-the-river plants at South Rivers
and Richmond.
b/ Units I, 2 and 3 at Cane Hall with available capacities of l,100, 1,200 and 1,200 kW.respectively. P fter 1985, available capacities are 3 x 1 ,100 kW. In 1983, 3 x 600 kcW
diesel sets installed.c/ Kingstown station ret;red in 1989.
d/ Based on the firm cont;nuouS outDut (2,335 kW).
e/ Reserve defined, solely for the purposes of consistency with IDA Appraisal Report
No. 4854b-SV (Aprii 1984), as the largest Ciesel unit and the largest Richmond hydro
unit.
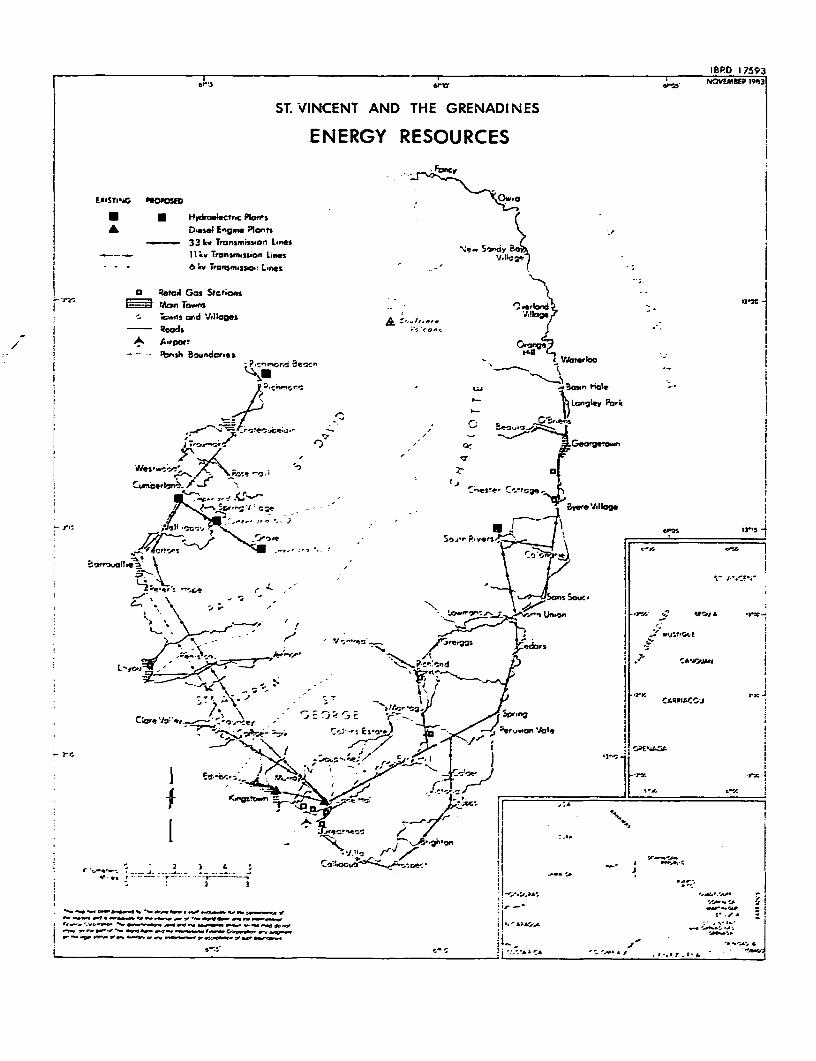
t BRD I 7S936rs . NO V10EMB|ER 1963
ST. VINCENT AND THE GRENADINES
ENERGY RESOURCES
* * ~~~HydrooNcCinc Plan-%f * ~ ~~Dl Engw Plants -
--33 kv Tronimiss on L-nes Soci_~~~~~I v Tronsm.ssion Linfe*cr¢ _ _ _ ~~~ 6 frv Tr .31g)n: Lines- f
! O~~~~ Retail Gos Stctions }-
i ra. =1 tJlion Tos -M _swTc.ns ond Jeltogs ; o' .4
/ i ^ ~~~~~A.por! rm7<
t -t ~~~~ ~~ - rch ou 0ndarm s Beach t INtgk
¢ §> c -r sr 5 * J; ^3cs~~~~~~~~~~~~~~~Bon hate--
r /J s~~~~~~~~~~~~~~~~~~~~~~~~~~~~~~~Lcn-ley Pcor&
j ru| eflPA ~~~~~~~~~~~~~~P~~~ > ~/fe.7 J 5
; s$¢ X _ t-eSte f t:!5 ,s& r~~~~~~
! ~~~~~: ro c-sja -- ' ,r.llo
l rlz ^.ts1l '5G5',-ffi ' ffi ffi _71; . tr5 %rI.onlicl-
r t, 7 0-: w t i\rn2
5Er51119- , l ~Cb rnltc,ng - -
-- -G \S n oc

8|8 80- 2
U.S.A. A&AMIAVA
.4 ~ u ~ GREAr ABA CO I-24' G tJ d, r fErASC
s ELEUrHERA I *
AANDROS IS. CArT S A
cr Eumm . RqwAYIWArlJMS IS. X J CO OW CLSLAVW
C ACAI- ISLA/
..- CAJCOS ned
PtNOS C& 6 7 AWASU.4 i N. LWISIS.
4C,~~~~~~~~~~~~~~~~~~~~~~~~~,
CAYMAN iS HAITI t>DOMINICAN
-: - JJ*MAICA \ REPUBLIC
/ ~~~~~~~~~~ ~~~JAMAICA . Sn0-
</GUATEMALA ,,,,'Pr -- "-
J £ HONDURAS 7,A o NI
X, ~ ~ ~ ~ ~ ~ ~ ~ ~ ~ ~ ~ ~ ~ ~ ~ ~~~~~t
,EL -,%,_ t v- ~~~~Pt Caotxrs \SALVADOR)> e --
NICARAGUA -
8b.fi.td! - wX An 1. ,E/
-' C r I 't-'COSTAPt L-.on
RICA * t
r -~~~~~~~~~~~~~~~~~~~~~~~~~~~~
~~~ Pr Aoea N , N. V
C C L O M B
Trnsp WM 1. e,. VrSpwd bV f MbWe B"f*' sirf Oelkmbr Ir VWcne*tv arofww scm ancr emkm lrw hr Ibr us of Vft vm8rnk Ihr hll*Fonc Cwbm rwta dow_m ued &a VW bhXan ow an Afa mimeo dnotr,w. en1~ ins pt of Tn1 VVdr 0d mrW _r Fgnne Comatwsis &nrAmrs7
an M& oft NW awn s1Mta or SW &-dr_r, or aecaosncr of suo_88e so, 7 'I2e
@ _ j _ . I/ _k._

I BRD 1780072 64- 56- JANUARY 1984
o9 EASTERN 24-
CARIBBEAN REFINERIESAND TRANSPORTATION ROUTES
I4Uf#l%I .L48A,0ooo REFINERIES WITH CAPACITIES IN BARRELS PER DA1TANKER SAILING DISTANCES IN MILES
AS4t -* INTERNATIONAL BOUNDARIES
CAICOS and
O 1i0 200 300 40 500 KIlOETR
HAITI ' DOMINICAN SAAnLA I. 6 IOD 200 300 MILES7hVMAS I- Ai&LA.2 REPUBLIC 48000 Puertok .I 000
sonrtv La RRo m-84HO Do ned = L Ln llo Ricok 1103,000 J .-- 4l7/ I-'istr f 77 A I
i,- V73EAR4-^', 7-
N6 57S r- L/4
;~ 'j* -- .v-MARME t 16@-
- - '--- '- -- , . .SrVIACENT
BaWRE I~~~~~~ I
/ ~ ~ ~ ~ ~ ~ ~ ~ ~ ~ ~ - -- k3esZxoMARGAR~A L ~ TRINIDAD AND TOBAGO I
/ - Jl ~~~~~~~3Z5,000:AL283 7oo Puerto Ia Cruz
1 - _~~~~~~~~~~~~~~~~~~~~-
/'1. R r / . ' a~~~~~~~I. 4\~~~~ ~ ~~~~~~~~~~~~~~~~~~~~~~~~ C
Georetown°
\ \ V E N E Z U E L A \ & Everton Pooriba StLourent
\L , _ - C- (-{r
N- (.Z J ( ~< SURINAME
L 0 M B I A t -=
I … -~ 1\ _/B R A Z I L
72° 64 56