Embed Size (px)
Citation preview
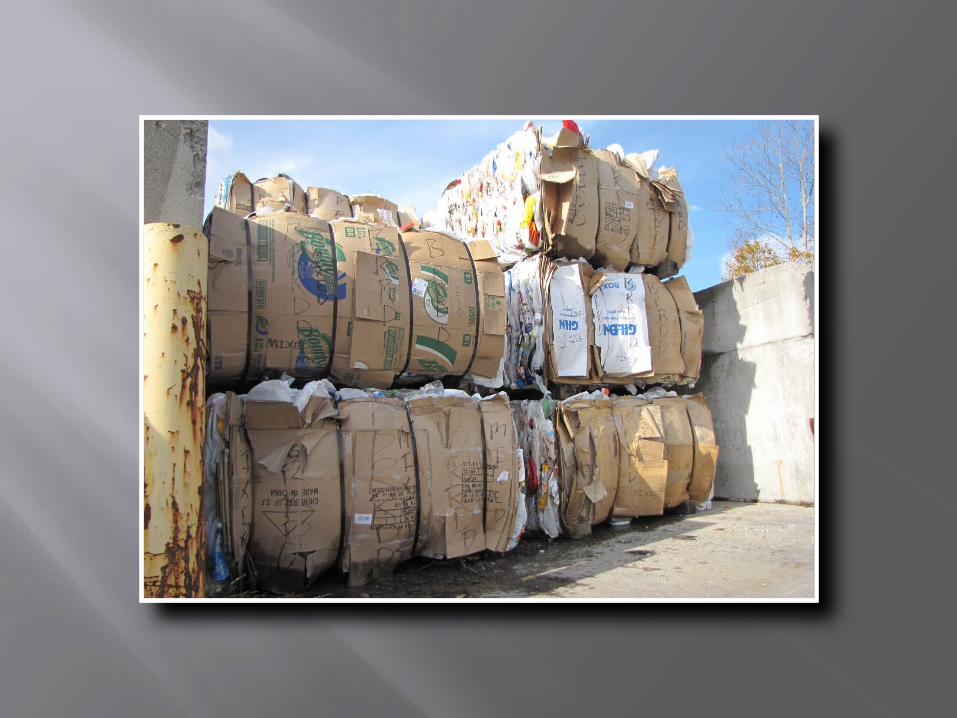
Maine Waste Composition Study
Discovering Resources in Maine’s Trash

Background
Project began in Summer of 2011
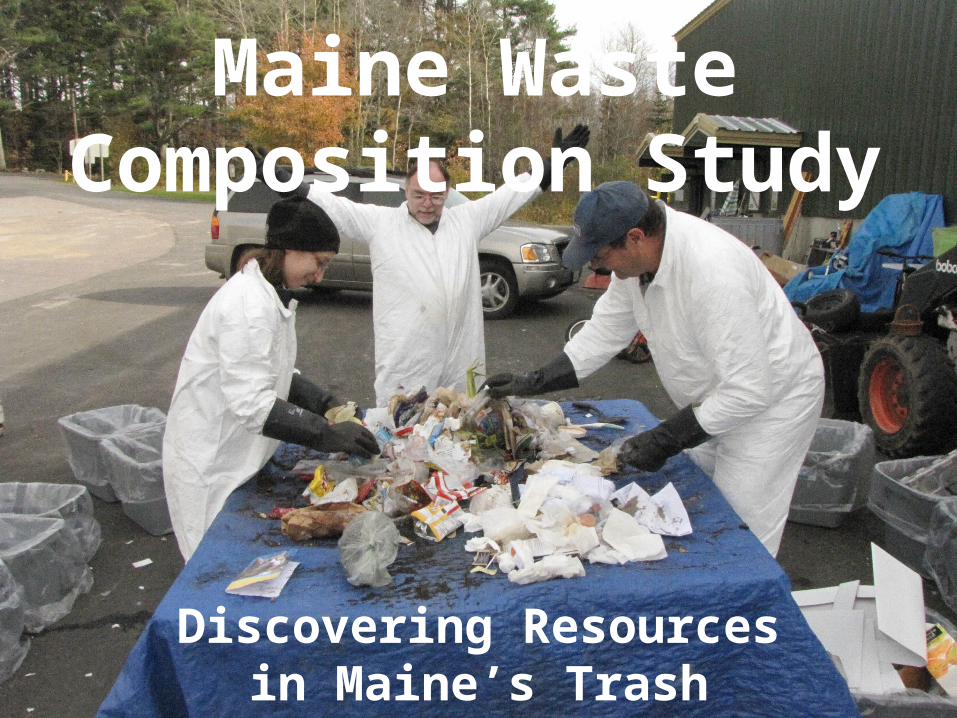
Sampled waste of 17 municipalities and regional transfer stations twice each
Looked at both composition of waste along with method for recycling and waste stream
Only sampled residential “baggable” waste
Municipality/Facility Approximate 2010 Service Population County
Bath 8,514 Sagadahoc
Boothbay 3,120 Lincoln
Central Penobscot (Dexter area) 6,531 Penobscot
Hatch Hill (Augusta region) 41,326 Kennebec
Houlton 6,123 Aroostook
Lincoln 5,085 Penobscot
Lisbon Falls 9,009 Androscoggin
Mid Maine (Corinth region) 9,306 Penobscot
Ogunquit 892 York
Old Town 7,840 Penobscot
Orono 10,362 Penobscot
Paris-Norway 10,197 Oxford
Pittsfield 4,215 Somerset
Pleasant River (Columbia Falls) 1,072 Washington
Scarborough (Ecomaine) 18,919 Cumberland
Skowhegan 8,589 Somerset
St. George (Tenants Harbor) 2,591 Knox
Total 153,691

Why Waste Composition now?
Improving waste management should be a targeted effort
20 years since its inception, the 50% recycling goal has not yet been reached (currently ~ 39%)
Knowing composition will help lead to the most efficient plan of attack
No study of Maine waste has been conducted since 1991/1992 and it is prudent to assume it has changed

Categorization
Waste was broken into 9 major categories
Organic, Paper, Plastic, Other, Construction and Demolition, Metal, Glass, Household Hazardous, and Electronics
Over 60 subcategories were used

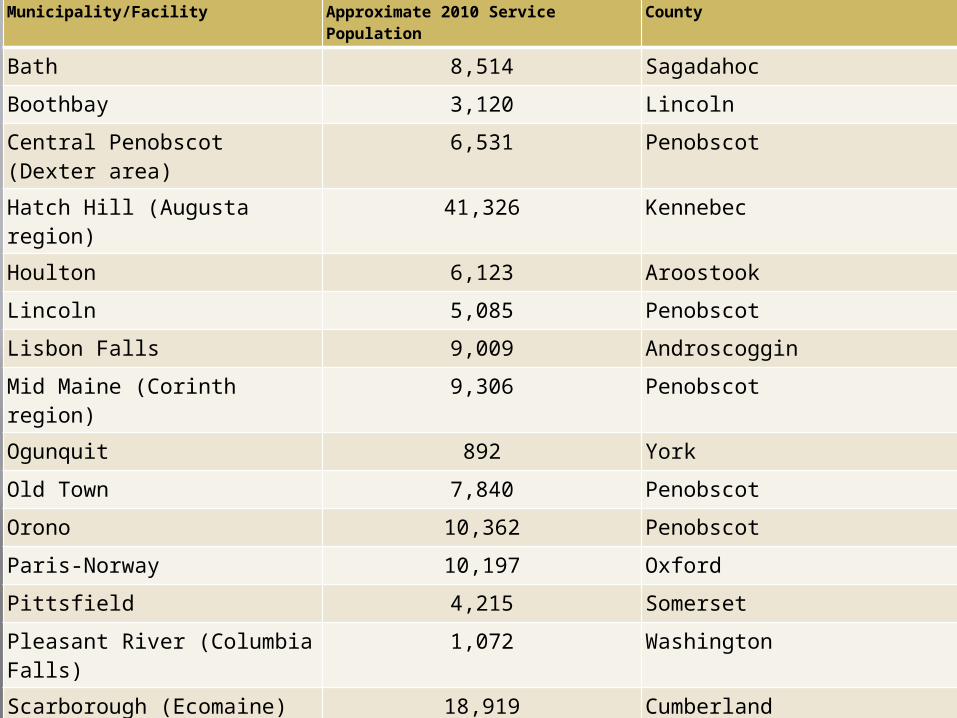
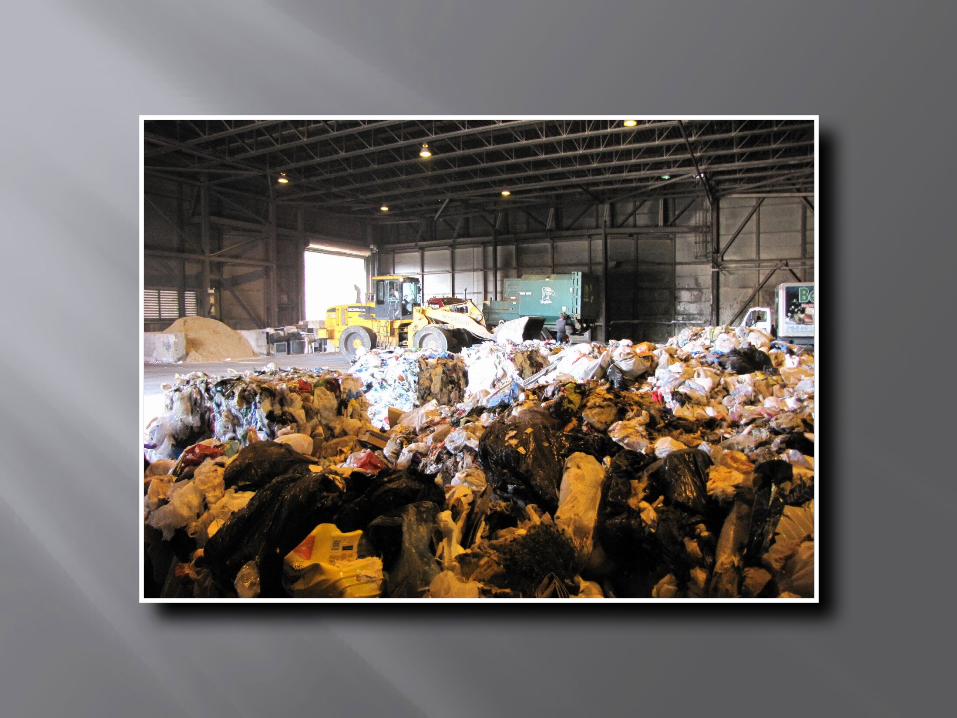
A Day Sorting Waste

A Day Sorting Waste
Collect sample of waste (no. of bags varied by location)
Broke open each bag and settled contents
Sorted into both final subcategories and several category groupings
Weighed bins, tallied results, and emptied contents as bins became full
Resorted bins with groupings as needed or at the end of the day


Organics; 43.28%
Paper; 25.57%
Plastic; 13.44%
Other Waste
; 5.77%
C&D; 3.35%
Metal; 3.26%
Glass; 2.71% HHW; 1.72% Electronics; 0.92%
Waste Composition for Major Categories

Major Category Category %
Organics 43.28%
Paper 25.57%
Plastic 13.44%
Other Waste 5.77%Construction and Demolition Debris (C&D) 3.35%
Metal 3.26%
Glass 2.71%
Household Hazardous Waste (HHZ) 1.72%
Electronics 0.92%
Waste Composition for Major Categories

Organics
Sub-Category% of Total
Waste% of Organic
Waste Cumulative %
Food 27.86% 64.38% 64.38%
Remainder/ Composite Organic
10.97% 25.35% 89.73%
Diapers 2.97% 6.86% 96.58%
Leaves & Grass 1.16% 2.68% 99.26%
Prunings & Trimmings 0.32% 0.74% 100.00%

Paper
Sub-Category% of Total
Waste% of Paper
WasteCumulative
%
Compostable 7.93% 31.02% 31.02%
Other Recyclable 4.90% 19.15% 50.17%
Remainder/ Composite Paper
4.08% 15.95% 66.12%
Magazine/ Catalog 2.88% 11.25% 77.37%
Newsprint 2.43% 9.51% 86.88%
High Grade Office 1.64% 6.41% 93.29%
Uncoated Corrugated Cardboard/ Kraft
1.61% 6.29% 99.58%
Phone Books 0.11% 0.42% 100.00%
Total 25.57% 100.00%

Plastic
Sub-Category% of Total
Waste% of Plastic
WasteCumulative
%
All Film 4.78% 35.61% 35.61%
Remainder/Composite Plastic 1.68% 12.50% 48.12%
Durable Plastic Items 1.41% 10.48% 58.59%
#3 - #7 Plastics 1.38% 10.25% 68.85%
HDPE Bottles 1.01% 7.50% 76.35%
Grocery/Merchandise Bags 0.82% 6.10% 82.45%
PET Containers-non bottles 0.71% 5.31% 87.76%
All Styrofoam 0.67% 4.99% 92.75%
PET Bottles/Jars 0.47% 3.50% 96.25%
Plastic ME DepositBeverage Containers 0.36% 2.68% 98.93%
HDPE Containers-non bottles 0.14% 1.07% 100.00%
Total 13.44% 100.00%

Metal Glass
Sub-Category% of Total
WasteTin/Steel Containers 1.45%
Other Ferrous 0.93%
Other Non-Ferrous 0.42%
Remainder/ Composite Metal
0.28%
Aluminum ME Deposit Containers
0.10%
Appliances 0.04%
Compressed Fuel Containers 0.03%
Total 3.26%
Sub-Category% of Total
WasteClear Glass Containers 1.96%
Glass ME Deposit Beverage Containers
0.41%
Green & Other Glass Containers 0.13%
R/C Glass 0.11%
Flat Glass 0.07%
Amber Glass Containers 0.02%
Total 2.71%

Major Category Subcategory % of Major Category % of SubcategoryOrganics 43.28%
Food 27.86%Remainder/Composite Organic 10.97%Diapers 2.97%Yard Waste 1.48%
Paper 25.57%Compostable Paper 7.93%Other Recyclable Paper 4.90%Remainder/Composite Paper 4.08%Magainze/Catalogs 2.88%Newsprint 2.43%High Grade Office Paper 1.64%Occ/Kraft 1.61%
Plastic 13.44%All Film 4.78%All Other Plastic 3.76%#3 - #7 Plastics 1.38%PET (#1) 1.18%HDPE (#2) 1.15%Grocery/Merch Bags 0.82%Plastic ME Dep. BevCont. 0.36%
Other Waste 5.77%Textiles (non-carpet) 4.26%
C&D 3.35%Metal 3.26%
Other Metal 1.71%Tin/Steel Cont. 1.45%Aluminum ME Dep. Beverage Cont. 0.10%
Glass 2.71%Clear Glass Cont. 1.96%Glass ME Dep. Bev Cont. 0.41%

Comparison to 1991/1992 Study
Paper percentage of total waste stream decreased by 23%
Significant decreases in Cardboard and High Grade Office Paper
Substantial decrease (75%) in Newsprint
Type of Paper
91/92 % of Total Waste Stream
2011 % of Total Waste Steam
Corrugated cardboard
2.92 1.61
High grade office
3.04 1.64
Magazines/ catalogs
2.92 2.88
Newsprint 9.88 2.43
Telephone books
0.19 0.11
Total of all paper
33.04 25.57

Comparison to 1991/1992 Study
Plastics bag waste cut in half
Rigid plastics has increased by 160%
Plastic percentage of total waste stream has doubled
Plastic Film waste much of increase
Type of Plastic
91/92 % of Total Waste Stream
2011 % of Total
Waste Stream
Plastic bags 1.59 0.82
All HDPE 1.23 1.15
Rigid plastics 1.12 2.92
Total of all plastic 6.69 13.44
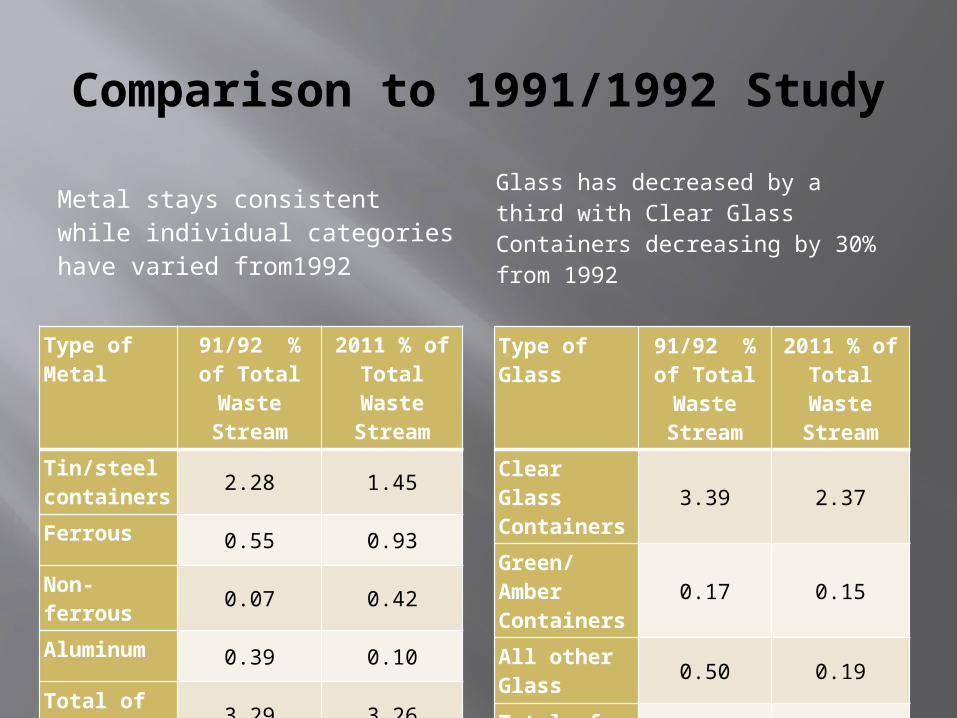
Comparison to 1991/1992 Study
Metal stays consistent while individual categories have varied from1992
Glass has decreased by a third with Clear Glass Containers decreasing by 30% from 1992
Type of Metal
91/92 % of Total
Waste Stream
2011 % of Total
Waste Stream
Tin/steel containers 2.28 1.45
Ferrous 0.55 0.93
Non-ferrous 0.07 0.42
Aluminum 0.39 0.10
Total of all metal 3.29 3.26
Type of Glass
91/92 % of Total Waste Stream
2011 % of Total
Waste Stream
Clear Glass Containers 3.39 2.37
Green/Amber Containers
0.17 0.15
All other Glass 0.50 0.19
Total of all Glass 4.06 2.71

Variations in Recyclable Material
Newsprint Broken down
by town sampled, variations are apparent
Distribution skewed to the right
Some towns have much better recovery rates
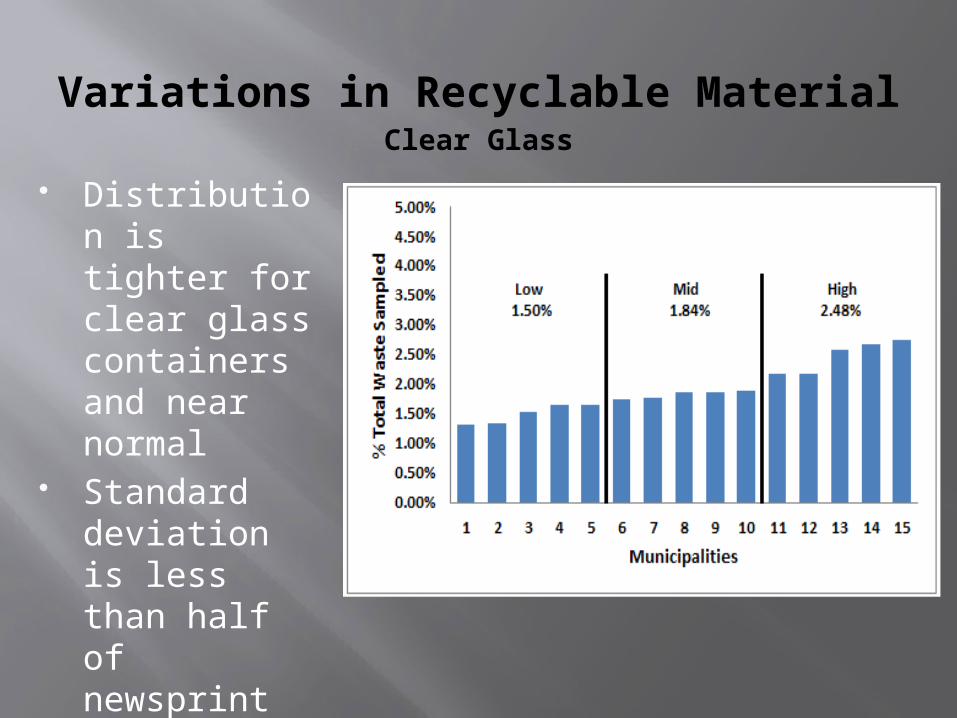
Variations in Recyclable MaterialClear Glass
Distribution is tighter for clear glass containers and near normal
Standard deviation is less than half of newsprint
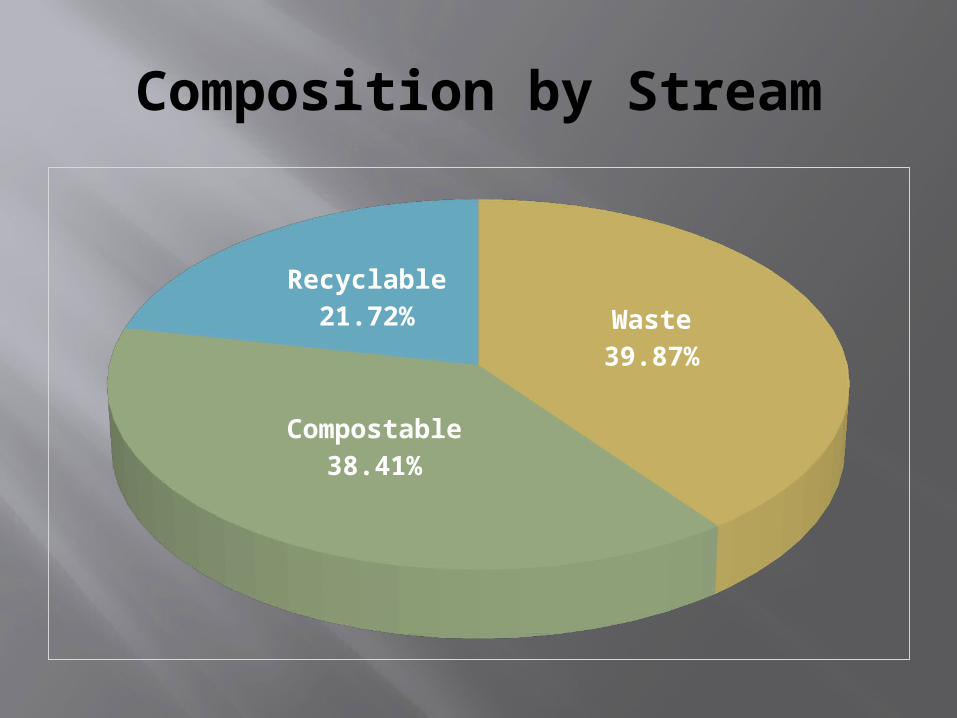
Composition by Stream
Waste39.87%
Compostable38.41%
Recyclable21.72%

Notes on Stream Classification
Classification is by:
What is widely recycled around the state Compostable without significant effort What is currently not diverted in a
significant amount of locations around the state
Not a perfect analysis due to fungible nature between categories of many items.

Top 10 Waste Subcategories
Waste Category% of Total
WasteCumulative % of Total
Waste
Food Waste 27.86% 27.86%
R/C Organic 10.97% 38.83%Compostable Paper 7.93% 46.76%Other Recyclable Paper 4.90% 51.66%
All Film 4.78% 56.44%Textiles (non-carpet) 4.26% 60.70%
R/C Paper 4.08% 64.78%
Diapers 2.97% 67.75%
Magainze/Catalogs 2.88% 70.62%
Newsprint 2.43% 73.05%
Topics for Discussion
Where can the next advances in recycling come?
What can be improved? Methods, actions, enforcement, technology.
What can be added and/or promoted everywhere? Textiles, film, grocery bags, hard plastics not #1-
7, composites, etc.
Topics for Discussion
How can we better utilize compositing to decrease the waste stream
Regional composting? Is it feasible? Cost-effective? What process
should be used? Can we control the smell?
Backyard composting Public perception, animal issues, individual
responsibility.
Topics for Discussion
What are best practices in Waste Management? Pay-as-you-throw, Single-Stream, curbside
collection, drop-off, mandatory recycling, HHW collection, citizen education, etc.

Take-Home’s
State is still not near 50% recycling goal
Waste composition has transformed with time
Plastic waste on rise as paper and glass decline
Recyclables in waste stream is over 20% and
compostable material is nearly 40%
Top 10 waste subcategories account for 73.05%
of the waste
There are widespread variations by town and by
subcategory that are observed


![Electricity generation potential from solid waste in three … · 2018-12-20 · Electricity generation potential from solid waste in three Colombian municipalities [112] TecnoLógicas,](https://img.pdfslide.us/doc/110x75/5f0aec537e708231d42e0134/electricity-generation-potential-from-solid-waste-in-three-2018-12-20-electricity.jpg)


![donglin presentation(2016) [Kompatibilitätsmodus] water Coal Waste vapour Buring Furnace Packing Inspection Sampled/Analysed Sampled/Analysed Vibration Sieve Separator Separator Eyclonc](https://img.pdfslide.us/doc/110x75/5aa2ab647f8b9a436d8d4220/donglin-presentation2016-kompatibilittsmodus-water-coal-waste-vapour-buring.jpg)