Embed Size (px)
Citation preview
Prepared by
Prepared for City of Palm Coast,
Florida
January 27, 2015
Drainage Study Sections 30 & 34 for Development of City Wide
Stormwater Management Master Plan
Singhofen & Associates, Inc. January 27, 2015
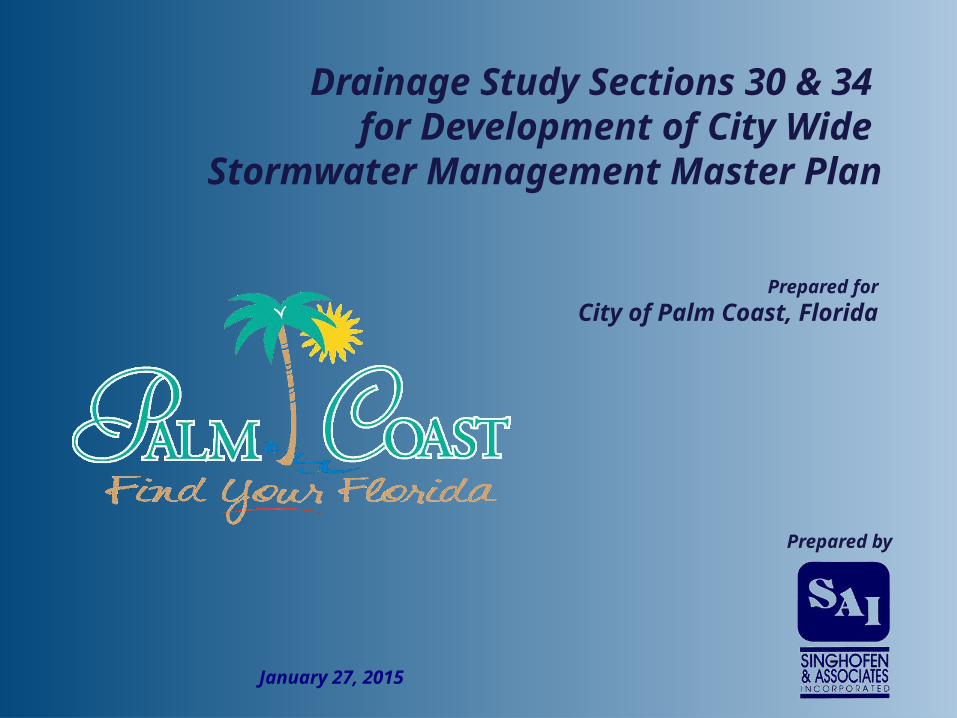
Comprehensive Approach for Priority Criteria
Visual Inspections of Aging InfrastructurePipe Ratings
Historical Records from Rainfall EventsVisual Inspections of Stormwater SystemPublic Works High Water Signage Areas
Complaints (Service Orders) from CitizensCustomer Service Calls Combined With Follow Up Inspections
Other Special SituationsHigh Groundwater Areas
City of Palm Coast Modeling Priority
Singhofen & Associates, Inc. January 27, 2015
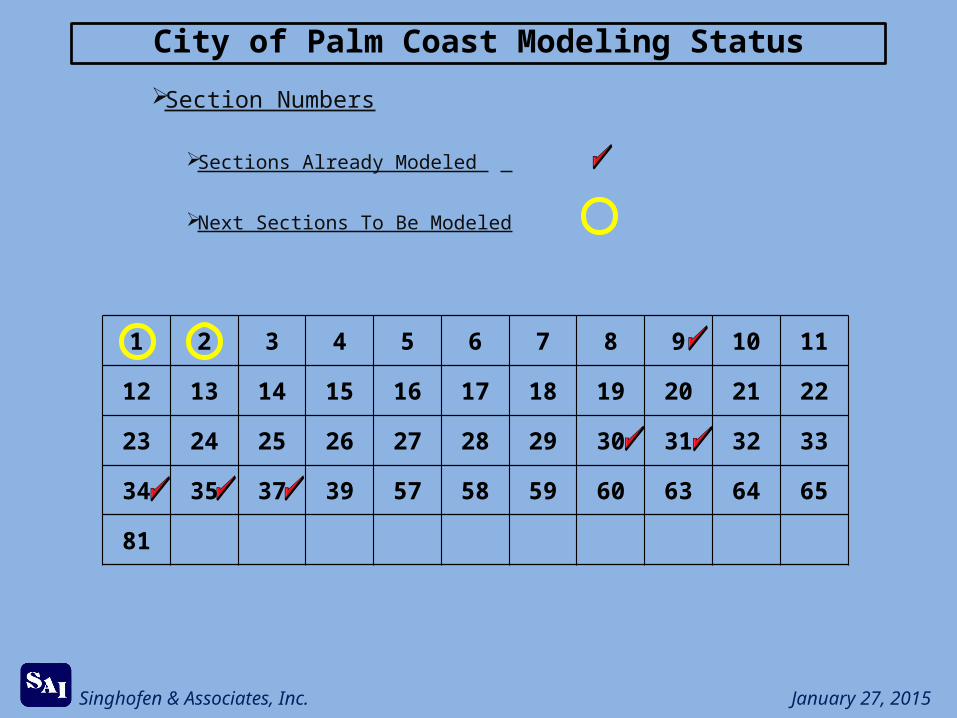
Section Numbers
Sections Already Modeled
Next Sections To Be Modeled
City of Palm Coast Modeling Status
1 2 3 4 5 6 7 8 9 10 11
12 13 14 15 16 17 18 19 20 21 22
23 24 25 26 27 28 29 30 31 32 33
34 35 37 39 57 58 59 60 63 64 65
81
Singhofen & Associates, Inc. January 27, 2015
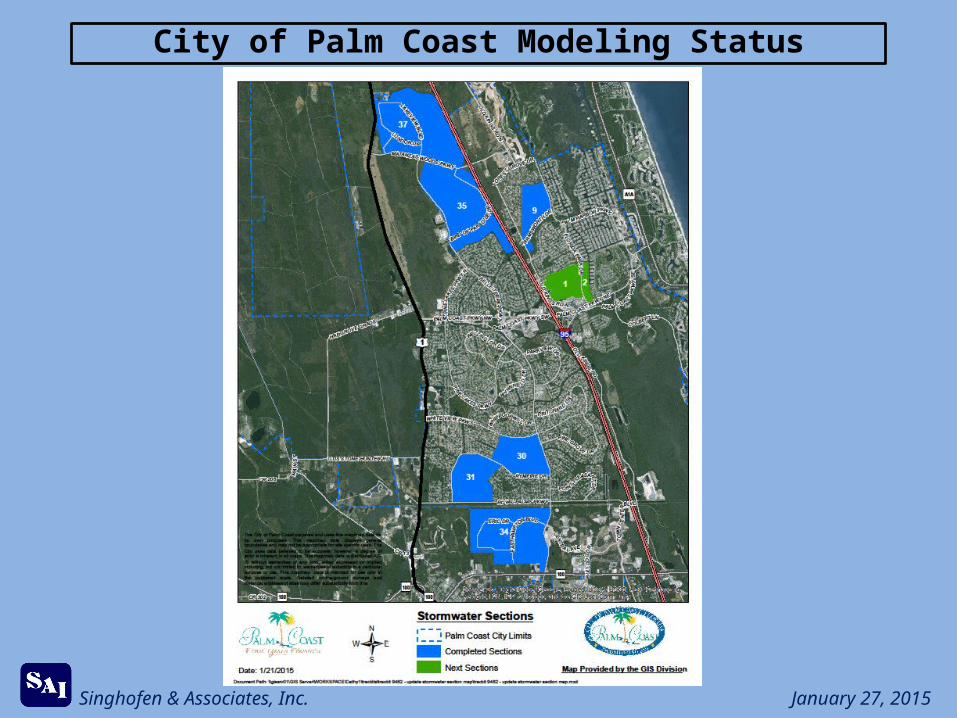
City of Palm Coast Modeling Status
Singhofen & Associates, Inc. January 27, 2015
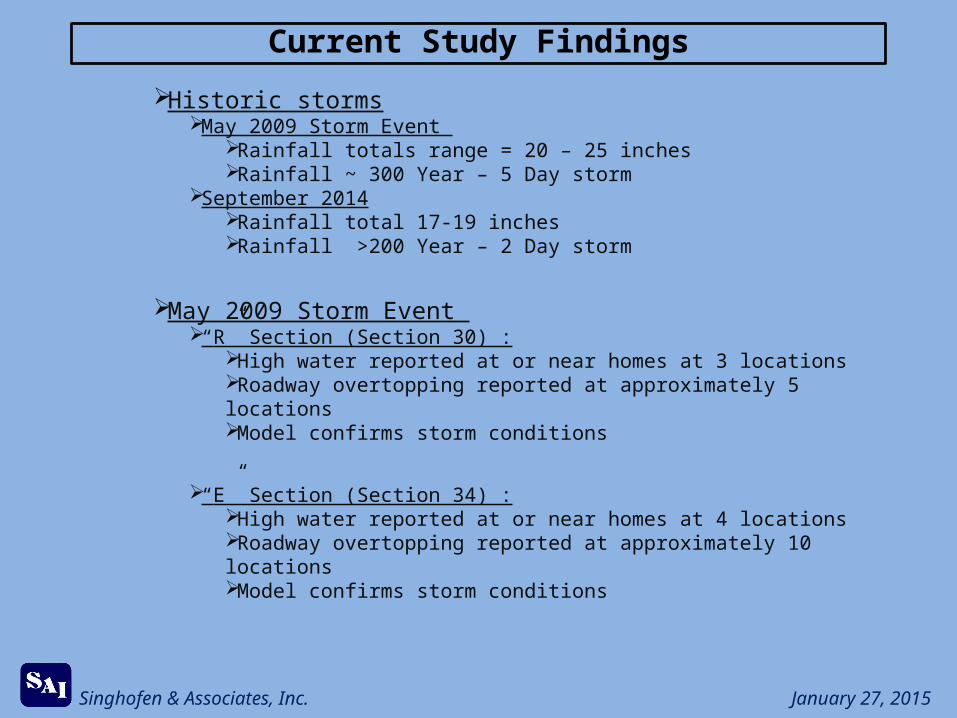
Historic stormsMay 2009 Storm Event
Rainfall totals range = 20 – 25 inchesRainfall ~ 300 Year – 5 Day storm
September 2014Rainfall total 17-19 inchesRainfall >200 Year – 2 Day storm
May 2009 Storm Event “R” Section (Section 30) :
High water reported at or near homes at 3 locationsRoadway overtopping reported at approximately 5 locationsModel confirms storm conditions
“E” Section (Section 34) :High water reported at or near homes at 4 locationsRoadway overtopping reported at approximately 10 locationsModel confirms storm conditions
Current Study Findings
Singhofen & Associates, Inc. January 27, 2015
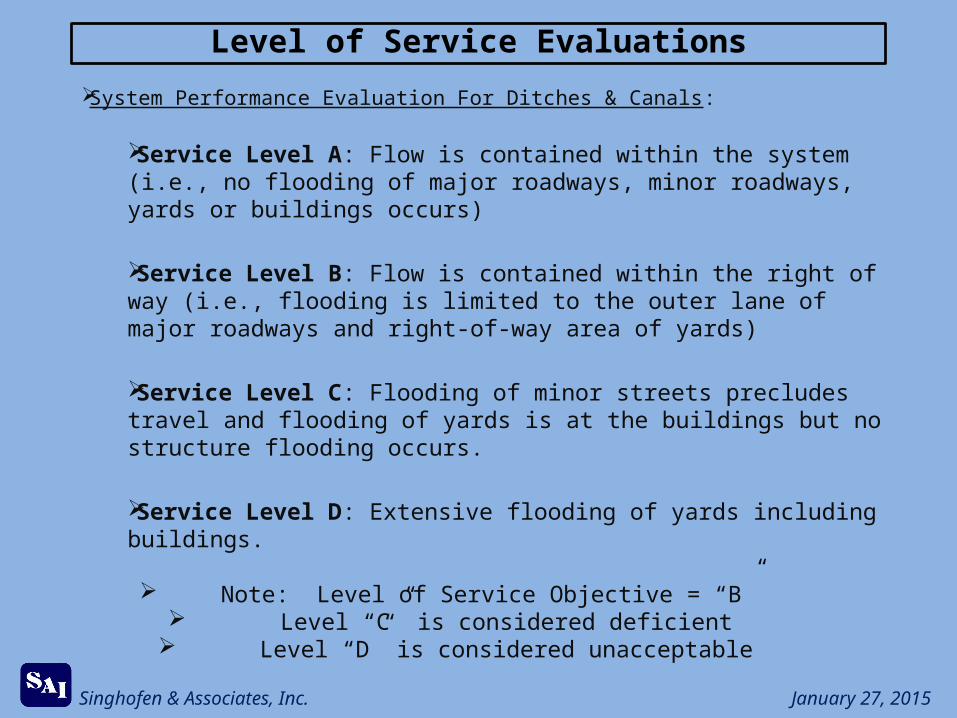
System Performance Evaluation For Ditches & Canals:
Service Level A: Flow is contained within the system (i.e., no flooding of major roadways, minor roadways, yards or buildings occurs)
Service Level B: Flow is contained within the right of way (i.e., flooding is limited to the outer lane of major roadways and right-of-way area of yards)
Service Level C: Flooding of minor streets precludes travel and flooding of yards is at the buildings but no structure flooding occurs.
Service Level D: Extensive flooding of yards including buildings.
Note: Level of Service Objective = “B” Level “C” is considered deficient
Level “D” is considered unacceptable
Level of Service Evaluations
Singhofen & Associates, Inc. January 27, 2015
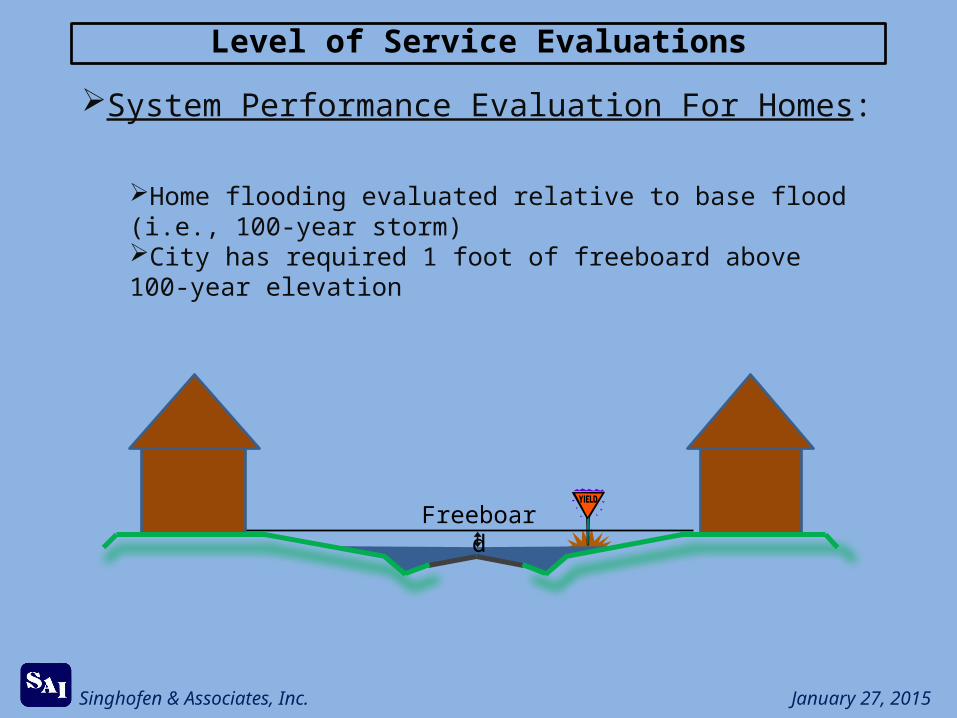
System Performance Evaluation For Homes:
Home flooding evaluated relative to base flood (i.e., 100-year storm)City has required 1 foot of freeboard above 100-year elevation
Level of Service Evaluations
Freeboard
Singhofen & Associates, Inc. January 27, 2015
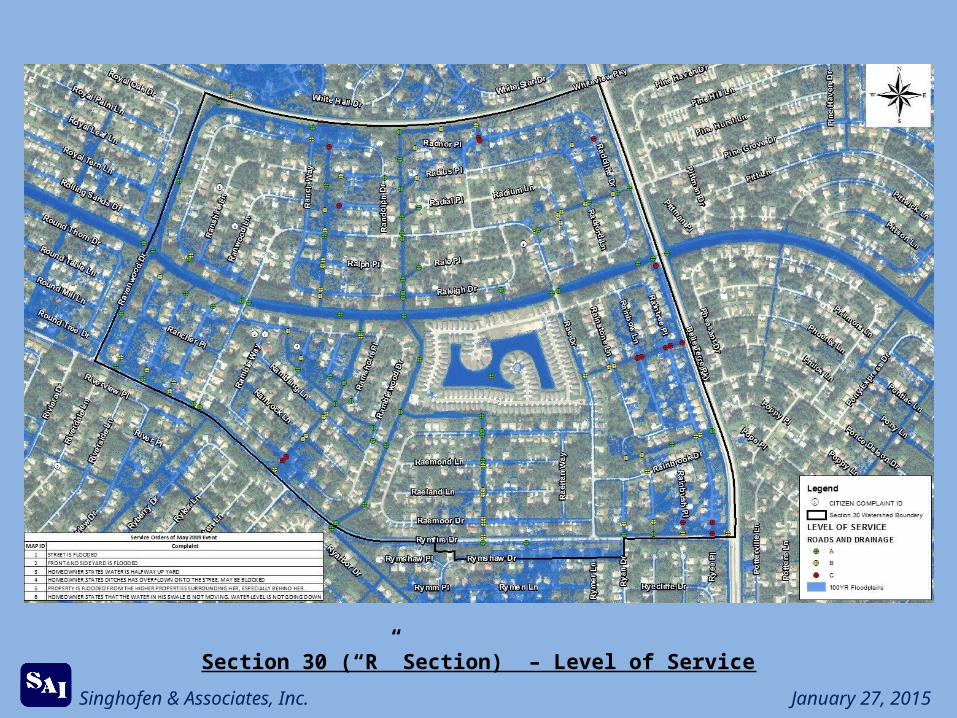
Section 30 (“R” Section) – Level of Service
Singhofen & Associates, Inc. January 27, 2015
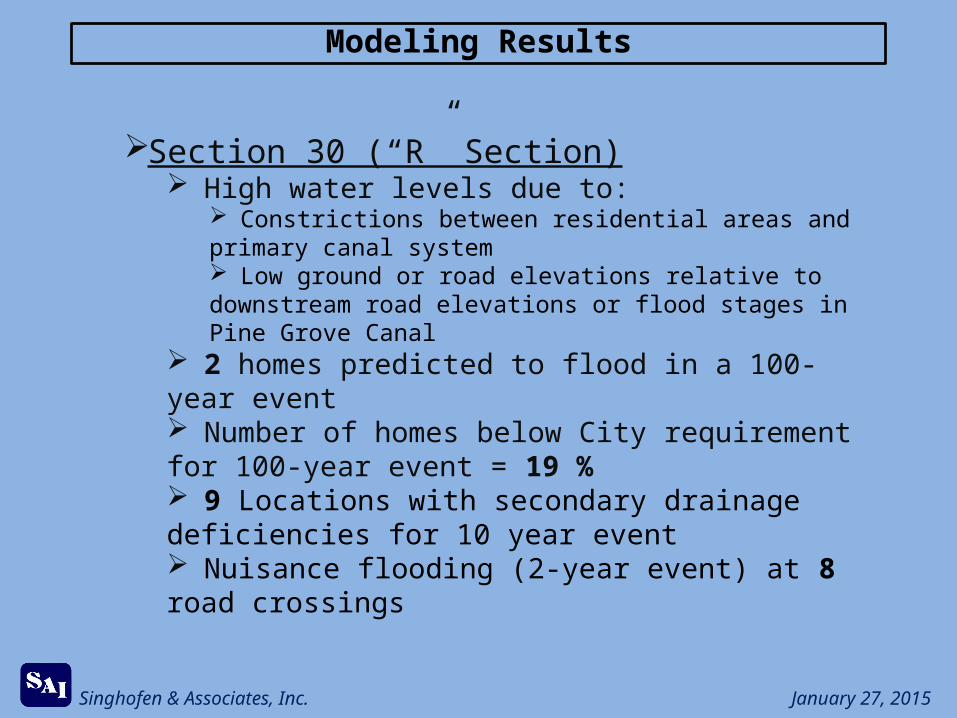
Section 30 (“R” Section) High water levels due to:
Constrictions between residential areas and primary canal system Low ground or road elevations relative to downstream road elevations or flood stages in Pine Grove Canal
2 homes predicted to flood in a 100-year event Number of homes below City requirement for 100-year event = 19 % 9 Locations with secondary drainage deficiencies for 10 year event Nuisance flooding (2-year event) at 8 road crossings
Modeling Results
Singhofen & Associates, Inc. January 27, 2015
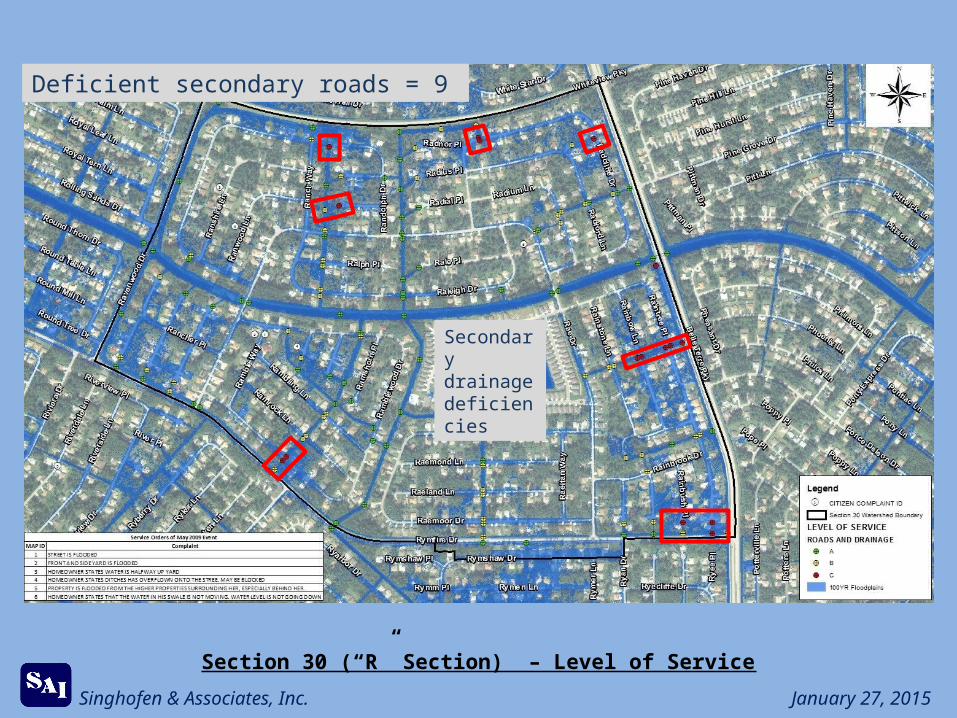
Section 30 (“R” Section) – Level of Service
Deficient secondary roads = 9
Secondary drainage deficiencies
Singhofen & Associates, Inc. January 27, 2015
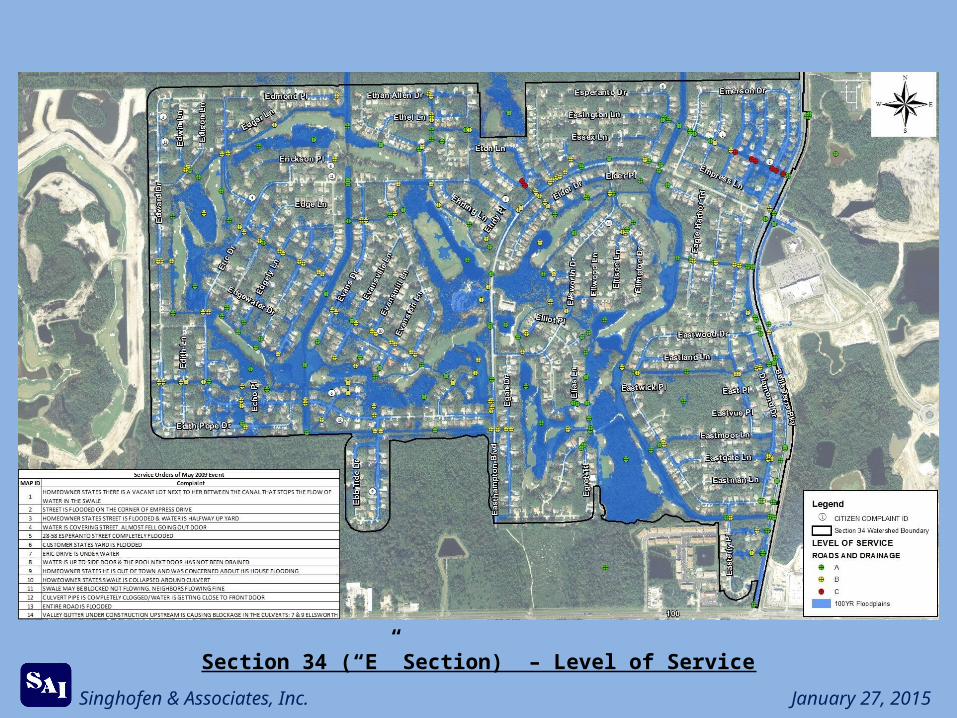
Section 34 (“E” Section) – Level of Service
Singhofen & Associates, Inc. January 27, 2015
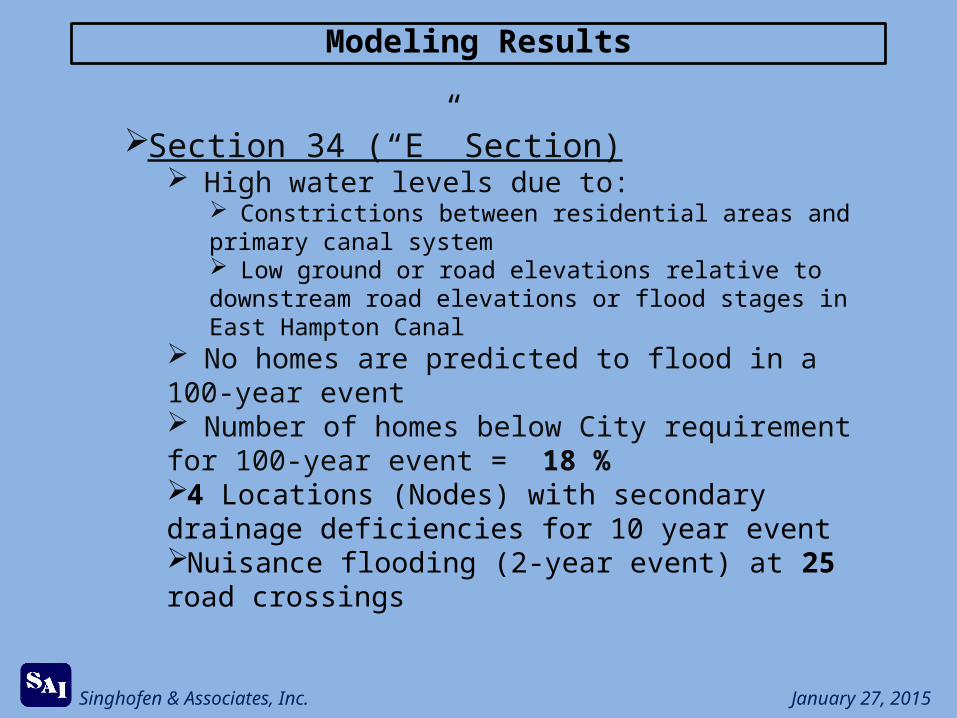
Section 34 (“E” Section) High water levels due to:
Constrictions between residential areas and primary canal system Low ground or road elevations relative to downstream road elevations or flood stages in East Hampton Canal
No homes are predicted to flood in a 100-year event Number of homes below City requirement for 100-year event = 18 % 4 Locations (Nodes) with secondary drainage deficiencies for 10 year eventNuisance flooding (2-year event) at 25 road crossings
Modeling Results
Singhofen & Associates, Inc. January 27, 2015
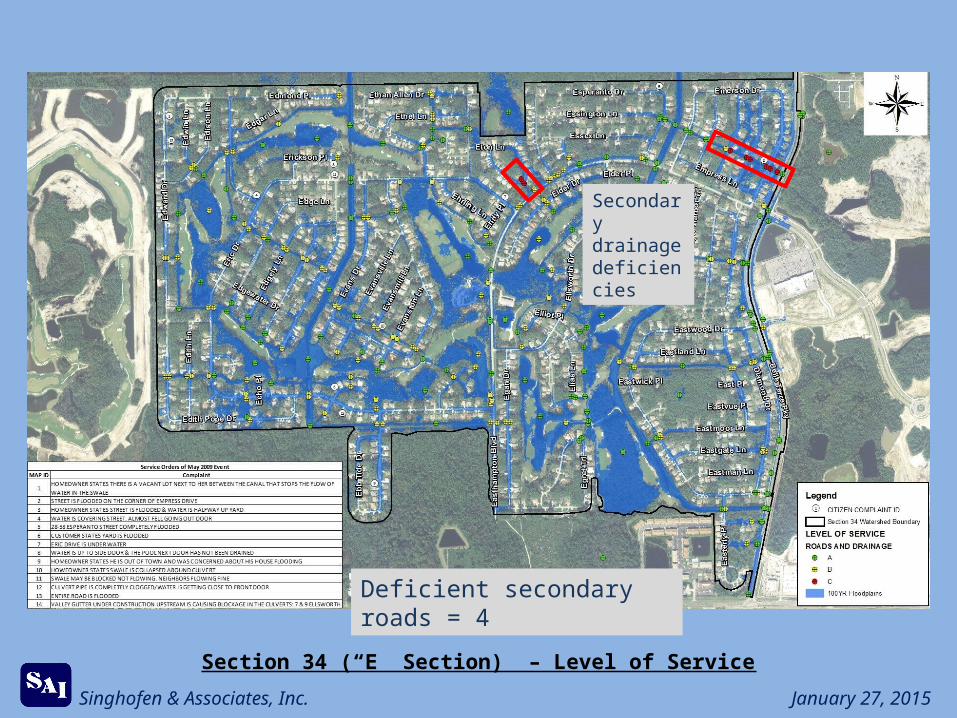
Section 34 (“E” Section) – Level of Service
Deficient secondary roads = 4
Secondary drainage deficiencies
Singhofen & Associates, Inc. January 27, 2015
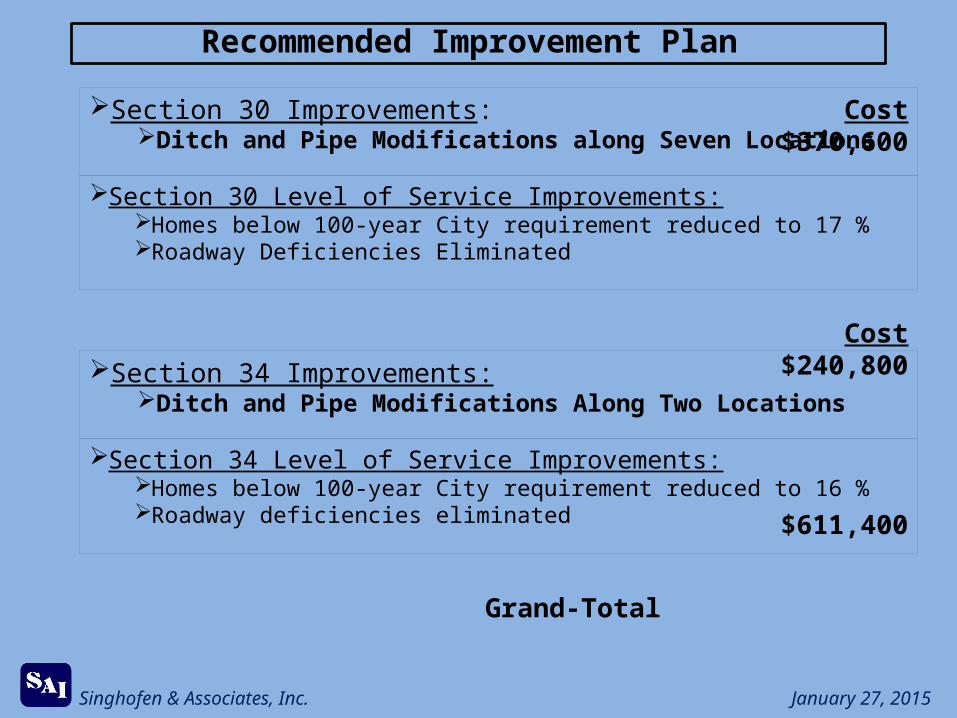
Recommended Improvement Plan
Section 30 Improvements:Ditch and Pipe Modifications along Seven Locations
Cost$370,600
Cost$240,800
$611,400
Section 30 Level of Service Improvements:Homes below 100-year City requirement reduced to 17 %Roadway Deficiencies Eliminated
Section 34 Improvements:Ditch and Pipe Modifications Along Two Locations
Section 34 Level of Service Improvements:Homes below 100-year City requirement reduced to 16 %Roadway deficiencies eliminated
Grand-Total
Singhofen & Associates, Inc. January 27, 2015
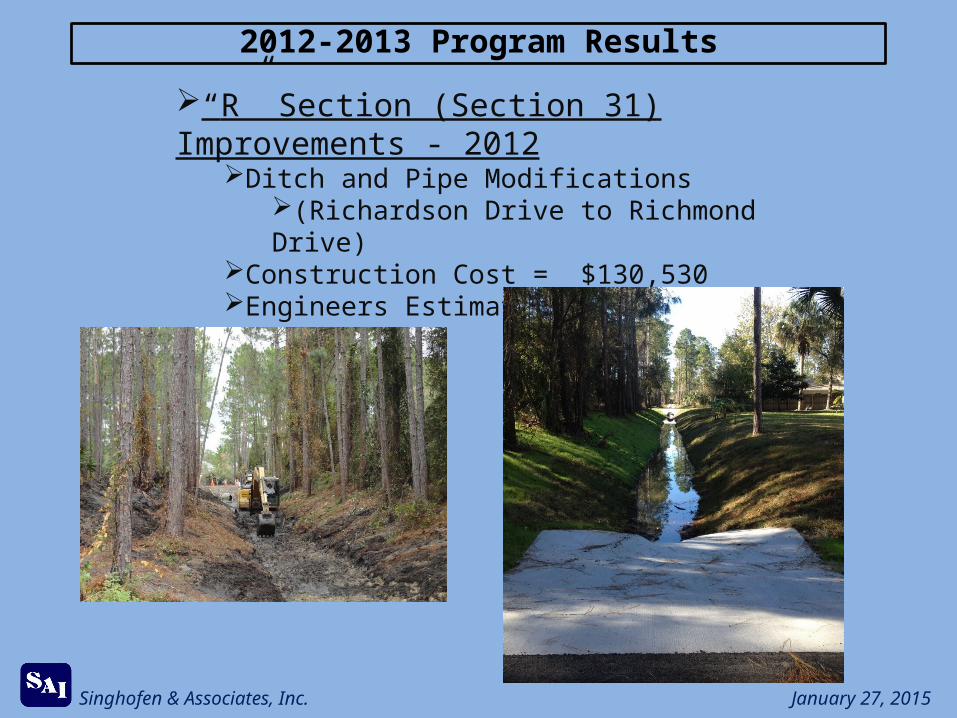
“R” Section (Section 31) Improvements - 2012Ditch and Pipe Modifications
(Richardson Drive to Richmond Drive)Construction Cost = $130,530Engineers Estimate = $215,000
2012-2013 Program Results
Singhofen & Associates, Inc. January 27, 2015
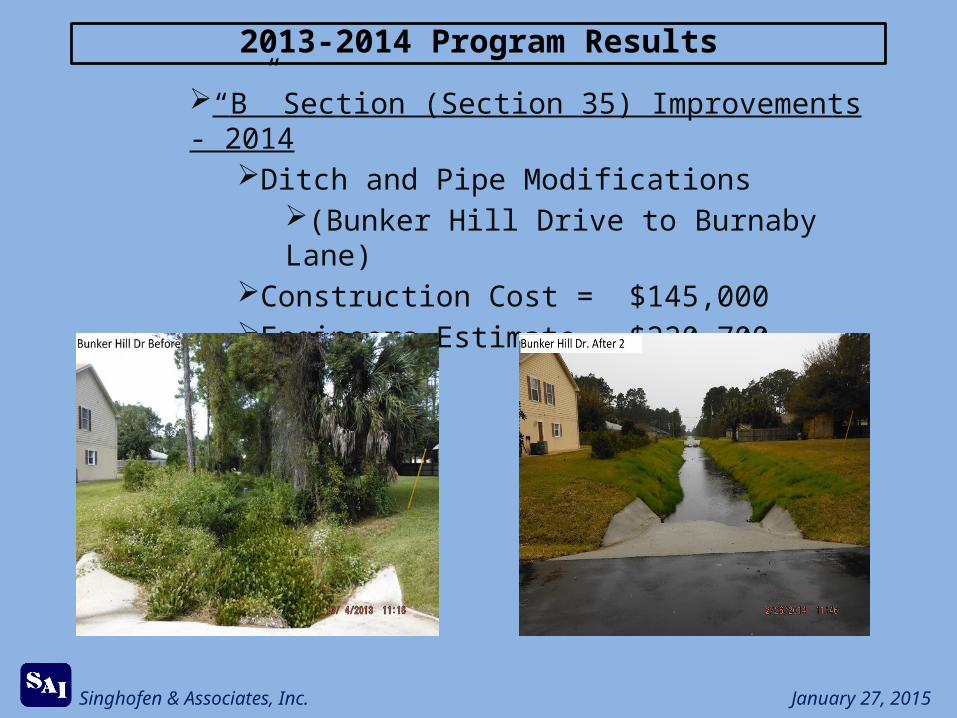
2013-2014 Program Results
“B” Section (Section 35) Improvements - 2014Ditch and Pipe Modifications
(Bunker Hill Drive to Burnaby Lane)Construction Cost = $145,000Engineers Estimate = $220,700
Singhofen & Associates, Inc. January 27, 2015
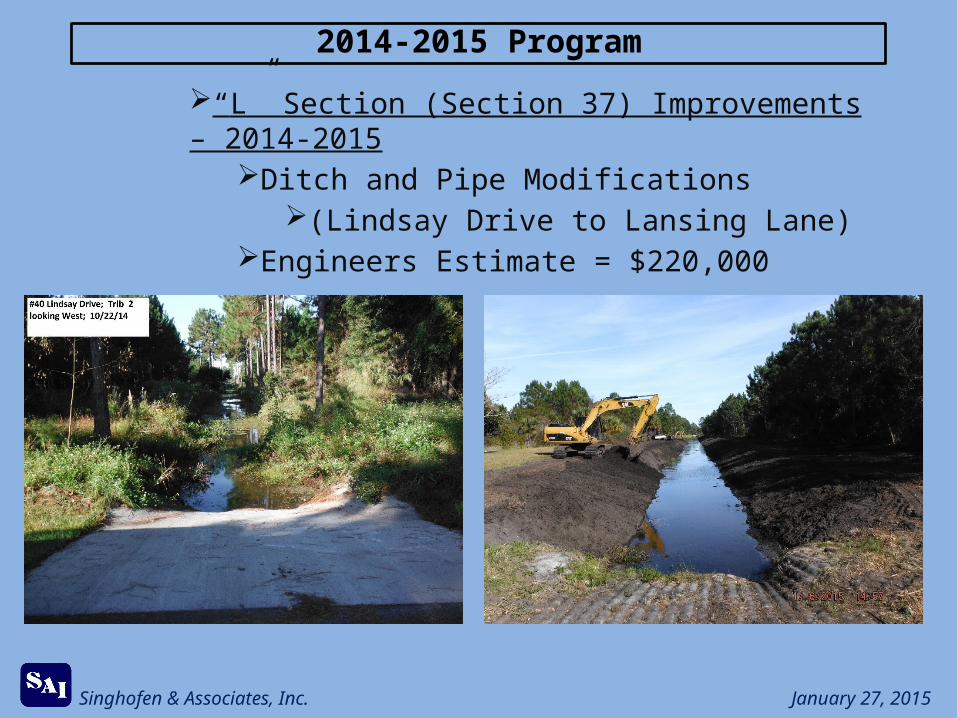
2014-2015 Program
“L” Section (Section 37) Improvements – 2014-2015Ditch and Pipe Modifications
(Lindsay Drive to Lansing Lane)Engineers Estimate = $220,000

Singhofen & Associates, Inc. January 27, 2015
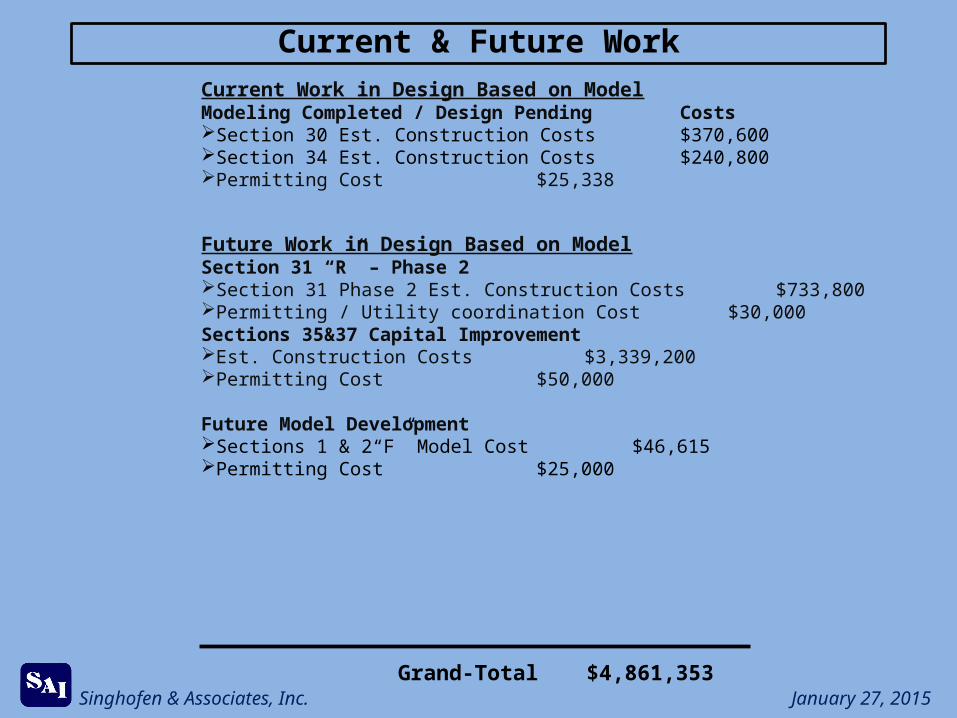
Current & Future Work
Singhofen & Associates, Inc. January 27, 2015
Current Work in Design Based on ModelModeling Completed / Design Pending CostsSection 30 Est. Construction Costs $370,600Section 34 Est. Construction Costs $240,800Permitting Cost $25,338
Future Work in Design Based on ModelSection 31 “R” – Phase 2Section 31 Phase 2 Est. Construction Costs $733,800Permitting / Utility coordination Cost $30,000 Sections 35&37 Capital Improvement Est. Construction Costs $3,339,200Permitting Cost $50,000
Future Model DevelopmentSections 1 & 2“F” Model Cost $46,615Permitting Cost $25,000
Current & Future Work
Grand-Total $4,861,353
Singhofen & Associates, Inc. January 27, 2015
Sections 30 and 34 ExpectationsContinue Maintenance and Selective ImprovementsCity Swale and Ditch Maintenance Has Reduced Future Capital Cost
Lessons Learned?