Embed Size (px)
Citation preview
.,
' ('
Physiological Indicators of utrient Deficiency ·in Algae
by F.P. Healey
FISHERIES AND MARINE SERVICE SERVICE DES PECHES ET DES SCIENCES DE LA MER
T
1975 Environment Canada
Fisheries and Marine Service
Environnement Canada
Service des peches et des sciences de Ia mer
Technical Reports
Technical Reports are research documents that are of sufficient importance to be preserved, but which for some reason are not appropriate for primary scientific publication. Inquiries concerning any particular Report should be directed to the issuing establishment.
Rapports Techniques
Les rapports techniques sont des documents de recherche qui revetent une assez grande importance pour etre conserves mais qui, pour une raison ou pour une autre, ne conviennent pas a une publication scientifique prioritaire. Pour toute demande de renseignements concernant un rapport particulier, il faut s'adresser au service responsable.
Department of the Environment
Fisheries and Marine Service
Research and Development Directorate
TECHNICAL REPORT No. 585
(Numbers 1-456 in this series were issued as Technical Reports of the Fisheries
Research Board of Canada. The series name was changed with report number 457)
Ministere de l'Environnement
Service des P~ches et des Sciences de la mer
Direction de la Recherche et Developpement
RAPPORT TECHNIQUE N°. 585
(Les numeros 1-456 dan cette serie furent utilises comme Rapports Techniques de l'Office des recherches dur les pecheries du Canada. Le nom de la serie fut change
avec le rapport numero 457)
PHYSIOLOGICAL INDICATORS OF NUTRIENT DEFICIENCY
IN ALGAE
by
F. P. Healey
This is the eighty-first Ceci est le quatre-vingt-uni~me
Technical Report from the Rapport Technique de la Direction de la
Research and Development Directorate Recherche et Developpement
Freshwater Institute Institut des eaux douces
Winnipeg, Manitoba Winnipeg, Manitoba
1975

ABSTRACT
Healey, F.P. 1975. Physiological indicators of nutrient deficiency in algae. Fish. Mar. Serv. Res. Dev. Tech. Rep. 585:30 p.
A survey of the literature dealing with the effect of nutrient deficiencies on the ~omposition and metabolism of algae has revealed quantitatively similar responses in widely divergent algae. These responses have been summarized to provide a basis for the interpretation of measurements of the composition and metabolism of natural populations.
~ ~
RESUME
Healey, F.P. 1975. Indicateurs physiologiques de la carence nutritive chez les algues. Fish. Mar. Serv. Res. Dev. Tech. Rep. 585:30 p.
L'etude de taus les travaux relatifs a l'effet des insuffisances nutritives sur la composition et le metabolisme des algues a revele des reactions qu~ntitativement semblables chez une grande variete d 1algues. On a prepar~ un resume sur ces reactions qui servira de base pour l' interpretation des mesures relatives a la composition et au metabolisme des algues naturelles.

1
INTRODUCTION
Several recent studies have dealt with a variety of potential indicators of the nutritional status of algal populations. Gerloff (34) has emphasized the value of tissue analysis in determining whlch nutrient most nearly approaches the critical concentration limiting g~owth. The ratio of cellular protein to carbohydrate may be an indicator of general nutrient deficiency (74). Extracellular alkaline phosphatase activity has been suggested as an indicator of P deficiency (30, 55) while increased ability to take up ammonium or phosphate may be useful in identifying Nand P deficiencies, respectively (27, 42). These and other potential indicators of nutrient deficiency have recently been reviewed from a qualitative viewpoint (43). A major difficulty with the application of these procedures to natural populations has been the lack of means to arrive at quantitative interpretations. The object of the present report is to provide a quantitative treatment of the effect of nutrient deficiency on algal composition and metabolism and to indicate the extent to which light and temperature can mimic the effects of nutrient deficiency, using results derived from laboratory cultures of algae. This revie\v should provide a basis for interpreting measurements on natural populations.
REVIEW OF METHODS
The purpose of this section is to give a brief summp.ry of the methods which were used to obtain the results discussed in this report. These methods have been used successfully on cul turecl algae rmd in many cases on .natural populations. They could potentially be adapted to greater use with natural populations.
Use of C-N analyzers (81) for measurement of partjculate or cellular C and N is becoming more common, replacing earlier wet ashing and micro-Kjeldahl procedures (83). Particulate Pis commonly measured as phosphate following chemical (83) or thermal (81) oxidation.
The Lowry procedure has generally been used to determine protein in algal cultures. Either the anthrone or the phenol-sulfuric acid procedures have been used for carbohydrate determinations. These are described by Herbert et al. (46) in comparison with other procedures. These authors also describe the measurement of RNA and DNA in microbial cells by selective extraction of the nucleic acids and measurement of the associated ribose by the orcinol procedure and deoxyribose by the diphenglamineprocedure. These procedures have been most commonly used in measuring nucleic acids in algal cultures. However, UV absorption has been used with success to measure RNA (15) and a fluorometric procedure for DNA (49) promises considerably increased sensitivity. Extraction with methanol-chloroform mixtures followed by either weighing of the dried extract or, more recently, measurement of the C in the dried

2
extract (48) has been used in lipid determination. A variety of solvents, usually absolute methanol or aqueous acetone, have been used for chlorophyll extraction. Spectrophotometric measurement has generally used the absorption coefficients of MacKinney (56) or Strickland and Parsons (83). Fluorometric measurement (94) offers greater sensitivity.
Measurement of initial saturated rates of nutrient uptake generally involves the addition of a final concentration of about 10 ~M ammonium or phosphate to a suspension of algae, filtration of aliquots at intervals over a period of up to one hour, and measurement of the ammonium or phosphate remaining in solution {25, 42). Measurement of the rate of uptake of labelled phosphate has also been used (32). For measurement of nutrient debts, about 10 ~M ammonium or phosphate is added to a suspension of algae. This is then left in darkness for about 24 hours, a period during which net uptake in at least the few algae which have been examined reaches approximately zero ( 42, 44, Healey unpubl.). Sarrjples taken immediately after nutrient addition and after 24 hours have pa!ss ed are fi 1 tered and analyzed for the remaining ammonium or phosphate. The nutrient debts, then, measure the total amount of the nutrient which the population is capable of taking up under non-growing conditions. This includes both the amount required to overcome any deficiency and nutrient which can be taken up and stored in a transient situation in excess of that. In the case of P at least, the latter can be large (42). Ammonium measurement by the Solorzano (79) procedure and phosphate by that of Murphy and Riley (60) are most commonly used.
To date, the most generally used procedure for the measurement of alkaline phosphatase activity involves the hydrolysis of p-nitrophenyl phosphate by a sqspension of whole cells to yield the coloured p-nitrophenol. Substrate concentrations of Q .1 to several millimolar have been used; however, in view of the high half saturation values found in at least some microorganisms (43), use of higher concentrations (above 1 mM) is advisable unless the saturating concentration for the population under study is known. In most cases, Mg has been added; however, the diversity of cation requirements of microbial phosphatases should be kept in ~ind (43). In at least hard and marine waters, these requirements are probably met without further addition. A temperature of 35 C and pH of 8.5 are recommended where the temperature and pH optima of the population are unknown. A fluorometric phosphatase measurement (66) promises to increase sensitivity considerably and allow phosphatase measurement in all but the most oligotrophic waters.
EXPLANATION OF FIGURES
Figures 1 to 11 present several aspects of the composition and metabolism of algae as a function of various nutrient deficiencies. The data have been taken primarily from the physiological literature, and represent measurements on unialgal or pure cultures grown in laboratory situations. For the most part, data included in this report met two basic requirements. First, only results from cultures
3
growing with no nutrient deficiency or with a clearly identified deficiency were included. In one case, noted below useful data were included where deficiency was evident but not clearly identified. Second, some indication of degree of deficiency, usually as reflected in the growth rate, was required.
The abscissa of each composition figure has 3 divisions. Extreme deficiency, E, is associated with growth rates less than 20% of the maximum. In the case of batch cultures, several days growth after exhaustion of the external limiting nutrient or the cessation of logarithmic growth was considered as extreme deficiency. Moderate deficiency, M, indicates growth rates about half the maximum. The letter N includes values for cultures growing with no deficiency at the maximum growth rates for the light intensity and temperature used. In the metabolic figures, a fourth division has been included. Slight deficiency, S, indicates growth rates about 80% of the maximum. This was included because in some algae, some metabolic indicators of nutrient deficiency appear to be very sensitive to the onset of deficiency, reaching as high values with only slight deficiency as with extreme deficiency.
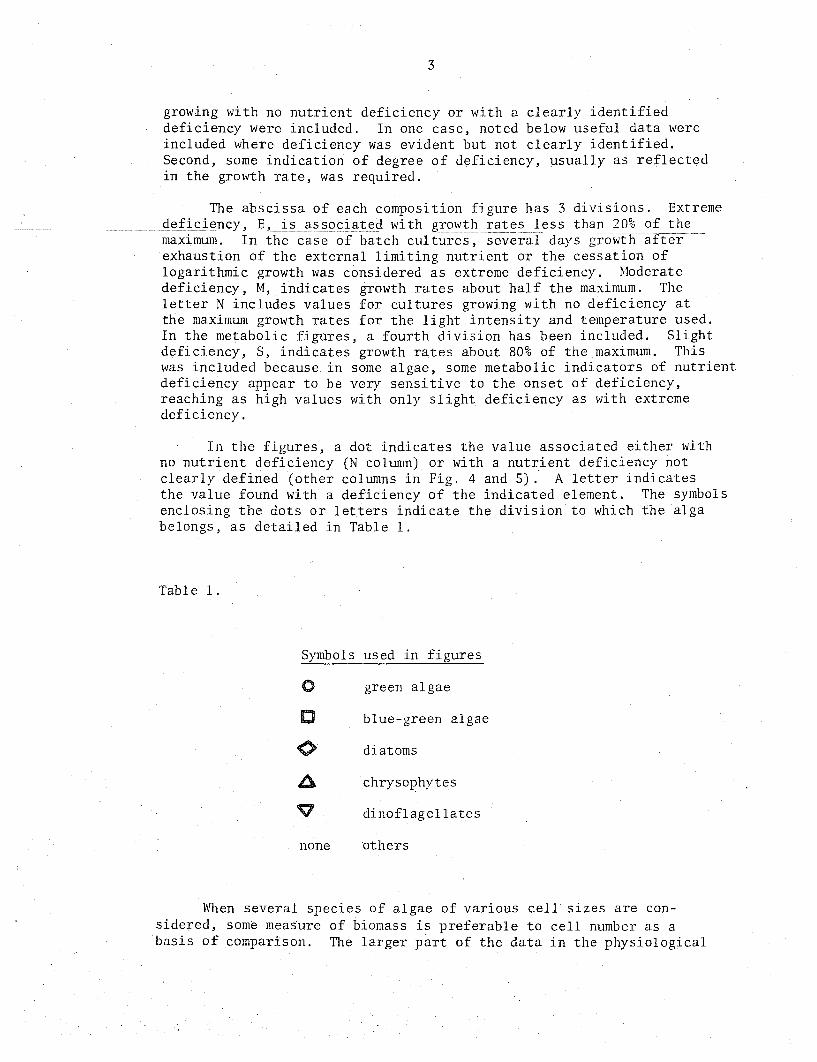
In the figures, a dot indicates the value associated either with no nutrient deficiency (N column) or with a nutrient deficiency not clearly defined (other columns in Fig. 4 and 5). A letter indicates the value found with a deficiency of the indicated element. The symbols enclosing the dots or letters indicate the division to which the alga belongs, as detailed in Table 1.
Table 1.
Symbols used in figures
0 green algae
0 blue-green algae
<> diatoms
~ chrysophytes
v dinoflagellates
none others
When several species of algae of various cell sizes are considered, some measure of biomass is preferable to cell number as a basis of comparison. The larger part of the data in the physiological

4
literature is expressed in terms of dry weight. This has been used here, the ordinates of the figures being weights of components or rates of reactions per mg dry weight of algae (organic dry weight in the case of diatoms) or weight ratios. Some data in the literature are given in terms of algal volume or wet weight. To convert this to a dry weight basis a specific gravity of 1.0 and a wet weight to dry weight ratio of 5:1 were used. Support for the latter is given in Table 2. Some papers use cell C as a basis. To convert these values to dry weight, a cell C:dry weight ratio of 0.5:1.0 was used. This choice is supported by Table 3.
CO~WOSITION AS AN INDICATOR OF NUTRIENT STATUS
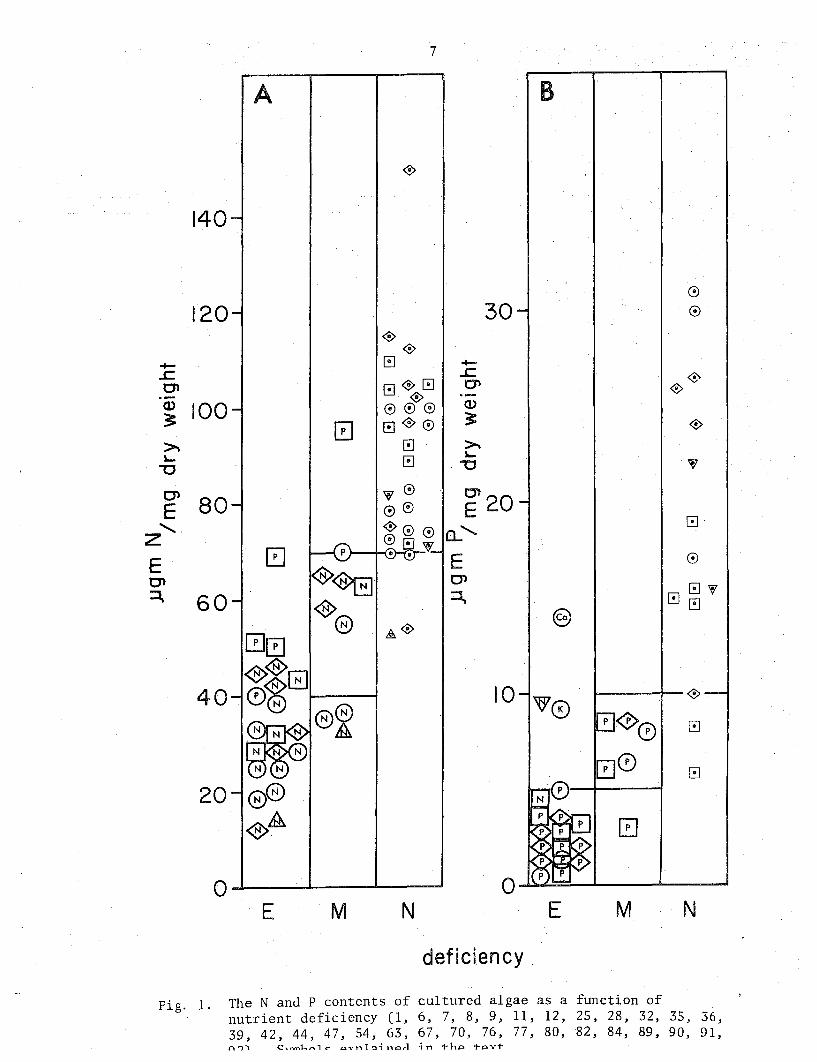
Figure 1 shows the distribution of N and P contents of algae in culture as a function of nutrient deficiency. Most of the N determinations found for algae with no nutrient deficiency fell in the range of 70 to 120 ~gmN/mg dry weight. Moving through moderate to extreme N deficiency, values fell to lie below 50 ~gm/mg dry weight. With increasing P deficiency, theN content also fell, but to a lesser extent. In spite of the overlap between the three divisions, expected because increasing deficiency is a continuum, the data support an approximate separation between values indicating no, moderate, and extreme deficiency. These are designated by the horizontal lines. Values above 70 ~gm N/mg dry weight indicate no N deficiency, values below 40, extreme deficiency, and intermediate values, moderate N deficiency. Similarly, the distribution of P contents sho\m in Fig. lb suggest P contents above 10 ~gm P/mg dry weight are indicative of no P deficiency while values below 5 ~gm/mg dry weight indicate extreme P deficiency. While no phylogenetic differences were evident in the N distribution, the available data suggest that exponentially growing blue-green algae tend to have lower P contents than do most greens and diatoms.
Two ratios in current ecological use are the N/P and N/C ratios. The distribution of these in algal cultures with various nutrient deficiencies is shown in Fig. 2. Although there are few N/P ratios available.for algae in culture, they support a clear separation between P and N deficient algae. While weight ratios above 10 indicate P deficiency, ratios for N deficient and not deficient cultures fell in the same range. Low N/P ratios in natural populations cannot be interpreted as indicating N deficiency unless a nutrient deficiency is established on the basis of some other indicator. Not surprisingly, the distribution of N/C ratios resembles that of N/dry weight; indeed, the data in Fig. 2b are included in Fig. la. On the basis of the rather constant relationship between cell C and dry weight, N per unit C or unit dry weight can be considered interchangeable, using the conversion ratio in Table 3.

5
Table 2. The relationship of wet weight to dry weight in cultured algae.
Alga
green algae
Ghlorella fusca
Chiarella fusca
Chiarella pyrenoidosa
Chiarella stigrnatophora
Chiarella vulgaris
Chiarella vulgaris
Chiarella vulgaris
Dunaliella tertiolecta
Pedinomonas minor
Scenedesrnus sp.
Tetraselmis succina
diatoms
Phaeodactylum tricornutum
chrysophytes
Chrysochrornulina kappa
Chrysochrornulina polylepis
Prymnesium parvum
Olisthodiscus sp.
average
rng wet weight rng dry weight
4.0
4.5
4.5
2.6
7.1
5.0
2.0
3.7
7.1
4.4
4.2
3.5
6.7
7.1
7.7
7.1
5.1
Reference
26
57
37
37
37
78
69
36,37
72
17
37
37
72
72
72
72

6
Table 3. The relationship of cell C to dry weight in cultured algae.
Alga
green algae
Chlorella ellipsoidea
Chlorella pyrenoidosa
Chlorella pyrenoidosa
Chlorella pyrenoidosa
Chlorella sorokiniana
Oocystis polymorpha
Scenedesmus quadricauda
blue-green algae
Agmenellum quadriplicatum
Agmenellum quadriplicatum
Anabaena cylindrica
Anabaena variablis
Anacystis nidulans
diatoms
Thalassiosira pseudonana
mg C mg dry weight
455-571
480-510
520-650
445-470
420-480
440-460
450-550
434-464
444-475
480
420-520
481-510
400-600
Reference
39
52
80
68
71
71
45
92
82
12
45
6
25
7
A B
140
G
120 30 0
<$> 0 - 0 -.c. .c. 0
Ol 008 0'1 0 Q) 100
~ Q)
~ 0®0
~ 0 [!]00 0
>. G >. ),..... 0
),.....
""C 'U w
Ol 80 E2o E z'
[!]
E 0 E 0
Ol N<S>G Ol ~ 60 :J.. C!Jw
<8> @ 00
@ a,.<? 00 ~<8> ~G 10 40 0 V@
0-
®~ P<$>0 N N 0
00 G
20 0
E M N E M N
deficiency .
Fig. 1. The N and P contents of cultured algae as a function of nutrient deficiency (1, 6, 7, 8, 9, 11, 12, 25, 28, 32, 35, 36, 39, 42, 44, 47, 54, 63, 67, 70, 76, 77, 80, 82, 84, 89, 90, 91, n'i'\ CH-n'\l"'""'1c- av-nlo:J;norl ;n Th,:::t. t-AVT

--£ Ol (])
3:
A 80 - 0
,_ 60
>. ..0
8
04 .-
:-0.8
B
0
00 0 0
~40 1-
0 ....... 0.2 ·- 0 0 0 0
a... z'
0 0
0
20 -
0
0 ~ ~ 0
0ffi0
v 0•W w0° 0
0 E M N
()
z'
0.1
0
0 0
~ 0 A~
@
~
E deficiency
--
0
0
0 'W0 0 0 G
0 w0
~~ G A <a>= @ A
M N
Fig. 2. The N/P and N/C ratios of cultured algae as a function of nutrient deficiency (6, 9, 12, 25, 32, 35, 39, 44, 63, 80, 84, 91, 92). Symbols explained in the text.
9
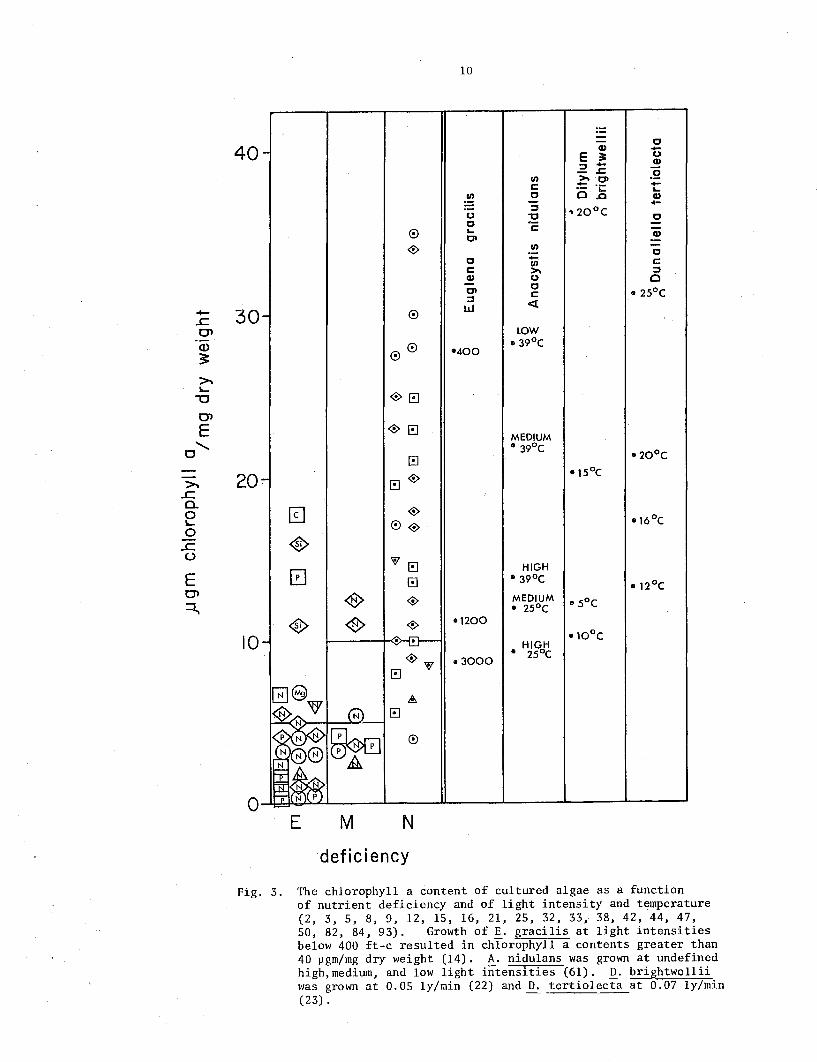
Figure 3 presents the chlorophyll content of cultured algae, together with some indication of the variation in the chlorophyll content of nutrient sufficient algae which can be induced by variations in light intensity and temperature. The chlorophyll content of extremely N or P deficient algae clustered below 7 ~gm/mg dry weight, while some other deficiencies resulted in higher chlorophyll contents. The chlorophyll contents of nutrient s~fficient algae spread over a broad range. Most of this spread mustf be,due to the variety of light intensities and temperatures at which the cultures were grown. The right-handside of Fig. 3 gives some idea of the variation that can be induced in the chlorophyll content of nutrient sufficient algae by variations in light and temperature. Each point indicates the chlorophyll content found at the intensity and/or temperature noted beside the point. Thus, Anacystis nidulans contained 9.4 ~gm chlorophyll a/mg dry weight at high intensity and 25°C and 14.3 ~gm/mg dry weight at the same light intensity at 39°C. In spite of these marked effects of light and temperature, all values in the righthand side of Fig. 3 fell above the values of extremely N and P deficient algae on the left-hand side. The data in Fig. 3 suggest that chlorophyll values of 10 ~gm/mg dry weight indicate N and P sufficiency, while values below 5 ~gm/mg dry weight are confined to extreme N and P deficiency. ·
The distributions of the two major components of the algal cell, protein and carbohydrate, with nutrient deficiency are shown in Fig. 4. The overlap in values between nutrient sufficient and deficient algae is greater than in earlier figures. However, with relatively few exceptions, protein values greater than 400 ~gm/mg dry weight and carbohydrate values less than 300 ~gm/mg dry weight indicate nutrient sufficiency while protein below 300 and carbohydrate above 400 indicate nutrient deficiency. The major exception to this is the low carbohydrate contents of some nutrient-deficient algae. The lowest of these values were for N-deficient green algae and Si-deficient diatoms storing lipid rather than carbohydrate. The numbers along the righthand side of each panel in Fig. 4 indicate the protein and carbohydrate contents of Euglena gracilis growing without nutrient deficiency at the light intensities (in foot candles) indicated by the numbers, As in the case of chlorophyll contents, higher light intensities mimiced nutrient deficiency, giving the lowest protein and highest carbohydrate contents found for any nutrient-sufficient algae. The distribution of protein contents shows some interesting features. Among the nutrientsufficient cultures, blue-green algae were confined to the higher protein contents. Generally, N deficiency resulted in lower protein contents than did P deficiency.
The fact that nutrient deficiency has opposite effects on the protein and carbohydrate contents of algae suggested that the protein to carbohydrate ratio may be a more reliable indicator of nutrient deficiency than either protein or carbohydrate alone. Fig. Sa shows this to be true, the overlap between extremely deficient and not deficient algae being much reduced. The major overlap is in two Sideficient diatoms, storing lipid. The ratio of protein to carbohydrate and lipid (Fig. Sb} reduces the overlap still further. As in Fig. 4, the numbers along the righ~hand side of the panels illustrate the effect of light intensity on these ratios in E. gracilis, the highest
40 -
30 ,_
>. 20 ..c c.. 0 I.... 0
..c (.)
10
0
-
-
0 0
0
0 0
00
0 El
El
El 0
@] 0 0 0
<B> w El
0 El
<8> 0
<B> <8> 0 ,:,.~
0 El w
G6l &.
~ (N) El
N
N
~ 0 @®
rtL~ .A
~1&\c~ E M N
deficiency
10
·-·-- CJ -CD -E :;:: 0
:::J .... CD
- .c. :§ (J) >t·CJ) c - ·- -·- "'" "'" (J) CJ O.c CD - -::J ~20°C 0 ~ CJ
CJ c -"'" -0' CD ·-(J) -CJ CJ .... c (J) c >. ::J CD 0 0 0' CJ
• 25°C c :::J <( LLJ
LOW • 39°C
•400
MEDIUM • 39°C
•20°C
•15°C
•16°C
HIGH • 39°C
• 12°C MEDIUM • 5°C • 25°C
•1200 •10°C
··3000
HIGH • 25°C
Fig. 3. The chlorophyll a content of cultured algae as a function of nutrient deficiency and of light intensity and temperature (2, 3, 5, 8, 9, 12, 15, 16, 21, 25, 32, 33, 38, 42, 44, 47, SO, 82, 84, 93). Growth of E. gracilis at light intensities below 400 ft-c resulted in chlorophyll a contents greater than 40 ~gm/mg dry weight (14). A. nidulans was grown at undefined high,medium, and low light intensities (61). D. brightwellii was grown at 0.05 ly/min (22) and D. tertiolecta at 0.07 ly/min (23) .

.......
..c. 0' a.> ~
>. ~
'"0
0'
E ..........
c: ·-a.> ....... 0 ~
0..
E 0'1 ~
11
A B ~0
<€> 700 700 -
0
<€>0 0~
600 0 .......
00 0 ..c. 0 0'
600 -0~ a.>
G ~
500
~ 400 0
0
300
0 0 >.
~
<!;>0~ "'0 0
~ 0'1
~0 0 E
0 0 <;> a.>' .......
0 190 0 120 ~
0 00 400 "'0
>.
000 ..c. 0
0 0 65 ...() ~
0 3000 u 1200
E 0'
500
400
300
·~ - N N P
N 0 0 3000
@* 1200
~ - ~ @ 0~ w
<? G 00
- 0 0;0
<8>0 <€>G
@ 0 :::J.. 800
200 0 200 - 0 8 00
<B>~ 'W
<€>8 0 G
100 100 - 190
G.J 0 65
·0 0120
0 -'----1...-----L---....,
E M· N 0
_j
E M N
deficiency
Fig. 4. The protein and carbohydrate contents of cultured algae as a function of nutrient deficiency (1, 3, 6, 8, 13, 15, 20, 31, 32, 33, 38, 42, 44, 47, 50, 62, 63, 80, 84, 87, 92, 93). Symbols explained in the text. The numbers on the right-hand side of each panel indicate the light intensities (in ft-c) which resulted in the corresponding protein and carbohydrate contents in exponentially-growing Euglena gracilis (14) .

a.> -0 1-
'"0 >.
..c 0
..a 1-0 (.)
......... c a.> -0 1-0..
12
A B 4 2.0
190
0
3 ®W 1.5
'"0
0 0..
0 + 4?> 00 a.> 0 -0 0 1- 0
'"0 0 . 120 0 >.
..c w 0190
0 0 ..a
2 ® 1- 1.0 0 0 0 (.)
c' 0
0
<B> 0 a.> w 6.5 - 4?> 00 0 1-
0 0.. 400
0400
w 0
0 § 00 <$> 0 0.5 0 3000
0 ~ 1200
1200
@ 3000 G
o~--~----~--~ o~--~----~--~
E M N E M N deficiency
Fig. S. The protein/carbohydrate and protein/carbohydrate+ lipid ratios of cultured algae as a function of nutrient deficiency (1, 3, 6, 8, 13, 15, 20, 33, 38, 42, q. 62, 63, 80, 84, 92, 93). Symbols explained in the text. Some exponentiallygrowing algae had ratios higher than the scale used. The numbers on the right-hand side of each panel indicate the l:tght intensities (in ft-c) which resulted in the corresponding ratios in exponentially-growing Euglena gracilis (14).

13
intensities g1v1ng the lowest ratios. Fig. 5 suggests that protein to carbohydrate ratios below 0.8 generally indicate N or P deficiency while those above 1.2 indicate nutrient sufficiency. For the protein to carbohydrate and lipid ratio, the corresponding values are 0.5 and 0.7.
Fig. 6 illustrates the distribution of RNA and DNA content with nutrient deficiency in algal cultures. The data here are fewer than for the other parameters. While there is a suggestion of a cluster of low values in extremely nutrient deficient cultures, the spread in all values is too great to allow these measurements to be reliable alone as indicators of nutrient status.
METABOLIC INDICATORS OF NUTRIENT STATUS
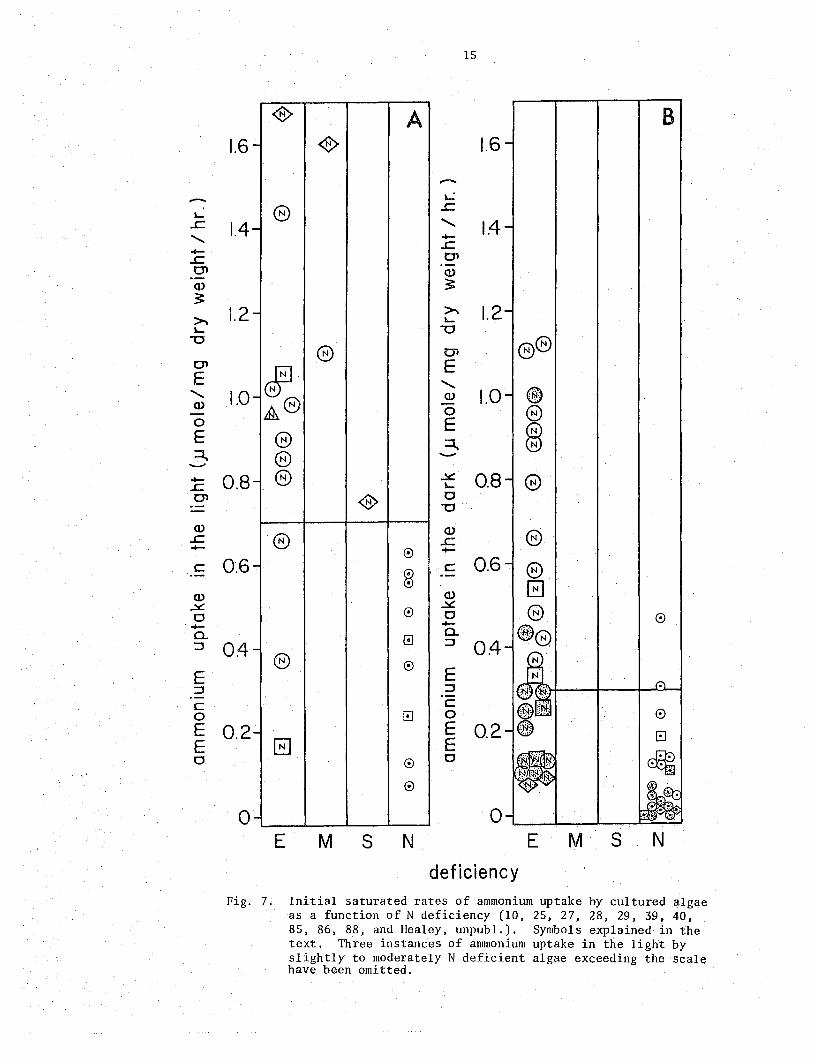
Initial saturated rates of ammonium uptake in the light and dark as a function of N deficiency are given in Fig. 7. Generally rates in the light (probably saturating for uptake in most or all cases; Fig. 7a) were up to twofold greater than those in the dark (Fig. 7b). Similar increases in rates with N deficiency were evident in both the light and dar~, but in both situations, there was some overlap between the rates seen inN-sufficient and N-deficient algae. This overlap seems more serious in ammonium uptake in the dark. However, it is interesting to note that the lowest rates for ammonium uptake in the dark by both N deficient and N sufficient algae come; from one laboratory (these are shaded in Fig. 7b), while the other, generally higher, results come from 3 other laboratories. If less emphasis is placed on the shaded symbols, a dark ammonium uptake rate of between 0.2 and 0.3 ~moles/mg dry weight/hr can be taken as a tentative cutoff between N sufficiency and N deficiency. The cutoff for ammonium uptake in the light seems to be between 0.6 and 0.8 ~mole/mg dry weight/hours, Algae with slight to moderate N deficiency had uptake rates in the light as high as or higher than extremely deficient ones. Saturated rates of nitrate uptake also increase with N deficiency (25, 88). However, the usefulness of this response as an indicator of N deficiency is doubtful because nitrate reductase is l9st during N deficiency in some algae (24) but not in others (59).
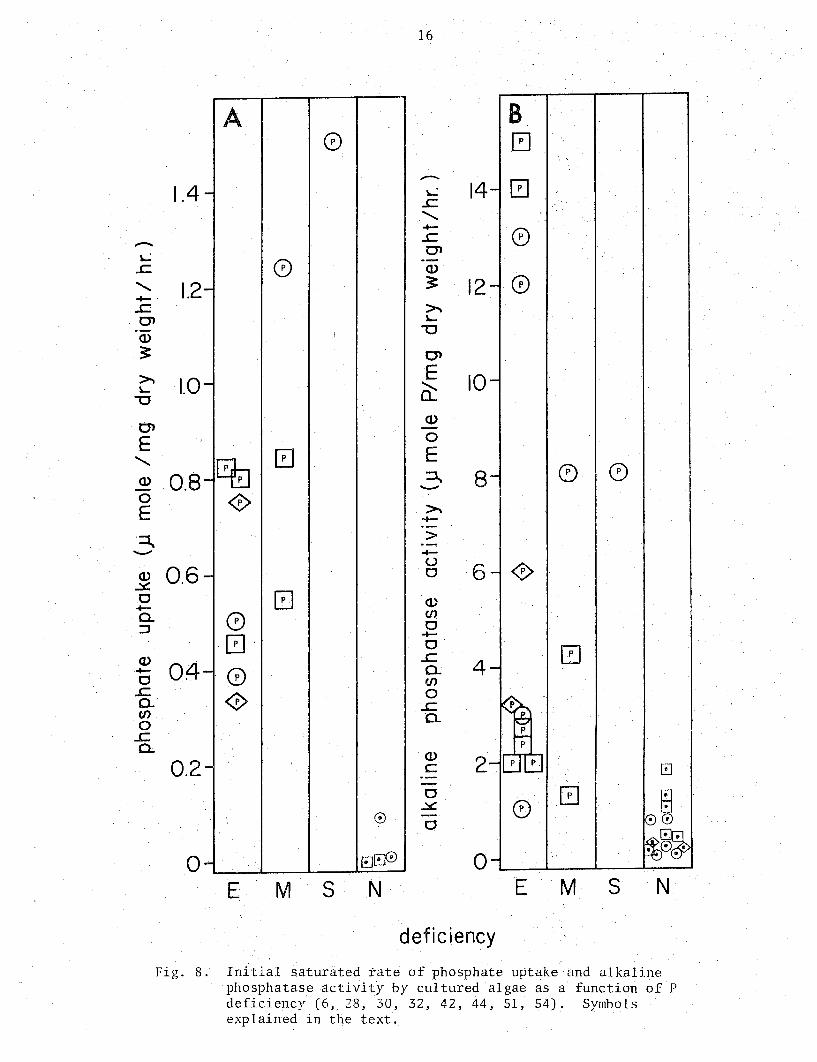
Two metabolic parameters related toP deficiency, the initial rate of phosphate uptake and the cellular alkaline phosphatase activity, are illustrated in Fig. 8. The phosphate uptake rate values are few but tentatively suggest that values below 0.1 to 0.2 ~moles/mg dry weight/hr indicate P sufficiency while higher values, some degree of P deficiency. The more abundant alkaline phosphatase values suggest that rates below 1 jJmole/mg dry weight/hr are indicative of P sufficiency while those above 2 are likely to be associated with P deficiency. These values were obtained using p-nitrophenyl phosphate as substrate, and may not be applicable to other substrates.
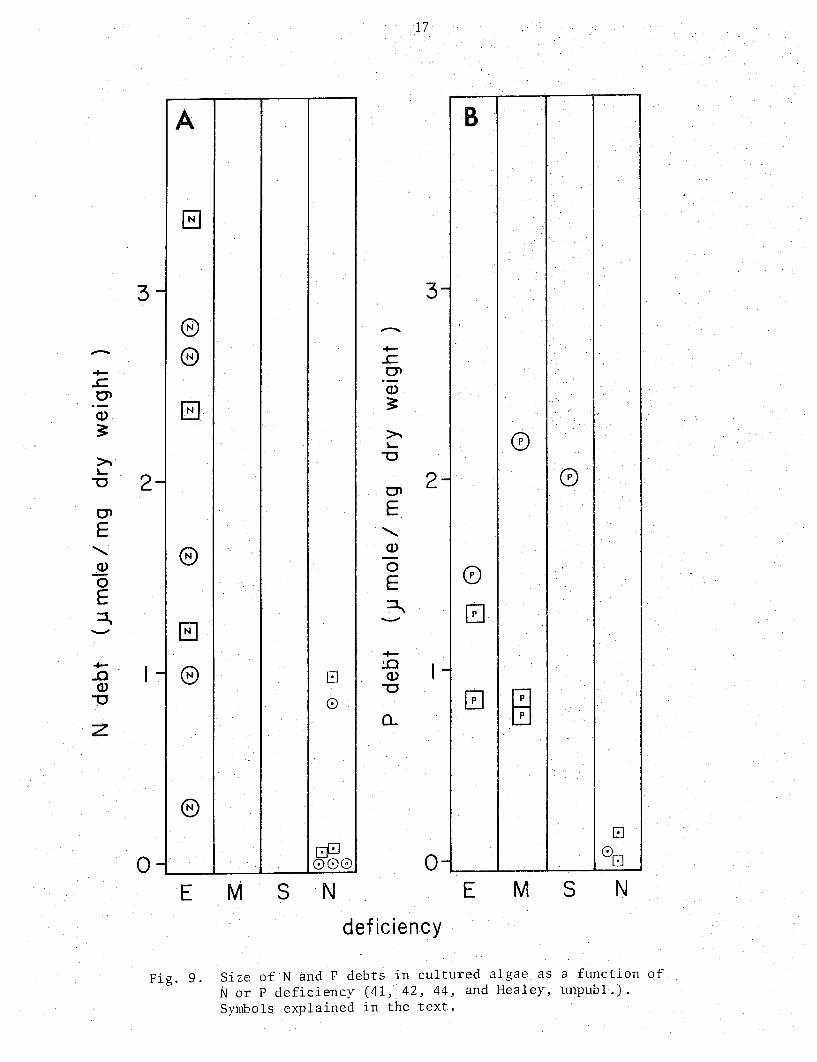
Fig. 9 illustrates the variation in the size of N and P debts with N and P deficiency. There are sufficient measurements to arrive at only tentative figures, but debts greater than abc.mt 1 ~mole N or P/mg dry weight may be taken as indicative of N or P deficiency, respectively, while debts approaching zero certainly indicate lack of deficiency.

-.c. c:n Q)
3
>-!.....
""0
Ol
E <!' z cr:
E Ol ::1..
A !::J
140 -
120 -
100 -
0
80 B G -
60 - (i)
0 0
40 <$> 0 -
0 0
20 - 09 0
0 &!,e & . ·-,:y
E M N
I
14
30 ,_
-..c Ol a.> 3
,_ Dl20 E
......... <( z 0
E 01 ::J..
10 -
0
B
<B>
v
9
0[!] @00
E
deficiency
0
~
'W
G 0
0
0 0
0 0
G 0
M N
Fig. 6. The RNA and DNA contents of cultured algae as a function of nutr.ientdeficiency (3, 33, 44, 47, 65, 70, 84, 93). Symbols explained in the text. ·
........ )....
..c.
' -..c. Ol Q)
3: >. )....
""0
Ol E
' Q) -0 E ::J.. ........ -..c. Ol
Q) ..c. -c
Q) ~ 0 -0. :J
E :J
c 0
1.6
1.4
1.2
1.0
0.8
0.6
04
<8> - <8>
@ -
-
@
-~ A.N @ @
- @
<8>
'@
-
-®
15
A B 1.6
......... ~
..c.
' 1.4 -..c. Ol Q)
3:
>. 1.2 "-""0
Ol
E e®
' ® Q) 1.0 . . 0 ® E ® ::J.. ..._..
...l!::: 0.8 ® )....
0 ""0
Q) ® ..c:
0
ffi . -c 0.6 ® Q) 0
0
[!]
...l!::: ® 0 0 - ®@ 0.
::J 0.4 0 E
::J c
[!] 0 0 E 0.2 -
B E 0.2 El E E
0 0 0 ~ . '
0
0 - 0 E M s N E M s N
deficiency Fig. 7. Initial saturated rates of ammonium uptake by cultured algae
as a function of N deficiency (10, 25, 27, 28, 29, 39, 40, 85, 86, 88, and Healey, unpubl.). Symbols explained in the text. Three instances of ammonium uptake in the light by slightly to moderately N deficient algae exceeding the scale have been omitted.
-~ ..c
' -..c Cl Q)
3: ~ ~
'U
Cl
E
' Q)
0 E ·~
...........
Q) .::s:. c -a. :::J
Q) -c ..c a. (/)
0 ..c a.
16
A B 0 0
1.4 - -~ 14 ..c
- 0 ......... -..c Cl
0
1.2 0
-Q)
~ 12 - 0 ~ ~
.I 'U
Ol
1.0 - E 10 0:: -
Q)
0
0.8 -C%J 0 E
~ 8 ........... - 0 0
0 >. -> -0.6 -
0 6 0 - 0
0 0
Q) (/)
c
04 0
- 0 -0 ..c
4 a. (/)
0 -
0 0 ..c 0.. ~ ~
..!.. p
0.2 -Q) 2 c - L~Jl!J 0
0
0
- El~
0 .::s:. -c
0
0 [!] ~
®0
~~ -E M s N E M s N
deficiency
Fig. 8. Initial saturated tate of phosphate uptake and alkaline phosphatase activity by cultured algae as a function of P deficiency (6, 28, 30, 32, 42, 44, 51, 54). Symbols explained in the text.
-+-..c O'l (])
~
~ lo....
"'0
O'l E
' .cv 0 E ~ -+-..a (1)
"'0
·Z
17
A B
0
3 - 3 -
@
@ '
[~J .. · ..
0
2 - Ol - 0 2
@
EJ - @
@
0 -E M s
c:J
8
~8 N
E
' (])
0 E ::1...
+-!.0 Q)
""0
0...
0
deficiency
0
0
-0 tE
c:J 0 - c:J
E M s N
Fig. 9. Si i.e of N and F debts in cultured algae as a function of Nor P deficiency (41, 42, 44, and Healey, unpubl.). Symbols explained in the text.

18
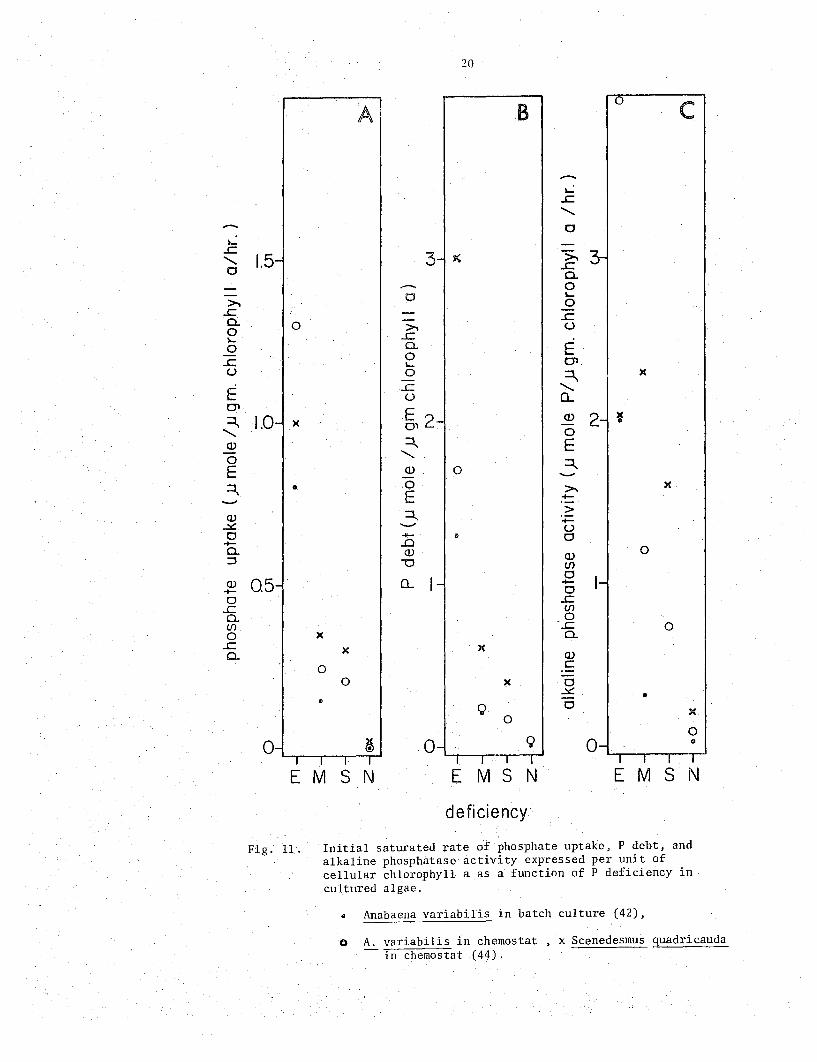
Expressing metabolic indicators of N deficiency per unit of cellular N or those of P deficiency per unit of cellular P rather than on a dry weight basis should show the presence of deficiency more clearly. This is e~)ected because the reaction (nutrient uptake or phosphatase) increases while the nutrient content decreases with increasing defl.ciency. This is illustrated for two indicators of P deficiency in Figure 10, Since the chlorophyll content of algae also decreases with increasing deficiency, metabolic indicators of N and P defici.ency expressed per unit of chlorophyll can be expected to be more sensitive to increasing deficiency than are the same parameters expressed per unit of dry weight .. Limited results for three. indicators of P de!iciency are shown in Fig." 11. Metabolic measurements from natural populations expressed per unit of chlorophyll should also be less subjett to interference from detritus than are those expressed on a dry weight or C basis. The ATP content of cellular mate:rial can also be expected to decrease w:lth increasing nutrient deficiency. Expressing rates per unit of sestmi.ic ATP may prove to be the best means of comparing these measurements on natural populations. However, theTe does not se.em to be any data of this sort on cultured material to use in interpreting field measurements.
The effects of deficiencies other than N on N uptake reactions and P on P up.take and phosphatase reactions have not been studied. However, Kuenzler and PeTras (55) report much higher alkaline phosphatase activities in several algae when P deficient than when deficient in a variety of .otheT nutrients.
CONCLUSIONS
The results summarized in Figs. 1-11 show that phylogenetically and ecdlogil=ally diveTse algae are similar enough in t.heir nutrient deficiency.symptoms for these symptoms to be used as indicators of m.itTient deficiency. However, it should be emphasized that most of the results in the figures are for gTeen and b1ue-gTeen algae and diatoms; more observations on chrysophytes, cryptomonads and dinoflagellates are needed. ~leasurements onnatural or enclosed blooms of algae fall into the same ranges as shown in Figs. 1-11 (4, 45, 58), showing that cultured and naturally-occurring alga.e behave similarly enough for the results of cultural studies to be applied to natura 1 populations. On the basis of Figures 1-9, the approximate division points between extremely, mocier~tely and not deficient algae shown in Table 4 are suggested. Those values in Table 4 expressed on a dry 1veight basis may find a inci're widespread ecological application ex--pressed per unit C. These values will be approximately twice those in Table 4. Values for metabolic indicators expressed per unit cellular N, P, or chlorophyll are as yet based on too few studies for even tentative division points to be suggested. Comparison of measurements on natural populations with the values shown in Table 4 should reveal the presence

-
(J) (.)
(J)
0
30
E ~- 20
......... (J)
0 E
(J) -0 ..c. 0.. en 0
..c. 0.
10
0
-
-
-
-
-
- · ..
-
0 A
0
0 <?
0 <2> ~
' " 080
E M N
19
(1.) (.)
(J)
0 E ~
......... a.. (I)
0 E ~
>
CD en 0 -
60 -
-
40 -
_g 20 1-
0.. (/) 0
..c. 0..
CD c 0
.::s:. 0
deficiency
-
0 -
0 B
0
0
0
0
0
000
E M N
Fig. 10. Initial saturated rate of phosphate uptake and alkaline phosphatase activity expressed per unit of cellular P as a function of P deficiency in cultured algae (6, 42, 44, 54). Symbols explained in the text. ·
20
0 B A c
...-.. ~
..c
......... - 0 ~
..c >- 3-......... 1.5- 3- " 0 ..c a.
.......... 0
>. 0 I... 0
..c a. 0
..c 0 >. (.)
lo... ..c 0 a. E 0 ..c !.... Ol (.) 0 =\ )(
E ...c ......... () 0...
CJl
~)2-~ 1.0- )( (1) 2- 'S
......... 0 Q) ::::1.. E 0 .........
E Q) 0 =1.. -=\ .. 0 >. )(
- E -Q) 4. >
...:.::: ...._... -(.) 0 - " 0 +- _o a. Q.) 0 ::J "0
(1) (/)
Q) 0.5- 0... 1-0 1--+- 0
0 ..c ..c (/)
a. 0 IJ) ·..c 0 0 )( a.
..c )( )( a. (1)
0 c 0 )( 0
...:.::: • • 9 0 0
)(
0
0- ~ 0- Q 0- " I r I I T T T T I I I I
E M s N E M s N E M s N
deficiency
Fig. u. Initial saturated rate of phosphate uptake, P debt, and alkaline phosphatase activity expressed per unit of cellular chlorophyll a as a function of P deficiency in cultured algae.
" Anabaena variabilis in batch culture (42),
0 A. variabilis in chemostat , x Scenedesmus guadricauda in chemostat (44).

21
Table 4. Approximate division points between nutrient-deficient and nutrient-sufficient algae on the basis of several physiological indicators.
).lgm/mg dry weight
cellular N
cellular p
protein
carbohydrate
chlorophyll a
weight ratios
N/P (P deficiency)
N/C
protein/carb6hydrate
protein/carbohydrate +
).lrnole/mg dry weight/hr
ammonium uptake, light
dark
phosphate uptake, light
alkaline phosphatase
).lmole/mg dry weight
N debt p debt
lipid
extreme deficiency
< 40
< 5
<300·
>400
< 5
> 10
< 0.10
< 0.7
< 0.5
> 0.7
> 0.3
> 0.2
> 2
> 1.0
> 0.5
>
>
>
>
>
>
moderate deficiency
40-70
5-10
300~400
300-400
5-10
0.10-0.13
0.7-1.2
0.5-0.6
0.7
0.3
0.2
2
1.0
0.5
no deficiency
> 70
> 10
>400
<300
> 10
< 10
> 0.13
> 1.2
> 0.6
< 0.7
< 0.3
< 0.2
< 2
< 1.0
< 0.5

22
or absence of nutrient deficiencies and indicate the severity of N or P deficiency· if present. This information should be useful in at least 3 areas.
Measurement of selected physiological indicators could supplement or replace growth bioassays in establishing and identifying limiting nutrients. The physiological indicators are preferable to growth bi6assays in referring directly to the population present at the time rather than to the water, and in being rapidly completed, leaving less chance for the introduction of artifacts due to prolonged enclosure. Given the accumulating evidence that P appears to be generally the primary limiting nutrient in fresh \vaters (75) and N in marine waters (73), physiolbgical indicators of nutrient deficiency may be most useful ih following details of nutrient limitation in time and space. Especially _when performed on separated components of mixed populations, greater insight into species successiol). may be gained,
Closely related to this is the use of p~ysiological indicators to follow the course of algal populations, from the viewpoint of physiological state as well as nutrient limitation, with greater sensitivity than measurement of population size and external nutrients allows. This possibility can perhaps be best illustrated by referring to some results of chemostat cultures. With a variety of limiting nutrients, growth rates from neal' maximal to very 101-.r are routinely obtained with no detectable variation in the external concentration of the limiting nutl'ient. At all growth rates, the limiting nutrient is at or below present limits of detection. However, there are great variations in· the internal conc.entrat~ons of the limiting nutrient and other aspects of the cellular composition. Growth rate is found to be an approximately hyperbolic function of the internal concentration of the limiting nutrient (9, 18, 19, 70). Similarly, with little variation in external.N and P concentratiohs, large changes in internal nutrients and composition have been observed during the course of blooms of Aphanizomenon flos-aquae (45).
Finally, knowledge of variations in the biochemical composition of algae ,especially the major co)llponents, may be as important as changes in algal species in understanding changes in zooplankt011 populations. Nutrient-deficient algae with n low protein to carbohydrate ratio could be a far different food source than nutrient-sufficient algae with a higher protein content.
The tables, as presented here, will be useful in inteTpreting measurements on natural populations only where one or more of the parameters considered is measured with either dry weight or cell C. Hopefully, this report will encourage more such measurements, either on total seston samples where organic detritus is low or on isolated components of natural plankton which can be largely freed of organic detritus. More measurements of these potential indicators as a function of nutrient deficiency in culture are also needed, with special emphasis on the simultaneous measurement of several indicators including cell Cor dry weight, N, P, chlorophyll and ATP as possible bases for comparison. Such studies should help further to bridge the gap between physiology and ecology.

23
REFERENCES
1. AACH, H.G. 1952. Uber Wachstum und Zusammensetzung von Chiarella pyrenoidosa bei unterschiedlichen Lichtstarken und Nitratmangen. Arch. Mikrobiol. 17:213-246.
2. AACH, H.G. 1953. Uber Abbau und Regeneration der Chloroplastenfarbstoffe bei Chiarella. Arch. Mikrobiol~ 19:166-173.
3. ALLEN, M~M., and A.J. SMITH. 1969. Nitrogen chlorosis in bluegreen algae. Arch. Mikrobiol. 69:114-120.
4. ANTIA, N.J., C.D. M¢ALLISTER, T.R. PARSONS, K. STEPHENS, and J.D.H. STRICKLAND. 1963. Further measurements of primary production using a large~volume plastic sphere. Limnol. Oceanogr. 8:166-183.
5. ARNON, D.L, P.S. ICHIOKA, G. WESSEL, A. FUJIWARA, and J.T. WOOLLEY. 1955. Molybdenum in relation to nitrogen metabolism. I. Assimilation of nitrate nitrogen by Scenedesmus. Physiol. Plant. 8:538,...551.
6. BATTERTON, J.C., and C. VAN BAALEN. 1968. Phosphorus deficiency and phosphate uptake in the blue-green alga Anacystis nidulans. Can. J. Microbial. 14:341-347.
7. BONE, D .H. 1971. Relationship between phosphates and alkaline phosphatase of Anabaena flos-aquCJ.e in continuous culture. Arch. Mikrobiol. 80:147~153.
8. BONGERSj L.H.J. 1956. A~pects of nitrogen assirnilatiqn by cultures of green algae. Medede1. Landbouwhogeschool Wageningen. 56(15): 1-52.
9. CAPERON, J., and J. MEYER. 1972. Nitrogen-limited growth of marine phytoplankton. I. Changes in population characteristics with steady-state growth rate. Deep-Sea Res. 19:601-618.
10. CAPERON, J., and J. MEYER. 1972. Nitrogen-limited growth of marine phytoplankton. II. Uptake kinetics and their role in nutrient limited growth of phytoplankton. Deep.-Sea Res. 19: 619-632.
11. CARPENTER, E .J. 1970. Phosphorus requirements of two planktonic diatoms in steady state culture. J. Phycol. 6:28-30.
12. COBB, H.D., and J. MEYERS. 1964. Comparative studies of nitrogen fixation and photosynthesis in Anabaena cylindrica. Am. J. Bot, 51:753-762.

24
13. COLLYER, l1.~l., and G.E. FOGG. 1955. Studies on fat accumulation by algae. J. Expl. Bot. 6:256-275.
14. COOk, J.R. 1963. Adaptations in growth and division in Euglena affected by energy supply. J. Protozoal. 10:436-444.
15. COOMBS, J., W.M. DARLEY, 0. HOLM-HANSEN, and B.E. VOLCANI. 1967. Studies on the biochemistry and fine structure of silica shell formation in diatoms. Chemical composition of Navicula pelliculosa during silicon-starvation synchrony. Plant Physiol. 42:1601-1606.
16. DALEY, R.J., and S.R. BROWN. 1973. Chlorophyll, nitrogen and photosynthetic patterns during growth and senescence of two blue-green algae. J. Phycol. 9:395-401.
17. DAS, G. 1968. Grmvth and appearance of Scenedesmus as influenced by deficient inorganic nutrition. Sven. Bot. Tidskr. 62:457-462.
18. DAVIES, A.G. 1970. Iron, chelation and the growth of marine phytoplankton. I. Growth kinetics and chlorophyll production in cultures of the euryhaline flagellate Dunaliella tertiolecta under iron-limidng conditions. J. Mar. Bioi. Assn. U.K. 50:65-86.
19. DROOP, M.R. 1970. Vitamin B1 , and marine ecology. culture and an approach to ... nutritional kinetics. Wiss. Meeresunters. 20:629-636.
V. Continuous Helga lander
20. EICHf!ORN, M. 1969. Zur Stoffproducktion kontinuierlicher Kulturen von Scenedescus ob liquus (Turp.) l~utzing im Dauerlicht bei Phosphat- und Nitratlimitation. Flora A 159:494-506.
21. ELEY, J .1-1. 1971. Effect of carbon dioxide concentTation on pigmentation in the blue-green alga Anacystis nidulans. Plant Cd l Physiol. 12:311-316.
22. EPPLEY, R.W. 1972. Temperature and phytoplankton growth in the sea. Fish. Bull. 70:1063-1085.
23. EPPLEY, R.W., and P.R. SLOAN. 1966. Growth rates of marine phytoplankton: correlation with light absorption by cell chlorophyll a. Physiol. Plant. 19:47-59.
24. EPPLEY, R.iV., J.L. COATSWORTH, and L. SOLORZANO. 1969. Studies of nitrate reductase in marine phytoplankton. Limnol. Oceanogr. 14:194-205.
25. EPPLEY, R.W., and E.II. RENGER. 1974. Nitrogen assimilation of an oceanic diatom in nitrogen-limited continuous culture. J. Phycol. 10:15-23.

25
26. FINDENEGG, G.R., H. PASCHINGER, and E. BRODA. 1971. Untersuchung der Lichtabhangigheit der Aufnahme von Rubidium, Zink, Kobalt, Blei und Cer durch Chlorella nach einer Flussmethode. Planta 99:163-173.
27. FITZGERALD, G.P. 1968. Detection of limiting or surplus nitrogen in algae and aquatic weeds. J. Phycol. 4:121-126.
28. FITZGERALD, G.P. 1969. Field and laboratory evaluations of bioassays for nitrogen and phosphorus with algae and aquatic weeds. Limnol. Oceanogr~ 14:206-212.
29. FITZGERALD, G.P. 1970. Evaluations of the availability of sou:rces of ni t:rogen and phospho:rus for algae. J. Phycol. 6:239-24 7.
30. FITZGERALD, G.P., and T.C. NELSON. 1966. Ext:ractive and enzymatic analyses for limiting or surplus phosphorus in algae. J. Phycol. 2:32-37.
31. FOGG, G.E., and D.M. COLLYER. 1953. The accumulation of lipides by algae. In: J.S. Burlow (ed.), Algal culture f:rom laborato:ry to pilot plant. Carn. Inst. Wash. publ. 600:177-181.
32. FUHS, G.iy.J S.D. DE~flv1ERLE, E. Ci\NELLI, and M. CHEN. 1972. Characte:ri zation of phospho:rus-limi ted plankton algae. In: G.E. Lickens (ed.), Nutrients and Eutrophication. Am. Soc. Limnol. Oceanog:r. Spec. Symp. 1:113-133.
33. GALLING, G. 1963. _,.'\nalyse des Magnesiwn-Mangels bei S)'11chronisierten Chlorellen. Arch. Mikrobiol. 46:150-184.
34. GERLOFF, G.C. 1969. Evaluating nutrient supplies for the g:rowth of aquatic plants in natural waters. In: G.E. Lickens (ed.), Nutrients and Eutrophication. Am. Soc. Limnol. Oceanogr. Spec. Symp. 1:-537-555.
35. GERLOFF, G.C., and F. SKOOG. 1954. Cell contents of nit:rogen and phosphorus as a measure of their availability for growth of ~licrocystis aeruginosa. Ecology 35:348-353.
36. GRANT, B,R. 1968. The effect of CO? concentration and buffer syste~ on nitrate and nitrite as~imilation by Dunalie1la tertiotecta. J. Gen. Microbial. 54:327-336.
37. GRANT, B.R., and I.M. TURNER. 1969. Light-stimulated nitrate and nitrite assimilation in several species of algae. Comp. Biochem. Physiol. 29:995-1004.
38. CUERIN-DU!'v!ARTRAIT, E., S. MIHAI~A, and A. MOYSE. 1970. Composition de Ch1orella pyrenoidosa, structure des cellules et de leurs

26
lamelles chlotoplastiques, en function de la carence en azote et de la levee de carence. Can. J. Bot. 48:1147-1154.
39. HATTORI, A. 195 7. Studies on the metabolism of urea and other nitrogenous compounds in Chlorella ellipsoidea. I. Assimilation of urea and other nitrogenous compounds by N-starved cells. J. Biochem. 44:253-273.
40. HATTORI, A. 1958. Studies on the metabolism of urea and other nitrogenous compounds in Chlorella ellipsoidea. II. Changes in levels of amino acids and amides during the assimilation of ammonia and urea by nitrogen-starved cells. J. Biochem. 45:57-64.
41. HATTORI, A. 1960. Studies on the metabolism of urea and other nitrogenous compounds in Chlorella ellipsoidea. III. Assimilation of urea. Plant Cell Physiol. 1: 107-ll5.
42. HEALEY, F.P. Anabaena.
1973. Characteristics of phosphorus deficiency in J. Phycol. 9:383-394.
43. HEALEY, F.P. 1973. Inorganic nutrient uptake and deficiency in algae. CRC Critical Rev. Microbial. 3:69-113.
44. HEALEY, F.P., and L.L. HENDZEL. 1975. Effect of phosphorus deficiency on two algae growing in chemostats. J. Phycol. 11; 303-309.
45. HEALEY, F.'P., and L.L. HENDZEL. 1975. Physiological changes during the course of blooms of Aphanizomenon.flos-aquae. J. Fish. Res. Board Can. (in press).
46. HERBERT, D., P.J. PHIPPS, and R.E. STRANGE. 1971. Chemical analysis of microbial cells.· In: J.R. Norris and D.W. Ribbons (eds:), Methods in Microbiology Academic Press, N.Y., Vol. 5B:209-344.
47. HOBSON, L.A., and R.J. PARISER. 1971. The effect of inorganic nitrogen on macromolecular synthesis by Thalassiosira fluviatilis Hustedt and Cyclotella nana Hustedt grown in batch culture. J. Exp. Mar. Biol. Ecol--:--6:"71-78.
48. HOLM HANSEN, 0., J. COOMBS, B. E. VOLCANI, and P.M. WILLIAMS. 196 7. Quai}titative microdetermination of lipid carbon in microorganisms. Anal . B iochem. 19: 561-568.
49. HOLM HANSEN, 0., W.H. SUTCLIFFE, and J. SHARP. 1968. ~1easure
ment of deoxyribonucleic acid in the ocean and its ecological significance. Limnol. Oceanogr. 13:507-514.

27
SO. IHLENFELDT, ~I.J .A., and J. GIBSON. 1975. Phosphate utilization and alkaline phosphatase activity in Anacystis nidulans (Synechococcus) . Arch. Mic robiol. 102: 23-28.
51. JEANJEAN, R. 1969. Influence de la carence en phosphore sur I es vi tesses d' absorption du phosphate par les Chlorelles. Bull. Soc. Fr. Physiol. Veg. 15:159-171.
52. KETCHUM, B .H. 1939. The development and restoration of deficiencies in the phosphorus and nitrogen composition of unicellular plants. J. Cell. Comp. Physiol. 13:373-381.
53. KUENZLER, E .J. 1965. Glucose-6-phosphate utilization by marine algae. J. Phycol. 1:156-164.
54. KUENZLER, E.J., and B.H. KETCHUM. 1962. Rate of phosphorus uptake by Phaeodactyltun tricornutum. Biol. Bull. 123:134-145.
55. KUENZLER, E.J., and J.P. PERRAS. 1965. Phosphatast~s of marine algae. Biol. Bull. 128:271-284.
56. MacKINNEY, G. 1941. Absorption of light by chlorophyll solution. J. Biol. Chern. 140:315-322.
57. MATZKU, S., and E. BRODA. 1970. Die Zinkaufnahme in das Innere von Chlorella. Planta 92:29-40.
58. McALLISTER, C.D., T.R. PARSONS, K. STEPHENS, and J.D.H. STRICKLAND. 1961. Measurements of primary production in coastal sea water using a large-volume plastic sphere. Limnol. Oceanogr. 6: 237-258.
59. MORRIS, I., and P.J. SYRETT. 1965. The effect of nitrogen starvation on the activity of nitrate reductase and other enzymes in Chiarella. J. Gen. Microbial. 38:21-28.
60. MURPHY, J. _, and J.P. RILEY. 1962. A modified single solution method for the determination of phosphate in natural waters. Anal.. Chilli. Acta. :!7:31-:56.
61. MYERS, J., and W.A. KRATZ. 1955. Relations bet\-1een pigment content and photosynthetic charactci'istics in a blue-green alga. J. Gen. Physiol. 39:11-~2.
62. MYKLESTAD, S. 1974. Production of carbohydrates by marine planktonic diatoms. I. Comparison of nine different species in culture. J. Exp. Mar. Biol. Ecol. 15:261-274.
63. ~IYKLESTAD, S., and A. HAUG. 1972. Production of carbohydrates by the marine diatom Cha.etoceros affinis var. willei (Gran) Bustedt. I. Effect of the concentration of nutrients in the

64.
28
culture medium. J. Exp. Mar. Biol. Ecol. 9:125-136.
NORTH, B.B., and G.C. STEPHE:'JS. 1967. Uptake and assimilation of amino acids by Platymonas. Biol. Bull. 133:391-400.
65. PARENTI, F., S. DIPIERRO, and C. PERRONE. 1972. Differential effect of phosphate starvation on the rates of cell division and plastid repliction in Euglena. J. Protozoal. 19:524-527.
66. PERRY, M.J. 1972. Alkaline phosphatase activity in subtropical Central North Pacific waters using a sensitive fluorometric method. Marine Biology. 15: 113-119.
67. PICKETT, J .M. chemostat.
1975. Growth of Chiarella in a nitrate-limited Plant Physiol. 55:223-225.
68. PIPES, W.O. 1962. Carbon dioxide-limited growth of Chiarella in continuous culture. Appl. Microbial. 10:281-288.
69. REISNER, G.S., and J.F. THO~WSON. 1956. The large-scale laboratory culture of Chiarella under conditions of micronutrient element deficiency. Plant Physiol. 31:181-185.
70. RHEE, G.-Y. 1973. A continuous culture study of phosphate uptake, growth rate and polyphosphate in Scenedesmus sp. J. Phycol. 9:495-506.
71. RICHARDSON, B., D.M. ORCUTT, H.A. SCHWERTNER, C.L. 1v1ARTINE::I, and H.E. WICKLINE. 1969. Effects of nitrogen limitation on the growth and composition of unicellular algae in continuous culture. Appl. Microbial. 18:245-250.
72. RICKETTS, T.R. 1966. On the chemical composition of some unicellular algae. Phytochemistry. ~:67-76.
73. RYTHER, J.H., and W.M. DUNSTAN. 1971. Nitrogen, phosphorus, and eutrophication in the coastal marine environment. Science. 171:1008-1013.
74. SAKSHAUG, E., and S. MYKLESTAD. 1973. Studies on the phytoplankton ecology of the Tronheimsfjord. III. Dynamics of phytoplankton blooms in relation to environmental factors, bioassay experiments, and parameters for the physiological state of the populations. J. Exp. Mar. Biol. Ecol. 11:157-188.
75. SCHINDLER, D.W. 1971. Carbon, nitrogen, and phosphorus and the eutrophication of freshwater 1 akes. J. Phycol. 7:321-329.
76. SCOTT, G. T. 1943. The mineral composition of Chiarella pyrenoidosa grown in culture media containing varying concentrations of Ca, Mg, K, and Na. J. Cell. Camp. Physiol. 21:327-338.
29
77. SCOTT, G.T. 1945. The mineral composition of phosphate deficient cells of Chlorella pyrenoidosa during the restoration of phosphate. J. Cell. Camp. Physiol. 26:35-42.
78. SHRIFT, A. 1954. Sulfur-selenium antagonism. I. Antimetabolite action of selenate on the growth of Chlorella vulgaris. Am. J. Bot. 41:223-230.
79. SOLORZANO, L. 1969. Determination of ammonia in natural waters by the phenol hypochlorite method. Limnol. Oceanogr. 14:799-801.
80. SPOEHR, H.A., and H.W. MILNER. 1949. The chemical composition of Chlorella; effect of environmental conditions. Plant Physiol. 24 :120-149.
81. STAINTON, M.P., M.J. CAPEL, and F.A.J. ARMSTRONG. 1974. The chemical analysis of freshwater. Fish. Res. Board Can. Misc. Spec. Publ. 25:125 p.
82. STEVENS, S.E., and C. VAN BAALEN. 1973. Characteristics of nitrate reduction in a mutant of the blue-green alga Agmenellum quadriplicatum. Plant Physiol. 51:350-356.
83. STRICKLAND, J.D.H., and T.R. PARSONS. Wqter analysis (second edition). Bull. 125, 203 pp.
1965. A manual of sea Fish. Res. Board Can.
84. STRICKLAND, J.D.H., 0. HOLM-HANSEN, R.W. EPPLEY, and R.J. LINN. 1969. The use of a deep tank in plankton ecology. I. Studies of the growth and composition of phytoplankton crops at lm~ nutrient levels. Linmol. Oceanogr. 14:23-34.
85. SYRETT, P .J. 1953. The assimilation of ammonia by nitrogenstarved cells of Chlorella vulgaris. I. The correlation of assimilation with respiration. Ann. Bot. N.S. 17:1-19.
86. SYRETT, P .J. 1956. The assimilation of ammonia and nitrate by nitrogen-starved cells of Chlorella vulgaris. III. Differences of metabolism dependent on the nature of the nitrogen source. Physiol. Plant. 9:28-37.
87. TAUB, F.B., and A.M. DOLLAR. 1965. Control of protein level of algae, Chlorella. J. Food Sci. 30:359-364.
88. THACKER, A., and P.J. SYRETT. 1972. The assimilation of nitrate and ammonium by Chlamydomonas reinhardi. New Phytol. 71:423-433.
89. THOMAS, IV.ll., and R.W. KRAUS. 1955. Nitrogen metabolism in Sceneclesmus as affected by environmental changes. Plant Physiol. 30:113-122.

30
90. THOMAS, W.H., and A.N. DODSON. 1968. Effects of phosphate concentration on cell division rates and yield of a tropical oceanic diatom. Bioi. Bull. 134:199-208.
91. THOMAS, W.H., and A.N. DODSON. 1972. On nitrogen deficiency in tropical Pacific Oceanic phytoplankton. II. Photosynthetic and cellular characteristics of a chemostat-grown diatom. Limnol. Oceanogr. 17:515-523.
92. VAN BAALEN, C., and J.E. MARLER. 196.3. Characteristics of marine blue-green algae with uric acid as nitrogen source. J. Gen. Microbial. 32:457-463.
93. WERNER, D. 1966.. Die Kieselsaure im Stoffwechsel von Cyclotella cryptica Reimann, Lewin, and Guillard. Arch. Mikrobiol. 55: 278-308.