Embed Size (px)
Citation preview
Investigating the Presence of Nonlinear Personality—Job Performance Relationships
A Dissertation SUBMITTED TO THE FACULTY OF
UNIVERSITY OF MINNESOTA BY
Philip T. Walmsley
IN PARTIAL FULFILLMENT OF THE REQUIREMENTS FOR THE DEGREE OF
DOCTOR OF PHILOSOPHY
Paul R. Sackett, Adviser
July 2013

© Philip T. Walmsley 2013

i
Acknowledgements I have had the incredible fortune to be influenced professionally and personally by many mentors. It has been the opportunity of a lifetime to work closely with Paul Sackett, who has set such an incredibly high bar as an adviser, collaborator, and friend. I would like to thank each member of my committee, namely John Campbell, Aaron Schmidt, and Mark Davison, as well as Nathan Kuncel and Deniz Ones for contributing so much to enrich my education and experience. Steve Nichols and Jeff Foster deserve major acknowledgement for playing key roles in my dissertation research. Patrick Sharpe, Tom Kane, Chuck MacLane, and Carol Shoptaugh all provided guidance and opportunities that I will always appreciate. In addition, all of my colleagues and friends from the University of Minnesota, U.S. Office of Personnel Management, and Missouri State University deserve hearty thanks. I would like to thank Renee Vincent, my parents, and brothers for their encouragement and support. Most importantly, thanks to Renee for being my partner and secret weapon in all my endeavors.
ii
Abstract
This research examines the form of the relationship between Big Five-oriented
personality predictors and occupational performance throughout the predictor and
criterion score ranges. Building on rationale that individuals can be either “too low” or
“too high” in their standing on various personality attributes for optimal performance,
previous research has produced discrepant findings with regard to whether and when to
expect curvilinear relationships between these attributes and job performance. Previous
studies have relied on small samples and unsystematic sampling, a variety of
performance criteria, the use of personality inventories for which construct validity
evidence is not immediately available, and a focus on only one or two of the Big Five
personality factors (typically conscientiousness). If personality—performance
relationships exhibit nonlinearity within the score range where decisions are made, there
could be immediate implications for the inferences that could be drawn from the use of
such test scores, such as whether top-down or cutoff-score based uses are most
appropriate. Incorporating large sample (n > 11,000) operational personality and
performance data, this research had several goals: (a) replicate and extend previous
research on conscientiousness and emotional stability to clarify existing conflicts in
findings, (b) provide the first major tests of nonlinearity for agreeableness, openness, and
extraversion, and (c) use a theoretically linked framework to identify and test for relevant
occupation-level moderating variables by incorporating job complexity and personality
based job analytic information. Results showed a general lack of meaningful curvilinear
effects for each Big Five scale in relation to overall job performance. Any expected
iii
declines in performance at high ends of the predictor range were very small on average,
and would be highly unlikely to produce scenarios in which those passing a realistic cut
score would be expected to underperform those screened out due a curvilinear effect.
Indices of job complexity and the importance of the personality trait to performance did
not exhibit moderating effects for the forms of each personality—performance
relationship. Results are useful for evaluating whether nonlinearity is likely to be an issue
when self-report personality assessments are used to make decisions with tangible
employment consequences. Even with slight curvilinear trends for several of the scales
examined, the results suggest that curvilinearity is highly unlikely to present problems for
typical uses of personality test scores in employment settings.
iv
Table of Contents
List of Tables ................................................................................................................... vii
List of Figures ................................................................................................................... ix
Abstract .............................................................................................................................. ii
Introduction ........................................................................................................................ 1
Section 1: Literature Review ............................................................................................. 5
Defining Personality as the Domain of Interest ......................................................... 5
Personality Measurement in Industrial and Organizational Psychology .................. 10
Mixed Feelings About the Utility of Personality Predictors in the Workplace ........ 12
Questions of Interest in the Current Study ............................................................... 17
Theory and Evidence On Nonlinear Personality-Job Performance Relationships ... 20
Summary of Issues Related to the Inferences From Previous Studies ..................... 37
Possible Moderators of Personality—Job Performance Functional Forms .............. 40
Possible Moderators in Addition to Job Complexity ..................................... 43
Occupation-Relevant Personality Work Styles ................................... 45
Study Overview ........................................................................................................ 49
Section 2: Method ............................................................................................................ 50
Sample ...................................................................................................................... 50
Measures ................................................................................................................... 51
Hogan Personality Inventory (HPI) ............................................................... 51
Job Performance............................................................................................. 53
Occupation Characteristics from O*NET ...................................................... 59
v
Data Analysis ........................................................................................................... 62
Descriptive Statistics ...................................................................................... 62
Nonlinearity Analyses .................................................................................... 63
Analyses For Recommended Operational Scales .......................................... 67
Summary ............................................................................................. 67
Moderator Analyses ....................................................................................... 69
Section 3: Results ............................................................................................................. 73
Descriptive Information ........................................................................................... 73
Primary Nonlinearity Analyses ................................................................................ 74
Graphical Displays ......................................................................................... 74
Hierarchical Polynomial Regression Results ........................................................... 75
Conscientiousness Results ............................................................................. 75
Conscientiousness—Overall Performance Moderation Analyses ........ 76
Agreeableness Results ................................................................................... 77
Agreeableness—Overall Performance Moderation Analyses .............. 77
Emotional Stability Results............................................................................ 78
Emotional Stability—Overall Performance Moderation Analyses....... 79
Openness Results ........................................................................................... 79
Openness—Overall Performance Moderation Analyses ...................... 80
Extraversion Results ...................................................................................... 80
Extraversion—Overall Performance Moderation Analyses ................. 81
Further Considering the Concept of Statistical Significance ......................... 81
vi
Analyses for Recommended Scales ......................................................................... 82
Section 4: Discussion ....................................................................................................... 82
Summary of Findings ............................................................................................... 83
Comparison with Previous Findings .............................................................. 86
Moderation Analysis Comparison ................................................................. 88
When Does Departure From Linearity Matter? ....................................................... 89
Limitations, Additional Analyses, and Conclusions ................................................ 91
Construct Validity .......................................................................................... 92
Criterion Focus............................................................................................... 96
The Meaning of Moderation .......................................................................... 97
Curvilinearity in Context ............................................................................... 99
References ...................................................................................................................... 101
Appendix A. Sampling of Meta-Analytic Criterion-Related Validity Estimates for Big
Five Personality Predictors ................................................................................ 159
vii
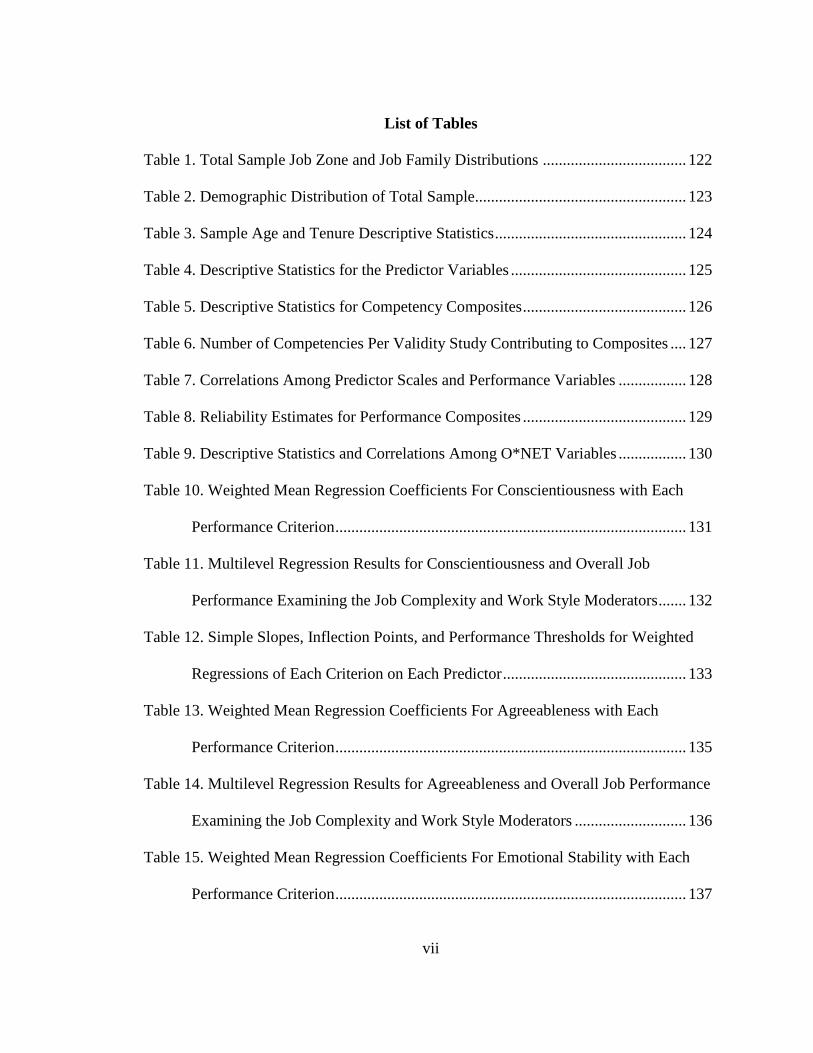
List of Tables
Table 1. Total Sample Job Zone and Job Family Distributions .................................... 122
Table 2. Demographic Distribution of Total Sample ..................................................... 123
Table 3. Sample Age and Tenure Descriptive Statistics ................................................ 124
Table 4. Descriptive Statistics for the Predictor Variables ............................................ 125
Table 5. Descriptive Statistics for Competency Composites ......................................... 126
Table 6. Number of Competencies Per Validity Study Contributing to Composites .... 127
Table 7. Correlations Among Predictor Scales and Performance Variables ................. 128
Table 8. Reliability Estimates for Performance Composites ......................................... 129
Table 9. Descriptive Statistics and Correlations Among O*NET Variables ................. 130
Table 10. Weighted Mean Regression Coefficients For Conscientiousness with Each
Performance Criterion ........................................................................................ 131
Table 11. Multilevel Regression Results for Conscientiousness and Overall Job
Performance Examining the Job Complexity and Work Style Moderators ....... 132
Table 12. Simple Slopes, Inflection Points, and Performance Thresholds for Weighted
Regressions of Each Criterion on Each Predictor .............................................. 133
Table 13. Weighted Mean Regression Coefficients For Agreeableness with Each
Performance Criterion ........................................................................................ 135
Table 14. Multilevel Regression Results for Agreeableness and Overall Job Performance
Examining the Job Complexity and Work Style Moderators ............................ 136
Table 15. Weighted Mean Regression Coefficients For Emotional Stability with Each
Performance Criterion ........................................................................................ 137
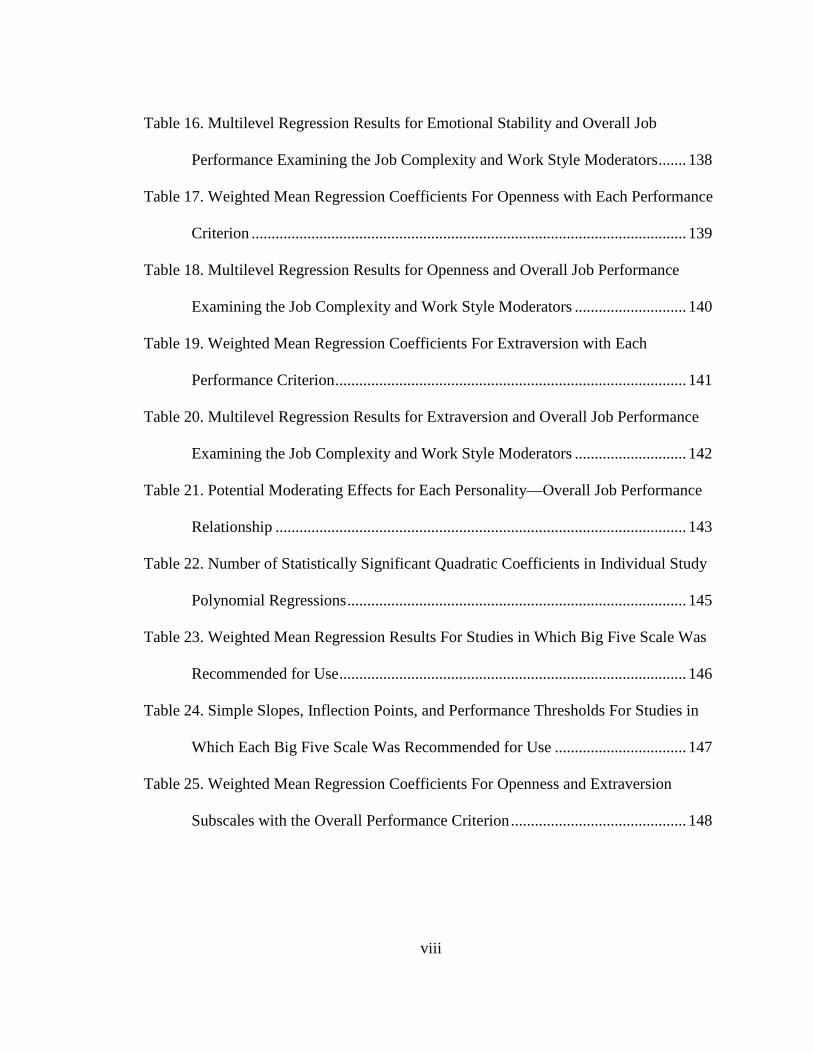
viii
Table 16. Multilevel Regression Results for Emotional Stability and Overall Job
Performance Examining the Job Complexity and Work Style Moderators ....... 138
Table 17. Weighted Mean Regression Coefficients For Openness with Each Performance
Criterion ............................................................................................................. 139
Table 18. Multilevel Regression Results for Openness and Overall Job Performance
Examining the Job Complexity and Work Style Moderators ............................ 140
Table 19. Weighted Mean Regression Coefficients For Extraversion with Each
Performance Criterion ........................................................................................ 141
Table 20. Multilevel Regression Results for Extraversion and Overall Job Performance
Examining the Job Complexity and Work Style Moderators ............................ 142
Table 21. Potential Moderating Effects for Each Personality—Overall Job Performance
Relationship ....................................................................................................... 143
Table 22. Number of Statistically Significant Quadratic Coefficients in Individual Study
Polynomial Regressions ..................................................................................... 145
Table 23. Weighted Mean Regression Results For Studies in Which Big Five Scale Was
Recommended for Use ....................................................................................... 146
Table 24. Simple Slopes, Inflection Points, and Performance Thresholds For Studies in
Which Each Big Five Scale Was Recommended for Use ................................. 147
Table 25. Weighted Mean Regression Coefficients For Openness and Extraversion
Subscales with the Overall Performance Criterion ............................................ 148
ix
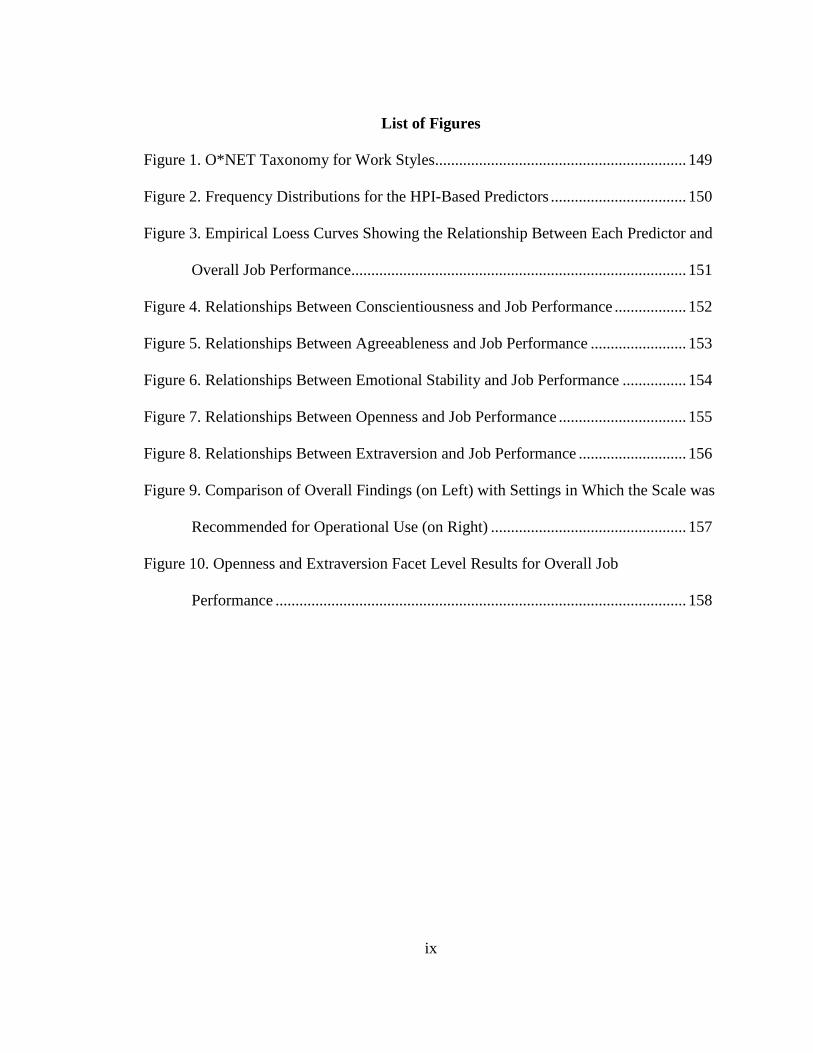
List of Figures
Figure 1. O*NET Taxonomy for Work Styles............................................................... 149
Figure 2. Frequency Distributions for the HPI-Based Predictors .................................. 150
Figure 3. Empirical Loess Curves Showing the Relationship Between Each Predictor and
Overall Job Performance.................................................................................... 151
Figure 4. Relationships Between Conscientiousness and Job Performance .................. 152
Figure 5. Relationships Between Agreeableness and Job Performance ........................ 153
Figure 6. Relationships Between Emotional Stability and Job Performance ................ 154
Figure 7. Relationships Between Openness and Job Performance ................................ 155
Figure 8. Relationships Between Extraversion and Job Performance ........................... 156
Figure 9. Comparison of Overall Findings (on Left) with Settings in Which the Scale was
Recommended for Operational Use (on Right) ................................................. 157
Figure 10. Openness and Extraversion Facet Level Results for Overall Job
Performance ....................................................................................................... 158
1
INTRODUCTION
In the years following 1991, researchers have generally accepted personality
characteristics as a class of individual differences for understanding individual behavior
in the workplace. In the psychology literature, concepts of personality have been
integrated into theory and practice in topics such as personnel selection (Hough &
Johnson, 2013), job analysis (Raymark, Schmit, & Guion, 1997), leadership (Judge,
Bono, Ilies, & Gerhardt, 2002), team performance (Peeters, Van Tuijl, Rutte, & Reyman,
2006), and job satisfaction (Judge, Heller, & Mount, 2002). A major emphasis has been
placed on understanding predictive relationships between personality characteristics and
job performance measures (Bartram, 2005; Hogan & Holland, 2003). Despite this
emphasis, much work remains in investigating the form of the relationships between
personality measures used in employment testing and indicators of valued job
performance. The current evidentiary base on these relationships has led to both
enthusiastic support (Ones, Dilchert, Viswesvaran, & Judge, 2007) and prominent
criticism (Morgeson, Campion, Dipboye, Hollenbeck, Murphy, & Schmitt, 2007) of
personality assessment in the workplace. One question that both sides seem to consider
important is whether there is reason to expect nonlinear personality—performance
relationships, as the answer would affect conclusions about how personality assessment
scores should be used and how well they can predict subsequent behavior. To date,
almost all of the research on personality testing in employment settings is based on the
either explicit or implicit assumption that personality—performance relationships are
2
linear. The purpose of this dissertation is to explore the degree to which this assumption
holds.
As the practice of personality assessment in the workplace has gained
prominence, the possibility of nonlinear personality—performance relationships has been
incorporated into burgeoning theory. The fundamental idea is that individuals could be
both “too low” or “too high” for optimal performance in their standing on various
personality attributes. For the purposes of this dissertation, nonlinear refers to a class of
relationships between independent and dependent variables. In straightforward language,
these nonlinear relationships are characterized by having a line of best fit, or regression
line, that is not straight throughout the score ranges of both variables. Best fitting
nonlinear relationships may form “U”, “inverted-U”, or even more complex shapes.
Mathematically, they can be defined by examining variables above an order of unity,
such as quadratic or cubic variables. In a regression framework, these nonlinear
relationships can be said to be nonlinear in the variables but linear in the parameters, in
the sense that the fundamental regression equations involve additive effects among
independent variables to best predict a dependent variable (Cohen, Cohen, West, &
Aiken, 2003, p. 195). Several scholars have suggested that aspects of the five-factor (or
“Big Five”) model, which is the dominant personality taxonomy in I-O psychology,
might be related in a nonlinear fashion to job performance (Le, Oh, Robbins, Ilies,
Holland, & Westrick, 2011; Murphy, 1996; Ones et al., 2007). However, current theory
omits several of the major components of the Big Five, and few aspects of the posited
nonlinear relationships have been empirically investigated. Thus, in addition to
3
contributing to an understanding of the observed form of personality—performance
relationships, this dissertation adds to theory on the expected relationships between
aspects of personality and job performance.
The presence of robust nonlinear personality—performance relationships may
have implications for applied settings in which personality assessments are used to make
administrative decisions about job applicants or incumbents. As noted by both Hough and
Dilchert (2010) and Converse and Oswald (2012), in instances where individuals are
rank-ordered on the basis of personality assessment scores, certain forms of nonlinear
relationships may result in errors of inference regarding the expected performance
associated with a given personality score if linearity is assumed. In cases where
personality assessment scores define a minimum threshold for screen out or screen in
purposes (e.g., Berry & Sackett, 2009), in the presence of substantial curvilinearity, those
who pass a cut score could perform the same or worse than those who were rejected, on
average. Information about nonlinear relationships may be used to identify optimal cut
points in the distribution of personality scores. Thus, the fundamental assumption that
“higher standing is better” in the personality domain has been challenged on conceptual
grounds, and if borne out empirically, could have important consequences for the use of
personality assessments in employment settings. Empirical work examining these issues
to date has yielded inconsistent findings and has suggested the presence of moderating
factors. That is, previous research has produced discrepant findings with regard to
whether and when to expect nonlinear relationships between these attributes and various
measures of individual job performance. Though previous research has suggested
4
moderators of the magnitude of personality—performance relationships (Barrick &
Mount, 1993), very few authors have proposed that the form of these relationships may
be dependent on moderating factors (cf. Le et al., 2011). Tett and Burnett (2003) offered
a framework for identifying and examining such moderators, but this framework has not
been applied to studies of the form of personality—performance relationships. Thus, an
additional goal of this dissertation is the examination of large-scale personality
assessment and job performance data to examine whether personality—performance
relationships are best described as nonlinear, and identification of the conditions under
which, if any, nonlinearity is present.
This document is organized as follows. The first section includes background
information and a literature review. This section begins by reviewing the use of
personality assessment in organizations as a tool for human resource decisions. The focus
is directed toward issues relevant to the form of the relationship between aspects of
personality and job performance. The review then moves to the basis for an examination
of the presence of nonlinearity in personality—performance relationships. This
discussion focuses on psychological theory-based perspectives as well as issues of
applied personality measurement in organizations. Then empirical work that examines
the form of personality—performance relationships is reviewed, highlighting issues that
prevent clear inferences from being drawn from the existing results. This section
concludes with a description of the current study as a contribution to the literature. A
statement of research questions forms the culmination of this section.
5
The second section describes the methodology used to examine the research
questions. Here, the sample and analytic framework used to evaluate the research
questions are described. The third section describes the results of the focal analyses. The
fourth section contains a discussion of implications of the findings and study limitations.
SECTION 1: LITERATURE REVIEW
Defining Personality as the Domain of Interest
The purpose of this section is to define personality as the focal domain of
individual differences in this dissertation. As Murphy (1996) notes, the term personality
has been defined in many ways, and it is not always clear how aspects of personality
differ from cognitive abilities, interests, moods, or values (cf., Barrick, Mount, & Gupta,
2003; DeYoung, 2011). Major taxonomic work has been achieved in these domains, and
a complete review of all domains is beyond the scope of this dissertation. In this section, I
review fundamental definitions of personality and its distinction from the cognitive
ability domain. I also address the taxonomic structure of the personality domain,
especially as it relates to the variables of interest in the current study.
To begin, McAdams and Pals (2006) provide the following as a definition of the
personality domain:
Personality is an individual’s unique variation on the general evolutionary design
for human nature, expressed as a developing pattern of dispositional traits,
characteristic adaptations, and integrative life stories complexly and differentially
situated in culture. (p. 212)
Following Tett and Guterman (2000), Tett and Burnett (2003) define personality as:
6
Intraindividual consistencies and interindividual uniqueness in propensities to
behave in identifiable ways in light of situational demands. (p. 502)
From a trait perspective, the term personality is typically used to describe a set of
dispositional characteristics that are stable enough to be viewed as a driver of an
individual’s tendency to behave in a particular manner. While there is broad recognition
that momentary states can influence an individual’s thoughts, feelings, and actions
(Fleeson & Gallagher, 2009), personality traits have been shown to predict many valued
behaviors and life outcomes such as happiness, health, relationship quality, and
occupational attainment and performance (Ozer & Benet-Martinez, 2006; Roberts,
Kuncel, Shiner, Caspi, & Goldberg, 2007). While personality can be viewed in terms of
both trait and state aspects, this study focuses on the stable aspects of personality that are
commonly used to inform administrative decisions in employment settings.
Personality-based characteristics are often distinguished from the domain of
cognitive abilities (Gottfredson, 1997; Neisser, Boodoo, Bouchard, Boykin, Brody, Ceci,
Halpern, Loehlin, Perloff, Sternberg, & Urbina, 1996). The label noncognitive is often
applied to the personality domain, whereas intelligence and general mental ability are
placed in the domain of cognitive abilities. Gottfredson (1997) defines intelligence as
follows:
Intelligence is a very general mental capability that, among other things, involves
the ability to reason, plan, solve problems, think abstractly, comprehend complex
ideas, learn quickly and learn from experience. It is not merely book learning, a
narrow academic skill, or test-taking smarts. Rather, it reflects a broader and
7
deeper capability for comprehending our surroundings—“catching on”, “making
sense” of things, or “figuring out” what to do. (p. 13)
While Carroll (1993) summarized nearly 100 years of empirical work in an
enormous set of analyses that yielded the generally accepted three-stratum model of
cognitive abilities, it is certainly the case that debate continues on the nature of cognitive
ability and its consequences for policy (Neisser et al., 1996; Nisbett, Aronson, Blair,
Dickens, Flynn, Halpern, & Turkheimer, 2012). Recognizing that the distinction between
the noncognitive/cognitive labels can be unsatisfying (DeYoung, 2011), one way of
delineating the personality constructs examined in this study is to say that they are major
components of the noncognitive construct space and do not appear in taxonomic
structures such as that offered by Carroll (1993).
Relative to the cognitive domain, work on the structure of personality has begun
much more recently. Current concepts of the structure of personality can be traced
through two major traditions. The first is often referred to as the lexical hypothesis (John
& Srivastava, 1999). This perspective is based on the notion that personality descriptors
can be found in language (Allport & Odbert, 1936). Specific focus is placed on words
developed to describe personal characteristics and tendencies. The lexical hypothesis
states that the general structure of personality attributes can be identified based on the
degree to which the terms covary when used to describe one’s self or other people
(Saucier & Goldberg, 2001). The second tradition involved the placement of personality-
based descriptors on questionnaires. Questionnaires were then distributed to thousands of
respondents across many different cultures (McCrae & Costa, 1997). Data from
8
personality description questionnaires, many of which included terms drawn from the
lexical hypothesis, has provided robust evidence for a Five Factor Model of personality
(Digman, 1990; John & Srivastava, 1999; McCrae & Costa, 1997). Barrick, Mount, and
Judge (2001) offer a series of adjectives intended to describe the five factors: (a)
conscientiousness involves being dependable, achievement-striving, hardworking,
persevering, and orderly; (b) agreeableness involves being cooperative, flexible, tolerant,
and forgiving; (c) emotional stability involves being calm, self-confident, and resilient;
(d) extraversion involves being sociable, talkative, assertive, and active; and (e) openness
to experience involves being curious, broad-minded, intelligent, and cultured. The five
factor, or Big Five, model of personality has served as an important framework for
integrating research on the internal structure and nomological network of human
personality. Still, skepticism exists about the degree to which the Big Five can be used to
comprehensively summarize individual differences in personality (Block, 1995; Hough,
1992). Nonetheless, some critics at least agree that the Big Five framework represents a
useful tool for organizing research and identifying prospects for future inquiry (Hough &
Schneider, 1996).
In addition, the hierarchical structure of the personality domain is currently
thought to be at least as theoretically and empirically complex as the cognitive ability
domain. Part of the reason for this is that measured personality attributes do not exhibit
the degree of positive manifold that measures of disparate cognitive abilities do (Murphy,
1996; Schmidt, 2012). Among personality researchers, consensus is emerging that the
structure of personality can best be described as a multi-level hierarchy (Markon,
9
Krueger, & Watson, 2005; Ones, Viswesvaran, & Dilchert, 2005). Given either non-zero
correlations among the Big Five factors or trait profiles across the factors, researchers
have identified broad, higher-level traits defined by combinations of Big Five factors.
These combinations, or meta-traits, have been given different labels by different
researchers. The combination of conscientiousness, agreeableness, and emotional
stability form a higher-order factor termed alpha (Digman, 1997), stability (DeYoung,
2010), or integrity (Ones & Viswesvaran, 2001) depending on its use. Similarly, the
combination of extraversion and openness to experience is termed beta (Digman, 1997)
or plasticity (DeYoung, 2010). Conversely, each Big Five factor can be further split into
facets or subscales. Facets are said to be related to their overarching Big Five factor, but
may also exhibit differing patterns of empirical relationships with external variables
(Dudley, Orvis, Lebiecki, & Cortina, 2006). Although a generalizable structure of Big
Five subfacets has not yet been established, structures of these facets are available for
some personality measures (e.g., Costa & McCrae, 1995). Since many studies summarize
predictive relationships between Big 5-level personality characteristics and various
behavioral criteria, and the Big Five reside at a conceptual level of broad use in
employment settings, the hierarchical level of personality corresponding to the Big Five
will be the focus of this dissertation.
Socioanalytic theory is another view of the personality domain that has led to
conceptual and empirical support for the Five Factor Model (Hogan, Hogan, & Roberts,
1996). Hogan and Shelton (1998) and Hogan, Davies, and Hogan (2007) describe
socioanalytic theory, which posits that individuals have two key motivations: getting
10
along and getting ahead. Getting along refers to functioning effectively with others in
society, while getting ahead refers to gaining power and status. These motivations shape
the two primary socioanalytic perspectives on describing personality: external description
as one’s reputation, and internal description as one’s identity. Moving beyond the self-
descriptions reported by McCrae and Costa (1997), Hogan and Shelton (1998) discuss
how the Big Five has been recovered in studies of reputations—that is, studies that
involve observer ratings of personality. The primary point is that when the
aforementioned literatures are taken together, the Big Five structure has emerged from
studies of both self and observer reports in many different contexts.
The goal of this discussion is to set the stage for personality as the focal domain
of interest in this dissertation. The next section describes how personality concepts and
measures have been integrated into research on work behavior.
Personality Measurement in Industrial and Organizational Psychology
Historically, individual differences related to personality, temperament, and
dispositional concepts were used in various applied psychology interventions. For
instance, in addition to job-related skills and abilities (Dunnette, 1976), applied
psychologists and human resource professionals have a long history of evaluating
applicant noncognitive characteristics, particularly for managerial occupations (Bray &
Grant, 1966; Guion, 1967). These characteristics, such as “interpersonal skills”,
“integrity”, “attention to detail”, or “resistance to stress”, can be crosswalked to
personality-based concepts. However, the lack of a common framework and a
proliferation of measures led to a fragmented research literature from which few
11
generalizations could be made (Guion & Gottier, 1965). At the same time, reviews of
available data from personality instruments revealed no systematic pattern for the
usefulness of predicting job performance, the most relevant set of dependent variables for
I-O psychologists (Guion & Gottier, 1965). Additionally, the range of occupational
demands and job characteristics across occupations led to a general endorsement of the
concept of situational specificity, whereby there was no expectation that personality
predictors could maintain comparable validity across occupations (Schmidt & Hunter,
1977). This was compounded by a broader literature stating that characteristics of a
situation were strong enough to influence behavior to the degree that stable individual
traits, if there were any (Davis-Blake & Pfeffer, 1989), had little effect on an individual’s
behavior (Mischel, 1968).
This situation led to two important events for researchers wanting to apply
personality concepts in employment settings. First was a call to focus on the taxonomic
structure of the personality domain at the expense of developing additional measures
(Dunnette, 1962 [cited in Guion & Gottier, 1965]). A scientific framework was needed to
describe the domain of personality characteristics, and further to describe how these
characteristics were supposed to relate to individual work behavior. Although it was
possible to use many hundreds of terms to describe a person’s attributes in the personality
domain, it was counterproductive not to combine like terms and develop a parsimonious
taxonomy. It was around this time that personality researchers began the studies that
ultimately led to the Five Factor Model described above. The development of a usable
taxonomy of personality characteristics was crucial; it provided the framework upon
12
which research results could be meaningfully cumulated (e.g. Barrick & Mount, 1991;
Hurtz & Donovan, 2000).
The second development was, to some degree, a consequence of the first. While
personality psychologists devoted substantial research effort to studying the internal
structure of personality, they often did so at the exclusion of studying external correlates.
That is, more attention was directed at understanding relationships among personality
measures than understanding whether and how personality could predict other variables
of interest (Hogan, 2006). Thus, attention needed to be focused on external variables in
the nomological networks of personality characteristics (Cronbach & Meehl, 1955) –
what did these characteristics meaningfully relate to, and thus, what criteria could be
predicted? The calls for research into the structure of personality and careful examination
of its correlates ultimately led to a general acceptance of personality predictors by I-O
psychologists, described next.
Mixed Feelings About the Utility of Personality Predictors in the Workplace
In a series of integrative reviews, Hough and her colleagues (Hough & Dilchert,
2010; Hough & Furnham, 2003; Hough & Oswald, 2008) attribute renewed interest in
personality variables among I-O psychologists to the two major and broad developments
just noted: a) evidence that individuals’ scores on personality assessments predicts valued
job performance, and b) further development of a taxonomic structure of human
personality that forms a common language for theories about why personality ought to be
relevant for job performance. These developments have formed the basis for large-scale
research to support the use of personality assessment.
13
Three landmark meta-analyses are credited for presenting empirical evidence for
the utility of occupational personality assessments. Hough, Eaton, Dunnette, Kamp, and
McCloy (1990) cumulated criterion-related validity information for personality constructs
as part of a literature review for the U.S. Army’s Selection and Classification Project,
widely known as Project A. Hough et al.’s initial purpose was to identify personality and
temperament constructs that could be useful in predicting job-related criteria. Hough et
al. went to great lengths to organize the personality and temperament measures into
construct categories that were at least somewhat discrete. They ended up with seven
categories: surgency, adjustment, agreeableness, dependability, intellectance, affiliation,
and miscellaneous. Average correlations among measures within each of the six
substantive categories (that is, not including miscellaneous) ranged from .33 (affiliation)
to .46 (surgency). Average cross-category correlations were all of lower magnitude than
average within-category correlations. The average correlation for the miscellaneous
category was .05. Hough et al. interpreted this as possible evidence for why previous
investigations (Guion & Gottier, 1965; Schmitt, Gooding, Noe, & Kirsch, 1984) yielded
little evidence for the predictive validity of personality measures: These studies were
thought to combine measures of disparate constructs, thus obscuring their nomological
network. Hough et al. went on to report a range of criterion-related validities across the
personality categories and various criteria. Notably, personality predictors showed lower
correlations with task-focused criteria (job proficiency) and higher correlations with non-
task criteria (delinquency). The patterns of validities also formed the basis for Schneider,
Hough, and Dunnette’s (1996) subsequent critique of the Big Five factors as obscuring
14
important differences among personality variables that are not aggregated to the Big Five
taxonomic level.
While Hough et al. (1990) made major advancements by categorizing personality
scales into a meaningful taxonomy, Barrick and Mount (1991) and Tett, Jackson, and
Rothstein (1991) expanded on that concept by grouping measures according to their
correspondence with the Big Five framework noted above. These two studies used
somewhat different procedures for conducting meta-analyses, and thereby yielded
different results in terms of validity coefficient magnitudes, but both are credited for
providing large-scale evidence that personality assessments can predict job performance
ratings. In particular, Barrick and Mount (1991) showed that the validity of
conscientiousness could be expected to be non-zero across all of the studies and
occupations they examined. The variance in criterion-related validities for
conscientiousness, as well as for agreeableness, emotional stability, openness, and
extraversion suggested the importance of moderators, or study characteristics that
condition the relationships among personality measures and criteria. Examples of these
moderators included occupation types or criteria of interest. In addition, Tett et al.
provided evidence that specific personality characteristics tended to exhibit larger
correlations with criteria in situations in which there were theoretical reasons for the link,
as reflected in job analysis data.
Building on the work of Barrick and Mount (1991), Hough et al. (1990), and Tett
et al. (1991) researchers have undertaken efforts to understand the moderating effects of
study characteristics moderating personality—performance relationships. Simply in terms
15
of the accumulation of personality-related effect sizes across studies, the literature now
contains meta-analyses of Big Five factor predictive validity when scales were designed
to measure the Big Five specifically (Hurtz & Donovan, 2000), personality ratings were
made by observers (Connelly & Ones, 2010; Mount, Barrick, & Strauss, 1994; Oh,
Wang, & Mount, 2011), in jobs requiring interpersonal interactions (Mount, Barrick, &
Stewart, 1998), sales jobs (Vinchur, Schippman, Switzer, & Roth, 1998), when leadership
effectiveness is of interest (Judge, Bono et al., 2002), when only single personality
measures are used to bypass issues with combining different tests (Bartram, 2005; Hogan
& Holland, 2003), when predictors are rationally and theoretically linked to specific
criteria (Hogan & Holland, 2003), when counterproductive behavior (CWB) is the
criterion of interest (Berry, Ones, & Sackett, 2007; Salgado, 2002), when organizational
citizenship behavior (OCB) is the criterion of interest (Chiaburu, Oh, Berry, Li, &
Gardner, 2011), and when academic performance is the criterion of interest (Poropat,
2009). This is not an exhaustive list (note that other meta-analyses containing some, but
not all, of the Big Five are not included in this list), but it is intended to represent the
range of investigations that have been reported. In all cases, the authors of these studies
concluded that the Big Five or its components are relevant predictors of various criteria
of interest. In lieu of reporting specific validity coefficients from these studies here, note
that large summary tables appear in Barrick, Mount, and Judge (2001), Hough and
Furnham (2003), and Ones, Dilchert, Viswesvaran, and Judge (2007).
In spite of the optimism generated by these studies, there remains controversy in
the academic literature over the use of personality in making personnel decisions with
16
tangible employment consequences. In some cases, this has resulted in hesitation by
practitioners about using personality predictors in applied settings. Criticisms of
personality assessments, most recently outlined by Murphy and Dzieweczynski (2005)
and Morgeson et al. (2007), include the following issues:
(a) Bivariate validity coefficients are too small. While intuition suggests that
aspects of an individual’s personality ought to be strongly related to how he or
she behaves when working, many criterion-related validity coefficients do not
meet a magnitude threshold to be deemed important. A sampling of the
magnitudes of meta-analytic correlations between personality predictors and
job performance criteria is drawn from work by Sackett and Walmsley (2012)
and is shown in Appendix A.
(b) Job applicants can and do intentionally misrepresent themselves to appear well
fit for the job. This process, termed by many as faking, results in a lack of
information about an applicant’s true tendencies. Additionally, those who fake
on a personality test may displace truthful and deserving applicants by falsely
appearing to be better qualified for employment.
(c) Personality measures often are not chosen based on a job analysis, and thus
may or may not provide relevant information on which to base employment
decisions.
(d) Theories linking personality to occupational performance are weak and lack
detail about the functional form of the relationship.
17
(e) Personality measures do not “behave” psychometrically the same way that
cognitive ability measures do. That is, personality measures do not display
strong positive manifold, even when separate measures are ostensibly
designed to tap the same constructs. This is also related to the criticism
outlined in (a) above. That is, in addition to low magnitude validity
coefficients, meta-analytic moderator analyses (including credibility intervals
and homogeneity tests) suggest that the bivariate validity for most, if not all,
personality predictors can be zero in some situations and thereby are not
generalizable.
(f) There are likely occupational characteristics that moderate the functional form
of personality—performance relationships, and as a science, we do not
understand these characteristics or their effects very well.
These issues are complex and the goal of this dissertation is not to directly respond to all
of them. Replies to Murphy and Dzieweczynski (2005) and Morgeson et al. (2007) were
published by Ones et al. (2005), Hogan (2005), Barrick and Mount (2005), Ones et al.
(2007), and Tett and Christiansen (2007). However, these replies are only able to focus
on some of the issues listed above, and none provided evidence on issues of possible
nonlinearity. Some of the disagreements are likely rooted in differing value judgments
that are likely intractable among researchers. Other responses to criticisms levied by
Murphy and Dziweczynski and Morgeson et al. simply require further research.
Questions of Interest in the Current Study
18
This dissertation focuses on contributing to the literature by addressing at least
some of the parts of this ongoing controversy. Specifically, the questions raised above
about (a) validity, (d) theory and evidence on the personality—performance functional
form, and (f) occupation-level moderators, are of interest here.
Recognizing that the bivariate validity coefficients for personality predicting
overall job performance are relatively low in magnitude when compared to coefficients
for cognitive ability tests or measures of job-related knowledge, skills, and abilities
(Schmidt & Hunter, 1998), researchers have suggested a number of measurement and
statistical approaches for enhancing criterion-related validity. Examples include
contextualizing personality items (i.e. adding “at work” to an otherwise non-
occupationally-focused personality item; Heggestad & Gordon, 2008; Schmit, Ryan,
Stierwalt, & Powell, 1995), gathering observer ratings of personality to predict job
performance (Connelly & Ones, 2010; Oh et al., 2011), using forced-choice formats
(Baron, 1996; Heggestad, Morrison, Reeve, & McCloy, 2006; Jackson, Wroblewski, &
Ashton, 2000), using conditional reasoning as a subtle measure of personality (James,
1998), and conducting multivariate analyses (Ones et al., 2007), as the classical bivariate
model appears to have caused a lot of consternation (Campbell, 1990). Hough and
Dilchert (2010) recently reviewed these approaches and concluded that they have
increased our understanding of strategies that appear useful in validation work.
This study takes a different tack. The focus here is on investigating the functional
form of the personality—performance relationship throughout the range of scores on both
personality and performance variables. Almost all correlational studies of personality’s
19
links to job performance appear to have implicitly carried the assumption that the best
fitting summary is linear. Thus, when each Big Five factor is scaled on a continuum
where lower scores reflect lower trait desirability, lower scorers are likely to perform
worse relative to higher scores, and this relationship remains linearly monotonic
throughout the personality and performance score ranges. This could be characterized as
“more is better”. In contrast, a nonlinear relationship suggests several alternatives:
(a) Possibility one is a negative quadratic relationship, whereby those in the
middle of the personality score range tend to have higher performance scores
than those low or high in the personality range. This possibility could be
characterized as “inverted-U-shaped” and would indicate that personality
scores less than the highest scores would provide the optimal forecast for
performance.
(b) Possibility two is a positive quadratic relationship, whereby those in the low
and high personality score ranges would tend to have higher performance
scores than those in the middle of the personality score range. This possibility
could be characterized as “U-shaped” and would indicate that personality
scores near the high and low ends of the range are associated with optimal
performance.
(c) Possibility three is a decelerating positive relationship that flattens above a
particular personality score. This type of relationship would be consistent with
the “good enough” hypothesis often posited for the relationship between
cognitive ability and performance (Arneson, Sackett, & Beatty, 2011).
20
Asymptotic relationships between personality and performance would indicate
that it is beneficial to score increasingly high on a given personality trait up to
a certain point on the scale. Above that threshold, however, personality scores
would not be useful for forecasting which applicants may be better
performers.
These three possibilities guide the research question development in this study. Note that
these are not the only possibilities for the relationship between two variables (e.g., cubic
functions), but represent the most likely possibilities for the personality—performance
functional form (Hough & Dilchert, 2010).
The possibilities outlined above are not new ideas; researchers have explicitly
suggested the possibility of nonlinear relationships with occupational criteria since at
least Murphy (1996). Unfortunately, studies of nonlinear relationships require unusually
large samples and somewhat sophisticated analyses (Cohen et al., 2003), and only a few
such studies have been reported. The next section describes research to date on the
personality—job performance functional form, and is organized by each Big Five factor.
For each factor, theoretical reasons for nonlinear forms are suggested, followed by a
review of the evidence to date.
Theory and Evidence On Nonlinear Personality-Job Performance Relationships
Conscientiousness—Job Performance Theory. Consistent with adjectives used
in the I-O literature (Barrick, Mount, & Judge, 2001), Goldberg (1992) reported a study
of personality markers in which low conscientiousness was described as “disorganized”,
“careless”, “inefficient”, “undependable”, and “haphazard”, whereas high
21
conscientiousness was described as being “organized”, “systematic”, “thorough”, and
“efficient”. Those scoring high on conscientiousness scales are typically said to be
dependable, persevering, careful, and self-disciplined (Barrick et al., 2001; Goldberg,
1992). If these characteristics are important for job performance, and low scorers tend to
be disorganized, impulsive, or undependable, then it is reasonable to expect that low
scorers on conscientiousness scales will underperform relative to higher scorers, on
average. Consistent with this expectation, previous meta-analytic correlations suggest a
small positive relationship between conscientiousness and various indices of performance
such as overall job performance (Barrick & Mount, 1991), task performance (Hurtz &
Donovan, 2000), organizational citizenship behavior (OCB; Hurtz & Donovan, 2000),
and avoidance of counterproductive behavior (CWB; Berry, Ones, & Sackett, 2007;
Salgado, 2002). However, some scholars have suggested that there may be a point in the
conscientiousness score range at which higher levels of the trait do not contribute to
better performance or become detrimental to performance.
Considering the high range of scores, Murphy (1996) suggested that individuals
high on conscientiousness may be “… so conventional and rule-bound that [they] cannot
function in anything but the most bureaucratic setting” (p. 22). Murphy and
Dzieweczynski (2005) proposed that managers very high on conscientiousness might not
have a realistic sense of when it is better to go “by the book” versus show flexibility in
application of rules and regulations. Similarly, Le et al. (2011) argued that high-
conscientiousness individuals tend to get bogged down into details such that they may
overlook important goals or miss critical information. Le et al. also noted a study by
22
LePine, Colquitt, and Erez (2000), in which participants working under a time limit were
required to incorporate new knowledge and skill as the task characteristics changed.
Participants scoring high on the dependability facet of conscientiousness had more
difficulty with this adaptation than those scoring lower, presumably because they focused
too heavily on a task performance goal at the exclusion of acquiring and applying new
knowledge.
MacLane and Walmsley (2010) argued that recent clinical psychology literature
also provides a basis from which to draw inferences about optimal levels of
conscientiousness for work performance. Current work on the American Psychiatric
Association’s Diagnostic and Statistical Manual is moving towards incorporation of
dimensional models of personality for diagnosis and classification of personality
disorders. This is a stark contrast with previous categorical schemes (Widiger & Trull,
2007). The primary dimensional models under consideration are the Big Five model and
very similar variants (Krueger, Eaton, Clark, Watson, Markon, Derringer, Skodol, &
Livesley, 2011; Miller, Bagby, & Pilkonis, 2005; Walton, Roberts, Krueger, Blonigen, &
Hicks, 2008). It is critical to note that any test that is diagnostic of a medical condition,
such as a personality disorder, is impermissible for initial employment decisions under
the Americans with Disabilities Act. However, the work done by clinical and personality
psychologists in describing the full range of personality characteristics, particularly the
extremely high ends of the trait continuum, can be useful for theory development for each
of the Big Five. In addition, these characteristics may foreshadow problematic tendencies
23
at high ends of the normal range. For instance, Widiger, Costa, and McCrae (2002)
describe those high in conscientiousness as follows:
Overachieves; shows workaholic absorption in his or her job or cause to the
exclusion of family, social, and personal interests; is compulsive, including
excessively clean, tidy, and attenti[ve] to detail; has rigid self-discipline and an
inability to set tasks aside and relax; lacks spontaneity; is overscrupulous in moral
behavior. (p. 442)
Widiger et al. go on to provide descriptions of high and low poles of six facets of
conscientiousness, corresponding to the NEO Personality Inventory (NEO-PI; Costa &
McCrae, 1992). As the Big Five represent the level of abstraction of typically of most
interest in employment settings (Hurtz & Donovan, 2000; cf. Ones & Viswesvaran,
1996), the focus here is not on the facets, but rather their contribution to a
conscientiousness-level understanding or bandwidth.
The implications suggested for high levels of conscientiousness from the non-
clinical and clinical literatures converge on several important points: First, relevant to the
performance of work tasks, it appears possible that those above a certain point on
conscientiousness may display debilitating perfectionism, may exhibit rigidity about rules
and their concepts of order, and excessively ruminate over decisions. Second, these
characteristics may prevent highly conscientious individuals from completing tasks and
making decisions in a timely manner, acquiring beneficial knowledge, or recognizing
opportunities to display flexibility in applying new skills. Third, as low-conscientiousness
descriptors tend to include low self-discipline, carelessness about rules and consequences
24
of decisions, and general undependability, it is expected that low, moderate, and some
high conscientiousness scores will be related positively to job performance. Fourth, the
point at which conscientiousness may is optimally associated with performance, and then
turn to a negative slope, is unknown and may be at such extremely high scores that they
occur rarely in normal populations. This fourth point raises the additional question of the
degree to which the location of an inflection point or nonlinear turning point is measure
dependent. From a scientific perspective, the turning point of interest refers to the level of
the personality construct (or theta level) at which nonlinearity occurs. However, given
differences in various personality measures’ sensitivity to the range of the underlying
construct, any point of inflection may be within the possible scale on some inventories
while off the scale on others.
Conscientiousness—Job Performance Evidence. Evidence for nonlinear
conscientiousness—performance relationships in employment settings is mixed. Robie
and Ryan (1999) tested for curvilinearity using conscientiousness scores from
administrations of the NEO-PI-R in Federal Government (n = 999) and private sector (n
= 200) settings. They also examined conscientiousness scores from the Personal
Characteristics Inventory (PCI) in three samples: DoD managers (n = 146), wholesale
sales reps (n = 206), and long-haul semi truck drivers (n = 256). The criterion variable
was supervisory ratings of overall job performance for all samples. Using the generally
accepted hierarchical polynomial regression analyses within each sample, Robie and
Ryan (1999) found no evidence for curvilinearity in conscientiousness—performance
relationships.
25
LaHuis, Martin, and Avis (2005) also tested for nonlinearity using two different
personality assessments. The first assessment was comprised of 17 situational judgment
and biodata items. Situational judgment items consisted of a scenario, several response
options, and instructions to respondents to choose the response that represents what they
would do. Biodata items were asked about previous work experiences related to
conscientiousness, such as preparation to complete tasks. The items were administered to
192 entry-level clerical employees at a federal agency. The second assessment was the
conscientiousness subscale from the NEO, administered to 203 clerical employees at a
state government agency. The criterion measure for both samples was a single-item
research focused supervisory judgment of overall job performance. In their first sample,
LaHuis et al. found a significant negative quadratic effect for conscientiousness—
performance, such that the relationship started positive, leveled off, and became slightly
negative at the high end of the conscientiousness score range. In sample two, LaHuis et
al. found a decelerating positive relationship that represented an asymptote at high levels
of conscientiousness.
Cucina and Vasilopoulos (2005) examined the form of conscientiousness—
freshman college grade point average (FGPA) relationships among 262 undergraduate
students. They used the 100-item Big 5 measure from the International Personality Item
Pool (IPIP; 20 items are designed to assess conscientiousness). They found a negative
quadratic relationship in the form of an inverted-U. Vasilopoulos, Cucina, and Hunter
(2007) reported similar findings for another academically-oriented criterion: training
performance. Vasilopoulos et al. found a negative quadratic relationship between a
26
locally-developed conscientiousness measure and performance on indices of classroom
learning (topics such as laws and operations content) at the Federal Law Enforcement
Training Center (FLETC). The personality assessment showed adequate convergent
validity with the NEO and had an internal structure consistent with other Big Five
measures. Of note, Vasilopoulos et al. probed the available conscientiousness facets for
the quadratic effect, finding the effect for dependability but not achievement.
Whetzel, McDaniel, Yost, and Kim (2010) reported a negative quadratic
relationship between conscientiousness, which was 1 of 32 scales measured using SHL’s
ipsative Occupational Personality Questionnaire (OPQi), and a task performance rating
composite based on a 15-item scale developed for research purposes. Their sample
consisted of 1,152 professionals in a financial services firm, and was split into equal
halves for cross-validation. When the quadratic term was added to their regression model
to test for nonlinearity, the change in R2 was approximately .05, which they interpreted as
minimal evidence for nonlinearity. Whetzel et al. suggested that the addition of a
quadratic or cubic term must change increment R2 at least .05 to be meaningful.
However, this rule-of-thumb was not applied in other studies and thereby may have lead
Whetzel et al. to draw somewhat different conclusions than other investigators.
Additionally, Whetzel et al. divided their sample in half and required the R2 increment to
meet the .05 threshold in both samples to be considered evidence for nonlinearity.
In arguably the most comprehensive study to date, Le et al. (2011) reported
negative quadratic nonlinear relationships between conscientiousness and three distinct
criteria in a sample of 602 participants from a concurrent validation study in a public
27
organization. The three criteria assessed were task performance, citizenship behavior, and
counterproductive behavior, all based on supervisory ratings collected for research
purposes. Conscientiousness was assessed using a locally-developed construct-based
integrity test that included several other personality constructs and overt integrity items.
Yet, Le et al. were unable to replicate these findings using another sample and a different
personality assessment. Their second study was also conducted in a concurrent validation
framework, and involved 956 participants from 25 organizations. As with their first
study, their criteria included supervisory ratings of task, citizenship, and
counterproductive performance. In this study, the personality test was a Big 5
questionnaire developed by ACT: the WorkKeys Talent Assessment. For each criterion,
Le et al. found no evidence of non-linear relationships with the conscientiousness
predictor.
To summarize, the current I-O psychology literature contains several published
studies investigating nonlinear relationships between conscientiousness and a variety of
performance indices, and results have been mixed. It is difficult to pinpoint contributing
factors for the range in findings; it may be that sample sizes, sample characteristics,
measurement instruments, criterion variables, or other moderating conditions all
contribute to the lack of clear findings.
Research Question 1: Is the relationship between conscientiousness and
performance best described as a linear or quadratic function?
Agreeableness—Job Performance Theory. Little theory exists regarding
whether to expect nonlinear agreeableness—performance relationships, but the concept
28
resonates intuitively. Given that much work is accomplished in a social environment,
disagreeableness can generally be regarded as unadaptive. Goldberg’s (1992) study of
Big Five markers yielded low agreeableness descriptors such as “cold”, “unkind”,
“distrustful”, “harsh”, and “rude”, whereas high agreeableness was described as being
“kind”, “cooperative”, “warm”, “trustful”, and “considerate”. The key question for
nonlinearity is whether the high end of these traits can be maladaptive. Murphy and
Dzieweczynski (2005) suggested that highly agreeable managers may fail to deliver bad
news or critical feedback that would be helpful to employees. Extrapolating to non-
managers, highly agreeable people may not advocate for their opinions, express healthy
dissent, or negotiate well in the workplace. This may be due to a tendency to want to
please others.
Drawing on the clinical literature, Widiger et al. (2002) outline possible
characteristics of highly agreeable people; these tendencies may lead them to face issues
in the workplace:
[They are] gullible; shows indiscriminant trust of others; shows excessive candor
and generosity to the detriment of self-interest; has an inability to stand up to
others and fight back; easily taken advantage of. (p. 441)
Thus there are several possibilities for reasons why those scoring very high in
agreeableness may not perform as well as those scoring somewhat lower. In terms of task
performance, highly agreeable people may take on excessive workloads due to an
inability to turn down requests from others. This could lead to failure to meet goals
adequately. In team settings, they may withhold opinions and suggestions in an attempt to
29
avoid offending others. Similarly, they may be taken advantage of by team members or
customers, which may lead highly agreeable people to sacrifice their goals or the goals of
their team, or exceed budgets in a customer service environment. These reasons are
consistent with meta-analytic findings that agreeableness does not meaningfully predict
performance in sales positions, as there may be a relationship between low levels of
agreeableness and performance, but nonlinearity in the high score range may weaken any
linear effect (Barrick & Mount, 1991; Vinchur, Schippman, Switzer, & Roth, 1998). It is
difficult to conceptualize high agreeableness as a detriment to organizational citizenship
behavior (OCB), beyond the possibility that OCB may come at the expense of task
performance if a performance episode is a zero-sum game. It also may be unlikely that
highly agreeable people will intentionally engage in counterproductive behavior towards
others. However, the possibility remains that highly agreeable people could engage in
behavior counter to an organization’s legitimate interests in negotiations, especially if
agreeable people fail to negotiate the best possible circumstances for the organization
they represent.
Agreeableness—Job Performance Evidence. To date, there are virtually no
reported investigations of nonlinear agreeableness—performance relationships based on
Big Five-oriented scales. Thus one goal of this study is to provide the first major tests in
this domain. However, one could speculate that analyses may have been conducted but
not reported. For instance, Le et al. (2011) report using an integrity test partially intended
to measure agreeableness in their first study, and used a Big Five assessment, presumably
including agreeableness, in their second study. Perhaps they were unable examine the
30
agreebleness portion of their measure, or have the space allotted to report what some may
consider as an uninteresting or null finding. While this is heavily speculative, the
argument here is that knowing that nonlinearity analyses were conducted and came up
unsupportive is as important as finding evidence of nonlinearity.
Whetzel et al. (2010) included some agreeableness-related scales in their study
using the OPQi. Examples include ipsative scales designed to measure the degree to
which people are Caring and Trusting. In both cases, analyses revealed no evidence for
nonlinearity in the prediction of rated task performance. Finally, Cucina and
Vasilopoulos (2005) reported tests of curvilinear relationships between IPIP
Agreeableness and first semester college GPA, finding no evidence for nonlinearity.
Research Question 2: Is the relationship between agreeableness and performance
best described as a linear or quadratic function?
Emotional Stability—Job Performance Theory. Based on Goldberg’s (1992)
work, those who score low on emotional stability scales may be described as “anxious”,
“moody”, “temperamental”, “fretful”, and “jealous”, while those scoring high could be
said to be “relaxed”, “unenvious”, “unemotional”, and “unexcitable”. Drawing from the
Yerkes-Dodson law, which specifies that potentially optimal levels of arousal lie in the
middle of the range, Vasilopoulos et al. (2007) suggested that, past a certain point on the
emotional stability score range, increased scores may be unlikely to contribute to
performance on moderately difficult tasks such as the training performance indices they
examined. Although they did not directly address social situations, it is possible that very
high scorers on emotional stability may be viewed by others as unresponsive to problems
31
or uninterested in their viewpoints on issues. The argument is that there is an optimal
level of emotional arousal that allows one to complete work tasks and interact
productively with others, and this optimal level does not lie in the very high end of the
emotional stability score range. Essentially, there may be a “good enough” level of
emotional stability; beyond this level there is no additional advantage in terms of
contribution to job performance (Le et al., 2011).
While emotional stability may be related asymptotically to performance of the
technical core of the work, it may bear relationships of a different functional form with
CWB. Le et al. (2011) suggested that emotional stability (ES) influences how one reacts
to a variety of job stressors, and that the optimal degree of ES depends on the stressors.
Accordingly, they suggested a negative relationship that asymptotes at higher levels of
ES, such that low ES is associated with greater CWB than moderate ES, whereas high ES
provides no further decrement in CWB. Thus the functional form may be said to be U-
shaped, or possibly somewhat L-shaped.
Widiger et al. (2002) offered the following description of high ES on the basis of
the clinical and personality literatures: “Lacks appropriate concern for potential problems
in health or social adjustment; shows emotional blandness” (p. 438). Thus the primary
implication of high ES for decrements in job performance may be in occupations or
situations in which display of heighted arousal or problem sensitivity is optimal.
Emotional Stability—Job Performance Evidence. Two reports of examinations
of ES—performance exist in the literature. The first was from Vasilopoulos et al. (2007),
who examined scores on a measure of ES, as well as its stress resistance and frustration
32
tolerance components, in relation to training performance in a sample of 1,010 federal
law enforcement trainees. Vasilopoulos et al. found evidence for a negative quadratic
(inverted-U) relationship, consistent with mid-range standing on ES being optimal for
training performance. They also reported that the negative quadratic was found for the
stress resistance facet, but not for the frustration tolerance facet. It is possible that the
training environment from which criterion data were drawn did not present adequate
stimulus for the full range of frustration tolerance to be displayed. Following this study,
Whetzel et al. (2010) examined OPQ scales for Emotionally Controlled and Worrying,
and reported no evidence for nonlinearity.
Le et al. (2011) examined two separate measures of ES in two samples. Study 1
involved 602 incumbents in a public organization who completed a construct-based
integrity test and were rated by their supervisors on several dimensions of performance.
The ES component exhibited a negative quadratic relationship with ratings of task
performance and ratings of OCB. In contrast, Le et al. reported a positive quadratic (U-
shaped) form for the ES—CWB relationship. Study 2 involved a very similar design, in
which 956 participants completed the WorkKeys Talent Assessment Big Five measure. In
this sample, Le et al. found no evidence of curvilinearity for task performance, a negative
quadratic for ES—OCB, and a positive quadratic for ES—CWB. Thus the results for
OCB and CWB criteria were replicated, but the task performance results did not
replicate.
Research Question 3: Is the relationship between emotional stability and
performance best described as a linear or quadratic function?
33
Openness to Experience—Job Performance Theory. According to Goldberg
(1992), people scoring low on openness are described as “unintellectual”,
“unimaginative”, “uncreative”, and “simple”, whereas those high on openness are labeled
“intellectual”, “creative”, “complex”, “bright”, and “philosophical”. There is little
developed theory relevant to whether high openness scores may have nonlinear
implications for job performance. As with other domains, examination of clinical
psychology literature may provide insight. Widiger et al. (2002) describe high openness
as:
Is preoccupied with fantasy and daydreaming; lacks practicality; has eccentric
thinking (e.g., belief in ghosts, reincarnation, UFOs); has a diffuse identity and
unstable goals, for example, joining a religious cult; is susceptible to nightmares
and states of altered consciousness; shows social rebelliousness and
nonconformity that can interfere with social or vocational advancement. (p. 440)
While some of these implications clearly fall outside the domain of work, some are
relevant to the workplace, such as lacking practicality or exhibiting rebelliousness or
nonconformity with consequences for vocational advancement. For example, creative
problem solving is often espoused as a critical skill for successful performance in many
occupations (Mumford, Peterson, & Childs, 1999; Reiter-Palmon, Mumford, & Threlfall,
1998). In most cases, creative solutions to workplace problems are optimal to the extent
that they are useful within the circumstances of the issue. Thus, while openness is likely a
useful personal characteristic for identifying creative solutions, high openness may be
detrimental if suggestions lack practicality.
34
If high openness can lead to generation of many ideas for solving work problems,
an additional implication for nonlinearity is constantly changing goals. If being open to
trying many courses of action results in one’s inability to choose and stick with a plan,
this may be detrimental for task performance in the high range of openness. As with other
Big Five personality characteristics, the key question is whether detrimental levels of
openness are observed in the workplace, beyond being possible from a theoretical
perspective.
Openness to Experience—Job Performance Evidence. Only one study has
assessed openness within the Big Five framework and tested for the presence of nonlinear
relationships. Cucina and Vasilopoulos (2005) used the IPIP 100-item Big Five measure
to assess openness for 262 undergraduate students and examined the form of its
relationship with first semester GPA. They found evidence for a positive quadratic (U-
shaped) relationship, whereby optimal levels of openness for FGPA were in the high and
low ends of the score range. Thus, although their study was in academic setting, Cucina
and Vasilopoulos provided evidence that openness can exhibit curvilinearity when
compared to performance in a consequential domain.
Within the occupational domain, Whetzel et al. (2010) reported some openness-
related scales in their study using the OPQi. While direct Big Five links are not available,
examples of these scales included measures of the degree to which people are Adaptable,
Innovative, Conventional, Forward Thinking, and Variety Seeking. Using their R2
increment of .05 in both split-half samples as a rule-of-thumb, Whetzel et al. reported no
evidence for curvilinearity between these measures and ratings of job performance. As
35
expected, if the .05 criterion was relaxed to .01, some of the findings can be interpreted as
evidence for nonlinearity. Additionally, some researchers in other studies relied on
statistical significance as evidence for the meaningfulness of polynomial regression
terms, whereas Whetzel et al. emphasized effect size. Although both approaches may
have merit, this makes direct comparisons among studies difficult.
Research Question 4: Is the relationship between openness and performance best
described as a linear or quadratic function?
Extraversion—Job Performance Theory. Goldberg (1992) offered the
following descriptors for low extraversion (labeled Surgency): “shy”, “quiet”, “reserved”,
“inhibited”, and “withdrawn”. Conversely, adjectives for high extraversion included
“talkative”, “assertive”, “energetic”, “bold”, “daring”, and “unrestrained”. Murphy
(1996) provides an example for why extraversion may exhibit a negative quadratic
(inverted-U) relationship with team performance: those scoring lower may experience
discomfort in team interactions and thereby may not participate or otherwise work well
with others, whereas those scoring high might spend all their time socializing at the
expense of completing tasks. This could be an important issue given that many work
tasks are completed in interdependent teams (cf., Bell, 2007). From the clinical
perspective, Widiger et al. (2002) describe high extraversion as:
Talks excessively, leading to inappropriate self-disclosure and social friction; has
an inability to spend time alone; is attention seeking; shows overly dramatic
expressions of emotions; shows reckless excitement seeking; inappropriately
attempts to dominate and control others. (p. 439)
36
Thus high extraversion could exhibit nonlinear relationships in interpersonal performance
settings, building on Murphy’s (1996) suggestions. Additionally, while extraversion is
related to leader emergence (Judge, Bono et al., 2002), this may come at the price of
others feeling as though they have been stepped by on an extremely dominant individual.
This has similar implications for CWB, as any attempts to control others in the workplace
could be interpreted as Machiavellianism (Kessler, Bandelli, Spector, Borman, Nelson, &
Penney, 2010).
Extraversion—Job Performance Evidence. There are no studies examining
nonlinear functional forms between Big Five measures of extraversion and occupational
performance. However, Whetzel et al. (2010) include some scales potentially relevant as
facets of extraversion in their investigation, namely, Affiliative, Outgoing, Outspoken,
and Socially Confident. Under their R2 increment of .05 in both samples rule-of-thumb,
none of these scales showed curvilinear relationships with job performance. Cucina and
Vasilopoulos (2005) report polynomial regression results for IPIP-Extraversion using a
first-semester GPA criterion for college students. They reported an R2 change of .000 and
a non-significant regression weight when the polynomial term was entered.
Research Question 5: Is the relationship between extraversion and performance
best described as a linear or quadratic function?
Finally, two studies by Benson and Cambpell (2007) are of note. These
researchers investigated the possibility that personality-based characteristics thought to
relate to leadership derailment were related in a nonlinear fashion to indices of leadership
behavior. The derailing composites examined by Benson and Campbell were composed
37
of several personality scales that represented very high or very low standing on Big Five
traits. In their first study, examples of these characteristics included leaders’ propensity to
be ego-centered, manipulative, micro-managing, or passive-aggressive. In their second
study, examples of these characteristics included excitability, skepticism, being overly
cautious, bold, or mischievous. Benson and Campbell reported significant negative
quadratic effects for composites of these personality predictors in relation to several
indices of leader behavior across two samples.
Summary of Issues Related to the Inferences From Previous Studies
There are a number of reasons why the studies reviewed above have not provided
definitive conclusions about the nonlinearity question, with several scholars noting that
the state of the literature is still inconsistent (Converse & Oswald, 2012; Schmidt, 2010).
The most obvious reason is the presence of conflicting findings, going beyond issues with
presence or absence of statistical significance that often cloud narrative reviews. This is
particularly evident in domains with the most studies; namely, the conscientiousness
domain. Conflicting findings are, in and of themselves, not necessarily a satisfying
motivator for additional research, as they may be symptomatic of many potential issues.
In particular, studies in applied psychology generally, and nonlinearity more specifically,
make use of convenience samples, which may be representative of a limited population.
This may be the case due to preselection on a complex set of known and unknown
factors. Additionally, both Hough and Dilchert (2010) and the Society for Industrial and
Organizational Psychology’s Principles for the Validation and Use of Personnel
Selection Procedures (SIOP, 2003, p. 21) describe the necessity for very large samples in
38
attempts to detect nonlinearity. Thus it is possible that sampling error and a lack of power
have played critical roles in the cumulative record of previous research. A related concern
is the question of whether observed personality scale scores covered enough of a range to
detect nonlinearity – particularly extremely high scorers. It is unclear whether scorers
covering the full range of responses were present in previous studies. Sampling from the
high-scoring end of the predictor distribution is particularly important in studies of this
nature (Little, 2007). Adding to differences in interpretations across studies, Whetzel et
al. (2010) suggested R2-change rules of thumb that were not similarly applied in other
studies, some of which appear to have relied more on statistical significance than effect
size.
A variety of criterion measures (e.g., supervisor ratings of overall performance,
GPA, training performance, counterproductive behavior) were used in the previous
studies, some perhaps more comparable than others. These criteria may be unaligned with
certain predictors; an example is that performance on knowledge acquisition measures in
a training context may be likely to demonstrate small relationships with personality
measures. Additionally, various personality measures were employed as predictors across
the studies. Construct validity is a particular concern, as Hough et al. (1990) reported
often low mean correlations among personality measures of common conceptual
domains. As an example, while many scales measuring “conscientiousness” exist, they
often differentially emphasize various facets such as achievement orientation, orderliness,
dutifulness, or self-discipline. Beyond construct coverage, measurement properties
differed among at least some of the measures. For instance, the ipsative measure studied
39
by Whetzel et al. (2010) may yield different scale information than non-ipsative forms of
similar assessments.
Finally, there has been little discussion of implications for applied measurement
situations, in which decisions carrying tangible employment consequences are made
about those completing personality measures. Hough and Dilchert (2010) noted that the
presence of curvilinearity could dictate whether certain uses of personality scores make
more sense than others, such as top-down selection strategies, setting cut scores for
screening purposes, or methods for combining personality scores with other assessment
information. Converse and Oswald (2012) presented a simulation documenting potential
losses in performance if personality data are treated as linear when the relationships are
truly nonlinear. Thus, in spite of compelling rationale for nonlinear relationships, it is
necessary to understand whether and when these effects occur (Grant & Schwartz, 2011).
The follow-on question is whether nonlinearity matters in operational settings. The most
immediate implications would be for two situations: First is a setting in which a cut score
is identified in the predictor distribution and candidates are rejected below the score. In
the presence of a substantial negative quadratic curvilinear effect, it would be possible for
some candidates who pass the cut score to perform worse than those rejected. Second is a
setting in which rank-ordered top-down selection decisions are made on the basis of
personality predictors. In this condition, the most serious issues would occur when a
negative slope describes the personality—performance relationship in the high score
range. This problem would be minimized in the case of asymptotic nonlinearity (Hough
& Dilchert, 2010). In both cases, a critical issue is the point in the personality score range
40
in which the validity coefficient describes a negative relationship (if at all). Theoretically,
it is important to understand possible nonlinear relationships, but the practical problems
would be minimized if the point at which validity becomes negative occurs outside of
either (a) the typical observed score range or (b) the possible score range. Building on the
above discussion about the possible differences in measurement properties between
specific assessments, it is also the case that personality inventories may differ in whether
a nonlinear turning point occurs within or beyond the observed scale range.
In addition to the factors noted here, conflicting findings among studies suggest
the importance of moderating variables, which are explored more fully in the next
section.
Possible Moderators of Personality—Job Performance Functional Forms
One way to summarize the review above is to note that the current I-O
psychology literature contains approximately six published studies of nonlinearity of
conscientiousness, two studies of emotional stability, one study of openness, and no
studies of agreeableness and extraversion. This statement is predicated on the use of
assessment instruments that are designed to measure each personality characteristic at the
definitional level of abstraction of the five-factor model. While these studies have shed
light on the possibility of nonlinear personality—performance relationships, the mixed
results across studies suggests at least two possibilities, namely, (a) sampling error or (b)
the presence of moderating variables. Differences in results due to sampling error are
possible in any similar set of studies. In this case, sample idiosyncrasies or capitalization
on chance characteristics of the samples studied could have yielded differences in
41
findings across studies. Johnson and Hezlett (2008) argue that sampling error cannot
account for all (or even most) of the variability in meta-analytic linear Big Five—job
performance investigations, which could be relevant for nonlinear cases. Johnson and
Hezlett discuss findings from Tett and Christiansen (2007), who found an average 80
percent credibility interval of .3 across meta-analyses; thus sampling error alone could
not account for the variability across studies.
While sampling error is at play in any set of psychological studies, the current
study emphasizes the possible importance of substantive moderating variables. That is,
there may be certain conditions under which it is more or less likely to observe nonlinear
personality—job performance relationships. In particular, moderation could have two
general effects: (a) influencing whether personality—performance relationships exhibit
nonlinearity, and (b) influencing the point in the joint predictor and criterion score ranges
at which the relationship departs from linearity. The focus in this study is on occupation-
level moderators of the form of individual-level personality—performance relationships.
Individual-level refers to the level of analysis in which each individual case has both
personality and performance scores. In contrast, occupation-level refers to the fact that
individuals are naturally grouped into various occupations, and each occupation is
associated with a set of defining characteristics. At the occupation level, these
characteristics are considered essentially constant within each occupational unit, such that
each individual within an occupation has the same score on an occupation-level
characteristic. An example is an occupation-level indicator of work autonomy: Many
occupations differ in terms of the autonomy afforded to incumbents, but the difference
42
here is conceptualized to vary at the occupation level as opposed to the individual level.
Thus, for the purposes of this study, occupation-level moderators differ from other
possible ways of thinking about moderators, such as the particular job performance
criterion of interest, personality predictor of interest, or environment in which a study
was conducted (i.e., lab/field comparisons). The fundamental research question is: What
are the conditions under which one might expect departure from linearity in personality—
job performance investigations?
Out of those reviewed above, one study has examined a possible moderator for
nonlinear personality—performance functional forms. Le et al. (2011) proposed that an
occupation-level feature, job complexity, might affect whether or not nonlinear
relationships are exhibited. They chose to investigate job complexity for three primary
reasons: (a) this characteristic is a known moderator of cognitive ability—performance
correlations (Hunter & Hunter, 1984), (b) it may provide an explanatory framework for
any differences in findings across occupations, and (c) complexity information for an
occupation is frequently available, as it is considered important. There are many
possibilities for operationally defining job complexity, and Le et al. reported two
techniques that differ between their two studies. In their first study, two researchers made
dichotomous judgments (low complexity/high complexity) on the basis of written
information about the jobs in question. The judgments integrated the degree of non-
routine and complex information processing as well as the training and preparation
needed. Le et al. found that job complexity moderated the conscientiousness—task
performance relationship, such that the negative quadratic relationship changed from
43
positive to negative much lower in the score range for low complexity jobs than for high
complexity. They also found that complexity moderated relationships of emotional
stability with task performance and OCB; in both cases, the inflection point at which the
form becomes negative occurred much lower in the personality score range for low
complexity jobs, whereas the form effectively asymptotes at higher scores in high
complexity jobs. In their second study, Le et al. operationally defined complexity using
job zone data from the Department of Labor’s Occupational Information Network
(O*NET). Job zone data is based on the degree of vocational preparation needed for the
job and takes into account experience, education, and training. While the
conscientiousness and emotional stability—task performance findings did not replicate,
complexity again moderated the negative quadratic emotional stability—OCB
relationship in the same manner as study 1. Le et al. (2011) positioned these findings
against Robie and Ryan’s (1999) and LaHuis et al.’s (2005) previous studies involving
conscientiousness: Where Robie and Ryan examined fairly complex jobs and found no
evidence of curvilinearity, LaHuis et al. obtained significant quadratic effects in two
samples of relatively low-complexity clerical occupations.
Research Question 6: Are the forms of relationships between personality
predictors and performance moderated by omnibus indices of job complexity?
Possible Moderators in Addition to Job Complexity. The current study is
intended to replicate Le et al.’s findings by examining the degree to which job
complexity moderates the form of the relationships in the current samples. However,
overall complexity indices are still somewhat of a “black box” in the sense that
44
occupations can vary in many different ways, leaving it unclear where a moderating
effect lies. While indices such as O*NET’s job zone can provide an omnibus test of
moderation via job complexity, it is possible that examining occupation characteristics as
moderators within a theoretical framework will provide additional explanatory power.
Tett and Burnett (2003) provide just such a framework by arguing that there are job or
situational characteristics that “activate” the expression of particular personality traits.
According to Tett and Guterman (2000), when a trait is cued as relevant in a given
situation, and the circumstances allow the actor opportunity to select a course of action,
then one’s standing on the trait becomes a determinant of the way they think, feel, or act.
In the case of possible nonlinearity, the question becomes whether these characteristics
activate trait expression similarly across the full range of the trait.
This study focuses on seven potential moderating characteristics, all of which
relate to occupation-level work styles. Drawn from large-scale efforts to quantify the
“personality loading” for various occupations, work styles are intended to indicate the
degree of personality trait relevance to the performance of work activities. To the extent
that occupations differ in terms of the importance of work styles, there may be utility in
examining whether these characteristics function as moderators of individual-level
personality—job performance relationships. Data on these characteristics are available in
the form of mean ratings on Likert-type scales (e.g., capturing judgments of importance).
For example, it is possible to ask, “For occupation X, how important is having a social
orientation to performance of the job?” In terms of analytical design, the moderation
question can be summarized as follows: Does the magnitude or direction of the quadratic
45
coefficient based on the regression of performance ratings on a personality scale depend
on the rated importance level of the moderating characteristic? This summary question
can be decomposed into two component research questions: (a) Does the moderator
determine whether there is evidence for nonlinearity, in terms of the magnitude and
practical significance of the quadratic regression coefficient? (b) In the case of a
meaningful quadratic coefficient, does the moderator appear to determine the location at
which a bend, or inflection point, occurs? One goal of this study is to examine these
moderators where it is feasible to do so, as this represents an expansion of the path of
inquiry started by Le et al. (2011). The set of work styles examined in this study is
detailed below.
Occupation-relevant personality work styles. Growing general acceptance of
personality measures in the workplace has included heightened interest in identifying
personality-based characteristics that are useful in the performance of work activities as
part of job analysis procedures. Two similar efforts in the late 1990’s resulted in
taxonomies of personality-based job analysis descriptors. Raymark et al. (1997)
developed a deductive job analysis questionnaire intended to identify the degree to which
work activities linked to each of the Big Five personality factors. Borman, Kubisiak, and
Schneider (1999) reported a similar effort to identify dispositional requirements as a
component of O*NET’s Content Model. In an effort to balance construct clarity and
empirical prediction, they drew from work on both the internal structure of personality
(i.e., the Big Five) and the literature on predictive validity for personality concepts,
46
whether rooted in the Big Five or not. Borman et al. identified 17 (later revised to 16)
descriptors that could be fully nested within 7 broader factors:
(a) Achievement orientation – job requires personal goal setting, trying to
succeed at those goals, and striving to be competent in own work
(b) Social influence – job requires having an impact on others in the organization,
and displaying energy and leadership
(c) Interpersonal orientation – job requires being pleasant, cooperative, sensitive
to others, easy to get along with, and having a preference for associating with
other organization members
(d) Adjustment – job requires maturity, poise, flexibility, and restraint to cope
with pressure, stress, criticism, setbacks, personal and work-related problems,
etc.
(e) Conscientiousness – job requires dependability, commitment to doing the job
correctly and carefully, and being trustworthy, accountable, and attentive to
details
(f) Independence – job requires developing one's own ways of doing things,
guiding oneself with little or no supervision, and depending on oneself to get
things done
(g) Practical intelligence – job requires generating useful ideas and thinking
things through logically
Previous research suggests that larger correlations are typically found when
personality predictors are matched on a rational or theoretical basis with criteria, as
47
opposed the “shotgun” approach whereby everything gets correlated with everything else
(Bartram, 2005; Hogan & Holland, 2003; Johnson & Hezlett, 2008; Tett et al., 1991).
However, that work focuses on the magnitude of correlations. The degree to which these
occupation-level work styles influence the functional form of personality with
performance remains to be seen.
This study focuses on the conceptual match between the individual-level
personality characteristic and the occupation-level work style. The focal comparisons are
listed here:
(a) The form of individual conscientiousness—performance relationships may be
moderated by the degree to which the Achievement Orientation and
Conscientiousness work styles are important for an occupation.
(b) The form of agreeableness—performance relationships may be moderated by
the importance of Interpersonal Orientation for an occupation.
(c) The form of emotional stability—performance relationships may be
moderated by the importance of the Adjustment work style for the occupation.
(d) The form of extraversion—performance relationships may be moderated by
the importance of Social Influence for the occupation.
(e) The form of openness—performance relationships may be moderated by the
importance of the Practical Intelligence work style for the occupation.
Researchers have made suggestions about the extent to which occupation
characteristics may either promote or inhibit the degree to which various individual
standing on personality traits is related to performance. Barrick and Mount (1993) found
48
that the magnitude of validity coefficients for conscientiousness, extraversion, and
agreeableness differed between high- and low-autonomy jobs. LaHuis et al. (2005)
suggested that low autonomy might contribute to finding nonlinearity, as lack of
autonomy may place a ceiling effect on whether higher scores on conscientiousness can
influence performance. In essence, low autonomy might create a “strong situation” that
would inhibit manifestation of the full range of the personality characteristic. Building on
this idea, Converse and Oswald (2012) proposed that high levels of conscientiousness
may be maladaptive in occupations requiring adaptability and flexibility: Increasing
information input and processing requirements may lead those high on conscientiousness
to get bogged down with details. Similar concepts could be true for other Big Five
factors. For instance, those scoring high on extraversion may not display that tendency in
work environments entailing minimal interaction; conversely they may be unable to
restrain their social tendencies, leaving others feeling dominated in team settings.
Additionally, agreeableness may have an asymptotic or negative quadratic relationship
with performance in occupations where conflict might occur: Those high in
agreeableness may not behave assertively enough or react appropriately in conflict
situations. Finally, those very high on openness may become distracted by the abundant
informational stimuli and be unable to focus on completing tasks.
By directly examining job analytic ratings of personality importance, the goal is
to understand how these characteristics operate using data from organizations.
49
Research Question 7: Are the forms of relationships between personality
predictors and performance moderated by occupation-level factors such as task
characteristics, work styles, the social context, or occupation-relevant interests?
Study Overview
The objective of the current study is to examine linear and nonlinear relationships
between Big Five personality measures and job performance using available data from a
single personality instrument: the Hogan Personality Inventory (HPI). Using one
instrument permits clarity in the inferences that can be drawn from results. In addition,
considerable effort has been undertaken to establish that the HPI can be interpreted
within the broader Big Five construct literature (Hogan & Hogan, 2007; Hogan &
Holland, 2003). Thus, examination of a large HPI database allows for a replication and
extension for the Big Five factors that have been studied previously using Big Five-
oriented scales (conscientiousness, openness, and emotional stability). A potential
disadvantage to focusing on one inventory is that the specification of exact bend or
inflection points for any nonlinear relationship may be inventory-specific. Thus the
generalizability of a specific turning point in the predictor score range may be
questionable.
This study provides the first major analyses f0or extraversion and agreeableness.
The scant previous evidence in these domains has been drawn from measures not
explicitly targeting the conceptual level of the Big Five. Importantly, the HPI validation
database also contains Standard Occupational Classification (SOC) codes that permit
links to the Department of Labor’s (DOL) O*NET database. This feature allows for
50
examination of the potential job complexity and work style moderators listed above,
consistent with proponents of Trait Activation Theory (Christiansen & Tett, 2008).
Thus, compared to existing studies in this domain, the current effort brings to bear
a larger database than ever before, based on one of the most widely used and accepted
personality assessments in applied psychology. Data spanning seven job families were
available, representing many settings. Finally, links to the O*NET allowed for integration
of a large, nationally representative and systematically-sampled job analysis system with
the personality data to examine potential moderators.
SECTION 2: METHOD
Sample
Data were drawn from test validation research conducted by Hogan Assessment
Systems. No new participants were tested for the specific purposes of this study.
Participants were drawn from 123 validity studies conducted in support of using the
Hogan Personality Inventory (HPI) scales as a set of predictor variables. Performance
rating data, detailed below, were collected and categorized according to a dimensional
model of job behavior. The largest sample sizes for analyses involving overall job
performance ranged from 11,312 to 12,216; analyses involving other criteria were
smaller (further details are found in the results section and associated tables). The sample
included studies with participants distributed among seven job families: managers and
executives, professionals, technicians and specialists, sales and customer support,
administrative and clerical, operations and trades, and service and support (Table 1).
Participants were distributed across occupations ranging from low complexity to high
51
complexity, as defined using the DOL O*NET’s job zone classification system, described
below (Table 1; see also Oswald, Campbell, McCloy, Rivkin, & Lewis, 1999).
Information on the gender, ethnic diversity, age, and tenure of the sample is shown in
Tables 2 and 3.
Measures
Hogan Personality Inventory (HPI). According to Hogan Assessment Systems,
the HPI was the first inventory of normal-range personality based on the Big Five
designed specifically for workplace use. The HPI consists of 206 true/false items that are
combined into 41 homogenous item clusters (HICs) based on common themes and
empirical correlations among items. In turn, these HICs form seven composite scales
used operationally (descriptions are based on the HPI Manual [Hogan & Hogan, 1995],
with the Big Five corollary in parentheses):
(a) Adjustment (emotional stability): confidence, self-esteem, and composure
under pressure
(b) Ambition (extraversion): initiative, competitiveness, and desire for leadership
roles
(c) Sociability (extraversion): extraversion, gregariousness, and need for social
interaction
(d) Interpersonal Sensitivity (agreeableness): tact, perceptiveness, and ability
maintain relationships
(e) Prudence (conscientiousness): self-discipline, responsibility, and
conscientiousness
52
(f) Inquisitive (openness to experience): imagination, curiosity, and creative
potential
(g) Learning Approach (openness to experience): achievement-oriented and up-
to-date on business and technical matters
The HPI manual (2007) describes test reliability for each of these scales as being
in the .69 to .87 range. Hogan and Holland (2003) also report recent reliability estimates,
where the first value indicates internal consistency and the second indicates test-retest:
Adjustment (.89/.86), Ambition (.86/.83), Sociability (.83/.79), Likeability/Interpersonal
Sensitivity (.71/.80), Prudence (.78/.74), Intellectance/Inquisitive (.78/.83), and School
Success/Learning Approach (.75/.86). All items were written targeting a fourth grade
reading level and have been reviewed for content based on professional standards. The
HPI has been used frequently in research settings, and is generally accepted among
practitioners and the academic community. Construct validity evidence for the HPI’s
relevance to the Big Five framework has been established in several major studies
(Hogan & Hogan, 1995; Hogan & Hogan, 2007; Hogan & Holland, 2003). The HPI is at
least as technically adequate as any comparable instrument, is associated with a long
history of supporting research, and has been used widely for workplace assessment.
Construct validation is certainly an ongoing process with implications for the degree to
which results from the current study can be generalized to settings in which alternative
personality inventories are administered (Anderson & Ones, 2003; Hough et al., 1990).
The Big Five bandwidth is the primary focus of this study, and the analyses and
results use the Big Five labels instead of the HPI scale labels. The HPI archive examined
53
in this study did not include individual scales mirroring the bandwidth of the extraversion
and openness to experience Big Five factors. The reason is that the concepts of Ambition
and Sociability, both linked to extraversion, could be said to tap into conceptually distinct
aspects of extraversion. The same argument can be made for the relationships of
Inquisitive and Learning Approach scales to openness to experience. Thus these HPI
scales were developed in a manner consistent with Hough’s (1992) arguments that Big
Five-bandwidth scales can obscure facet-level measurement properties. To provide
proxies for Big Five extraversion and openness, and thereby to provide some comparison
to other studies at the Big Five level, these two groupings of “facet” scales were
combined into unit weighted scales representing extraversion and openness (e.g., Bobko,
Roth, & Buster, 2007). Descriptive statistics for the personality predictor scales are
shown in Table 4. Correlations among the scales are shown in Table 7.
Job performance. Performance ratings were collected for research purposes and
were based on the domain competency model described by Hogan, Davies, and Hogan
(2007) and Hogan Assessment Systems (2009). Thus, in this study the term
“competency” refers to a behavioral performance component on which individuals are
thought to vary. Supervisors provided numeric competency ratings for those who
completed the HPI. In each validation study, the rated performance competencies were
included on the basis of a job analysis procedure. The studies examined in the present
research were drawn from a mix of predictive and concurrent validation designs, with the
large majority from concurrent studies. Hogan et al. (2007) provided rational crosswalks
of their domain model to performance models suggested in the literature (e.g., Bartram,
54
2005; Borman & Motowidlo, 1993; Campbell, McCloy, Oppler, & Sager, 1993; Hunt,
1996, Tett, Guterman, Bleier, & Murphy, 2000), arguing that their domain model can
subsume these models. While this is a broad claim, it is consistent with recent
suggestions from Campbell (2012), who argued that most professionally developed
multidimensional models of occupational performance refer to the same fundamental
behavioral concepts, even if they use different labels. Following consideration of the
measurement properties of the conceptually multidimensional competency ratings, an
index of overall job performance was determined to be the best available criterion for this
study. The following paragraphs provide details about this decision.
The four domains in the model used by Hogan et al. (2007) are intrapersonal
skills, interpersonal skills, technical skills, and leadership skills. In spite of the use of the
term “skills”, these classifications refer to substantive domains of employee behaviors, as
opposed to performance determinants. One goal of this study was to examine
performance information in such a way as to provide information about task
performance, OCB, and CWB. These three performance categories have been shown to
be relevant in the work environment, conceptually and empirically distinct (Dalal, 2005;
Rotundo & Sackett, 2002), and consistent with other models such as that provided by
Campbell et al. (1993). Concepts of task, OCB, and CWB performance were also studied
in the work of Le et al. (2011) described above. It appears possible to link the Rotundo
and Sackett three-component framework to the Hogan competency model on a rational
basis. First, the component of work skill from the Hogan et al. model refers to the
proficiency with which one assimilates and works with information and solves work-
55
related problems. This dimension essentially refers to the core technical component of
job performance – often labeled task performance. Example competencies linked to
technical skill in this model included Industry Knowledge, Information Analysis,
Presentation Skills, and Problem Solving. Thus these ratings were the closest available
proxy to an index of the proficiency with which an employee performs work activities
that involve specific technical matters. Second, Hogan et al.’s concept of intrapersonal
skills concerns the degree to which employees maintain self-esteem, resilience, and
emotional security, as well as the degree to which they exercise self-control. Thus, high
intrapersonal performance could be seen as avoidance of CWB, with example
competencies including Professionalism, Following Procedures, Responsibility, and
Work Ethic. These concepts correspond to the Maintaining Personal Discipline
performance component discussed by Campbell, McHenry, and Wise (1990). Third,
Hogan et al.’s interpersonal skill competency refers to the degree to which employees are
rewarding to work with, contribute positively to the work environment, and are
empathetic towards others. This domain is comprised of competencies such as
Organizational Citizenship, Service Orientation, Building Relationships, and Teamwork.
These behaviors appear to match well with concepts of OCB and contextual performance
offered by Borman and Motowidlo (1993) and Organ (1997). Finally, the concept of
leadership skill is based on recruiting, managing, and planning work for others. Sample
competencies included Managing Conflict, Motivating Others, Employee Development,
and Resource Management. These leadership competencies were not restricted to use in
studies with participants holding formal leadership or managerial roles, but do tend to be
56
emphasized more heavily in those settings. The development of the four performance
components in the domain model is described in Hogan and Warrenfeltz (2003) and a
white paper from Hogan Assessment Systems (2009).
The four broad performance components described above can be characterized as
overlapping both conceptually and empirically. Conceptually, the behaviors involved in
performing leadership work also often have both interpersonal (Building Teams) and
intrapersonal (Managing Conflict) components. Some competencies categorized in the
more technically focused work skill domain also relate to interpersonal concepts, such as
Negotiation or Sales Ability. From a measurement standpoint, all competency data were
collected via supervisor ratings. The use of a common method can contribute to the
magnitude of correlations among different competency ratings for both substantive and
non-substantive reasons (Podsakoff et al., 2003). On one hand, an employee may be rated
at a similar level across performance components due to commonalities in the judged
effectiveness of those specific behaviors, or perhaps due to performance in conceptually
separable domains that share determinants (Viswesvaran, Schmidt, & Ones, 2005). On
the other hand, ratings on multiple competencies may covary due to a rater’s holistic
evaluative judgment about an employee’s behavior or contribution, largely irrespective of
the substance of the rating stimulus. Composites for the intrapersonal, interpersonal,
leadership, and work skill domains were formed, each consisting of the available
component competencies rated within a given validity study. Descriptive information for
the performance ratings is shown in Tables 5 and 6. Correlations among the performance
composites are shown in Table 7, and range from .61 to .75, uncorrected for measurement
57
error. Although it may be desirable to conduct a factor analysis on the competency
ratings as a further empirical examination of their dimensionality, such an analysis was
not feasible due to missing values in the correlation (or covariance) matrix for all
competencies. That is, since many performance competency pairs were never included
together in a study, even a pairwise matrix could not be assembled for submission to
factor analysis.
A feature of the archival database is that most validity studies incorporated ratings
across differing sets of competencies. That is, different groupings of competencies were
available for each validity study. The primary reason for this is that the final set of
competencies included on validation study performance rating forms was selected based
on importance ratings from a job analysis questionnaire. While the goal was to draw
some inference about each of the four performance domains (not including overall
performance), it also meant that the competencies comprising the domain composite
differed somewhat across validity studies. Every competency rating in the database was
available on a standardized scale. To provide an estimate of reliability or consistency
within each domain, the average correlation among competency ratings within each
domain was obtained. This correlation estimate was then entered into the Spearman-
Brown formula to estimate an intraclass correlation based on the average number of
competencies making up the composite. These estimates are shown in Table 8, and show
that several of the domain-specific criteria are estimated to have low reliability (.5 to .6)
when operationally defined as composites in the manner done in this study. In lieu of a
factor analysis, to examine the dimensionality of the individual competency ratings, a set
58
of divergent (between-domain) correlations was calculated for comparison with the
convergent (within-domain) correlations in Table 8. For example, the mean correlation of
competencies categorized as “intrapersonal” with competencies not categorized as
“intrapersonal” (labeled “other” in Table 8) was obtained. All of these correlations were
calculated within each validity study and the results represent weighted averages across
the studies. The data in Table 8 show that the convergent and divergent correlations were
of nearly the same magnitude (all fell within a range from .40 to .47), suggesting that the
conceptual differences between criteria were not borne out empirically.
Given all of the above, overall job performance was selected as the focal criterion
domain for four primary reasons. First, as shown above, the convergent and divergent
correlations among performance ratings indicated that these data contained virtually no
empirical properties for differentiating among performance domains. Analyses for each
criterion domain were conducted on the basis of the conceptual distinctions described
above for exploratory purposes, but the correlations suggest strong positive manifold
across the ratings. Second, research indicates that composite measures of overall
performance can be derived from conceptually distinct performance measures, whereby
those who perform well in one domain of performance also tend to perform well in other
domains (Viswesvaran et al., 2005). The correlations among the four composite criteria
suggest the presence of a large general performance factor. Overall performance can be
said to provide an indication of one’s economic value in the pursuit of organizational
goals (Schmidt & Kaplan, 1971). Third, overall job performance data were available for
virtually all of the validity studies available for analysis, and thus yielded an opportunity
59
to maximize the sample size for this set of analyses while still allowing for substantive
conclusions to be drawn. Fourth, a final advantage is that examination of overall job
performance permits comparison with findings from previous studies. Overall job
performance represented summary judgments made by raters regarding the effectiveness
of an employee’s job behavior. As with the four criteria described above for the domain
model, overall job performance ratings were available in a standardized metric (mean of
0 and standard deviation of 1). As an indirect indicator of reliability, the same procedure
used to estimate ICCs for the other performance composites was applied to the full set of
correlations among competencies. Given an average of 10.52 competencies rated per
study and mean correlation among competencies at .43, an approximate ICC for an
overall performance composite was .89. Note that this estimate is a within-rater
(intrarater) reliability estimate: The interrater reliability of these performance ratings is
not addressed here due to the unavailability of data. An interrater reliability estimate
would be needed if one were to correct for unreliability (Schmidt & Hunter, 1996).
Occupation Characteristics from O*NET. The O*NET database provides a
repository of rigorously collected occupational information. These data were drawn from
the Department of Labor’s (DOL) website to form the moderator variables in this study.
The validity studies in the Hogan Archive were coded using the DOL’s Standard
Occupational Classification (SOC) scheme. The SOC coding in the HPI database is the
key feature that allows the link between the personality-based validity evidence and the
O*NET information. To date, a primary use of the HPI’s SOC linkage is to allow for
60
internal validity generalization studies in support of a given client organization’s use of
the HPI. The current study uses this linkage for somewhat broader research purposes.
The O*NET contains job-analytic data that are systematically sampled from many
occupations throughout the U.S. economy. The database available at the time of this
study, O*NET 17.0, contains updated data representing 900 occupations. O*NET data
are organized using a Content Model that allows for occupations to be evaluated on over
250 characteristics within 6 major categories. The O*NET 17.0 development database
was obtained from the DOL’s website: http://www.onetcenter.org/. O*NET lists 1,110
occupations in the current SOC, although over 100 occupations do not presently have
data collected. Each occupation for which data exists has been evaluated either by job
incumbents (those who regularly perform the work), occupational analysts (those who
have specialized training in job analysis techniques), occupational experts (those who are
involved in a professional association relevant to a particular occupation), or a
combination of these three data sources.
Similar to Le et al.’s (2011) second study, this study adopts O*NET’s job zone as
an index of overall job complexity. The job zone corresponds with typical educational
requirements and experience needed, although it is also assigned on the basis of
vocational training, consistent with previous classifications in the Dictionary of
Occupational Titles (Oswald, Campbell, McCloy, Rivkin, & Lewis, 1999). Each
occupation is assigned a numerical job zone code, which is defined by the following 5-
point scale:
• 1 = Little or no preparation needed (less than high school);
61
• 2 = Some preparation needed (high school diploma);
• 3 = Medium preparation needed (high school plus);
• 4 = Considerable preparation needed (bachelor’s degree); and
• 5 = Extensive preparation needed (bachelor’s degree plus).
As job zone assignments take into account education, experience, and training, the ratings
are similar to complexity information used in previous studies, namely Hunter’s (1983)
examination of General Aptitude Test Battery (GATB) validity. The DOL provides
additional information on the job zone classification system at the following internet
address: http://online.onetcenter.org/help/online/zones.
O*NET’s Content Model essentially defines the taxonomy for each of the
domains from which potential moderating variables are drawn in this study. Ratings of
personality trait relevance to performance of the occupation were taken from O*NET’s
taxonomy of work styles. The current work styles taxonomy includes 16 rated descriptors
representing the importance of the trait for performance, which were combined into the
following seven composite variables (with number of component descriptors in
parentheses): achievement orientation (3), social influence (1), interpersonal orientation
(3), adjustment (3), conscientiousness (3), independence (1), and practical intelligence
(2). Evaluators rate work style descriptors in terms of their importance to performance on
a 5-point Likert scale, where 1 = Not Important, 2 = Somewhat Important, 3 =
Important, 4 = Very Important, and 5 = Extremely Important. Most of the work style
variables involved calculation of composite variables. Overall descriptive statistics,
internal consistency estimates where feasible, and correlations among moderators were
62
examined. This descriptive information is presented in Table 9. Primarily, this was done
to examine the composite variables used in this study, adding to the conceptual and
empirical rationale that already exists in the form of the hierarchical descriptor
taxonomies in O*NET’s Content Model (Borman et al., 1999). The distributions for these
variables were also examined.
One other comment on the use of O*NET data is relevant here: These data were
not collected for the specific organizations represented within the HPI database save for
unlikely chance overlap; thus the O*NET data represent typical occupational
characteristics, as opposed to the characteristics within the specific organizations from
which the personality—performance validity data are drawn. While in some ways this
could be considered a strength, such as in avoidance of potential common method
variance (i.e., single source) confounds, this feature is important for interpreting results,
as findings may differ in cases where personality, performance, and occupational
characteristic data are collected within the same organizational context.
Data Analysis
Descriptive statistics. A series of analyses were planned to evaluate the research
questions in this study. Descriptive statistics were examined for all variables, including
calculation of means, standard deviations, scale score ranges, and distributional
characteristics (i.e., skewness). Similar analyses were also conducted within each of the
validity studies. Although important for any study, distributional characteristics are
particularly important in this study, as the frequency of personality scores at the high end
of the scale can affect the degree to which nonlinearity is a concern.
63
Nonlinearity analyses. Building on the descriptive analyses, correlations between
each personality predictor and each criterion variable were examined. The focal analyses
for nonlinearity were drawn in part from procedural recommendations for hierarchical
polynomial regression analyses described by Cohen et al. (2003). Polynomial regression
techniques are associated with the highest statistical power for analyses of this type,
especially in comparison to statistics such as the correlation ratio (Coward & Sackett,
1990). In addition to the descriptive analyses described above, the first step in examining
the form of the personality—performance relationships is plotting the data. For each
personality predictor, scatterplots of the joint relationship with each criterion domain
were generated. Loess curves were superimposed on the scatterplots, as they are
nonparametric curves that completely follow the data; that is, they are not based on a
linear fit coefficient such as a correlation or regression coefficient. Loess curves connect
the means of Y across specific values of X. An additional virtue of scatterplots is that,
along with descriptive statistics, they can be useful in the detection of outliers.
A second set of residual scatterplots was generated. These graphs were based on
residuals from a linear regression of each criterion on each predictor. Following
estimation of the linear regression, the residuals were plotted on the Y axis (ordinate)
against the predictor on the X axis (abscissa). The advantage to the residual plots is that
they allow for inspection of the relationship that was not predicted by the linear equation.
That is, once the linear trend is accounted for, is there evidence for a predictable
curvilinear trend? These two sets of plots were generated for each predictor—criterion
combination using the full available database.
64
The hierarchical power polynomial regression approach proceeded in several
phases. The general equation used in analyses of this type – and adopted in virtually all
studies of nonlinearity reported above – is as follows:
Prior to analysis, the each predictor is centered so that the mean score becomes equal to
0. Following the recommendations of Cohen et al. (2003) and Enders and Tofighi (2007),
predictors were group mean centered in this study. A set of overall analyses were
conducted that were identical in all analytical aspects except group mean versus grand
mean centering; the results were very similar and the group mean centered results will be
the focus from this point forward. Procedurally, centering was done by subtracting the
group mean (with group in this case being each validity study) from each predictor
variable. In addition to providing interpretational advantages for the subsequent
regression results, which gives the 0 point a meaningful value, centering removes
nonessential collinearity among the predictors. This helps address multicollinearity,
which is a particular issue in polynomial regression, as the higher-order polynomial terms
are formed using the lowest-order (linear) term. Once the linear predictor is centered,
higher-order centered predictors are formed from the centered linear predictor. This is
accomplished by squaring the linear term. For all analyses not incorporating continuous
moderator variables (described in more detail below), the analytic strategy involved
estimating a set of regression coefficients within each validity study and calculating a
sample-size-weighted average of the results. The consequence for the centering decision
is that such within-study analyses end up being equivalent whether one is interested in
65
grand mean or group mean centering, since each group is analyzed separately. For
multilevel modeling analyses, centering plays a more important role since all available
groups are analyzed simultaneously. Group mean centering was used for those analyses,
as it is the recommended procedure when cross-level interactions are of interest with
cross-sectional data (Enders & Tofighi, 2007).
The regression analyses were conducted by entering the centered personality
variable of interest as the sole predictor in step one. The squared value of that centered
variable was then entered as the second predictor in step two, and change in variance
explained statistics (R2), along with the magnitude, direction, and significance of the
polynomial/quadratic coefficient, were interpreted. The equation was then plotted for
interpretation. Two additional pieces of information were examined: (a) simple slopes
and (b) location of bend points. The equation for calculating simple slopes in this case
was (Cohen et al., 2003):
Simple slopes provide information about the linear regression of performance on the
personality predictor, and can be calculated for an X value of interest. Thus the slope can
be evaluated at multiple points along the predictor score distribution. In this case, simple
slopes were calculated for predictor scores at -2 SDs, -1 SD, the mean, +1 SD, +2 SDs,
and +3 SDs. Alternatively, bend points occur where the slope of the regression line
changes sign (an inflection point) or meaningfully departs from linearity. For a negative
quadratic coefficient, the latter issue can be characterized as the point at which, after
reaching an optimal level in association with performance, higher personality scale scores
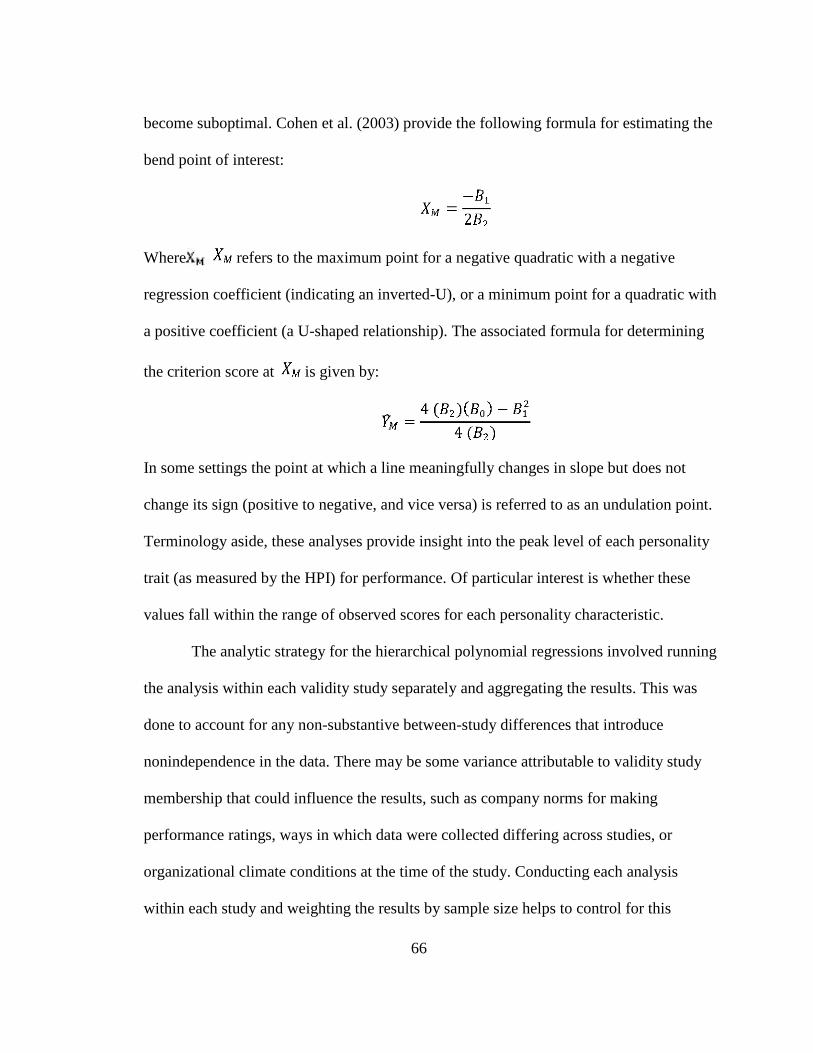
66
become suboptimal. Cohen et al. (2003) provide the following formula for estimating the
bend point of interest:
Where refers to the maximum point for a negative quadratic with a negative
regression coefficient (indicating an inverted-U), or a minimum point for a quadratic with
a positive coefficient (a U-shaped relationship). The associated formula for determining
the criterion score at is given by:
In some settings the point at which a line meaningfully changes in slope but does not
change its sign (positive to negative, and vice versa) is referred to as an undulation point.
Terminology aside, these analyses provide insight into the peak level of each personality
trait (as measured by the HPI) for performance. Of particular interest is whether these
values fall within the range of observed scores for each personality characteristic.
The analytic strategy for the hierarchical polynomial regressions involved running
the analysis within each validity study separately and aggregating the results. This was
done to account for any non-substantive between-study differences that introduce
nonindependence in the data. There may be some variance attributable to validity study
membership that could influence the results, such as company norms for making
performance ratings, ways in which data were collected differing across studies, or
organizational climate conditions at the time of the study. Conducting each analysis
within each study and weighting the results by sample size helps to control for this
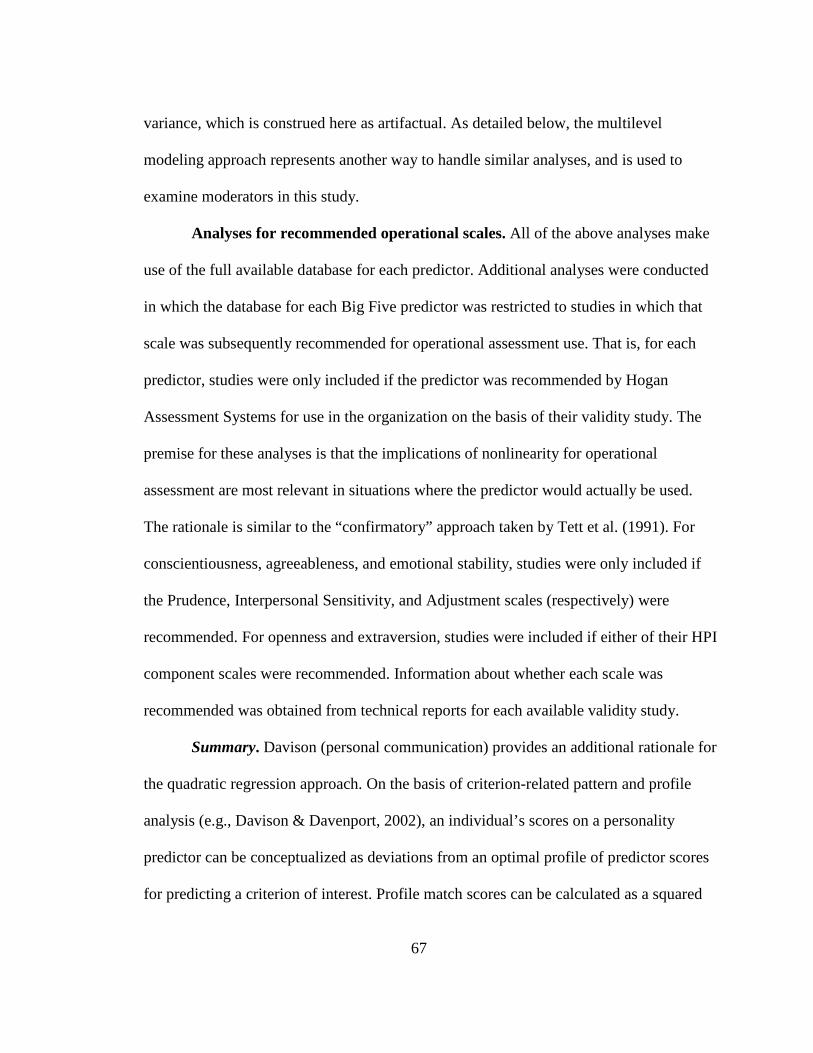
67
variance, which is construed here as artifactual. As detailed below, the multilevel
modeling approach represents another way to handle similar analyses, and is used to
examine moderators in this study.
Analyses for recommended operational scales. All of the above analyses make
use of the full available database for each predictor. Additional analyses were conducted
in which the database for each Big Five predictor was restricted to studies in which that
scale was subsequently recommended for operational assessment use. That is, for each
predictor, studies were only included if the predictor was recommended by Hogan
Assessment Systems for use in the organization on the basis of their validity study. The
premise for these analyses is that the implications of nonlinearity for operational
assessment are most relevant in situations where the predictor would actually be used.
The rationale is similar to the “confirmatory” approach taken by Tett et al. (1991). For
conscientiousness, agreeableness, and emotional stability, studies were only included if
the Prudence, Interpersonal Sensitivity, and Adjustment scales (respectively) were
recommended. For openness and extraversion, studies were included if either of their HPI
component scales were recommended. Information about whether each scale was
recommended was obtained from technical reports for each available validity study.
Summary. Davison (personal communication) provides an additional rationale for
the quadratic regression approach. On the basis of criterion-related pattern and profile
analysis (e.g., Davison & Davenport, 2002), an individual’s scores on a personality
predictor can be conceptualized as deviations from an optimal profile of predictor scores
for predicting a criterion of interest. Profile match scores can be calculated as a squared
68
profile match measure; for instance, a squared Euclidean distance. This squared distance
term functions as a quadratic term in the regression model, and can capture a nonlinear
predictor-criterion relationship. Note that full capitalization on a criterion-related profile
occurs in cases with multiple predictors, such that a profile across a set of independent
variables can be identified. The focal analyses in this study are based on the examination
of personality scales individually in separate regression models.
Several overarching comments about the power polynomial approach are
warranted. First, nonindependence of the data, and thus the residuals from a regression
analysis using data compiled across validity studies, may be an issue (Kenny & La Voie,
1985). Thus, intraclass correlations (described in more detail below) were calculated and
examined as an indication of the degree to which variance in each criterion is attributable
to validity-study-level effects. In all cases, these intraclass correlations were
approximately equal to 0. Nonetheless, two procedures were used to ensure that the
hierarchical polynomial regression procedure avoids conflating between and within-study
effects: (a) calculating regressions within unit and sample-size weighting the resulting
coefficients of interest, as described above, and (b) using multilevel modeling techniques,
described below, for moderation analyses.
Second, interpretation of the shape of the regression function, as well as the
weights used to calculate simple slopes and inflection points, are based on the regression
coefficients for the highest-order predictor (the quadratic term), in the context of the fully
specified polynomial equation. While these analytical procedures are generally accepted,
Cohen et al. (2003) note that polynomial equations may only be approximations to
69
nonlinear relationships. In a related point, the goal of this study is to not be a “curve-
fitting” exercise: While the regression models are a centerpiece of the analyses,
understanding the implications associated with the observed data, not just regression fit,
is important. One way to examine this issue is to use a procedure similar to Coward and
Sackett (1990), where the number of statistically significant quadratic coefficients is
tabulated. While this procedure provides no information about effect size (Ones et al.,
2007), it provides an indication of how frequently a quadratic coefficient is found to be
statistically significant, and can be compared to commonly accepted chance base rates
(i.e., .05). Findings of statistical significance are often relied on heavily in polynomial
regressions in the personality domain, so this count can be informative.
Moderator Analyses. Multilevel modeling (MLM) was used to examine both the
nonlinearity analysis questions and moderation hypotheses, since employees were nested
within occupations differing in the characteristics outlined above. As described above,
the personality and performance measures in this study were conceptualized at the
individual person level, which can in turn be considered level-1 variables here. In this
study, moderating variables of interest all refer to occupation-level characteristics, which
were considered level-2 variables. Thus the occupational characteristics take on the same
value for all cases within an occupation but take on varying values across occupations. If
analyzed with “standard” regression procedures – those that do not take into account the
nested data structure – standard errors would be biased, in turn rendering statistical
significance tests biased at best or misleading and uninterpretable at worst (Bliese, 2000;
Bliese & Hanges, 2004; Raudenbush & Bryk, 2002).
70
For the purposes of this study, MLM analyses were associated with two key
virtues. The first was the ability to estimate the proportion of variance in the performance
variable attributable to both level-1 and level-2 units. Such an analysis indicated the
degree to which validity study nesting contributes to variance in performance. (Note that
validity study and organizational nesting were functionally equivalent in this case.) As
above, the degree to which one’s membership in a particular organization or validity
study can influence the ratio of within-organization to across-organization variance is an
open question. That is, might the circumstances surrounding a particular validity study or
the differing conditions across organizations lead performance ratings to be more similar
within organizations (or validity studies) than across organizations (or studies)? In this
case, the occupation-level moderators would still be of interest, but the units responsible
for nesting would be organizations.
Analytically, these variance proportions were estimated with an unconditional
multilevel model, where the dependent variable was estimated as a function of the grand
mean, validity-study-specific deviations, and a residual reflecting individual case
differences from their validity study’s mean (Hofmann, Griffin, & Gavin, 2000; Peugh &
Enders, 2005). Variance estimates for level-1 and level-2 residuals that resulted from this
estimation were used to calculate an intraclass correlation (ICC), which indicated the
proportion of variance between level-2 units. Larger ICCs indicated larger effects of the
level-2 units.
The second virtue was the ability to take into account the nested data structure to
estimate moderator effects in the form of cross-level interactions (Davison, Kwak, Seo, &
71
Choi, 2002). The fundamental, broad question of interest was whether the association
between personality and performance was dependent on the occupational characteristic.
Put another way, one could ask whether a level-2 variable predicts variation in the
relationship between a level-1 predictor and criterion. A more specific cross-level
interaction research question could take the following form: Does the rated importance of
achievement orientation for an occupation predict the linear and curvilinear effects of
conscientiousness on task performance? The ICC from the unconditional model provides
one signal of the necessity for such an analysis; in other words, the ICC may signal that
the level-2 variable has an influence. With an ICC approximating zero, study-level
characteristics may be unlikely to exert a meaningful moderating influence. However,
there is no general agreement on the ICC magnitude that meets a threshold for
importance, and the ICC is certainly not an indicator of the significance of a main effect
or interaction effect. Thus it is critical to note that such analyses proceeded on the basis
of a judgment call that considered the magnitude of the ICC, the significance of the level-
1 and level-2 variance components, the broad set of research questions, and the
theoretical rationale for the moderating characteristic.
The analytic sequence for the moderator variables proceeded in the following
manner. MLM procedures were conducted in four steps, consistent with procedures
reported by Le et al. (2011). The first step involved estimating an ICC for the criterion
variable and validity study identifier. The remaining steps involved multilevel regressions
with predictors added in each step: Building on the unconditional model, the level-2
moderator main effect was added (step 1), the level-1 linear mean effect term was added
72
(step 2), the level-1 quadratic main effect term was added (step 3), and moderator
interaction terms with the level-1 linear and quadratic predictors were added (step 4).
Results of moderation analyses were plotted to further examine the effects.
Given the large scope of these analyses, the moderators were examined only for
the overall job performance criterion. Each multilevel modeling analysis is accompanied
with two sets of regression coefficients. The first contains the full model multilevel
regression coefficients for each predictor, criterion, and moderator combination. The
second contains the regression coefficients for -1 SD, +1 SD, and the mean level of the
moderator variable. These coefficients enable plotting and examination of whether the
inflection point varies meaningfully across moderator levels. This second set of
regression equations was calculated using the procedure derived by Le et al. (2011, p.
119; see also Cohen et al., 2003, p. 293), in which the full regression equation was
rearranged to yield coefficients for specified levels of the moderator. Each result table
containing regression estimates for high, low, and mean moderator settings also contains
inflection point estimates for both centered and standardized predictor scaling.
Finally, several possibilities for estimating pseudo-R2 exist in multilevel
modeling, although there is no direct analogue to the standard R2 usually reported for
single-level regression. Following recommendations from Hofmann, Griffin, and Gavin
(2000), the current R2 is based on estimation of percentage of within-group variance
accounted for by each set of predictors relative to the total within-group variance
estimated in an unconditional multilevel model (equivalent to a one-way ANOVA with
no predictors/covariates). This equation allows for direct comparison to similar studies of
73
this nature (e.g., Le et al., 2011) and also allows for a consistent R2 estimate at each step
of the multilevel modeling procedure. The drawback is that this method occasionally
yields negative pseudo-R2 estimates when predictors are added to the model (Snijders &
Bosker, 1994) – a counterintuitive result when compared to typical interpretation of R2 in
a regression framework. Generally, this occurs because the pseudo-R2 in multilevel
modeling is an indicator of reduction in variance components relative to the
unconditional model, and some predictors either do not change the within-group variance
component estimate or can actually increase it. Some investigators may choose to
estimate R2 using a different set of variance components depending on the “level” of each
predictor added to the model (i.e., a different baseline model for each comparison).
However, this can result in a different equation for R2 at each level of the modeling
procedure (Gelman & Pardoe, 2006); arguably this makes comparison across all R2 even
more complex. Alternative formulas for those estimates have been proposed (Snijders &
Bosker, 1994). Finally, each result table contains inflection point estimates for both raw
and standardized predictor scaling.
SECTION 3: RESULTS
Descriptive Information
Demographic and descriptive information for study variables are shown in Tables
1 through 9, and were discussed in the Method section above. Distributional information
is of particular interest in studies of this nature, so predictor data were plotted (Figure 2)
and skewness statistics are reported in Table 4 for predictors and Table 5 for criteria.
Examination of skewness suggests that the Agreeableness scale exhibited negative skew.
74
None of the criterion variables had skewness statistics approaching an absolute value of
1, and thus skewness was not determined to be problematic for this study. Still,
interpretation of analyses involving the Agreeableness scale should include consideration
of these findings. Prior to the polynomial regression analyses, the above descriptive
information was examined for each validity study with the general goal of identifying any
potentially aberrant studies. No studies were removed on the basis of this review, perhaps
due to the periodic cleaning and upkeep of the data archive by Hogan Assessment
Systems.
Primary Nonlinearity Analyses
Graphical Displays. A series of loess curve graphs were examined following
recommendations from Cohen et al. (2003). The smoothing parameter for each loess
curve was fit with 50% of points. This parameter defines the proportion of observations
used in each local regression. Decreasing this number results in the curve being more
susceptible to influence by idiosyncrasies in each section of the score range, whereas
larger values of this parameter result in smoother curves with the potential to overfit the
data (Jacoby, 2000). The large number of observations in these graphs also helps avoid
idiosyncratic fitting of the loess curve. The loess curves fitting the scatterplot for each
predictor in comparison to overall job performance are shown in Figure 3. The general
conclusion is that there is minimal visual evidence of departure from linearity for most of
the predictors. Although the loess curve for Conscientiousness displays some fluctuation
in the form of a negative quadratic at the high end of the scale, it is worth noting that the
Y-axis (job performance) is scaled from -1 to +1 SDs in all figures, and that widening the
75
range can have the effect of reducing any graphed departure from linearity. Scatterplots
and loess curves were also obtained and examined for each validity study, but are not
included here due to space concerns.
Hierarchical Polynomial Regression Results
This section provides results of the sample-weighted hierarchical regression and
multilevel modeling procedures, organized by predictor. The position taken here is that
judgments about the presence and nature of curvilinearity should consider several aspects
of the results of these analyses: the statistical significance of the quadratic multilevel
regression coefficients, weighted mean regression coefficients and multiple R’s, simple
slopes, location of bend points, and graphical display of the full regression model. Results
are organized by predictor, with moderation analyses following the regression results.
Results for the alternative criterion domains are presented for completeness, but are not
emphasized due to the lack of empirical basis for differentiating between criteria in this
study. Thus strong caution is urged in interpreting any differences across criteria.
Conscientiousness Results. Research question 1 addresses the
conscientiousness—performance relationship. Compiled results for the relevant analyses
are shown in Tables 10, 11, and 12, and displayed graphically in Figure 4. The findings
for Conscientiousness—overall job performance suggest a negative quadratic (change in
R = .04; Table 10), where the relationship has a positive slope through most of the score
range, but flattens out above 2 SDs above the mean (Figure 4, top left). However, the first
column of coefficients in Table 11 shows that the multilevel quadratic coefficient was not
statistically significant. The slope was estimated to change direction at 1.76 SDs above
76
the mean, equivalent to a raw score of 28 out of a maximum of 31 (Table 12). This
pattern is consistent with the loess curve for Conscientiousness in Figure 3 (top left),
although the lack of statistical significance calls into question whether the quadratic
pattern is meaningful. While these very high scores have the potential to be suboptimal
for performance compared to a linear trend, any total potential performance loss is likely
to be minimal (cf., Converse & Oswald, 2012). Returning to the full sample of observed
Conscientiousness raw scores, 569 out of 13,056, or 4%, scored in this area of the range.
Figure 4 shows that for each criterion examined, Conscientiousness displayed a slight
negative quadratic effect very high in the score range.
Conscientiousness—Overall Performance Moderation Analyses. As detailed in
the Method section, ICCs were calculated for each analysis using the level-1 and level-2
variance components in the unconditional model. In all cases, the ICCs were
approximately zero and thus are not reported for each analysis below. Although this
finding suggests minimal variation in performance ratings across validity studies, the
MLM procedure is still the recommended procedure for accounting for any cross-study
effects attributable to the fact that individuals were naturally grouped within validity
study.
Table 11 shows that none of the moderation analyses for the Conscientiousness
predictor produced statistically significant results. Nonetheless, the results are plotted in
the final three components of Figure 4 for the sake of completeness. These figures
suggest visual evidence for slight differences in multilevel regressions across moderator
77
levels, but strong caution is urged in interpretation of these findings given the lack of
statistical significance.
Agreeableness Results. Research question 2 addresses the agreeableness—
performance relationship. Compiled results for the relevant analyses are shown in Tables
13, 14, and 12, and displayed graphically in Figure 5. The results for the Agreeableness
scale suggest an unambiguously linear positive relationship with overall performance
throughout the entire score range (Figure 5, top left). In these data, the higher the
agreeableness-related score, the better. This is the case even with an average change in R
of .045 after adding the quadratic predictor to the model. The first column in Table 14
shows that the multilevel quadratic coefficient was not statistically significant. The
results for Agreeableness suggest that, using this scale, it is difficult to be too agreeable:
From a “curve-fitting” perspective, the positive slope would not be forecasted to flatten
out until well beyond the possible score range at a value equivalent to over 11 SDs above
the predictor mean (Table 12). Figure 5 provides visual evidence that the form of the
Agreeableness—performance relationship differed very slightly across criteria, although
there is not enough difference to infer that the consequences for nonlinearity depend on
these criteria as measured here.
Agreeableness—Overall Performance Moderation Analyses. Table 14 shows
that neither of the moderation analyses for Agreeableness produced statistically
significant results. As with Conscientiousness, the results are plotted in the final two
components of Figure 5 for completeness. Although it appears that Agreeableness flattens
78
out lower in the scale for high complexity jobs (Table 21), the lack of statistical
significance precludes any strong inference from these results.
Emotional Stability Results. Research question 3 addresses the emotional
stability—performance relationship. Compiled results for the relevant analyses are shown
in Tables 15, 16, and 12, and displayed graphically in Figure 6. Table 15 shows an
unstandardized regression coefficient of .000 and a very small positive beta coefficient (β
= .004) for the Emotional Stability predictor (change in R = .035). In this case, the
unstandardized coefficient was actually very slightly negative. The appearance of the
small positive beta coefficient here is an artifact of the weighted average procedure
across validity studies, and should not be overinterpreted since there is no visual evidence
of a nonlinear relationship between Emotional Stability and overall performance.
However, the quadratic coefficient from the multilevel regression (Table 16, first
column) was statistically significant. Given this situation, the simple slopes and graphical
displays are particularly useful for interpretation, and suggest that the Emotional
Stability—overall performance relationship can be described as unambiguously linear in
spite of the finding of statistical significance. Figure 6 (top left) displays these findings.
This is consistent with Table 12, which shows the projected bend point over 8 SDs above
the mean at a centered value of 48.41, which in turn corresponds to a raw scale value
around 75 (maximum possible is 38). Analyses for the alternative criteria showed that
Emotional Stability exhibits positive relationships with each criterion (Figure 6; Table
12); however, those results are not definitive due to the lack of empirical differentiation
79
among criteria. Thus the general conclusion is that there are no expected performance
declines in the high score range in these data.
Emotional Stability—Overall Performance Moderation Analyses. Table 16
shows that neither of the moderation analyses for Emotional Stability produced
statistically significant results. Figure 6 (bottom left and right) contains plots of these
equations, although strong caution is urged regarding interpretation. Fundamentally, there
is a positive relationship between Emotional Stability and performance regardless of job
complexity or the importance of adjustment for job performance.
Openness Results. Research question 4 addresses the openness—performance
relationship. Results for the relevant analyses are shown in Tables 17, 18, and 12, and
displayed graphically in Figure 7. For overall performance, a change in R of .046 is
associated with a statistically significant quadratic coefficient in the multilevel regression
(Table 18). Table 12 shows that the simple slopes for Openness are positive at low
scores, but become increasingly negative starting about .75 SDs above the mean. The
practical meaning in raw score units is abstract because the HPI does not use an
operational openness scale, but these findings, along with the top left plot in Figure 7
suggest that those with standing above 1 SD could perform less optimally than those
whose Openness standing is closer to the mean. Considering the relative magnitude of the
simple slopes and the slight curvilinear trends in the regression line (Figure 7) and
empirical loess curve (Figure 3, second row, right), the effects of this finding on job
performance appear small.
80
The findings for Openness are very consistent in form across criteria, which is
unsurprising given the substantial correlations between these criterion composites. Table
12 shows that the estimated bend points all occur between .5 to 1 standard deviations
above the mean. Although any expected loss in performance compared with linear
relationships is minimal, these findings indicate some departure from linearity associated
with high standing on Openness.
Openness—Overall Performance Moderation Analyses. Table 18 contains
multilevel regression equations for Openness, and shows that neither of the interaction
effects for job complexity or the practical intelligence work style were statistically
significant. Examination of the last two graphs in Figure 6 confirms the interpretation that
there is no evidence for either of these moderators influencing the negative quadratic
effect in the Openness—overall performance relationship.
Extraversion Results. Research question 5 addresses the extraversion—
performance relationship. The focal results are shown in Tables 19, 20, and 12, and
displayed graphically in Figure 8. The addition of the Extraversion quadratic term
resulted in a change in R of .046 (Table 19). However, the multilevel quadratic
coefficient was not statistically significant (Table 20), so any interpretation of a
curvilinear effect should be done with caution. In the lower end of the score range, the
slope is meaningfully positive (Table 12). However, the inflection point occurs at 1.15
SDs above the mean, with progressively higher Extraversion values associated with a
declining trend in overall performance (Figure 8, top left). This regression line differs
from the loess curve for Extraversion shown at the bottom of Figure 3. The loess curve
81
based on the scatterplot suggested no curvilinear effect: It is possible that the projection
of the regression line in Figure 8 at the very high ends of the scale gives the impression of
more of a curvilinear effect than the observed data support. Thus, if Extraversion is
construed as a combination of Ambition and Sociability concepts, while it is possible that
those with very high standing may underperform relative to those just above average, any
curvilinear effect appears small. Figure 8 shows that the Extraversion predictor showed
the same basic negative quadratic patterns for each criterion.
Extraversion—Overall Performance Moderation Analyses. Table 20 contains
multilevel regression equations for Extraversion, and shows that neither of the interaction
effects for job complexity or the social influence work style were statistically significant.
The final two components of Figure 7 display these findings. As with the other
predictors, these findings are reported for completeness, but strong caution is urged in
interpretation given the non-significant results.
Further considering the concept of statistical significance. It is common for
studies of curvilinearity to place weight on findings of statistically significant polynomial
regression coefficients or changes in R or R2 (Cohen et al., 2003). To provide some
indication of this within validity studies, this study followed a strategy used by Coward
and Sackett (1990) that tabulates the proportion of studies with statistically significant
polynomial regression results. The results for each HPI predictor in reference to the
overall performance criterion are shown in Table 22. In all analyses, the proportion of
statistically significant quadratic coefficients was less than .1. These findings suggest that
departure from linearity occurs only about as frequently as what could be expected by
82
chance alone. The analyses in Table 22 lead to fundamentally similar conclusions as the
other analyses described above. The primary caveat in interpreting Table 22 is the
consideration of factors contributing to power (Cohen, 1992) across the validity studies:
sample size, effect size, and acceptable significance criteria. Sample size is particularly
relevant given that it is the chief power-relevant characteristic varying across studies: the
sample size in these studies ranged from 10 to 817.
Analyses for Recommended Scales
These analyses were conducted to examine the implications of nonlinearity for
situations in which the predictor would be used operationally. Sample sizes for the
analyses and regression equations are shown in Table 23. The simple slopes and bend
points shown in Table 24 indicate that the findings from these analyses mirror those from
the overall analyses (comparisons for bend points are found in Table 12). The slight
exception is for the Openness scale, where the slight curvilinear effect from the overall
analysis effectively disappeared: The estimated standardized bend point in the
supplemental analysis was over 6 SDs above the mean, compared to just under 1 SD
above the mean in the overall analysis. To provide a graphical comparison, Figure 8
contains the regression lines from the original “all available studies” analyses on the left
side of the page and the regression lines from the “only recommended studies” analyses
on the right side. Visual inspection of these graphs shows that each scale demonstrated
the same general pattern of relationship when restricted to settings in which the scale was
recommended for use.
SECTION 4: DISCUSSION
83
This study investigated the possibility that meaningful nonlinear trends occur in
the relationships between personality predictors and occupational performance. The focus
was on the Big Five personality framework, and the use of the Hogan Personality
Inventory database allowed for the largest current investigation of these questions within
the range of personality predictors and performance ratings observed in actual
organizational settings. The use of a single personality instrument across over 100
validity studies provided an opportunity for comparison with the findings of previous
studies for the Conscientiousness, Emotional Stability, and Openness predictors.
Additionally, this study provided the first major tests for Agreeableness and Extraversion
in reference to job performance. Results showed that, within validity studies, statistically
significant quadratic effects did not occur frequently (Table 22). The typical sample size
available for criterion-related validity studies may leave many studies of this nature
underpowered for detecting nonlinearity, however, and this situation led to a strategy of
pooling results across thousands of test-takers. These aggregated analyses showed that
curvilinearity was unlikely to play a significant role in the relationships between these
Big Five-oriented personality scales and job performance, in spite of theoretical rationale.
The basic findings for each predictor are briefly summarized here.
Summary of Findings
The Conscientiousnss quadratic coefficient in the multilevel regression equation
was not statistically significant. Although Figure 4 showed that the form of the
relationship was positive through most of the score range and leveling off at very high
scores, the lack of statistical significance suggests the need for caution in interpreting any
84
graphed departure from linearity. The moderation analyses showed that job complexity,
the importance of achievement orientation to the job, and the importance of
conscientiousness to the job did not statistically significantly affect the
Conscientiousness—performance relationship.
The Agreeableness results (Figure 5) exhibited no appreciable departure from
linearity. That is, higher standing was usually associated with higher performance ratings.
Further research in this area might identify samples in which Agreeableness scores are
not negatively skewed, or focus on the Agreeableness—task performance relationship
given the trend in this study, although the criterion breakouts are not definitive. Neither
job complexity nor the rated importance of interpersonal orientation functioned as
statistically significant moderators of the Agreeableness—performance relationship.
The trends for Emotional Stability (Figure 6) were linear and positive. This was
the case even with the finding of a statically significant multilevel quadratic coefficient.
When this finding was probed and graphed, there were no major expected performance
declines or increases in the high ends of the predictor range, and any departure from
linearity in the regression line carried negligible implications for performance.
Moderation analyses showed that neither job complexity nor the rated importance of
adjustment to the occupation yielded statistically significant effects.
Openness (Figure 7) produced the same fundamental negative quadratic pattern
across criteria, and the multilevel quadratic coefficient was statistically significant. These
results suggest that high standing on Openness may be associated with expected
performance decline. However, when interpreted in light of the implications for job
85
performance, this slight curvilinear effect is unlikely influence differentiation among
performers in the high end of the range. In terms of moderation, job complexity and the
importance of practical intelligence to performance did not alter the form of the
Openness—performance relationship.
Finally, the regression equation for Extraversion (Figure 8) suggested a slight
negative quadratic pattern high in the score range, but the associated multilevel quadratic
coefficient was not statistically significant. In addition, the loess curve for Extraversion
(Figure 3) displayed no evidence of curvilinearity. The moderation analyses showed that
neither job complexity nor the importance of social influence had a statistically
significant effect on the point at which the Extraversion—performance relationship was
estimated to change from positive to negative.
A set of supplemental analyses replicated these results by examining only settings
in which each Big Five scale was recommended for operational use (Figure 9). Thus, the
general conclusion is that none of the relationships between the personality predictors and
overall job performance could be described as curvilinear enough to distort expectations
about job performance. Although analyses of quadratic coefficients yielded statistical
significance for Emotional Stability and Openness, when viewed in combination with the
empirical loess curves (Figure 3) and simple slopes (Table 12), neither predictor showed
a substantial curvilinear effect. In instances where the loess and regression graphs
suggested any negative quadratic effects (for Conscientiousness and Openness), the
curvilinearity could be characterized as leveling off (or “asymptotic”; Hough & Dilchert,
2010) within the score range. In this case, even if these curvilinear effects are real and
86
progressively higher personality scores are not associated with increased expected
performance, the finding is that these high scores are also not associated with expected
declines in performance.
Comparison with Previous Findings. As noted in the introduction, results for
conscientiousness have been mixed in previous studies. The present findings for a non-
significant quadratic coefficient across large samples is consistent with Robie and Ryan’s
(1999) study, which examined several conscientiousness measures in relation to overall
performance ratings in five samples and found no evidence for departure from linearity.
This study’s loess and regression figures for Conscientiousness (Figures 3 and 4)
suggested an asymptotic pattern similar to findings reported by LaHuis et al. (2005), who
focused on overall performance ratings, Le et al.’s (2011) study 1, which focused on task,
OCB, and CWB ratings, Whetzel et al. (2010), who focused on task performance ratings,
Vasilopoulos et al. (2007), who focused on training performance, and Cucina and
Vasilopoulos (2005), who focused on college FGPA. Nonetheless, the lack of statistical
significance in this study across a large sample is a failure to replicate the statistically
significant results reported by most of these authors. The reasons for the difference in
findings is not immediately clear, although sampling error, the variety of criteria across
these studies, and differences in the personality tests studied all may contribute.
This study’s findings for Agreeableness are the first reported examinations of
nonlinearity between a Big Five bandwidth predictor and job performance. Whetzel et al.
(2010) examined two OPQ agreeableness-related scales, Caring and Trusting, in
reference to task performance, and Cucina and Vasilopoulos (2005) examined the IPIP
87
Agreeableness scale in reference to freshman GPA. Neither of those studies found
nonlinear agreeableness effects, similar to this study. Thus the emerging picture is that
agreeableness scales do not exhibit meaningful departure from linearity in the settings in
which studies have been conducted.
This study’s results for a statistically significant emotional stability quadratic are
consistent with Vasilopoulos et al. (2007) and Le et al. (2011), who reported statistically
significant negative quadratic effects for emotional stability with training performance
and task, OCB, and CWB, respectively. However, the graphed regression results reported
by Vasilopoulos et al. and Le et al. show negative quadratic effects that are unlike the
graphed results in this study, which indicated no curvilinearity. Thus, the substance of the
current results may be similar to Cucina and Vasilopoulos’s (2005) finding of no
significant departure from linearity in the prediction of FGPA.
There are virtually no studies that have examined whether openness scales exhibit
curvilinear relationships with job performance. This study provides the first major look,
but can compared to Whetzel et al.’s (2010) and Cucina and Vasilopoulos’s (2005)
findings. Whetzel et al. interpreted small (change in R2 < .05) quadratic effects as
evidence for linearity for their Adaptable, Innovative, Conventional, Forward Thinking,
and Variety Seeking OPQ scales. In contrast, Cucina and Vasilopoulos found a negative
quadratic for IPIP Openness in relation to FGPA. Importantly, Whetzel et al. noted that
small nonlinear effects (change in R2 > .01) did occur for their Adaptable, Innovative, and
Variety Seeking scales. Similar to this study, even with the quadratic pattern, Whetzel et
al. interpreted these findings as a general lack of evidence for meaningful curvilinearity
88
for openness predictors. Thus the balance of the evidence indicates slight curvilinear
effects for openness, but the implications for performance appear to be minimal.
This study is also the first to provide a major examination of the form of the
extraversion—performance relationship. Cucina and Vasilopoulos (2005) also reported a
non-significant quadratic coefficient in the prediction of FGPA, and Whetzel et al. (2010)
reported only linear effects (change in R2 < .01) for the Affiliative, Outgoing, Outspoken,
and Socially Confident scales in relation to task performance. The results from the current
study are consistent with the available studies in this domain.
Moderation Analysis Comparison. In terms of the job complexity moderation
analyses, Le et al. (2011) used a slightly different criterion measurement framework than
the current study, used different personality measures, and used two different job
complexity operationalizations (dichotomous high/low complexity in their Study 1 and
O*NET’s job zone in their Study 2). Thus these comparisons are more exploratory than
definitive. In their first study, Le et al. found a statistically significant interaction between
their Conscientiousness scale and task performance, such that the inflection point for low
complexity jobs (.23 SDs) was much lower in the predictor scale than for high
complexity jobs (2.33 SDs). That finding did not replicate in their second study using
different measures, and notably, the same job zone complexity system used in this study.
The significant job complexity moderator finding also did not emerge with the
Conscientiousness—overall performance measure in this study.
Le et al. (2011) also found a significant emotional stability—complexity
interaction in predicting the task performance criterion in their first study. Regression
89
lines for high and low complexity were in the form of a negative quadratic. This finding
did not replicate in terms of statistical significance in their second study. Job complexity
also did not have a significant moderating effect in the current study. Given the
differences in the way variables were measured across studies and the general failure to
replicate these findings, it could be said that the jury is still out with regard to strong
conclusions in this domain (Schmidt, 2010).
When Does Departure From Linearity Matter?
It is useful to understand how personality scales relate to job performance indices
from a basic science perspective. In practice, the question of the degree to which any
finding of curvilinearity matters depends on how one wants to use the scores. Although
this study found minimal evidence for curvilinearity, other studies have emphasized the
possible consequences of curvilinearity for personality assessments (Converse & Oswald,
2012). The form of nonlinearity likely of greatest interest for selection professionals is a
negative quadratic effect, in which progressively higher personality scale scores are
associated with decreasing expected job performance. When used for administrative
purposes, organizations can use personality test scores (a) to screen out applicants who do
not meet a minimum threshold, (b) to rank test-takers in a top-down manner, or (c) in
combination with scores from other assessments before making decisions.
Cut score strategies may be the most common administrative use of personality
test scores, whereby those with low standing are screened out either for lack of fit or
business necessity purposes. In the presence of curvilinear relationships, when cut scores
are used the critical question becomes: At what point in the range of acceptable scores
90
could those who pass be expected to underperform relative to those who are screened
out? That is, is the curvilinear regression line negatively sloped enough to indicate that
those at a specified high standing on the personality characteristic could be expected to
perform worse than those who scored below the cut score in the first place? The clear
inference from this study is that such a result is unlikely to occur. For instance, if a cut
score is set at -1 SD on the Openness predictor, the curvilinear effect is not substantial
enough for this problem to occur, on average. Of course, the point at which this effect
could occur depends on the location of the cut score in the predictor distribution. The
higher the cut score, the greater the possibility for high scorers to perform worse than
those screened out in the context of a negative quadratic regression line. Based on the
current findings, these cut scores would need to be atypically high to result in very high
scorers underperforming those screened out due to the quadratic effect. Further, this
effect would likely be impossible for the Emotional Stability findings in this study.
Although it may be possible for those with high standing on Openness to underperform
relative to those failing to attain a cut score near the mean, the overall slope suggests that
this would carry minimal performance implications. In addition, the analysis involving
only studies in which openness-related scales were recommended for use yielded an
effectively linear relationship between Openness and performance.
Organizations adopting a top-down rank order strategy with these scales should
consider that this practice might result in slightly lower average performance than
expected if the expectation is a robust linear relationship. The question of how much of a
performance loss will depend on the point at which the relationship turns negative and
91
how steep the negative slope is in the high end of the score range. In this study, even in
cases in which the bend point occurred relatively low on the scale (e.g., Openness—
overall performance at .75 SDs) any declines in performance were still projected to be
small given small slope coefficients. Nonetheless, it is possible that treating all
personality—performance relationships as though they are linear when they may not be
could be associated with lower than expected performance (Converse & Oswald, 2012).
It is unclear how frequently organizations use personality test scores to rank test-
takers for purposes of making employment decisions. There are many ways that
personality scale scores could be combined with other assessments, and Whetzel et al.
(2010) note that some profile assessments implicitly or explicitly incorporate nonlinearity
in scoring keys, perhaps without supporting empirical research. In this case, the results
from this study may be useful as general priors for where cut scores could be established
or how personality scores could be weighted; perhaps incorporating local data. The
estimated bend points in this study are indicative of the HPI and the occupations
represented in the analyses, but may not transport to other settings. The fundamental
premise is that those wanting to estimate the utility of using personality assessments for
administrative purposes must consider how the scores will be combined and used, and
must also consider whether any potential nonlinearity could violate the assumptions
inherent to a utility estimate.
Limitations, Additional Analyses, and Conclusions
This study contributes to the literature by examining personality scales relevant to
the full Big Five model and potentially relevant moderators. The large samples and
92
coverage of occupations are strengths for the generalizability of the results. On the other
hand, personality assessments are used in multiple ways in applied settings, and
personnel decisions are usually not made solely on the basis of one predictor. When
personality is assessed, multiple personality scales are usually administered and the data
from each are combined in some way to contribute to a personnel decision. It is also the
case that other non-personality assessments are often included in a procedure, and may be
combined with personality assessment information within a stage or hurdle (DeCorte,
Sackett, & Lievens, 2011, illustrate hypothetical examples). This situation makes it
difficult to make concrete statements about the implications of departure from linearity in
Big Five oriented measures outside of a bivariate framework, aside from the broad
argument above that the findings of this study suggest that curvilinearity is unlikely to
present a problem. It is also the case that scales exhibiting quadratic trends did not
suggest large performance decrements.
Construct Validity. The emergent conclusion is that the complexity of constructs
in the personality domain and differences how measures are designed and implemented
(e.g., Hough et al., 1990; Hough & Ones, 2001) leads to difficulty in drawing any
sweeping generalizations from this study about the implications for practitioners using
other personality assessments. In terms of construct validity, the HPI scales used in this
study are well researched and generally accepted among scientists and practitioners.
However, the content of the Big Five scales derived from the HPI is likely to differ
somewhat from other instruments, and the HPI was developed at least in part for use in
workplace assessment, unlike some other personality measures. For instance, the HPI
93
Prudence scale correlated with NEO Conscientiousness and Agreeableness at nearly
equal magnitudes in a sample from the Baltimore Longitudinal Study of Aging (n = 124;
Costa & McCrae, 1995). Thus Hough et al.’s finding that personality scales ostensibly
representing the same-labeled domain may not be empirically interchangeable, even
when accounting for measurement error, is likely as true today as it was in 1990.
Nonetheless, the fact that the same assessment was used for all validity studies examined
here is considered a strength for interpretation. This fact makes it clear that estimated
bend points for the analyses may not generalize to other instruments.
One further construct-related issue is the focus on the conceptual and empirical
Big Five bandwidth of the personality predictors. Some scholars have long argued that
the breadth of the Big Five can easily obscure patterns of subscale correlations with other
variables, such as job performance indices (Hough, 1992). Recent studies have shown
that facet level predictors (i.e., sub-Big Five) often correlate differently with various
criteria (e.g., Dudley et al.’s [2006] examination of conscientiousness). In the current
study, sub-Big Five facet scales were available for openness (HPI’s Inquisitive and
Learning Approach) and extraversion (HPI’s Ambition and Sociability). Additional
analyses were conducted to examine whether these scales exhibited the same trends as
their broader composites. Each facet was examined in reference to overall performance
for comparison purposes, using the same approach as the Big Five analyses reported
above.
Table 25 contains the regression results for these scales, and Figure 10 displays
the graphs for comparison. For the openness domain, the major finding was that the two
94
subscales exhibited similar asymptotic negative quadratic patterns. For the extraversion
domain, curvilinearity was more prevalent for the Sociability scale than the Ambition
scale. The trends were quite different for these two scales: Sociability suggested a
negative quadratic effect, which could be explained by a tendency for those who socialize
frequently at work to underperform relative to somewhat less sociable employees. In
contrast, Ambition exhibited a slight positive quadratic effect, where higher scores were
associated with increased returns to performance. Thus the broad finding for these scales
was that the facets of openness exhibited similar patterns and facets of extraversion
exhibited different patterns, in line with reasoning that more detailed levels of the
personality hierarchy may yield differing patterns within a broader Big Five concept
(Hough & Dilchert, 2010). Vasilopoulos et al. (2007) also reported different curvilinear
patterns for subscales of conscientiousness (dependability and achievement) and
emotional stability (stress resistance and frustration tolerance) available in their study.
One caveat is that this “facet” structure for openness and extraversion could be
considered idiosyncratic to the HPI, and it is possible that Ambition could conceptually
be situated at a hierarchical breadth more akin to "compound traits” such as Integrity or
Customer Service Orientation (Judge & Kammeyer-Mueller, 2012). In fact, Hogan
Assessment Systems would probably not consider these scales as “facets” in the same
way that Costa and McCrae (1995) use the term. Recall that the 7 HPI scales are
comprised of 41 homogeneous item clusters that may fall more into the “facet” category.
Additionally, the sampling of these validity studies could be described as more
convenient than systematic. To be included in the database, organizations would need to
95
have been interested in using personality assessments and willing to participate in
validation research, perhaps at their own expense. On the other hand, this situation is
common for field research synthesis, and the coverage of industries and occupations is
broad. Thus the sampling is comparable in scope to many meta-analyses relying on field
studies.
An additional consideration is that studies of this nature can provide trends and
associations between personality test scores and performance ratings, but they tell us
fairly little about the mechanisms or specific behaviors of those scoring at any given
point on each personality scale’s score range. For instance, why might those scoring very
high on conscientiousness scales not receive increasingly higher performance ratings, on
average? It is possible that these individuals behave in rigid or compulsively self-
disciplined ways as has been previously theorized (Murphy, 1996; Widiger et al., 2002),
but little attention has been paid to whether these specific behaviors are actually exhibited
by high scorers. As another example, do those with high standing on extraversion
inventories display socially dominant or excessively bold behavior? Numerous questions
could be identified for each personality characteristic of interest. Research examining the
actual behaviors defining test score ranges could be useful.
Links to other research literatures outside of I-O psychology may also be fruitful
in this line of research. For instance, there has been recent movement by clinical
researchers to understand whether abnormal or extreme personality-related behaviors can
be represented by trait continua, rather than discrete categories of non-normal range
personality (Clark, 2007; Krueger & Tackett, 2003; Markon et al., 2005; Widiger et al.,
96
2002; Widiger & Trull, 2007). That is, description of non-normal-range personality
disorder can be both conceptually and empirically based on the same dimensional models
as description of normal personality; namely, the Big Five. This line of reasoning may be
useful for the fundamental question about why curvilinearity could matter in workplace
settings: Why might high scores be associated with suboptimal performance? Much
clinical work has focused on understanding the content of maladaptive personality-related
behavior, particularly for those with very high standing on certain personality traits. The
clinical/I-O link represents an appealing approach in this domain, but the literatures have
remained separate so far: From an I-O perspective, the likely reason is that much I-O
research is focused on practical intervention that could be applied in organizations and
would fare well against scrutiny based on various legal frameworks (e.g., Americans with
Disabilities Act compliance). However, when viewed from a basic science perspective,
the concern with implications for personnel assessment in operational settings may be
minimized. The major point is that the separation of clinical and I-O personality
literatures may serve to obscure the ends of the Big Five continua because measures
intended for use in one domain (i.e., clinical practice or personnel assessment) are not
intended for the other, and this is done purposefully (Krueger, Derringer, Markon,
Watson, & Skodol, 2011; MacLane & Walmsley, 2010). Nonetheless, exploration of this
link in future research could be useful for explaining why high scores in the normal range
of personality scales could be associated with performance declines.
Criterion Focus. This study relied primarily on an index of overall performance.
Four additional criterion domains were examined, but all were measured using a common
97
method (supervisory ratings), and there was little evidence for empirical differentiation
between domains given positive manifold and low reliability for some domains.
Emphasis on overall performance may not be a problem in terms of fidelity to practice
since this represents a typical state of affairs in applied research. However, these analyses
were conducted from the perspective that it may be informative to at least consider the
conceptual substance of the performance domains of interest when interpreting results of
nonlinearity analyses (Cucina & Martin, 2013). The results showed that the performance
domains made little difference, perhaps due to their measurement properties. It is possible
that a performance measurement program that incorporates multiple measurement
methods and targets multiple performance domains (e.g., Campbell, McHenry, & Wise,
1990) could be very informative for this line of research.
The Meaning of Moderation. Turning to the moderation analyses, in spite of the
rationale that job complexity and the judged importance of personality characteristics for
job performance could influence the personality—performance relationship, none of the
analyses produced statistically significant results. Thus the effects of job complexity in
this study are not as dramatic as the moderation findings reported, but in some cases not
replicated, by Le et al. (2011).
An additional consideration is that job analysis ratings of the importance of given
personality traits for performance may implicitly take into account curvilinearity, but not
in a way that is evident in a set of importance ratings. Importance ratings may not provide
any indication of the “ideal point” for a trait to operate in context – a rater may believe
that a trait is highly important but also believe that it is optimal to behave in a way that
98
displays moderate standing on the trait, rather than “more is better” (e.g., Kuncel &
Tellegen, 2009 provide the example of talkativeness). This could be the case if raters tend
to provide importance ratings that are a reflection of their trait standing or focus on an
idealized profile of traits to match job characteristics (Aguinis, Mazurkiewicz, &
Heggestad, 2009; Cucina, Vasilopoulos, & Sehgal, 2005). Consider importance ratings
for agreeableness: When incumbents provide ratings for low complexity jobs, they may
decide that getting along with customers is important and provide a high rating (i.e., a 4
or 5 on a 5-point scale). In this case the rater may implicitly consider a linear monotonic
relationship between agreeableness and performance related to getting along with others.
In contrast, incumbents in high complexity managerial positions may decide that while
some degree of agreeableness is critical, being too agreeable may undermine a manager’s
authority in other settings. These incumbents may rate agreeableness very high in
importance but simultaneously believe that moderate standing on the trait is optimal
compared to very high standing.
Thus, the moderator analyses herein are interpreted more as an initial look into
these questions. The results suggest possible trends or considerations rather than a
definitive test. As described above, a major caveat is that occupation-level data were
drawn from O*NET and matched by SOC code, rather than by gathering occupation
information specific to the validity studies in question. Ultimately, practitioners could
consider consequences of personality test use in specific settings given information about
how assessment scores might be used. Researchers could generate hypotheses on the
basis of these results and those of Le et al. (2011) in planning future definitive testing.
99
Further research that collects this type of data in the same environment in which predictor
and criterion data are collected could be very beneficial.
Curvilinearity in Context. Finally, as with many studies examining bivariate
correlations between personality predictors and job performance ratings, the slopes of
these relationships could be regarded as small (Morgeson et al., 2007). However, none of
these coefficients were corrected for statistical artifacts such as range restriction or
criterion unreliability that may obscure the potential utility of using personality
assessments in operational settings (Barrick & Mount, 1991; Ones et al., 2007). The
absolute magnitude of the R2 coefficients from the hierarchical regressions is small and
consistent with coefficients in the personality—job performance literature that are
uncorrected for statistical artifacts such as range restriction and unreliability. The
discussion herein focuses on the form of the observed relationship, as other studies have
examined linear slopes with emphasis on correction for statistical artifacts (see examples
in Table 1), as well as implications of using multiple personality scales and compound
traits for predicting performance (Barrick et al., 2001; Hogan & Holland, 2003; Hough &
Johnson, 2013; Ones et al., 2007; Ones & Viswesvaran, 2001). The addition of the
quadratic predictors to the regression models indicated slight incremental validity for
predicting performance, consistent with similar studies (Le et al., 2011). It is true that a
primary argument for the use of personality scales is their relevance for predicting
performance, but it is also the case that the classic bivariate predictive validity model
may not be well suited for understanding the power of personality predictors (e.g.,

100
Campbell, 1990). In any case, the magnitude of the slope is a relevant component of an
argument about the consequences of departure from linearity.
101
REFERENCES Allport, G. W., & Odbert, H. S. (1936). Trait names: A psycholexical study.
Psychological Monographs, 47.
Aguinis, H., Mazurkiewicz, M. D., & Heggestad, E. D. (2009). Using web-based frame-
of-reference training to decrease biases in personality-based job analysis: An
experimental field study. Personnel Psychology, 62, 405-438.
Anderson, N., & Ones, D. S. (2003). The construct validity of three entry-level
personality inventories used in the UK: Cautionary findings from a multiple-
inventory investigation. European Journal of Personality, 17, S39-S66.
Arneson, J. J., Sackett, P. R., & Beatty, A. S. (2011). Ability-performance relationships
in education and employment settings: Critical tests of the more-is-better and the
good-enough hypothesis. Psychological Science, 22(10), 1336-1342.
Baron, H. (1996). Strengths and limitations of ipsative measurement. Journal of
Occupational and Organizational Psychology, 69, 49-56.
Barrick, M. R., & Mount, M. K. (1991). The Big Five personality dimensions and job
performance: A meta-analysis. Personnel Psychology, 44, 1-26.
Barrick, M. R., & Mount, M. K. (1993). Autonomy as a moderator of the relationships
between the Big Five personality dimensions and job performance. Journal of
Applied Psychology, 78(1), 111-118.
Barrick, M. R., & Mount, M. K. (2005). Yes, personality matters: Moving on the more
important matters. Human Performance, 18(4), 359-372.
102
Barrick, M. R., & Mount, M. K., & Gupta, R. (2003). Meta-analysis of the relationship
between the Five-Factor Model of personality and Holland’s occupational types.
Personnel Psychology, 56, 45-74.
Barrick, M. R., & Mount, M. K., Judge, T. A. (2001). Personality and performance at the
beginning of the new millennium: What do we know and where do we go next?
International Journal of Selection and Assessment, 9, 9-30.
Bartram, D. (2005). The great eight competencies: A criterion-centric approach to
validation. Journal of Applied Psychology, 90(6), 1185-1203.
Bell, S. T. (2007). Deep-level composition variables as predictors of team performance:
A meta-analysis. Journal of Applied Psychology, 92(3), 595-615.
Benson, M. J., & Campbell, J. P. (2007). To be, or not to be, linear: An expanded
representation of personality and its relationship to leadership performance.
International Journal of Selection and Assessment, 15(2), 232-249.
Berry, C. M., Ones, D. S., & Sackett, P. R. (2007). Interpersonal deviance, organizational
deviance, and their common correlates: A review and meta-analysis. Journal of
Applied Psychology, 92(2), 410-424.
Berry, C. M., & Sackett, P. R. (2009). Faking in personnel selection: Tradeoffs in
performance versus fairness resulting from two cut-score strategies. Personnel
Psychology, 62, 835-863.
Bliese, P. D. (2000). Within-group agreement, non-independence, and reliability:
Implications for data aggregation and analysis. In K. J. Klein & S. W. J.
Kozlowski (Eds.), Multilevel theory, research, and methods in organizations:
103
Foundations, extensions, and new directions (pp. 349-381). San Francisco, CA:
Jossey-Bass.
Bliese, P. D., & Hanges, P. J. (2004). Being both too liberal and too conservative: The
perils of treating grouped data as though they were independent. Organizational
Research Methods, 7(4), 400-417.
Block, J. (1995). A contrarian view of the five-factor approach to personality description.
Psychological Bulletin, 117(2), 187-215.
Borman, W. C., Kubisiak, U. C., & Schneider, R. J. (1999). Work styles. In N. G.
Peterson, M. D. Mumford, W. C. Borman, P. R. Jeanneret, & E. A. Fleishman
(Eds.), An occupational information system for the 21st century: The development
of O*NET (pp. 213-226). Washington, DC: American Psychological Association.
Borman, W. C., & Motowidlo, S. J. (1993). Expanding the criterion domain to include
elements of contextual performance. In N. Schmitt & W. C. Borman (Eds.),
Personnel selection in organizations (pp. 71-98). San Francisco, CA: Jossey-
Bass.
Bray, D. W., & Grant, D. L. (1966). The assessment center in the measurement of
potential for business management. Psychological Monographs: General and
Applied, 80(17), 1-27.
Campbell, J. P. (1990). Modeling the performance prediction problem in industrial and
organizational psychology. In M. D. Dunnette & L. M. Hough (Eds.), Handbook
of industrial and organizational psychology (2nd ed., pp. 687-732). Palo Alto, CA:
Consulting Psychologists Press.
104
Campbell, J. P. (2012). Behavior, performance, and effectiveness in the 21st century. In S.
W. J. Kozlowski (Ed.), The Oxford handbook of organizational psychology (pp.
159-194). New York: Oxford University Press.
Campbell, J. P., McCloy, R. A., Oppler, S. H., & Sager, C. E. (1993). A theory of
performance. In N. Schmitt, W.C. Borman, & Associates (Eds.), Personnel
Selection in Organizations. San Francisco, CA: Jossey-Bass.
Campbell, J. P., McHenry, J. J., & Wise, L. L. (1990). Modeling job performance in a
population of jobs. Personnel Psychology, 43, 313-575.
Carroll, J. B. (1993). Human cognitive abilities: A survey of factor-analytic studies. New
York, NY: Cambridge University Press.
Chiaburu, D. S., Oh, I.-S., Berry, C. M., Li, N., & Gardner, R. G. (2011). The five-factor
model of personality traits and organizational citizenship behaviors: A meta-
analysis. Journal of Applied Psychology, 96, 1140-1166.
Christiansen, N. D., & Tett, R. P. (2008). Toward a better understanding of the role of
situations in linking personality, work behavior, and job performance. Industrial
and Organizational Psychology: Perspectives on Science and Practice, 1(3), 312-
316.
Cohen, J., Cohen, P., West, S. G., & Aiken, L. S. (2003). Applied multiple
regression/correlation for the social sciences. Hillsdale, NJ: Lawrence Erlbaum
and Associates.
105
Connelly, B. S., & Ones, D. S. (2010). An other perspective on personality: Meta-
analytic integration of observers’ accuracy and predictive validity. Psychological
Bulletin, 136(6), 1092-1122.
Converse, P. D., & Oswald, F. L. (2012). Thinking ahead: Assuming nonlinear
personality-criterion relationships in personnel selection. Presented at the 27th
Annual Conference of the Society for Industrial and Organizational Psychology,
San Diego, CA.
Costa, P. T., & McCrae, R. R. (1992). Normal personality assessment in clinical practice:
The NEO personality inventory. Psychological Assessment, 4(1), 5-13.
Costa, P. T., & McCrae, R. R. (1995). Domains and facets: Hierarchical personality
assessment using the revised NEO personality inventory. Journal of Personality
Assessment, 64(1), 21-50.
Coward, W. M., & Sackett, P. R. (1990). Linearity of ability—performance relationships:
A reconfirmation. Journal of Applied Psychology, 75(3), 297-300.
Cronbach, L. J., & Meehl, P. E. (1955). Construct validity in psychological tests.
Psychological Bulletin, 52(4), 281-302.
Cucina, J. M., & Martin, N. R. (2013). Reconciling conflicting findings of personality
curvilinearity with theory and psychometrics. Paper presented at the 28th Annual
Conference of the Society for Industrial and Organizational Psychology. Houston,
TX.
106
Cucina, J. M., & Vasilopoulos, N. L. (2005). Nonlinear personality—performance
relationships and the spurious moderating effects of traitedness. Journal of
Personality, 73, 227-260.
Cucina, J. M., Vasilopoulos, N. L., & Sehgal, K. (2005). Personality-based job analysis
and the self-serving bias. Journal of Business and Psychology, 20(2), 275-290.
Dalal, R. S. (2005). A meta-analysis of the relationship between organizational
citizenship behavior and counterproductive work behavior. Journal of Applied
Psychology, 90(6), 1241-1255.
Davis-Blake, A. & Pfeffer, J. (1989). Just a mirage: The search for dispositional effects in
organizational research. Academy of Management Review, 14(3), 385-400.
Davison, M. L., & Davenport, E. C. (2002). Identifying criterion-related patterns of
predictor scores using multiple regression. Psychological Methods, 7(4), 468-484.
Davison, M. L., Kwak, N., Seo, Y. S., & Choi, J. (2002). Using hierarchical linear
models to examine moderator effects: Person-by-organization interactions.
Organizational Research Methods, 5(3), 231-254.
De Corte, W., Sackett, P. R., & Lievens, F. (2011). Designing Pareto-optimal selection
systems: Formalizing the decisions required for selection system development.
Journal of Applied Psychology, 96(5), 907-926.
DeYoung, C. G. (2011). Intelligence and personality. In R. J. Sternberg & S. B. Kaufman
(Eds.), The Cambridge handbook of intelligence (pp. 711-737). New York, NY:
Cambridge University Press.
107
DeYoung, C. G. (2010). Toward a theory of the big five. Psychological Inquiry, 21, 26-
33.
Digman, J. M. (1990). Personality structure: Emergence of the five-factor model. Annual
Review of Psychology, 41, 417-440.
Digman, J. M. (1997). Higher-order factors of the Big Five. Journal of Personality and
Social Psychology, 73, 1246-1256.
Dudley, N. M., Orvis, K. A., Lebiecki, J. E., & Cortina, J. M. (2006). A meta-analytic
investigation of conscientiousness in the prediction of job performance:
Examining the intercorrelations and the incremental validity of narrow traits.
Journal of Applied Psychology, 91, 40-57.
Dunnette, M. D. (1966). Personnel selection and placement. Belmont, CA: Wadsworth.
Dunnette, M. D. (1976). Aptitudes, abilities, and skills. In M. D. Dunnette (Ed.),
Handbook of industrial and organizational psychology. Chicago: Rand-McNally.
Fine, S. A. (1988). Human service workers. In S. Gael (Ed.), The job analysis handbook
for business, industry, and government (pp. 1163-1180). New York: Wiley.
Fleeson, W., & Gallagher, P. (2009). The implications of big five standing for the
distribution of trait manifestation in behavior: Fifteen experience-sampling studies
and a meta-analysis. Journal of Personality and Social Psychology, 97(6), 1097-
1114.
Goldberg, L. R. (1992). The development of markers for the big five factor structure.
Psychological Assessment, 4(1), 26-42.
108
Gottfredson, L. S. (1997). Mainstream science on intelligence: An editorial with 52
signatories, history, and bibliography. Intelligence, 24, 13-23.
Grant, A. M., & Schwartz, B. (2011). Too much of a good thing: The challenge and
opportunity of the inverted U. Perspectives on Psychological Science, 6(1), 61-76.
Guion, R. M. (1967). Personnel selection. Annual Review of Psychology, 18, 191-216.
Guion, R. M., & Gottier, R. F. (1965). Validity of personality measures in personnel
selection. Personnel Psychology, 18, 135-164.
Heggestad, E. D., & Gordon, H. L. (2008).An argument for context-specific personality
assessments. Industrial and Organizational Psychology: Perspectives on Science
and Practice, 1(3), 320-322.
Heggestad, E. D. Morrison, M., Reeve, C. L., & McCloy, R. A. (2006). Forced-choice
assessments of personality for selection: Evaluating issues of normative
assessment and faking resistance. Journal of Applied Psychology, 91(1), 9-24.
Hogan, R. (2005). In defense of personality measurement: New wine for old whiners.
Human Performance, 18(4), 331-341.
Hogan, R. T. (2006). Who wants to be a psychologist? Journal of Personality
Assessment, 86(2), 119-130.
Hogan, J., Davies, S., & Hogan, R. (2007). Generalizing personality-based validity
evidence. In S. M. McPhail (Ed.), Alternative validation strategies: Developing
new and leveraging existing validity evidence (pp. 181-229). San Francisco, CA:
Jossey-Bass.
109
Hogan, J., & Hogan, R. (1989). How to measure employee reliability. Journal of Applied
Psychology, 74(2), 273-279.
Hogan R., & Hogan, J. (1995). The Hogan Personality Inventory Manual (2nd ed.).
Tulsa, OK: Hogan Assessment Systems.
Hogan, R., Hogan, J., & Roberts, B. W. (1996). Personality measurement and
employment decisions: Questions and answers. American Psychologist, 51(5),
469-477.
Hogan, J. & Holland, B. (2003). Using theory to evaluate personality and job-
performance relations: A socioanalytic perspective. Journal of Applied
Psychology, 88, 100-112.
Hogan R., & Shelton, D. (1998). A socioanalytic perspective on job performance. Human
Performance, 11(2/3), 129-144.
Holland, J. L. (1996). Exploring careers with a typology: What we have learned and some
new directions. American Psychologist, 51(4), 397-406.
Hough, L. M. (1992). The “big five” personality variables—construct confusion:
Description versus prediction. Human Performance, 5(1&2), 139-155.
Hough, L. M., & Dilchert, S. (2010). Personality: Its measurement and validity for
employee selection. In J. L. Farr and N. T. Tippins (Eds.), Handbook of employee
selection (pp. 299-319). New York, NY: Routledge/Taylor & Francis.
Hough, L. M., Eaton, N. K., Dunnette, M. D., Kamp, J. D., & McCloy, R. A. (1990).
Criterion-related validities of personality constructs and the effect of response
distortion on those validities. Journal of Applied Psychology, 75, 581-595.
110
Hough, L. M., & Furnham, A. (2003). Importance and use of personality variables in
work settings. In I. B. Weiner (Ed-in-Chief) & W. Borman, D. Ilgen, & R.
Klimoski (Vol. Eds.), Comprehensive handbook of psychology: Industrial
organizational psychology. (Vol. 12, pp. 131–169). New York: Wiley & Sons.
Hough, L. M., & Johnson, J. W. (2013). Use and importance of personality variables in
work settings. In I. B. Weiner (Ed-in-Chief) & N. Schmitt & S. Highhouse (Vol.
Eds.), Handbook of psychology: Industrial and organizational psychology. (Vol.
12, pp. 211-243). Hoboken, New Jersey: John Wiley & Sons.
Hough, L. M., & Ones, D. S. (2001). The structure, measurement, validity, and use of
personality variables in industrial, work, and organizational psychology. In N.
Anderson, D. S. Ones, H. K. Sinangil, & C. Viswesvaran (Eds.), Handbook of
industrial, work, and organizational psychology: Vol. 1. Personnel psychology
(pp. 233-277). Thousand Oaks, CA: Sage.
Hough, L. M., & Oswald, F. L. (2008). Personality testing and I-O psychology:
Reflections, progress, and prospects. Industrial and Organizational Psychology:
Perspectives on Science and Practice, 1, 272-290.
Hough, L. M., & Schneider, R. J. (1996). Personality traits, taxonomies, and applications
in organizations. In K. Murphy (Ed.), Individual differences and behavior in
organizations (pp. 31–88). San Francisco: Jossey-Bass.
Hunt, S. T. (1996). Generic work behavior: An investigation into the dimensions of
entry-level, hourly job performance. Personnel Psychology, 49, 51-83.
111
Hunter, J. E. (1983). Test validation for 12,000 jobs: An application of job classification
and validity generalization analysis to the General Aptitude Test Battery. U.S.
Department of Labor, USES Test Research Report No. 45. Washington, DC.
Hunter, J. E., & Hunter, R. F. (1984). Validity and utility of alternative predictors of job
performance. Psychological Bulletin, 96, 72-98.
Hurtz, G. M., & Donovan, J. J. (2000). Personality and job performance: The Big Five
revisited. Journal of Applied Psychology, 85, 869-879.
Jackson, D. N., Wroblewski, V. R., & Ashton, M. C. (2000). The impact of faking on
employment tests: Does forced choice offer a solution? Human Performance,
13(4), 371-388.
James, L. R. (1998). Measurement of personality via conditional reasoning.
Organizational Research Methods, 1(2), 131-163.
Jeanneret, P. R., Borman, W. C., Kubisiak, U. C., & Hanson, M. A. (1999). Generalized
work activities. In N. G. Peterson, M. D. Mumford, W. C. Borman, P. R.
Jeanneret, and E. A. Fleishman (Eds.), An occupational information system for the
21st Century: The development of O*NET (pp. 105-125). Washington, DC:
American Psychological Association.
John, O. P., & Srivastava, S. (1999). The Big Five trait taxonomy: History, measurement,
and theoretical perspectives. In L. A. Pervin & O. P. John (Eds.), Handbook of
personality: Theory and research (2nd ed., pp. 102-138). New York: Guilford
Press.
112
Johnson, J. W., & Hezlett, S. A. (2008). Modeling the influence of personality on
individuals at work: A review and research agenda. In S. Cartwright & C. L.
Cooper (Eds.), The Oxford handbook of personnel psychology (pp. 59-92).
Oxford, UK: Oxford University Press.
Judge, T. A., Bono, J. E., Ilies, R., & Gerhardt, M. W. (2002). Personality and leadership:
A qualitative and quantitative review. Journal of Applied Psychology, 87(4), 765–
779.
Judge, T. A., Heller, D., & Mount, M. K. (2002). Five-factor model of personality and
job satisfaction: A meta-analysis. Journal of Applied Psychology, 87(3), 530-541.
Judge, T. A., & Kammeyer-Mueller, J. D. (2012). On the value of aiming high: The
causes and consequences of ambition. Journal of Applied Psychology, 97(4), 758-
775.
Kessler, S. R., Bandelli, A. C., Spector, P. E., Borman, W. C., Nelson, C. E., & Penney,
L. M. (2010). Re-examining Machiavelli: A three-dimensional model of
Machiavellianism in the workplace. Journal of Applied Social Psychology, 40(8),
1868-1896.
Krueger, R. F., Derringer, J., Markon, K. E., Watson, D., & Skodol, A. E. (2012). Initial
construction of a maladaptive personality trait model and inventory for DSM-5.
Psychological Medicine, 42(9), 1879-1890.
Krueger, R. F., Eaton, N. R., Clark, L. A., Watson, D., Markon, K. E., Derringer, J.,
Skodol, A., & Livesley, W. J. (2011). Deriving an empirical structure of
113
personality pathology for DSM-5. Journal of Personality Disorders, 25(2), 170-
191.
Krueger, R. F., & Tackett, J. L. (2003). Personality and psychopathology: Working
toward the bigger picture. Journal of Personality Disorders, 17(2), 109-128.
Kuncel, N. R., & Tellegen, A. (2009). A conceptual and empirical reexamination of the
measurement of the social desirability of items: Implications for detecting
desirable response style and scale development. Personnel Psychology, 62, 201-
228.
LaHuis, D. M., Martin, N. R., & Avis, J. M. (2005). Investigating nonlinear
conscientiousness—job performance relations for clerical employees. Human
Performance, 18, 199-212.
Le, H., Oh, I., Robbins, S. B., Ilies, R., Holland, E., & Westrick, P. (2011). Too much of
a good thing? Curvilinear relationships between personality traits and job
performance. Journal of Applied Psychology, 96, 113-133.
LePine, J. A., Colquitt, J. A., & Erez, A. (2000). Adaptability to changing task contexts:
Effects of general cognitive ability, conscientiousness, and openness to
experience. Personnel Psychology, 53, 563-593.
Little, I. S. (2007). Revisiting the relationship between conscientiousness and job
performance: Linearity or non-linearity? Unpublished doctoral dissertation.
Bowling Green, OH.
MacLane, C. N., & Walmsley, P. T. (2010). Reducing counterproductive behavior
through employee selection. Human Resource Management Review, 20, 62-72.
114
Markon, K. E., Krueger, R. F., & Watson, D. (2005). Delineating the structure of normal
and abnormal personality: An integrative hierarchical approach. Journal of
Personality and Social Psychology, 88, 139-157.
McAdams, D. P., & Pals, J. L. (2006). A new big five: Fundamental principles for an
integrative science of personality. American Psychologist, 61(3), 204-217.
McCormick, E. J., Jeanneret, P. R., & Mecham, R. C. (1972). A study of job
characteristics and job dimensions as based on the Position Analysis
Questionnaire (PAQ). Journal of Applied Psychology Monograph, 56(4), 347-
368.
McCrae, R. R., & Costa, P. T. (1997). Personality trait structure as a human universal.
American Psychologist, 52(5), 509-516.
Miller, J. D., Bagby, R. M., & Pilkonis, P. A. (2005). A comparison of the validity of the
five-factor model (FFM) personality disorder prototypes using FFM self-report
and interview measures. Psychological Assessment, 17(4), 497-500.
Mischel, W. (1968). Personality and assessment. New York: Wiley.
Morgeson, F. P., Campion, M. A., Dipboye, R. L., Hollenbeck, J. R., Murphy, K., &
Schmitt, N. (2007). Reconsidering the use of personality tests in personnel
selection contexts. Personnel Psychology, 60, 683-729.
Mount, M. K., Barrick, M. R., & Stewart, G. L. (1998). Five-factor model of personality
and performance in jobs involving interpersonal interactions. Human
Performance, 11, 145-165.
115
Mount, M. K., Barrick, M. R., & Strauss, J. P. (1994). Validity of observer ratings of the
big five personality factors. Journal of Applied Psychology, 79(2), 272-280.
Mumford, M. D., Peterson, N. G., & Childs, R. A. (1999). Basic and cross-functional
skills. In N. G. Peterson, M. D. Mumford, W. C. Borman, P. R. Jeanneret, and E.
A. Fleishman (Eds.), An occupational information system for the 21st Century:
The development of O*NET (pp. 49-69). Washington, DC: American
Psychological Association.
Murphy, K. R. (1996). Individual differences and behavior in organizations: Much more
than g. In K. Murphy (Ed.), Individual differences and behavior in organizations
(pp. 3–30). San Francisco: Jossey-Bass.
Murphy, K. R., & Dzieweczynski, J. L. (2005). Why don’t measures or broad dimensions
of personality perform better as predictors of job performance? Human
Performance, 18(4), 343-357.
Neisser, U., Boodoo, G., Bouchard, T. J., Boykin, A. W., Brody, N., Ceci, S. J., Halpern,
D. F., Loehlin, J. C., Perloff, R., Sternberg, R. J., & Urbina, S. (1996).
Intelligence: Knowns and unknowns. American Psychologist, 51(2), 77-101.
Nisbett, R. E., Aronson, J. Blair, C., Dickens, W., Flynn, J., Halpern, D. F., &
Turkheimer, E. (2012). Intelligence: New findings and theoretical developments.
American Psychologist, 67(2), 130-159.
Oh, I.-S., Wang, G., & Mount, M. K. (2011). Validity of observer ratings of the five-
factor model of personality traits: A meta-analysis. Journal of Applied
Psychology, 96(4), 762-773.
116
Ones, D. S., Dilchert, S., Viswesvaran, C., & Judge, T. A. (2007). In support of
personality assessment in organizational settings. Personnel Psychology, 60, 995-
1027.
Ones, D. S., & Viswesvaran, C. (1996). Bandwidth-fidelity dilemma in personality
measurement for personnel selection. Journal of Organizational Behavior, 17,
609-626.
Ones, D. S., & Viswesvaran, C. (2001). Integrity tests and other criterion-focused
occupational personality scales (COPS) used in personnel selection. International
Journal of Selection and Assessment, 9, 31-39.
Ones, D. S., Viswesvaran, C., & Dilchert, S. (2005). Personality at work: Raising
awareness and correcting misconceptions. Human Performance, 18(4), 389-404.
Organ, D. W. (1997). Organizational citizenship behavior: It’s construct clean-up time.
Human Performance, 10, 85-97.
Ozer, D. J., & Benet-Martinez, V. (2006). Personality and the prediction of consequential
outcomes. Annual Review of Psychology, 57, 401-421.
Peeters, M. A. G., Van Tuijl, H. F. J. M., Rutte, C. G., & Reyman, I. M. M. J. (2006).
Personality and team performance: A meta-analysis. European Journal of
Personality, 20, 377-396.
Peugh, J. L., & Enders, C. K. (2005). Using the SPSS mixed procedure to fit cross-
sectional and longitudinal multilevel models. Educational and Psychological
Measurement, 65(5), 717-741.
117
Podsakoff, P. M., MacKenzie, S. B., Lee, J-Y., & Podsakoff, N. P. (2003). Common
method biases in behavioral research: A critical review of the literature and
recommended remedies. Journal of Applied Psychology, 88(5), 879-903.
Poropat, A. E. (2009). A meta-analysis of the five-factor model of personality and
academic performance. Psychological Bulletin, 135(2), 322-338.
Raudenbush S. W., & Bryk, A. S. (2002). Hierarchical linear models: Applications and
data analysis methods. CA: Sage Publications.
Raymark, P. H., Schmit, M.J., & Guion, R.M. (1997). Identifying potentially useful
personality constructs for employee selection. Personnel Psychology, 50, 723-
736.
Reiter-Palmon, R. Mumford, M. D., & Threlfall, K. V. (1998). Solving everyday
problems creatively: The role of problem construction and personality type.
Creativity Research Journal, 11(3), 187-197.
Roberts, B. W., Kuncel, N. R., Shiner, R., Caspi, A. & Goldberg, L. R. (2007). The
power of personality: The comparative validity of personality traits,
socioeconomic status, and cognitive ability for predicting important life
outcomes. Perspectives on Psychological Science, 2(4), 313-345.
Robie, C., & Ryan, A. M. (1999). Effects of nonlinearity and heteroscedasticity on the
validity of conscientiousness in predicting overall job performance. International
Journal of Selection and Assessment, 7, 157-169.
118
Rotundo, M., & Sackett, P. R. (2002). The relative importance of task, citizenship, and
counterproductive performance to global ratings of job performance: A policy-
capturing approach. Journal of Applied Psychology, 87, 66-80.
Sackett, P. R. (2002). The structure of counterproductive work behaviors: Dimensionality
and relationships with facets of job performance. International Journal of
Selection and Assessment, 10, 5-11.
Sackett, P. R., & Walmsley, P. T. (2012). Which non-cognitive attributes are most
important in the workplace? Manuscript in preparation, Department of
Psychology, University of Minnesota, Minneapolis, Minnesota.
Salgado, J. F. (2002). The Big Five personality dimensions and counterproductive
behaviors. International Journal of Selection and Assessment, 10, 117-125.
Saucier, G. & Goldberg, L. R. (2001). Lexical studies of indigenous personality factors:
Premises, products, and prospects. Journal of Personality, 69(6), 847-879.
Schmidt, F. L. (2010). Invited address to the International Society of Intelligence
Research. Alexandria, VA. Available as of September 23, 2012 at:
http://www.isironline.org/meeting/archive.html
Schmidt, F. L. (2012). Cognitive tests used in selection can have content validity as well
as criterion validity: A broader research review and implications for practice.
International Journal of Selection and Assessment, 20(1), 1-13.
Schmidt, F. L., & Hunter, J. E. (1977). Development of a general solution to the problem
of validity generalization. Journal of Applied Psychology, 62(5), 529-540.
119
Schmidt, F. L., & Hunter, J. E. (1996). Measurement error in psychological research:
Lessons from 26 research scenarios. Psychological Methods, 1(2), 199-223.
Schmidt, F. L., & Hunter, J. E. (1998). The validity and utility of selection methods in
personnel psychology: Practical and theoretical implications of 85 years of
research findings. Psychological Bulletin, 124, 262-274.
Schmidt, F. L., & Kaplan, L. B. (1971). Composite vs. multiple criteria: A review and
resolution of the controversy. Personnel Psychology, 24, 419-434.
Schmit, M. J., Ryan, A. M., Stierwalt, S. L., & Powell, A. B. (1995). Frame-of-reference
effects on personality scale scores and criterion-related validity. Journal of
Applied Psychology, 80(5), 607-620.
Schmitt, N., Gooding, R. Z., Noe, R. A., & Kirsch, M. (1984). Metaanalyses of validity
studies published between 1964 and 1982 and the investigation of study
characteristics. Personnel Psychology, 37, 407-422.
Schneider, R. J., Hough, L. M., & Dunnette, M. D. (1996). Broadsided by broad traits:
How to sink science in five dimensions or less. Journal of Organizational
Behavior, 17, 639-655.
Society for Industrial and Organizational Psychology, Inc. (2003). Principles for the
validation and use of personnel selection procedures (4th ed.). Bowling Green,
OH.
Tett, R. P., & Burnett, D. D. (2003). A personality trait-based interactionist model of job
performance. Journal of Applied Psychology, 88, 500-517.
120
Tett, R. P., & Christiansen, N. D. (2007). Personality tests at the crossroads: A response
to Morgeson, Campion, Dipboye, Hollenbeck, Murphy, and Schmitt (2007).
Personnel Psychology, 60, 967-993.
Tett, R. P., & Guterman, H. A. (2000). Situation trait relevance, trait expression, and
cross-situational consistency: Testing a principle of trait activation. Journal of
Research in Personality, 34, 397-423.
Tett, R. P., Guterman, H. A., Bleier, A., & Murphy, P. J. (2000). Development and
content validation of a “hyperdimensional” taxonomy of managerial competence.
Human Performance, 13, 205-251.
Tett, R. P., Jackson, D. N., & Rothstein, M. (1991). Personality measures as predictors of
job performance: A meta-analytic review. Personnel Psychology, 44, 703-742.
Vasilopoulos, N. L., Cucina, J. M., & Hunter, A. E. (2007). Personality and training
proficiency: Issues of bandwidth—fidelity and curvilinearity. Journal of
Occupational and Organizational Psychology, 80, 109-131.
Vinchur, A. J., Schippmann, J. S., Switzer, F. S., & Roth, P. L. (1998). A meta-analytic
review of predictors of job performance for salespeople. Journal of Applied
Psychology, 83, 586-597.
Viswesvaran, C., Schmidt, F. L., & Ones, D. S. (2005). Is there a general factor in ratings
of job performance? A meta-analytic framework for disentangling substantive and
error influences. Journal of Applied Psychology, 90, 108-131.
121
Walton, K. E., Roberts, B. W., Krueger, R. F., Blonigen, D. M., & Hicks, B. M. (2008).
Capturing abnormal personality with normal personality inventories: An item
response theory approach. Journal of Personality, 76(6), 1623-1647.
Whetzel, D. L., McDaniel, M. A., Yost, A. P., Kim, N. (2010). Linearity of personality—
performance relationships: A large-scale examination. International Journal of
Selection and Assessment, 18, 310-320.
Widiger, T. A., Costa, P. T., & McCrae R. R. (2002). A proposal for Axis II: Diagnosing
personality disorders using the five-factor model. In P. T. Costa and T. A.
Widiger (Eds.). Personality disorders and the five factor model of personality (2nd
ed). Washington, DC: American Psychological Association.
Widiger, T. A., & Trull, T. J. (2007). Plate tectonics in the classification of personality
disorder. American Psychologist, 62(2), 71-83.
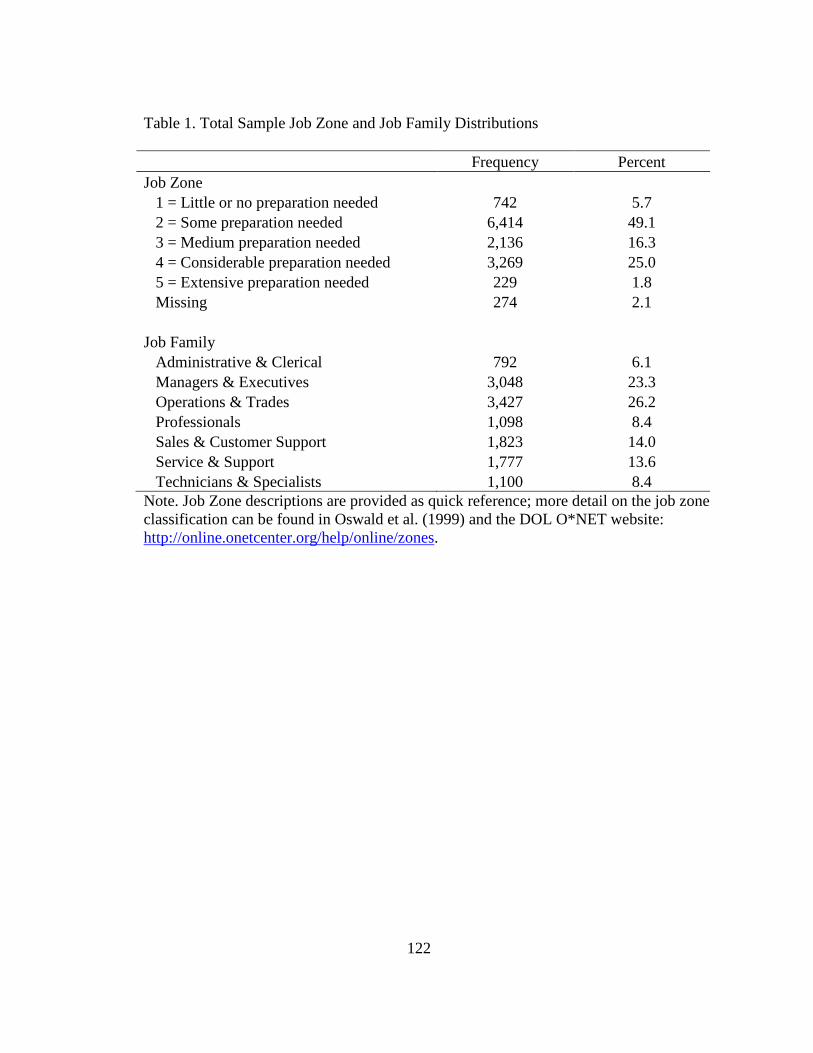
122
Table 1. Total Sample Job Zone and Job Family Distributions
Frequency Percent
Job Zone 1 = Little or no preparation needed 742 5.7 2 = Some preparation needed 6,414 49.1 3 = Medium preparation needed 2,136 16.3 4 = Considerable preparation needed 3,269 25.0 5 = Extensive preparation needed 229 1.8 Missing 274 2.1 Job Family Administrative & Clerical 792 6.1 Managers & Executives 3,048 23.3 Operations & Trades 3,427 26.2 Professionals 1,098 8.4 Sales & Customer Support 1,823 14.0 Service & Support 1,777 13.6 Technicians & Specialists 1,100 8.4 Note. Job Zone descriptions are provided as quick reference; more detail on the job zone classification can be found in Oswald et al. (1999) and the DOL O*NET website: http://online.onetcenter.org/help/online/zones.
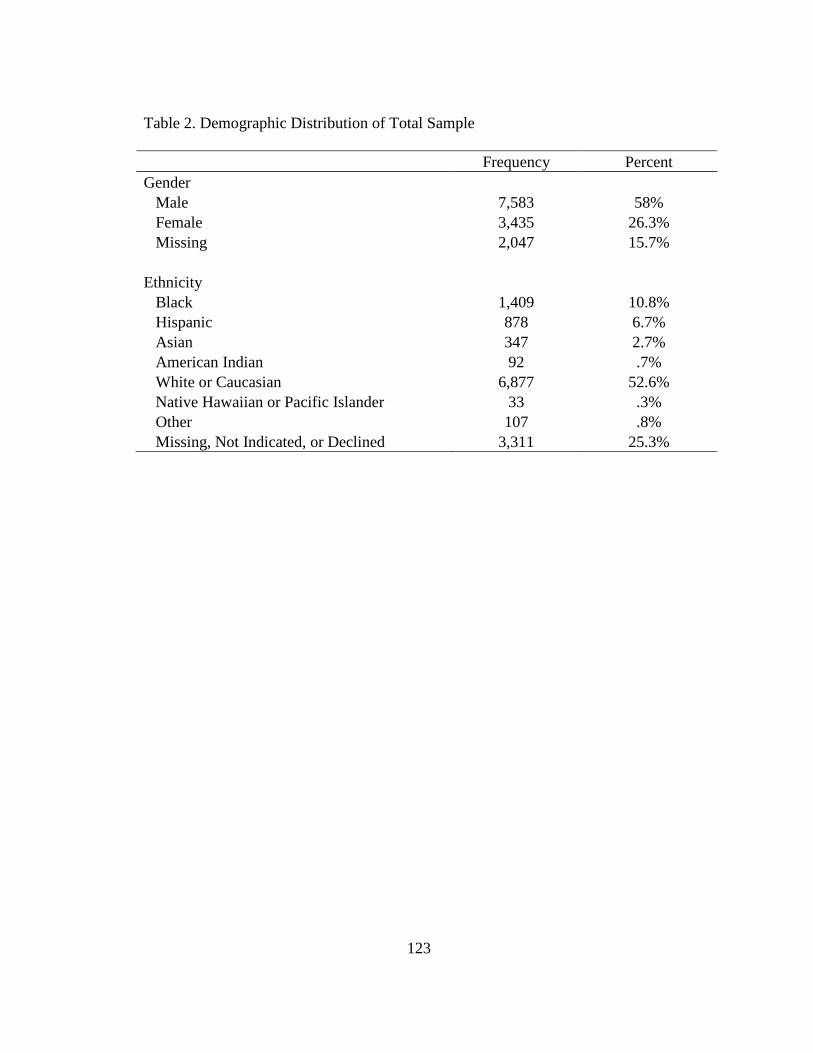
123
Table 2. Demographic Distribution of Total Sample
Frequency Percent
Gender Male 7,583 58% Female 3,435 26.3% Missing 2,047 15.7% Ethnicity Black 1,409 10.8% Hispanic 878 6.7% Asian 347 2.7% American Indian 92 .7% White or Caucasian 6,877 52.6% Native Hawaiian or Pacific Islander 33 .3% Other 107 .8% Missing, Not Indicated, or Declined 3,311 25.3%
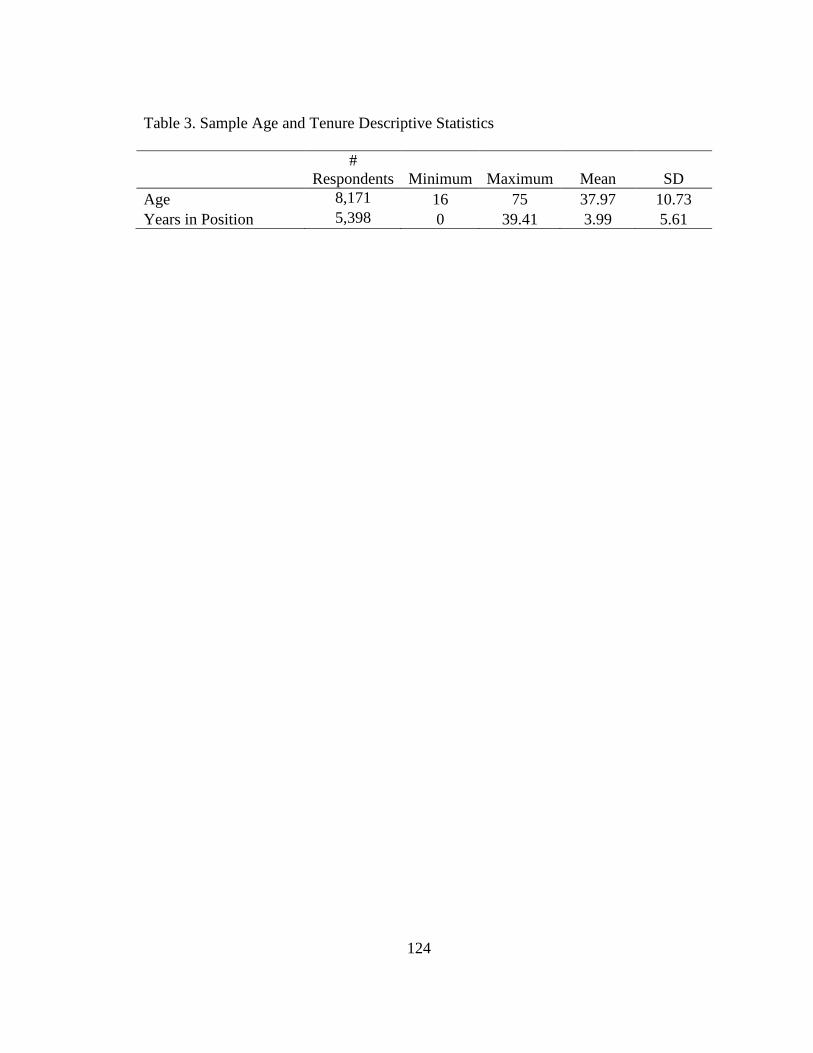
124
Table 3. Sample Age and Tenure Descriptive Statistics
# Respondents Minimum Maximum Mean SD
Age 8,171 16 75 37.97 10.73 Years in Position 5,398 0 39.41 3.99 5.61
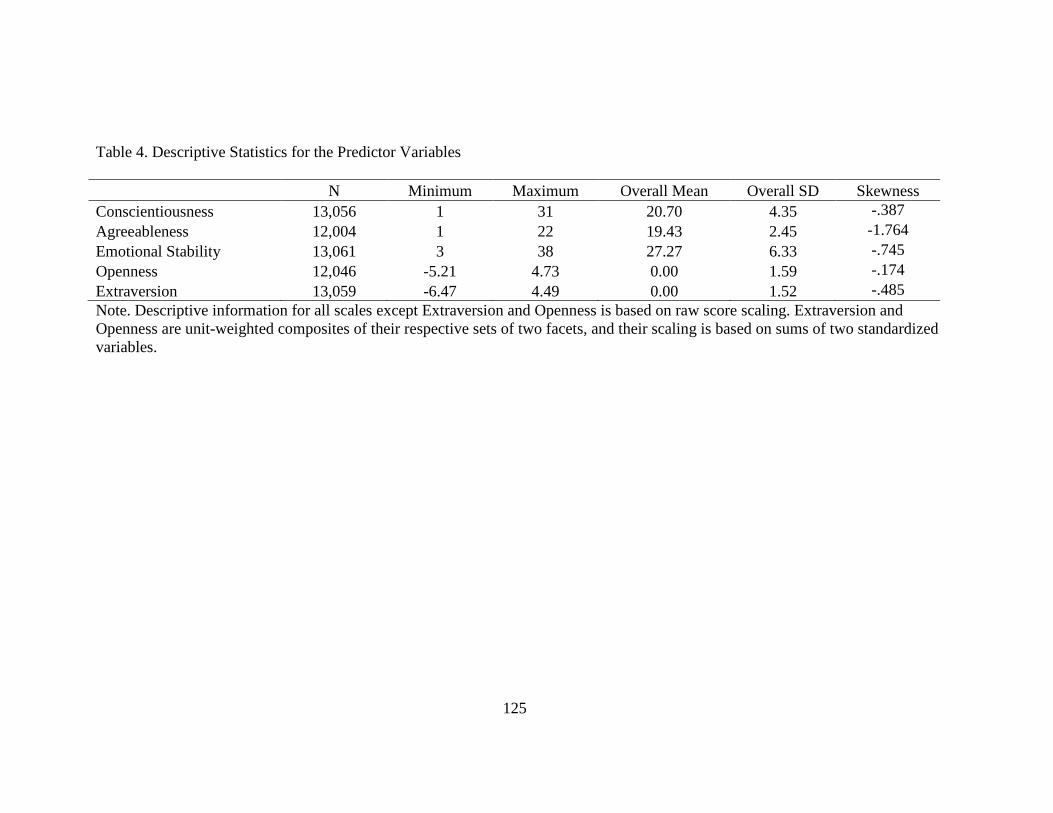
125
Table 4. Descriptive Statistics for the Predictor Variables
N Minimum Maximum Overall Mean Overall SD Skewness
Conscientiousness 13,056 1 31 20.70 4.35 -.387 Agreeableness 12,004 1 22 19.43 2.45 -1.764 Emotional Stability 13,061 3 38 27.27 6.33 -.745 Openness 12,046 -5.21 4.73 0.00 1.59 -.174 Extraversion 13,059 -6.47 4.49 0.00 1.52 -.485 Note. Descriptive information for all scales except Extraversion and Openness is based on raw score scaling. Extraversion and Openness are unit-weighted composites of their respective sets of two facets, and their scaling is based on sums of two standardized variables.
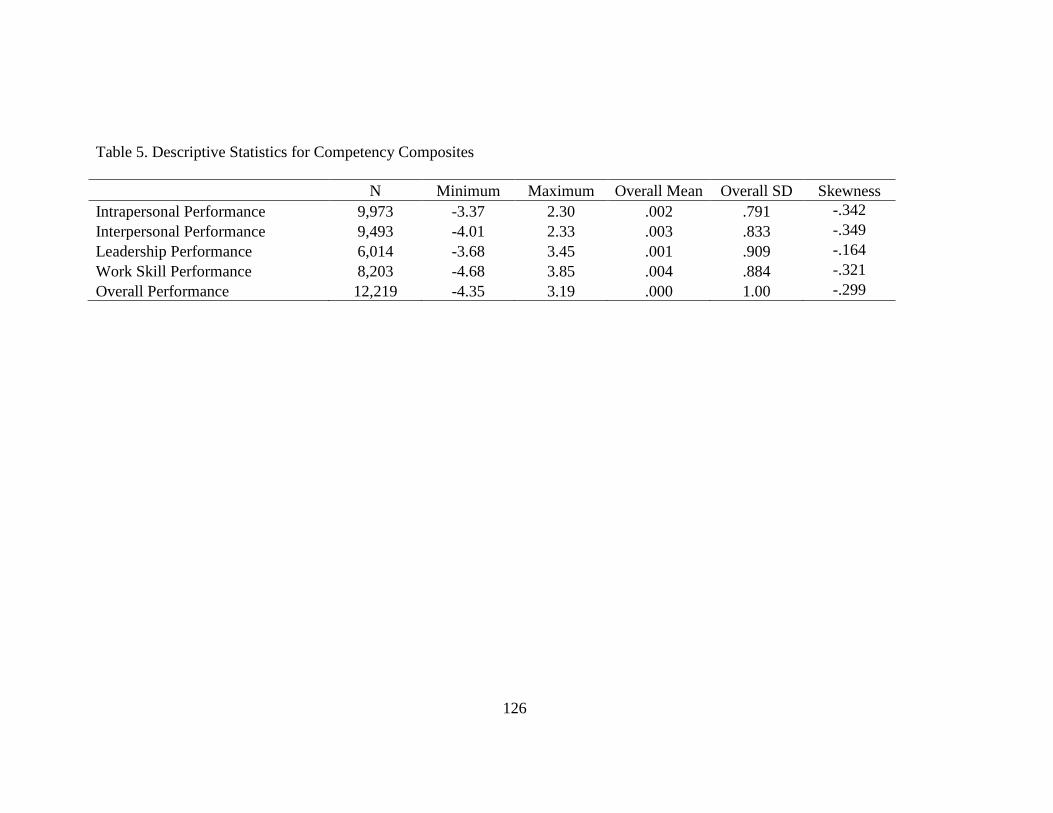
126
Table 5. Descriptive Statistics for Competency Composites
N Minimum Maximum Overall Mean Overall SD Skewness
Intrapersonal Performance 9,973 -3.37 2.30 .002 .791 -.342 Interpersonal Performance 9,493 -4.01 2.33 .003 .833 -.349 Leadership Performance 6,014 -3.68 3.45 .001 .909 -.164 Work Skill Performance 8,203 -4.68 3.85 .004 .884 -.321 Overall Performance 12,219 -4.35 3.19 .000 1.00 -.299
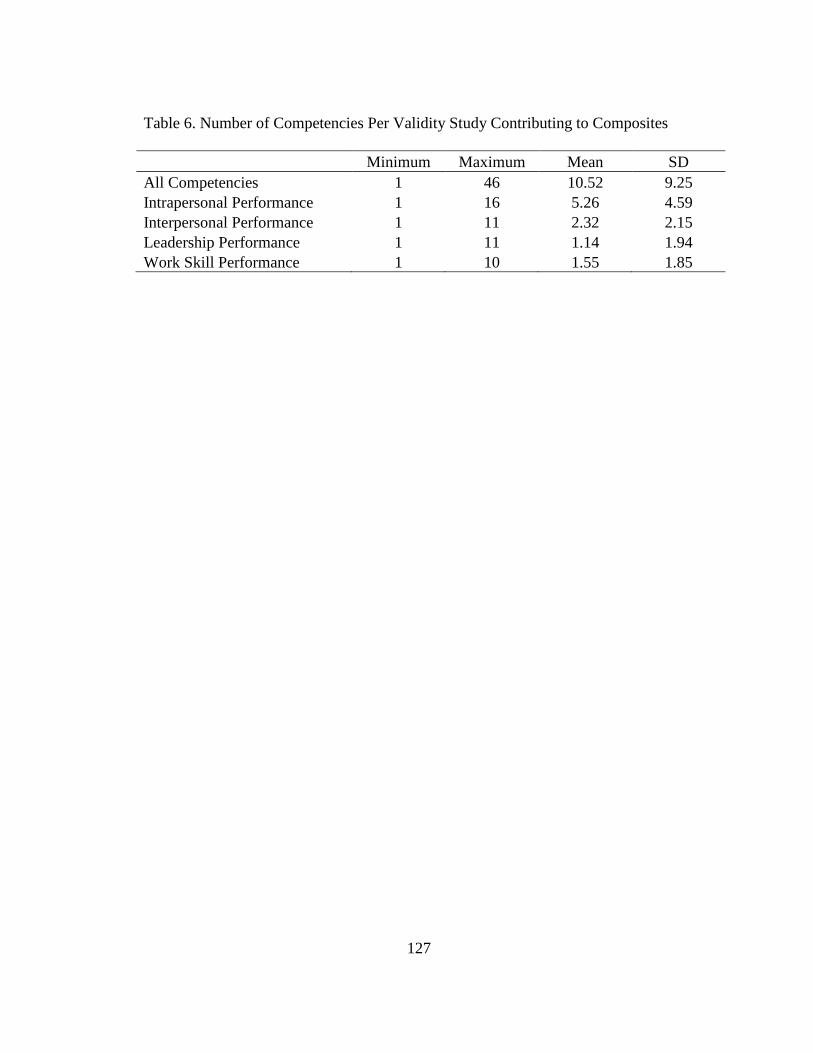
127
Table 6. Number of Competencies Per Validity Study Contributing to Composites
Minimum Maximum Mean SD
All Competencies 1 46 10.52 9.25 Intrapersonal Performance 1 16 5.26 4.59 Interpersonal Performance 1 11 2.32 2.15 Leadership Performance 1 11 1.14 1.94 Work Skill Performance 1 10 1.55 1.85
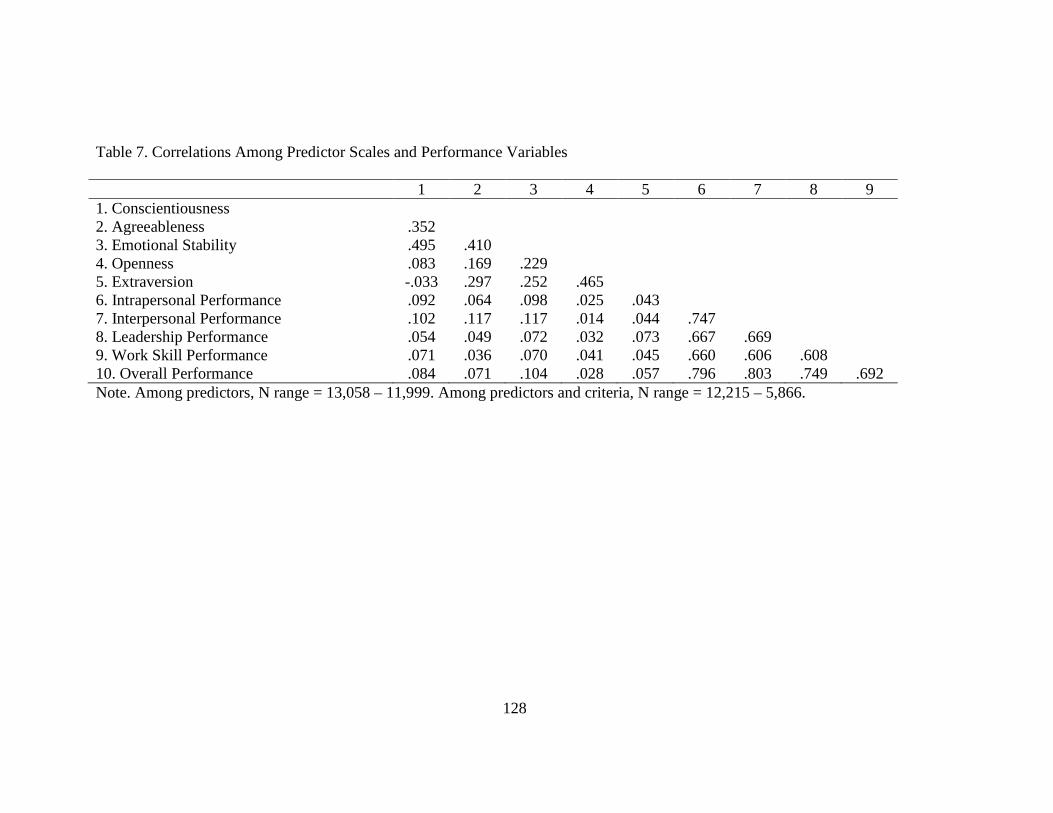
128
Table 7. Correlations Among Predictor Scales and Performance Variables 1 2 3 4 5 6 7 8 9 1. Conscientiousness 2. Agreeableness .352 3. Emotional Stability .495 .410 4. Openness .083 .169 .229 5. Extraversion -.033 .297 .252 .465 6. Intrapersonal Performance .092 .064 .098 .025 .043 7. Interpersonal Performance .102 .117 .117 .014 .044 .747 8. Leadership Performance .054 .049 .072 .032 .073 .667 .669 9. Work Skill Performance .071 .036 .070 .041 .045 .660 .606 .608 10. Overall Performance .084 .071 .104 .028 .057 .796 .803 .749 .692 Note. Among predictors, N range = 13,058 – 11,999. Among predictors and criteria, N range = 12,215 – 5,866.
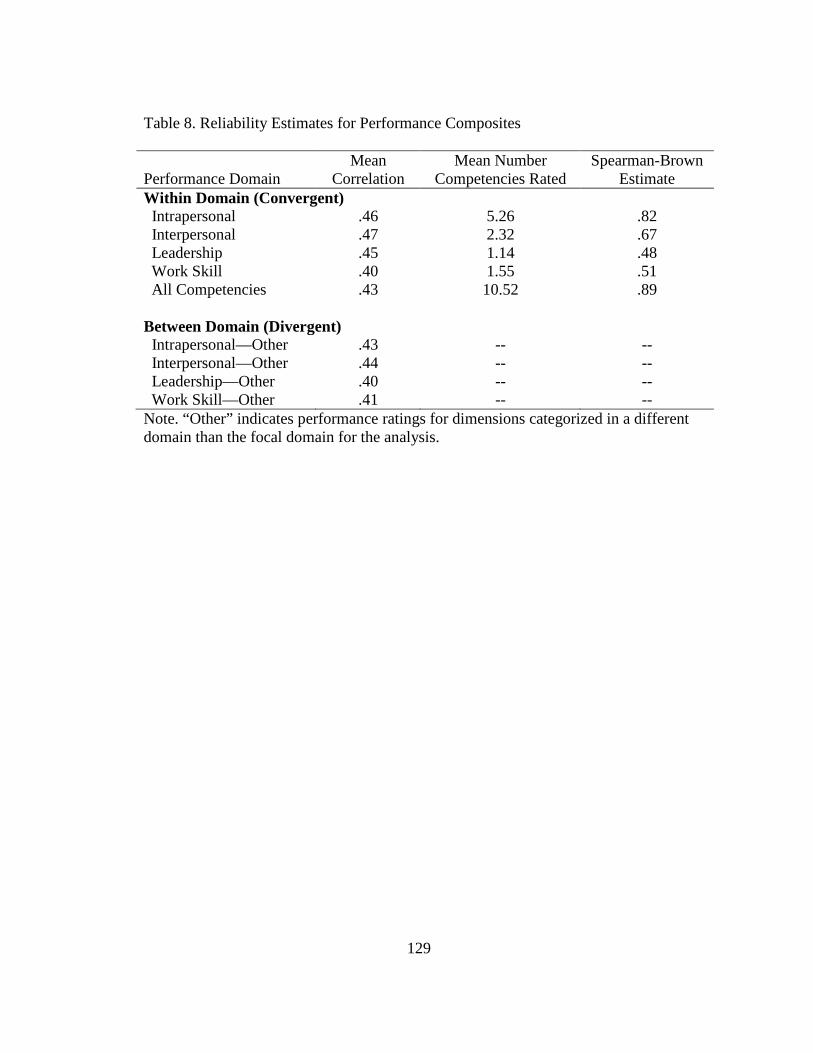
129
Table 8. Reliability Estimates for Performance Composites
Performance Domain Mean
Correlation Mean Number
Competencies Rated Spearman-Brown
Estimate Within Domain (Convergent) Intrapersonal .46 5.26 .82 Interpersonal .47 2.32 .67 Leadership .45 1.14 .48 Work Skill .40 1.55 .51 All Competencies .43 10.52 .89 Between Domain (Divergent) Intrapersonal—Other .43 -- -- Interpersonal—Other .44 -- -- Leadership—Other .40 -- -- Work Skill—Other .41 -- -- Note. “Other” indicates performance ratings for dimensions categorized in a different domain than the focal domain for the analysis.
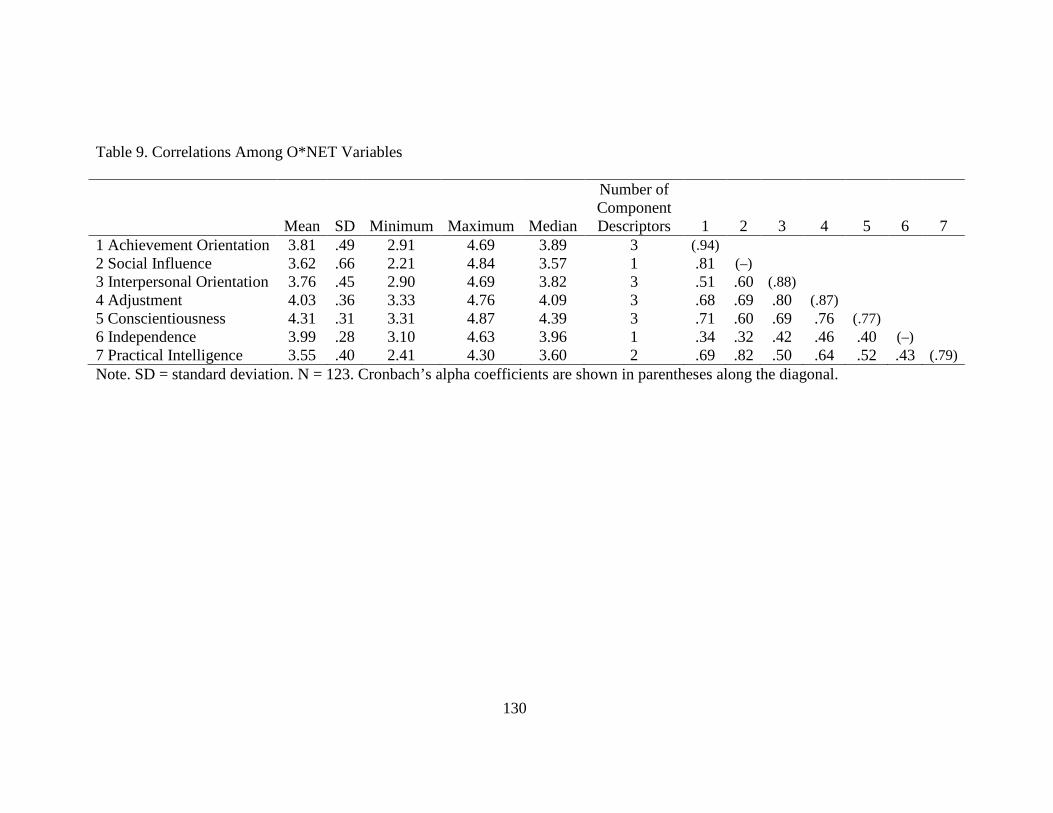
130
Table 9. Correlations Among O*NET Variables
Mean SD Minimum Maximum Median
Number of Component Descriptors 1 2 3 4 5 6 7
1 Achievement Orientation 3.81 .49 2.91 4.69 3.89 3 (.94) 2 Social Influence 3.62 .66 2.21 4.84 3.57 1 .81 (–) 3 Interpersonal Orientation 3.76 .45 2.90 4.69 3.82 3 .51 .60 (.88) 4 Adjustment 4.03 .36 3.33 4.76 4.09 3 .68 .69 .80 (.87) 5 Conscientiousness 4.31 .31 3.31 4.87 4.39 3 .71 .60 .69 .76 (.77) 6 Independence 3.99 .28 3.10 4.63 3.96 1 .34 .32 .42 .46 .40 (–) 7 Practical Intelligence 3.55 .40 2.41 4.30 3.60 2 .69 .82 .50 .64 .52 .43 (.79) Note. SD = standard deviation. N = 123. Cronbach’s alpha coefficients are shown in parentheses along the diagonal.
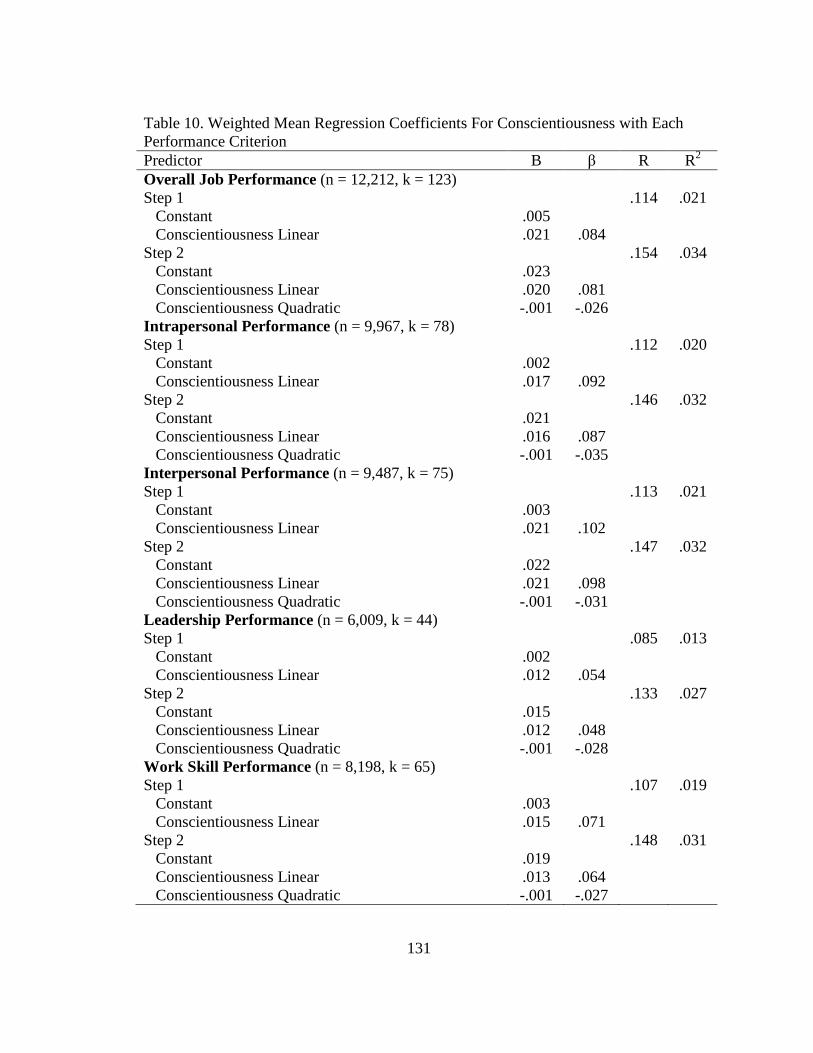
131
Table 10. Weighted Mean Regression Coefficients For Conscientiousness with Each Performance Criterion Predictor B β R R2
Overall Job Performance (n = 12,212, k = 123) Step 1 .114 .021 Constant .005 Conscientiousness Linear .021 .084 Step 2 .154 .034 Constant .023 Conscientiousness Linear .020 .081 Conscientiousness Quadratic -.001 -.026 Intrapersonal Performance (n = 9,967, k = 78) Step 1 .112 .020 Constant .002 Conscientiousness Linear .017 .092 Step 2 .146 .032 Constant .021 Conscientiousness Linear .016 .087 Conscientiousness Quadratic -.001 -.035 Interpersonal Performance (n = 9,487, k = 75) Step 1 .113 .021 Constant .003 Conscientiousness Linear .021 .102 Step 2 .147 .032 Constant .022 Conscientiousness Linear .021 .098 Conscientiousness Quadratic -.001 -.031 Leadership Performance (n = 6,009, k = 44) Step 1 .085 .013 Constant .002 Conscientiousness Linear .012 .054 Step 2 .133 .027 Constant .015 Conscientiousness Linear .012 .048 Conscientiousness Quadratic -.001 -.028 Work Skill Performance (n = 8,198, k = 65) Step 1 .107 .019 Constant .003 Conscientiousness Linear .015 .071 Step 2 .148 .031 Constant .019 Conscientiousness Linear .013 .064 Conscientiousness Quadratic -.001 -.027
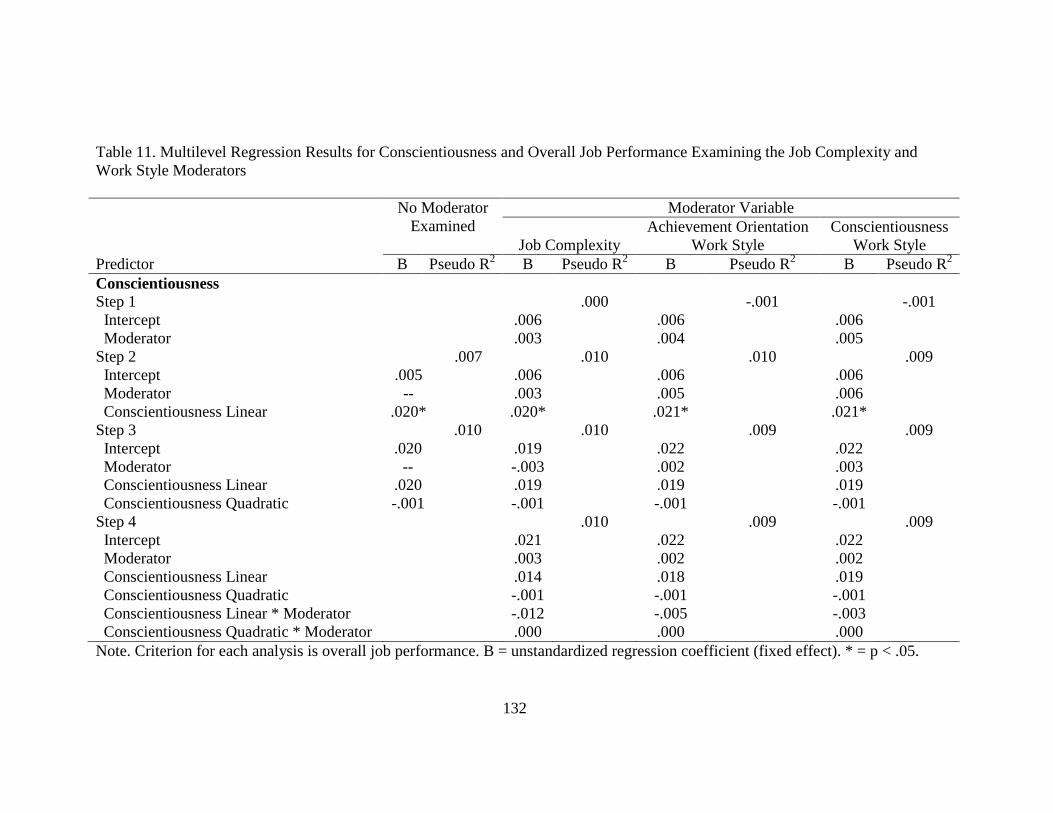
132
Table 11. Multilevel Regression Results for Conscientiousness and Overall Job Performance Examining the Job Complexity and Work Style Moderators No Moderator
Examined Moderator Variable
Job Complexity Achievement Orientation
Work Style Conscientiousness
Work Style Predictor B Pseudo R2 B Pseudo R2 B Pseudo R2 B Pseudo R2 Conscientiousness Step 1 .000 -.001 -.001 Intercept .006 .006 .006 Moderator .003 .004 .005 Step 2 .007 .010 .010 .009 Intercept .005 .006 .006 .006 Moderator -- .003 .005 .006 Conscientiousness Linear .020* .020* .021* .021* Step 3 .010 .010 .009 .009 Intercept .020 .019 .022 .022 Moderator -- -.003 .002 .003 Conscientiousness Linear .020 .019 .019 .019 Conscientiousness Quadratic -.001 -.001 -.001 -.001 Step 4 .010 .009 .009 Intercept .021 .022 .022 Moderator .003 .002 .002 Conscientiousness Linear .014 .018 .019 Conscientiousness Quadratic -.001 -.001 -.001 Conscientiousness Linear * Moderator -.012 -.005 -.003 Conscientiousness Quadratic * Moderator .000 .000 .000 Note. Criterion for each analysis is overall job performance. B = unstandardized regression coefficient (fixed effect). * = p < .05.
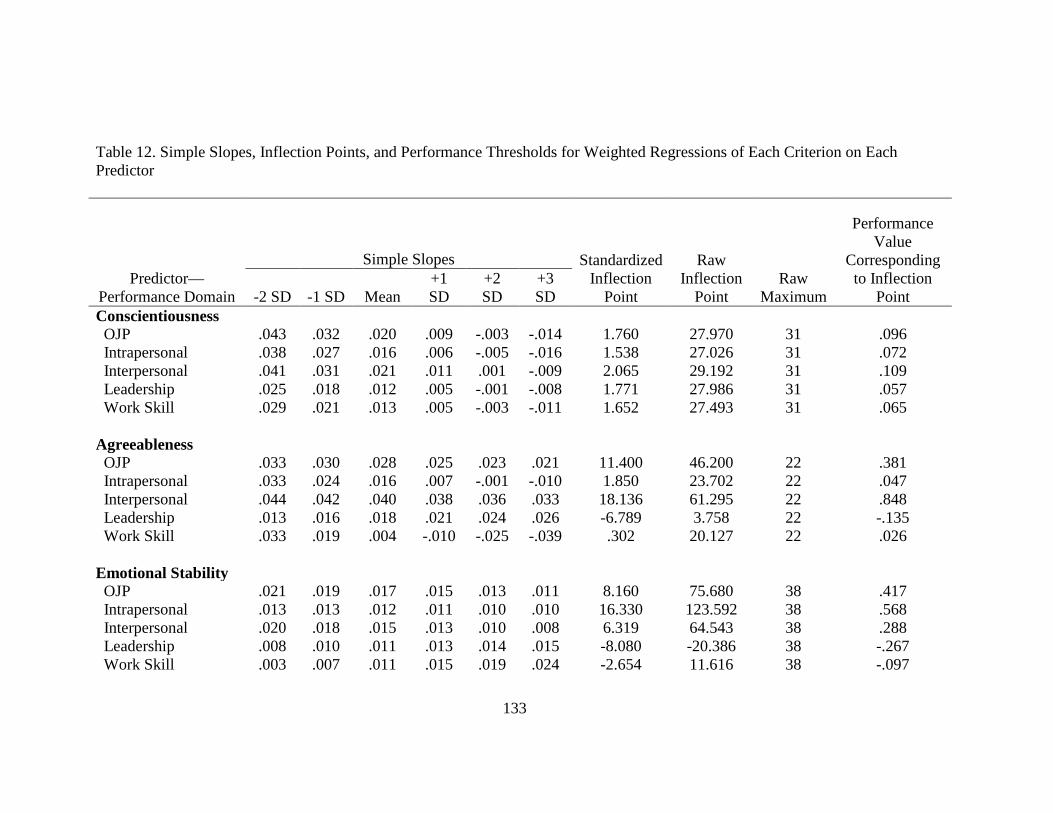
133
Table 12. Simple Slopes, Inflection Points, and Performance Thresholds for Weighted Regressions of Each Criterion on Each Predictor
Predictor—Performance Domain
Simple Slopes Standardized Inflection
Point
Raw Inflection
Point Raw
Maximum
Performance Value
Corresponding to Inflection
Point -2 SD -1 SD Mean +1 SD
+2 SD
+3 SD
Conscientiousness OJP .043 .032 .020 .009 -.003 -.014 1.760 27.970 31 .096 Intrapersonal .038 .027 .016 .006 -.005 -.016 1.538 27.026 31 .072 Interpersonal .041 .031 .021 .011 .001 -.009 2.065 29.192 31 .109 Leadership .025 .018 .012 .005 -.001 -.008 1.771 27.986 31 .057 Work Skill .029 .021 .013 .005 -.003 -.011 1.652 27.493 31 .065 Agreeableness OJP .033 .030 .028 .025 .023 .021 11.400 46.200 22 .381 Intrapersonal .033 .024 .016 .007 -.001 -.010 1.850 23.702 22 .047 Interpersonal .044 .042 .040 .038 .036 .033 18.136 61.295 22 .848 Leadership .013 .016 .018 .021 .024 .026 -6.789 3.758 22 -.135 Work Skill .033 .019 .004 -.010 -.025 -.039 .302 20.127 22 .026 Emotional Stability OJP .021 .019 .017 .015 .013 .011 8.160 75.680 38 .417 Intrapersonal .013 .013 .012 .011 .010 .010 16.330 123.592 38 .568 Interpersonal .020 .018 .015 .013 .010 .008 6.319 64.543 38 .288 Leadership .008 .010 .011 .013 .014 .015 -8.080 -20.386 38 -.267 Work Skill .003 .007 .011 .015 .019 .024 -2.654 11.616 38 -.097
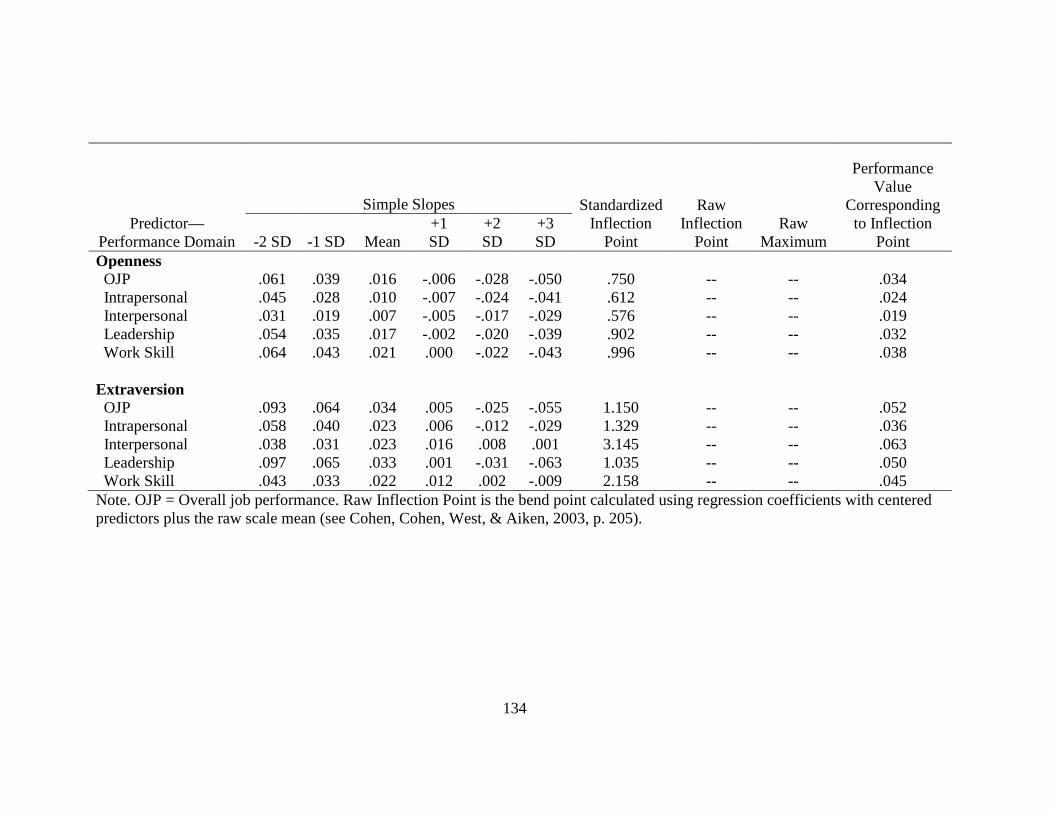
134
Predictor—Performance Domain
Simple Slopes Standardized Inflection
Point
Raw Inflection
Point Raw
Maximum
Performance Value
Corresponding to Inflection
Point -2 SD -1 SD Mean +1 SD
+2 SD
+3 SD
Openness OJP .061 .039 .016 -.006 -.028 -.050 .750 -- -- .034 Intrapersonal .045 .028 .010 -.007 -.024 -.041 .612 -- -- .024 Interpersonal .031 .019 .007 -.005 -.017 -.029 .576 -- -- .019 Leadership .054 .035 .017 -.002 -.020 -.039 .902 -- -- .032 Work Skill .064 .043 .021 .000 -.022 -.043 .996 -- -- .038 Extraversion OJP .093 .064 .034 .005 -.025 -.055 1.150 -- -- .052 Intrapersonal .058 .040 .023 .006 -.012 -.029 1.329 -- -- .036 Interpersonal .038 .031 .023 .016 .008 .001 3.145 -- -- .063 Leadership .097 .065 .033 .001 -.031 -.063 1.035 -- -- .050 Work Skill .043 .033 .022 .012 .002 -.009 2.158 -- -- .045 Note. OJP = Overall job performance. Raw Inflection Point is the bend point calculated using regression coefficients with centered predictors plus the raw scale mean (see Cohen, Cohen, West, & Aiken, 2003, p. 205).
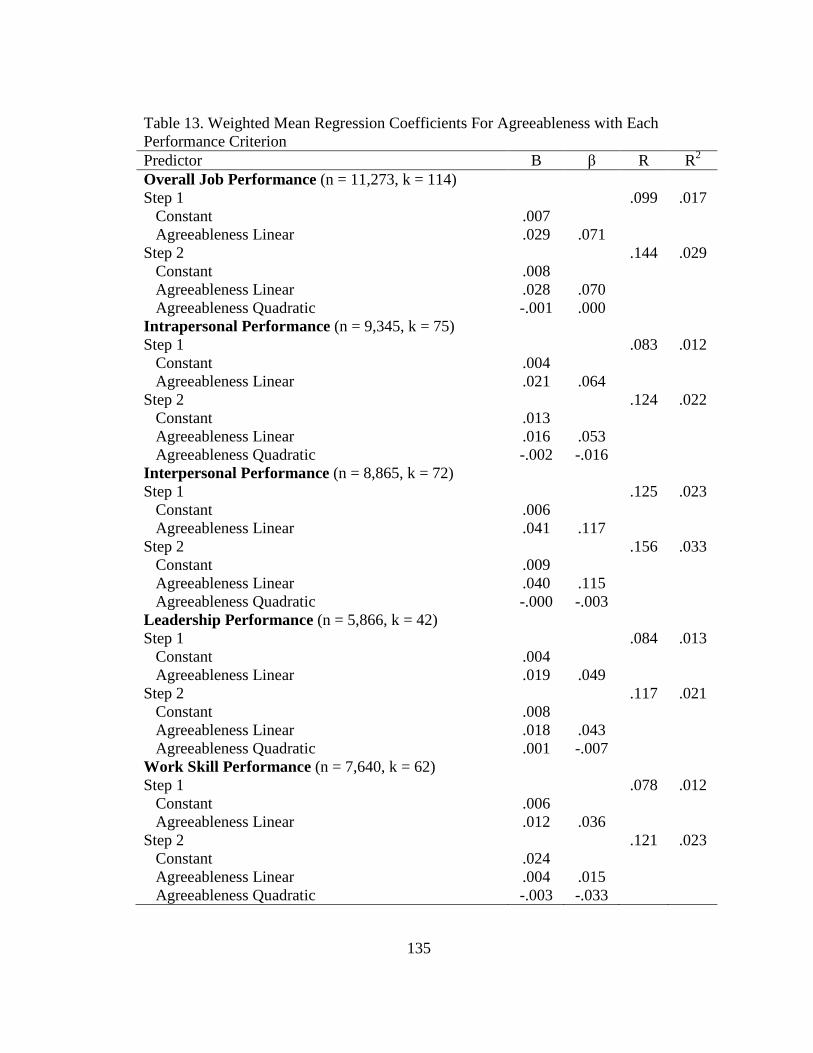
135
Table 13. Weighted Mean Regression Coefficients For Agreeableness with Each Performance Criterion Predictor B β R R2
Overall Job Performance (n = 11,273, k = 114) Step 1 .099 .017 Constant .007 Agreeableness Linear .029 .071 Step 2 .144 .029 Constant .008 Agreeableness Linear .028 .070 Agreeableness Quadratic -.001 .000 Intrapersonal Performance (n = 9,345, k = 75) Step 1 .083 .012 Constant .004 Agreeableness Linear .021 .064 Step 2 .124 .022 Constant .013 Agreeableness Linear .016 .053 Agreeableness Quadratic -.002 -.016 Interpersonal Performance (n = 8,865, k = 72) Step 1 .125 .023 Constant .006 Agreeableness Linear .041 .117 Step 2 .156 .033 Constant .009 Agreeableness Linear .040 .115 Agreeableness Quadratic -.000 -.003 Leadership Performance (n = 5,866, k = 42) Step 1 .084 .013 Constant .004 Agreeableness Linear .019 .049 Step 2 .117 .021 Constant .008 Agreeableness Linear .018 .043 Agreeableness Quadratic .001 -.007 Work Skill Performance (n = 7,640, k = 62) Step 1 .078 .012 Constant .006 Agreeableness Linear .012 .036 Step 2 .121 .023 Constant .024 Agreeableness Linear .004 .015 Agreeableness Quadratic -.003 -.033

136
Table 14. Multilevel Regression Results for Agreeableness and Overall Job Performance Examining the Job Complexity and Work Style Moderators No Moderator
Examined Moderator Variable
Job Complexity
Interpersonal Orientation Work Style
Predictor B Pseudo R2 B Pseudo R2 B Pseudo R2 Agreeableness Step 1 .000 -.001 Intercept .006 .005 Moderator .003 .007 Step 2 .006 .008 .008 Intercept .007 .010 .007 Moderator -- .006 .008 Agreeableness Linear .032* .030* .031* Step 3 .029 .027 .025 Intercept .007 .010 .007 Moderator -- .006 .015 Agreeableness Linear .031* .030* .031* Agreeableness Quadratic .000 .000 .000 Step 4 .027 .026 Intercept .013 .007 Moderator .011 .022 Agreeableness Linear .026* .030* Agreeableness Quadratic -.001 .000 Agreeableness Linear * Moderator -.010 -.010 Agreeableness Quadratic * Moderator -.002 -.002 Note. Criterion for each analysis is overall job performance. B = unstandardized regression coefficient (fixed effect). * = p < .05.
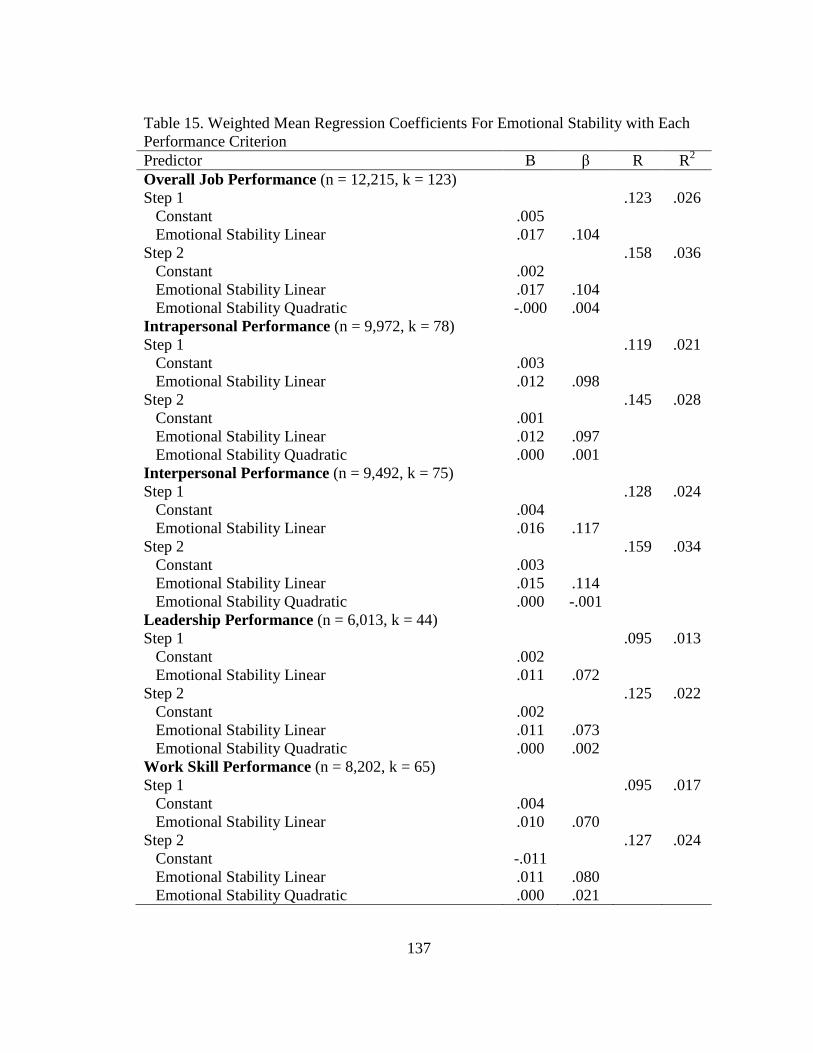
137
Table 15. Weighted Mean Regression Coefficients For Emotional Stability with Each Performance Criterion Predictor B β R R2
Overall Job Performance (n = 12,215, k = 123) Step 1 .123 .026 Constant .005 Emotional Stability Linear .017 .104 Step 2 .158 .036 Constant .002 Emotional Stability Linear .017 .104 Emotional Stability Quadratic -.000 .004 Intrapersonal Performance (n = 9,972, k = 78) Step 1 .119 .021 Constant .003 Emotional Stability Linear .012 .098 Step 2 .145 .028 Constant .001 Emotional Stability Linear .012 .097 Emotional Stability Quadratic .000 .001 Interpersonal Performance (n = 9,492, k = 75) Step 1 .128 .024 Constant .004 Emotional Stability Linear .016 .117 Step 2 .159 .034 Constant .003 Emotional Stability Linear .015 .114 Emotional Stability Quadratic .000 -.001 Leadership Performance (n = 6,013, k = 44) Step 1 .095 .013 Constant .002 Emotional Stability Linear .011 .072 Step 2 .125 .022 Constant .002 Emotional Stability Linear .011 .073 Emotional Stability Quadratic .000 .002 Work Skill Performance (n = 8,202, k = 65) Step 1 .095 .017 Constant .004 Emotional Stability Linear .010 .070 Step 2 .127 .024 Constant -.011 Emotional Stability Linear .011 .080 Emotional Stability Quadratic .000 .021
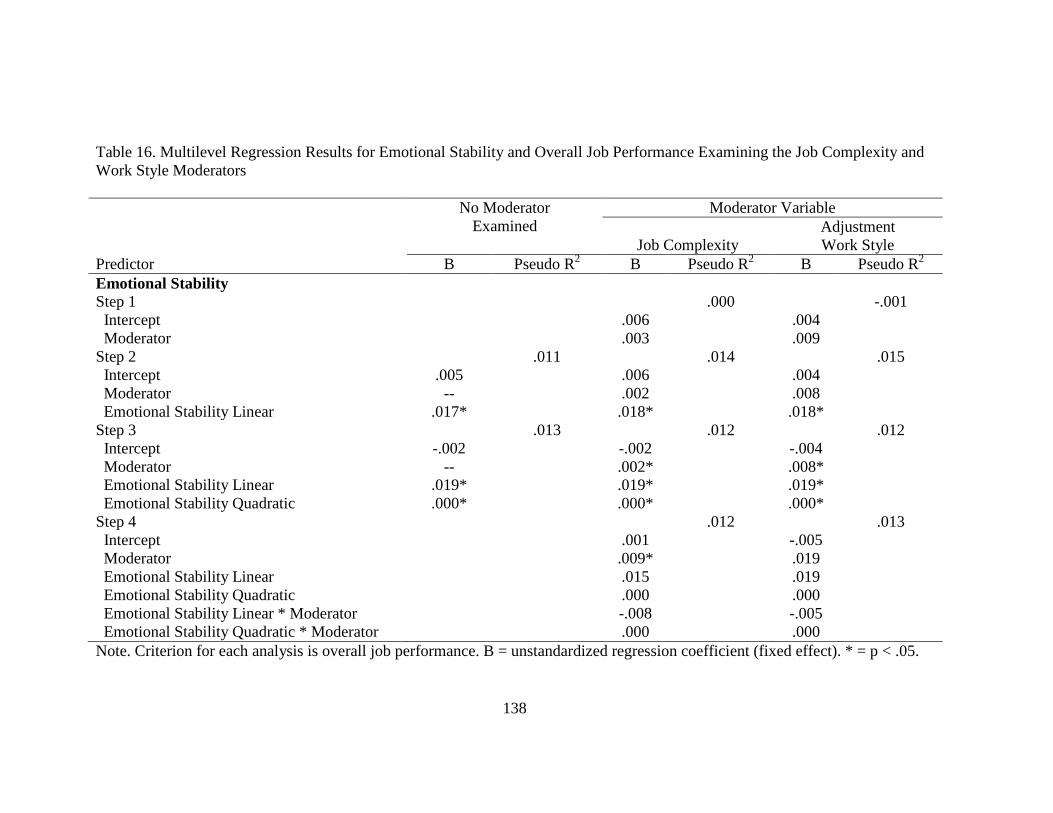
138
Table 16. Multilevel Regression Results for Emotional Stability and Overall Job Performance Examining the Job Complexity and Work Style Moderators No Moderator
Examined Moderator Variable
Job Complexity
Adjustment Work Style
Predictor B Pseudo R2 B Pseudo R2 B Pseudo R2 Emotional Stability Step 1 .000 -.001 Intercept .006 .004 Moderator .003 .009 Step 2 .011 .014 .015 Intercept .005 .006 .004 Moderator -- .002 .008 Emotional Stability Linear .017* .018* .018* Step 3 .013 .012 .012 Intercept -.002 -.002 -.004 Moderator -- .002* .008* Emotional Stability Linear .019* .019* .019* Emotional Stability Quadratic .000* .000* .000* Step 4 .012 .013 Intercept .001 -.005 Moderator .009* .019 Emotional Stability Linear .015 .019 Emotional Stability Quadratic .000 .000 Emotional Stability Linear * Moderator -.008 -.005 Emotional Stability Quadratic * Moderator .000 .000 Note. Criterion for each analysis is overall job performance. B = unstandardized regression coefficient (fixed effect). * = p < .05.
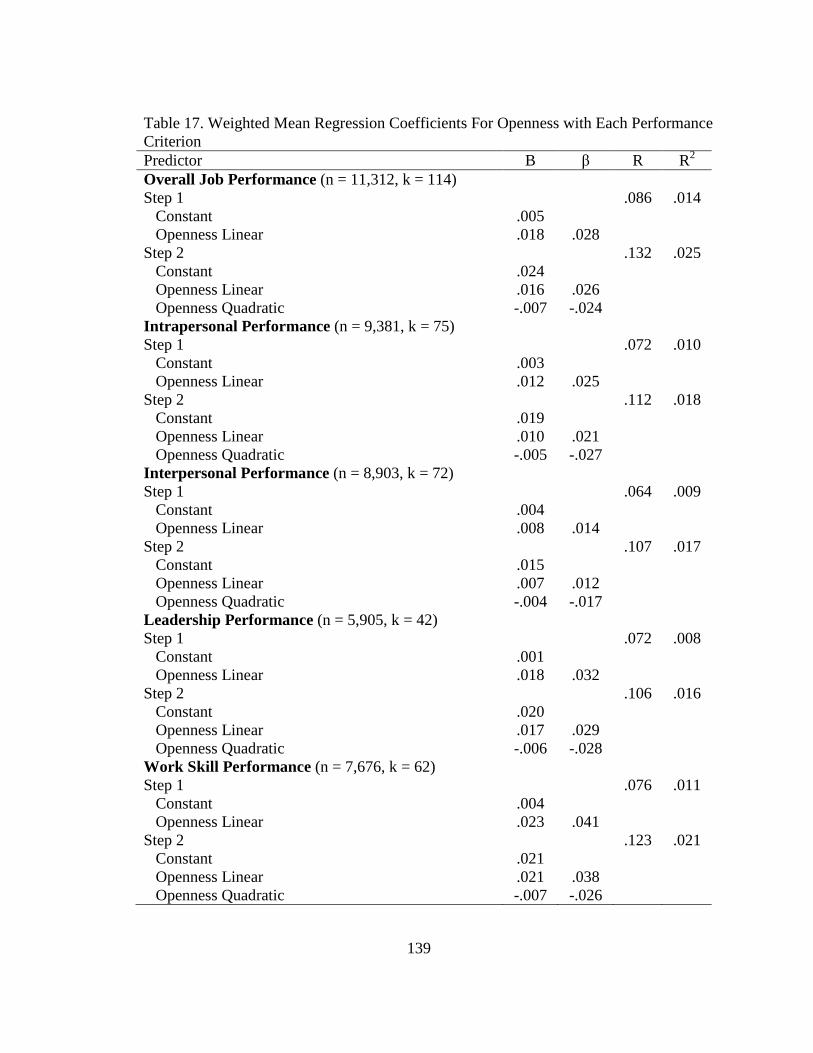
139
Table 17. Weighted Mean Regression Coefficients For Openness with Each Performance Criterion Predictor B β R R2
Overall Job Performance (n = 11,312, k = 114) Step 1 .086 .014 Constant .005 Openness Linear .018 .028 Step 2 .132 .025 Constant .024 Openness Linear .016 .026 Openness Quadratic -.007 -.024 Intrapersonal Performance (n = 9,381, k = 75) Step 1 .072 .010 Constant .003 Openness Linear .012 .025 Step 2 .112 .018 Constant .019 Openness Linear .010 .021 Openness Quadratic -.005 -.027 Interpersonal Performance (n = 8,903, k = 72) Step 1 .064 .009 Constant .004 Openness Linear .008 .014 Step 2 .107 .017 Constant .015 Openness Linear .007 .012 Openness Quadratic -.004 -.017 Leadership Performance (n = 5,905, k = 42) Step 1 .072 .008 Constant .001 Openness Linear .018 .032 Step 2 .106 .016 Constant .020 Openness Linear .017 .029 Openness Quadratic -.006 -.028 Work Skill Performance (n = 7,676, k = 62) Step 1 .076 .011 Constant .004 Openness Linear .023 .041 Step 2 .123 .021 Constant .021 Openness Linear .021 .038 Openness Quadratic -.007 -.026
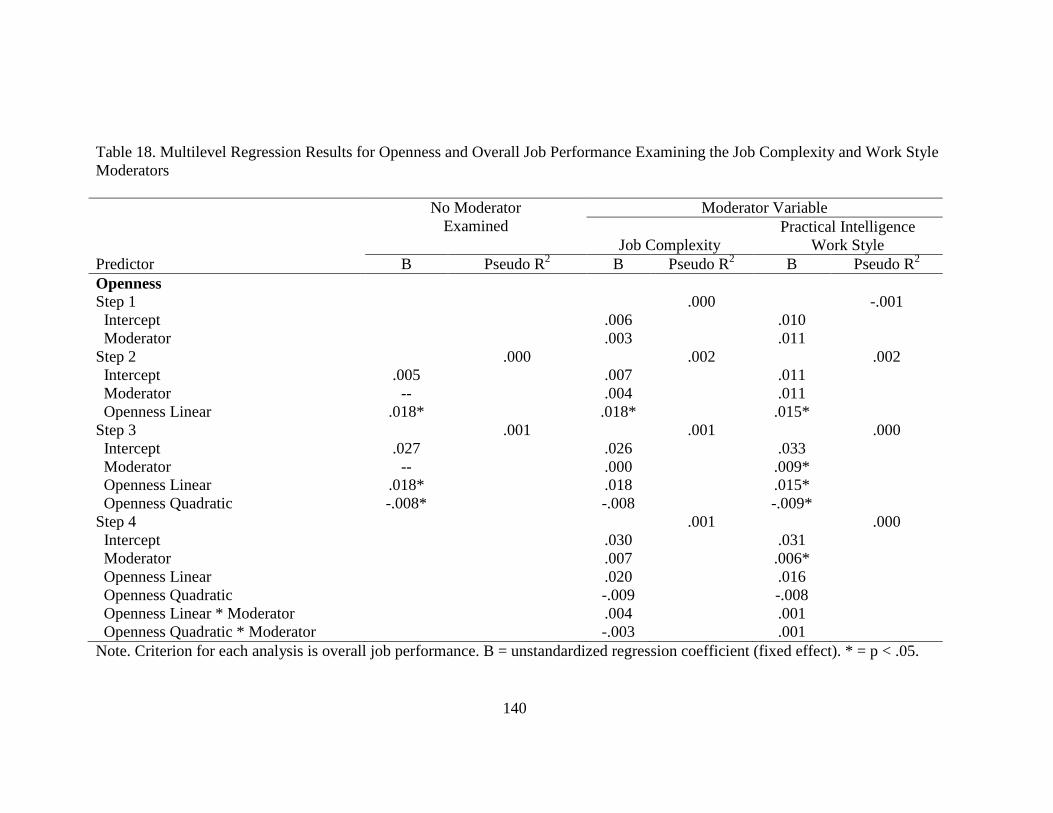
140
Table 18. Multilevel Regression Results for Openness and Overall Job Performance Examining the Job Complexity and Work Style Moderators No Moderator
Examined Moderator Variable
Job Complexity
Practical Intelligence Work Style
Predictor B Pseudo R2 B Pseudo R2 B Pseudo R2 Openness Step 1 .000 -.001 Intercept .006 .010 Moderator .003 .011 Step 2 .000 .002 .002 Intercept .005 .007 .011 Moderator -- .004 .011 Openness Linear .018* .018* .015* Step 3 .001 .001 .000 Intercept .027 .026 .033 Moderator -- .000 .009* Openness Linear .018* .018 .015* Openness Quadratic -.008* -.008 -.009* Step 4 .001 .000 Intercept .030 .031 Moderator .007 .006* Openness Linear .020 .016 Openness Quadratic -.009 -.008 Openness Linear * Moderator .004 .001 Openness Quadratic * Moderator -.003 .001 Note. Criterion for each analysis is overall job performance. B = unstandardized regression coefficient (fixed effect). * = p < .05.

141
Table 19. Weighted Mean Regression Coefficients For Extraversion with Each Performance Criterion Predictor B β R R2
Overall Job Performance (n = 12,212, k = 123) Step 1 .097 .016 Constant .004 Extraversion Linear .040 .057 Step 2 .143 .028 Constant .022 Extraversion Linear .034 .049 Extraversion Quadratic -.010 -.025 Intrapersonal Performance (n = 9,969, k = 78) Step 1 .090 .014 Constant .002 Extraversion Linear .025 .043 Step 2 .130 .024 Constant .013 Extraversion Linear .023 .038 Extraversion Quadratic -.006 -.019 Interpersonal Performance (n = 9,489, k = 75) Step 1 .085 .013 Constant .003 Extraversion Linear .024 .044 Step 2 .130 .024 Constant .008 Extraversion Linear .023 .043 Extraversion Quadratic -.002 -.009 Leadership Performance (n = 6,010, k = 44) Step 1 .100 .017 Constant .001 Extraversion Linear .040 .040 Step 2 .138 .027 Constant .024 Extraversion Linear .033 .060 Extraversion Quadratic -.011 -.037 Work Skill Performance (n = 8,199, k = 65) Step 1 .092 .014 Constant .004 Extraversion Linear .025 .045 Step 2 .130 .025 Constant .008 Extraversion Linear .022 .040 Extraversion Quadratic -.003 -.009
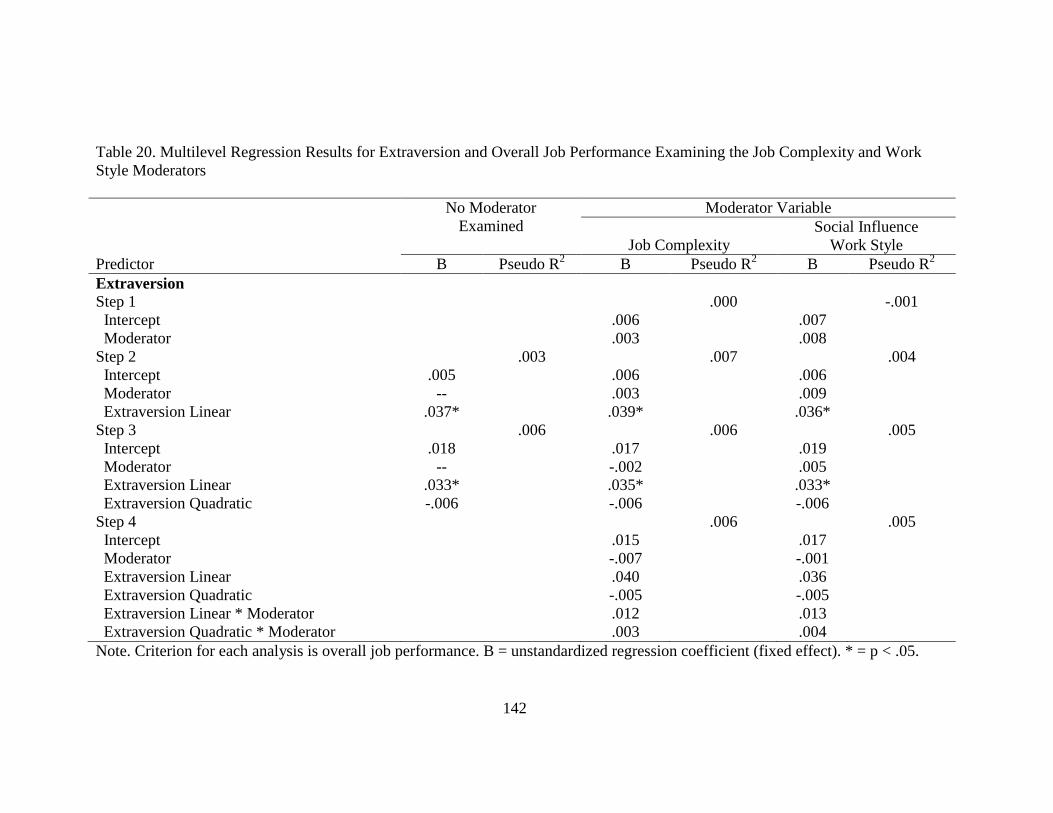
142
Table 20. Multilevel Regression Results for Extraversion and Overall Job Performance Examining the Job Complexity and Work Style Moderators No Moderator
Examined Moderator Variable
Job Complexity
Social Influence Work Style
Predictor B Pseudo R2 B Pseudo R2 B Pseudo R2 Extraversion Step 1 .000 -.001 Intercept .006 .007 Moderator .003 .008 Step 2 .003 .007 .004 Intercept .005 .006 .006 Moderator -- .003 .009 Extraversion Linear .037* .039* .036* Step 3 .006 .006 .005 Intercept .018 .017 .019 Moderator -- -.002 .005 Extraversion Linear .033* .035* .033* Extraversion Quadratic -.006 -.006 -.006 Step 4 .006 .005 Intercept .015 .017 Moderator -.007 -.001 Extraversion Linear .040 .036 Extraversion Quadratic -.005 -.005 Extraversion Linear * Moderator .012 .013 Extraversion Quadratic * Moderator .003 .004 Note. Criterion for each analysis is overall job performance. B = unstandardized regression coefficient (fixed effect). * = p < .05.
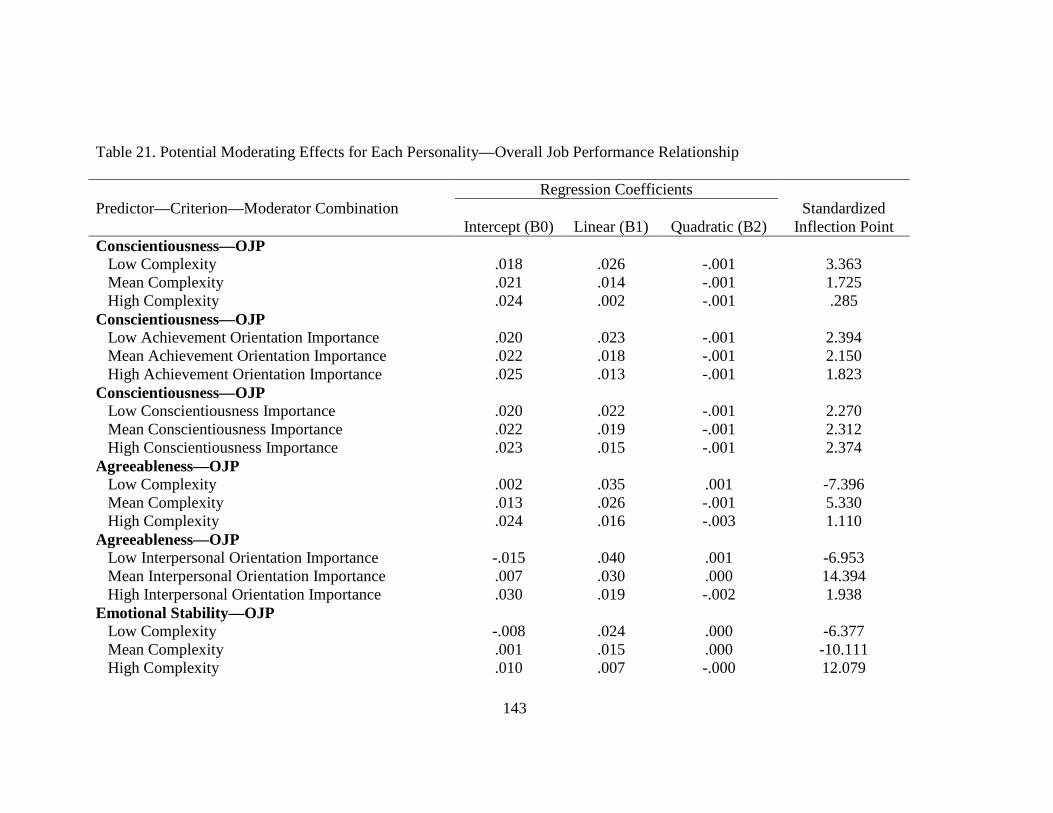
143
Table 21. Potential Moderating Effects for Each Personality—Overall Job Performance Relationship Regression Coefficients Predictor—Criterion—Moderator Combination
Intercept (B0) Linear (B1) Quadratic (B2) Standardized
Inflection Point Conscientiousness—OJP Low Complexity .018 .026 -.001 3.363 Mean Complexity .021 .014 -.001 1.725 High Complexity .024 .002 -.001 .285 Conscientiousness—OJP Low Achievement Orientation Importance .020 .023 -.001 2.394 Mean Achievement Orientation Importance .022 .018 -.001 2.150 High Achievement Orientation Importance .025 .013 -.001 1.823 Conscientiousness—OJP Low Conscientiousness Importance .020 .022 -.001 2.270 Mean Conscientiousness Importance .022 .019 -.001 2.312 High Conscientiousness Importance .023 .015 -.001 2.374 Agreeableness—OJP Low Complexity .002 .035 .001 -7.396 Mean Complexity .013 .026 -.001 5.330 High Complexity .024 .016 -.003 1.110 Agreeableness—OJP Low Interpersonal Orientation Importance -.015 .040 .001 -6.953 Mean Interpersonal Orientation Importance .007 .030 .000 14.394 High Interpersonal Orientation Importance .030 .019 -.002 1.938 Emotional Stability—OJP Low Complexity -.008 .024 .000 -6.377 Mean Complexity .001 .015 .000 -10.111 High Complexity .010 .007 -.000 12.079
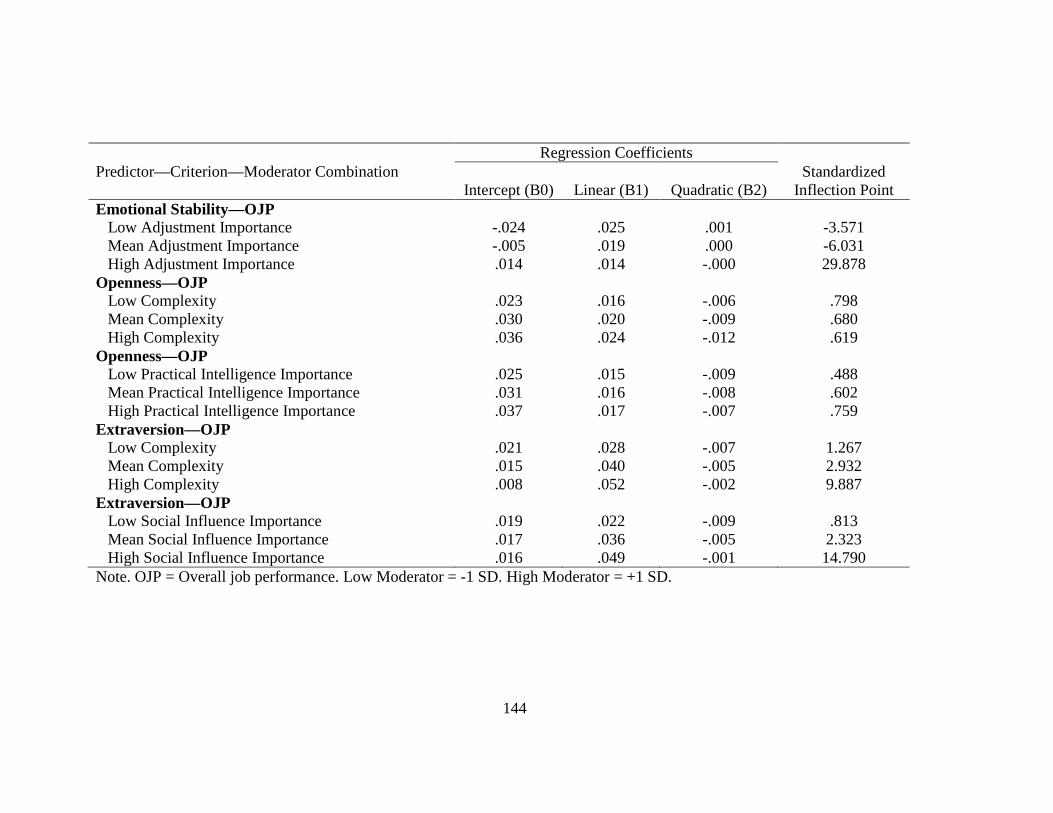
144
Regression Coefficients Predictor—Criterion—Moderator Combination
Intercept (B0) Linear (B1) Quadratic (B2) Standardized
Inflection Point Emotional Stability—OJP Low Adjustment Importance -.024 .025 .001 -3.571 Mean Adjustment Importance -.005 .019 .000 -6.031 High Adjustment Importance .014 .014 -.000 29.878 Openness—OJP Low Complexity .023 .016 -.006 .798 Mean Complexity .030 .020 -.009 .680 High Complexity .036 .024 -.012 .619 Openness—OJP Low Practical Intelligence Importance .025 .015 -.009 .488 Mean Practical Intelligence Importance .031 .016 -.008 .602 High Practical Intelligence Importance .037 .017 -.007 .759 Extraversion—OJP Low Complexity .021 .028 -.007 1.267 Mean Complexity .015 .040 -.005 2.932 High Complexity .008 .052 -.002 9.887 Extraversion—OJP Low Social Influence Importance .019 .022 -.009 .813 Mean Social Influence Importance .017 .036 -.005 2.323 High Social Influence Importance .016 .049 -.001 14.790 Note. OJP = Overall job performance. Low Moderator = -1 SD. High Moderator = +1 SD.
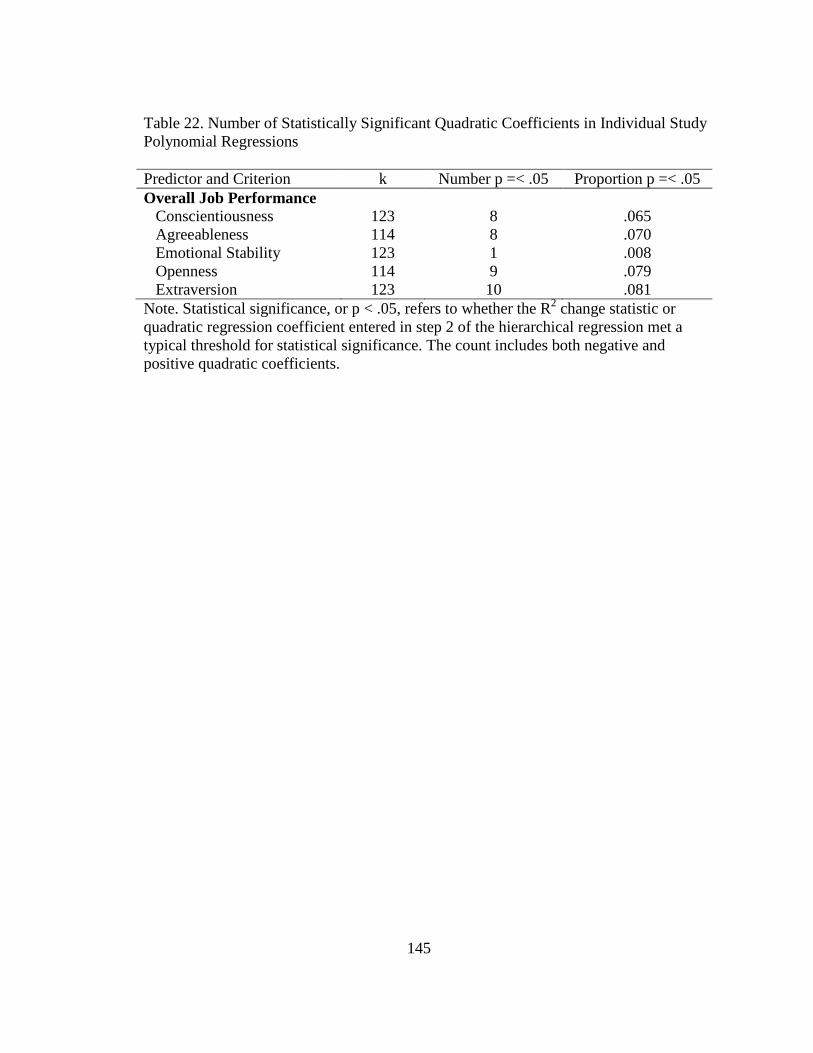
145
Table 22. Number of Statistically Significant Quadratic Coefficients in Individual Study Polynomial Regressions Predictor and Criterion k Number p =< .05 Proportion p =< .05 Overall Job Performance Conscientiousness 123 8 .065 Agreeableness 114 8 .070 Emotional Stability 123 1 .008 Openness 114 9 .079 Extraversion 123 10 .081 Note. Statistical significance, or p < .05, refers to whether the R2 change statistic or quadratic regression coefficient entered in step 2 of the hierarchical regression met a typical threshold for statistical significance. The count includes both negative and positive quadratic coefficients.
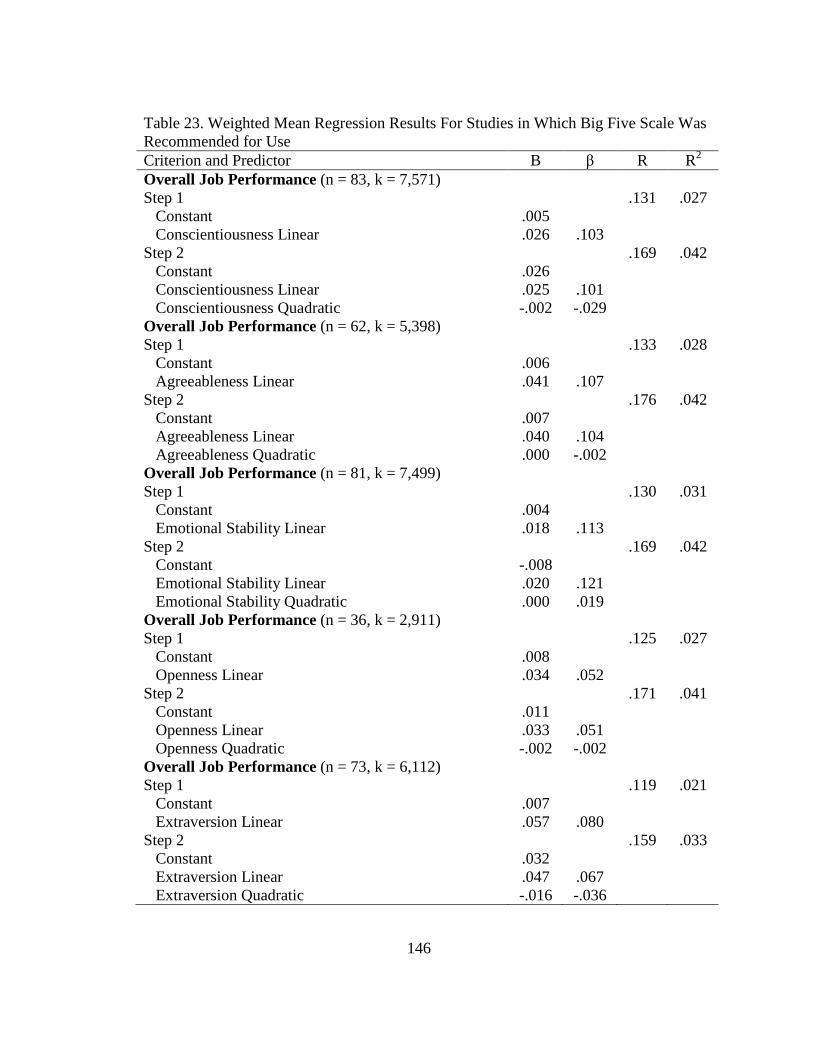
146
Table 23. Weighted Mean Regression Results For Studies in Which Big Five Scale Was Recommended for Use Criterion and Predictor B β R R2
Overall Job Performance (n = 83, k = 7,571) Step 1 .131 .027 Constant .005 Conscientiousness Linear .026 .103 Step 2 .169 .042 Constant .026 Conscientiousness Linear .025 .101 Conscientiousness Quadratic -.002 -.029 Overall Job Performance (n = 62, k = 5,398) Step 1 .133 .028 Constant .006 Agreeableness Linear .041 .107 Step 2 .176 .042 Constant .007 Agreeableness Linear .040 .104 Agreeableness Quadratic .000 -.002 Overall Job Performance (n = 81, k = 7,499) Step 1 .130 .031 Constant .004 Emotional Stability Linear .018 .113 Step 2 .169 .042 Constant -.008 Emotional Stability Linear .020 .121 Emotional Stability Quadratic .000 .019 Overall Job Performance (n = 36, k = 2,911) Step 1 .125 .027 Constant .008 Openness Linear .034 .052 Step 2 .171 .041 Constant .011 Openness Linear .033 .051 Openness Quadratic -.002 -.002 Overall Job Performance (n = 73, k = 6,112) Step 1 .119 .021 Constant .007 Extraversion Linear .057 .080 Step 2 .159 .033 Constant .032 Extraversion Linear .047 .067 Extraversion Quadratic -.016 -.036
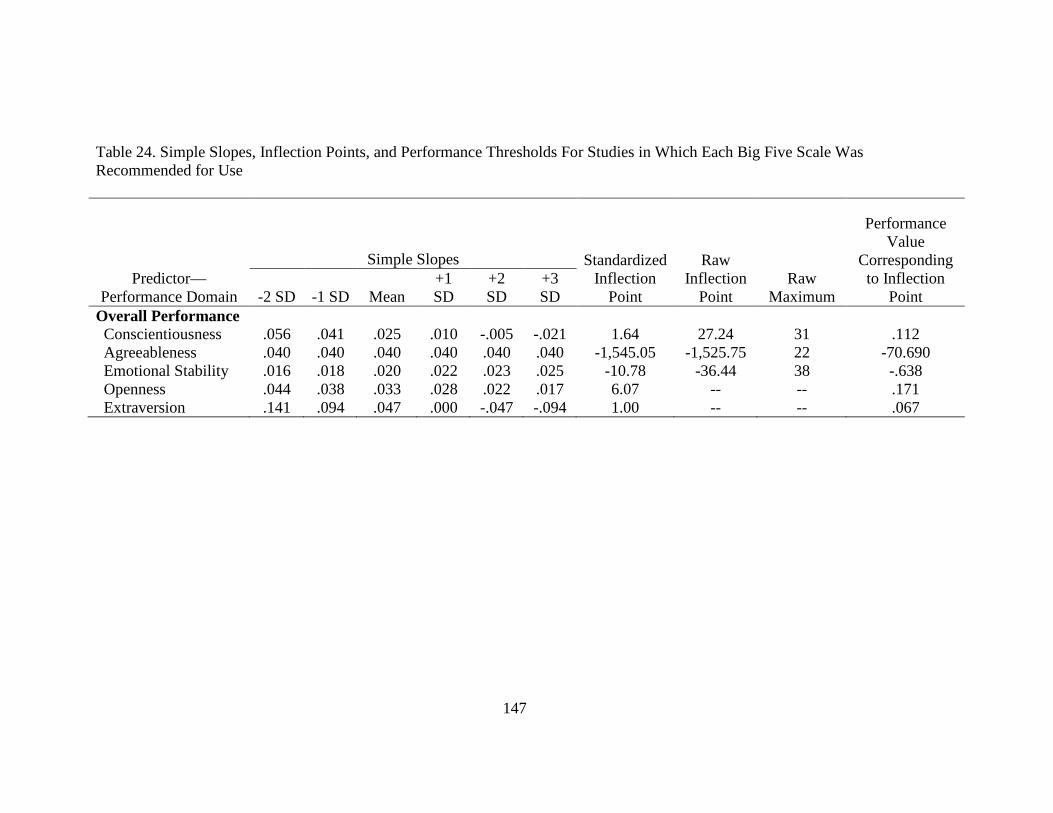
147
Table 24. Simple Slopes, Inflection Points, and Performance Thresholds For Studies in Which Each Big Five Scale Was Recommended for Use
Predictor—Performance Domain
Simple Slopes Standardized Inflection
Point
Raw Inflection
Point Raw
Maximum
Performance Value
Corresponding to Inflection
Point -2 SD -1 SD Mean +1 SD
+2 SD
+3 SD
Overall Performance Conscientiousness .056 .041 .025 .010 -.005 -.021 1.64 27.24 31 .112 Agreeableness .040 .040 .040 .040 .040 .040 -1,545.05 -1,525.75 22 -70.690 Emotional Stability .016 .018 .020 .022 .023 .025 -10.78 -36.44 38 -.638 Openness .044 .038 .033 .028 .022 .017 6.07 -- -- .171 Extraversion .141 .094 .047 .000 -.047 -.094 1.00 -- -- .067

148
Table 25. Weighted Mean Regression Coefficients For Openness and Extraversion Subscales with the Overall Performance Criterion Predictor B β R R2
Openness Overall Job Performance (n = 11,314, k = 114) Step 1 .080 .012 Constant .005 Inquisitive Linear .002 .008 Step 2 .114 .021 Constant .014 Inquisitive Linear .002 .007 Inquisitive Quadratic .000 -.012 Overall Job Performance (n = 11,315, k = 114) Step 1 .092 .014 Constant .006 Learning Approach Linear .013 .041 Step 2 .125 .024 Constant .017 Learning Approach Linear .012 .039 Learning Approach Quadratic -.001 -.014 Extraversion Overall Job Performance (n = 12,216, k = 123) Step 1 .120 .023 Constant .004 Ambition Linear .025 .096 Step 2 .162 .036 Constant -.004 Ambition Linear .028 .109 Ambition Quadratic .000 .018 Overall Job Performance (n = 12,214, k = 123) Step 1 .092 .013 Constant .005 Sociability Linear .000 -.001 Step 2 .129 .023 Constant .016 Sociability Linear .000 -.001 Sociability Quadratic -.001 -.014
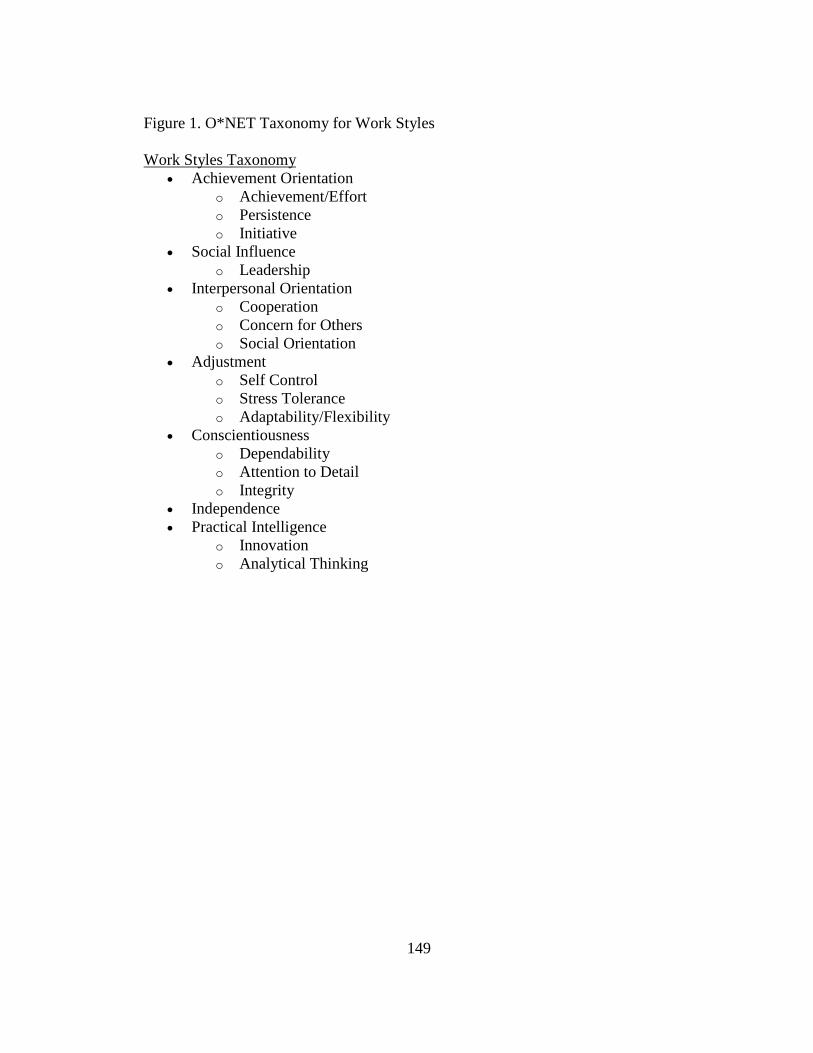
149
Figure 1. O*NET Taxonomy for Work Styles Work Styles Taxonomy
• Achievement Orientation o Achievement/Effort o Persistence o Initiative
• Social Influence o Leadership
• Interpersonal Orientation o Cooperation o Concern for Others o Social Orientation
• Adjustment o Self Control o Stress Tolerance o Adaptability/Flexibility
• Conscientiousness o Dependability o Attention to Detail o Integrity
• Independence • Practical Intelligence
o Innovation o Analytical Thinking
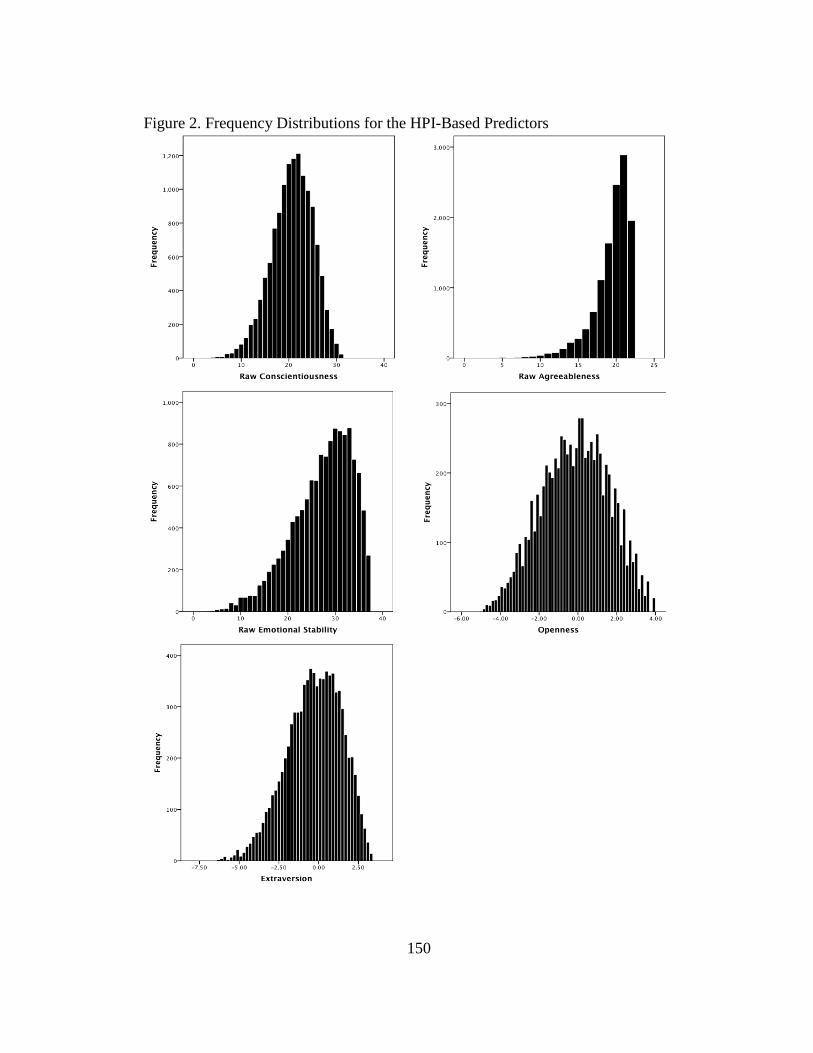
150
Figure 2. Frequency Distributions for the HPI-Based Predictors
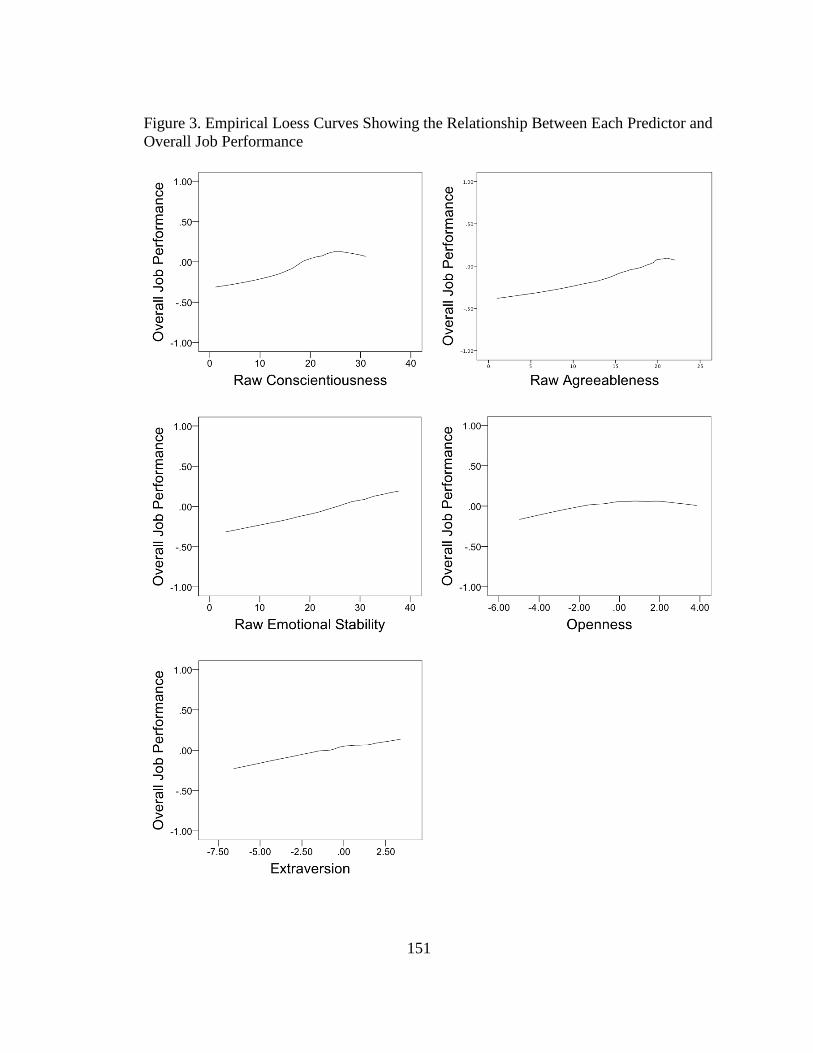
151
Figure 3. Empirical Loess Curves Showing the Relationship Between Each Predictor and Overall Job Performance
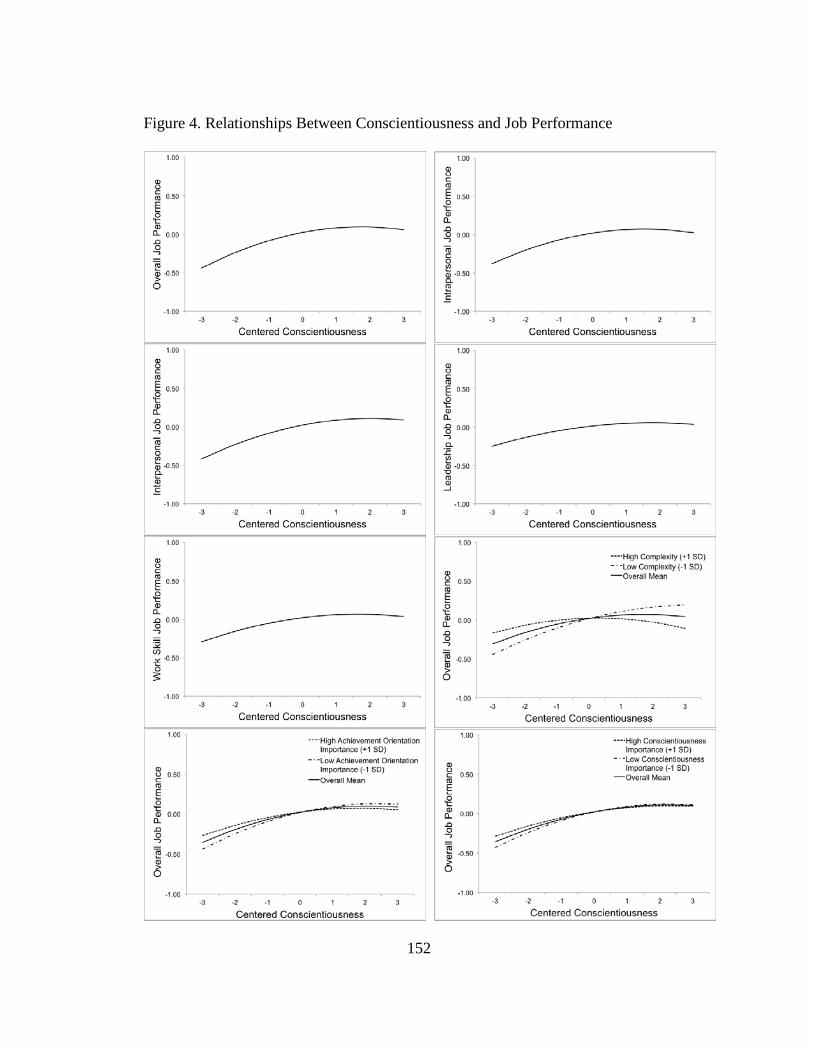
152
Figure 4. Relationships Between Conscientiousness and Job Performance
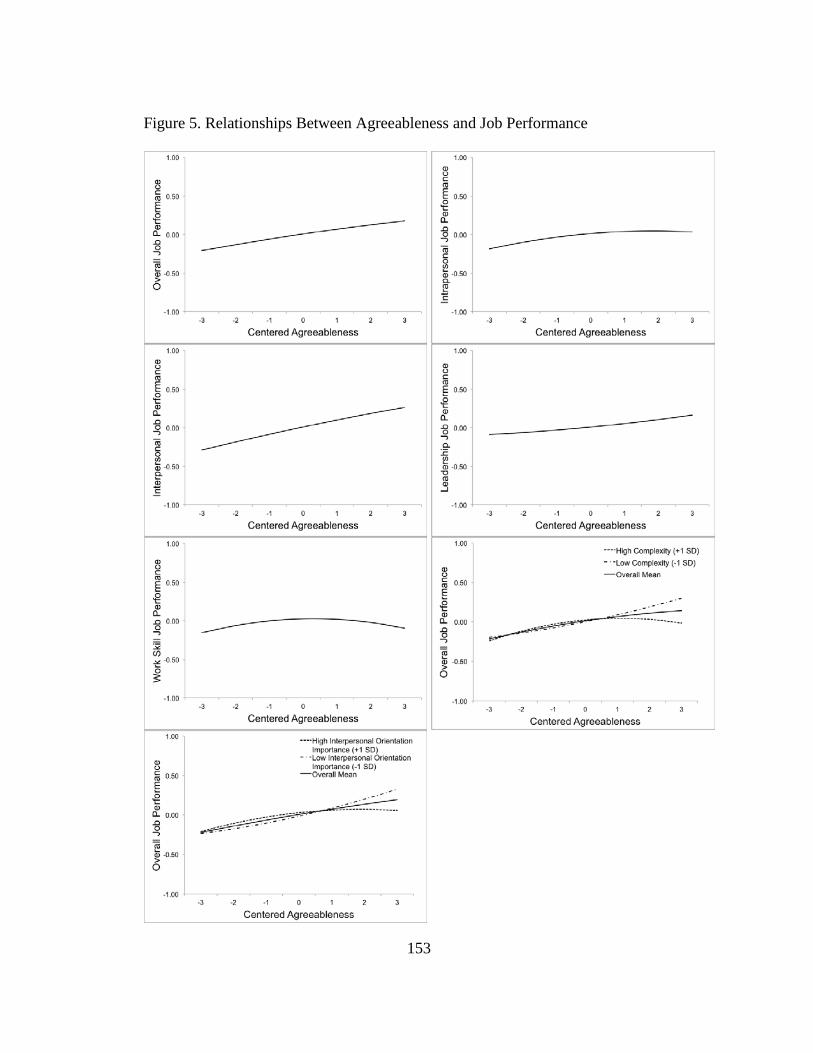
153
Figure 5. Relationships Between Agreeableness and Job Performance
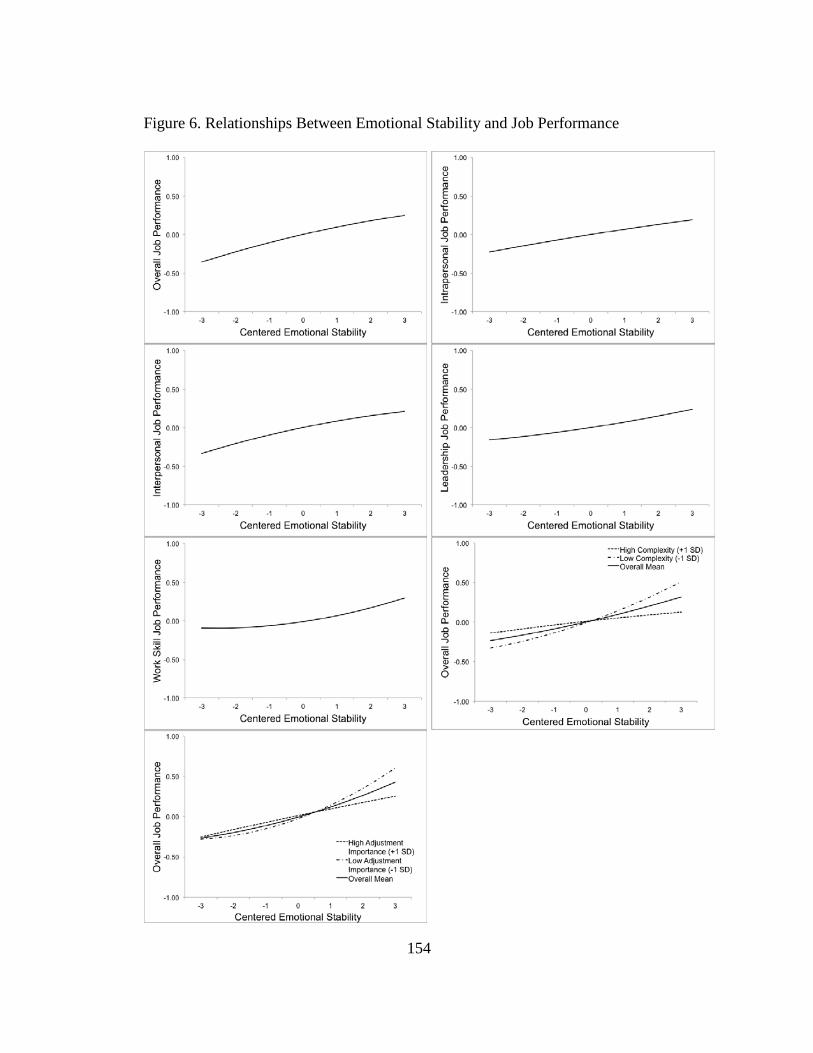
154
Figure 6. Relationships Between Emotional Stability and Job Performance
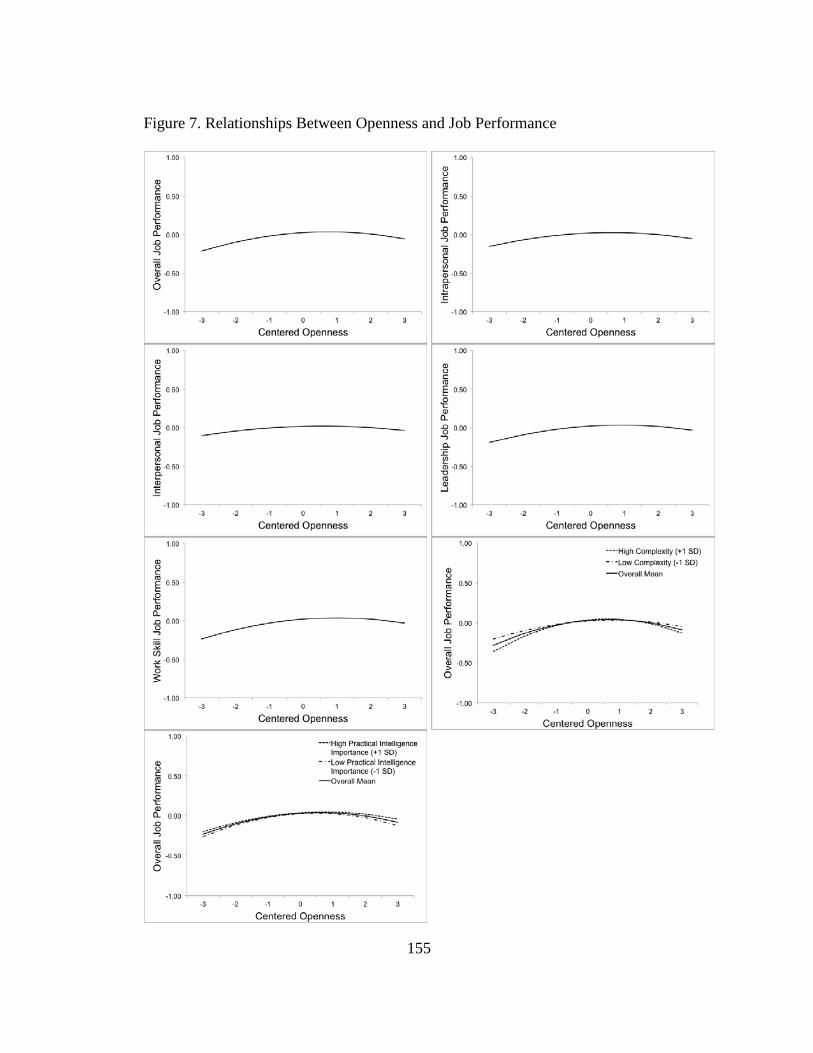
155
Figure 7. Relationships Between Openness and Job Performance
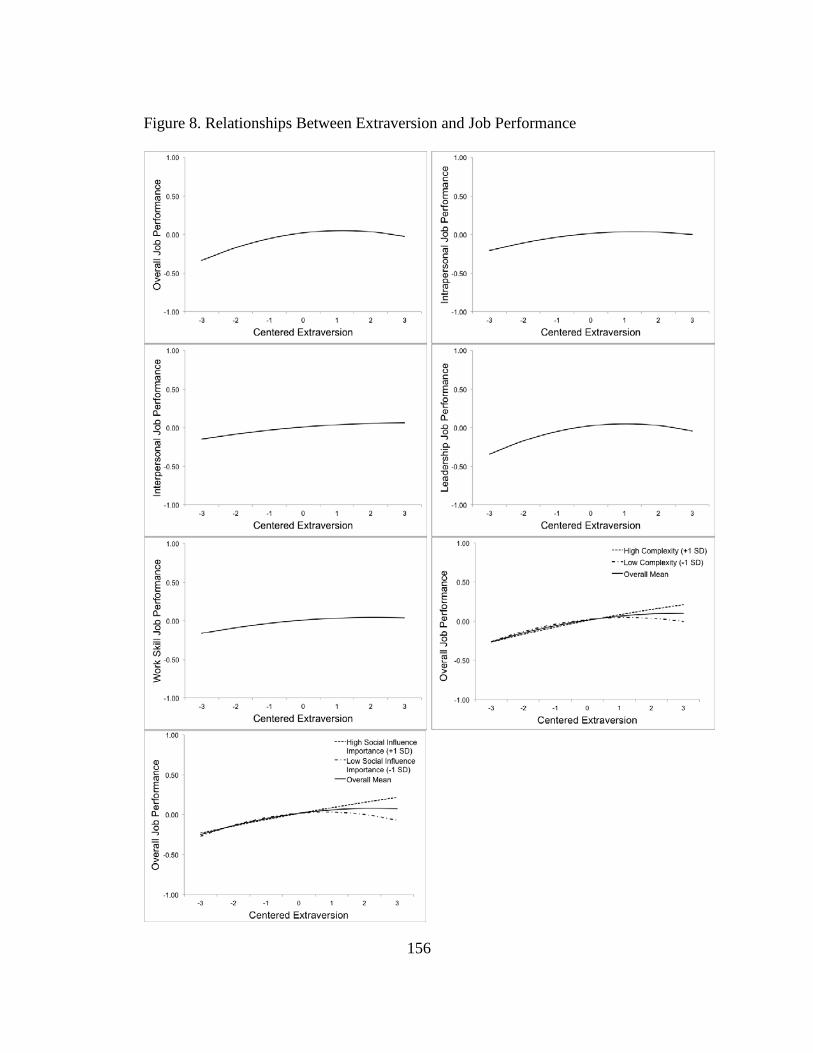
156
Figure 8. Relationships Between Extraversion and Job Performance
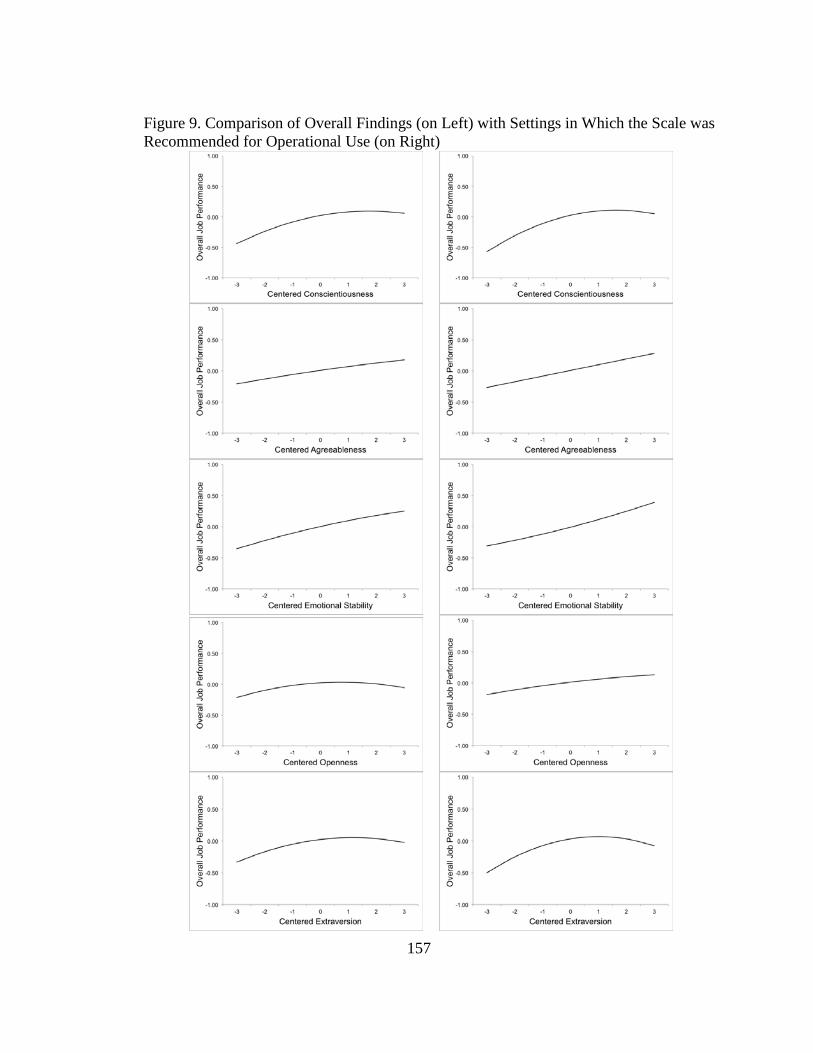
157
Figure 9. Comparison of Overall Findings (on Left) with Settings in Which the Scale was Recommended for Operational Use (on Right)
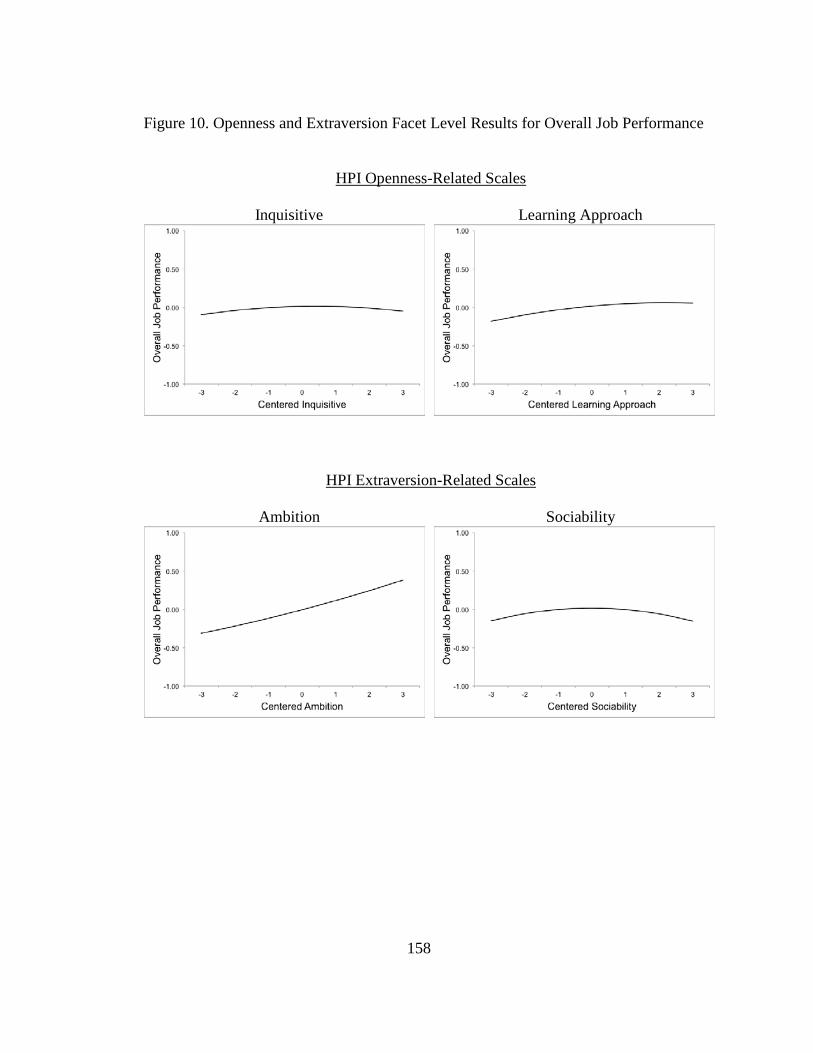
158
Figure 10. Openness and Extraversion Facet Level Results for Overall Job Performance
HPI Openness-Related Scales
Inquisitive Learning Approach
HPI Extraversion-Related Scales
Ambition Sociability
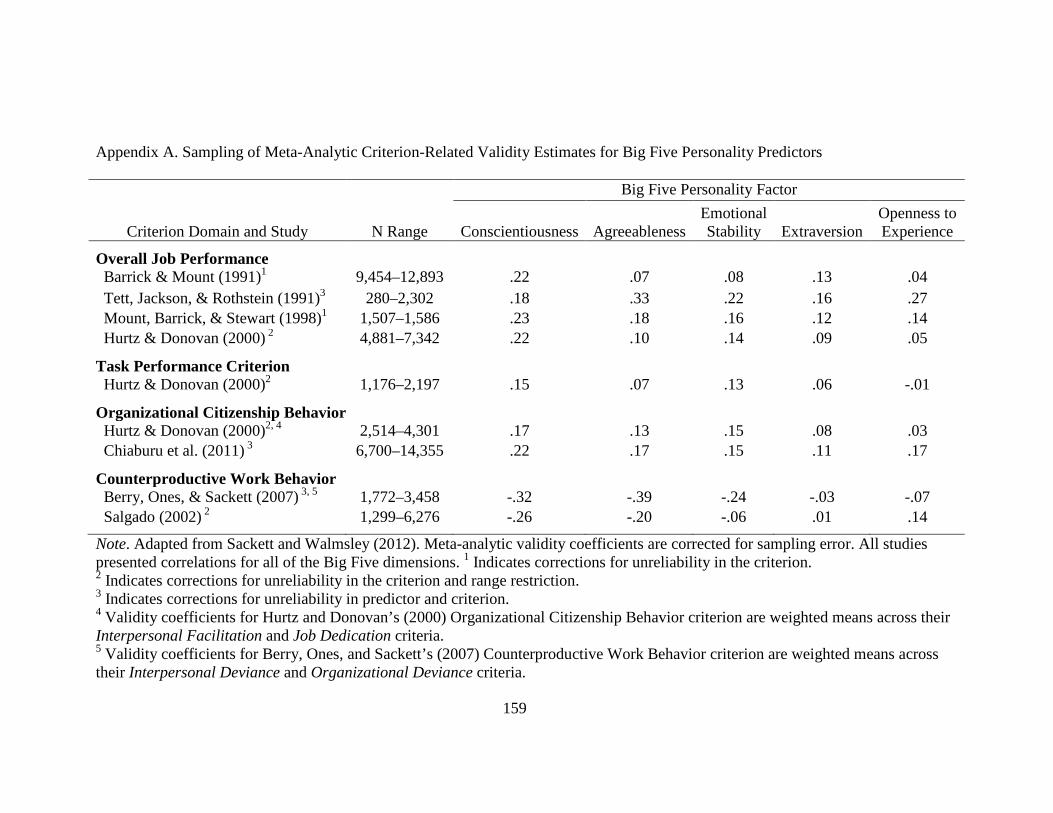
159
Appendix A. Sampling of Meta-Analytic Criterion-Related Validity Estimates for Big Five Personality Predictors Big Five Personality Factor
Criterion Domain and Study N Range Conscientiousness Agreeableness Emotional Stability Extraversion
Openness to Experience
Overall Job Performance Barrick & Mount (1991)1 9,454–12,893 .22 .07 .08 .13 .04 Tett, Jackson, & Rothstein (1991)3 280–2,302 .18 .33 .22 .16 .27 Mount, Barrick, & Stewart (1998)1 1,507–1,586 .23 .18 .16 .12 .14 Hurtz & Donovan (2000) 2 4,881–7,342 .22 .10 .14 .09 .05
Task Performance Criterion
Hurtz & Donovan (2000)2 1,176–2,197 .15 .07 .13 .06 -.01
Organizational Citizenship Behavior Hurtz & Donovan (2000)2, 4 2,514–4,301 .17 .13 .15 .08 .03 Chiaburu et al. (2011) 3 6,700–14,355 .22 .17 .15 .11 .17
Counterproductive Work Behavior Berry, Ones, & Sackett (2007) 3, 5 1,772–3,458 -.32 -.39 -.24 -.03 -.07 Salgado (2002) 2 1,299–6,276 -.26 -.20 -.06 .01 .14
Note. Adapted from Sackett and Walmsley (2012). Meta-analytic validity coefficients are corrected for sampling error. All studies presented correlations for all of the Big Five dimensions. 1 Indicates corrections for unreliability in the criterion. 2 Indicates corrections for unreliability in the criterion and range restriction. 3 Indicates corrections for unreliability in predictor and criterion. 4 Validity coefficients for Hurtz and Donovan’s (2000) Organizational Citizenship Behavior criterion are weighted means across their Interpersonal Facilitation and Job Dedication criteria. 5 Validity coefficients for Berry, Ones, and Sackett’s (2007) Counterproductive Work Behavior criterion are weighted means across their Interpersonal Deviance and Organizational Deviance criteria.