Embed Size (px)
Citation preview
1
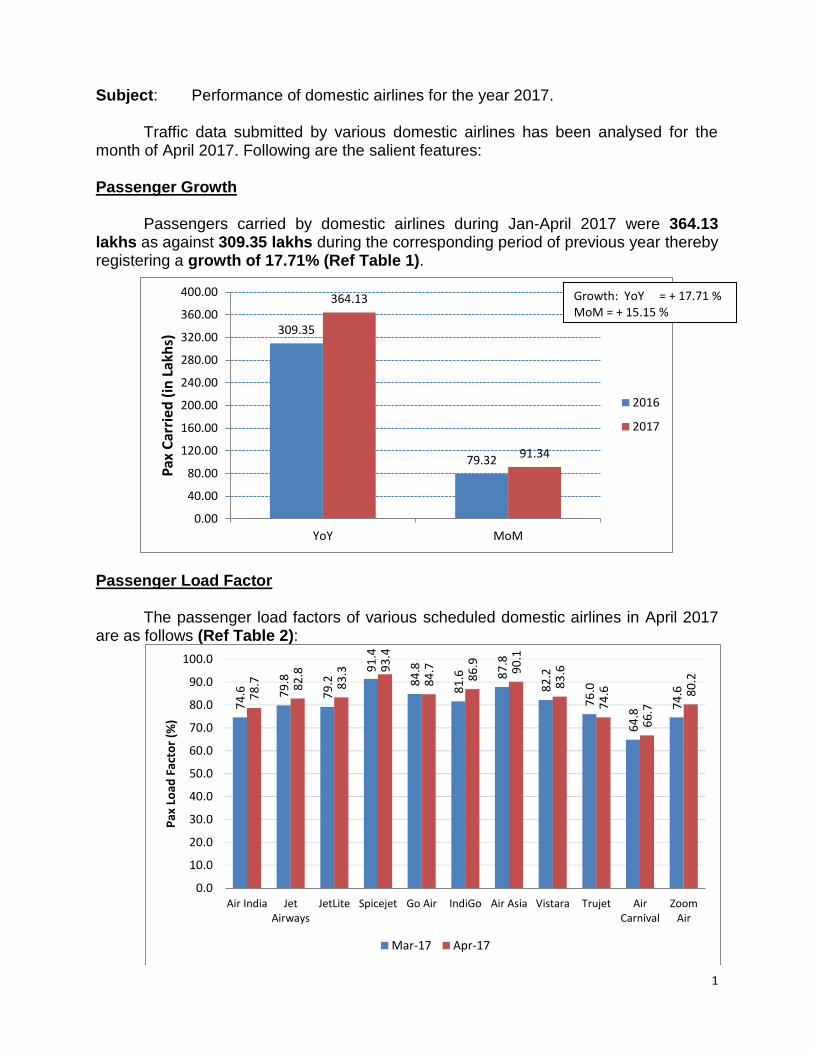
Subject: Performance of domestic airlines for the year 2017. Traffic data submitted by various domestic airlines has been analysed for the month of April 2017. Following are the salient features: Passenger Growth
Passengers carried by domestic airlines during Jan-April 2017 were 364.13
lakhs as against 309.35 lakhs during the corresponding period of previous year thereby registering a growth of 17.71% (Ref Table 1).
Passenger Load Factor
The passenger load factors of various scheduled domestic airlines in April 2017 are as follows (Ref Table 2):
309.35
79.32
364.13
91.34
0.00
40.00
80.00
120.00
160.00
200.00
240.00
280.00
320.00
360.00
400.00
YoY MoM
Pax
Car
ried
(in
Lak
hs)
2016
2017
74
.6 79
.8
79
.2
91
.4
84
.8
81
.6 87
.8
82
.2
76
.0
64
.8
74
.678
.7 82
.8
83
.3 93
.4
84
.7
86
.9 90
.1
83
.6
74
.6
66
.7
80
.2
0.0
10.0
20.0
30.0
40.0
50.0
60.0
70.0
80.0
90.0
100.0
Air India JetAirways
JetLite Spicejet Go Air IndiGo Air Asia Vistara Trujet AirCarnival
ZoomAir
Pax
Lo
ad F
acto
r (%
)
Mar-17 Apr-17
Growth: YoY = + 17.71 % MoM = + 15.15 % 8 %

2
The passenger load factor in the month of Apr 2017 has shown increasing trend
compared to previous month primarily due to beginning of tourist season.
Cancellations
The overall cancellation rate of scheduled domestic airlines for the month of April 2017 has been 0.43%.Airline-wise details of cancellations are as follows:
Various reasons of cancellations are indicated below:
0.00
0.19
0.35
0.38
0.43
0.43
0.49
0.64
0.73
0.88
58.00
0.00 10.00 20.00 30.00 40.00 50.00 60.00 70.00
Zoom Air
IndiGo
Vistara
Spicejet
Air Asia
Jet Airways
JetLite
Go Air
Air India
Trujet
Air Carnival
Cancellation Rate (%)
Technical 27.1%
Operational 0.3%
Weather 22.6%Commercial 5.5%
Conse/Misc44.5%

3
Passenger Complaints during the month
During April 2017, a total of 643 passenger related complaints had been received by the scheduled domestic airlines. The number of complaints per 10,000 passengers carried for the month of April 2017 has beenaround 0.70. The airline-wise details are as follows:
Various reasons of passenger complaints are indicated below:
0.0
0.0
0.1
0.2
0.4
0.5
0.6
0.7
1.3
1.9
0.0 0.5 1.0 1.5 2.0 2.5
Air Carnival
Zoom Air
Vistara
IndiGo
Trujet
Spicejet
Air Asia
Go Air
Jet Airways+Jetlite
Air India (dom)
No. of Complaints/10,000 Pax
Fare 2.0% Refund
6.2%
Flight Problem22.4%
Baggage28.0%
Customer Service25.7%
Disability0.8%
Staff Behaviour8.7%
Catering0.3%
Others5.9%

4
The reason for complaint as percentage compared to the previous month is as follows:
Airline-wise status of redressal of complaints is given at Table – 4. Compliance of Route Dispersal Guidelines Airline-wise Compliance of Route Dispersal Guidelines during the month of Apr 2017 is given in the following table. Zoom Air did not operated in CAT I routes for the month of April 2017.
Airline ASKM Deployment (%) of Category I
Cat III Cat IIA Cat II
Air India + Alliance Air 135.1 1.90 28.7
Jet Airways + JetLite 74.2 1.38 16.7
Spicejet 130.3 1.73 44.5
Go Air 199.3 1.99 75.7
IndiGo 174.4 1.28 27.6
Vistara 59.7 1.01 22.4
Air Asia 1263.6 16.27 480.0
Zoom Air - - -
Minimum Capacity Requirement in accordance with RDG (As % of Capacity Deployed in Category I)
Category II - 10%
Category IIA - 1%
Category III - 50%
2.2
4.8
31
.9
26
.5
19
.1
1.6
7.8
0.1
5.9
2.2
6.5
30
.9
24
.4
20
.4
0.6
8.7
0.4
5.9
2.0
6.2
22
.4
28
.0
25
.7
0.8
8.7
0.3
5.9
0.0
5.0
10.0
15.0
20.0
25.0
30.0
35.0
40.0
Fare Refund FlightProblem
Baggage CustomerService
Disability StaffBehaviour
Catering Others
Feb-17 Mar-17 Apr-17

5
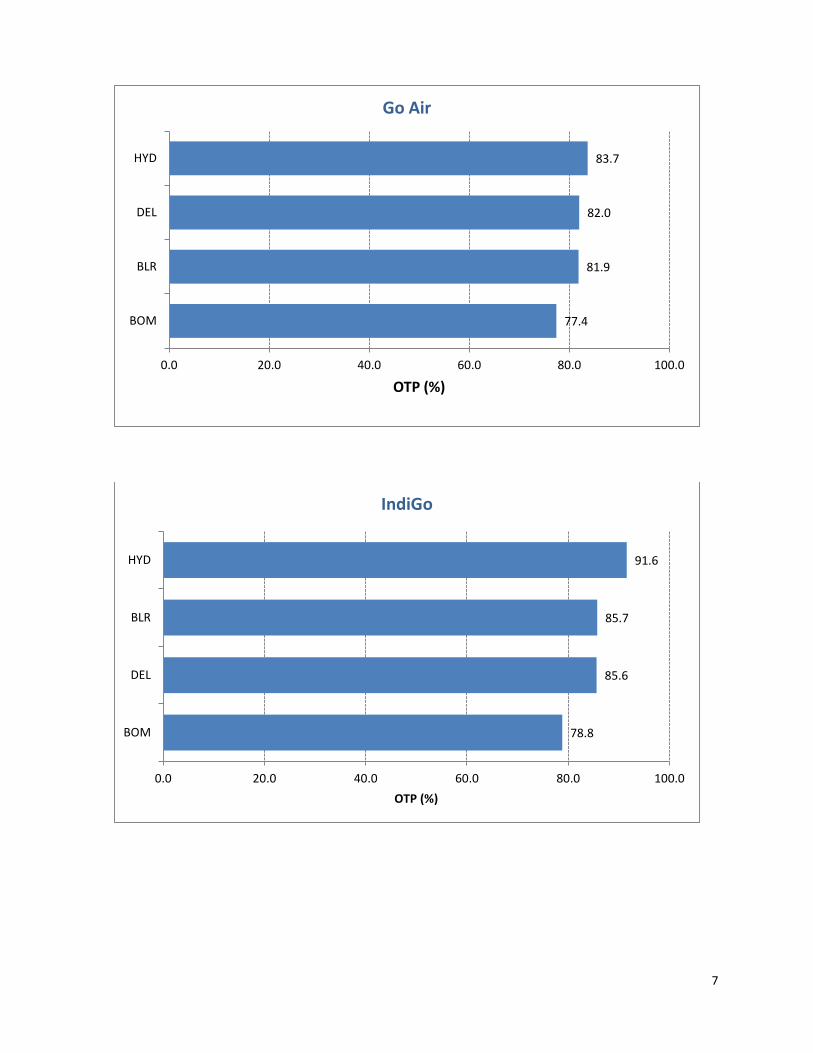
On-Time Performance (Scheduled Domestic Airlines)
On-Time Performance (OTP) of scheduled domestic airlines has been computed for four metro airports viz. Bangalore, Delhi, Hyderabad and Mumbai. Airline-wise OTP at four metro airports for the month of April 2017is as follows:
Airport-wise On-Time Performance of scheduled domestic airlines complying with
Route Dispersal Guidelines is as follows:
78.7
80.4
83.9
85.2
85.4
87.4
0.0 20.0 40.0 60.0 80.0 100.0
Jet Airways+JetLite
Go Air
Air India (Dom)
IndiGo
Spicejet
Vistara
OTP (%)
OTP at Four Metro Airports
78.9
84.6
88.6
93.6
0.0 20.0 40.0 60.0 80.0 100.0
BOM
DEL
HYD
BLR
OTP (%)
Air India (Domestic)

6
74.3
78.1
85.4
89.1
0.0 20.0 40.0 60.0 80.0 100.0
BOM
DEL
HYD
BLR
OTP (%)
Jet Airways + JetLite
76.0
82.6
88.0
90.6
0.0 20.0 40.0 60.0 80.0 100.0
BLR
BOM
DEL
HYD
OTP (%)
Spicejet
7
77.4
81.9
82.0
83.7
0.0 20.0 40.0 60.0 80.0 100.0
BOM
BLR
DEL
HYD
OTP (%)
Go Air
78.8
85.6
85.7
91.6
0.0 20.0 40.0 60.0 80.0 100.0
BOM
DEL
BLR
HYD
OTP (%)
IndiGo

8
Reasons for delay have been analysed, which are presented below. It has been found that majority of delays have been attributed to ‘Reactionary’.
81.7
88.6
88.7
90.5
0.0 20.0 40.0 60.0 80.0 100.0
BOM
BLR
DEL
HYD
OTP (%)
Vistara
Pax 2%
Ramp 2%
Tech 4%
Ops 4%
Reactionary 65%
Airport 7% Wx 1%
ATC 15%Misc 0%

9
Revenue Earned& Seats Sold in Highest Fare Bucket
The revenue earned and the number of seats sold by scheduled private airlines
in the highest fare bucket on select 20 sectorsis as follows:
Jet Airways
0.2
%
0.2
%
0.2
%
0.2
%
0.3
% 0.5
%
0.2
%
0.2
%
0.0
%
0.1
%
0.0
%
0.1
%
0.2
%
0.2
% 0.4
%
0.1
%
0.6
%
0.4
%
0.1
%
0.7
%
0.4
% 0.6
%
0.3
%
0.3
%
0.5
%
0.3
%
0.2
%
0.1
%
0.1
%
0.0
% 0.3
%
0.2
%
0.1
% 0.4
%
0.6
% 0.8
%
0.3
%
0.3
%
0.0%
1.0%
2.0%
3.0%
4.0%
5.0%
% of Seats Sold in Highest fare bucket
Mar-17 Apr-17
0.4
8%
0.7
3%
0.7
6%
0.3
1% 0.6
8%
2.0
7%
0.5
3%
0.4
7%
0.2
3%
0.8
7%
0.0
0%
0.2
9% 0.6
6%
0.5
6% 1
.08
%
0.1
6%
2.2
8%
1.3
4%
0.6
8%1
.21
%
0.6
4%
1.5
5%
0.5
0%
0.7
5%
1.4
8%
0.6
9%
0.2
8%
0.4
2% 0.8
5%
0.0
9%
1.0
3%
0.7
8%
0.4
2% 0.7
6%
0.6
4%
2.4
2%
0.6
5%
0.5
0%
0.0%
1.0%
2.0%
3.0%
4.0%
5.0%
% of Revenue Earned in Highest fare bucket
Mar-17 Apr-17

10
Indigo
0.5
0%
0.0
2%
0.1
5%
0.0
2%
0.0
5%
0.2
1%
0.0
6%
0.0
0%
0.0
0%
0.0
0%
0.0
0%
0.0
7%
0.0
0%
0.0
1%
0.0
0%
0.2
1%
0.0
5%
2.0
1%
0.0
8%
0.8
2%
0.2
1%
0.2
4%
0.4
2%
0.0
2%
0.0
0%
0.0
0%
0.0
4%
0.0
1%
0.7
7%
0.0
6%
0.1
0%
0.0
5%
0.1
2%
0.0
0%
0.0%
1.0%
2.0%
3.0%
4.0%
5.0%
% of Seats Sold in Highest fare bucket
Mar-17 Apr-17
2.3
0%
0.0
6% 0.7
8%
0.0
8%
0.2
4% 1
.22
%
0.3
7%
0.0
0%
0.0
0%
0.0
2%
0.0
1%
0.5
6%
0.0
0%
0.0
6%
0.0
2% 1
.07
%
0.3
4%
6.9
2%
0.3
2%
3.7
2%
0.8
8%
1.2
5% 2
.10
%
0.1
2%
0.0
0%
0.0
2%
0.1
4%
0.0
4%
3.8
3%
0.2
5%
0.5
8%
0.2
5%
0.5
9%
0.0
2%
0.0%
2.0%
4.0%
6.0%
8.0%
10.0%
% of Revenue Earned in Highest fare bucket
Mar-17 Apr-17

11
Go Air
1.3
5%
1.2
3%
0.3
7%
0.0
1%
0.0
0%
0.0
0%
0.0
0%
0.0
0%
0.0
0%
0.0
2%
0.0
2%
0.0
0%
0.0
0%
0.0
5%
0.0
0%
3.7
7%
3.4
6%
0.7
5%
0.0
0%
0.0
6%
0.0
9%
0.0
1%
0.0
0%
0.0
7%
0.0
2% 0.7
3%
0.0
0%
0.0
0%
0.2
4%
0.0
0%
0.0%
2.0%
4.0%
6.0%
8.0%
10.0%
% of Seats Sold in Highest fare bucket
Mar-17 Apr-17
5.1
5%
4.0
6%
1.4
0%
0.1
0%
0.0
0%
0.0
0%
0.0
0%
0.0
0%
0.0
0%
0.0
7%
0.1
1%
0.0
0%
0.0
0%
0.1
9%
0.0
0%
11
.49
%
10
.50
%
3.0
6%
0.0
3%
0.2
2%
0.3
3%
0.0
6%
0.0
0%
0.3
0%
0.0
3%
3.3
6%
0.0
0%
0.0
0% 1.1
6%
0.0
0%
0.0%
3.0%
6.0%
9.0%
12.0%
15.0%
% of Revenue Earned in Highest fare bucket
Mar-17 Apr-17

12
Spicejet
1.1
7%
0.0
0%
0.2
1%
0.0
1%
0.1
3%
0.1
6%
0.0
3%
0.0
0%
0.0
1%
0.0
0%
0.0
0%
0.0
0%
0.0
3%
0.0
2%
0.0
3%
0.0
2%
0.0
1%
2.1
2%
0.0
7%
0.7
3%
0.0
9%
0.6
1%
0.2
3%
0.1
0%
0.0
0%
0.0
6%
0.0
4%
0.0
0%
0.0
7%
0.3
4%
0.4
9%
0.0
0%
0.1
9%
0.4
3%
0.0%
1.0%
2.0%
3.0%
4.0%
5.0%
% of Seats Sold in Highest fare bucket
Mar-17 Apr-17
5.4
7%
0.0
0%
1.1
2%
0.0
4% 0.7
5%
1.0
6%
0.1
6%
0.0
2%
0.0
5%
0.0
0%
0.0
0%
0.0
0%
0.2
1%
0.1
2%
0.1
9%
0.1
4%
0.1
1%
7.8
9%
0.3
2%
3.1
8%
0.4
2%
3.1
6%
1.2
2%
0.5
5%
0.0
0%
0.4
6%
0.2
2%
0.0
0%
0.4
1%
1.8
9%
2.2
0%
0.0
0%
1.0
3%
2.6
2%
0.0%
2.0%
4.0%
6.0%
8.0%
10.0%
% of Revenue Earned in Highest fare bucket
Mar-17 Apr-17

13
Vistara
0.0
0%
0.2
4%
0.3
2%
0.0
8%
0.0
0%
0.0
3%
0.0
3%
0.0
1%
0.0
0%
0.0
6%
0.0
0%
0.0
0%
1.0
4%
0.5
8%
0.0
9%
0.3
0%
0.2
5%
0.0
7%
0.0
8%
0.0
4%
0.1
0%
5.6
6%
0.0%
1.0%
2.0%
3.0%
4.0%
5.0%
6.0%
7.0%
8.0%
9.0%
10.0%
BLR-BOM BLR-DEL BOM-DEL CCU-DEL DEL-GAU DEL-HYD DEL-SXR BLR-CCU CCU-GAU CCU-IXZ DEL-IXL
% of Seats Sold in Highest fare bucket
Mar-17 Apr-17
0.0
0%
1.2
5%
1.4
3%
0.3
7%
0.0
0%
0.1
1%
0.0
2%
0.0
3%
0.0
0%
0.2
5%
0.0
0%
0.0
0%
5.0
0%
2.4
3%
0.1
0% 1.7
4%
1.1
1%
0.0
5%
0.3
9%
0.2
8%
0.1
8%
19
.16
%
0.0%
2.0%
4.0%
6.0%
8.0%
10.0%
12.0%
14.0%
16.0%
18.0%
20.0%
22.0%
24.0%
BLR-BOM BLR-DEL BOM-DEL CCU-DEL DEL-GAU DEL-HYD DEL-SXR BLR-CCU CCU-GAU CCU-IXZ DEL-IXL
% of Revenue Earned in Highest fare bucket
Mar-17 Apr-17

14
Air Asia
1.2
2%
0.0
0%
5.1
9%
0.2
4%
0.0%
2.0%
4.0%
6.0%
8.0%
10.0%
BLR-DEL DEL-GAU
% of Seats Sold in Highest fare bucket
Mar-17 Apr-17
1.0
2%
0.0
0%
2.0
0%
0.2
0%
0.0%
1.0%
2.0%
3.0%
4.0%
5.0%
BLR-DEL DEL-GAU
% of Revenue Earned in Highest fare bucket
Mar-17 Apr-17

15
Compliance of CAR Section 3, Series M, Part IV
In accordance with the Civil Aviation Requirement Section 3, Series M, Part IV, airline are required to submit data on number of cases of denied boarding, cancellations and delays along with the status on a monthly basis. Airline Denied Boarding Cancellations Delays Beyond 2 Hrs
No. ofPax Affected
Status of Facilities & Compensation
No. ofPax Affected
Status of Facilities & Compensation
No. ofPax Affected
Status of Facilities
Air India 357
Refund
Rebookedon other flights
Hotel accommodation
Compensation of Rs. 14.97 lakhs
1438
Refunds
Rescheduling
Hotel accommodation
Compensation of Rs. 9.04 lakhs
23813
Refreshments
Refunds where pax desired
Rescheduling
Compensation of Rs. 49.13 lakhs
Jet Airways
and JetLite
2292
Refund
Rebooked on other flights
Hotel accommodation
Compensation of Rs.80.89 lakhs
684
Refunds
Rescheduling
Hotel accommodation.
Compensation of Rs. 1.81 lakhs
1082 Refreshments
Refunds where pax desired
Rescheduling
SpiceJet 30 1.62 lakhs 2085
Refreshments
Rescheduling
Compensation of Rs. 14.12 lakhs
7337
Refreshments
Transfer to other airlines
Compensation of Rs. 14.45 lakhs
Go Air Nil Nil 192 Refreshments
Rescheduling
843
All pax given refreshments
Refunds where pax desired
Rescheduling
Indigo Nil Nil 4601 0.17 lakhs 14341 Refreshments
Air Asia 13 0.42 lakhs 150 0.21lakhs 1100
Refreshments
Rescheduling Compensation of Rs. 1.92 lakhs
Vistara 6 1.54 lakhs 481 - 2798 Refreshments
Rescheduling
TruJet 4 0.14 lakhs 112
Refreshments
Rescheduling
Compensation of Rs. 0.83 lakhs
Nil Nil
Air Carnival
- - 237 Refunds
- -
Zoom Air
Nil Nil Nil Nil Nil Nil

16
SUMMARY
Denied Boarding Cancellations Delays
No. ofPax Affected
Facilities & Compensation
No. ofPax Affected
Facilities & Compensation
No. ofPax Affected
Facilities
2702 Rs. 99.58lakhs compensation
9980 Rs. 26.19 lakhs compensation and facilities
51314
Rs. 65.50 lakhs towards compensation and facilities

Table 1
TOTAL DOMESTIC PASSENGERS CARRIED BY SCHEDULED DOMESTIC AIRLINES (IN LAKHS) - YEAR 2017
Month & Year Air India
(Domestic) Private Carriers
Total Domestic
Percentage Share
Private Carriers
Air India
Jan 13.50 82.29 95.79 85.9 14.1
Feb 11.71 74.83 86.55 86.5 13.5
Mar 11.80 78.66 90.46 87.0 13.0
Ist Quarter 37.01 235.79 272.79 86.4 13.6
Apr 11.80 79.54 91.34 87.1 12.9
May
Jun
IInd Quarter 11.80 79.54 91.34 87.1 12.9
Jul
Aug
Sep
IIIrd Quarter
Oct
Nov
Dec
IVth Quarter
Total 48.81 315.33 364.13 86.6 13.4
Data of 2016 Air India
(Domestic) Private Carriers
Total Domestic
Percentage Share
Private Carriers
Air India
IstQtr 35.38 194.65 230.03 84.6 15.4
IIndQtr 11.98 67.34 79.32 84.9 15.1
IIIrdQtr
IVthQtr
Total 47.36 261.99 309.35 84.7 15.3
Growth (%) = + 3.06 +20.36 +17.71

18
Table 2
MONTH-WISE SEAT FACTOR OF SCHEDULED OPERATORS IN 2017 (PASSENGER LOAD FACTOR IN PERCENTAGE)
Month Air India (Dom)
Jet Airways
JetLite Spice Jet
Go Air IndiGo Air Costa
Air Asia
Vistara Trujet Air Carnival
Zoom Air
Jan 81.4 86.8 85.4 93.6 90.8 90.0 81.1 87.4 85.1 74.8 56.6 -
Feb 79.8 86.8 84.9 93.7 90.9 87.7 84.9 88.1 85.0 77.0 73.6 59.0
Mar 74.6 79.8 79.2 91.4 84.8 81.6 - 87.8 82.2 76.0 64.8 74.6
Apr 78.7 82.8 83.3 93.4 84.7 86.9 - 90.1 83.6 74.6 66.7 80.2
May
Jun
Jul
Aug
Sep
Oct
Nov
Dec

Table 3 MARKET SHARE OF SCHEDULES DOMESTIC AIRLINES (YEAR 2017)
Month & Year
Passengers Carried (in Lakhs)/Market Share (%)
Air India Private Air Carriers
Jet Airways Jet Lite Spice Jet Go Air Indigo Air Costa Air Asia Vistara Zoom Air Trujet Air Carnival
Jan Pax Carried 13.50 14.84 2.40 12.29 7.88 38.09 0.44 2.86 3.03 - 0.33 0.11
Market Share 14.1 15.5 2.5 12.8 8.2 39.8 0.5 3.0 3.2 - 0.3 0.1
Feb Pax Carried 11.71 13.67 2.15 11.32 7.49 34.19 0.40 2.38 2.70 0.01 0.39 0.14
Market Share 13.5 15.8 2.5 13.1 8.7 39.5 0.5 2.8 3.1 0.0 0.4 0.2
Mar Pax Carried 11.80 13.97 2.30 11.93 8.02 36.11 - 2.83 2.92 0.02 0.41 0.13
Market Share 13.0 15.4 2.5 13.2 8.9 39.9 - 3.1 3.2 0.0 0.5 0.1
IstQtr Pax Carried 37.01 42.49 6.85 35.54 23.40 108.39 0.84 8.07 8.65 0.04 1.13 0.38
Market Share 13.6 15.6 2.5 13.0 8.6 39.7 0.3 3.0 3.2 0.0 0.4 0.1
Apr Pax Carried 11.80 13.90 2.22 11.77 7.40 37.79 - 2.98 2.97 0.03 0.48 0.01
Market Share 12.9 15.2 2.4 12.9 8.1 41.4 - 3.3 3.2 0.0 0.5 0.0
May Pax Carried
Market Share
Jun Pax Carried
Market Share
IIndQtr Pax Carried 11.80 13.90 2.22 11.77 7.40 37.79 - 2.98 2.97 0.03 0.48 0.01
Market Share 12.9 15.2 2.4 12.9 8.1 41.4 - 3.3 3.2 0.0 0.5 0.0
Jul Pax Carried
Market Share
Aug Pax Carried
Market Share
Sep Pax Carried
Market Share
IIIrdQtr Pax Carried
Market Share
Oct Pax Carried
Market Share
Nov Pax Carried
Market Share
Dec Pax Carried
Market Share
IVthQtr Pax Carried
Market Share
TOTAL Pax Carried 48.81 56.39 9.07 47.31 30.80 146.18 0.84 11.06 11.62 0.06 1.61 0.39
Market Share 13.4 15.5 2.5 13.0 8.5 40.1 0.2 3.0 3.2 0.0 0.4 0.1

20
Table 4
Airline
Complaints Redressal Status
Total Per 10,000
Passengers Carried
Closed Open
Air Asia 18 0.6 18 0
Vistara 4 0.1 4 0
Go Air 54 0.7 54 0
Indigo 75 0.2 75 0
SpiceJet 53 0.5 53 0
Jet Airways + JetLite 211 1.3 211 0
Air India (Dom) 226 1.9 143 83
TruJet 2 0.4 2 0
Air Carnival 0 0.0 0 0
Zoom Air 0 0.0 0 0
Total 643 0.70 560 83


![INDEX [pibphoto.nic.in]pibphoto.nic.in/documents/rlink/2017/jan/p20171402.pdf · INDEX Sl. No. Content Page No. 1. Schedule for General Election to Legislative Assembly of Goa 2 2](https://img.pdfslide.us/doc/110x75/5e906b1909823070b129a753/index-index-sl-no-content-page-no-1-schedule-for-general-election-to-legislative.jpg)