Embed Size (px)
Citation preview
3.4 LINE OF BEST FIT
Once data is collected and organized, we need to analyze the strength of the relationship and formalize it with an equation
By understanding the strength of the relationship, we can make estimates and predictions about the two variables being studied
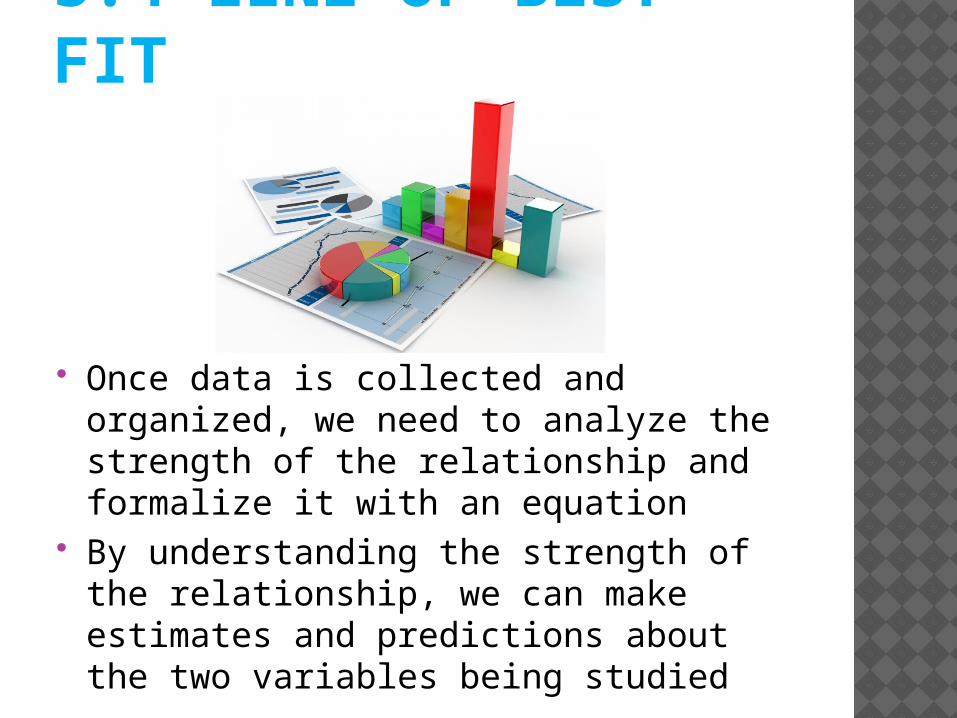
EXAMPLES
Graph with a few data points…
EXAMPLES
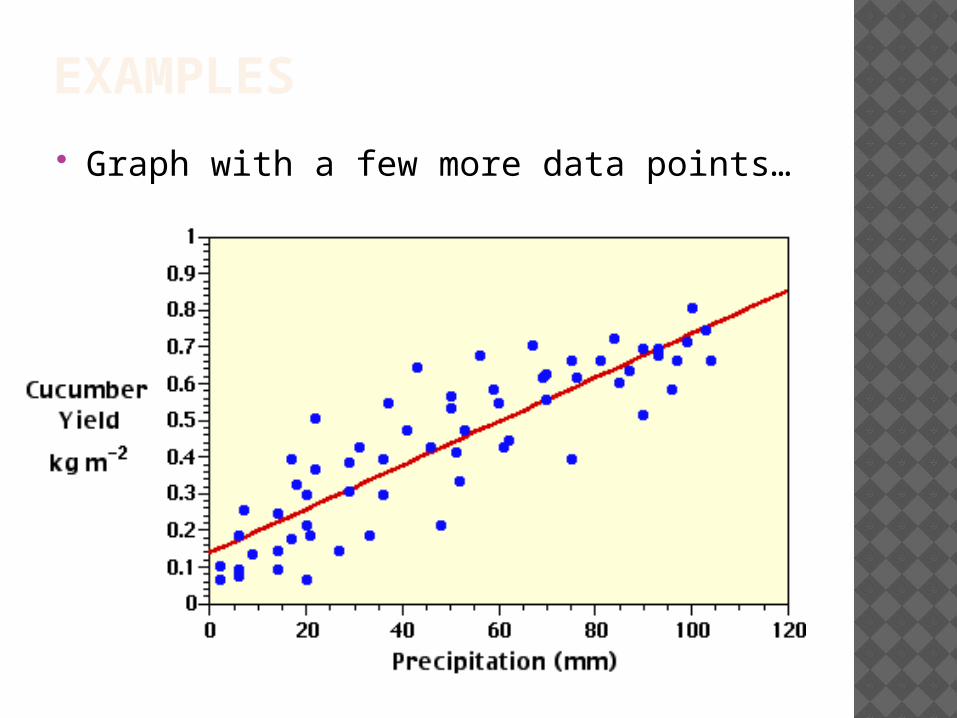
Graph with a few more data points…
IS IT LINEAR OR NOT? Sometimes one data set will look more
linear than another oneThere are varying degrees of linearity
The more linear a set of data is, the closer the lines are to the line of best fitWe use the CORRELATION COEFFICIENT
to represent how far the points are on average from the line of best fit
If r is close to +1 or -1, it’s a close fitThe sign of r relates to the slope of the line,
not the fit
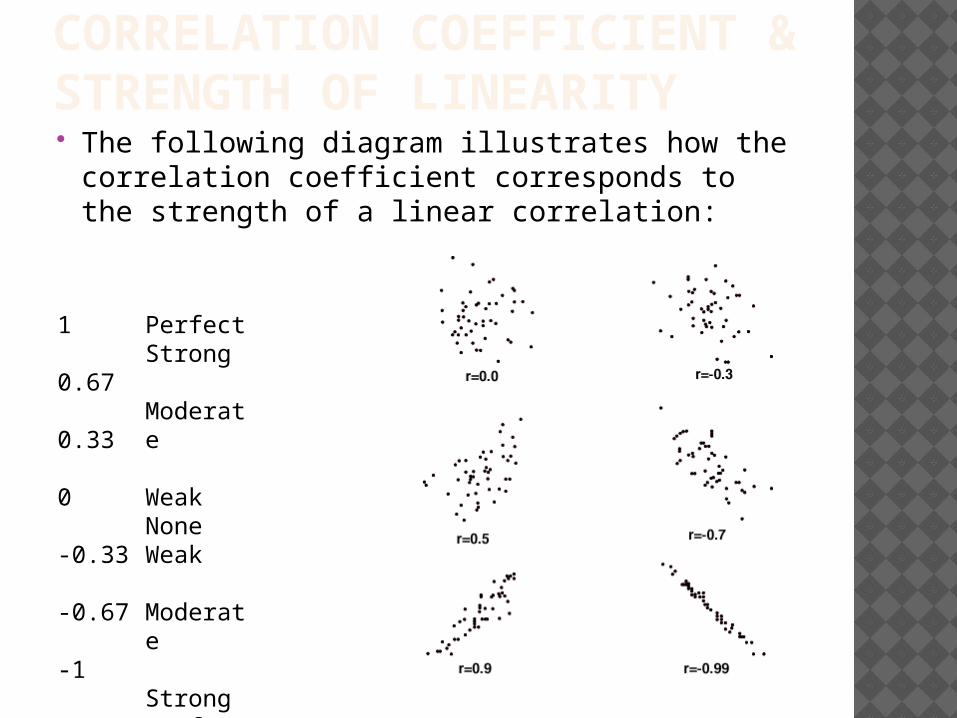
CORRELATION COEFFICIENT & STRENGTH OF LINEARITY The following diagram illustrates how
the correlation coefficient corresponds to the strength of a linear correlation:
1
0.67
0.33
0
-0.33
-0.67
-1
PerfectStrong
Moderate
WeakNoneWeak
Moderate
StrongPerfect
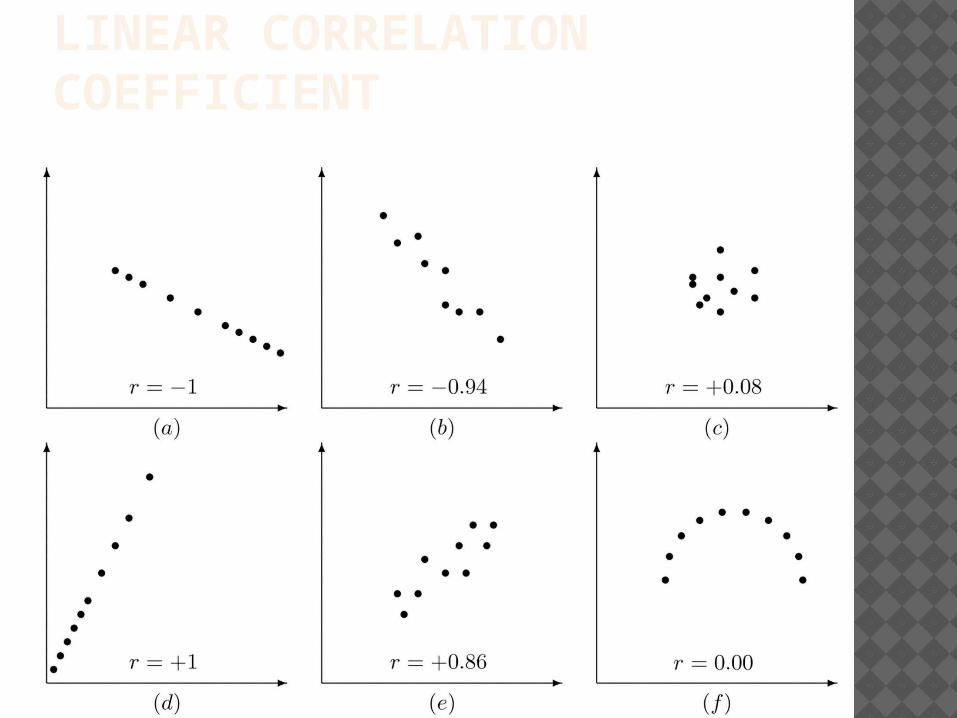
LINEAR CORRELATION COEFFICIENT
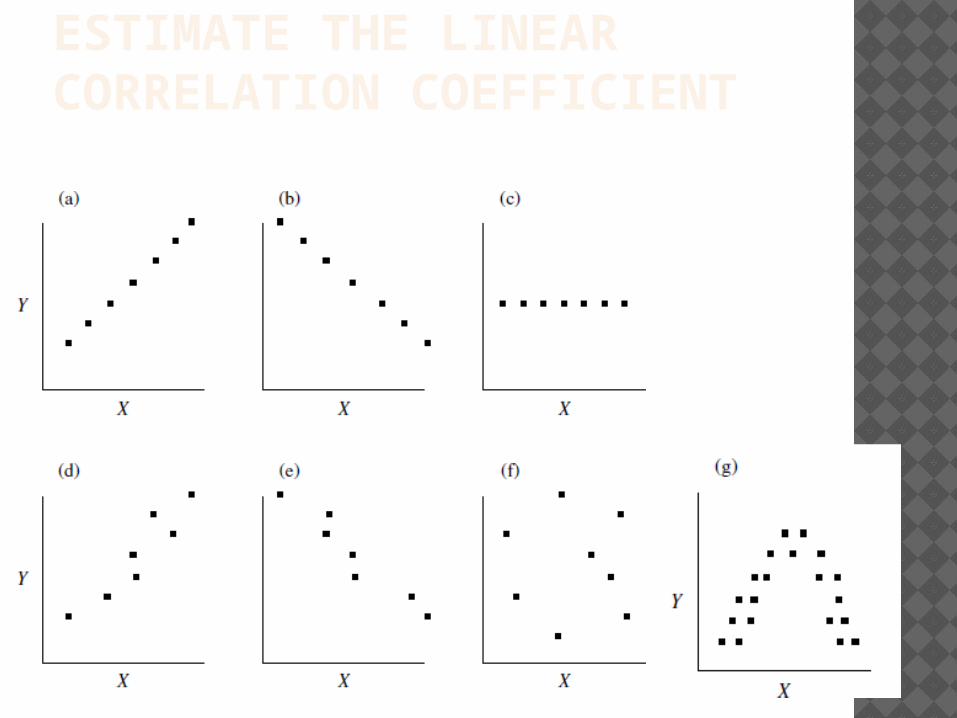
ESTIMATE THE LINEAR CORRELATION COEFFICIENT
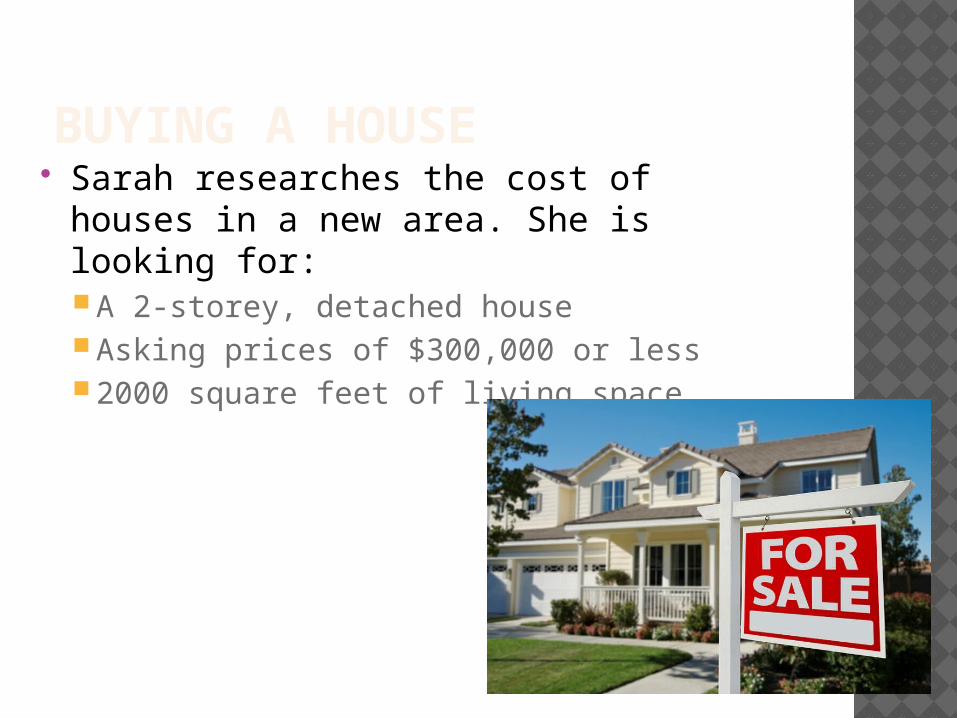
BUYING A HOUSE Sarah researches the cost of houses in a
new area. She is looking for:A 2-storey, detached houseAsking prices of $300,000 or less2000 square feet of living space
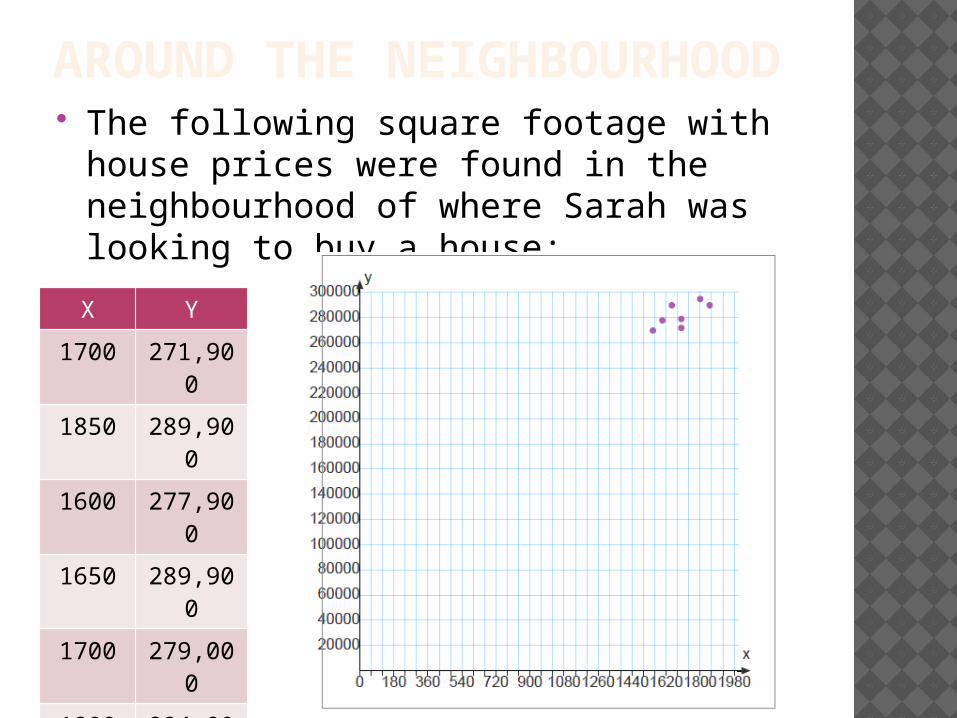
AROUND THE NEIGHBOURHOOD The following square footage with house
prices were found in the neighbourhood of where Sarah was looking to buy a house:
X Y
1700 271,900
1850 289,900
1600 277,900
1650 289,900
1700 279,000
1800 294,900
1550 269,900
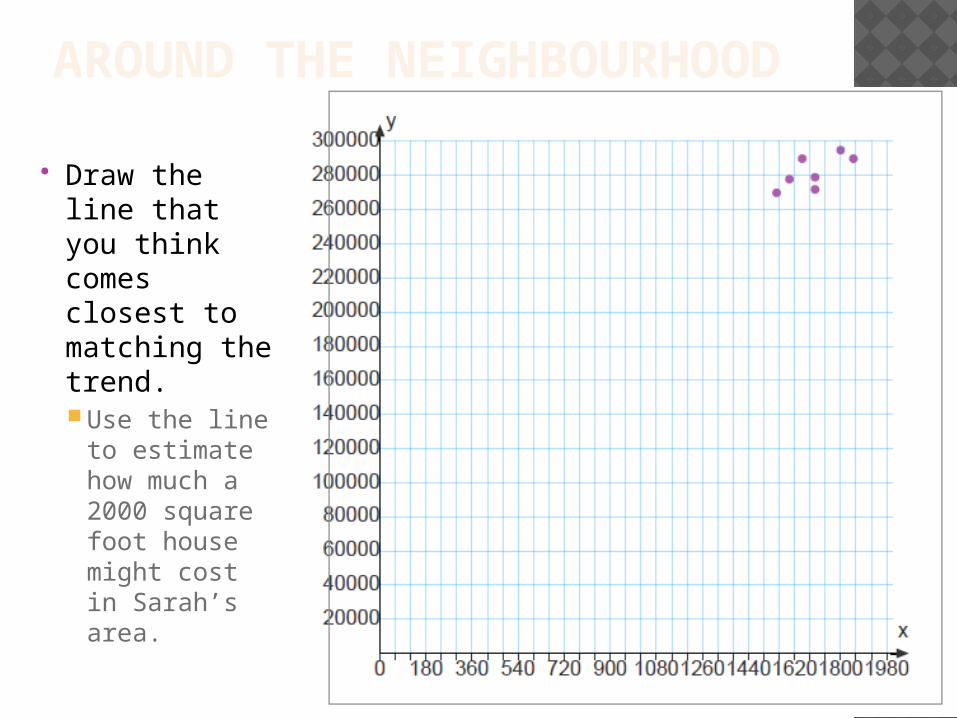
AROUND THE NEIGHBOURHOOD
Draw the line that you think comes closest to matching the trend. Use the line
to estimate how much a 2000 square foot house might cost in Sarah’s area.
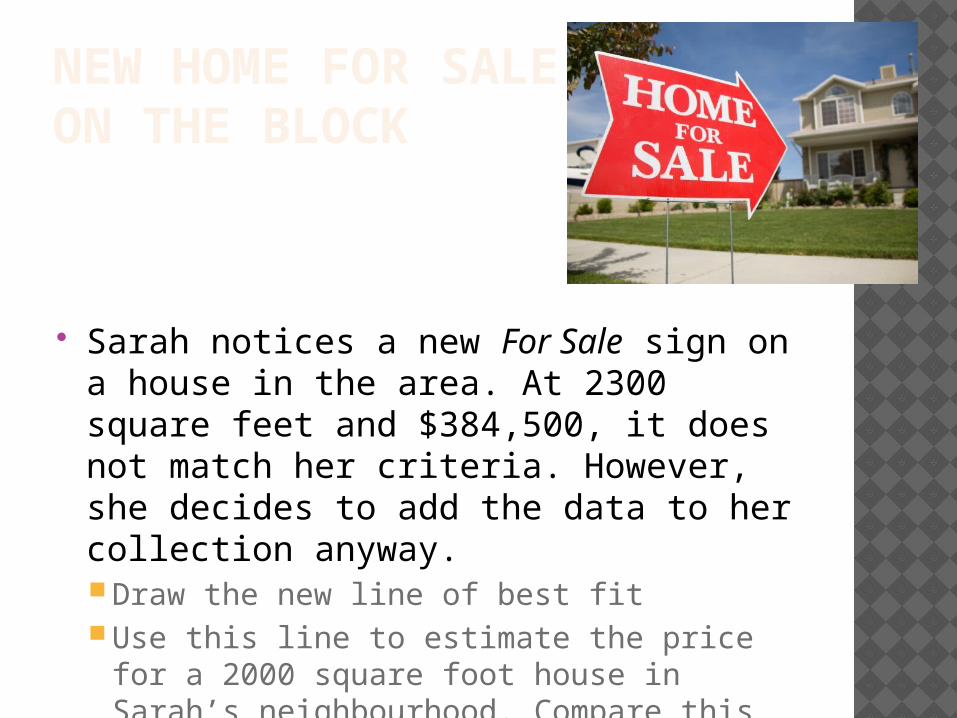
NEW HOME FOR SALE ON THE BLOCK
Sarah notices a new For Sale sign on a house in the area. At 2300 square feet and $384,500, it does not match her criteria. However, she decides to add the data to her collection anyway.Draw the new line of best fitUse this line to estimate the price for a
2000 square foot house in Sarah’s neighbourhood. Compare this estimate to your first estimate.
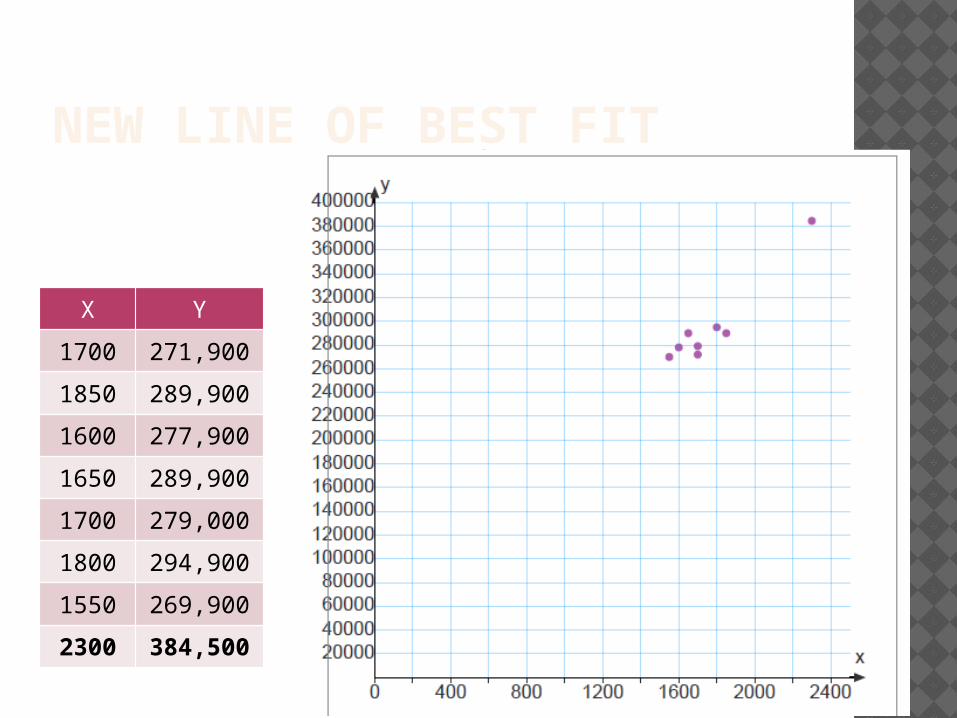
NEW LINE OF BEST FIT
X Y
1700 271,900
1850 289,900
1600 277,900
1650 289,900
1700 279,000
1800 294,900
1550 269,900
2300 384,500
REFLECT How did the arrangement of plotted data
affect the way you drew a line of best fit? How does it affect your confidence in using the line to make predictions?
A real estate agent tells Sarah that 2000 square foot houses often come up for sale in this area, usually at prices from $295,000 to $305,000. How close were your estimates to these
prices? Which line of best fit helped you make a
closer prediction?
LINE OF BEST FIT What equation can we use to model the
line of best fit?y = mx + b
What does the y-intercept represent in this line of best fit? Does its meaning make sense in this context? Why or why not?
REGRESSION ANALYSIS Once you determine that two variables
have a moderate to strong linear relationship, you can find a linear model.This way, you can make predictions for one
variable based on the value of the other variable
1500 1600 1700 1800 1900 2000 2100 2200 2300 24000
50000
100000
150000
200000
250000
300000
350000
400000
450000
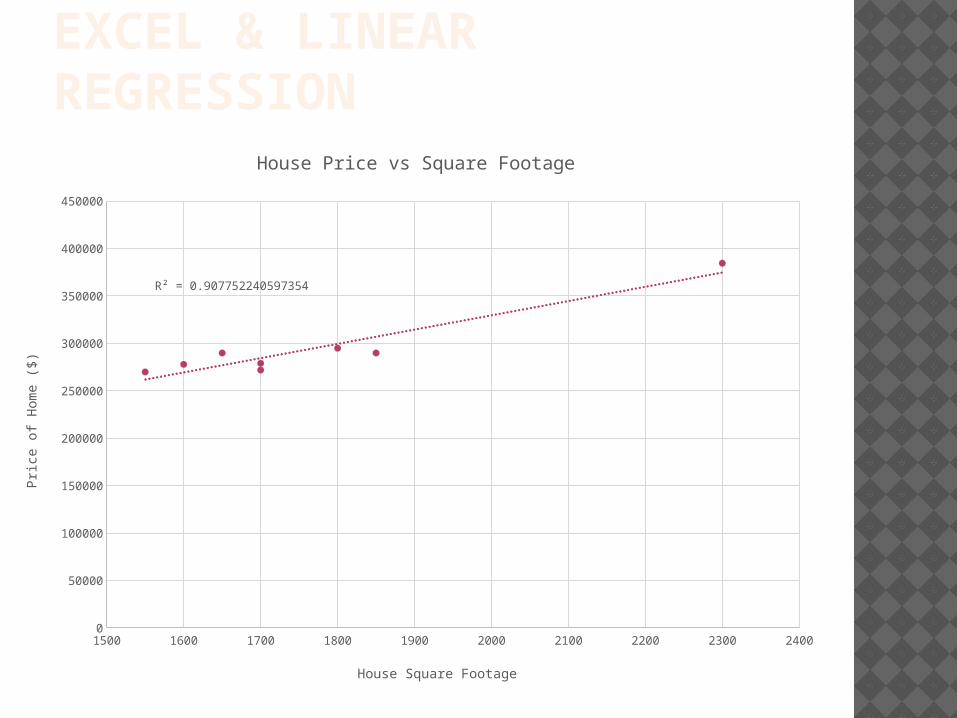
R² = 0.907752240597354
House Price vs Square Footage
House Square Footage
Pri
ce o
f H
om
e (
$)
EXCEL & LINEAR REGRESSION
3.4 HOMEWORK p. 175 #1, 2, 7, 9, 13