Embed Size (px)
Citation preview
Ⓒ
Olo
f S
.
Future directions of EU agricultural policies
The CAP towards 2020
Tassos Haniotis, DirectorEconomic Analysis, Perspectives and Evaluations
DG for Agriculture and Rural Development
European Commission
ABARES Outlook 2011, 2 March 2011
Haniotis - ABARES Outlook 20112
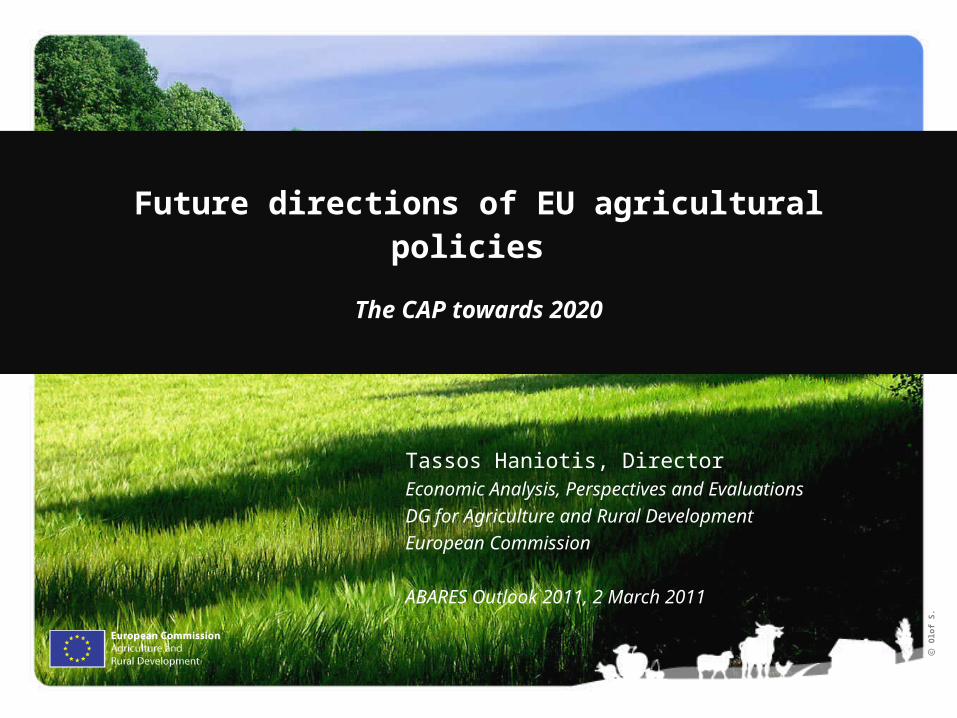
Outline
1. The objectives of CAP reform
2. The context of CAP reform
3. The CAP at a glance
4. Policy challenges and options
5. Next steps

Haniotis - ABARES Outlook 20113
CAP reform objectives at a glanceFuture challenges
Economicchallenges
Environmentalchallenges
Territorialchallenges
• Food security
• Price volatility
• Economic crisis
• GHG emissions
• Soil depletion
• Water/air quality
• Habitats/biodiversity
• Vitality of rural areas
• EU rural diversity
• Regional growth
Equity and balance of support
Contribution to Europe 2020 strategy
Viable food production Sustainable management of natural resources
Balanced territorial development
CAP2020 reform objectives

Haniotis - ABARES Outlook 20114
The wider context of CAP reform
The future of the CAP is debated within the context of:
• A cost-driven commodity price boom– the “baseline” to assess the impact of potential policy changes is full of major
uncertainties, mostly of uncertainties outside agriculture
• A new set of EU institutional realities– co-decision after the Lisbon Treaty increases the role not just of the EP in the
decision process, but also of the wider public in the consultation process
• A parallel process of multiple EU policy decisions – CAP reform is linked to the debate about the future EU budget and the wider EU 2020
strategy of “smart, sustainable and inclusive growth”
Haniotis - ABARES Outlook 20115
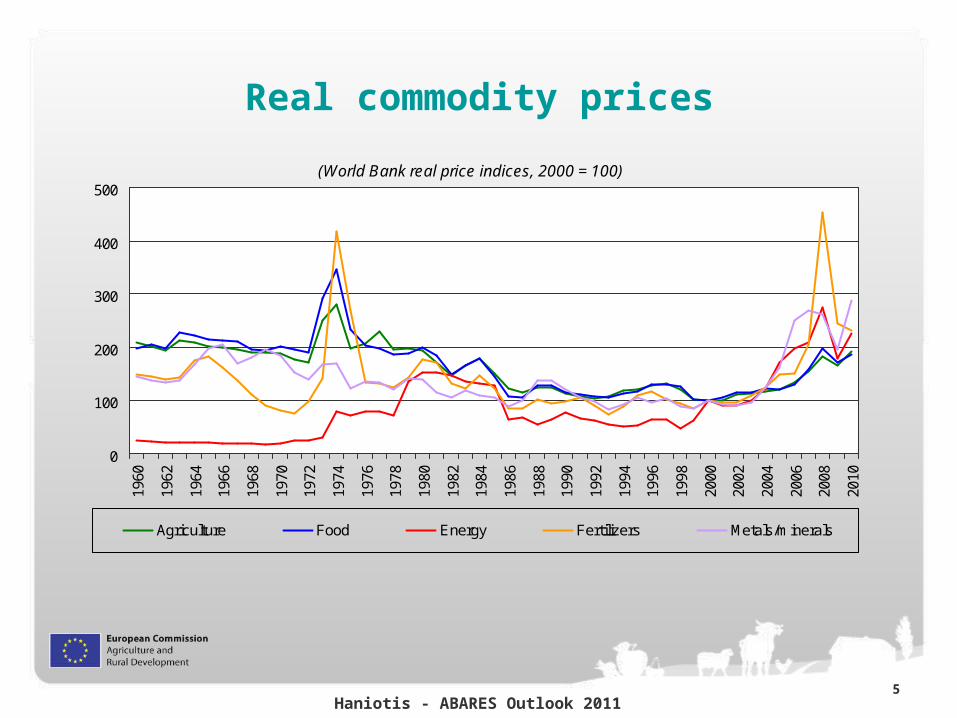
Real commodity prices
(World Bank real price indices, 2000 = 100)
0
100
200
300
400
500
1960
1962
1964
1966
1968
1970
1972
1974
1976
1978
1980
1982
1984
1986
1988
1990
1992
1994
1996
1998
2000
2002
2004
2006
2008
2010
Agriculture Food Energy Fertilizers Metals/minerals

Haniotis - ABARES Outlook 20116
Energy and agricultural prices
Source: World Bank.
(nWorld Bank nominal price indices, 2000=100)
0
50
100
150
200
250
300
350
400
1986
1987
1988
1989
1990
1991
1992
1993
1994
1995
1996
1997
1998
1999
2000
2001
2002
2003
2004
2005
2006
2007
2008
2009
2010
Agriculture + 50 % Energy + 223 %

Haniotis - ABARES Outlook 20117
Price developments in the EU food chain
95
100
105
110
115
120
Jan
-07
Ma
r-0
7
Ma
y-0
7
Jul-
07
Se
p-0
7
No
v-0
7
Jan
-08
Ma
r-0
8
Ma
y-0
8
Jul-
08
Se
p-0
8
No
v-0
8
Jan
-09
Ma
r-0
9
Ma
y-0
9
Jul-
09
Se
p-0
9
No
v-0
9
Jan
-10
Ma
r-1
0
Ma
y-1
0
Jul-
10
Se
p-1
0
No
v-1
0
Source: European Commission – DG Economic and Financial Affairs, based on Eurostat data
FOOD PRICE CRISIS
PRODUCER LAG
RETAIL LAG DEJA VU?
Agriculturalcommodity prices
Overall inflation(HICP)
Food producer prices
Food consumer prices
Haniotis - ABARES Outlook 20118
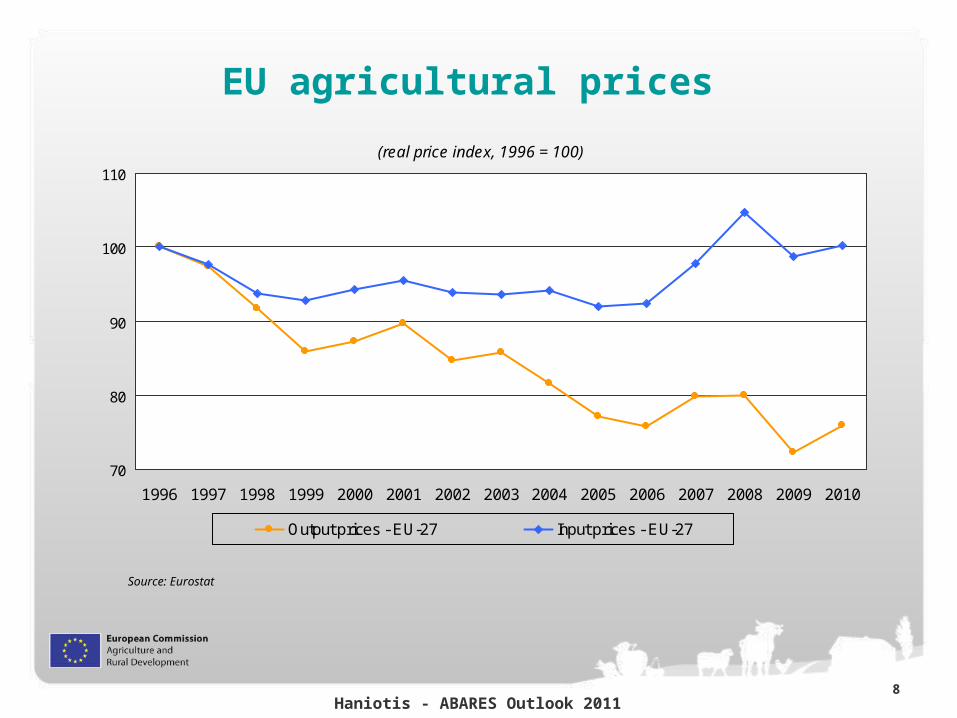
EU agricultural prices
Source: Eurostat
(real price index, 1996 = 100)
70
80
90
100
110
1996 1997 1998 1999 2000 2001 2002 2003 2004 2005 2006 2007 2008 2009 2010
Output prices - EU-27 Input prices - EU-27
Haniotis - ABARES Outlook 20119
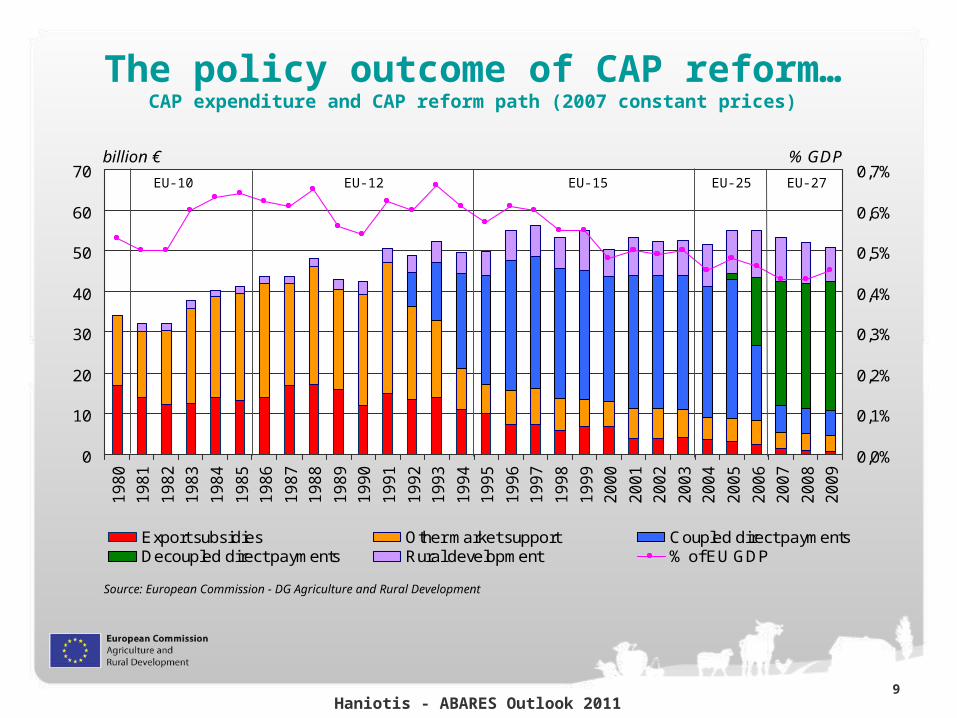
The policy outcome of CAP reform…CAP expenditure and CAP reform path (2007 constant prices)
0
10
20
30
40
50
60
70
19
80
19
81
19
82
19
83
19
84
19
85
19
86
19
87
19
88
19
89
19
90
19
91
19
92
19
93
19
94
19
95
19
96
19
97
19
98
19
99
20
00
20
01
20
02
20
03
20
04
20
05
20
06
20
07
20
08
20
09
% GDPbillion €
0,0%
0,1%
0,2%
0,3%
0,4%
0,5%
0,6%
0,7%
Export subsidies Other market support Coupled direct paymentsDecoupled direct payments Rural development % of EU GDP
Source: European Commission - DG Agriculture and Rural Development
EU-10 EU-12 EU-15 EU-25 EU-27
Haniotis - ABARES Outlook 201110
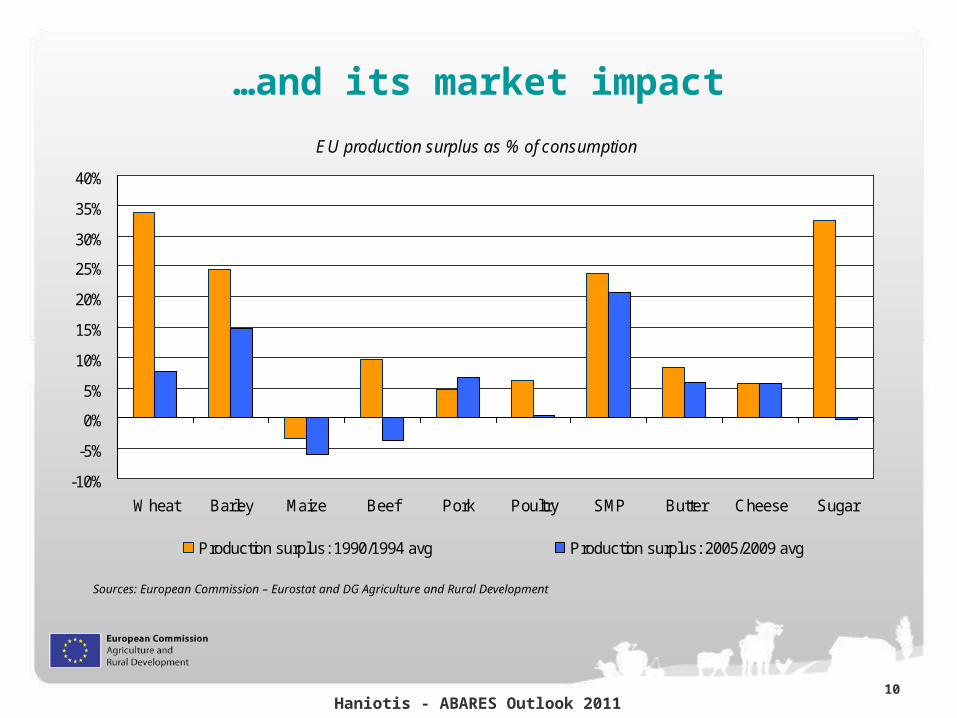
…and its market impact
-10%
-5%
0%
5%
10%
15%
20%
25%
30%
35%
40%
Wheat Barley Maize Beef Pork Poultry SMP Butter Cheese Sugar
EU production surplus as % of consumption
Production surplus: 1990/1994 avg Production surplus: 2005/2009 avg
Sources: European Commission – Eurostat and DG Agriculture and Rural Development
Haniotis - ABARES Outlook 201111
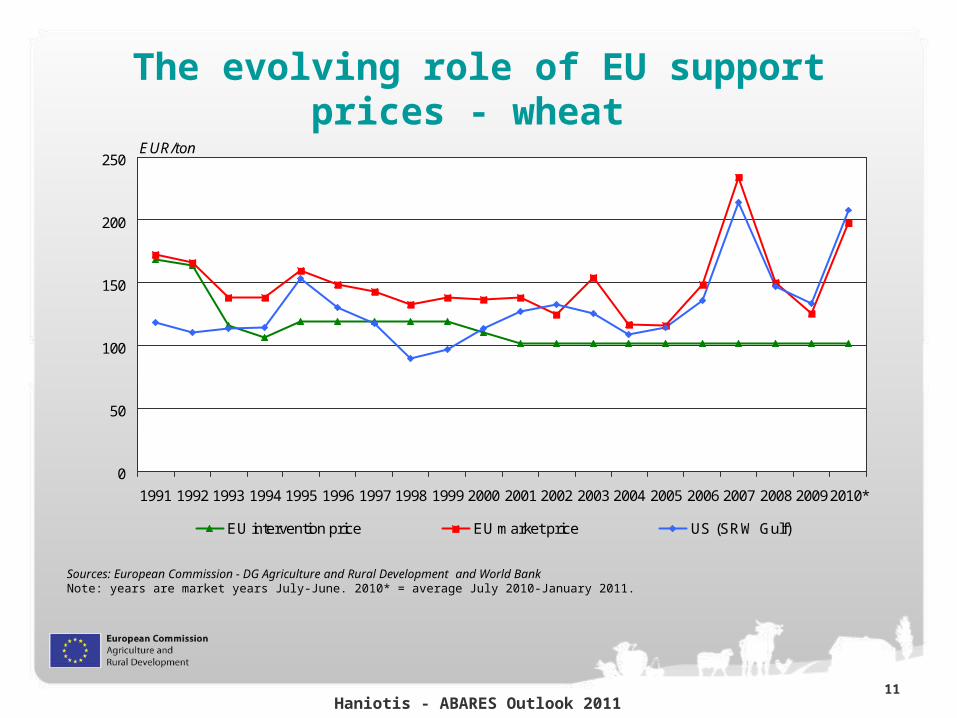
The evolving role of EU support prices - wheat
0
50
100
150
200
250
1991 1992 1993 1994 1995 1996 1997 1998 1999 2000 2001 2002 2003 2004 2005 2006 2007 2008 20092010*
EUR/ton
EU intervention price EU market price US (SRW Gulf)
Sources: European Commission - DG Agriculture and Rural Development and World BankNote: years are market years July-June. 2010* = average July 2010-January 2011.
Haniotis - ABARES Outlook 201112
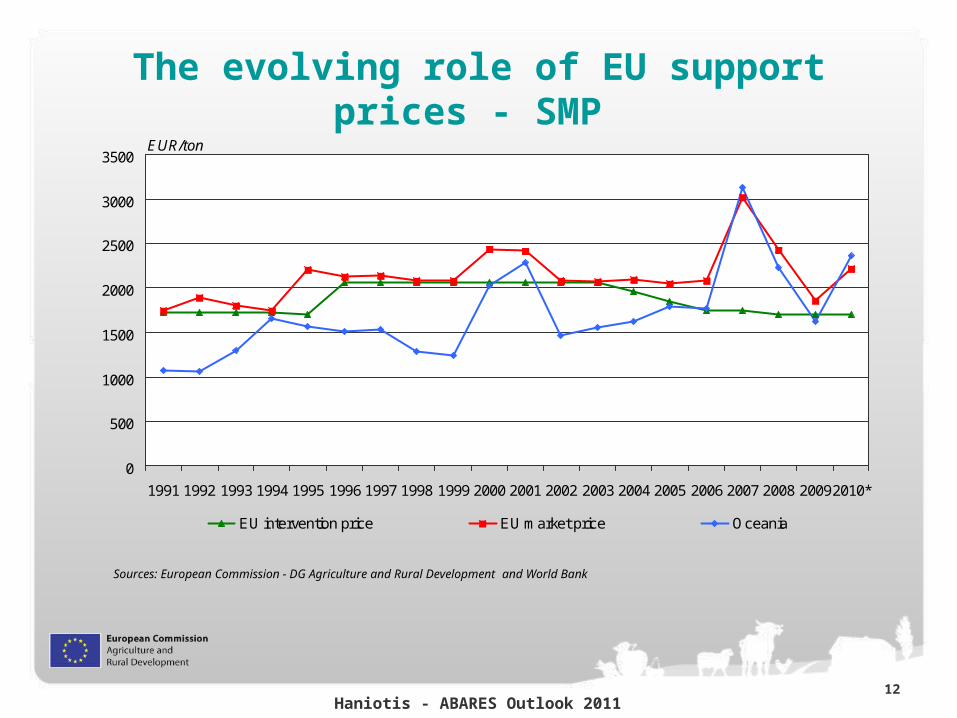
The evolving role of EU support prices - SMP
0
500
1000
1500
2000
2500
3000
3500
1991 1992 1993 1994 1995 1996 1997 1998 1999 2000 2001 2002 2003 2004 2005 2006 2007 2008 20092010*
EUR/ton
EU intervention price EU market price Oceania
Sources: European Commission - DG Agriculture and Rural Development and World Bank
Haniotis - ABARES Outlook 201113
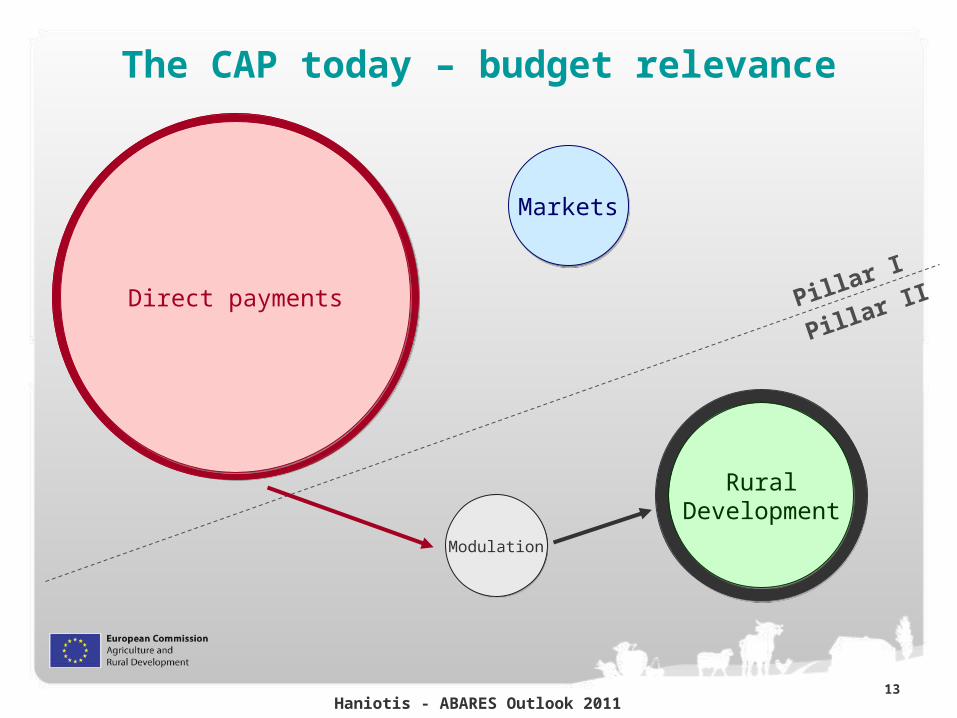
The CAP today – budget relevance
RuralDevelopment
Direct payments
Markets
Pillar I
Pillar II
Modulation
Haniotis - ABARES Outlook 201114
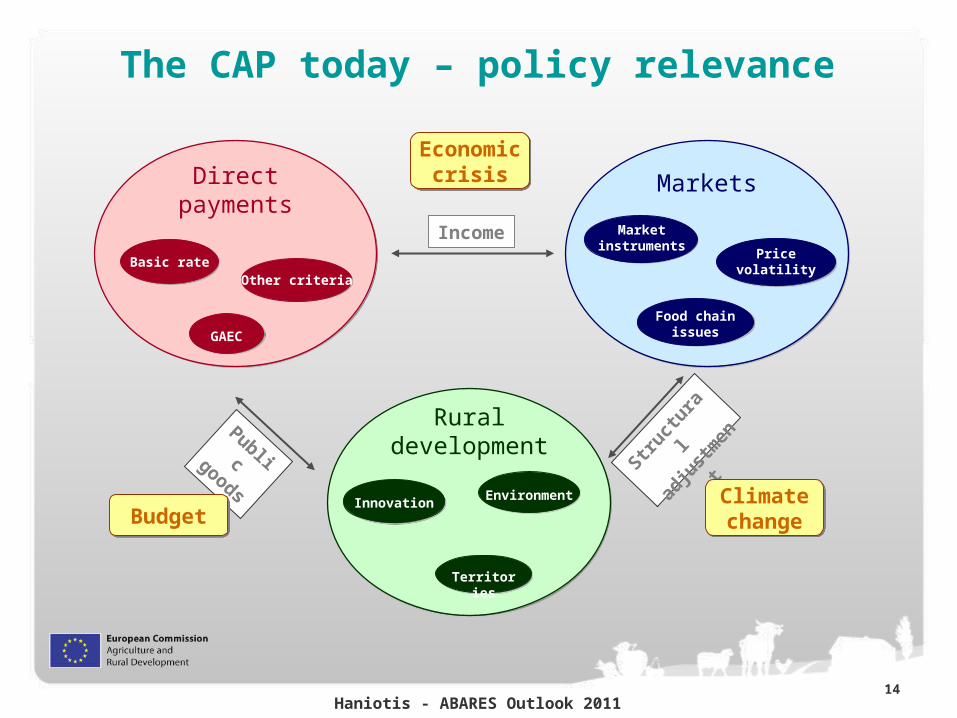
The CAP today – policy relevance
Directpayments
Basic rate
Markets
Ruraldevelopment
InnovationEnvironment
Territories
Income
Public goods
Struct
ural
adju
stm
ent
Pricevolatility
Marketinstruments
Food chainissues
Other criteria
GAEC
BudgetBudget
Economiccrisis
Economiccrisis
ClimatechangeClimatechange
Haniotis - ABARES Outlook 201115
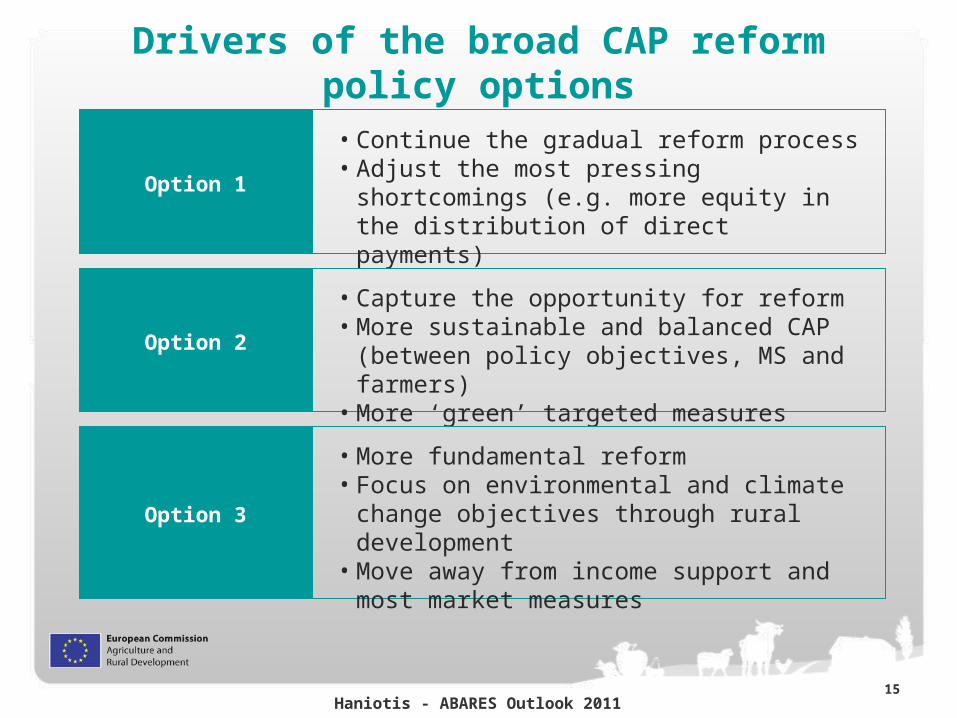
Drivers of the broad CAP reform policy options
Option 1
• Continue the gradual reform process• Adjust the most pressing shortcomings (e.g.
more equity in the distribution of direct payments)
Option 2
• Capture the opportunity for reform• More sustainable and balanced CAP (between
policy objectives, MS and farmers)• More ‘green’ targeted measures
Option 3
• More fundamental reform• Focus on environmental and climate change
objectives through rural development• Move away from income support and most
market measures
Haniotis - ABARES Outlook 201116
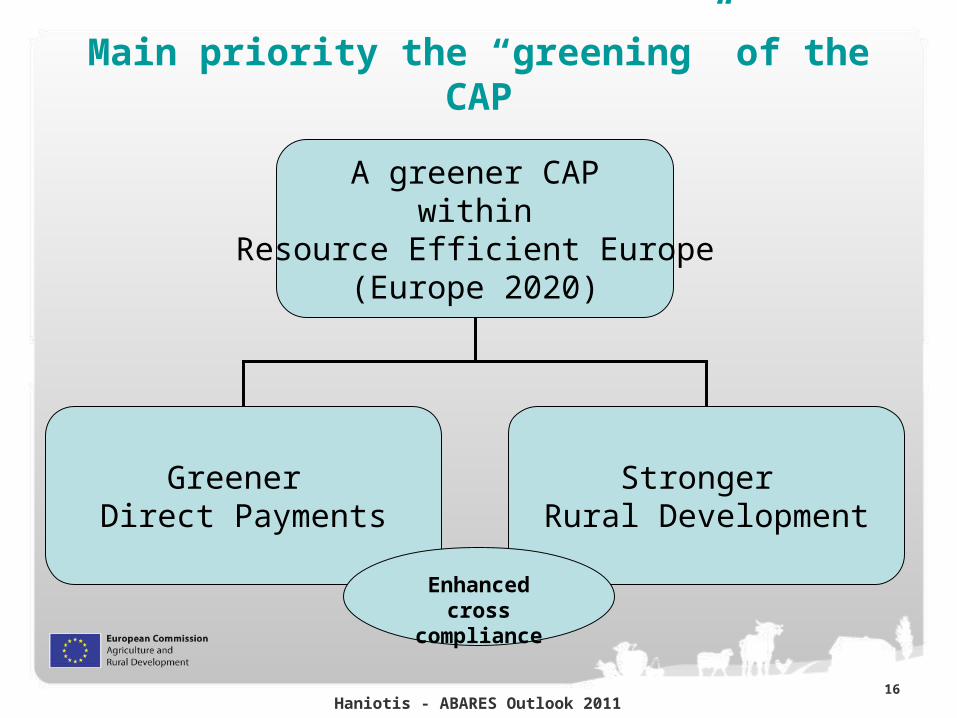
Main priority the “greening” of the CAP
A greener CAPwithin
Resource Efficient Europe(Europe 2020)
Greener Direct Payments
Stronger Rural Development
Enhancedcross compliance
Haniotis - ABARES Outlook 201117
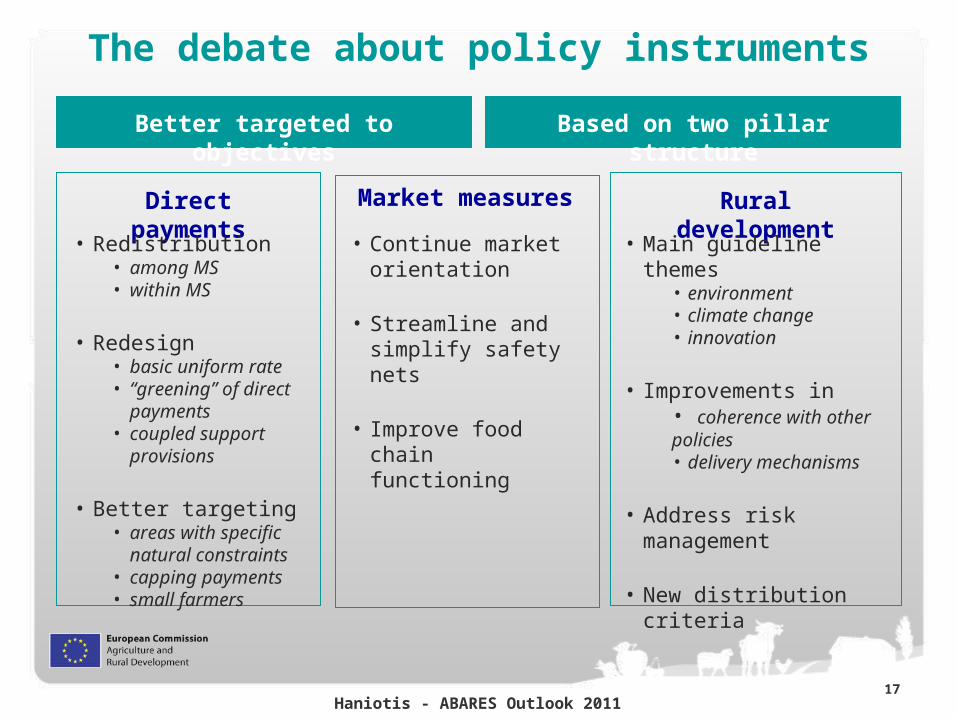
The debate about policy instruments
Better targeted to objectives Based on two pillar structure
Direct payments Market measures Rural development
• Continue market orientation
• Streamline and simplify safety nets
• Improve food chain functioning
• Main guideline themes• environment• climate change• innovation
• Improvements in• coherence with other policies• delivery mechanisms
• Address risk management
• New distribution criteria
• Redistribution• among MS• within MS
• Redesign• basic uniform rate• “greening” of direct
payments• coupled support
provisions
• Better targeting• areas with specific
natural constraints• capping payments• small farmers

Haniotis - ABARES Outlook 201118
Average direct payments per potentially eligible area and beneficiary
Direct payments net ceilings fully phased-in (in 2016)
Source: European Commission - DG Agriculture and Rural Development
0
100
200
300
400
500
600
700
800
Mal
ta
Bel
gium
Net
herla
nds
Italy
Gre
ece
Cyp
rus
Den
mar
k
Slo
veni
a
Ger
man
y
Fra
nce
EU
-15
Luxe
mbo
urg
EU
-27
Irel
and
Aus
tria
Hun
gary
Cze
ch R
epub
lic
Spa
in
Fin
land
Sw
eden
Uni
ted
Kin
gdom
Bul
garia
Pol
and
EU
-12
Slo
vaki
a
Rom
ania
Por
tuga
l
Lith
uani
a
Est
onia
Latv
ia
EUR/ben.EUR/ha
0
8000
16000
24000
32000
40000
48000
DP net ceilings fully phased-in (EUR/ha)EU-27 average (EUR/ha)DP net ceilings fully phased-in (EUR/beneficiary)
Haniotis - ABARES Outlook 201119
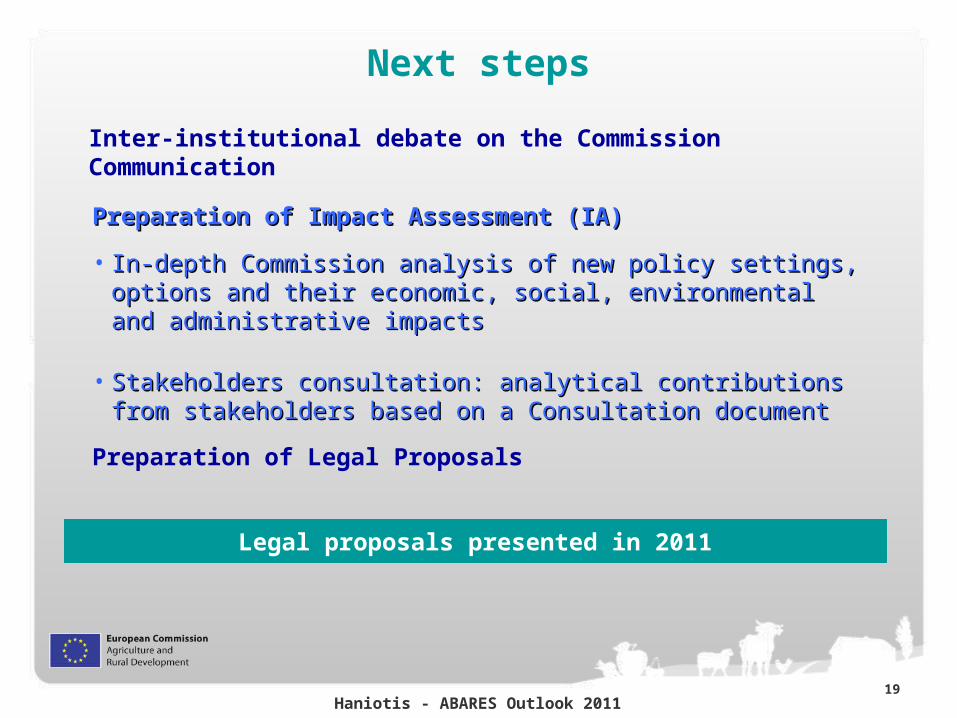
Next steps
Inter-institutional debate on the Commission Communication
Preparation of Impact Assessment (IA)Preparation of Impact Assessment (IA)
Preparation of Legal Proposals
• In-depth Commission analysis of new policy settings, options and their In-depth Commission analysis of new policy settings, options and their economic, social, environmental and administrative impactseconomic, social, environmental and administrative impacts
• Stakeholders consultation: analytical contributions from stakeholders Stakeholders consultation: analytical contributions from stakeholders based on a Consultation documentbased on a Consultation document
Legal proposals presented in 2011
Haniotis - ABARES Outlook 201120
Thank you
http://ec.europa.eu/agriculture/cap-post-2013