Embed Size (px)
Citation preview
OCTOBER 1944
... CONTENTS ..
VoL. 1, No. 3
The Radio Engineer's Stake in Our Future
Proceedings of the I.R.E. 1
Acoustic Considerations in 2 -Way Loudspeaker
Communications Communications 2
Stage -By -Stage Tests Radio Craft 8
Using Cathode Coupling Electronic Industries 10
H -F Crystal Oscillator Circuits Radio 14
Antenna Power Divider Electronics 21
A New High -Speed Circuit Tester____Radio Service Dealer 23
Field Testing with Equipment Limitations
Communications 26
Frequency Adjustment of Quartz Oscillator -Plates
by X -Rays Clifford Frondel 31
_ :.9:__.<. -35-_. h..- .s. .+.r+s!Mc-.. . ..._ - r ,._ www.americanradiohistory.com
THE RADIO ENGINEERS' DIGEST
JOHN F. C. MOORE, Editor
Copyright 1944 by The Hudson American Corporation
Vol. 1, No. 3 October 1944
Published monthly at Brooklyn, N. Y., by The Hudson American Corporation.
Editorial Office, 300 Pearl Street, Brooklyn 1, N. Y.
Subscription rate, $5 per year. Single copies 50 cents.
Printed by Criterion Products Corporation, New York, N. Y.
www.americanradiohistory.com
1
THE RADIO ENGINEER'S STAKE IN OUR FUTURE Reprinted from Proceedings of the I.R.E.
By Miller McClintock President, Mutual Broadcasting System
NE of the most inspiring elements in broadcasting lies not only in the breath- taking speed with which it has developed but likewise in the fact that the
horizons ahead have no limitation. The miracle of radio as it stands today is the result of the imagination, skill,
and scientific ability of radio engineeers in all fields of electronics. Upon these en- gineers, we must continue to depend for the expansion of radio to its full opportunities and responsibilities in the future.
That which was an unbelievable phenomenon only a few years ago has now become an actuality. It is a simple commonplace to say that frequency modulation and television will be here in great volume in the postwar years. While its full development cannot yet be foreseen, it needs little discussion among radio engineers.
We are less likely, however, to understand the impact of radio industry upon the development of other industries and upon the molding of our social and economic life.
Immediately after the war and in the years following, autobiles will return in full volume. There may be as many as 50,000,000 cars in this country ten years after peace. The principles are already laid whereby the highways of the future and the traffic system will largely be under electronic control. Each vehicle will be equipped with radio signals on its instrument panel telling, among other things, whether or not cars are coming from blind roadways or drives ahead. Traffic stop and go signals will be repeated in cars both by light and by sound. Continuous trafic instructions and directions will be available along each highway for each car. Touring passengers may enjoy a description of the historical and business significance of each of the miles of the highway over which they pass. These mechanisms are not visionary but have been fully field-tested and probably no highway will be built in the future without complete electronic equipment.
There will be many electronic controls within cars themselves, such as electric bumpers preventing collisions and invisible electric tracks to guide vehicles around curves and obstacles. Passengers in cars will find it possible, at 60 miles per hour, to call any telephone number in the country. The effects of these developments upon comfort, safety, and efficiency in highway traffic are beyond calculation.
The application of radib to maritime and aerial navigation opens equally practi- cal but, none the less, spectacular opportunites. Shipping upon the approaches to and in great harbors will no longer be fogbound. Ships will be guided to their berths and along their channels with complete security and efficiency. Collisions at sea will become something of history.
Air liners similarly will descend unseeing in heavy weather to land with safety on their home runways. But to return to land transportation; radio as developed today has all of the elern'nts necessary to make the tragic train disasters of recent months only a memory. Full and complete radio train control is now available in several different forms. Engineers will never be without full information as to the clear track ahead and should they disregard warning control, the train control will be taken away from them.
These are only a few of the marvels of radio which will be commonplace things of tomorrow. If one goes into the laboratories, the factory, the great steel mills, he only sees today the elementary beginnings of electronic controls of scientific processes and production which will revolutionize many industrial activities.
. All of these developments will be superimposed upon the greatly expanding services and obligations of radio communications for the entertainment, information, and culture of our people and of the people of the whole world. In the hands of the radio engineer lies the opportunity and the capacity to make all of these marvels the servants of mankind.
Copyright 1944, Institute of Radio En inors. Inc., 330 West 42nd St., N. Y. C. (Proceedings of the I.R.E., August 1944)
www.americanradiohistory.com
2
ACOUSTIC CONSIDERATIONS IN . 2 -WAY LOUDSPEAKER COMMUNICATIONS
Reprinted from Communications
By A. J. Sanial Chief Engineer, Powers Electronic and Communication Co., Inc.
THE use of reversible loudspeaker systems for two-way voice communication provides an improtant advantage over other forms of communication, because
it is possible to signal or carry on a conversation with another person at a consider- able distance, at which point no equipment is necessary. This is made possible by loudspeakers that amplify voice and project it in one direction and then permit pickup by a distant voice with the same units, amplifying the input to a practical volume in the other direction.
The most practical and economical audible communication systems are of the so-called talk -back type. A talk -back loudspeaker system is one in which the loud- speakers are used alternately as sound pickups or microphones; that is, the same electro -acoustic device is used for a dual purpose, a single amplifier system being switched so that in talking back, the loudspeaker is transferred from the normal amplifier output connection to the amplifier input. Although it would seem that such systems are inherently simple, and any special considerations of the acoustic problem involved would not be justified, this supposition finds itself discarded when we have to provide transmission and pickup of the human voice, navigational or other signals, etc., over distances up to one-half mile. It is also necessary to give special considera- tion to very noisy location voice pickups. Examples of this in marine work are engine rooms, anchor windlass compartments, open decks during bad weather, etc. If the acoustic components and amplifier of a standard high quality public address or music distribution system were to be used for such applications, it would be found impos- sible to obtain the desired results. There are many good reasons for this, most of which will be apparent when all the various acoustic factors, both natural and arti- ficial, are considered.
The first distinguishing requirement of this type of audio communication system design, particularly in marine applications, is that maximum speech articulation, under all the varied conditions encountered, shall be obtained. Not only must speech be carried for considerable distances over water for communication from ship to ship, or ship to shore, but the speech must override the various and sundry noises which occur in different locations throughout the ship. For interior communication, severe reverberation effects are very often encountered, such as in enclosed steel compartments, or on semi -enclosed spaces as embarkation decks and the like. In ad- dition to these limitations, the talk -back loudspeakers, besides being designed for optimum results for high level talk -out purposes. must also serve as very efficient microphones.
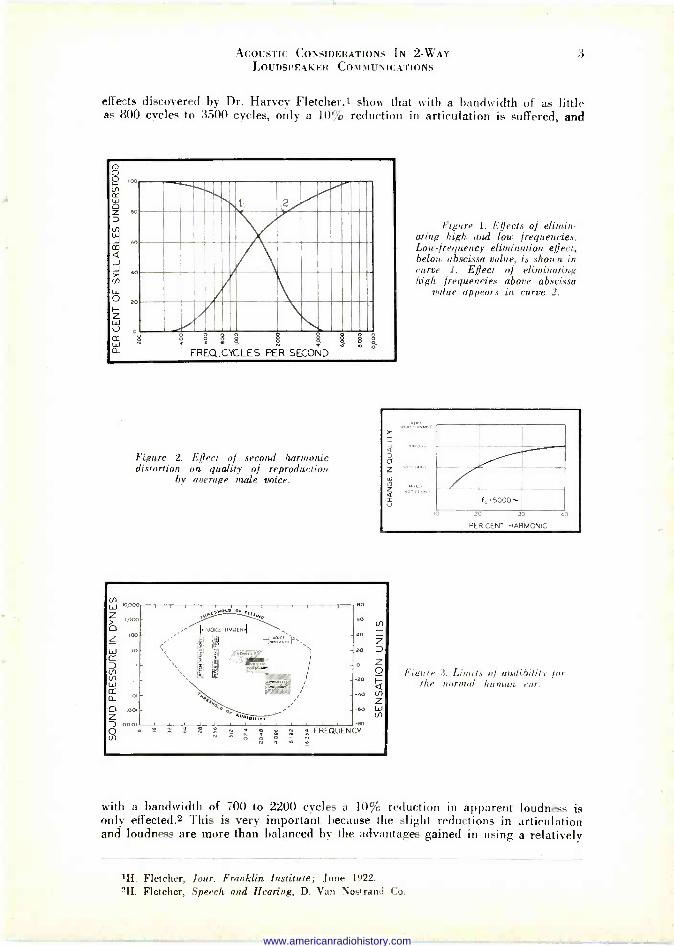
One of the most important characteristics of the talk -back system is the reduction in frequency bandwidth transmitted, as compared to that in the conventional type high -quality loudspeaker system. In the first place, low frequencies up to approxi- mately 400 to 500 cycles contribute very little to the articulation of speech. This is shown in curve I of Figure 1. We note here the reduction of syllable articulation, as more and more low frequencies are cut out by means of high-pass filters. In a like manner, the very high frequencies can be cut down with very little effect on the articulation. This is shown in curve 2; high frequencies have been cut out of a system by variable low-pass filters at lower and lower cut-off frequencies. These
Copyright 1944, Bryan Davis Publishing Co.. Inc.. 19 East 47th St., N. Y. C. (Communications, June 1944)
_ www.americanradiohistory.com
ACOUSTIC CONSIDERATIONS IN 2 -WAY 3 LOUDSPEAKER COMMUNICATIONS
effects discovered by Dr. Harvey Fletcher,' show that with a bandwidth of as little as 800 cycles to 3500 cycles, only a 10% reduction in articulation is suffered, and
8 Oo ,.0
ó t-; 2 z 60, D
J 60 CO
Q J J 40
Ñ it. ° zo H Z
o
W a R : FREQ.CYCLES
Q Çj 5 e o$ ó á
PER SECOND é
8
Figure 2. Effect of second harmonic distortion on quality of reproduction
by average male voice.
I- VOICE TIMBER 1 ,}
1 7véiwul`
7;,.157,7irjr 1
Figure 1. Effects of elimin- ating high and low frequencies. Low -frequency elimination effect, below abscissa value, is shown in curve 1. Effect of eliminating high frequencies above abscissa
value appears in curve 2.
f 5000- U 20 30 aC
PER CENT HARMONIC
Figure 3. Limits of audibility for the normal human ear.
with a bandwidth of 700 to 2200 cycles a 10% reduction in apparent loudness is only effected.2 This is very important because the slight reductions in articulation and loudness are more than balanced by the advantages gained in using a relatively
1H. Fletcher, Jour. Franklin Institute; June 1922.
2H. Fletcher, Speech and Hearing, D. Van Nostrand Co.
www.americanradiohistory.com
4 THE RADIO ENGINEERS' DIGEST OCTOBER
narrow band of frequencies. In the first place, the power efficiency of the system, particularly in the electro -acoustic devices, increases as the transmitted frequency bandwidth is decreased. This is particularly important, since the increase in efficiency between a narrow -band system and a wide -band system is inversely proportional to the square of the ratio of the bandwidths, other conditions remaining equal. This is apparent when designing dynamic systems, and indeed has a sound basis in the mathematics of dynamical systems.3 This means that a loudspeaker, having certain size and weight limitations, can be designed to produce much greater output for limited frequency band speech transmission, compared to its output if designed for high quality reproduction. Less amplifier power is thus required with a resulting decrease in the size of the amplifier equipment for a given acoustic result. Any increase such as this in power efficiency reflects itself in a large system in a great saving in size, weight, and cost of the component parts of the system.
It is common knowledge to engineers in this field that overloading in loudspeaker systems, with the consequent harmonic generation, results in objectionable reproduc- tion which, beyond a certain point, reduces the intelligibility considerably. Olson and Massa4 have shown that this degradation of fidelity becomes less as the higher frequencies are cut out. These investigations show that with a high frequency cut- off of 5,000 cycles, as much as 25% second harmonic can be tolerated before be-
coming objectionable. Average curves, taken from data published, are shown in Figure 2 to illustrate the degree of overloading with harmonic content, the ordinate of which can also be considered as a measure of the reduction in intelligibility. It is also well known that cutting out as much of the low frequencies as possible (which do not contribute to intelligibility), as close to the input source as possible, greatly reduces the percentage of harmonics generated in the system. It can be seen that as the cut-off frequency is lowered, more and more harmonics generated by the addi- tional low frequencies fall in the reproduced band.
Perhaps an equally important, if not the most important effect of using a min-
imum bandwidth in this type of speech transmission system, is that there is invariably some source of interfering noise present. Under some conditions this noise is of a
predominately low frequency character, and at other times it is composed chiefly
of higher frequencies. It is generally, although not always, predominant in some portion of either of these regions. Thus by using the minimum band for speech, a
great deal of interfering noise spectrum is automatically kept out of the system.
Accordingly, additional reduction in harmonic generation is obtained and the effects of intermodulation of noise and signal, which are very often present when interfering noises are allowed to pass through audio systems, are also reduced.
In cases where there are strong signals such as whistles and the like, particularly in the low frequency region, a great deal of interference is caused due to the masking effect described and investigated by Fletcher2. For example, if these tones are allowed to pass through a system and out of the reproducer without attenuation, in addition to
causing overloading effects in the amplifier system as described above, they will tend to mask out the other signals or speech in the listener's ear.
The undesirable reverberation effects referred to before are also greatly reduced by limiting the frequncy band to just that necessary. When speech is reproduced, for instance, in a below -deck compartment, some portions of the low frequency sound occur at the natural resonant periods of the compartment. These frequencies are not only over accentuated, but the hangover effects due to long reverberation time are increased to such an extent that the intelligibility of speech is seriously reduced. Similar effects are encountered in talking -back over the system from the same location.
Not only is it of great importance to restrict the frequency band, but it is desirable
3Wente and Thuras, Journal of the Accoustical Society of America; July, 1931.
301son and Massa, Applied Acoustics, p. 465, The Blakiston Co.
www.americanradiohistory.com
1944 ACOUSTIC CONSIDERATIONS IN 2 -WAY 5 LOUDSPEAKER COMMUNICATIONS
that the overall response have an increase in amplification with increasing frequency. Wegal and Fletcher2 found that the maximum ear sensitivity occurs in the region of 3,000 cycles, so that it is important to have a rising amplification up to this frequency at least (Figure 3.). Measurements show that the speech power in the voice drops off from 1,000 cycles as the frequency rises, the vowel sounds having the greatest power are in the region of 1,000 cycles, the voice consonants with less power are in the 2,000 -cycles region, and the unvoiced consonants with the least power in the higher frequencies appear from 3,000 to 5,000 cycles.
It should therefore be desirable, and this is proved in actual practice, to have the frequency response continue to rise, preferably to at least 3,000 cycles. The degree of rise varies with the application, the design of loudspeakers, amplifiers, and microphones, and the minimum quality requirements if any, but the rise should be between 6 db and 10 db per octave. These values have been verified in surveys made by the writer with acoustic equipment of known characteristics and amplifiers equipped with calibrated networks, permitting adjustment of the response in both directions of transmission until optimum results were obtained.
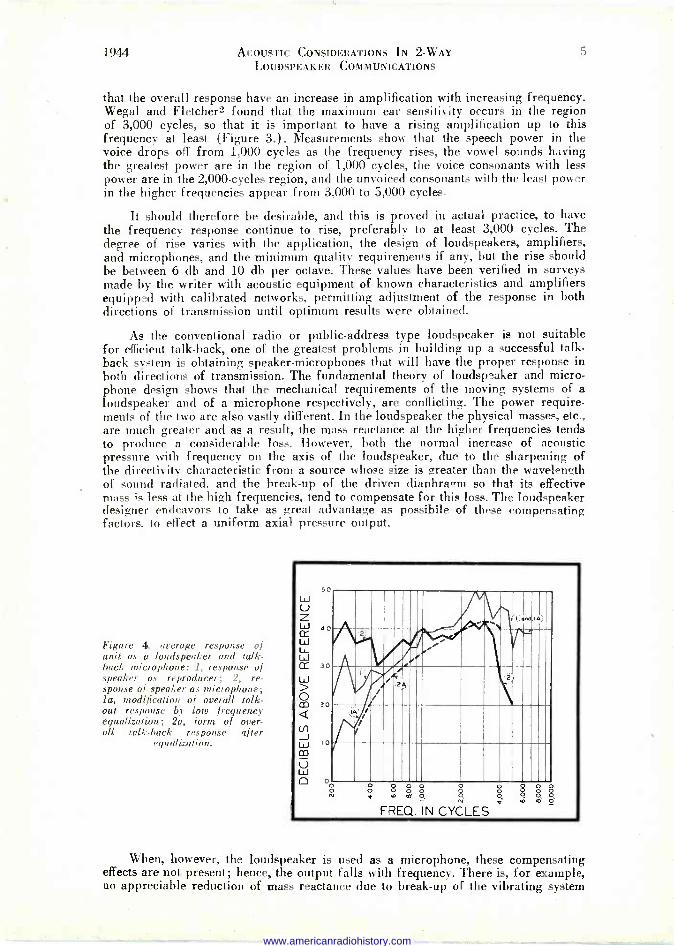
As the conventional radio or public-address type loudspeaker is not suitable for efficient talk -back, one of the greatest problems in building up a successful talk - back system is obtaining speaker -microphones that will have the proper response in both directions of transmission. The fundamental theory of loudspeaker and micro- phone design shows that the mechanical requirements of the moving systems of a loudspeaker and of a microphone respectively, are conflicting. The power require- ments of the two are also vastly different. In the loudspeaker the physical masses, etc., are much greater and as a result, the mass reactance at the higher frequencies tends to produce a considerable loss. However, both the normal increase of acoustic pressure with frequency on the axis of the loudspeaker, due to the sharpening of the directivity characteristic from a source whose size is greater than the wavelength of sound radiated, and the break-up of the driven diaphragm so that its effective mass is less at the high frequencies, tend to compensate for this loss. The loudspeaker designer endeavors to take as great advantage as possibile of these compensating factors, to effect a uniform axial pressure output.
Figure 4. average response of unit as a loudspeaker and talk - back microphone: 1, response of speaker as reproducer; 2, re- sponse of speaker as microphone; la, modification of overall talk - out response by low frequency equalization; 2a, form of over- all talk -back response after
equalization.
50
40
30
eo
10
o
, ` 1IaMlAi
'2:
' i i
(f`.
Ì ,4
33: 2i
lA'/
l
D a 8 8 8 m u 0
8 0 0 0 8 8 N
FREQ. IN CYCLES
When, however, the loudspeaker is used as a microphone, these compensating effects are not present; hence, the output falls with frequency. There is, for example, no appreciable reduction of mass reactance due to break-up of the vibrating system
www.americanradiohistory.com
6 THE RADIO ENGINEERS' DIGEST OCTOBER
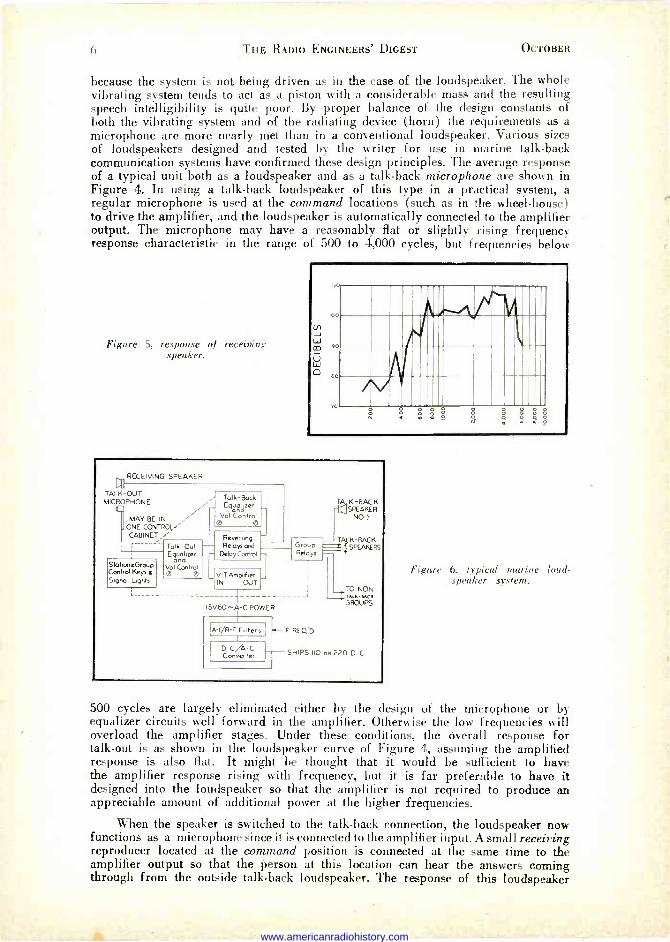
because the system is not being driven as in the case of the loudspeaker. The whole vibrating system tends to act as a piston with a considerable mass and the resulting speech intelligibility is quite poor. By proper balance of the design constants of both the vibrating system and of the radiating device (horn) the requirements as a microphone are more nearly met than in a conventional loudspeaker. Various sizes of loudspeakers designed and tested by the writer for use in marine talk -back communication systems have confirmed these design principles. The average response of a typical unit both as a loudspeaker and as a talk -back microphone are shown in Figure 4. In using a talk -back loudspeaker of this type in a practical system, a regular microphone is used at the command locations (such as in the wheel -house) to drive the amplifier, and the loudspeaker is automatically connected to the amplifier output. The microphone may have a reasonably flat or slightly rising frequency response characteristic in the range of 500 to 4,000 cycles, but frequencies below
Figure 5, response of receiving speaker.
tn -J LJ
0
0
90
eo
70 O a S S
RECEIVING SPEAKER
TALK MICROPHONE
C
-OUT
MAY BE IN ONE CONTROL/
TA K -BACK -u\ SPEAKER
NO 1
Talk -Back Equalzer
Vol .Control 0 0
CABINET,/ --------
Reversing TALK -BACK Talk -Out Relays and Group SPEAKERS E zer
and Delay Control Relays
Sta ion&Group Vol Control Con rol Keys z 0 0 V-TArnplf,en Signal Lights IN OUT
JO NON -J TALE -MC.
ISV60^-A-C POWER GROUPS
IF REQ'D A-F/R-F Filters
SHIPS HO oe220 D -L D -C/A -C Converter
Figure 6, typical nutrine loud- speaker system.
500 cycles are largely eliminated either by the design of the microphone or by equalizer circuits well forward in the amplifier. Otherwise the low frequencies will overload the amplifier stages. Under these conditions, the overall response for talk -out is as shown in the loudspeaker curve of Figure 4, assuming the amplified response is also flat. It might be thought that it would be sufficient to have the amplifier response rising with frequency, but it is far preferable to have it designed into the loudspeaker so that the amplifier is not required to produce an appreciable amount of additional power at the higher frequencies.
When the speaker is switched to the talk -back connection, the loudspeaker now functions as a microphone since it is connected to the amplifier input. A small receiving reproducer located at the command position is connected at the same time to the amplifier output so that the person at this location can hear the answers coming through from the outside talk -back loudspeaker. The response of this loudspeaker
www.americanradiohistory.com
1949 ACOUSTIC CONSIDERATIONS IN 2 -WAY 7 LOUDSPEAKER COMMUNICATIONS
as a microphone, Figure 4, does not over -accentuate the low frequencies as much as would a conventional loudspeaker used as a microphone. It is still, however, very desirable to cut out a great proportion of the low frequencies below 400 or 500 cycles.
The receiving reproducer's characteristics are shown in Figure 3. This further reduces the undesirable low frequency reproduction and boosts the con- sonant region up to 3,000 cycles. It has been shown in practice that it is desirable in the receiving reproducer to further attenuate, gradually, frequencies below 2,000 cycles at the rate of about 6db per octave, to make up for the preponder- ance of these frequencies in the characteristic of the outside talk -back speaker. This can be seen from its response as a microphone. We can accomplish this in the input or low level circuits of the amplifier, and by suitable equalizers; these equal- izers, of course, being switched in automatically in the correct position for either the talk -out or the talk -back condition. A block diagram of a system incorporating these features appears in Figure, 6. The system is designed to give the over-all response, frequency attenuation, equalization, etc., in accordance with the require- ments described. Other features of the amplifier and the design of the relay circuits used for switching the acoustic apparatus to the input or to the output as required, are specially designed for systems of this type to avoid noise, oscillation, acoustic clicks. etc.. which a conventional public-address system would produce if it were used for this kind of a talk -back loudspeaker communication system.
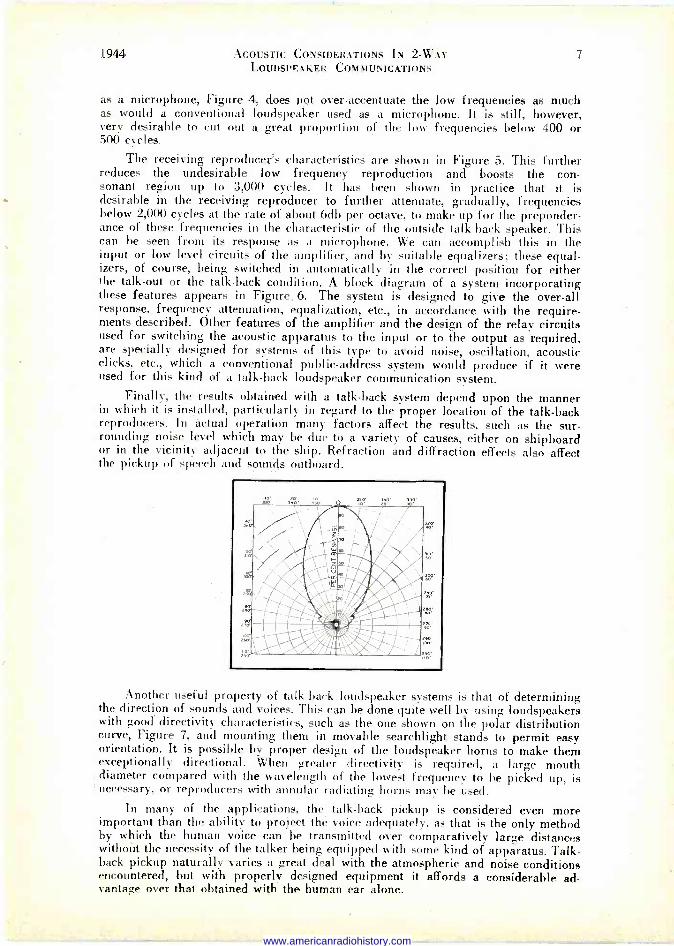
Finally, the results obtained with a talk -back system depend upon the manner in which it is installed, particularly in regard to the proper location of the talk -back reproducers. In actual operation many factors affect the results, such as the sur- rounding noise level which may be due to a variety of causes, either on shipboard or in the vicinity adjacent to the ship. Refraction and diffraction effects also affect the pickup of speech and sounds outboard.
_,'
DO
i
i1:4/ +,; i1ü i
1
u u1r -'
Another useful property of talk -back loudspeaker systems is that of determining the direction of sounds and voices. This can be done quite well by using loudspeakers with good directivity characteristics, such as the one shown on the polar distribution curve, Figure 7, and mounting them in movable searchlight stands to permit easy orientation. It is possible by proper design of the loudspeaker horns to make them exceptionally directional. 'When greater directivity is required, a large mouth diameter compared with the wavelength of the lowest frequency to be picked up, is necessary, or reproducers with annular radiating horns may he used.
In many of the applications, the talk -back pickup is considered even more important than the ability to project the voice adequately, as that is the only method by which the human voice can be transmitted over comparatively large distances without the necessity of the talker being equipped with some kind of apparatus. Talk - back pickup naturally varies a great deal with the atmospheric and noise conditions encountered, but with properly designed equipment it affords a considerable ad- vantage over that obtained with the human ear alone.
www.americanradiohistory.com

8
STAGE -BY -STAGE TESTS Reprinted from Radio -Craft
By Jack King
Your Signal Generator Will Help You Find Hidden Troubles
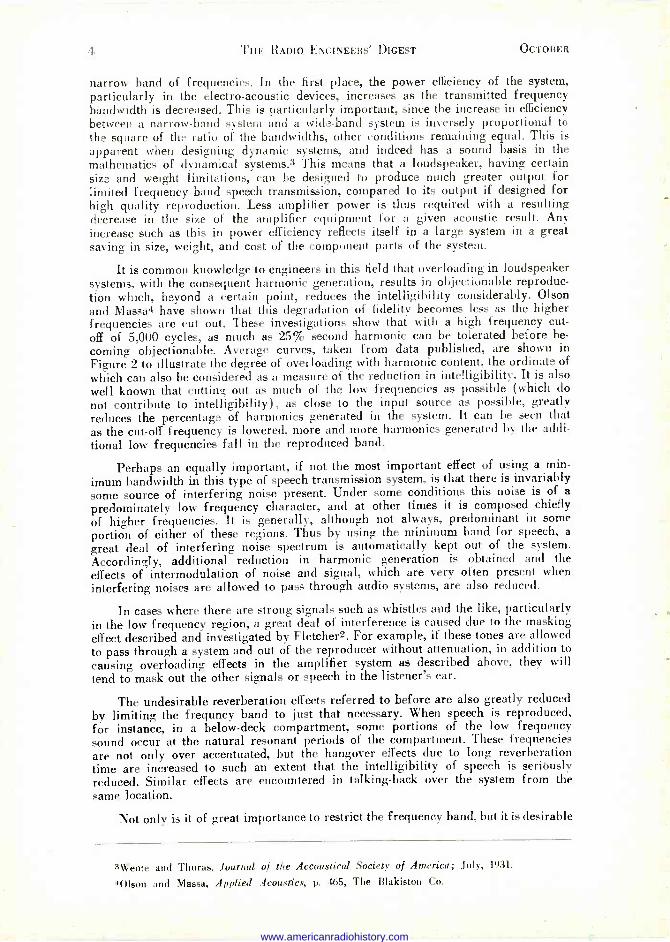
THE signal generator is a useful tool. It can be employed for other purposes besides alignment of a receiver. In stage -by -stage testing it permits in many
cases rapid diagnosis of the trouble. In Fig. 1 the diagram of a typical radio receiver is shown. Let's use the stage by stage technique in trouble shooting in this set.
First, by using the audio modulation signal of 400 cycles per second, we can test the audio section. We may connect two leads from the audio tip jacks on the generator to the two outside terminals of the volume control (R-26 in Fig. 1), with the receiver's volume control set at minimum. Now, if gain is brought up by advancing the control, the audio note should be heard. If it is loud and clear we know the audio stages are working properly. If the note is not heard the generator prods can be shifted to the grid of the 6K5 and ground. Should the signal now be heard, we might look for an open in condenser 28.
Let's assume that no signal was heard with the generator connected to the 6K5 grid and ground but that a signal does get through with the genérator connected to the 6F6 grid and ground. We would suspect an open in C-34, or possibly some de- fect in the 6K5 stage, such as a bad 6K5, an open in its grid or plate circuit, or pos- sibly a short circuit from grid to ground.
All of these conditions would be possibilities. In finding the trouble we would eliminate, in a step by step process of reasoning and testing, all of the possible causes of the trouble. For example, whether C-34 is open or not can readily be determined by shunting a new condenser across it and observing the results. Whether there is a short from grid to ground can be determined by inspecting the wiring
RED BLN CND
_._ DE T.-O5C RABE.
_ .Mf TO
.C'L Ì', _dI 12
0[C,..Dt.
oe .
D.r U[ID ,!Y .-óñiroar 1
%óérou vKJswo.. _
w.rtt
emeS 6E7G
IS t.oe..,
q.i e m B Q:coon . Aloo
b.[cro. ot eor.rw. " n os,,,,, -"- . ... 1 - teD. et.. DI [w,rt. gi * <A Y. w u5[D D RDD[-(y wc.t iOB O.U. --.: ....-..., _... , _ -
... . - ...,;ëa ... _.--- --------- nuo to[
D [u[
2
(-p .«%" "
Of C
ueratss..n [crw.iiñ.
rntow
o 1RDn
t]Dn RECT .tusw 514G
11.e.11.111, LESS.,& 'suu
101n
73D 470 -i7n K.C.
Fig. 1. The Philco 38-7, 38-8 and 38 9, a typical radio receiver shown here to demonstrate the technique of stage by -stage testing.
Copyright 1944, Radcraft Publications, Inc., 25 West Broadway, N. Y. C. (Radio -Craft, August 1944)
www.americanradiohistory.com
STAGE -BY -STAGE TESTS 9
and by using an ohmmeter. By indicating the defective stage or section of the set, the generator technique speeds up the work and you don't need to test every circuit with the volt -ohmmeter.
But suppose even the grid -ground connection in the 6F6 stage does not produce an audible response in the loud -speaker, what then? We may look for trouble in the 6F6, in the part of the 6F6 stage, or possibly in the loud -speaker. Shifting the gener- ator connection to the plate and ground in the 6F6 stage will show whether the speaker is working. If we hear a signal now, we know that the trouble lies between the 6F6 grid and the 6F6 plate. The lack of gain might be due to an open in the 6F6 grid circuit, a short from grid to ground, a weak emission 6F6 or possibly lower than normal heater, plate and screen voltages. A voltage test would quickly show the conditions in the 6F6 stage.
Because voltage measurements generally show the nature of the trouble quickly the signal generator technique is usually used only when there is some obscure or difficult condition to trace, such as distortion. However, the signal need not, necessarily, be furnished by a serviceman's signal generator. In a sense, a record player of the crystal pickup type is a generator, and such a record player is a handy thing to have around when checking for volume and distortion. The output of the record player can be fed to the two end terminals of the volume control (R-26) in a set such as this one, to provide an audio signal for checking purposes. If it is found that no distortion is heard when this is done, the trouble definitely is localized in some stage ahead of the audio input stage, which is a very useful bit of information to have.
The distortion is shown up in many cases by a changing of the note of the audio generator signal. It is somewhat easier to detect a change in a single frequency note than it is to detect a change in a composite signal such as the musical output signal of a record player or the music and voice modulated signal of a radio station. Therefore, we can check readily by shifting the generator connection along from grid to ground on each stage, being sure to use a blocking condenser to prevent disturbing any D.C. circuits. Unless the generator has larger than usual output, it may be found somewhat difficult to test the detector circuit by feeding in a signal to the plate and ground of the 6K7 I.F. stage. In many cases a weak signal will come through. Then, shifting the connection of the generator to the grid of the 6K7, a much louder signal should be heard, indicating the 6K7 is contributing to the gain of the receiver. The receiver's volume control should be at maximum when making these tests. Next the generator is connected to the grid of the 6A8, with the receiver dial set at 550 Kc. and the generator dial set at the I.F. The receiver circuit is disturbed by the addition of the test cable and the shunt impedance of the generator, but practical servicemen find such objections inconsequential and use the tests every day in their work.
Suppose the I.F. signal gets through from the 6A8 grid to the loud -speaker and yet the radio does not pick stations as the dial is tuned over the band. This defect points most probably to oscillator failure. There is a simple way of checking the oscillator. Set the service generator for unmodulated output, couple it loosely to the grid of the mixer by attaching the generator cable clip to the insulated grid wire (no direct connection). Then advance the generator output control or attenuator to about half -scale. The receiver dial may be set at about 1000 Kc., volume advanced to maximum. The generator dial is then tuned from about 1000 to 2000 and if a number of stations are heard it is clear the receiver's oscillator circuit is not working. Beat notes will be heard if the receiver's oscillator is working. Another way of checking the receiver oscillator is to connect a high resistance voltmeter between the oscillator grid and the cathode, the negative terminal of the meter going to the grid, the positive to the cathode. If a reading is obtained with the instrument set on the 0-10 volt range, the oscillator is working. If a reading is not obtained, or a reverse reading is given, the oscillator is not working and should be checked. There may be an open oscillator coil, shorted oscillator tuning condenser, or a lack of anode and filament voltage on the oscillator causing the trouble.
www.americanradiohistory.com
10
USING CATHODE COUPLING Reprinted from Electronic Industries
By 6i'. Muller
Useful applications of cathode follower systems at low and high frequencies. Basic circuit characteristics.
AMONG the large variety of tube circuits that are daily employed to carry out all sorts of jobs the "cathode follower circuit" seems to be sort of a stepchild
among the greater part of electronic workers. In general while a few radio en- gineers and laboratory men seem to have recognized the value of cathode follower circuits and their applications, many others never have become fully aware of their features. The cathode follower is a most useful circuit in these times when parts are at a premium.
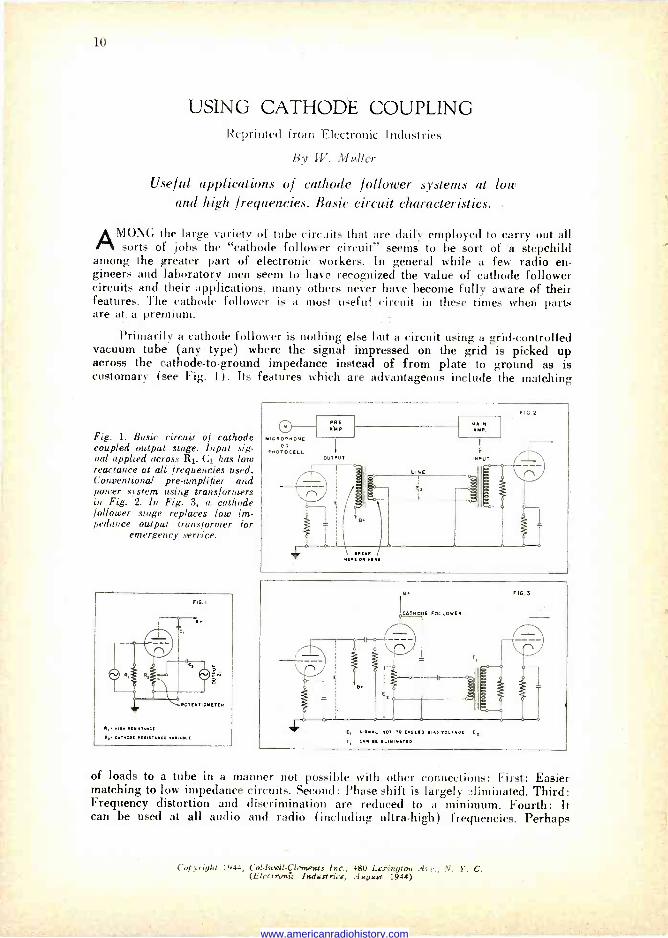
Primarily a cathode follower is nothing else but a circuit using a grid -controlled vacuum tube (any type) where the signal impressed on the grid is picked up across the cathode -to -ground impedance instead of from plate to ground as is customary (see Fig. 11. Its features which are advantageous include the matching
Fig. 1. Basic circuit of cathode coupled output stage. Input sig- nal applied across RI. C1 has low reactance at all frequencies used. Conventional pre -amplifier and power system using transformers in Fig. 2. In Fig. 3, a cathode follower stage replaces low im- pedance output transformer for
emergency service.
FIG I
R, xltR MIST.« Rt. CSTXOOt RtHETSRGE ulRttt
Be
CATHODE FOLLOWER
C. SILRSL ROT TOERCLED Oust VOLTA« EL
T. COX OE LlIY1I.STLO
FIG 3
of loads to a tube in a manner not possible with other connections: First: Easier matching to low impedance circuits. Second: Phase shift is largely eliminated. Third: Frequency distortion and discrimination are reduced to a minimum. Fourth: It can be used at all audio and radio (including ultra -high) frequencies. Perhaps
Copyright 1944, ColdwelLClements Inc.. 480 Lexington Az e., N. Y. C. (Electronic Industries, August 1944)
www.americanradiohistory.com

USING CATHODE COUPLING 11
there are some other advantages, but the aforementioned are the most obvious. The disadvantages are as follows: First: No voltage amplification results. That is,
the theoretical energy transfer is unity, but in practice is slightly less (usually about 90 per cent of input signal). Second: Th? tube selected must be able to handle maximum signal at input, which in some applications might be almost any 1( s'
Third: The output signal is in phase with input signal, which might be objectionabl_e in some cases. Fourth: Since there is no gain, but a slight loss, this might mean that additional amplification would be required. Certain other disadvantages are not listed since they have little bearing on the following.
Referring back to the first advantage, namely easier matching of loads at low impedances, assume the conditions in Fig. 2. where a microphone or phototube preamplifier is to be matched into a 600 -ohm line. Generally we use a preamplifier - to -line output transformer to do this, that is, the primary of the transformer is fed from the final tube in the preamplifier and the signal appearing across this primary usually is stepped down to match the desired secondary impedance of 600 ohms. On th? other end of the line we have another transformer, usually step-up, that feeds the grid of the next amplifier, whatever this amplifier might be. This operation calls for two line -matching transformers, and if the installation is high quality. the transformers have to be the best. To apply cathode follower circuits to this application to eliminate the need for the transformers, first ascertain the operating level of the signal that would be normally delivered to the primary of the line output transformer. Then select a tube whose bias is large enough to cover the maximum excursions of the incoming signal, and connect as per Fig. 3, and tap the cathode resistor at a point equal to the desired line impedance of 600 ohms. The gain of the next unit is then raised slightly so as to conpensate for the loss incurred in the cathode follower. Since line levels for preamplifier circuits are low, no real problem will be experienced. Another point is that the grid input of the following circuit can be worked directly from the line, that is. high impedance input with no detrimental effects.
If the tube used happens to he a 6C5 then the impedances in the output load impedance can be varied from 1 to 2000 ohms, with any intermediate step, that might be desirable as in Fig. 4. Distortion and frequency discrimination will be
Fig. 4. Circuit for low frequency applications. Plate to ground capacitor eon be several mfd.
www.americanradiohistory.com

12 THE RADIO ENGINEERS' DIGEST OCTOBER
nil. Here a simple tube replaces a hard -to -get transformer.
This example covers one instance of the application. The next example will cover line matching where a number of points are to be supplied with signal energy as in the case of test positions in a radio set factory. The problem here is to feed a number of test positions with a 450 kc signal, as in Fig. 5. Here again the procedure is similar to the first problem. The required test voltage seldom runs over 3 volts. The line used will be coax. The master generator is terminated into the line either inductively or through a cathode follower. By taping the cathode resistor as needed, the coaxial cable can be easily matched, terminating the far end into a fixed
TESTROOM FIG 5
MAST ER OSCILLATOR
R.F. SIGNAL UP TO)OOMC
_J
x
TEST Pos.1
12N PUT
r TEST POS.2
X
VTM
T TEST POS.S
SUGGESTED FACTORY TEST POSITION LAYOUT
CAN 8E CARRIED TO X STATIONS
X x o
TEST POS.
UNIT FOR TEST POSITION ( POWER SUPPLY NOT SHOWN)
X
XT
1
TEST POS.S
STEP
ATTENUATOR
OUTPUT
Fig. 5. RF test signal distribution system using cathode followers to take signal from coaxial line. Tubes at each test position produce negligible loading of line, give low impedance output.
resistance. All test point positions have a cathode follower whose grid is fed directly from the line (high impedance input) and whose output can have a readily con- structed output attenuator of the resistive type. Attenuation will be smooth and easily accomplished. No other forms of matching will be needed.
If the level on a line or output of a device runs as high as 100 or 200 volts, the only rule to be observed is to provide a cathode follower tube, whos bias is as large or larger than the maximum signal encountered. When cathode follower tubes are used at high frequencies it is advisable to by-pass the plate circuits
www.americanradiohistory.com
1944 USING CATHODE COUPLING 13
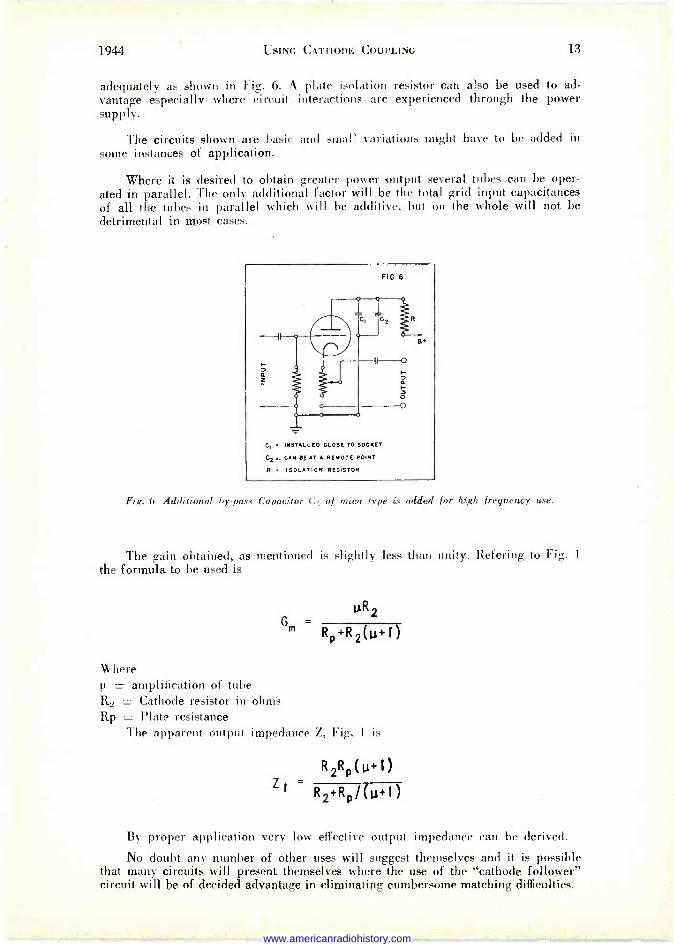
adequately as shown in Fig. 6. A plate isolation resistor can also be used to ad- vantage especially where circuit interactions are experienced through the power supply.
The circuits shown are basic and small variations might have to be added in some instances of application.
Where it is desired to obtain greater power output several tubes can be oper- ated in parallel. The only additional factor will be the total grid input capacitances of all the tubes in parallel which will be additive, but on the whole will not be detrimental in most cases.
FIG.6
CI INSTALLED CLOSE TO SOCKET
CZ.. CAN SE AT A REMOTE POINT
R ISOLATION RESISTOR
Fig. 6. Additional by-pass Capacitor C1 of mica type is added for high frequency use.
The gain obtained, as mentioned is slightly less than unity. Refering to Fig. 1
the formula to be used is
Gm - µR2
Rp+R2(u+l)
Where
N = amplification of tube R2 = Cathode resistor in ohms Rp = Plate resistance
The apparent output impedance Z, Fig. 1 is
Z
R2Rp(u+1)
R2+R/(µ+1)
By proper application very low effective output impedance can be derived.
No doubt any number of other uses will suggest themselves and it is possible that many circuits will present themselves where the use of the "cathode follower" circuit will be of decided advantage in eliminating cumbersome matching difficulties.
www.americanradiohistory.com
H -F CRYSTAL OSCILLATOR CIRCUITS Reprinted from Radio
By Joseph J. Anlage
Engineer, North American Philips Co.
An analysis of high -frequency crystal oscillator circuits is given. A special circuit for high harmonic operation is discussed.
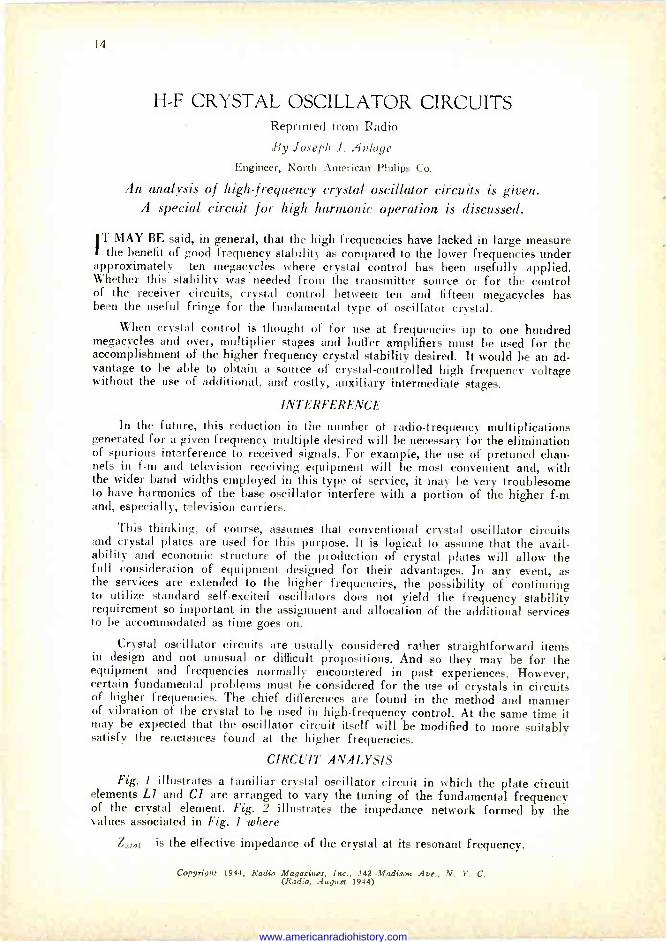
IT MAY BE said, in general, that the high frequencies have lacked in large measure the benefit of good frequency stability as compared to the lower frequencies under
approximately ten megacycles where crystal control has been usefully applied. Whether this stability was needed from the transmitter source or for the control of the receiver circuits, crystal control between ten and fifteen megacycles has been the useful fringe for the fundamental type of oscillator crystal.
When crystal control is thought of for use at frequencies up to one hundred megacycles and over, multiplier stages and buffer amplifiers must be used for the accomplishment of the higher frequency crystal stability desired. It would be an ad- vantage to be able to obtain a source of crystal -controlled high frequency voltage without the use of additional, and costly, auxiliary intermediate stages.
INTERFERENCE
In the future, this reduction in the number of radio -frequency multiplications generated for a given frequency multiple desired will be necessary for the elimination of spurious interference to received signals. For example, the use of pretuned chan- nels in f -m and television receiving equipment will be most convenient and, with the wider band widths employed in this type of service, it may be very troublesome to have harmonics of the base oscillator interfere with a portion of the higher f -m and, especially, television carriers.
This thinking, of course, assumes that conventional crystal oscillator circuits and crystal plates are used for this purpose. It is logical to assume that the avail- ability and economic structure of the production of crystal plates will allow the full consideration of equipment designed for their advantages. In any event, as the services are extended to the higher frequencies, the possibility of continuing to utilize standard self-excited oscillators does not yield the frequency stability requirement so important in the assignment and allocation of the additional services to be accommodated as time goes on.
Crystal oscillator circuits are usually considered rather straightforward items in design and not unusual or difficult propositions. And so they may be for the equipment and frequencies normally encountered in past experiences. However, certain fundamental problems must be considered for the use of crystals in circuits of higher frequencies. The chief differences are found in the method and manner of vibration of the crystal to be used in high -frequency control. At the same time it may be expected that the oscillator circuit itself will be modified to more suitably satisfy the reactances found at the higher frequencies.
CIRCUIT ANALYSIS
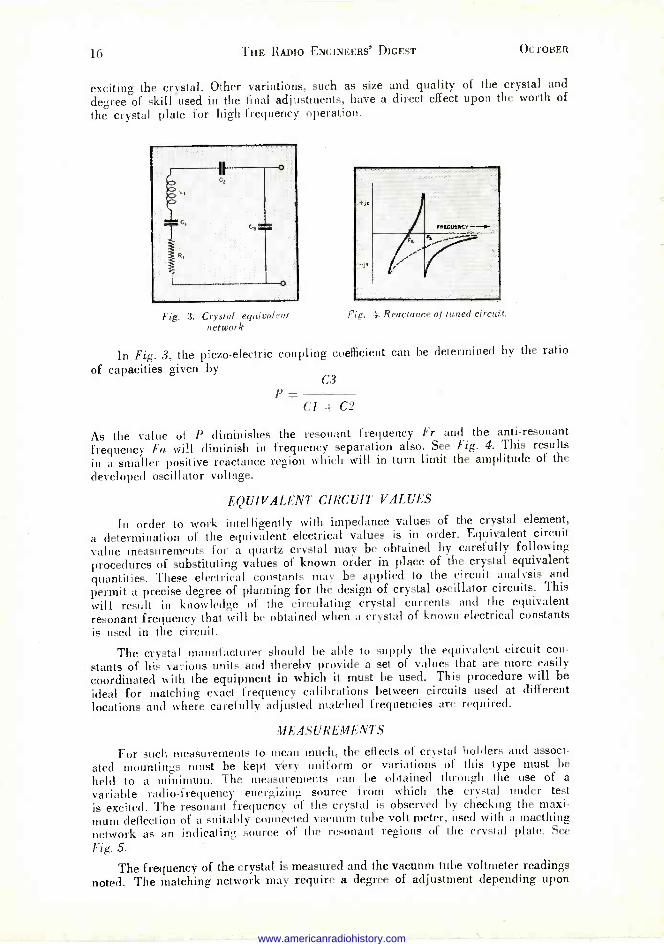
Fig. 1 illustrates a familiar crystal oscillator circuit in which the plate circuit elements Ll and Cl are arranged to vary the tuning of the fundamental frequency of the crystal element. Fig. 2 illustrates the impedance network formed by the values associated in Fig. 1 where
Zitat is the effective impedance of the crystal at its resonant frequency.
Copyright 1944, Radio Magazines, Imc., 342.Madioon Ave., N. Y. C. (Radio, August 1944)
www.americanradiohistory.com
H -F CRYSTAL OSCILLATOR CIRCUITS 15
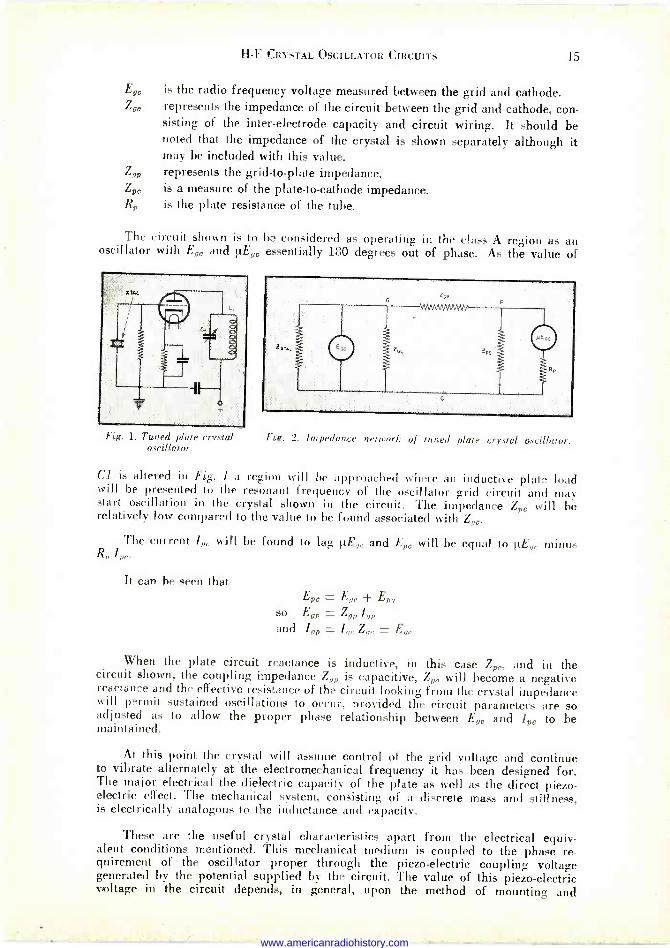
Ep0 is the radio frequency voltage measured between the grid and cathode. Zue represents the impedance of the circuit between the grid and cathode, con-
sisting of the inter -electrode capacity and circuit wiring. It should be noted that the impedance of the crystal is shown separately although it may be included with this value.
Z, represents the grid -to -plate impedance. Z,, is a measure of the plate -to -cathode impedance. RP is the plate resistance of the tube.
The circuit shown is to be considered as operating in the class A region as an oscillator with Ep and µE0 essentially 180 degrees out of phase. As the value of
Fig. 1. Tuned plate crystal oscillator.
Ire. 2. Impedance network of tuned plate crystal oscillator.
(:l k altered in Fig. I a region will be approached where an inductive plate load will he presented to the resonant frequency of the oscillator grid circuit and may start oscillation in the crystal shown in the circuit. The impedance Zn will he relatively low compared to the value to be found associated with Z.
The current In will be found to lag µE and EP will be equal to µE minus P,, !P.
It can he seen that EPo = Ep + Epg
so E9P = ZP IP and hp = 1 Zm = E
When the plate circuit reactance is inductive, in this case ZP, and in the circuit shown, the coupling impedance Z , is capacitive, Z will become a negative reactance and the effective resistance of the circuit looking from the crystal impedance will permit sustained oscillations to occur, provided the circuit parameters are so adjusted as to allow the proper phase relationship between Eg and IP to be maintained.
At this point the crystal will assume control of the grid voltage and continue to vibrate alternately at the electromechanical frequency it has been designed for. The major electrical the dielectric capacity of the plate as well as the direct piezo- electric effect. The mechanical system, consisting of a discrete mass and stiffness, is electrically analogous to the inductance and capacity.
These are the useful crystal characteristics apart from the electrical equiv- alent conditions mentioned. This mechanical medium is coupled to the phase re- quirement of the oscillator proper through the piezo-electric coupling voltage generated by the potential supplied by the circuit. The value of this piezo-electric voltage in the circuit depends, in general, upon the method of mounting and
www.americanradiohistory.com
16 THE RADIO ENGINEERS' DIGEST OCTOBER
exciting the crystal. Other variations, such as size and quality of the crystal and
degree of skill used in the final adjustments, have a direct effect upon the worth of
the crystal plate for high -frequency operation.
Fig. 3. Crystal equivalent network
F.g. 4. Reactance of tuned circuit.
In Fig. 3, the piezo-electric coupling coefficient can be determined by the ratio
of capacities given by C3
P- Cl + C2
As the value of P diminishes the resonant frequency Fr and the anti -resonant frequency Fa will diminish in frequency separation also. See Fig. 4. This results
in a smaller positive reactance region which will in turn limit the amplitude of the
developed oscillator voltage.
EQUIVALENT CIRCUIT VALUES
In order to work intelligently with impedance values of the crystal element,
a determination of the equivalent electrical values is in order. Equivalent circuit value measurements for a quartz crystal may be obtained by carefully following procedures of substituting values of known order in place of the crystal equivalent quantities. These electrical constants may be applied to the circuit analysis and
permit a precise degree of planning for the design of crystal oscillator circuits. This
will result in knowledge of the circulating crystal currents and the equivalent resonant frequency that will be obtained when a crystal of known electrical constants is used in the circuit.
The crystal manufacturer should be able to supply the equivalent circuit con-
stants of his various units and thereby provide a set of values that are more easily coordinated with the equipment in which it must be used. This procedure will be
ideal for matching exact frequency calibrations between circuits used at different locations and where carefully adjusted matched frequencies are required.
MEASUREMENTS
For such measurements to mean much, the effects of crystal holders and associ-
ated mountings must be kept very uniform or variations of this type must be
held to a minimum. The measurements can be obtained through the use of a
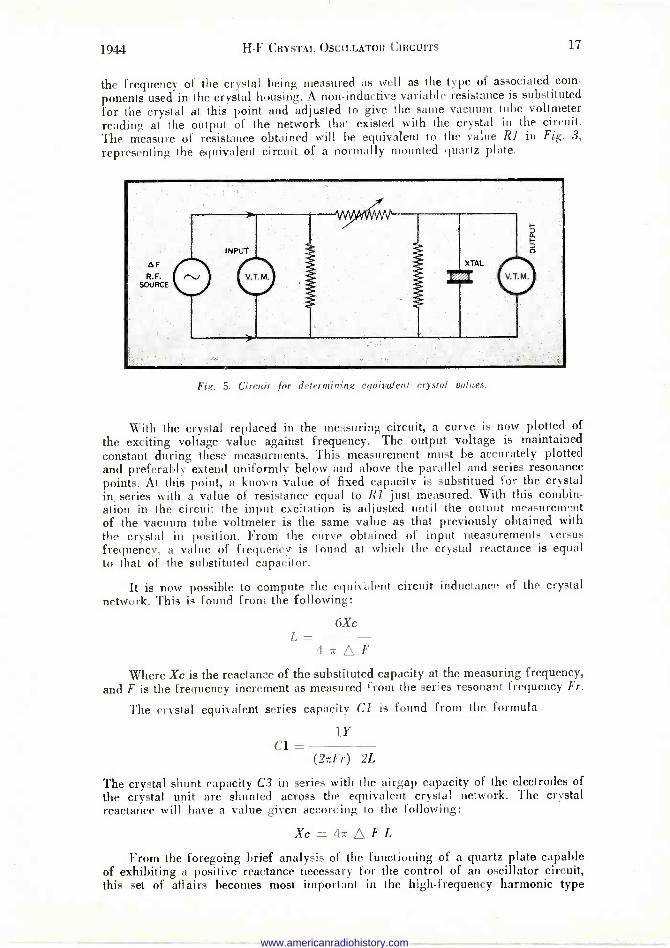
variable radio -frequency energizing source from which the crystal under test is excited. The resonant frequency of the crystal is observed by checking the maxi- mum deflection of a suitably connected vacuum tube volt meter, used with a macthing network as an indicating source of the resonant regions of the crystal plate. See
Fig. 5.
The frequency of the crystal is measured and the vacuum tube voltmeter readings noted. The matching network may require a degree of adjustment depending upon
www.americanradiohistory.com
1944 H -F CRYSTAL OSCILLATOR CIRCUITS 17
the frequency of the crystal being measured as well as the type of associated com-
ponents used in the crystal housing. A non -inductive variable resistance is substituted for the crystal at this point and adjusted to give the same vacuum tube voltmeter reading at the output of the network that existed with the crystal in the circuit. The measure of resistance obtained will be equivalent to the value Rl in Fig. 3,
representing the equivalent circuit of a normally mounted quartz plate.
Fig. 5. Circuit for determining equivalent crystal values.
With the crystal replaced in the measuring circuit, a curve is now plotted of the exciting voltage value against frequency. The output voltage is maintained constant during these measurments. This measurement must be accurately plotted and preferably extend uniformly below and above the parallel and series resonance points. At this point, a known value of fixed capacity is substitued for the crystal in, series with a value of resistance equal to Rl just measured. With this combin- ation in the circuit the input excitation is adjusted until the output measurement of the vacuum tube voltmeter is the same value as that previously obtained with the crystal in position. From the curve obtained of input measurements versus frequency, a value of frequency is found at which the crystal reactance is equal to that of the substituted capacitor.
It is now possible to compute the equivalent circuit inductance of the crystal network. This is found from the following:
L 6Xc
47rAF Where Xc is the reactance of the substituted capacity at the measuring frequency,
and F is the frequency increment as measured from the series resonant frequency Fr.
The crystal equivalent series capacity Cl is found from the formula
Cl - lY
(2;rFr) 2L
The crystal shunt capacity C3 in series with the airgap capacity of the electrodes of the crystal unit are shunted across the equivalent crystal network. The crystal reactance will have a value given according to the following:
Xc = 4zr Q F L
From the foregoing brief analysis of the functioning of a quartz plate capable of exhibiting a positive reactance necessary for the control of an oscillator circuit, this set of affairs becomes most important in the high -frequency harmonic type
www.americanradiohistory.com
18 THE RADIO ENGINEERS' DIGEST OCTOBER
of crystal and circuit.
CRYSTAL "Q" The ability of the crystal to perform this function efficiently is generally re-
ferred to as the Q of the quartz plate. This may be computed from the following:
1
Q= 27c Fr Cl R1
It has been shown by previous investigation (1) that it becomes increasingly difficult to excite the higher harmonic vibrations where a positive reactance of sufficient order is required to have the crystal assume control of the circuit. The limits involved may be shown as
P 1
2 Q
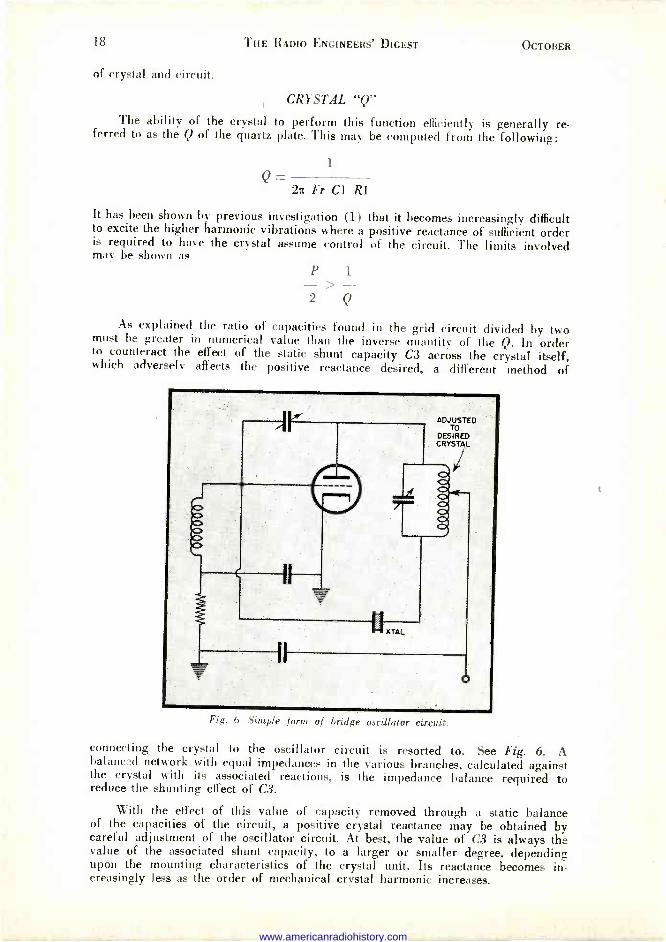
As explained the ratio of capacities found in the grid circuit divided by two must be greater in numerical value than the inverse quantity of the Q. In order to counteract the effect of the static shunt capacity C3 across the crystal itself, which adversely affects the positive reactance desired, a different method of
Fig. 6. Simple form of bridge oscillator circuit.
connecting the crystal to the oscillator circuit is resorted to. See Fig. 6. A balanced network with equal impedances in the various branches, calculated against the crystal with its associated reactions, is the impedance balance required to reduce the shunting effect of C3.
With the effect of this value of capacity removed through a static balance of the capacities of the circuit, a positive crystal reactance may be obtained by careful adjustment of the oscillator circuit. At best, the value of C3 is always the value of the associated shunt capacity, to a larger or smaller degree, depending upon the mounting characteristics of the crystal unit. Its reactance becomes in- creasingly less as the order of mechanical crystal harmonic increases.
www.americanradiohistory.com
1914 H -F CRYSTAL OSCILLATOR CIRCUITS 19
It is at once apparent that in order to be able to use, for example, the fifteenth harmonic of a six -megacycle crystal plate it is necessary that the reactance of the components associated with the crystal be of an order that will permit the crystal to provide the necessary amount of control reactance. To perform this function, a crystal must be prepared with great care in the final grinding stages. The plane parallel surfaces must conform to a symmetry and polish that is unusually perfect in view of past technique.
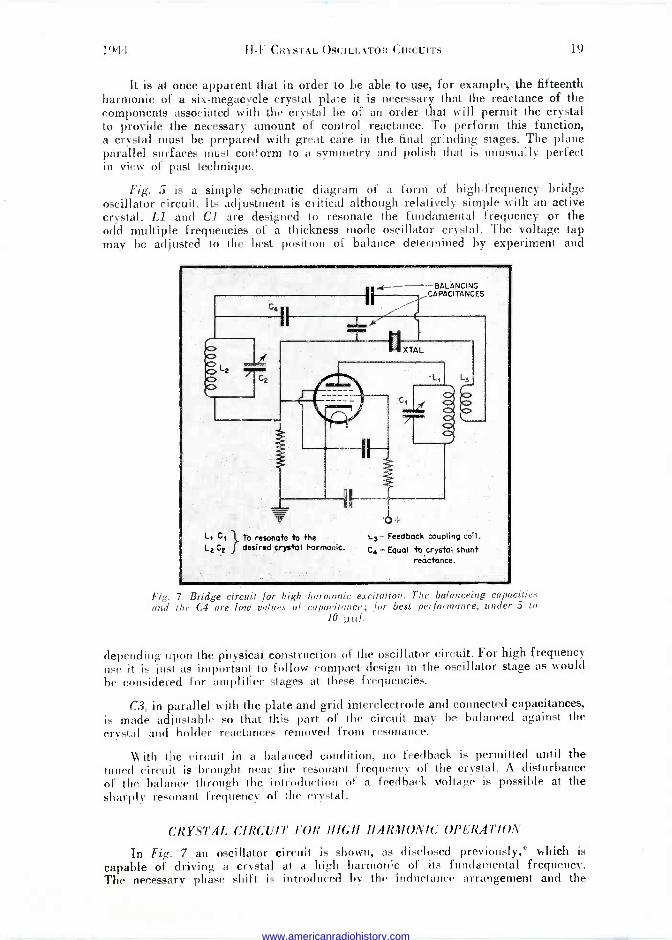
Fig. 5 is a simple schematic diagram of a form of high -frequency bridge oscillator circuit. Its adjustment is critical although relatively simple with an active crystal. Ll and Cl are designed to resonate the fundamental frequency or the odd multiple frequencies of a thickness mode oscillator crystal. The voltage tap may be adjusted to the best position of balance determined by experiment and
L.
.c -----BALANCING CAPACITANCES
L1 C1 1j To resonate to the L1 Cr ) desired crystal harmonic.
j O+
L3- Feedback coupling coil.
C4-Equal to crystal shunt recictance.
Fig. 7. Bridge circuit for high harmonic t. notion. The balunceing rupacitie, and the C4 are low values of capacitan,r: for best performance, under 5 to
10 uuf
depending upon the physical construction of the oscillator circuit. For high frequency use it is just as important to follow compact design in the oscillator stage as would he considered for amplifier stages at these frequencies.
C3, in parallel with the plate and grid interelectrode and connected capacitances, is made adjustable so that this part of the circuit may be balanced against the crystal and holder reactances removed from resonance.
With the circuit in a balanced condition, no feedback is permitted until the tuned circuit is brought near the resonant frequency of the crystal. A disturbance of the balance through the introduction of a feedback voltage is possible at the sharply resonant frequency of the crystal.
CRYSTAL CIRCUIT FOR HIGH HARMONIC OPERATION
In Fig. 7 an oscillator circuit is shown, as disclosed previously,* which is capable of driving a crystal at a high harmonic of its fundamental frequency. The necessary phase shift is introduced by the inductance arrangement and the
www.americanradiohistory.com

20 THE RADIO ENGINEERS' DIGEST
resonant circuits are tuned so that their anti -resonant frequencies coincide with the resonant harmonic of the crystal. This is the condition for maximum output and stabilization against voltage changes.
In operation, the condenser balancing the crystal is turned off its balancing value and the circuit is allowed to oscillate uncontrolled by the crystal. The grid and plate tuned circuits are next adjusted until maximum output results near the desired crystal frequency. The balancing condenser is then adjusted toward balance and the oscillation will usually stop.
The grid and plate capacities are then tuned to the crystal frequency and the oscillator will then oscillate and be controlled by the crystal only.
The temperature coefficient characteristics of crystals operated at their high harmonics have drift percentages directly related to the rate of change for frequency with temperature of the fundamental frequency of the crystal. For example, at ten megacycles, if a drift of two cycles per megacycle for a single degree centigrade is assumed, a total drift of twenty cycles would be obtained. If, at the fifth harmonic or fifty megacycles, a measurement under the same conditions was made a total drift of one hundred cycles would result.
Frequency stabilities much better than the above mentioned are very possible as well as r -f output somewhat above one hundred megacycles, from the oscillator stage alone. Tubes such as the 952 acorn pentode may be used in the circuitof Fig. 7, or other beam power tubes capable of more output and comparing favorably in electrical efficiency at these frequencies.
*Patent No. 2,259,528.
Science will not cure the world of its present sickness, but it can help power- fully-It can fortify man's critical spirit in an hour of deepest need. Its orderly approach to many material problems can be more widely extended. It has made a spiritual contribution to living and thinking that grows more apparent the more deeply men reflect upon it.
ISAIAH BOWMAN.
www.americanradiohistory.com
21
ANTENNA POWER DIVIDER Reprinted from Electronics
By Earl Travis
Chief Engineer, Radio Station K V EC San Luis Obispo, California
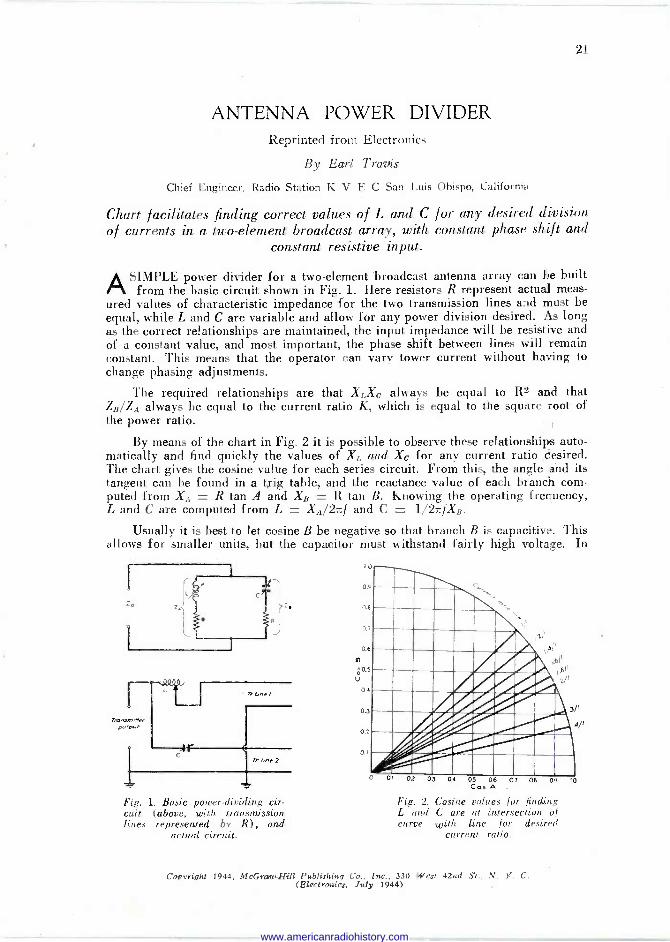
Chart facilitates finding correct values of L and C for any desired division of currents in a two -element broadcast array, with constant phase shift and
constant resistive input.
ASIMPLE power divider for a two -element broadcast antenna array can be built from the basic circuit shown in Fig. 1. Here resistors R represent actual meas-
ured values of characteristic impedance for the two transmission lines and must be equal, while L and C are variable and allow for any power division desired. As long as the correct relationships are maintained, the input impedance will be resistive and of a constant value, and most important, the phase shift between lines will remain constant. This means that the operator can vary tower current without having to change phasing adjustments.
The required relationships are that XLXC always be equal to R2 and that ZB/ZA always be equal to the current ratio K, which is equal to the square root of the power ratio.
By means of the chart in Fig. 2 it is possible to observe these relationships auto- matically and find quickly the values of XL and Xc for any current ratio desired. The chart gives the cosine value for each series circuit. From this, the angle and its tangent can be found in a trig table, and the reactance value of each branch com- puted from XA = R tan A and XB = R tan B. Knowing the operating frequency, L and C are computed from L = XA/27f and C = 1/27rfXB.
Usually it is best to let cosine B be negative so that branch B is capacitive. This allows for smaller units, but the capacitor must withstand fairly high voltage. In
r'iii r .un.,rrer
polpur.
b.,e
O.
0.8
0.7
0.6
m
0.5
V
7.4
0.3
01
0.1
rr. /.ne ?
Fig. 1. Basic power -dividing cir- cuit (above, with transmission lines represented by R), and
actual circuit.
'` ,\` 1b\_ ,
I, 1 Aj .;' /'', ' 1 .r/W o,, .! i%,'g P°.... _r-..
04 03 06 07 OA pe Cos A .
Fig. 2. Cosine values for finding L and C are at intersection of curve with line for desired
current ratio.
Copyright 1944, McGraw-Hill Publishing Co., Inc., 330 West 42nd St., N. Y. C. (Electronics, July 1944) .
10
/l
www.americanradiohistory.com
22 THE RADIO ENGINEERS' DIGEST
the case of high power it might be better to let cosine B be positive so its circuit is inductive. This will call for larger units, but the capacitor will not have to withstand such high voltage.
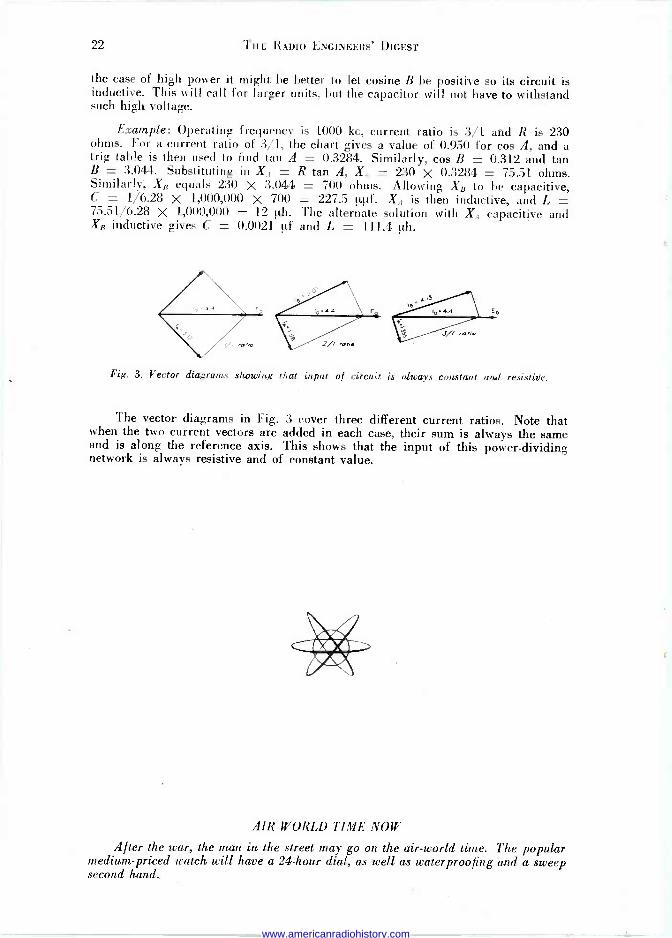
Example: Operating frequency is 1000 kc, current ratio is 3/1 and R is 230 ohms. For a current ratio of 3/1, the chart gives a value of 0.950 for cos A, and a trig table is then used to find tan A = 0.3284. Similarly, cos B = 0.312 and tan B = 3.044. Substituting in X1 = R tan A, XA = 230 X 0.3284 = 75.51 ohms. Similarly, XB equals 230 X 3.044 = 700 ohms. Allowing XB to be capacitive, C = 1/6.28 X 1,000,000 X 700 = 227.5 µµf. X Á is then inductive, and L = 75.51/6.28 X 1,000,000 = 12 µh. The alternate solution with X, capacitive and X5 inductive gives C = 0.0021 pi and L = 111.4 µh.
Fig. 3. Vector diagrams showing that input of circuit is always constant and resistive.
The vector diagrams in Fig. 3 cover three different current ratios. Note that when the two current vectors are added in each case, their sum is always the same and is along the reference axis. This shows that the input of this power -dividing network is always resistive and of constant value.
AIR WORLD TIME NOW
After the war, the man in the street may go on the air -world time. The popular medium-priced watch will have a 24 -hour dial, as well as waterproofing and a sweep second hand.
www.americanradiohistory.com
Z:,
A NEW HIGH-SPEED CIRCUIT TESTER Reprinted from Radio Service Dealer
By A. Liebscher
This electronic indicator has time -saving features, plus safety operating factors which prevent meter burnout . .. Random probers can be
"trigger- happy."
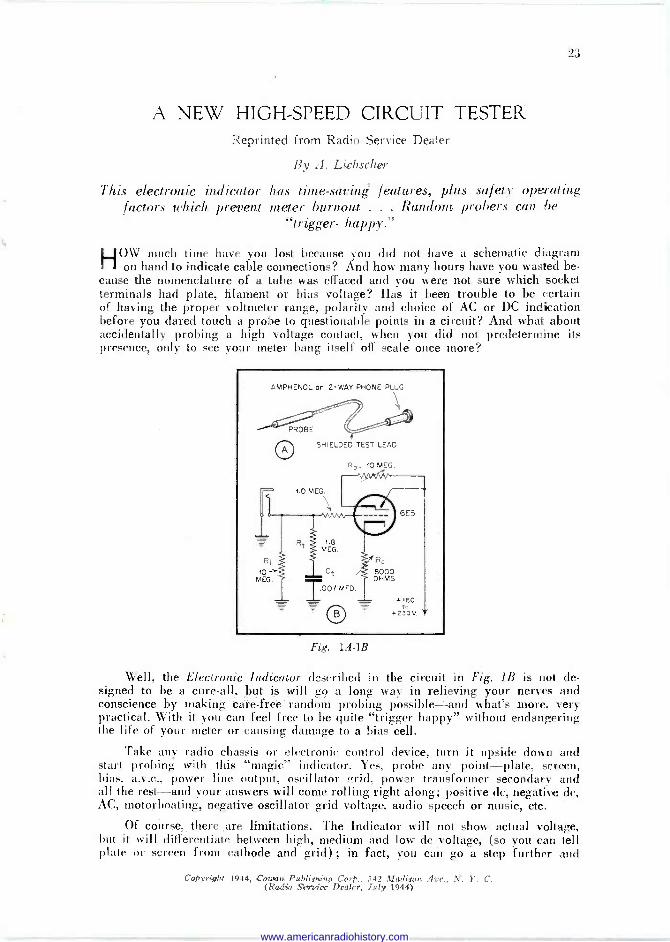
LJOW much time have you lost because you did not have a schematic diagram EII on hand to indicate cable connections? And how many hours have you wasted be- cause the nomenclature of a tube was effaced and you were not sure which socket terminals had plate, filament or bias voltage? Has it been trouble to be certain of having the proper voltmeter range, polarity and choice of AC or DC indication before you dared touch a probe to questionable points in a circuit? And what about accidentally probing a high voltage contact, when you did not predetermine its presence, only to see your meter bang itself off scale once more?
AMPHENOL or 2 -WAY PHONE PLUG
PROBE
SHIELDED TEST LEAD
R. 10 MEG.
Fig. 1A -1B
Well, the Electronic Indicator described in the circuit in Ftg. 1B is not de- signed to be a cure-all, but is will go a long way in relieving your nerves and conscience by making care -free random probing possible -and what's more, very practical. With it you can feel free to be quite "trigger happy" without endangering the life of your meter or causing damage to a bias cell.
Take any radio chassis or electronic control device, turn it upside down and start probing with this "magic" indicator. Yes, probe any point-plate, screen, bias. a.v.c., power line output, oscillator irrid, power transformer secondary and all the rest-and your answers will come rolling right along; positive dc, negative dc, AC, motorboating, negative oscillator grid voltage, audio speech or music, etc.
Of course, there are limitations. The Indicator will not show actual voltage, but it will differentiate between high, medium and low do voltage, (so you can tell plate or screen from cathode and grid) ; in fact, you can go a step further and
Copyright 1944, Cowan Publishing Corp., 342 Madison Ave., N. Y. C. (Radio Ssrzice Dealer, July 1944)
www.americanradiohistory.com
24 THE RADIO ENGINEERS' DIGEST OCTOBER
identify the ac filament contacts-all without turning a knob or even changing a
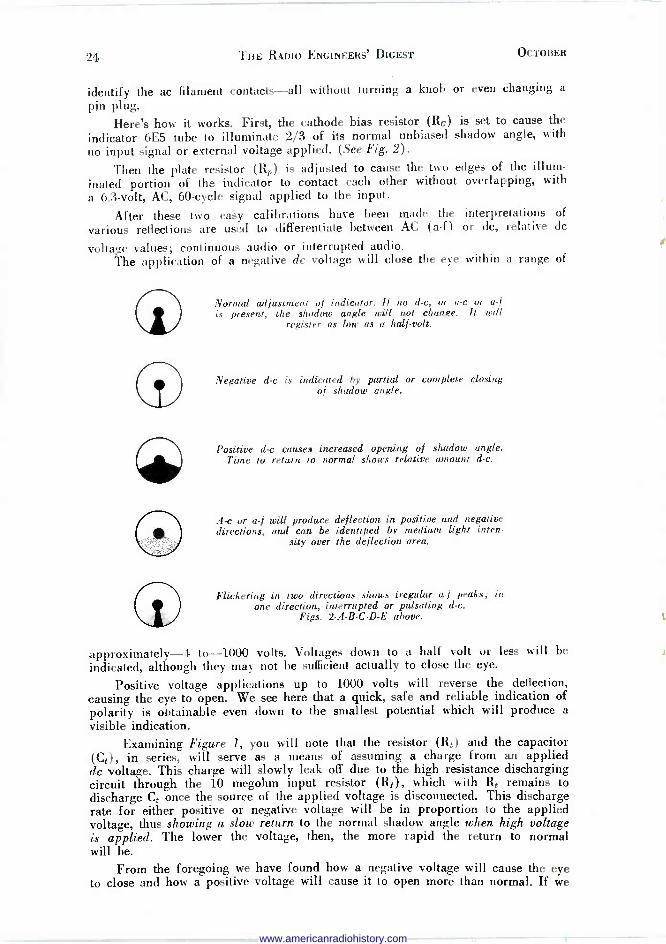
pin plug. Here's how it works. First, the cathode bias resistor (Re) is set to cause the
indicator 6E5 tube to illuminate 2/3 of its normal unbiased shadow angle, with no input signal or external voltage applied. (See Fig. 2).
Then the plate resistor (R4) is adjusted to cause the two edges of the illum- inated portion of the indicator to contact each other without overlapping, with a 6.3 -volt, AC, 60 -cycle signal applied to the input.
After these two easy calibrations have been made the interpretations of
various reflections are used to differentiate between AC (a -f) or dc, relative do
voltage values; continuous audio or interrupted audio. The application of a negative dc voltage will close the eye within a range of
Normal adjustment of indicator. If no d -c, or a -c or a -f is present, the shadow angle will not change. It will
register as low as a half -volt.
Negative d -c is indicated by partial or complete closing of shadow angle.
Positive d -c causes increased opening of shadow angle. Time to return to normal shows relative amount d -c.
A -c or a -f will produce deflection in positive and negative directions, and can be identified by medium light inten-
sity over the deflection area.
Flickering in two directions shows iregular a -f peaks; in one direction, interrupted or pulsating d -c.
Figs. 2 -A -B -C -D -E above.
approximately -4 to -1000 volts. Voltages down to a half volt or less will be indicated, although they may not be sufficient actually to close the eye.
Positive voltage applications up to 1000 volts will reverse the deflection, causing the eye to open. We see here that a quick, safe and reliable indication of polarity is obtainable even down to the smallest potential which will produce a visible indication.
Examining Figure 1, you will note that the resistor (Re) and the capacitor (Ci), in series, will serve as a means of assuming a charge from an applied dc voltage. This charge will slowly leak off due to the high resistance discharging circuit through the 10 megohm input resistor (R1), which with Re remains to discharge Ce once the source of the applied voltage is disconnected. This discharge rate for either positive or negative voltage will be in proportion to the applied voltage, thus showing a slow return to the normal shadow angle when high voltage is applied. The lower the voltage, then, the more rapid the return to normal will be.
From the foregoing we have found how a negative voltage will cause the eye to close and how a positive voltage will cause it to open more than normal. If we
www.americanradiohistory.com
1944 A NEW HIGH-SPEED CIRCUIT TESTER 25
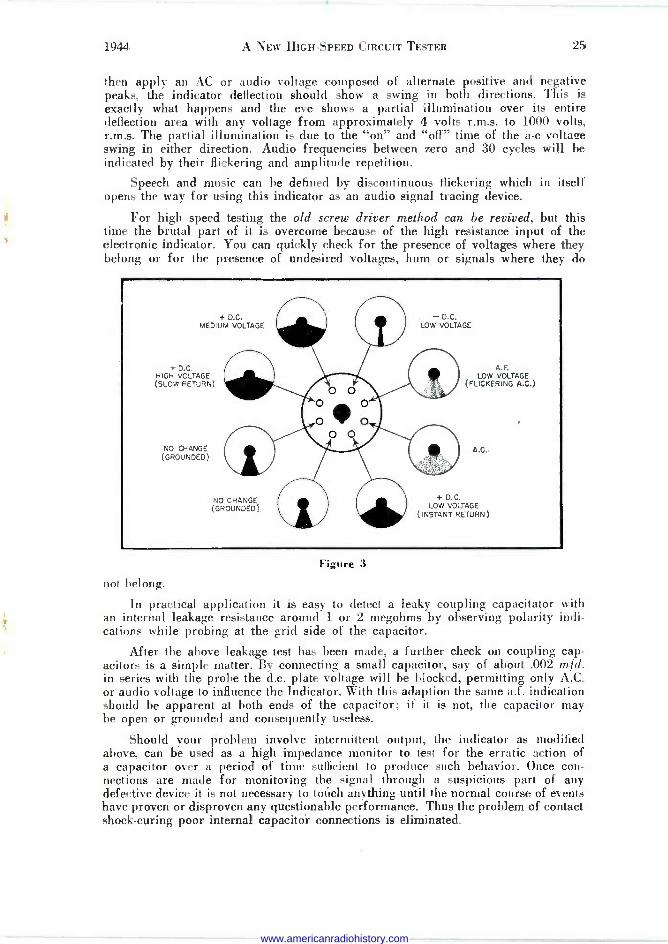
then apply an AC or audio voltage composed of alternate positive and negative peaks, the indicator deflection should show a swing in both directions. This is exactly what happens and the eye shows a partial illumination over its entire deflection area with any voltage from approximately 4 volts r.m.s. to 1000 volts, r.m.s. The partial illumination is due to the "on" and "off" time of the a -c voltage swing in either direction. Audio frequencies between zero and 30 cycles will be indicated by their flickering and amplitude repetition.
Speech and music can be defined by discontinuous flickering which in itself opens the way for using this indicator as an audio signal tracing device.
For high speed testing the old screw driver method can be revived, but this time the brutal part of it is overcome because of the high resistance input of the electronic indicator. You can quickly check for the presence of voltages where they belong or for the presence of undesired voltages, hum or signals where they do
+ D.C. MEDIUM VOLTAGE
+ D.C. HIGH VOLTAGE (SLOW RETURN)
NO CHANGE (GROUNDED)
NO CHANGE (GROUNDED)
- D.C. LOW VOLTAGE
A.F. LOW VOLTAGE
(FLICKERING A.C.)
A.C..
+ D.C. LOW VOLTAGE
(INSTANT RETURN)
Figure 3
not belong.
In practical application it is easy to detect a leaky coupling capacitator with an internal leakage resistance around 1 or 2 megohms by observing polarity indi- cations while probing at the grid side of the capacitor.
After the above leakage test has been made, a further check on coupling cap- acitors is a simple matter. By connecting a small capacitor, say of about .002 m f d. in series with the probe the d.c. plate voltage will be blocked, permitting only A.C. or audio voltage to influence the Indicator. With this adaption the same a.f. indication should be apparent at both ends of the capacitor; if it is not, the capacitor may be open or grounded and consequently useless.
Should your problem involve intermittent output, the indicator as modified above, can be used as a high impedance monitor to test for the erratic action of a capacitor over a period of time sufficient to produce such behavior. Once con- nections are made for monitoring the signal through a suspicious part of any defective device it is not necessary to touch anything until the normal course of events have proven or disproven any questionable performance. Thus the problem of contact shock -curing poor internal capacitor connections is eliminated.
www.americanradiohistory.com
Zfi
FIELD TESTING WITH EQUIPMENT LIMITATIONS Reprinted from Communications
By Dr. Otto J. Smith Director, Radio -Communications Engineering University of Denver
Testing Limitations
MANY times in field testing, an engineer finds himself in need of a measurement for which the most appropriate equipment is not available. For example, one
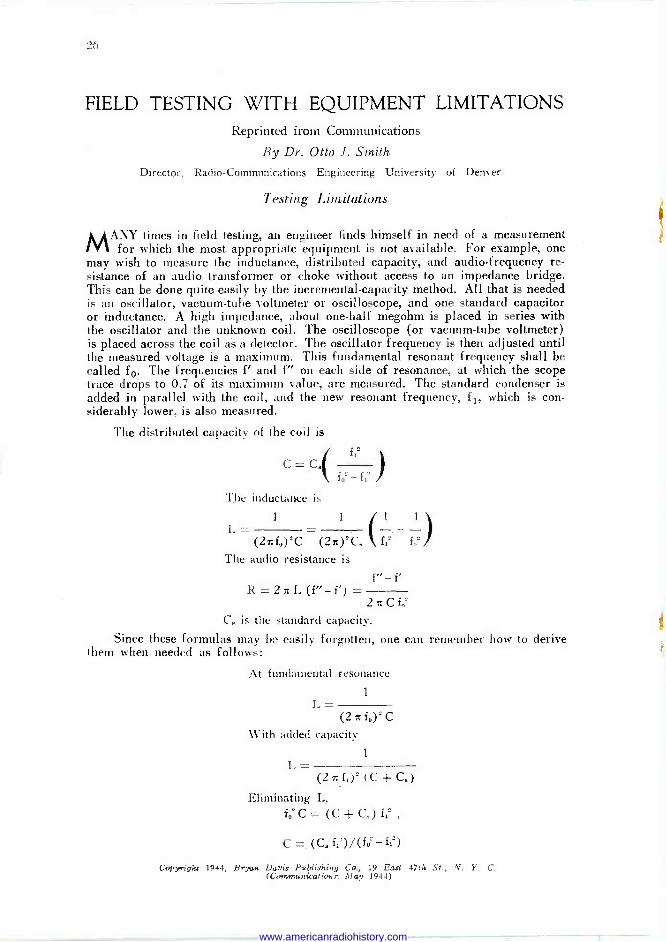
may wish to measure the inductance, distributed capacity, and audio -frequency re- sistance of an audio transformer or choke without access to an impedance bridge. This can be done quite easily by the incremental -capacity method. All that is needed is an oscillator, vacuum -tube voltmeter or oscilloscope, and one standard capacitor or inductance. A high impedance, about one-half megohm is placed in series with the oscillator and the unknown coil. The oscilloscope (or vacuum -tube voltmeter) is placed across the coil as a detector. The oscillator frequency is then adjusted until the measured voltage is a maximum. This fundamental resonant frequency shall be called fo. The frequencies f' and f" on each side of resonance, at which the scope trace drops to 0.7 of its maximum value, are measured. The standard condenser is added in parallel with the coil, and the new resonant frequency, fl, which is con- siderably lower, is also measured.
The distributed capacity of the coil is
C = C.
The inductance is
( f12
f02-f'
1
L= 1 1 1
(27do)2C _
(2102C, f12 f,2
The audio resistance is
f"-f'
R=2aI.(f"-f')= 2Cfo=
C. is the standard capacity.
Since these formulas may be easily forgotten, one can remember how to derive them when needed as follows:
At fundamental resonance
L= 1
(2 a f,)2 C
With added capacity
L= i
(27: fi)2 (C -1- C.)
Eliminating L, fo' C = (C + C, ) f=2 ,
C = (C. f,')/(f;-f=") Copyright 1944, Bryan Davis Publishing Co., 19 East 47th St., N. Y. C.
(Communications. May 1944)
www.americanradiohistory.com
FIELD TESTING WITH EQUIPMENT, LIMITATIONS 27
From the 0.707 points of the resonance curve,
But
1 Af f"- f'
2 Q f, 2 f,
Q= 2af,L
R
R f" -f' 27:f,I, fu
R=2aL(f"-f')
In case a known condenser is not available, a known inductance may be added in parallel with the coil, and the resonant frequency will rise. In this case the computations are:
{,- _ = L.(
1
C= (21) L. (f,2 -f02)
R = same as before.
This method is quite rapid, and the accuracy is very good if the change in
resonant frequency is large; for example, from about 12,000 cycles per second down
to a few hundred. For the usual audio coils, this can be accomplished with a con-
denser of about 0.01 or 0.1 mfd. If the coil has a fundamental resonant frequency outside of the range of the oscillator, capacity may be added in parallel to drop the
resonant frequency. The computed capacity will now be the sum of that added and the internal coil capacity.
For many purposes, d -c saturating current must be present in the coil at the
time that the measurements of inductance are made. The d -c is blocked from the
oscillator with a condenser of satisfactory voltage rating. A second condenser is
used to isolate the scope or whatever meter is used for an indicator.
In radio -frequency measurements, the same procedure is followed as with audio. Measurements on a tank circuit are made with the tuning condenser in place. Best results are obtained with a standard condenser of over three times the capacity of the tuning condenser.
It is easy to measure resonances that occur outside of the range of the oscil- lator, by driving the circuit at subharmonic frequencies. In this case there is a res-
onant rise of voltage for one of the harmonic components of the applied voltage wave. This produces an output wave distorted by one very prominent harmonic. The actual resonant frequency is the oscillator setting times the order of the harmonic.
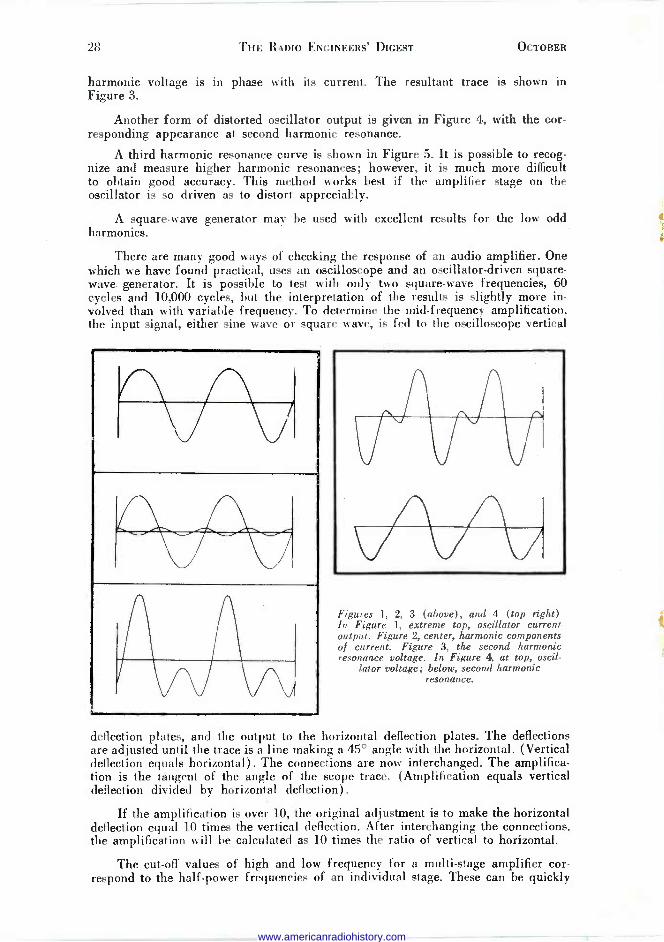
A common form of distorted amplifier output is shown in Figure 1. It has been exaggerated for study purposes. This has a second harmonic with a phase as shown in Figure 2. When the frequency is considerably below second harmonic resonance, both component voltages lead their respective currents by about 90°. This gives a trace similar to the negative of Figure 4a. When the oscillator is set at one-half resonant frequency, the fundamental voltage leads its current, and the second
www.americanradiohistory.com
28 THE RADIO ENGINEERS' DIGEST OCTOBER
harmonic voltage is in phase with its current. The resultant trace is shown in Figure 3.
Another form of distorted oscillator output is given in Figure 4, with the cor- responding appearance at second harmonic resonance.
A third harmonic resonance curve is shown in Figure 5. It is possible to recog- nize and measure higher harmonic resonances; however, it is much more difficult to obtain good accuracy. This method works best if the amplifier stage on the oscillator is so driven as to distort appreciably.
A square -wave generator may be used with excellent results for the low odd harmonics. _
There are many good ways of checking the response of an audio amplifier. One which we have found practical, uses an oscilloscope and an oscillator -driven square - wave generator. It is possible to test with only two square -wave frequencies, 60 cycles and 10,000 cycles, but the interpretation of the results is slightly more in- volved than with variable frequency. To determine the mid -frequency amplification, the input signal, either sine wave or square wave, is fed to the oscilloscope vertical
Figures 1, 2, 3 (above), and 4 (top right) In Figure 1, extreme top, oscillator current output. Figure 2, center, harmonic components of current. Figure 3, the second harmonic resonance voltage. In Figure 4, at top, oscil-
lator voltage; below, second harmonic resonance.
deflection plates, and the output to the horizontal deflection plates. The deflections are adjusted until the trace is a line making a 45° angle with the horizontal. (Vertical deflection equals horizontal) . The connections are now interchanged. The amplifica- tion is the tangent of the angle of the scope trace. (Amplification equals vertical deflection divided by horizontal deflection).
If the amplification is over 10, the original adjustment is to make the horizontal deflection equal 10 times the vertical deflection. After interchanging the connections, the amplification will be calculated as 10 times the ratio of vertical to horizontal.
The cut-off values of high and low frequency for a multi -stage amplifier cor- respond to the half -power frequencies of an individual stage. These can be quickly
www.americanradiohistory.com
1944 FIELD TESTING WITH EQUIPMENT LIMITATIONS 29
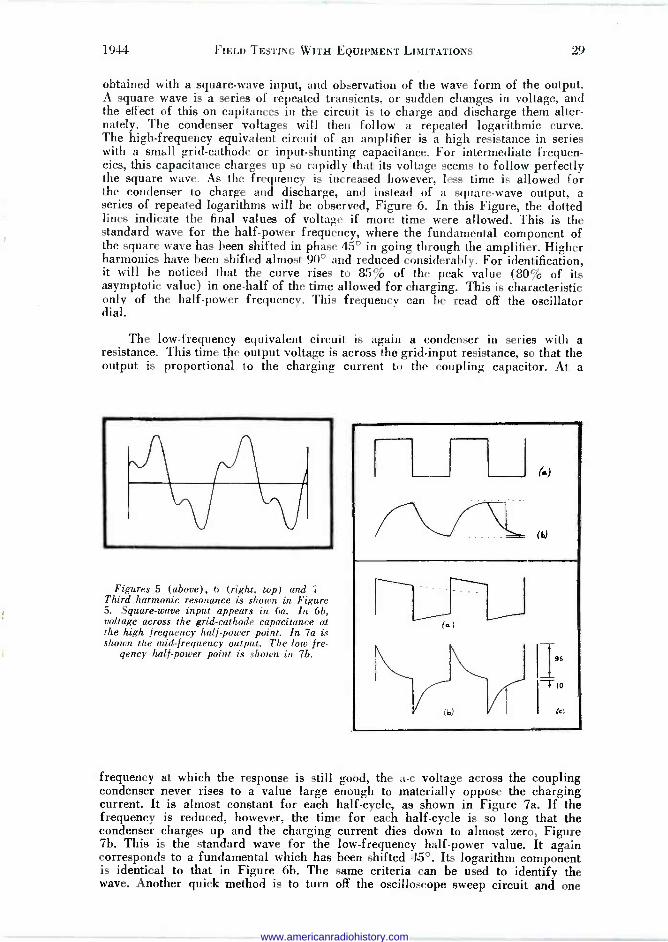
obtained with a square -wave input, and observation of the wave form of the output. A square wave is a series of repeated transients, or sudden changes in voltage, and the effect of this on capitanees in the circuit is to charge and discharge them alter- nately. The condenser voltages will then follow a repeated logarithmic curve. The high -frequency equivalent circuit of an amplifier is a high resistance in series with a small grid -cathode or input -shunting capacitance. For intermediate frequen- cies, this capacitance charges up so rapidly that its voltage seems to follow perfectly the square wave. As the frequency is increased however, less time is allowed for the condenser to charge and discharge, and instead of a square -wave output, a series of repeated logarithms will be observed, Figure 6. In this Figure, the dotted lines indicate the final values of voltage if more time were allowed. This is the standard wave for the half -power frequency, where the fundamental component of the square wave has been shifted in phase 45° in going through the amplifier. Higher harmonics have been shifted almost 90° and reduced considerably. For identification, it will be noticed that the curve rises to 85% of the peak value (80% of its asymptotic value) in one-half of the time allowed for charging. This is characteristic only of the half -power frequency. This frequency can be read off the oscillator dial.
The low -frequency equivalent circuit is again a condenser in series with a resistance. This time the output voltage is across the grid -input resistance, so that the output is proportional to the charging current to the coupling capacitor. At a
Figures 5 (above), 6 (right, top) and 7 Third harmonic resonance is shown in Figure 5. Square -wave input appears in 6a. In 6b, voltage across the grid -cathode capacitance at the high frequency half -power point. In 7a is shown the mid -frequency output. The low !re-
gency half -power point is shown in 7h.
(.)
(b)
95
-Tio
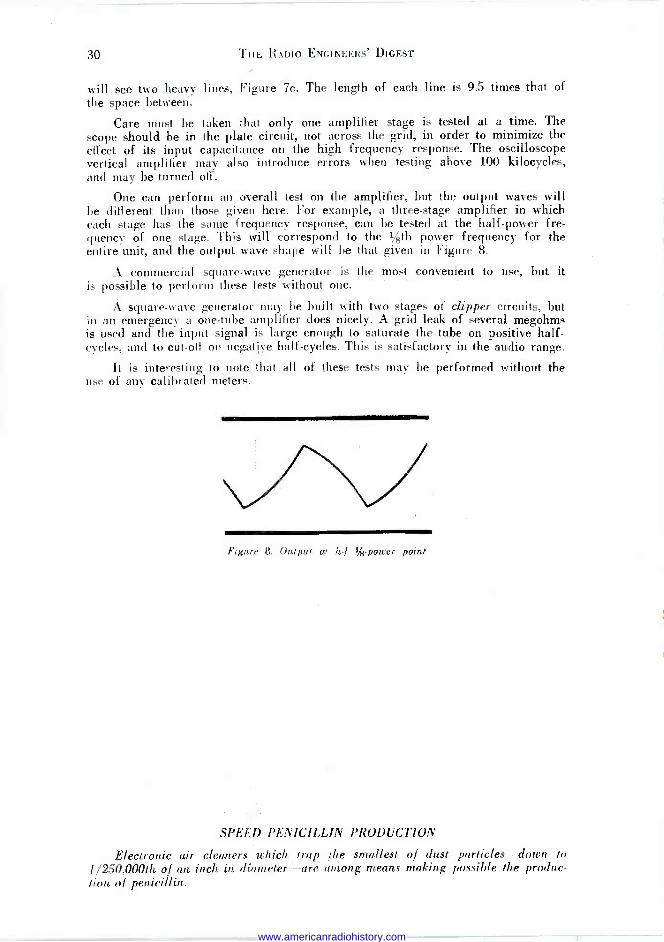
frequency at which the response is still good, the a -c voltage across the coupling condenser never rises to a value large enough to materially oppose the charging current. It is almost constant for each half -cycle, as shown in Figure 7a. If the frequency is reduced, however, the time for each half -cycle is so long that the condenser charges up and the charging current dies down to almost zero, Figure 7b. This is the standard wave for the low -frequency half -power value. It again corresponds to a fundamental which has been shifted 45°. Its logarithm component is identical to that in Figure 6b. The same criteria can be used to identify the wave. Another quick method is to turn off the oscilloscope sweep circuit and one
www.americanradiohistory.com
30 THE RADIO ENGINEERS' DIGEST
will see two heavy lines, Figure 7c. The length of each line is 9.5 times that of the space between.
Care must be taken that only one amplifier stage is tested at a time. The scope should be in the plate circuit, not across the grid, in order to minimize the effect of its input capacitance on the high frequency response. The oscilloscope vertical amplifier may also introduce errors when testing above 100 kilocycles, and may be turned off.
One can perform an overall test on the amplifier, but the output waves will be different than those given here. For example, a three -stage amplifier in which each stage has the same frequency response, can be tested at the half -power fre- quency of one stage. This will correspond to the 1/8th power frequency for the entire unit, and the output wave shape will be that given in Figure 8.
A commercial square -wave generator is the most convenient to use, but it is possible to perform these tests without one.
A square -wave generator may be built with two stages of clipper circuits, but in an emergency a one -tube amplifier does nicely. A grid leak of several megohms is used and the input signal is large enough to saturate the tube on positive half - cycles, and to cut-off on negative, half -cycles. This is satisfactory in the audio range.
It is interesting to note that all of these tests may be performed without the use of any calibrated meters.
Figure 8. Output at h -f !s -power point
SPEED PENICILLIN PRODUCTION
Electronic air cleaners which trap the smallest of dust particles-down to 1/250,000th of an inch in diameter-are among means making possible the produc- tion of penicillin.
www.americanradiohistory.com
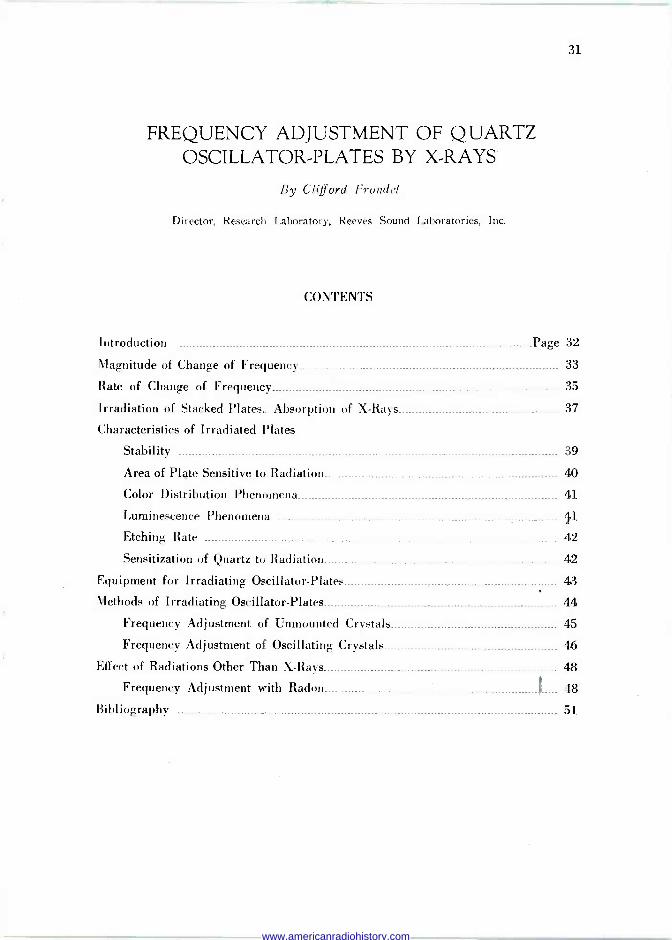
31
FREQUENCY ADJUSTMENT OF QUARTZ OSCILLATOR -PLATES BY X-RAYS
By Clifford Frondel
Director, Research Laboratory, Reeves Sound Laboratories, Inc.
CONTENTS
Introduction Page 32
Magnitude of Change of Frequency 33
Rate of Change of Frequency 35
Irradiation of Stacked Plates. Absorption of X -Rays 37
Characteristics of Irradiated Plates
Stability 39
Area of Plate Sensitive to Radiation 40
Color Distribution Phenomena 41
Luminescence Phenomena
Etching Rate 42
Sensitization of Quartz to Radiation 42
Equipment for Irradiating Oscillator -Plates 43
Methods of Irradiating Oscillator -Plates 44
Frequency Adjustment of Unmounted Crystals 45
Frequency Adjustment of Oscillating Crystals 46
Effect of Radiations Other Than X -Rays 48
Frequency Adjustment with Radon t 48
Bibliography 51
www.americanradiohistory.com
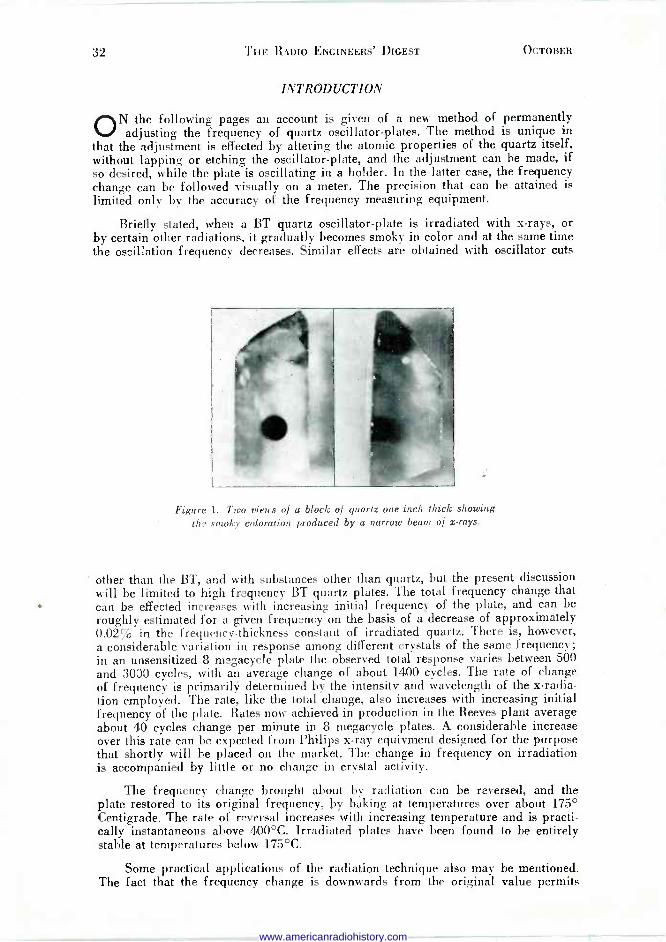
32 THE RADIO ENGINEERS' DIGEST OCTOBER
INTRODUCTION
ON the following pages an account is given of a new method of permanently adjusting the frequency of quartz oscillator -plates. The method is unique in
that the adjustment is effected by altering the atomic properties of the quartz itself, without lapping or etching the oscillator -plate, and the adjustment can be made, if so desired, while the plate is oscillating in a holder. In the latter case, the frequency change can be followed visually on a meter. The precision that can be attained is limited only by the accuracy of the frequency measuring equipment.
Briefly stated, when a BT quartz oscillator -plate is irradiated with x-rays, or by certain other radiations, it gradually becomes smoky in color and at the same time the oscillation frequency decreases. Similar effects are obtained with oscillator cuts
Figure 1. Tneo views of u block of quartz one inch thick showing the smoky coloration produced by a narrow beam of x-rays.
other than the BT, and with substances other than quartz, but the present discussion will be limited to high frequency BT quartz plates. The total frequency change that can be effected increases with increasing initial frequency of the plate, and can be roughly estimated for a given frequency on the basis of a decrease of approximately 0.02% in the frequency -thickness constant of irradiated quartz. There is, however, a considerable variation in response among different crystals of the same frequency; in an unsensitized 8 megacycle plate the observed total response varies between 500 and 3000 cycles, with an average change of about 1400 cycles. The rate of change of frequency is primarily determined by the intensity and wavelength of the x-radia- tion employed. The rate, like the total change, also increases with increasing initial frequency of the plate. Rates now achieved in production in the Reeves plant average about 40 cycles change per minute in 8 megacycle plates. A considerable increase over this rate can be expected from Philips x-ray equiyment designed for the purpose that shortly will be placed on the market. The change in frequency on irradiation is accompanied by little or no change in crystal activity.
The frequency change brought about by radiation can be reversed, and the plate restored to its original frequency, by baking at temperatures over about 175° Centigrade. The rate of reversal increases with increasing temperature and is practi- cally instantaneous above 400°C. Irradiated plates have been found to be entirely stable at temperatures below 175°C.
Some practical applications of the radiation technique also may be mentioned. The fact that the frequency change is downwards from the original value permits
www.americanradiohistory.com

1944 FREQUENCY ADJUSTMENT OF QUARTZ 33
the salvage of plates that have been overshot in frequency during manufacture, provided that the desired frequency change is within the range of the radiation technique. Similarly, plates that have gone over frequency due to ageing, re -cleaning, or under -plating may be recovered. At the present writing, roughly 1000 over - frequency plates are being recoved per week by x-rays in the Reeves plant. Another advantage of the method arises in that the frequency of stabilized crystals can be adjusted without disturbing the surface condition of the quartz. PIates can also be finished to have a desired frequency at a specified temperature by irradiation to fre- quency while held at that temperature. The greatest advantage of the method, however, is that the frequency adjustment can be brought under continuous, visual, control by oscillating the crystal in the x-ray beam until it reaches the desired frequency and then stopping the treatment. This can be accomplished while the crystal is mounted in its permanent holder, if the latter is suitably designed, or in a temporary holder so made as to permit entrance of the x-ray beam. Frequency adjustments of the highest precision can be attained in this way. The irradiation -to -frequency technique is of special advantage in the manufacture of ultra -high frequency pates, in the range over 15 megacycles, since the conventional methods of finishing crystals here become very difficult to control while the radiation technique, on the other hand, is at its maximum power.
Much of the work so far done in the field has been of a qualitative nature in which emphasis was placed on the immediate problem of handling a specific type and frequency of oscillator -plate. Many applications of the method still remain to be explored. Further work will no doubt add greatly both to a knowledge of the general principles involved and to the power of the method as a production tool.
MAGNITUDE OF CHANGE OF FREQUENCY IN BT CRYSTALS
THE rate of change of frequency of a quartz oscillator -plate during irradiation is rapid at first but then decreases and approaches zero at saturation. At this
point there is no further change in frequency on continued exposure to the x-rays. The total change of frequency that can be effected is variable and depends on a number of factors. Among these are the type of cut of the plate, the treatment given to the plate prior to irradiation, the kind of radiation employed, and the initial frequency, or thickness, of the plate itself. There also is a considerable variation in response among different specimens of raw quartz and hence between different plates of the same frequency cut therefrom. The time needed to effect saturation appears to be constant for plates of a given frequency regardless of the total amount of change provided that the conditions of irradiation are identical. The observed variation in saturation value in 8000Kc, BT -cut, plates is roughly from 500 to 3000 cycles decrease, with an average change of approximately 1400 cycles decrease. These and other data mentioned on the following pages refer, unless so stated, to quartz plates exposed to unfiltered copper x-rays without special provision to in- crease the effect by prior sensitization of the quartz or otherwise.
Production data illustrating the frequency spread observed in a run of 638 plates of 8007 Kc. frequency that had been irradiated only part of the way to satur- ation are shown in Figure 2. The plates had been overshot a few hundred cycles or so during manufacture and were irradiated enough to bring them back down below the upper frequency tolerance. The frequency changes are shown on the graph as rates. These rates are the slopes of the linear portion below the knee of the curves ob- tained by graphing frequency change against the time of irradiation.
The average saturation value is a function of the initial frequency, or thickness, of the plate and increases with increasing frequency. Preliminary measurements indicate that the average change in BT plates of a particular frequency can be cal- culated on the assumption that the frequency -thickness constant of irradiated quartz
www.americanradiohistory.com
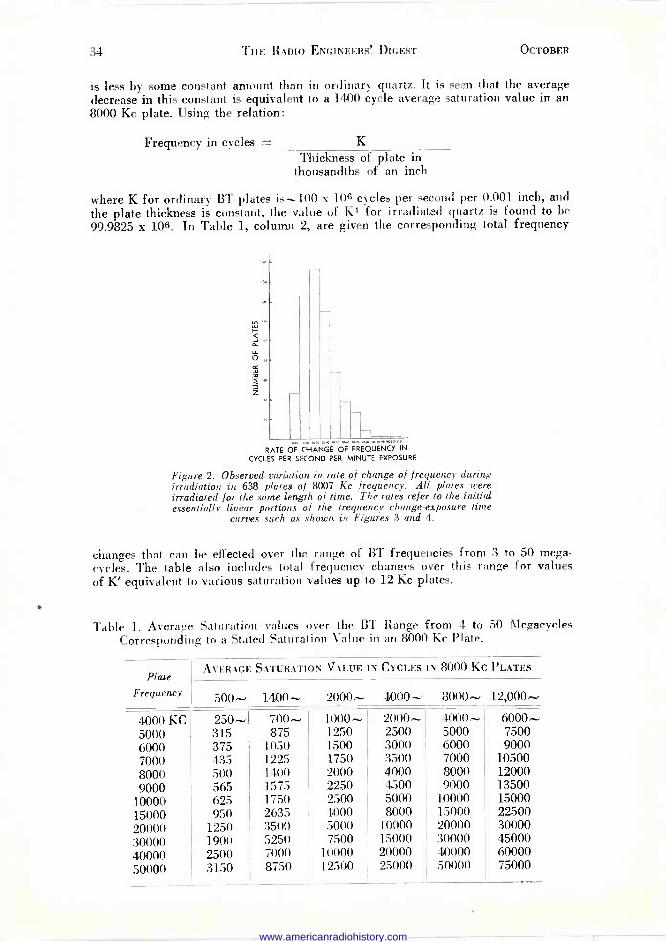
34 THE RADIO ENGINEERS'. DIGEST OCTOBER
is less by some constant amount than in ordinary quartz. It is seen that the average decrease in this constant is equivalent to a 1400 cycle average saturation value in an 8000 Kc plate. Using the relation:
Frequency in cycles = K Thickness of plate in
thousandths of an inch
where K for ordinary BT plates is -100 x 106 cycles per second per 0.001 inch, and the plate thickness is constant, the value of Ki for irradiated quartz is found to be 99.9825 x 10⁶. In Table 1, column 2, are given the corresponding total frequency
RATE OF CHANGE OF FRECIUENCY IN
CYCLES PER SECOND PER MINUTE EXPOSURE
Figure 2. Observed variation in rate of change of frequency during irradiation in 638 plates of 8007 Kc frequency. All plates were irradiated for the same length of time. The rates refer to the initial essentially linear portions of the frequency change -exposure time
curves such as shown in Figures 3 and 4.
changes that can be effected over the range of BT frequencies from 3 to 50 mega- cycles. The table also includes total frequency changes over this range for values of K' equivalent to various saturation values up to 12 Kc plates.
Table 1. Average Saturation values over the BT Range from 4 to 50 Megacycles Corresponding to a Stated Saturation Value in an 8000 Kc Plate.
Plate Frequency
AVERAGE SATURATION VALUE IN CYCLES IN 8000 KC PLATES
500 1400 2000 4000 8000 12,000-
4000 KC 250 - 700-, 1000-- 2000-, 4000 6000 5000 315 875 1250 2500 5000 7500 6000 375 1050 1500 3000 6000 9000 7000 435 1225 1750 3500 7000 10500 8000 500 1400 2000 4000 8000 12000 9000 565 1575 2250 4500 9000 13500
10000 625 1750 2500 5000 10000 15000 15000 950 2635 4000 8000 15000 22500 20000 1250 3500 5000 10000 20000 30000 30000 1900 5250 7500 15000 30000 45000 40000 2500 7000 10000 20000 40000 60000 50000 3150 8750 12500 25000 50000 75000
www.americanradiohistory.com

1944 FREQUENCY ADJUSTMENT OF QUARTZ 35
A rough idea of the magnitude of the frequency change to be obtained between different pieces of quartz can be gained from the luminescence phenomena described in a later section and from the original color of the quartz. Generally speaking, colorless quartz shows a wide variation from specimen to specimen in the degree of response in color to radiation. On the other hand, deep smoky quartz and citrine -uni- formly show a relatively small response. Amethyst quartz is entirely unaffected. If amethyst is first decolorized by baking, irradiation restores the amethystine color. Rose quartz, which contains traces of titanium in solid solution, develops an extremely in- tense, almost black, smoky color. Chalcedony is weakly affected by x-rays and alternate bands in the mineral may become unequally colored. Opal is not affected. Tridymite, an orthorhombic polymorph of Si02, is deeply colored by x-rays.
The change in color and in frequency is a photoelectric effect produced in the quartz by the absorption of radiant energy. The effect is closely similar to the blackening of silver halide photographic emulsions by x-rays or ordinary light. The fluorescence and photochemical effects accompanying the absorption of ultra- violet light also are related phenomena. The x-ray energy absorbed by the quartz apparently is able not only to effect a momentary transfer of electrons from low to higher levels, with accompanying fluorescence, but also to permanently eject electrons from the atom. The alteration in the interatomic bonding forces thus brought about is reflected by the variation in the elastic constants and, in turn, in the oscil- lating characteristics of the irradiated plate.
RATE OF CHANGE OF FREQUENCY
THE principal factors influencing the rate of change of frequency during irradiation are the intensity of the x-ray beam, the distance of the plate from the window
and anode of the x-ray tube, and the initial frequency of the plate itself.
Beam Intensity. The rate of change of frequency is found to be directly propor- tional to the intensity of the x-ray beam. The beam intensity itself increases as the square of the voltage and directly as the current passed. It may be noted that the peak wave -length of the continuous radiation yielded by the tube decreases with increasing voltage so that there is an accompanying slight decrease in the percentage absorption of the beam.
Using copper radiation from a tube operated at 25 ma and 60 KV, with a crystal to window distance of approximately 1mm, ordinary unsensitized 8 megacycle plates can be changed in frequency on the average about 40 cycles a minute. At 20 ma and 40 KV on a slightly different type of tube an average rate was obtained of roughly
-2100
-1800 v r V z -1500
uì N a -1200 W
V -900
T V z j -600
LL -300
8065 Kc Plate
25 ma, 60 KV
d = 0.2 mm 7570 Kc Plate
25 ma, 40 KV
d=12 mm
7570 Kc Plate
25 ma, 40 KV
d=12 mm
0 1 4 3 4 5 6
EXPOSURE TIME IN. HOURS
Figure 3. Relation of frequency change to exposure time at various x-ray beam intensities.
8065 Kc Plate
5 ma, 20 KV
d=15 mm
7 10
www.americanradiohistory.com
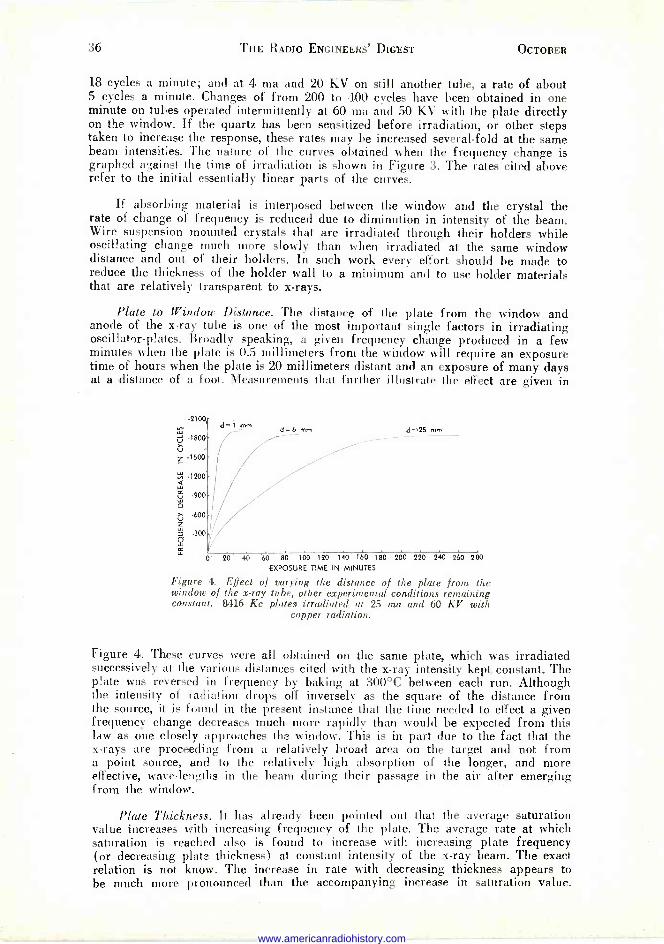
36 THE RADIO ENGINEERS' DIGEST OCTOBER
18 cycles a minute; and at 4 ma and 20 KV on still another tube, a rate of about 5 cycles a minute. Changes of from 200 to 400 cycles have been obtained in one minute on tubes operated intermittently at 60 ma and 50 KV with the plate directly on the window. If the quartz has been sensitized before irradiation, or other steps taken to increase the response, these rates may be increased several -fold at the same beam intensities. The nature of the curves obtained when the frequency change is graphed against the time of irradiation is shown in Figure 3. The rates cited above refer to the initial essentially linear parts of the curves.
If absorbing material is interposed between the window and the crystal the rate of change of frequency is reduced due to diminution in intensity of the beam. Wire suspension mounted crystals that are irradiated through their holders while oscillating change much more slowly than when irradiated at the same window distance and out of their holders. In such work every effort should be made to reduce the thickness of the holder wall to a minimum and to use holder materials that are relatively transparent to x-rays.
Plate to Window Distance. The distance of the plate from the window and anode of the x-ray tube is one of the most important single factors in irradiating oscillatr)r-plates. Broadly speaking, a given frequency change produced in a few minutes when the plate is 0.5 millimeters from the window will require an exposure time of hours when the plate is 20 millimeters distant and an exposure of many days at a distance of a foot. Measurements that further illustrate the effect are given in
-2100
W -1800'
- z -1500
-1200
-900 ó
-600 z z -300
Po ce LL
= 1 mm d=6 mm d=R5 mm
20 40 60 80 100 120 140 160 180 200 220 240 260 280
EXPOSURE TIME IN MINUTES
Figure 4. Effect of varying the distance of the plate from the window of the x-ray tube, other experimental conditions remaining constant. 8416 Kc plates irradiated at 25 ma and 60 KV with
copper radiation.
Figure 4. These curves were all obtained on the same plate, which was irradiated successively at the various distances cited with the x-ray intensity kept constant. The plate was reversed in frequency by baking at 300°C between each run. Although the intensity of radiation drops off inversely as the square of the distance from the source, it is found in the present instance that the time needed to effect a given frequency change decreases much more rapidly than would be expected from this law as one closely approaches the window. This is in part due to the fact that the x-rays are proceeding from a relatively broad area on the target and not from a point source, and to the relatively high absorption of the longer, and more effective, wave -lengths in the beam during their passage in the air after emerging from the window.
Plate Thickness. It has already been pointed out that the average saturation value increases with increasing frequency of the plate. The average rate at which saturation is reached also is found to increase with increasing plate frequency (or decreasing plate thickness) at constant intensity of the x-ray beam. The exact relation is not know. The increase in rate with decreasing thickness appears to be much more pronounced than the accompanying increase in saturation value.
www.americanradiohistory.com
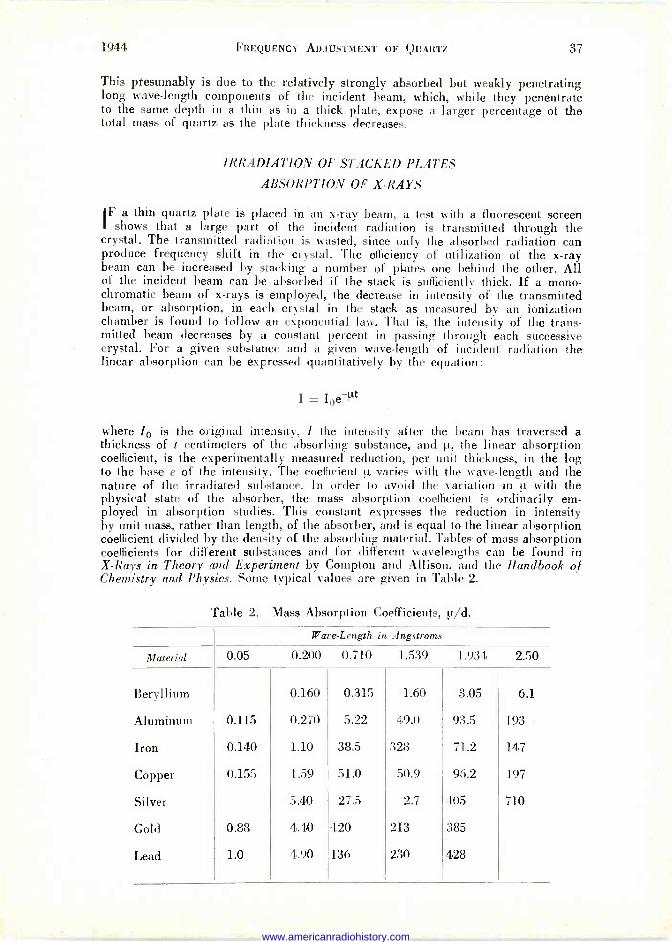
1944 FREQUENCY ADJUSTMENT OF QUARTZ 37
This presumably is due to the relatively strongly absorbed but weakly penetrating long wave -length components of the incident beam, which, while they penentrate to the same depth in a thin as in a thick plate, expose a larger percentage of the total mass of quartz as the plate thickness decreases.
IRRADIATION OF STACKED PLATES
ABSORPTION OF X-RAYS
IF a thin quartz plate is placed in an x-ray beam, a test with a fluorescent screen
shows that a large part of the incident radiation is transmitted through the crystal. The transmitted radiation is wasted, since only the absorbed radiation can produce frequency shift in the crystal. The efficiency of utilization of the x-ray beam can be increased by stacking a number of plates one behind the other. All of the incident beam can be absorbed if the stack is sufficiently thick. If a mono- chromatic beam of x-rays is employed, the decrease in intensity of the transmitted beam, or absorption, in each crystal in the stack as measured by an ionization chamber is found to follow an exponential law. That is, the intensity of the trans- mitted beam decreases by a constant percent in passing through each successive crystal. For a given substance and a given wave -length of incident radiation the linear absorption can be expressed quantitatively by the equation:
I=loéµt
where I0 is the original intensity, I the intensity after the beam has traversed a thickness of t centimeters of the absorbing substance, and µ, the linear absorption coefficient, is the experimentally measured reduction, per unit thickness, in the log to the base e of the intensity. The coefficient [t, varies with the wave -length and the nature of the irradiated substance. In order to avoid the variation in with the physical state of the absorber, the mass absorption coefficient is ordinarily em- ployed in absorption studies. This constant expresses the reduction in intensity by unit mass, rather than length, of the absorber, and is equal to the linear absorption coefficient divided by the density of the absorbing material. Tables of mass absorption coefficients for different substances and for different wavelengths can be found in X -Rays in Theory and Experiment by Compton and Allison, and the Handbook of Chemistry and Physics. Some typical values are given in Table 2.
Table 2. Mass Absorption Coefficients, µ/d.
Wave -Length in Angstroms
Material 0.05 0.200 0.710 1.539 1.934 2.50
Beryllium 0.160 0.315 1.60 3.05 6.1
Aluminum 0.115 0.270 5.22 49.0 93.5 193
Iron 0.140 1.10 38.5 328 71.2 147
Copper 0.155 1.59 51.0 50.9 96.2 197
Silver 5.40 27.5 2.7 405 710
Gold 0.88 4.40 -120 213 385
Lead 1.0 4.90 136 230 428
www.americanradiohistory.com
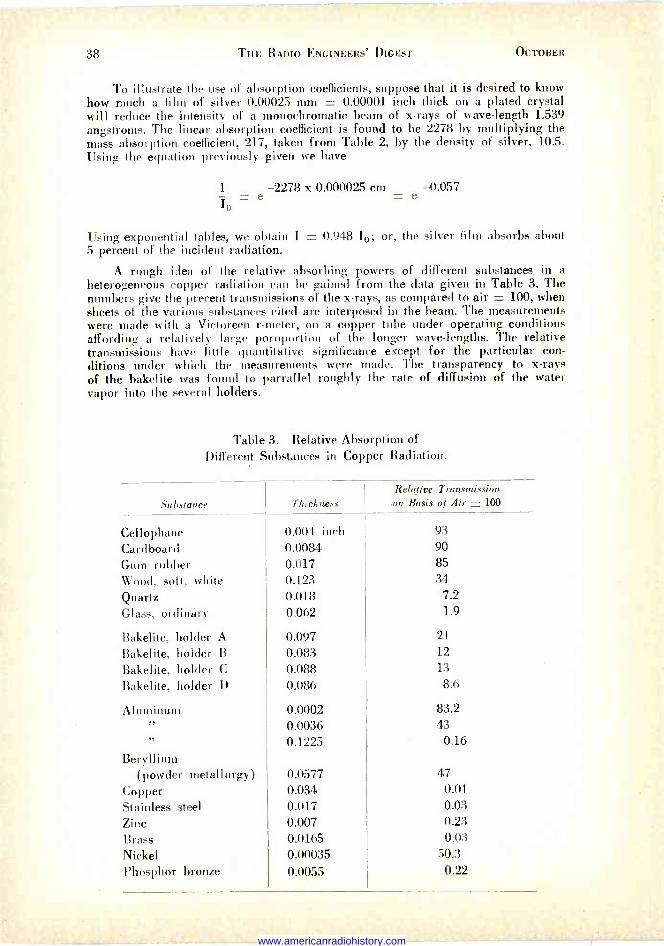
38 THE RADIO ENGINEERS' DIGEST OCTOBER
Ì= e 0
To illustrate the use of absorption coefficients, suppose that it is desired to know how much a film of silver 0.00025 mm = 0.00001 inch thick on a plated crystal will reduce the intensity of a monochromatic beam of x-rays of wave -length 1.539 angstroms. The linear absorption coefficient is found to be 2278 by multiplying the mass absorption coefficient, 217, taken from Table 2, by the density of silver, 10.5._ Using the equation previously given we have
I -2278 x 0.000025 cm -0.057 = e
Using exponential tables, we obtain I = 0.948 Io; or, the silver film absorbs about 5 percent of the incident radiation.
A rough idea of the relative absorbing powers of different substances in a heterogeneous copper radiation can be gained from the data given in Table 3. The numbers give the precent transmissions of the x-rays, as compared to air = 100, when sheets of the various substances cited are interposed in the beam. The measurements were made with a Victoreen r -meter, on a copper tube under operating conditions affording a relatively large poroportion of the longer wave -lengths. The relative transmissions have little quantitative significance except for the particular con- ditions under which the measurements were made. The transparency to x-rays of the bakelite was found to parrallel roughly the rate of diffusion of the water vapor into the several holders.
Table 3. Relative Absorption of Different Substances in Copper Radiation.
Substance Thickness Relative Transmission
on Basis of Air = 100
Cellophane 0.004 inch 93
Cardboard 0.0084 90
Gum rubber 0.017 85
Wood, soft, white 0.123 34
Quartz 0.018 7.2
Glass, ordinary 0.062 1.9
Bakelite, holder A 0.097 21
Bakelite, holder B 0.083 12
Bakelite, holder C 0.088 13
Bakelite, holder D 0.086 8.6
Aluminum 0.0002 83.2 ,,
f) 0.0036 0.1225
43 0.16
Beryllium (powder metallurgy) 0.0577 47
Copper 0.034 0.01
Stainless steel 0.017 0.03
Zinc 0.007 0.23
Brass 0.0165 0.03
Nickel 0.00035 50.3
Phosphor bronze 0.0055 0.22
www.americanradiohistory.com
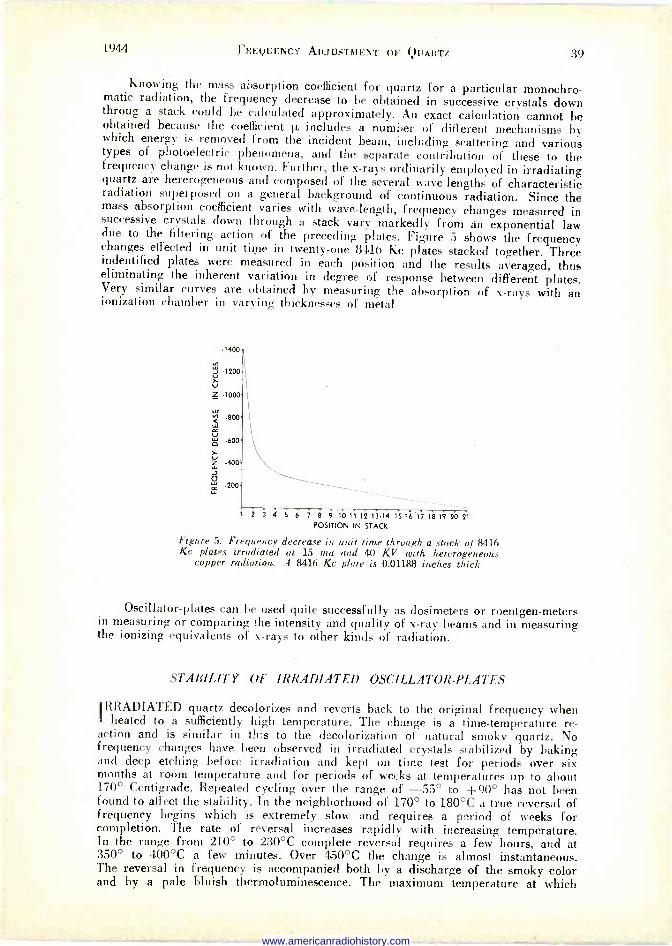
1944 FREQUENCY ADJUSTMENT OF QUARTZ 39
Knowing the mass absorption coefficient for quartz for a particular monochro- matic radiation, the frequency decrease to be obtained in successive crystals down throng a stack could be calculated approximately. An exact calculation cannot be obtained because the coefficient p, includes a number of different mechanisms by which energy is removed from the incident beam, including scattering and various types of photoelectric phenomena, and the separate contribution of these to the frequency change is not known. Further, the x-rays ordinarily employed in irradiating quartz are hererogeneous and composed of the several wave -lengths of characteristic radiation superposed on a general background of continuous radiation. Since the mass absorption coefficient varies with wave -length, frequency changes measured in successive crystals down through a stack vary markedly from an exponential law due to the filtering action of the preceding plates. Figure 5 shows the frequency changes effected in unit time in twenty-one 8416 Kc plates stacked together. Three indentified plates were measured in each position and the results averaged, thus eliminating the inherent variation in degree of response between different plates. Very similar curves are obtained by measuring the absorption of x-rays with an ionization chamber in varying thicknesses of metal
-14001
-1200
V Z -1000
-800
-600
-400
-200
2 3 4 5 6 7 8 9 10 11 12 1314 15 1617 18 19 20 21
POSITION IN STACK
Figure 5. Frequency decrease in unit time through a stack of 8416 Kc plates irradiated at 15 ma and 40 KV with heterogeneous
copper radiation. A 8416 Kc plate is 0.01188 inches thick.
Oscillator -plates can be used quite successfully as dosimeters or roentgen -meters in measuring or comparing the intensity and quality of x-ray beams and in measuring the ionizing equivalents of x-rays to other kinds of radiation.
STABILITY OF IRRADIATED OSCILLATOR -PLATES
IRRADIATED quartz decolorizes and reverts back to the original frequency when heated to a sufficiently high temperature. The change is a time -temperature re-
action and is similar in this to the decolorization of natural smoky quartz. No frequency changes have been observed in irradiated crystals stabilized by baking and deep etching before irradiation and kept on time test for periods over six months at room temperature and for periods of weeks at temperatures up to about 170° Centigrade. Repeated cycling over the range of -55° to +90° has not been found to affect the stability. In the neighborhood of 170° to 180°C a true reversal of frequency begins which is extremely slow and requires a period of weeks for completion. The rate of reversal increases rapidly with increasing temperature. In the range from 210° to 230°C complete reversal requires a few hours, and at 350° to 400°C a few minutes. Over 450°C the change is almost instantaneous. The reversal in frequency is accompanied both by a discharge of the smoky color and by a pale bluish thermoluminescence. The maximum temperature at which
www.americanradiohistory.com
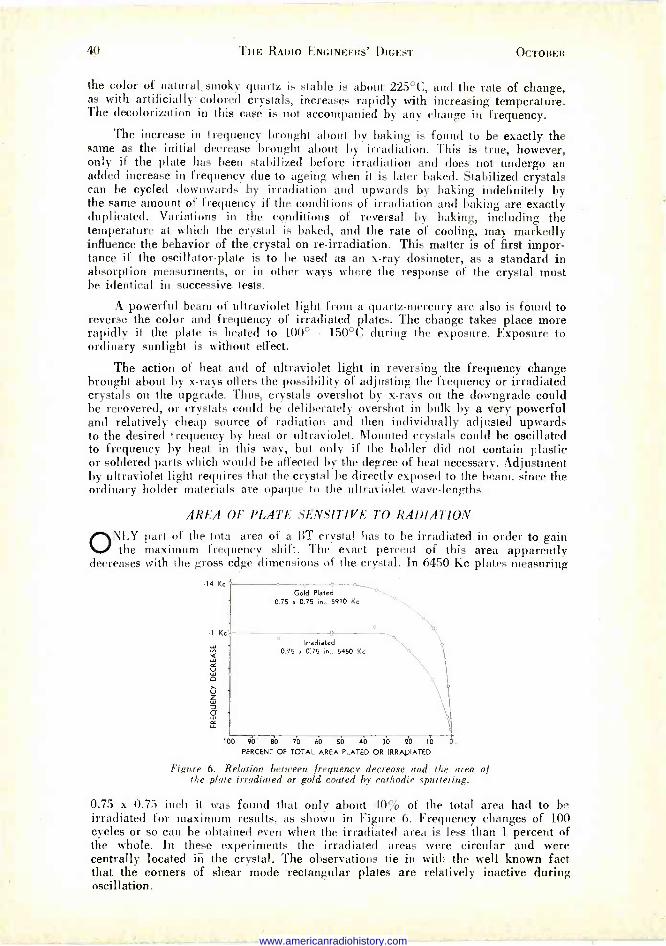
40 THE RADIO ENGINEERS' DIGEST OCTOBER
the color of natural, smoky quartz is stable is about 225°C, and the rate of change, as with artificially colored crystals, increases rapidly with increasing temperature. The decolorization in this case is not accompanied by any change in frequency.
The increase in frequency brought about by baking is found to be exactly the same as the initial decrease brought about by irradiation. This is true, however, only if the plate has been stabilized before irradiation and does not undergo an added increase in frequency due to ageing when it is later baked. Stabilized crystals can be cycled downwards by irradiation and upwards by baking indefinitely by the same amount of frequency if the conditions of irradiation and baking are exactly duplicated. Variations in the conditions of reversal by baking, including the temperature at which the crystal is baked, and the rate of cooling, may markedly influence the behavior of the crystal on re -irradiation. This matter is of first impor- tance if the oscillator -plate is to he used as an x-ray dosimeter, as a standard in absorption measurments, or in other ways where the response of the crystal must be identical in successive tests.
A powerful beam of ultraviolet light from a quartz -mercury arc also is found to reverse the color and frequency of irradiated plates. The change takes place more rapidly if the plate is heated to 100° - 150°C during the exposure. Exposure to ordinary sunlight is without effect.
The action of heat and of ultraviolet light in reversing the frequency change brought about by x-rays offers the possibility of adjusting the frequency or irradiated crystals on the upgrade. Thus, crystals overshot by x-rays on the downgrade could be recovered, or crystals could be deliberately overshot in bulk by a very powerful and relatively cheap source of radiation and then individually adjusted upwards to the desired frequency by heat or ultraviolet. Mounted crystals could be oscillated to frequency by heat in this way, but only if the holder did not contain plastic or soldered parts which would be affected by the degree of heat necessary. Adjustment by ultraviolet light requires that the crystal be directly exposed to the beam, since the ordinary holder materials are opaque to the ultraviolet wave -lengths.
AREA OF PLATE SENSITIVE TO RADIATION
ONLY part of the total area of a BT crystal has to be irradiated in order to gain the maximum frequency shift. The exact percent of this area apparently
decreases with the gross edge dimensions of the crystal. In 6450 Kc plates measuring
14 Kc
LL
Gold Plated 0.75 r 0.75 in., 5910 Kc
Irradiated 0.75 0:75 in., 6450 Ke
100 90 80 70 60 50 40 30 20 10
PERCENT OF TOTAL AREA PLATED OR IRRADIATED
Figure 6. Relation between frequency decrease and the area of the plate irradiated or gold coated by cathodic sputtering.
0.
0.75 x 0.75 inch it was found that only about 40% of the total area had to be irradiated for maximum results, as shown in Figure 6. Frequency changes of 100 cycles or so can be obtained even when the irradiated area is less than 1 percent of the whole. In these experiments the irradiated areas were circular and were centrally located in- the crystal. The observations tie in with the well known fact that the corners of shear mode rectangular plates are relatively inactive during oscillation.
www.americanradiohistory.com
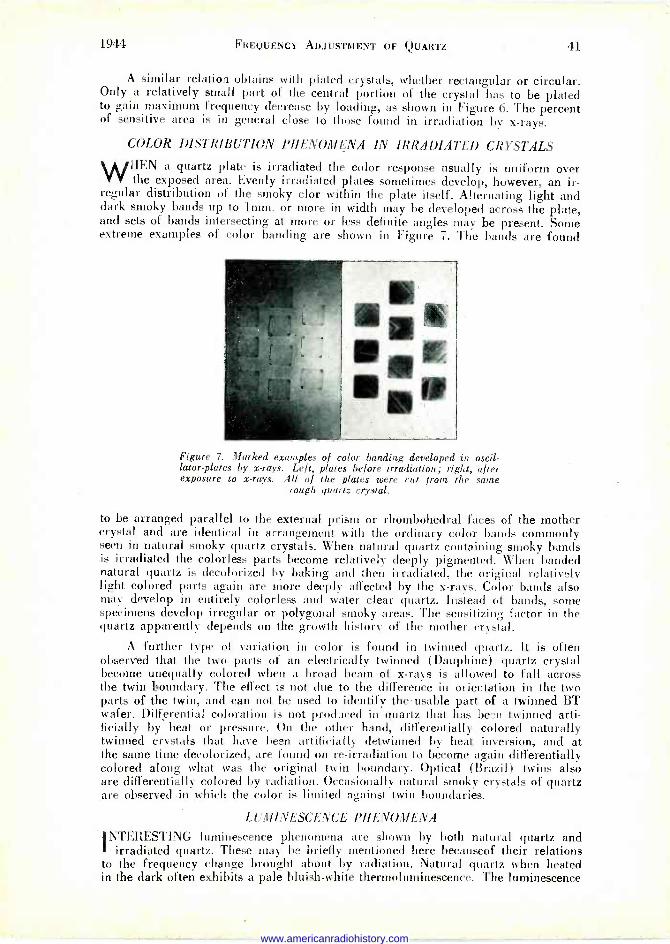
1944 FREQUENCY ADJUSTMENT OF QUARTZ 41
A similar relation obtains with plated crystals, whether rectangular or circular. Only a relatively small part of the central portion of the crystal has to be plated to gain maximum frequency decrease by loading, as shown in Figure 6. The percent of sensitive area is in general close to those found in irradiation by x-rays.
COLOR DISTRIBUTION PHENOMENA IN IRRADIATED CRYSTALS
WHEN a quartz plate is irradiated the color response usually is uniform over the exposed area. Evenly irradiated plates sometimes develop, however, an ir-
regular distribution of the smoky clor within the plate itself. Alternating light and dark smoky bands up to 1mm. or more in width may be developed across the plate, and sets of bands intersecting at more or less definite angles may be present. Some extreme examples of color banding are shown - in Figure 7. The bands are found
Figure 7. Marked examples of color banding developed in oscil- lator -plates by x-rays. Left, plates before irradiation; right, after exposure to x-rays. All of the plates were cut from the same
rough quartz crystal.
to be arranged parallel to the external prism or rhombohedral faces of the mother crystal and are identical in arrangement with the ordinary color bands commonly seen in natural smoky quartz crystals. When natural quartz containing smoky bands is irradiated the colorless parts become relatively deeply pigmented. When banded natural quartz is decolorized by baking and then irradiated, the original relatively light colored parts again are more deeply affected by the x-rays. Color bands also may develop in entirely colorless and water clear quartz. Instead of bands, some specimens develop irregular or polygonal smoky areas. The sensitizing factor in the quartz apparently depends on the growth history of the mother crystal.
A further type of variation in color is found in twinned quartz. It is often observed that the two parts of an electrically twinned (Dauphine) quartz crystal become unequally colored when a broad beam of x-rays is allowed to fall across the twin boundary. The effect is not due to the difference in orientation in the two parts of the twin, and can not be used to identify the usable part of a twinned BT wafer. Differential coloration is not produced in quartz that has been twinned arti- ficially by heat or pressure. On the other hand, differentially colored naturally twinned crystals that have been artificially detwinned by heat inversion, and at the same time decolorized, are found on re -irradiation to become again differentially colored along what was the original twin boundary. Optical (Brazil) twins also are differentially colored by radiation. Occasionally natural smoky crystals of quartz are observed in which the color is limited against twin boundaries.
LUMINESCENCE PHENOMENA
INTERESTING luminescence phenomena are shown by both natural quartz and irradiated quartz. These may be briefly mentioned here becauseof their relations
to the frequency change brought about by radiation. Natural quartz when heated in the dark often exhibits a pale bluish -white thermoluminescence. The luminescence
www.americanradiohistory.com
42 THE RADIO ENGINEERS' DIGEST OCTOBER
begins at a rather low temperature and after increasing in intensity with increasing temperature to about 300° to 400°C gradually dies out. Once the luminescence has been discharged, it does not recur on reheating. The intensity of the luminescence varies widely in different specimens of quartz, and sometimes is found to be confined to particular growth bands or parts of the mother crystal. The effect is relatively weak or absent in smoky quartz as compared to colorless quartz. However, branded smoky and colorless sections of quartz always are relatively more affected by x-rays in the colorless regions whether these parts are thermoluminescent or not. Thermoluminescence does not appear to be as intimately connected with the frequency effect as is the original color. There appears to be no significant difference in the frequency -thickness constant of natural thermoluminescent and non-thermolumines- cent quartz.
Irradiated quartz always is thermoluminescent on heating. The luminescence is confined to the irradiated area. The luminescence begins at a lower temperature than in natural quartz, below 100°C, and the intensity is considerably greater. The glow is not accompanied by a change in frequency or in the smoky color at temperatures below the 170° to 180°C stability limit previously described. In an irradiated plate the thermoluminescence may persist after the quartz has been heated to a temperature at which the frequency and smoky color are discharged.
Quartz exhibits a bluish -white fluorescence during irradiation with x-rays. The samples also phosphoresce briefly after exposure. The intensity of the fluores- cence varies considerably in different specimens. A relativly intense glow appears to be met with in material that is not thermoluminescent and that has an original smoky color. It is usually found that the more intense the fluorescence the less intense is the total response in frequency and in smoky color produced by the radiation.
ETCHING RATE OF IRRADIATED CRYSTALS
IF a quartz plate is irradiated through a lead shield pierced with a small hole, so that there is a sharply defined smoky area produced on the quartz, and the
plate is then very deeply etched with a solvent for quartz, it is found that the irradiated area is less affected and appears on the surface of the plate as a slight eminence. In other words, the rate of solution of irradiated quartz is less than in ordinary quartz. The difference in rate is not sufficiently large to be measured by comparing the etching rate in cycles change per minute of irradiated and non - irradiated plates over an etching period of 40 or 50 Kc. It is also found under certain not easily reproducible etching conditions that sawn and lapped sections or finished plates of ordinary non -radiated quartz sometimes become differentially etched along parallel bands or zones. Crystals with alternately banded smoky and colorless portions may show marked effects of this kind. The behavior reflects a local variation in the properties of the quartz itself, possibly of the nature of an impurity content.
SENSITIZATION OF QUARTZ TO RADIATION
AN oscillator -plate that has been baked at an elevated temperature is found when subsequently irradiated to change frequency more rapidly. The increase in rate
brought about by baking between 250° and 350°C ranges up to two -fold, and there is an accompanying increase in the total frequency change. The temperature to which the plate is heated and the rate of cooling, together with the nature of the atmosphere in which the baking is done, all influence the sensitization. The field is being explored at the present writing and a full account can not yet be given.
www.americanradiohistory.com
191-1 FREQUENCY ADJUSTMENT OF QUARTZ 43
X-RAY EQUIPMENT FOR IRRADIATING OSCILLATOR -PLATES
W IIILE almost any type of x-ray unit can be used to demonstrate the effect, the, successful application of the method on a mass production scale requires more
or less special equipment. The ordinary x-ray tube used for crystallographic or medical purposes is not well suited for irradiation of oscillator -plates for several reasons. Of these, the most important is the narrowness of the x-ray beam at the window, as fixed by the sharpness of focus on the anode and by the anode screen. Usually the emergent beam has an area of only a few square millimeters and it is then necessary to back away from the window until the divergence in the beam is sufficient to cover the sensitive area of the oscillator -plate. This is undesirable because the intensity of the radiation drops off roughly as the inverse square of the distance from the anode and the exposure times are increased accordingly. The importance of getting the plate as close as possible to the window, preferably within a fraction of a millimeter. must be stressed. It is also desirable, since the rate of change of frequency varies directly with the intensity of the beam, other conditions remaining fixed. that the x-ray output of the tube be as large as is possible within the practical limits set by cost and tube design. Generally speaking, the x-ray output of the several types of x-ray 'equipment now employed in the quartz oscillator industry for purposes of crystal orientation is too small to give practical rates of change. Nevertheless, rates up to 10 cycles or so change a minute in high frequency plates can be attained with this equipment if the crystal to window distance is kept at a minimum.
Engineers of the North American Philips Co., Inc., have closely followed the development of the radiation technique in the Reeves Laboratory, and have de- signed an x-ray tube and holder for the specific purpose of irradiating quartz. This equipment will shortly be available to the quartz oscillator industry through a Signal Corps equipment pool. It is hoped that other manufacturers as well will make equipment available. The Philips tube is designed to operate continuously at somewhat above 25ma and 60Ky, with a copper target, and should afford a frequency change of roughly 50 cycles a minute, on the average, in unsensitized 8 megacycle plates. The focal spot of the tube has been enlarged and other details of construction adjusted so as to give a beam approximately one-half inch in diameter at the window. The tube, which is water cooled, has two windows which are each fitted with a shielded holder in which plates may be oscillated during irradiation. The electronic equipment necessary to oscillate the plate in the holder is not supplied with the tube. The holder is constructed and shielded in such a way as to permit plates to be introduced and removed without danger to the operator while the tube is running.
Tungsten tubes operated at 150 to 1000 KV appear to be of little or no practi- cal use for the industrial radiation of quartz. The principal objection is the extreme penetration-and low absorption-of their radiation. Their high cost, inability to run continuously over long periods, and the dangers and inconvenience of operation under plant conditions are added factors. It must be borne in mind in this connection that, only the radiation absorbed in the crystal produces a frequency change, and in this choice of wave -length, and the relation of wave -length to the thickness of the plate, is an important factor. Quantitative absorption measurements with single 9 megacycle plates indicate that a greater effect is obtained with Cu than W radiation at the same tube voltage, and the advantage increases with increasing voltage. This is due to the greater quantity of soft radiation emitted by the Cu target. Once the soft radiation is filtered out, as in very thick low frequency plates or in stacked high frequency plates, the advantage is with the W tube because of the greater x-ray output at the same voltage than with Cu.
www.americanradiohistory.com
44 THE RADIO ENGINEERS' DIGEST OCTOBER
METHODS OF IRRADIATING OSCILLATOR -PLATES
SPECIAL attention should be paid to the following general matters in irradiated quartz crystals. Several have been discussed in greater detail in preceding
sections.
1. The crystal must be placed as close as possible to the window of the x-ray tube, preferably within distance of one-half millimeter.
2. The x-ray beam should be made as intense as possible, since the photo- electric response of the quartz appears to be directly proportional thereto.
3. The wave -length of the x-rays employed should be so selected as to yield maximum absorption in the total thickness of the quartz plate being irradiated. For example, soft x-rays are strongly absorbed and are relatively efficient in producing ionization, but their penetrating power is low and hence they may not penetrate through a thick crystal. On the other hand, hard x-rays penetrate deeply but their absorption and ionizing power is relatively low and hence the greater part of the energy in the x-ray beam might be transmitted through a relatively thin crystal. Considering the various factors involved, including the practicalities of tube design and flexibility of application, copper radiation appears to be best for general use. Radiation of a longer wave -length and hence more easily absorbed, such as from Fe, Co, Cr, Mn, or 'fi target, would be especially suited for very high frequency plates, of a thickness of 0.008 inch or less. Thick low frequency plates may perhaps best be irradiated with a more penetrating radiation, such as from a tungsten tube operated at from 40 to 80 KV, but sufficient experimental data is not yet át hand to decide this matter.
4. Foreign material such as metal, glass, or plastic sheets should not be placed in front of the crystal during irradiation since this will absorb part of the incident radiation, especially the relatively effective soft components, and thereby slow down the change in the quartz. X-rays used in irradiating oscillator -plates should not be filtered. If the crystal is irradiated while in a bakelite or other holder or if it is oscillated in a special holder on the tube during irradiation, every effort must be made to keep the shielding material as transparent to x-rays as possible, both by controlling the thickness and the composition of the material. Plastics, thin Al or Be foil, and very thin Cu foil are relatively transparent to copper x-rays. Metals such as iron or lead are relatively opaque to x-rays, even in thin sheets, and x-ray beams of the intensity described here can not penetrate through the steel electrodes used in clamp type holders.
5. Advantage should be taken of the fact that quartz crystals can be markedly sensitized to the effect of x-rays by prior baking to 300°C to 570°C. Baking also is advantageous because of the stabilizing effect it has on the crystal. Note that one former objection to the. baking of crystals, that of an erratic increase in fre- quency which often brought the plate out of tolerance, is readily overcome by the irradiation method without destroying the stability of the plate. Attention should also be given to methods of increasing the efficiency of the radiation by coating or backing up the crystal with a highly scattering metal or substance. The plate that immediately supports the crystals in the irradiation jig should be made of nickel, since this metal will give the maximum amount of back -scattering in copper radiation.
6. X-rays are dangerous and every care must be taken to shield the operator both from direct and scattered radiation. Irradiation jigs should he completely shielded by lead sheets not less than 1mm in thickness.
7. Quartz crystals may acquire a static electric charge during irradiation, es- pecially if they are placed directly in contact with the window, and thereby may attract particles of dust to their surface. This dust can be blown off with compressed air-a much easier procedure than trying to remove the static charge. Under cer- tain conditions the metal parts of water cooled tubes may sweat and moisture may
www.americanradiohistory.com
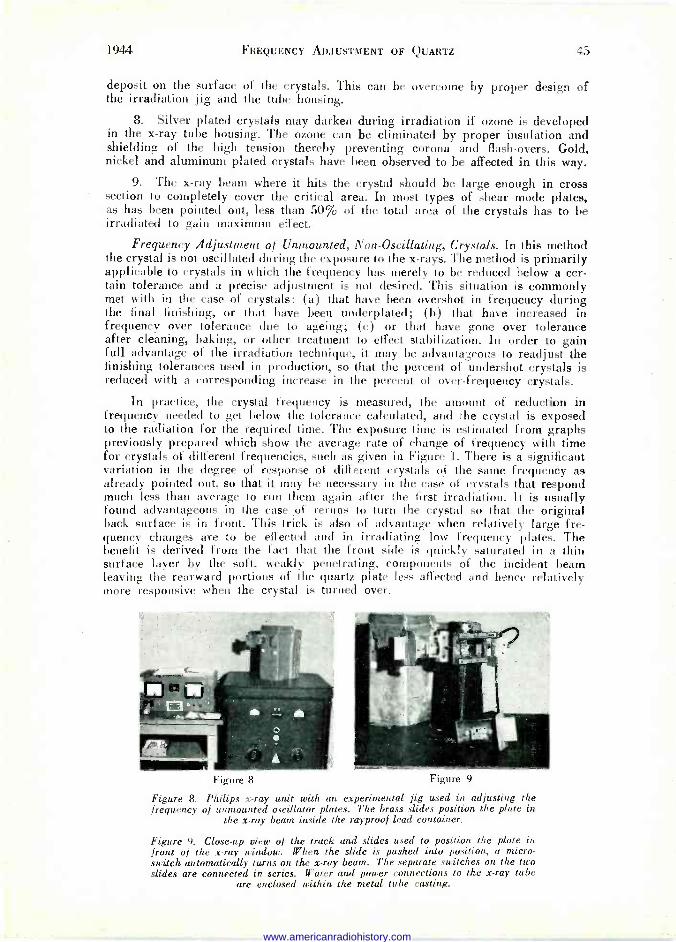
1944 FREQUENCY ADJUSTMENT OF QUARTZ 45
deposit on the surface of the crystals. This can be overcome by proper design of the irradiation jig and the tube housing.
8. Silver plated crystals may darken during irradiation if ozone is developed in the x-ray tube housing. The ozone can be eliminated by proper insulation and shielding of the high tension thereby preventing corona and flash-overs. Gold, nickel and aluminum plated crystals have been observed to be affected in this way.
9. The x-ray beam where it hits the crystal should be large enough in cross section to completely cover the critical area. In most types of shear mode plates, as has been pointed out, less than 50% of the total area of the crystals has to be irradiated to gain maximum effect.
Frequency Adjustment of Unmounted, Non -Oscillating, Crystals. In this method the crystal is not oscillated during the exposure to the x-rays. The method is primarily applicable to crystals in which the frequency has merely to be reduced below a cer- tain tolerance and a precise adjustment is not desired. This situation is commonly met with in the case of crystals: (a) that have been overshot in frequency during the final finishing, or that have been underplated; (h) that have increased in frequency over tolerance due to ageing; (c) or that have gone over tolerance after cleaning, baking, or other treatment to effect stabilization. In order to gain full advantage of the irradiation technique, it may be advantageous to readjust the finishing tolerances used in production, so that the percent of undershot crystals is reduced with a corresponding increase in the percent of over -frequency crystals.
In practice, the crystal frequency is measured, the amount of reduction in frequency needed to get below the tolerance calculated, and the crystal is exposed to the radiation for the required time. The exposure time is estimated from graphs previously prepared which show the average rate of change of frequency with time for crystals of different frequencies, such as given in Figure 1. There is a significant variation in the degree of response of different crystals of the same frequency as already pointed out, so that it may be necessary in the case of crystals that respond much less than average to run them again after the first irradiation. It is usually found advantageous in the case of reruns to turn the crystal so that the original back surface is in front. This trick is also of advantage when relatively large fre- quency changes are to be effected and in irradiating low frequency plates. The benefit is derived from the fact that the front side is quickly saturated in a thin surface layer by the soft, weakly penetrating, components of the incident beam leaving the rearward portions of the quartz plate less affected and hence relatively more responsive when the crystal is turned over.
Figure 8 Figure 9
Figure 8. Philips x-ray unit with an experimental jig used in adjusting the frequency of unmounted oscillator plates. The brass slides position the plate in
the x-ray beam inside the rayproof lead container.
Figure 9. Close-up view of the track and slides used to position the plate in front of the x-ray window. When the slide is pushed into position, a micro - switch automatically turns on the x-ray beam. The separate switches on the two slides are connected in series. Water and power connections to the x-ray tube
are enclosed within the metal tube casting.
www.americanradiohistory.com

46 THE RADIO ENGINEERS' DIGEST OCTOBER
A photograph of an irradiation unit used in production in the Reeves plant is shown in Figures 8 and 9. This unit is being used at the present time to recover finished crystals that have gone over frequency tolerances during finishing or baking. Several hundred crystals are handled per eight hour shift. The crystal is held on a brass slide which runs in a track frame attached to the tube housing. The crystal is positioned in the middle of the beam by stops and just grazes the window. The end of the slides engage a microswitch which turns the tube on and off as the slides are individually entered and removed. Other types of jigs have been experimented with in which the tube is left running constantly but in this case extreme care must be taken to ensure that the operator is entirely shielded from scattered radiation while the crystals are being changed.
Another technique that is of value under certain circumstances consists of stacking a number of crystals in front of the window and irradiating all simultan- eously. This results in a much more efficient use of the incident x-rays. The theory of the method has been described in a preceding section. This technique becomes especially useful in extremely high frequencies. Efforts to devise an irradiation jig in which the first crystal is periodically peeled off and the rest of the stack pushed forward automatically have been hindered by the development of strong static charges which cause the crystals to adhere tightly. Mechanical difficulties also are encountered in handling very thin crystals.
Frequency Adjustment of Mounted Oscillating, Crystals. A great advantage of the irradiation technique is that it affords a method of adjusting a crystal exactly to a desired frequency. This is accomplished by oscillating the crystal during irradiation and following the frequency change on a meter. Irradiation is stopped when the frequency reaches the desired value. Full advantage of the method is gained only if the crystal can be irradiated while mounted within its permanent holder. This requires a wire suspension or clip mounting in which the major portion of the crystal is not shielded by heavy metal parts. Crystals mounted between contact (pres- sure) electrodes can not he irradiated directly because the metal parts shield off the x-ray beam. In such cases, it is necessary to measure the crystal beforehand and determine the amount of frequency change desired, then transferring the crystal to a special jig in which it can be oscillated and irradiated simultaneously, and finally replacing in the original holder after the desired change is effected.
It may be pointed out that if the crystal is irradiated to frequency the accuracy that can be obtained depends primarily on the measuring equipment. Lack of stability in the meters can cause variations around the true frequency. Adjustment of the iradiated crystal to zero beat against a standard crystal on a metered com- parison oscillator is inadvisable since the meters usually become markedly unstable as the two frequencies approach zero difference. The variation in frequency accom- panying irradiation also can he picked up on an Esterline-Angus recorder but here again recognizance must be made of lag and instability in the meters.
It is also quite within the realm of possibility to effect entirely automatic controls by which the mounted crystals can be introduced into the x-ray beam, irradiated to frequency, and then removed for another crystal. Still other advantages can be taken of the irradiation -to -frequency technique. among them, the opportunity to adjust a crystal to have a specific frequency at a given temperature. This can be realized by heating or cooling the crystal to the desired temperature during irradia- tion. The cooling should be so arranged as to prevent the condensation of moisture on the surface of the crystal with a consequent decrease in frequency due to mechanical loading. Any formation of frost on the crystal or elsewhere in the path of the direct beam will reduce the intensity of the x-rays by absorption.
A simple and effective method for irradiating wire suspension mounted crystals is to fasten the holder to the tube housing flush with the window with a spring clamp or bit of adhesive tape. Short leads are brought down from the holder pins to the oscillator on which the frequency change is .followed. The crystal inside the
www.americanradiohistory.com
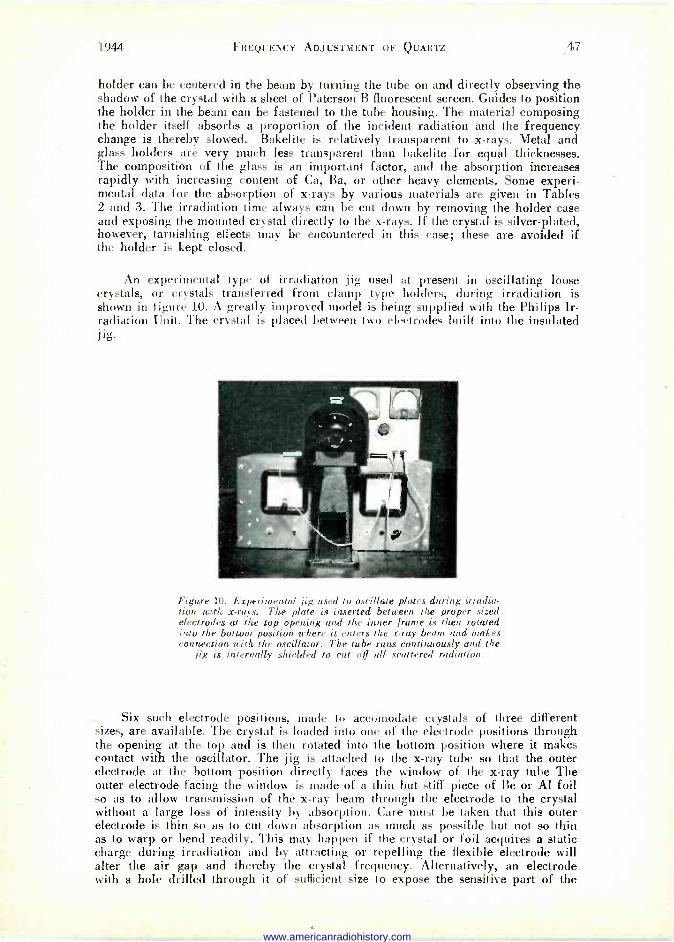
1944 FREQUENCY ADJUSTMENT OF QUARTZ 47
holder can be centered in the beam by turning the tube on and directly observing the shadow of the crystal with a sheet of Paterson B fluorescent screen. Guides to position the holder in the beam can be fastened to the tube housing. The material composing the holder itself absorbs a proportion of the incident radiation and the frequency change is thereby slowed. Bakelite is relatively transparent to x-rays. Metal and glass holders are very much less transparent than bakelite for equal thicknesses. The composition of the glass is an important factor, and the absorption increases rapidly with increasing content of Ca, Ba, or other heavy elements. Some experi- mental data for the absorption of x-rays by various materials are given in Tables 2 and 3. The irradiation time always can be cut down by removing the holder case and exposing the mounted crystal directly to the x-rays. If the crystal is silver-plated, however, tarnishing effects may be encountered in this case; these are avoided if the holder is kept closed.
An experimental type of irradiation jig used at present in oscillating loose crystals, or crystals transferred from clamp type holders, during irradiation is shown in figure 10. A greatly improved model is being supplied with the Philips Ir- radiation Unit. The crystal is placed between two electrodes built into the insulated j ig.
Figure 10. Experimental jig used to oscillate plates during irradia- tion with x-rays. The plate is inserted between the proper sized electrodes at the top opening an4 the inner frame is then rotated into the bottom position where it enters the x-ray beam and makes connection with the oscillator. The tube runs continuously and the
jig is internally shielded to cut off all scattered radiation.
Six such electrode positions, made to accomodate crystals of three different sizes, are available. The crystal is loaded into one of the electrode positions through the opening at the top and is then rotated into the bottom position where it makes contact with the oscillator. The jig is attached to the x-ray tube so that the outer electrode at the bottom position directly faces the window of the x-ray tube The outer electrode facing the window is made of a thin but stiff piece of Be or Al foil so as to allow transmission of the x-ray beam through the electrode to the crystal without a large loss of intensity by absorption. Care must be taken that this outer electrode is thin so as to cut down absorption as much as possible but not so thin as to warp or bend readily. This may happen if the crystal or foil acquires a static charge during irradiation and by attracting or repelling the flexible electrode will alter the air gap and thereby the crystal frequency. Alternatively, an electrode with a hole drilled through it of sufficient size to expose the sensitive part of the
www.americanradiohistory.com
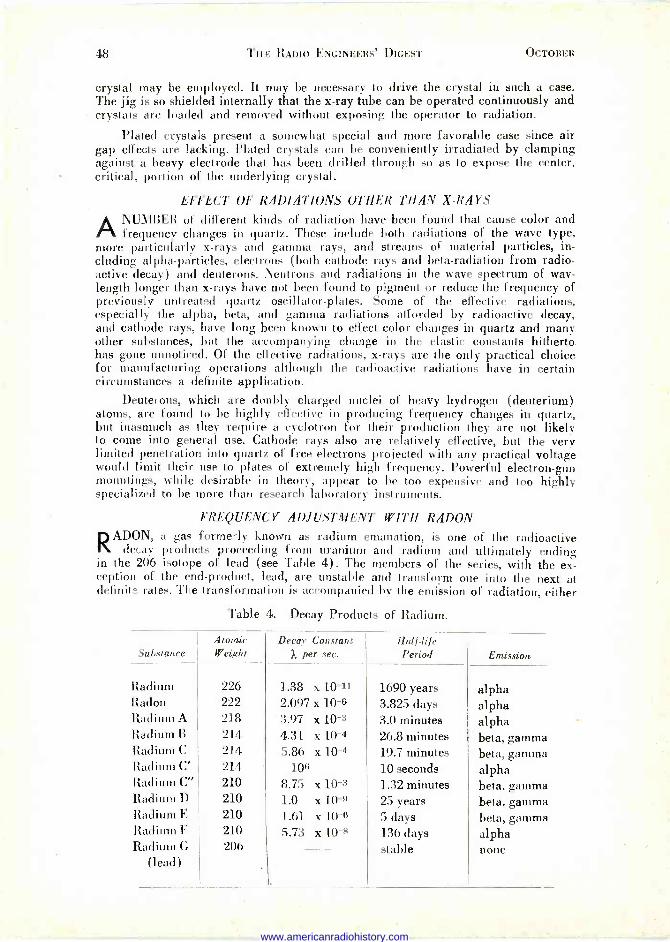
48 THE RADIO ENGINEERS' DIGEST OCTOBER
crystal may be employed. It may be necessary to drive the crystal in such a case. The jig is so shielded internally that the x-ray tube can be operated continuously and crystals are loaded and removed without exposing the operator to radiation.
Plated crystals present a somewhat special and more favorable case since air gap effects are lacking. Plated crystals can be conveniently irradiated by clamping against a heavy electrode that has been drilled through so as to expose the center, critical, portion of the underlying crystal.
EFFECT OF RADIATIONS OTHER THAN X-RAYS
ANUMBER of different kinds of radiation have been found that cause color and frequency changes in quartz. These include both radiations of the wave type,
more particularly x-rays and gamma rays, and streams of material particles, in- cluding alpha -particles, electrons (both cathode rays and beta -radiation from radio- active decay) and deuterons. Neutrons and radiations in the wave spectrum of wav- length longer than x-rays have not been found to pigment or reduce the frequency of previously untreated quartz oscillator -plates. Some of the effective radiations, especially the alpha, beta, and gamma radiations afforded by radioactive decay, and cathode rays, have long been known to effect color changes in quartz and many other substances, but the accompanying change in the elastic constants hitherto. has gone unnoticed. Of the effective radiations, x-rays are the only practical choice for manufacturing operations although the radioactive radiations have in certain circumstances a definite application.
Deuterons, which are doubly charged nuclei of heavy hydrogen (deuterium) atoms, are found to be highly effective in producing frequency changes in quartz, but inasmuch as they require a cyclotron for their production they are not likely to come into general use. Cathode rays also are relatively effective, but the very limited penetration into quartz of free electrons projected with any practical voltage would limit their use to plates of extremely high frequency. Powerful electron -gun mountings, while desirable in theory, appear to be too expensive and too highly specialized to he more than research laboratory instruments.
FREQUENCY ADJUSTMENT WITH RADON RADON, a gas formerly known as radium emanation, is one of the radioactive
decay products proceeding from uranium and radium and ultimately ending in the 206 isotope of lead (see Table 4). The members of the series, with the ex- ception of the end -product, lead, are unstable and transform one into the next at definite rates. The transformation is accompanied by the emission of radiation, either
Table 4. Decay Products of Radium.
Substance Atomic Weight
Decay Constant 1 per sec.
Half-life Period Emission
Radium 226 1.38 x 10⁻¹I 1690 years alpha Radon 222 2.097 x 10⁻⁶ 3.825 days alpha Radium A 218 3.97 x 10⁻³ 3.0 minutes alpha Radium B 214 4.31 x 10⁻⁴ 26.8 minutes beta, gamma Radium C 214 5.86 x 10⁻⁴ 19.7 minutes beta, gamma Radium C' 214 106 10 seconds alpha Radium C" 210 8.75 x 10⁻³ 1.32 minutes beta, gamma Radium D 210 1.0 x 10⁻⁹ 25 years beta, gamma Radium E 210 1.61 x 10⁻⁶ 5 days beta, gamma Radium F 210 5.73 x 10⁻⁸ 136 days alpha Radium G 206 stable none
(lead)
www.americanradiohistory.com

1944 FREQUENCY ADJUSTMENT OF QUARTZ 49
alpha particles or beta particles plus gamma rays, as noted in Table 4. These radi- ations, more particularly the gamma rays, are utilized in therapeutics and industrial radiography and also can be applied to the irradiation of quartz oscillator -plates.
Radon itself emits only alpha particles, but the freshly prepared gas progres- sively disintegrates into RaA, RaB, etc., all present simultaneously in a state of transient equilibrium, and some of these contribute beta and gamma radiation. Because of the long- half life period of RaD, 25 years, and the extremely short life of the products between radon and RaD, the length of time in which a radon preparation can be used as a practical source of radiation is fixed by the decay constant of radon itself. The decay of radon is exponential, and can be expressed
N = Noe _At
where N is the number of relative units of radon (atoms, or millicuries Ì which survive after a time t, No the number originally present at time zero, and 7` is a constant ( =2.097 x 10⁻⁶ for radon) indicating the rate of disintegration. Roughly about 16.5. percent of the activity of radon, as measured by its gamma output after transient equilibrium is reached, is lost each 24 hours. Half intensity is rearhed in 3.825 days and only about 0.4 percent of the initial activity remains after 30 days. The total amount or intensity of the radiation delivered by a given quantity of radon is conveniently expressed by the number of millicurie-hours delivered. The millicurie is the standard of measure of radon, and represents the amount of radon in radio- active equilibrium with 1 milligram of radium element. The millicurie-hour output can be calculated from the area under the curve of the decay equation. Table 5
gives the millicurie-hour output of one millicurie over selected times up to 30 days.
Table 5. Decay of Radon.
(Giving the percent remaining, and number of millicurie-hours of radiation afforded, if the original strength at time zero is one millicuriel
Time Percent Millicurie-Hours
Remaining Afforded Tune Percent Millicurie-Hours
Remaining Afforded
0 100 0 Days Hrs.
5 hours 96.29 4.94 2 20 59.82 53.42
10 92.72 9.62 3 0 58.05 55.80
15 89.29 14.25 4 0 48.42 68.60
20 85.98 18.64 5 0 40.43 79.30 24 83.42 22.08 6 0 33.70 88.40
1 day 5 hrs. 80.32 26.18 7 0 28.11 95.78 1 10 77.35 30.15 10 0 16.32 111.4
1 15 74.48 33.98 20 0 2.66 129.4
1 20 71.72 37.60 30 0 0.4 132.7
2 0 69.59 40.45 complete 0.0 133.3
2 10 64.52 47.12
Method. In using radon to adjust frequency, the plates are sealed in a hollow lead container in direct contact with the gas where they are acted upon by the alpha, beta and gamma radiationsproceeding therefrom. The walls of the container should be at least one inch thick to guard against the gamma rays. Ordinarily the container is opened and the crystals removed while a considerable portion of the original radon charge still remains. This operation should be done in a hood under strong
www.americanradiohistory.com
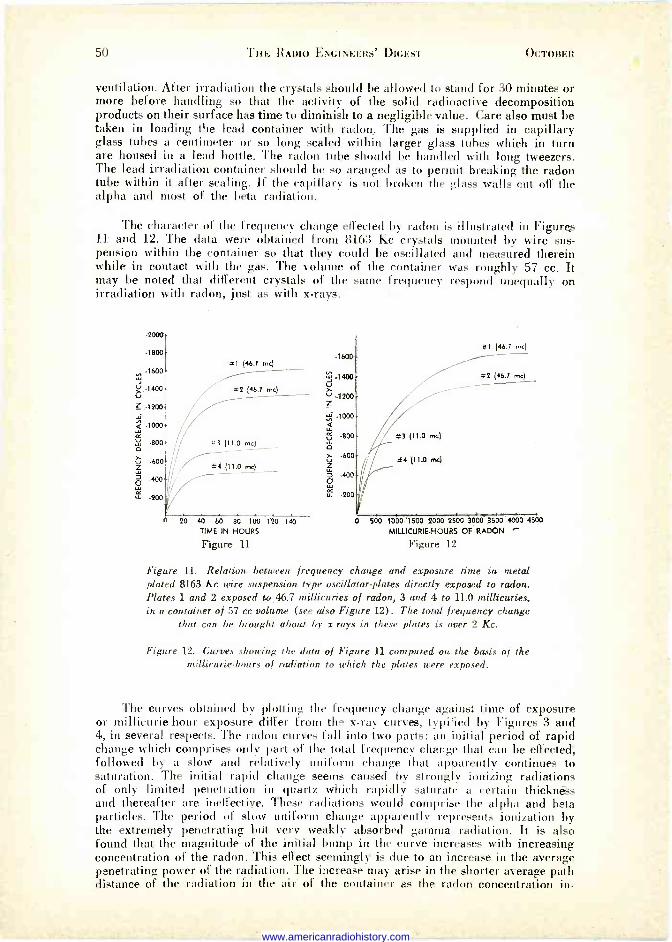
50 THE RADIO ENGINEERS' DIGEST OCTOBER
ventilation. After irradiation the crystals should be allowed to stand for 30 minutes or more before handling so that the activity of the solid radioactive decomposition products on their surface has time to diminish to a negligible value. Care also must be taken in loading the lead container with radon. The gas is supplied in capillary glass tubes a centimeter or so long sealed within larger glass tubes which in turn are housed in a lead bottle. The radon tube should be handled with long tweezers. The lead irradiation container should be so aranged as to permit breaking the radon tube within it after sealing. If the capillary is not broken the glass walls cut off the alpha and most of the beta radiation.
The character of the frequency change effected by radon is illustrated in Figures 11 and 12. The data were obtained from 8163 Kc crystals mounted by wire sus- pension within the container so that they could be oscillated and measured therein while in contact with the gas. The volume of the container was roughly 57 cc. It may be noted that different crystals of the same frequency respond unequally on irradiation with radon, just as with x-rays.
-2000
.1800
-1600
J r -1400 V
.1200
Q -1000 K
-800 o
Z -b00
.4QQ
LL -200
O 20 40 60 80 100 120 140
TIME IN HOURS
Figure 11
.1400 V
Z 1200 / -1000
V -800 *3 (11.0 mc)
o v -600 / *4 (11.0 me) z a -400
LL -200
#1 (46.7 mc)
#2 (46.7 mc)
0 500 1000 1500 2000 2500 3000 3500 40004500 MIWCURIE-HOURS OF RADON
Figure 12
Figure 11. Relation between frequency change and exposure time in metal plated 8163 Kc wire suspension type oscillator -plates directly exposed to radon. Plates 1 and 2 exposed to 46.7 millicuries of radon, 3 and 4 to 11.0 millicuries, in a container of 57 cc volume (see also Figure 12). The total frequency change
that can be brought about by x-rays in these plates is over 2 Kc.
Figure 12. Curves showing the data of Figure 11 computed on the basis of the millicurie-hours of radiation to which the plates were exposed.
The curves obtained by plotting the frequency change against time of exposure or millicurie-hour exposure differ from the x-ray curves, typified by Figures 3 and 4, in several respects. The radon curves fall into two parts: an initial period of rapid change which comprises only part of the total frequency change that can be effected, followed by a slow and relatively uniform change that apparently continues to saturation. The initial rapid change seems caused by strongly ionizing radiations of only limited penetration in quartz which rapidly saturate a certain thickness and thereafter are ineffective. These radiations would comprise the alpha and beta particles. The period of slow uniform change apparently represents ionization by the extremely penetrating but very weakly absorbed gamma radiation. It is also found that the magnitude of the initial bump in the curve increases with increasing concentration of the radon. This effect seemingly is due to an increase in the average penetrating power of the radiation. The increase may arise in the shorter average paih distance of the radiation in the air of the container as the radon concentration in-
www.americanradiohistory.com
1944 FREQUENCY ADJUSTMENT OF QUARTZ 51
creases, with consequent less loss of energy by absorption and scattering before entering the quartz.
Theoretically, the time rate of change of frequency should vary in proportion to the concentration of radon, and the millicurie-hour rate of change in plates of a given frequency should be constant and independent of concentration. There are rather marked departures from this due to intrinsic variations in the response of different specimens of quartz and to the penetration effect noted above. The average millicurie-hour rate of change of frequency calculated from the limited data at hand is roughly 2.26 cycles per me -hr in 8163 Kc plates. The rate was calculated on the basis of the initial, linear, part of the frequency curves.
The advantage of the radon method is that a large number of plates can be equally and simultaneously irradiated. This can be accomplished by racking the plates in the container. The unit cost is proportional to the number of plates, since the same amount of radon will suffice for one as for many plates, within certain limits, if the gas volume is kept constant by appropriate design of the rack and container. This is due to the fact that only a small part of the available radiation is utilized in any case. The principal factors that determine the application of the method are the cost of the radon (roughly $1.00 a millicurie), the total number of plates to be irradiated, the average amount of frequency change desired, and the time in which the frequency change must be effected. The two latter factors fix the amount; of radon that must be employed. The actual estimation of this amount requires a knowledge of the relation between radon concentration and both the average amount of frequency change and the average time rate of change of frequency. These two factors are not independent, as noted, and their relation to radon concentration varies with the frequency of the plate. The amount of radon required, the exposure time, and the accompanying total average frequency change can be calculated directly if any one of these factors is known and if the millicurie-hour rate of change of frequency has been previously established for the crystal frequency in question and the container in question.
For example, it is desired to know how much radon is needed to effect an average change of 500 cycles in 24 hours in 8163 Kc plates, under the experimental conditions previously described. The total number of millicurie-hours of radon required is 500 = 221, where 2.26 is the experimentally established millicurie-hour
2.26 rate of change of frequency in 8163 Kc crystals. Using Table 5, it is found that 1 millicurie of radon affords 22.08 millicurie-hours of radiation in 24 hours, so that a total charge of 10 millicuries is needed to yield 221 millicurie-hours in the same time. The total cost is roughly $10.00, and the unit cost depends on the number of plates run simultaneously. The cost could be reduced by increasing the time of irradiation, thus necessitating less radon for the initial charge, but a practical limit is set in this by the relation between total frequency change and the amount of radon used. In general, for small numbers of plates and for frequency changes that must be effected in a very short time the cost of radon treatment is much greater than that of the x-ray method.
BIBLIOGRAPHY
The following works contain general accounts of the production, absorption and application of x-rays and other ionizing radiations:
Ions, Electrons and Ionizing Radiations. J. A. Crowther. Longmans, Green, 1938. Electron and Nuclear Physics. J. B. Hoag. Van Nostrand, 1938.
www.americanradiohistory.com
52 THE RADIO ENGINEERS' DIGEST
Introduction to Modern Physics. F. K. Richtmeyer and E. H. Kennard. McGraw-Hill, 1942.
Radiology Physics. J. K. Robertson. Van Nostrand, 1941.
X -Rays in Theory and Experiment. A. H. Compton and S. K. Allison. Van Nostrand, 1935.
Radiations from Radioactive Substances. E. Rutherford, J. Chadwick and C. D. Ellis. Macmillan, 1930.
Works dealing more directly with photoelectric and photochemical phenomena are:
Electronic Processes in Ionic Crystals. N. F. Mott and R. W. Gurney. Oxford, 1940.
The Chemical Aspects of Light. E. J. Bower. Oxford, 1942.
The Chemical Action of Ultraviolet Rays. F. F. Heyroth. Reinhold, 1941.
Das Radium und die Farben. C. Doelter. Dresden, 1910.
Photoconductivity in Crystals. A. L. Hughes. Reviews Modern Physics, Vol. 8, p. 294, 1936.
Luminescence of Liquids and Solids. P. Pringsheim and M. Vogel. Interscience Publ., 1943.
Photoelectric Phenomena. A. L. Hughes and L. A. Dubridge. McGraw-Hill, 1932.
Photochemistry and the Mechanism of Chemical Reactions. G. K. Rollefson and M. Burton. Prentice -Hall, 1942.
www.americanradiohistory.com
i
www.americanradiohistory.com

HASTEN THE DAY!
BUY WAR BONDS
www.americanradiohistory.com