Embed Size (px)
Citation preview

.
.
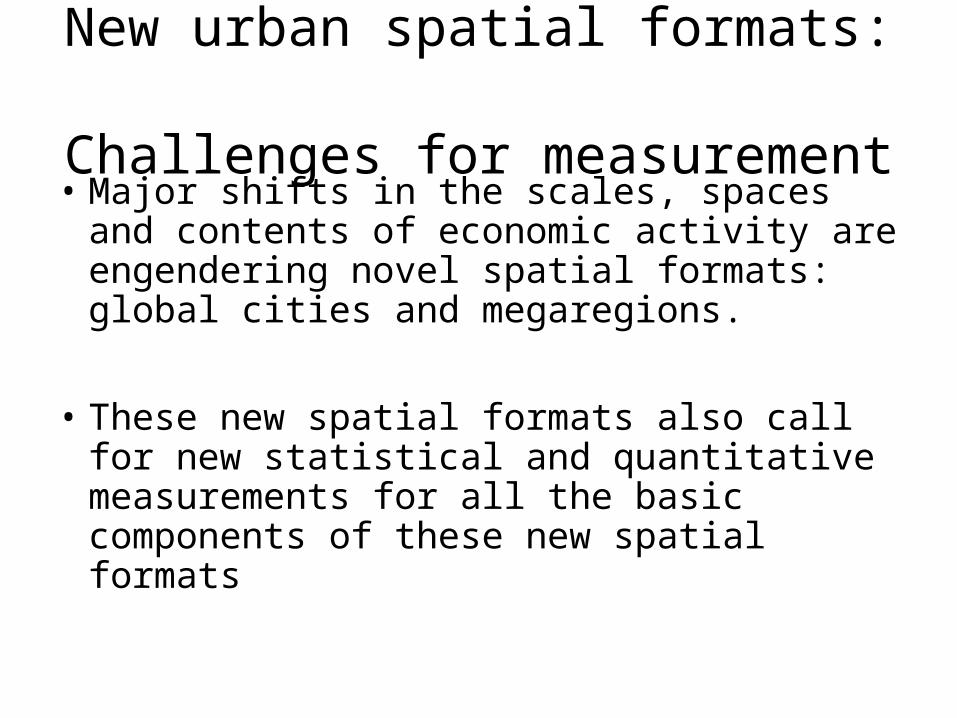
New urban spatial formats: Challenges for measurement
• Major shifts in the scales, spaces and contents of economic activity are engendering novel spatial formats: global cities and megaregions.
• These new spatial formats also call for new statistical and quantitative measurements for all the basic components of these new spatial formats

Urban areas have always been difficult to measure
• But measuring the components of global cities and megaregions poses especially difficult issues:
• Global cities: Rapidly growing share of their economy and population are circulating in and out.
• A megaregion includes cities, suburbs, metropolitan areas, administrative regions.

Measurement difficulties: global cities
• Core components of the economy are part of larger transnational operations: the global city under study is just one moment of a firm’s or a market’s components
• Example: global finance: - operates largely in electronic space- before we can measure how it fits into a
city’s economy, we need to understand how a financial center (territorial) matters to global electronic finance .

Measurement difficulties:Megaregions
• Emerging spaces: thus identifying the boundary will require far more projection of future trends in all the key economic sectors of a region, than has been typical.
• Furthermore, it requires dealing with the potentially very diverse types of measurements that a given country has developed for different territorial units –cities, suburbs, metropolitan areas, administrative regions.
• Megaregions cut across diverse administrative units but incorporate only part of each .

Taken from Urbanage.net
.
• .
Taken from Urbanage.net
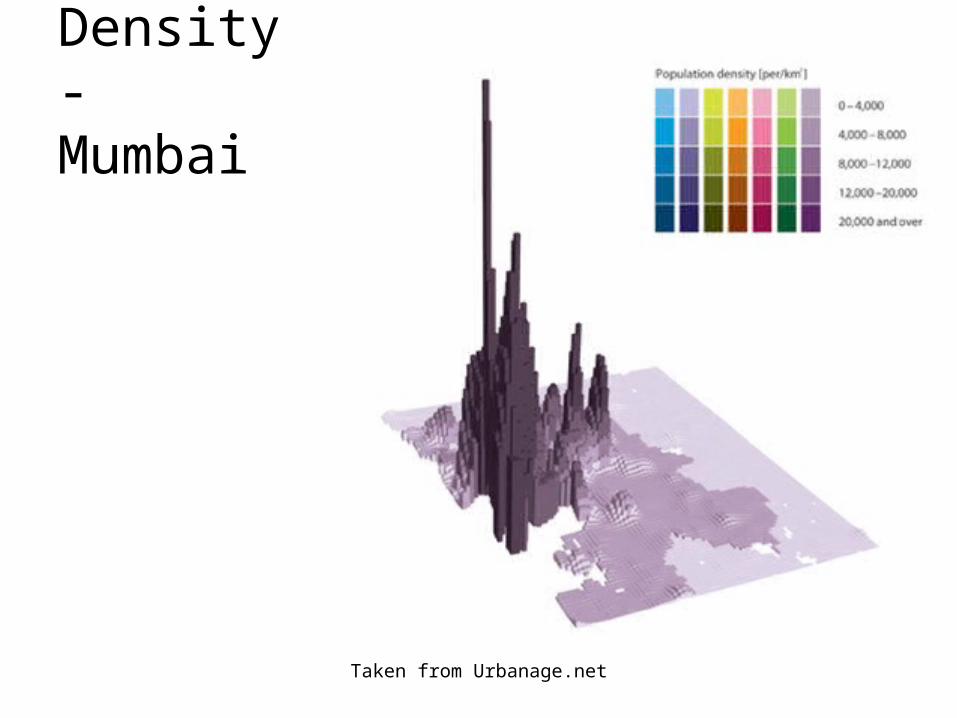
Density- Mumbai

Taken from Urbanage.net
Density- NYC

Taken from Urbanage.net
Density- Shanghai
Taken from Urbanage.net
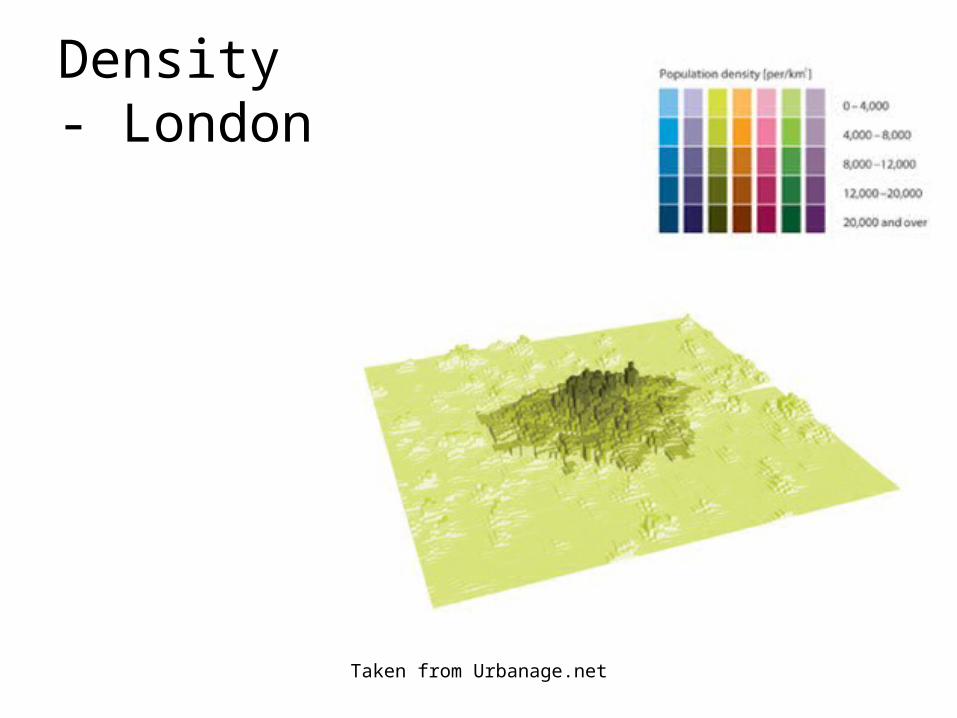
Density - London
Taken from Urbanage.net
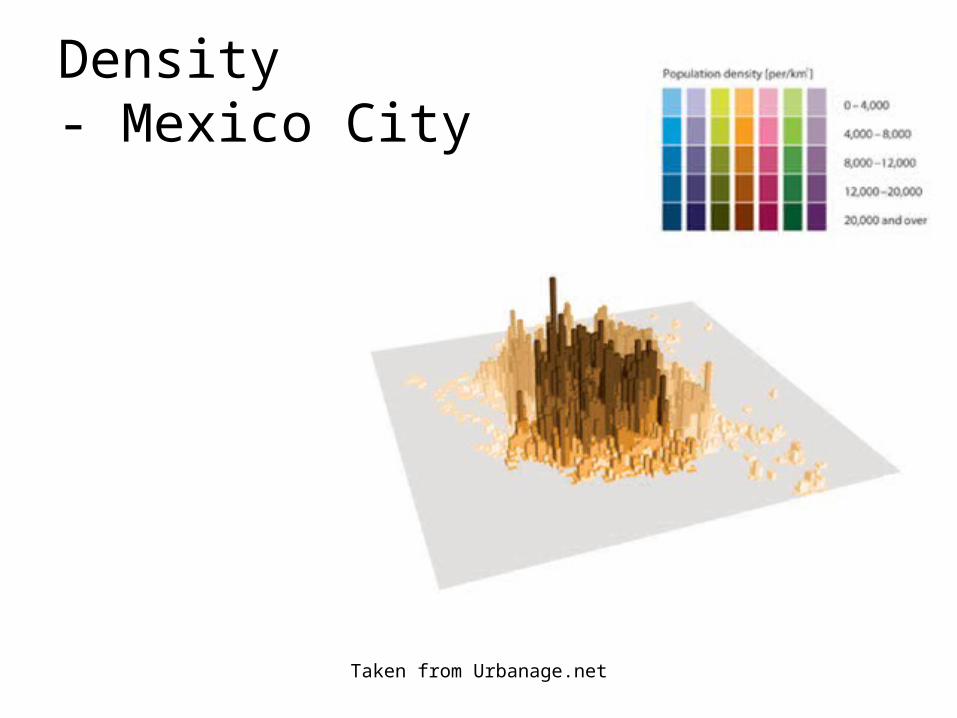
Density- Mexico City

Taken from Urbanage.net
Density- Johannesburg

Density and Travel to Work
Residential Density

New York
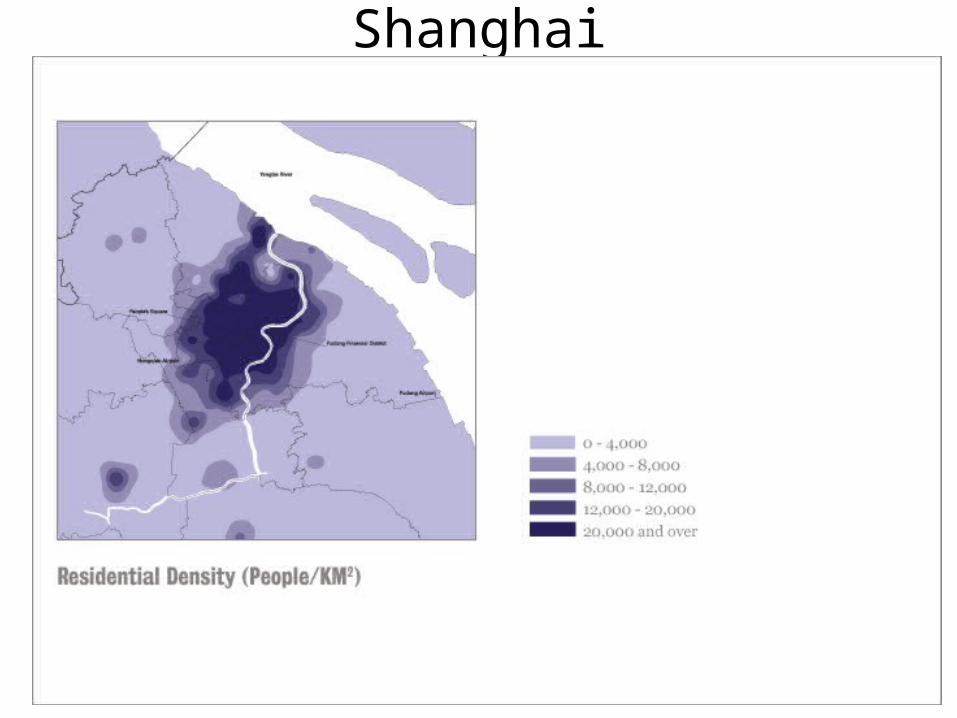
Shanghai

London

Mexico
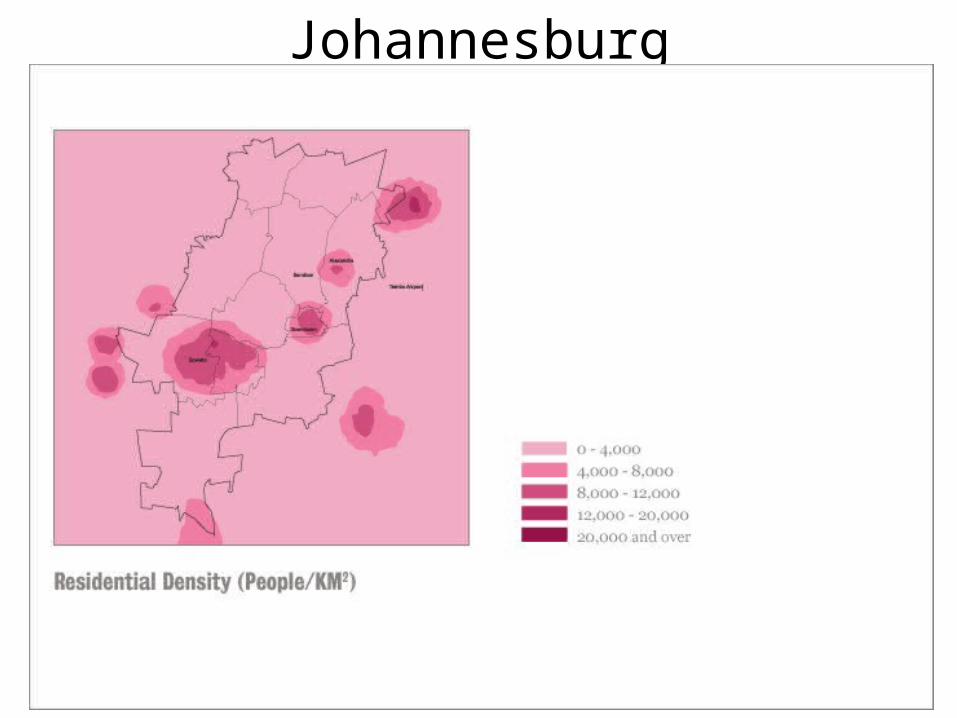
Johannesburg

Berlin


Travel to Work

New York

Shanghai

London

Mexico
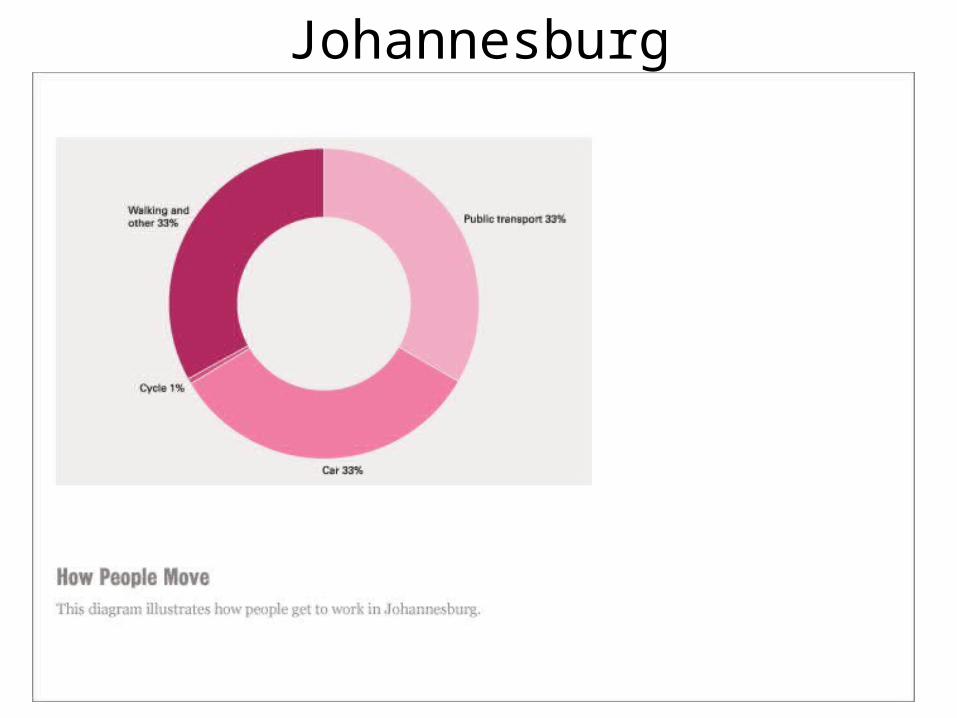
Johannesburg

Berlin

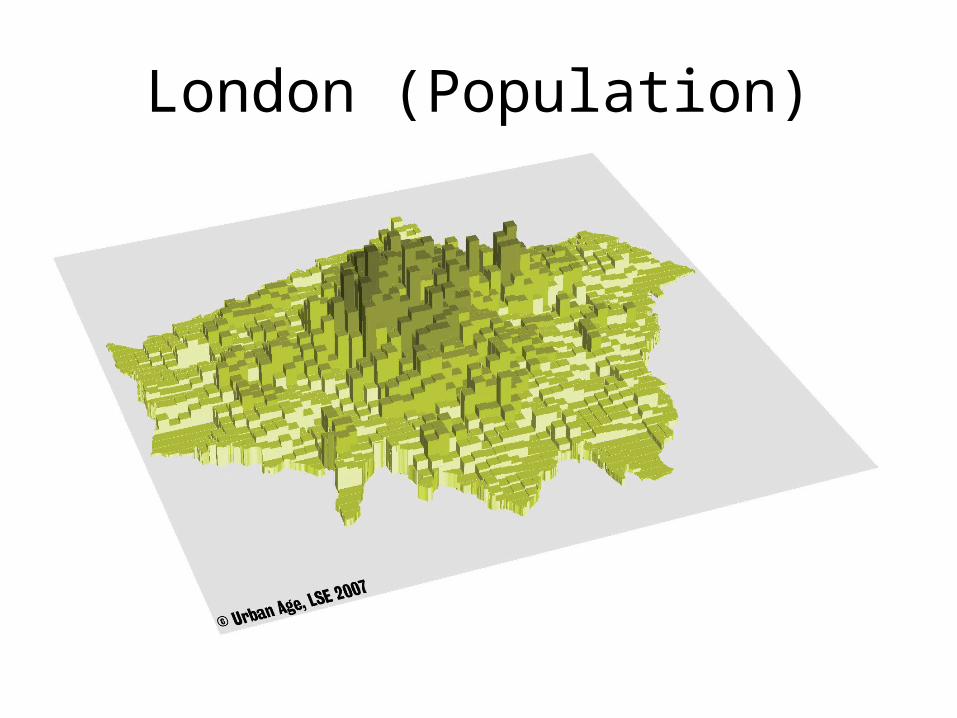
London (Population)
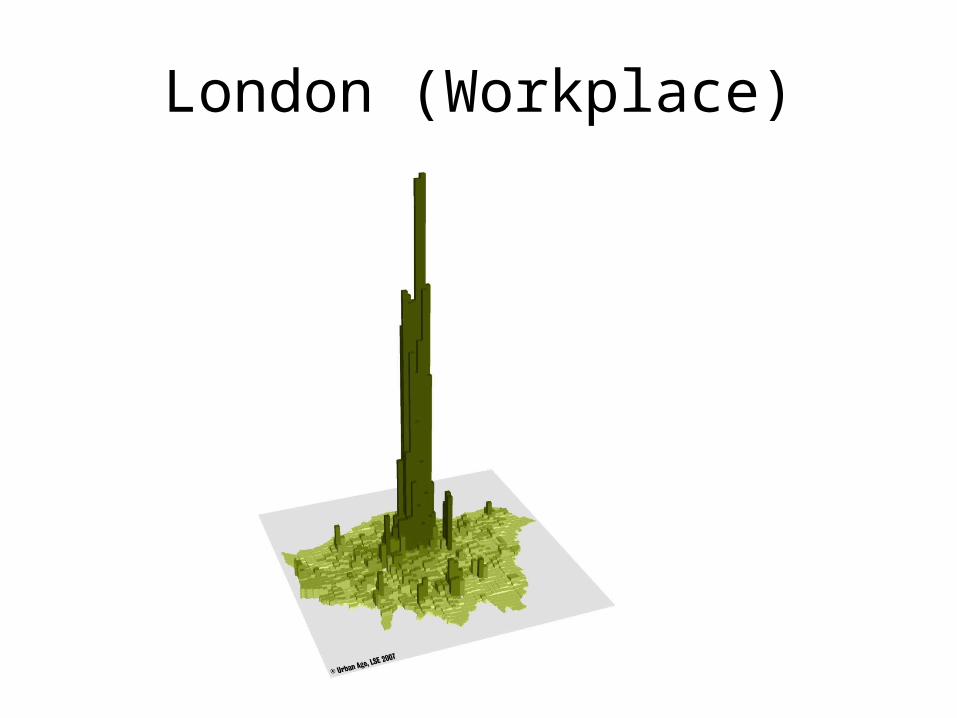
London (Workplace)
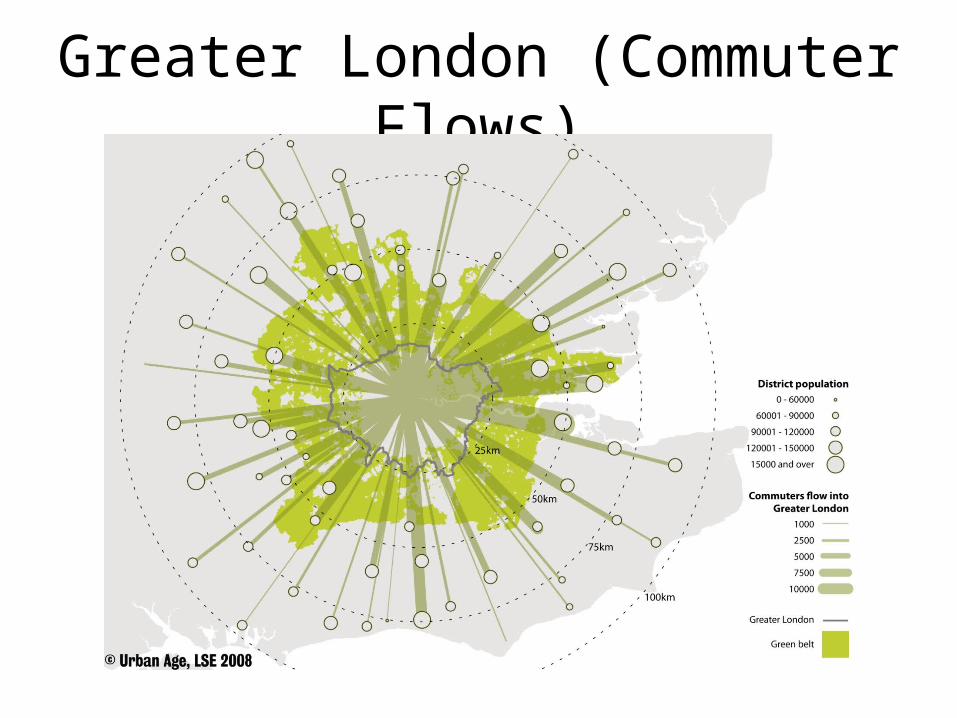
Greater London (Commuter Flows)
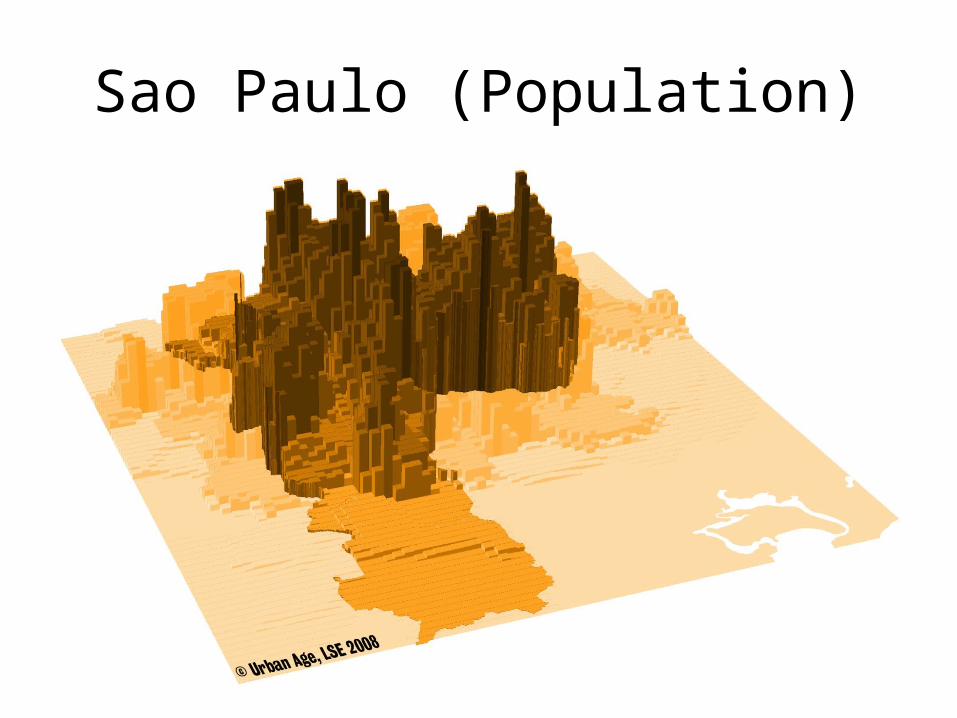
Sao Paulo (Population)

Sao Paulo (Workplace)

.
• .

Overall Ranking:
WCOC Index, Top 20
1 London 79.17
2 New York 72.77
3 Tokyo 66.60
4 Singapore 66.16
5 Chicago 65.24
6 Hong Kong 63.94
7 Paris 63.87
8 Frankfurt 62.34
9 Seoul 61.83
10 Amsterdam 60.06
11 Madrid 58.34
12 Sydney 58.33
13 Toronto 58.16
14 Copenhagen 57.99
15 Zurich 56.86
16 Stockholm 56.67
17 Los Angeles 55.73
18 Philadelphia 55.55
19 Osaka 54.94
20 Milan 54.73

Indicator 3: Ease of Doing Business
Subindicators
• Starting a Business
• Employing Workers
• Getting Credit
• Closing a Business
• Conventions/Exhibitions/Meetings
Conventions/Exhibitions/MeetingsBanking ServicesEase of Entry and ExitInvestor ProtectionCorporate Tax BurdenContract Enforcement

Ease of Doing
Business: Top 20
City Dimension 3 Score
1 Singapore 82.82
2 Hong Kong 80.37
3 London 79.42
4 Toronto 76.24
5 New York 75.91
6 Dublin 75.71
7 Edinburgh 75.29
8 Vancouver 74.89
9 Montreal 74.60
10 Chicago 73.81
11 San Francisco 73.68
12 Sydney 72.39
13 Los Angeles 72.34
14 Boston 71.89
15 Washington D.C. 71.78
16 Copenhagen 71.72
17 Atlanta 71.69
18 Miami 71.51
19 Melbourne 71.34
20 Dallas 71.32
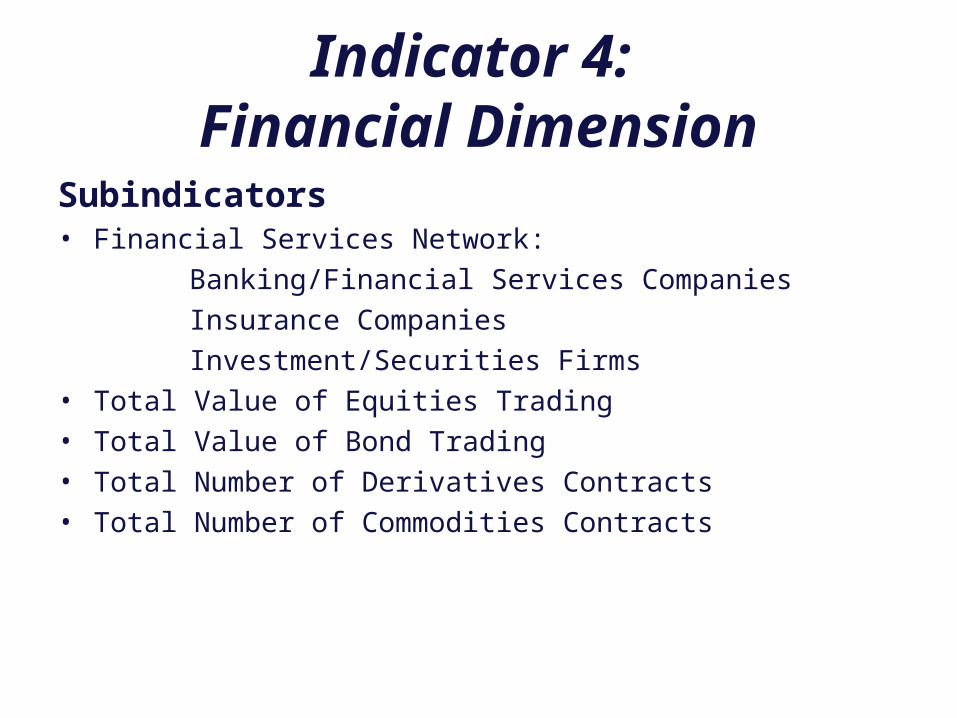
Indicator 4: Financial Dimension
Subindicators• Financial Services Network:
Banking/Financial Services Companies
Insurance Companies
Investment/Securities Firms• Total Value of Equities Trading• Total Value of Bond Trading• Total Number of Derivatives Contracts• Total Number of Commodities Contracts

Financial Dimension:
Top 20
City Dimension 4 Score
1 London 84.70
2 New York 67.85
3 Frankfurt 52.88
4 Seoul 52.76
5 Chicago 52.51
6 Tokyo 48.95
7 Mumbai 47.32
8 Moscow 47.27
9 Shanghai 46.54
10 Madrid 44.60
11 Singapore 42.15
12 Paris 41.85
13 Hong Kong 39.61
14 Sydney 39.47
15 Milan 38.45
16 Sao Paulo 34.92
17 Amsterdam 34.44
18 Copenhagen 33.24
19 Taipei 33.04
20 Zurich 31.93
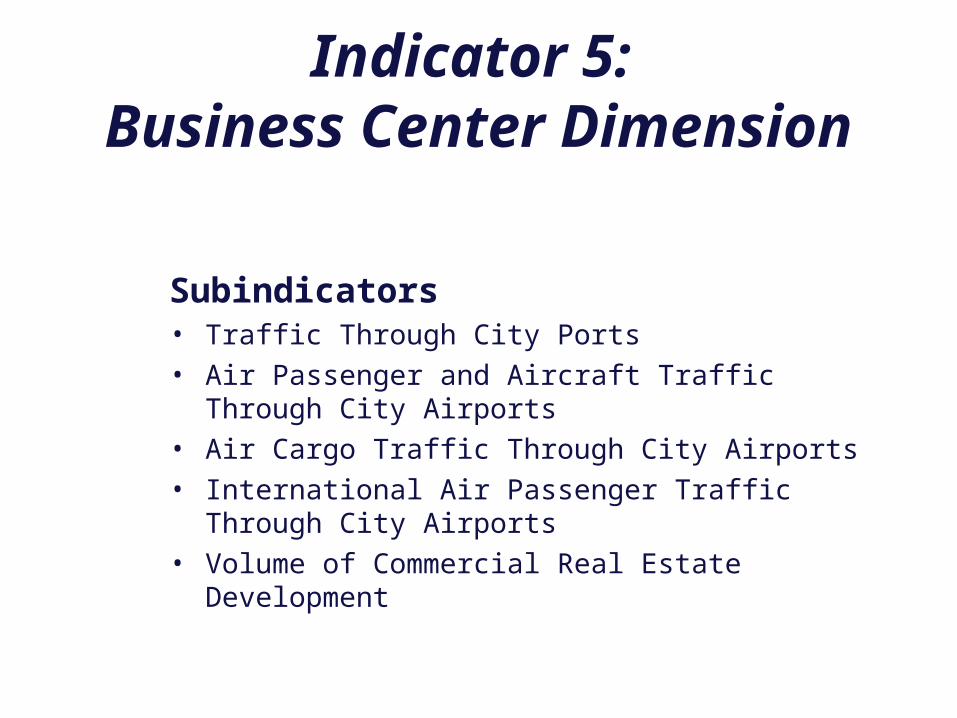
Indicator 5: Business Center Dimension
Subindicators• Traffic Through City Ports• Air Passenger and Aircraft Traffic Through City
Airports• Air Cargo Traffic Through City Airports• International Air Passenger Traffic Through City
Airports• Volume of Commercial Real Estate Development

Business Center
Dimension: Top 20
City Dimension 5 Score
1 Hong Kong 72.25
2 London 67.44
3 Singapore 62.58
4 Shanghai 60.30
5 Dubai 59.34
6 Tokyo 58.15
7 Paris 57.73
8 New York 54.60
9 Amsterdam 48.00
10 Seoul 47.33
11 Frankfurt 46.73
12 Los Angeles 44.47
13 Bangkok 44.21
14 Chicago 40.52
15 Miami 39.23
16 Taipei 37.78
17 Madrid 37.71
18 Milan 36.46
19 Beijing 35.07
20 Atlanta 33.69

Knowledge Creation and Information
Flows: Top 20
City Dimension 6 Score
1 London 62.35
2 New York 59.02
3 Tokyo 52.06
4 Paris 51.65
5 Seoul 51.31
6 Zurich 47.84
7 Chicago 46.31
8 Geneva 45.28
9 Stockholm 44.15
10 Los Angeles 43.08
11 Osaka 40.87
12 Boston 40.58
13 Copenhagen 39.57
14 Singapore 39.45
15 Berlin 39.41
16 Amsterdam 39.11
17 Atlanta 38.21
18 Philadelphia 37.80
19 Washington D.C. 37.46
20 Taipei 37.00

Overall Ranking:
WCOC Index
1 London 79.17
2 New York 72.77
3 Tokyo 66.60
4 Singapore 66.16
5 Chicago 65.24
6 Hong Kong 63.94
7 Paris 63.87
8 Frankfurt 62.34
9 Seoul 61.83
10 Amsterdam 60.06
11 Madrid 58.34
12 Sydney 58.33
13 Toronto 58.16
14 Copenhagen 57.99
15 Zurich 56.86
16 Stockholm 56.67
17 Los Angeles 55.73
18 Philadelphia 55.55
19 Osaka 54.94
20 Milan 54.73