Embed Size (px)
Citation preview

339
JKMU Journal of Kerman University of Medical Sciences, 2018; 25 (4): 339-354
Investigating the Levels of Thermal Stress in Kerman City in 2016 Using
Thermal Indices: WBGT, ESI, HI, HSI, and SWreq
Sajad Zare, Ph.D. 1, Rasoul Hemmatjo, Ph.D.
2, Hossein Elahi Shirvan, M.S.c.
3, Naser Hasheminejad, Ph.D.
4,
Keyvan Sarebanzadeh, M.S.c. 5, Khodabakhsh Zare, M.S.c.
6, Mohammad Faridan, Ph.D.
7
1- Assistant Professor, Department of Occupational Health, School of Public Health, Kerman University of Medical Sciences, Kerman, Iran
2- Assistant Professor, Department of Occupational Health, School of Public Health, Urmia University of Medical Sciences, Urmia, Iran
3- Student Research Committee, Kerman University of Medical Sciences, Kerman, Iran
4- Associate Professor, Department of Occupational Health, School of Public Health, Kerman University of Medical Sciences, Kerman, Iran
5- Student Research Committee, Kerman University of Medical Sciences, Kerman, Iran (Corresponding author; [email protected])
6- Occupational Health Engineering, Shiraz University of Medical Sciences, Shiraz, Iran
7- Assistant Professor, Department of Public Health, Faculty of Health, Lorestan University of Medical Sciences, Lorestan, Iran
Received: 17 January, 2018 Accepted: 18 April, 2018
ARTICLE INFO
Original Article
Thermal climate
Heat indices
Heat
Temperature
Thermal stress may have numerous harmful effects on human health. This
study aimed at investigating thermal stress in the city of Kerman, Iran.
In this descriptive-analytical study, thermal stress was assessed from 6 AM to 9
PM in 2016 using four thermal stress indices including wet-bulb globe temperature
(WBGT), environmental stress index (ESI), Humidex, heat stress index (HSI), and Required
Sweat Rate (SWreq). Necessary data were collected from the meteorological organization of
Kerman. Pearson’s correlation coefficient and linear regression were used to examine the
relationships among thermal stress indices and environmental parameters. All analyses were
performed using SPSS version 22.
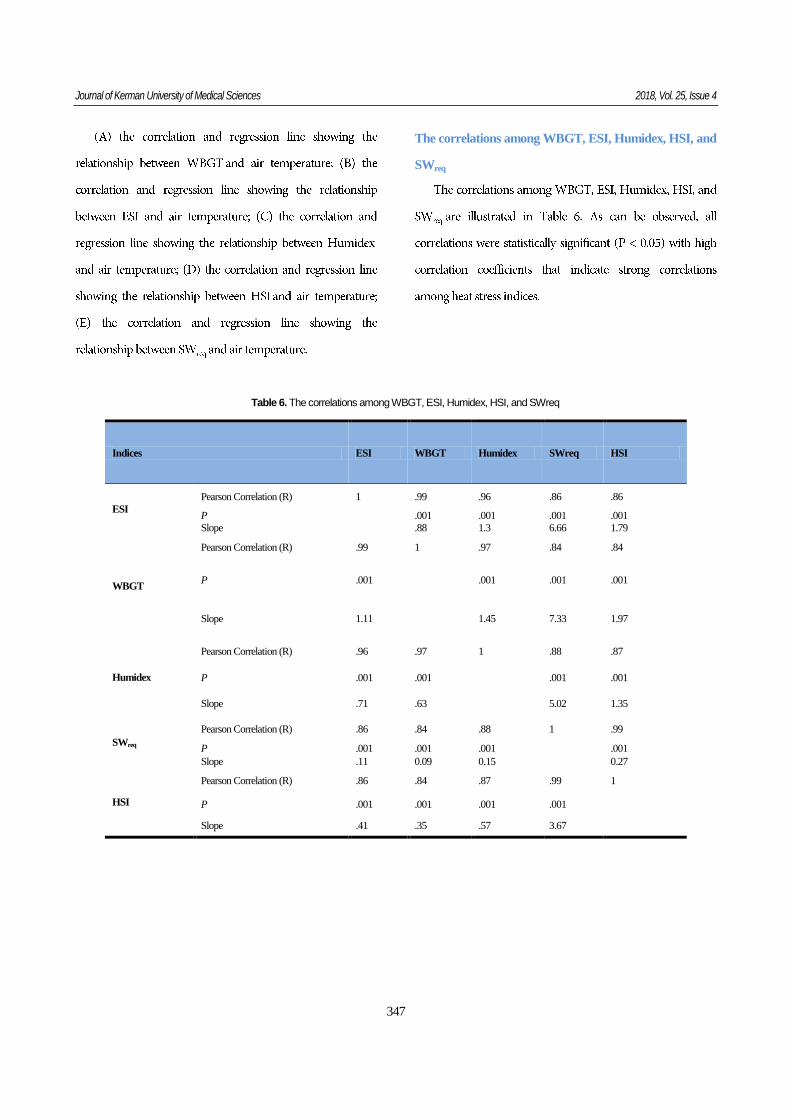
Based on the results, the highest correlation coefficients were observed between
ESI and WBGT (r = 0.99), Humidex and ESI (r = 0.96), Humidex and WBGT (r = 0.97)
and SWreq and HSI (r = 0.99). On the other hand, thermal stress indices had significant
relationships with environmental parameters including wind speed, air temperature, and
relative humidity (P < 0.05).
All indices had strong and significant associations with one another. WBGT,
HSI, and Humidex demonstrated similar thermal sensations. Furthermore, according to the
obtained values of ESI, Humidex, and WBGT, people enjoy thermal comfort in all months
of the year (save for January as judged by the obtained WBGT value). Thus, the climate of
this city poses no threat to people’s thermal comfort.
Introduction

Thermal stress and thermal idices Zare, et al
340

Journal of Kerman University of Medical Sciences 2018, Vol. 25, Issue 4
341
Materials and Methods
Location of the study
Figure 1: Kerman’s location in Iran (30°15′N 56°58′E)
Collecting data related to environmental parameters

Thermal stress and thermal idices Zare, et al
342
Table 1.
Months Metabolic rate (w/m2) Cloudiness (octane) Clothing insulation (clo)
Jan-Feb-Mar 80 4 1.5
Apr-May-Jun 80 1 0.7
July-Aug-Sep 80 0 0.5
Oct-Nov-Dec 80 2 1.2
Fixed input values fed into Bioklima Software
Calculating heat stress indices (WBGT, ESI, Humidex,
HSI and SWreq)
Wet-bulb globe temperature
Environmental stress index
Humidex index
1 15417.753
273.16 273.166.11
tdvp e
Heat stress index
Journal of Kerman University of Medical Sciences 2018, Vol. 25, Issue 4
343
Required Sweat Rate
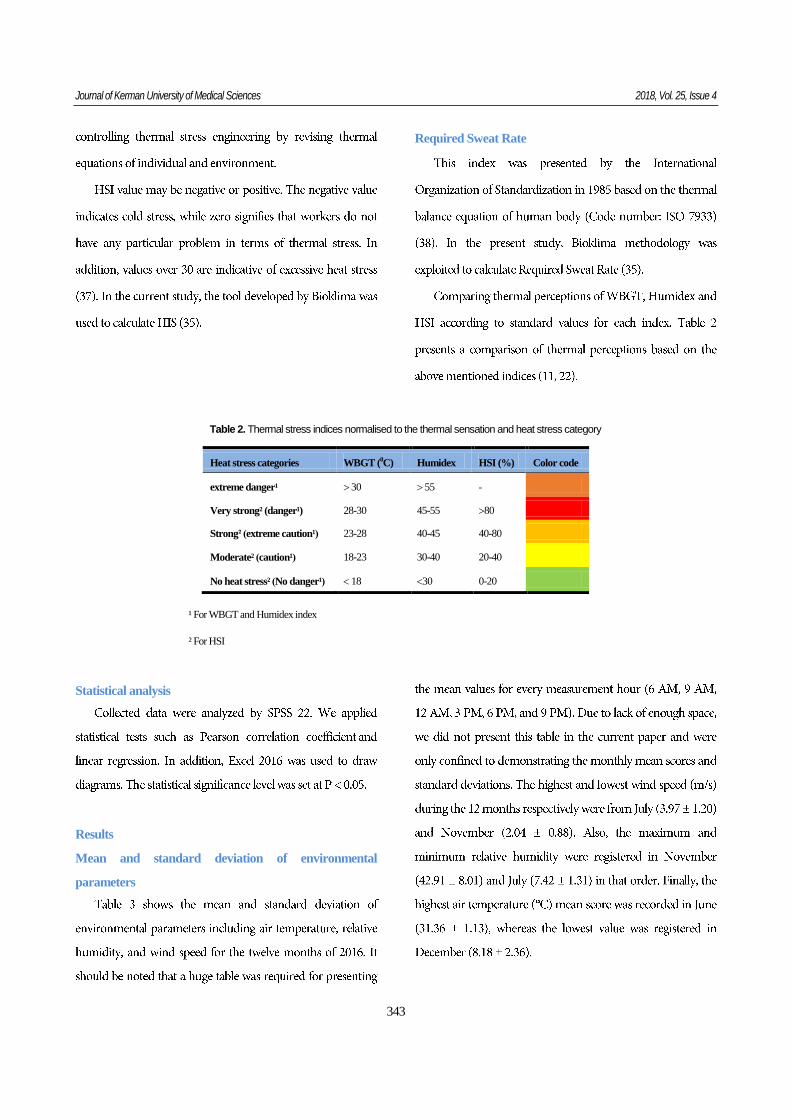
Table 2. Thermal stress indices normalised to the thermal sensation and heat stress category
Heat stress categories WBGT (0C) Humidex HSI (%) Color code
extreme danger¹ 30 55 -
Very strong² (danger¹) 28-30 45-55 80
Strong )² extreme caution¹ ( 23-28 40-45 40-80
Moderate² )caution¹ ( 18-23 30-40 20-40
No heat stress² )No danger¹ ( 18 30 0-20
¹ For WBGT and Humidex index
² For HSI
Statistical analysis
Results
Mean and standard deviation of environmental
parameters

Thermal stress and thermal idices Zare, et al
344
Table 3. Mean and standard deviation of environmental parameters for the twelve months of 2016
Hour Parameters
JAN FEB MAR APR MAY JUN JUL AUG SEP OCT NOV DEC
24-hour
mean
Wind Speed (m/s) Mean 2.24 2.74 2.07 3.07 3.41 3.48 3.97 3.66 2.48 2.24 2.04 1.96
SD* 1.81 1.42 0.67 1.25 1.39 0.87 1.20 1.08 1.04 0.70 0.88 1.03
Humidity (%) Mean 20.18 39.58 38.28 22.41 11.38 7.83 7.42 11.04 17.73 19.03 42.91 29.11
SD 7.35 10.55 14.11 9.22 3.82 1.93 1.31 2.56 7.47 4.37 8.01 10.17
Air Temperature (0C) Mean 9.99 9.54 13.72 20.92 28.09 31.3 29.8 27.83 25.40 23.17 12.61 8.18
SD 3.91 4.76 5.22 3.50 2.50 1.13 1.38 1.09 2.83 1.47 2.93 2.36
*SD: Standard deviation
The values of WBGT, ESI, Humidex, HSI and SWreq
Table 4. Mean and standard deviation of the WBGT, ESI, Humidex, HSI and SWreq indices in a 24-hour period in 12 months of 2016
24-hour mean of Indices JAN FEB MAR APR MAY JUN JUL AUG SEP OCT NOV DEC Annual
24-
hour
mean
WBGT (ºC)
Mean -0.53 4.24 1.33 9.72 9.54 18.69 13.50 11.33 9.29 7.71 6.77 -3.18 7.37
SD 4.00 3.83 4.04 1.46 0.67 1.40 2.58 2.34 1.72 0.96 4.81 2.62 2.54
ESI (ºC)
Mean 0.36 3.48 -0.86 10.06 10.10 11.98 14.15 12.02 9.88 7.89 3.45 -4.44 6.51
SD 3.75 4.27 4.78 1.23 0.55 0.73 2.53 2.19 1.84 0.69 4.83 1.73 2.43
Humidex (ºC)
Mean -1.66 2.56 -0.03 12.06 12.02 26.71 18.23 14.89 11.74 9.08 4.06 -5.52 8.68
SD 5.17 1.88 5.34 1.96 0.89 2.38 4.02 3.37 2.64 1.18 7.02 2.91 3.23
heat stress index (%)
Mean -3.61 6.54 2.55 3.22 5.99 13.79 10.01 3.12 -4.56 7.59 -1.37 -13.32 2.50
SD 6.01 5.98 6.88 2.25 3.83 7.39 6.75 5.70 5.67 2.10 8.85 3.70 5.43
Swreq (W/m²)
Mean -13.80 23.26 6.97 7.17 19.17 40.14 36.55 10.99 -16.41 26.70 -6.54 -46.06 7.35
SD 22.80 21.08 23.83 2.18 11.59 12.51 24.76 20.71 20.50 6.66 28.86 18.22 17.81

Journal of Kerman University of Medical Sciences 2018, Vol. 25, Issue 4
345
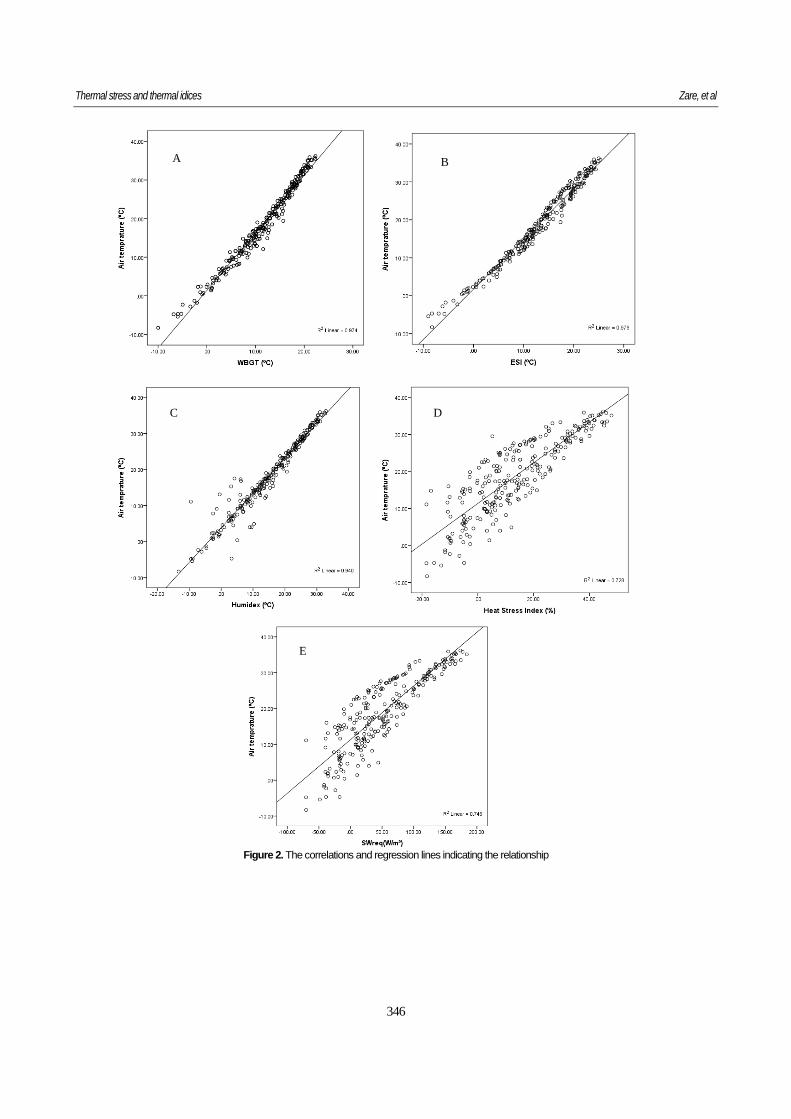
The correlation between WBGT, ESI, Humidex, HSI and
SWreq indices and environmental parameters (wind
speed, relative humidity and air temperature)
Table 5. The correlations between heat stress indices (WBGT, ESI, Humidex, HSI, and SWreq) and environmental parameters (wind speed, relative
humidity, and air temperature)
Environmental parameters ESI WBGT Humidex SWreq HIS
Wind Speed
Pearson Correlation (r) .45 .45 .38 .43 .42
P .001 .001 .001 .001 .001
Slope 1.89 1.68 2.20 14.18 3.69
Relative humidity
Pearson Correlation (r) -.76 -.69 -.70 -.63 -.62
P .001 .001 .001 .001 .001
Slope -0.29 -0.23 -0.36 -1.86 -0.49
Air Temperature
Pearson Correlation (r) .99 .99 .97 .86 .85
P .001 .001 .001 .001 .001
Slope .74 .65 .98 4.98 1.33
Thermal stress and thermal idices Zare, et al
346
Figure 2. The correlations and regression lines indicating the relationship
A
E
D C
B
Journal of Kerman University of Medical Sciences 2018, Vol. 25, Issue 4
347
The correlations among WBGT, ESI, Humidex, HSI, and
SWreq
Table 6. The correlations among WBGT, ESI, Humidex, HSI, and SWreq
Indices ESI WBGT Humidex SWreq HSI
ESI
Pearson Correlation (R) 1 .99 .96 .86 .86
P .001 .001 .001 .001
Slope .88 1.3 6.66 1.79
WBGT
Pearson Correlation (R) .99 1 .97 .84 .84
P .001 .001 .001 .001
Slope 1.11 1.45 7.33 1.97
Humidex
Pearson Correlation (R) .96 .97 1 .88 .87
P .001 .001 .001 .001
Slope .71 .63 5.02 1.35
SWreq
Pearson Correlation (R) .86 .84 .88 1 .99
P .001 .001 .001 .001
Slope .11 0.09 0.15 0.27
HSI
Pearson Correlation (R) .86 .84 .87 .99 1
P .001 .001 .001 .001
Slope .41 .35 .57 3.67

Thermal stress and thermal idices Zare, et al
348
Figure 3. The correlations and regression lines indicating the relationship (A) WBGT and ESI; (B) ESI and Humidex; (C) WBGT and Humidex (D)
HSI and SWreq.
A
D C
B

Journal of Kerman University of Medical Sciences 2018, Vol. 25, Issue 4
349
-60/00
-50/00
-40/00
-30/00
-20/00
-10/00
0/00
10/00
20/00
30/00
40/00
50/00
J A N F E B M A R A P R M A Y J U N J U L A U G S E P O C T N O V D E C
MEA
N
THE 12 MONTHS OF THE YEAR
WBGT ESI Humidex HSI SWreq Air tempreture
Comparing 24-hour mean values of heat indices (WBGT,
ESI, Humidex, HSI, and SWreq)
Figure 4. Comparison of 24-hour mean values of WBGT, ESI, Humidex, HSI, and SWreq, and air temperature during various months of 2016
Table 7. Comparing thermal stress based on WBGT, HSI, and Humidex
24-hour mean of Indices JAN FEB MAR APR MAY JUN JUL AUG SEP OCT NOV DEC Annual
24-hour
mean
WBGT -0.53 4.24 1.33 9.72 9.54 18.69 13.50 11.33 9.29 7.71 6.77 -3.18 7.37
Humidex -1.66 2.56 -0.03 12.06 12.02 26.71 18.23 14.89 11.74 9.08 4.06 -5.52 8.68
HSI -3.61 6.54 2.55 3.22 5.99 13.79 10.01 3.12 -4.56 7.59 -1.37 -13.32 2.50
Discussion

Thermal stress and thermal idices Zare, et al
350

Journal of Kerman University of Medical Sciences 2018, Vol. 25, Issue 4
351
Ethical considerations
Acknowledgements
Conflicts of interest

Thermal stress and thermal idices Zare, et al
352
References
Journal of Kerman University of Medical Sciences 2018, Vol. 25, Issue 4
353

Thermal stress and thermal idices Zare, et al
354


![(WBGT: Welt-bulb Global Tempreture: CO (WBGTffi) I VB (RJIIE (WBGTffi) rGOOD PARK! 2019] - ((Ë)955Y) : 10Ê27a (E) : [KURADASHl.jp] foodloss.peatix](https://img.pdfslide.us/doc/110x75/5eb5d8dd16c37935a563db25/wbgt-welt-bulb-global-tempreture-co-wbgtffi-i-vb-rjiie-wbgtffi-rgood-park.jpg)