Embed Size (px)
Citation preview
Environment Quality Assessment
During Sinhastha Kumbhamela
2003 – 2004
“ MASS BATHING ”
At Trimbakeshwar & Nashik
( Maharashtra )
- Regional Office -
Maharashtra Pollution Control Board, Nashik
July – Sept, 2003.
Environmental Quality Assessment
During Sinhastha Kumbhamela 2003-2004
“MASS BATHING”
At Trimbakeshwar & Nashik ( Maharashtra )
During Shahi Snan ( Parvani)
1. Ambient Air Quality Monitoring. 2. River Water Quality Monitoring.
- Regional Office -
Maharashtra Pollution Control Board, Nashik 1st floor, Near ITI, Satpur, Nashik-7.
- Head Office -
Maharashtra Pollution Control Board, Mumbai. Kalpataru Point, 3rd floor,
Sion-Matunga Scheme Road No.8, Opp. Sion Circle, Sion (E),
Mumbai-400022.

Contribution : 1. Project Spirit, Concept & Development:
Shri. Hemant Takle, Board Member, Nashik.
2. Project Advisory:
Shri. A.M.Deshpande, Air Pollution Abatement Engineer, MPC Board, Mumbai. Dr. Supate, Principal Scientific Officer, MPC Board, Mumbai. Planning, Co-Ordination & Project Preparation: Shri. P.P.Nandusekar, Regional Officer, MPC Board, Nashik.
3. Field Monitoring:
Supervision, Control & Planning:Shri. J.H.Patil, Sub-Regional Officer, MPC Board, Nashik. Water Quality Monitoring :Shri. A.J.Kude, Field Officer. Shri. A.M.Kare, Field Officer. Shri. A.D.Chavan, Field Officer. Shri. R.U.Patil, Field Officer. Shri. Shinde, Field Officer, Shri. Mane, Field Officer. Shri. Gandhe, Field Officer. Shri. Ruikar, Field Assistant. Shri. Yeola, Field Assistant.
Shri. Nisal, Field Assistant Shri. Kshirsagar, Field Assistant Shri. Kadve, Field Assistant Shri. Avsarkar, Tracer. Shri. Sonar, Peon.
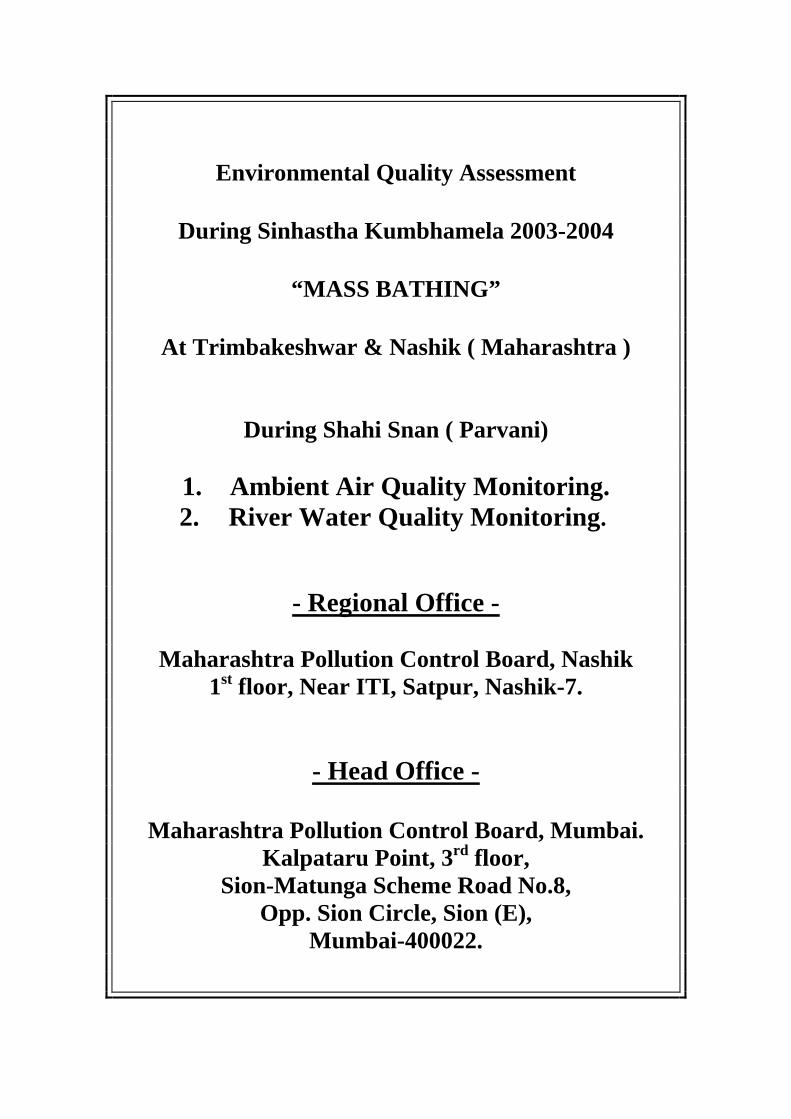
Shri. Wani, Peon. 5. Ambient Air Quality Monitoring:
Shri. Bande, Junior Scientific Officer. Shri. Thakur, Junior Scientific Officer. Shri. Badguzar, Junior Scientific Officer. 6. Laboratory Analysis of the Sampling :
A) Supervisory Work of the Analysis: Mrs. Jayant, Senior Scientific Officer. Shri. Narendra, Scientific Officer.
B) Analytical Work:
Shri. Khadkikar, Junior Scientific Officer. Mrs. Wagh, Junior Scientific Officer. 7. Report Editing :
Shri.P.P.Nandusekar, Regional Officer,MPC Board,Nashik.
8. Account Record Keeping:
Mrs. Gokhle, Sr.Clerk, MPC Board, Nashik. Mrs. Pangare, Sr. Clerk, MPC Board, Nashik.
9. Manuscript typing & Computer Typing :
Shri. K.N.Patil, Jr. Steno. Miss. Sujata B. Deshmukh.
Agencies Involved in the Environmental Awareness, Publicity & Co-Ordination Work : 1) Co-Ordinator.:
M/s. Siddhata Invent Management- Shri. Vinayak Ranade. 2) Concept Development : 3) Preparation of Advertisement for Local Channels.: 4) Display of Hoarding Agency: 5) Photography & Video Shooting: 6) Preparation of Cloth Banners:
Introduction: Rivers in India have been regarded from time immemorial as
sacred water bodies. It is believed that a holy dip in the same
purges away all sins. Hence, millions of people in India take holy
dips in rivers, especially on some auspicious occasions. Kumbh &
Ardh Kumbh Melas are among many such millions of people take
holy dips in the river. Generally, it is restricted to limited stretches
of rivers as they are considered to be more sacred.
Kumbh (kumbh means pot) Mela is a sacred Hindu
Pilgrimage that takes place at the following four locations of India.
1. Prayag (near the city of Allahabad, in the state of Uttar
Pradesh) at the confluence of three rivers Ganga (Ganges),
Yamuna & Saraswati.
2. Haridwar (in the state of Uttar Pradesh) where the river
Ganga enters the plains from Himalayas.
3. Ujjain (in Madhya Pradesh), on the banks of Kipra River, &
4. Nashik & Trimbakeshwar (in Maharashtra) on the banks of
Godavari River.]
The observance of Kumbha Mela is based upon the following
story:
Thousands of years ago, perhaps in the Vedic period, gods &
demons made a temporary agreement to work together in
obtaining amrita (the nectar of immortality) from the Milky Ocean,
& to share this equally. However, when the Kumbha (pot)
containing the amrita appeared, the demons ran away with the pot
& where chased by the gods. For twelve human years the gods &
demos fought in the sky for the possession of this pot of amrita fell
on the four places: Prayag, Haridwar, Ujjain & Nashik. Thus,
Kumbhamela is observed at these four locations where the nectar
fell.
Kumbha Mela is attended by millions of people on a single
day. A ritual bath at a predetermined time & place is the major
event of this festival. Other activities include religious discussions,
devotional singing, maits water irrespective of its water quality
suitability. The mass feeding of holy men/women & the poor &
religious assemblies where doctrines are debated & standardized.
Kumbha Mela (especially the Maha Kumbha Mela) is the most
sacred of all the Hindu pilgrimages. Thousands of holy
men/women (monks, saints, sadhus) grace the occasion by their
presence. The suspiciousness of Kumbha Mela is in part attributed
to the gathering of thousands of holy men/women at one place on
earth.
According to astrologers, the “Kumbha Fair” takes place
when the planet Jupiter enters Aquarius & the Sun enters Aries.
Bathing activity is one of the important in situ utilization of
water bodies, which demands water quality requirement alien to
the water quality required for drinking purposes. During bathing,
people not only take dip in the water body but also drink its water
irrespective of its water quality suitability. The Water (Prevention &
Control of Pollution) Act, 1974 is basically aimed to support the
quality of various designated-best-use of water bodies such as:
A) Drinking water source without conventional treatment but
after dis-infection;
B) Out door bathing organized;
C) Drinking water source with conventional treatment followed
by dis-infection;
D) Propagation wild life, fisheries &
E) Irrigation, industrial cooling, controlled waste disposal.
These beneficial uses of water bodies have been identified in
terms of primary water quality criteria using few physico-chemical
parameters. With the growing demand of fresh waters, associated
with fast depleting water resources, the de-sighed stretched of
water body have been subjected to multiple beneficial uses, Such
multiple uses of water body has resulted in deterioration of water
quality in most of the water bodies & thus rendering objectionable
for organized use. The intensification on pollution control activities
along with promotion of cleaner technologies over the years, had
led to formulation of Action Plans to arrest degradation of Water
quality from point sources of pollution, such as industrial &
domestic water waste. However, the non-point or diffused sources
of pollution to water bodies still remain a matter of serious concern
in order to restoration of water quality.
Now in the year 2003-2004 as Kumbha Mela it is being held
at Trimbakeshwar & Nashik in Maharashtra there will be very few
floating population more than 50 lacks during the each Shahi
Snan. During the Shahi Snan by taking a Bathing Activity there will
be definitely Pollution of Godavari at Nashik & Trimbak & there will
be generation of Solid Waste, Plastic, Paper as well as Bio-
Medical Waste also. In addition of the above there will be
Vehicular Pollution, noise pollution, odour/smell pollution for which
it is felt that other than Water & Air Quality Monitoring there should
be Environmental Awareness Programmes. Education tot he
students as well as citizens, discussions & publicity through the
news papers, Local Channels, TV & Akashwani by way of various
activities.
Problems:
1. Many religious places are under severe stress of
environmental insanitiation & there is urgent need for there
are up-gradation.
2. Heaps of rotting garbage invaded by pigs & other straw
animals, uncleaned & choked sewage drains overflowing on
roads led cess polls along the roads & public places, all
these lead to unhygienic living conditions at many religious in
the country.
3. Due to inadequate infrastructure & manpower the local
authorities are not able to cope with the maintenance of
sanitation at religious places especially during mass
gatherings.
4. The pilgrims/tourists are also equally responsible for creating
in sanitary conditions at religious places. There is no
discipline in garbage disposal, it is thrown anywhere & every
where. There is no effective regulation to bring discipline
among public/pilgrims/ tourists. Penal provisions are so any
defaulter can easily afford & they violate the regulations
weak that.
5. Solid waste management is in important facet of
environmental hygiene & needs to be integrated with total
environmental planning. Many diseases are spread through
flies, which mainly breed on solid wastes. A common
transmission route of bacillary dysentery amoebic dysentery
& diarrhoea is from fecal matter to food by flies.
Mismanagement of garbage was mainly responsible for the
famous epidemic of Surat in 1994.
6. Lack of Co-Ordination among various agencies responsible
for public services is also one of the major cause for
insanitation.
7. The drains inn general are not cleaned regularly & even if
they are cleaned, the sludge is not removed. Hence, the
sludge again find its way into the drains. The sweepers many
times throw the solid waste collected after sweeping the
streets into the drains, causing them to be choked.
8. Due to inadequate all ill maintained toilets, open defecation
& urination all along the drains, wall sides, open grounds,
parks & other such public places, are quite common in most
of the religious places.
9. Proper drainage is lacking for many urinals provided at
religious places, as a result the urine spread all over the area
causing severe nuisance of bad odor, ugly look & promote
breeding of several disease vectors.
10. Most of the places the garbage collection points are open
dump without boundary & protection. As such, they are
subject to invasion like pigs, cows & goats which spread this
dirty rotting material around & create unhygienic conditions.
11. The investigations have established beyond doubt that Fecal
Coliform MPN count increase 12 to 200 times compare to
background value consequent upon mass bathing even in
swiftly flowing river stretches. Even in estuarine system at
Ganga Sagar Coliform count increased 10 to 30 times due to
mass bathing.
12. The organic matter contribution during mass bathing was
quite significant as revealed study at Nashik-Trimbakeshwar.
Apart from body washing the pilgrims were offering milk, curd
sweets, ghee, flowers & other materials into water to worship
the river. The increase the organic matter contribution per
capita during auspicious days as compared to normal days.
13. A wide variety of pathogenic organisms are potentially
transmissible to man through bathing, such as typhoid,
paratyphoid, cholera, bacterial dysentery, various skin
infecting pathogens.
14. The main problem observed in religious places are due to
encroachments inadequate infrastructure (Water supply &
Sanitary facilities) & in sanitary conditions. At many places
the conditions are so critical that there is an urgent need to
adopt measures to remedy the situation to avoid the
outbreaks of diseases.
Objectives Of The Study :
The present study was undertaking with the following objectives:
1. To asses the changes in water quality between the pre &
post bathing period as well as on the day Shahi Snan
(Parvani) specifically from July,2003 to Sept,2003 at
Trimbakeshwar & Nashik.
2. To asses the existing raw material in Kushawarta Kund &
Ahilya Godavari River Sangam back side of Trimbakeshwar
Jotirlinga Temple at Trimbakeshwar as well as Victoria
Bridge, Ramkund, Tapowan for their suitability for Physico-
Chemical, Biological, Bacteriological, heavy metallic &
pesticides contamination.
3. To evolve remedial measures to prevent environmental
hazards due to mass bathing & alternatives for maintaining
bathing water quality at above places.
4. To suggest measures to restore the aquatic life & to evolve a
rationale for bathing water quality criteria.
5. To monitor the Air Quality at above places due to the
gathering of in large quantity of human population & related
activities.
WATER QUALITY ASSESSMENT & COMMENT:
I) Physical chemical & Bacteriological Parameters :
First Shahi Snan At Kushawarta (Trimbakeshwar): 11/8/03, 12/8/03 &13/8/03.
During the first Shai Snan i.e. on 12/8/03 as well as one day
prior to Shahi Snan i.e. On 11/8/03 & let then i.e. immediately after
the Shahi Snan (13/8/03) at Kushawarta though this water is used
for only bathing purpose & not for the drinking purpose the quality
of the water is compare with the A-1 class of water as the stretch
of the Godavari river from origin up to the Gangapur dam is
notified as a A-1 class of water. The comparison is done for
selected parameters such as pH, DO, BOD, SS, Detergent,
Ammonia & Bacteriological Count MPN/100 ml.
pH: The pH is observed well within the limit on all the 3
days i.e. 11/8/03, 12/8/03, 13/8/03. DO is also reported
unsatisfactorily most of the time but it is observed on lower side i.e.
3.5 mg/l on 13/8/03. This shows the DO is deteriorated on 13/8/03
when compare to 11/8/03 & 12/8/03. Whereas BOD is observed
that Exceed all three days i.e. 11/8/03, 12/8/03, 13/8/03. The
quality of DO is observed deteriorated on 12/8/03 (Higher value of
BOD) & the quality of BOD is still deteriorated on 13/8/03 &
maximum BOD id reported 32.mg/l. at 22 hrs. on 13/8/03.
SS: The quality of Water is also observed deteriorated in
respect of SS on all three days but the quality is more deteriorated
on 13/8/03 whereas highest value is reported 31mg/l.
Detergent: The values of Detergent are observed on lower side on
11/8/03 whereas on 12/8/03 & 13/8/03 the values of detergent are
observed on very higher side. The highest value is observed 15.86
mg/l on 13/8/03. When it is compared with the bacteriological
quality it is observed that on all three days MPN/100 ml is
observed all the time exceeding except one value i.e. 95 on
12/8/03 at 12.oo & 130. On 12/8/03 at 20.00 hrs. the highest value
is observed 1800 on 11/8/03 as well as 13/8/03.
Ammonia: The values of Ammonia is reported Nil on 11/8/03
whereas on 12/8/03 the value is reported exceeding at 8.00 clock
(1.621) & at 16.00. hrs. (2.28) Whereas on 13/8/03 the quality of
Ammonia is observed within the limit.
The quality is compared with the following std. Limits.
1. pH in the range of 6.5 to 8.5 .
2. Do should not be less than 5 mg/l.
3. BOD should not exceed 2 mg/l.
4. Detergent should not exceed 1 mg/l.
5. MPN/100 – 250.
6. Ammonia – 1.5 mg
7. SS : Not to exceed 25 mg/l.
Second Shahi Snan At Kushawarta (Trimbakeshwar): (26/8/03, 27/8/03, 28/8/03)
pH : It is observed that there is no deterioration in the
quality with reference to the pH parameter. All the time they are
found within the limit. The minimum pH is observed 6.46 (20.00
Hrs.) on 27/8/03 whereas highest pH is observed 7.83 at (8.00
hrs.) On 26/8/03
DO : It is observed that DO is on lower side i.e. less than 5
mg/l i.e. 4.2 (12 hrs) & 1 (20.00 hrs.) on 27/8/03 & also 4.9 (16
hrs.) & 3 (20 hrs) on 28/8/03 this shows that there is deterioration
of quality of water with reference to DO at particular times on day
of Shahi Snan as well as on the next day of Shahi Snan (27/8/03)
after the Shahi Snan (28/8/03)
BOD: It is observed that BOD is shown always exceeding on
all the three days than the prescribed limit i.e. 2mg/l. the highest
BOD is shown 86 mg/l (20 hrs.) on 27/8/03 i.e. the end of the
Shahi Snan sampling time where as it is also observed that there
is deterioration of water quality with ref. DO To 28/8/03. The
highest value shown on 28/8/03 18 mg/l (20 hrs)
SS: It is observe that SS are higher on all three days but it
is observed that more higher values are observed on day of Shahi
Snan i.e. 55 mg/l (20 hrs) compare to the prior to the Shahi Snan &
after the Shahi Snan.
Ammonia: It is observed that the Ammonia value are also
observed always exceeding on 26/8/03, & 27/8/03 the highest
value is reported on day of Shahi Snan 9.798 (20 hrs) where as
lowest value is reported is 0.835 mg/l (16 hrs) on 28/8/03.
Detergent: It is observed that the quality of the water most of
the time within the limit with ref, to DO on all three days whereas
highest value is shown 0.908 mg./l (8 hrs.) on 28/8/03 whereas
lowest value is shown 0.137 mg/l at 16.hrs on 26/8/03.
Bacteriological Quality
MPN/100ml: It is observed on all the day of monitoring the
Bacteriological Quality with ref. To MPN/100 ml is found
deteriorated the lowest value is reported 425 (8hrs) on 26/8/03
where as highest value is reported 1800 (12 hrs) on 27/8/03.
Third Shahi Snan at Kushawarta (Trimbakeshwar): 6/9/03, 7/9/03, 8/9/03.
pH : The pH value is observed all the times within the limit
on all the 3 days of sampling period the lowest pH is reported 7.24
mg/l (16 hrs.) on date of Shahi Snan i./e 7/9/03. Whereas highest
pH is reported 8.67 916 hrs) on the next day of Shahi Snan i.e. on
8/9/03.
DO: It is observed that the quality of water is deteriorated in
respect of DO & the lowest value is reported 1.6 mg/l (16 hrs) on
day of Shahi Snan. It is still further observed that the Do through
out the day on day of Shahi Snan was on lower side & hence
quality was not satisfactory. Whereas one day prior to Shahi Snan
6/9/03 Do is reported satisfactory & all the values are shown more
than 6.2 mg/l it is also observed that on the next day of Shahi
Snan 8/9/02 Do has improved compare to on day of Shahi Snan
but it was lower than the prescribed limit in the order of 4.1 to 4.3
mg/l 7& hence it is not satisfactory.
BOD: In respect of BOD it is observed that the BOD is reported on
the very higher side on the day of Shahi Snan
( 7/9/03) highest value is reported 40 mg/l (16 hrs) whereas all
other values are showing BOD exceeding always more than the
limiting BOD 2mg/l. it is also observed that BOD prior to one day
Shahi Snan is observed on slightly higher side i.e. range of 6 to 7
mg/l but whereas on the next day of Shahi Snan 8/9/03 the BOD
value is reported on higher side compare to the one day of Shahi
Snan.
SS: In respect of SS it is observed that the quality on 6/9/03
was not satisfactory & very much on higher side in the range of
216 to 276 mg/l. whereas on the date of sampling the values are
reported in the range of 31 to 42 mg./l which is observed slightly
on higher side. Similar observations are also observed next day of
Shahi Snan i.e. on 8/9/03.
AMMONIA: In respect of Ammonia the concentrations are
observed within the limit on one day advance of the Shahi Snan
whereas on the date of Shahi Snan the Ammonia is observed on
higher side of 3 occasions i.e. 1.7 mg/l (12 hrs), 4. 09 (16 hrs) &
3.25 (20 hrs 0 on 7/9/03. Whereas the ammonia is observed ion
the next day of Shahi Snan i.e. on 8/9/03 within the limit.
Detergent: In respect of detergent it is observed on date of
Shahi Snan detergent values are reported ion higher side at 12
hrs, 16, 20 hrs. Whereas on the next day of Shahi Snan i.e. on
8/9/03 the detergent s are reported on very higher side than the
date of the Shahi Snan. & The all the values on 8/9/03 are
reported in the range of 11 to 13.8 mg./l.
Bacteriological Quality
MPN/100ml: It is observed that the quality in respect of
Bacteriological Parameters on date of Shahi Snan i.e. on 7/9/03
was on higher side on all occasions compare to the one day prior
to Shahi Snan (6/9/03) & one day after the Shahi Snan 8/9/03 the
lowest value is reported 350 (8 hrs0 on 6/9/03 & 8/9/03. Whereas
the highest is reported 900 (16 hrs) on all three days.
WATER QUALITY ASSESSMENT & COMMENT:
I) Physical chemical & Bacteriological parameters : First Shahi Snan At Ahilya-Godavari Sangam (Trimbakeshwar): 11/8/03,12/8/03 &13/8/03.
pH: The pH parameter is observed on all occasions of the
1st Shahi Snan monitoring programme from 11 Aug, to 13 Aug.
lowest pH is observed 7.15 920 hrs) on day of Shahi Snan
12/8/03. Whereas highest pH is observed 8.6 (12 hrs) on 11/8/03
the one day prior to Shahi Snan.
DO: The Do is reported lower value than the prescribed
value on 11/8/03 & it is observed in the range of 4 to 4.7 mg/l on
11/8/03 i.e. on each day advance of the date of Shahi Snan.
Whereas Do is observed satisfactory on the date of Shahi Snan
i.e. on12/8/03 & 13/8/03 this may be because of continuous flow of
water with a high turbulence & It is at confluence of the both the
rivers Ahilya –Godavari as compare to the stagnant water of
Kushawarta.
BOD: BOD is reported on very higher side on 11/8/03 as well
as 12/8/03 compare to the values reported on13/8/03. The BOD is
in the range of 3.5 to 10 mg/l on the date 13/8/03 whereas BOD is
reported in the range of 13 to 24 mg/l on 12/8/03 whereas BOD is
still reported in the range of 26 to 39 mg/l on 11/8/03.
SS: It is observed that SS are near to satisfactory on date
of Shahi Snan 12/8/03 as well as 13/8/03 compare to the values of
11/8/03 the lowest value is reported 22 mg/l (12 hrs0 on 12/8/03 &
highest value is reported 41 on 11/8/03 (8 hrs).
Ammonia: Ammonia is reported almost nil on date of Shahi Snan
i.e. on 12/8/03 as well as on the next day of Shahi Snan. Whereas
ammonia is reported slightly at higher side on 11/8/03 on the prior
to on each day of Shahi Snan.
Detergent: The concentration of Detergent is observed on very
higher side 10.92 (8 .00 Hrs.) on day of Shahi Snan whereas
rest of the day it is observed nearly satisfactory. Similar
satisfactory observations are noted on next day of Shahi Snan i.e.
on 13/8/03.
Bacteriological Quality
MPN/100ml: It is observed that only on 1 occasion bacteriological
Parameters are observed within the limit i.e. 70 (12 hrs) on day of
Shahi Snan 12/8/03 whereas all the times the values are reported
on higher side. The highest value is reported 1800 on 8 hrs. on all
the 3 days.
Second ShahiSnan At Ahilya--Godavari Sangam (Trimbakeshwar): 26/8/03, 27/8/03, 28/8/03:
pH: It is observed that there is no deterioration in the
quality with reference to the pH parameter. All the time they are
found within the limit. The minimum pH is observed 6.97 (20.00
Hrs.) on 27/8/03 whereas highest pH is observed 7.27 at (8.00
hrs.) On 26/8/03.
DO: It is observed that DO is on lower side i.e. less than 5
mg/l i.e. 4.7 (12 hrs) on 26/8/03 & 4.6 (20.00 hrs.) on 27/8/03. The
Highest DO is reported on date 26/8/03 is 5.5 mg/l at (20.00 hrs.)
BOD: It is observed that BOD is shown always exceeding on
all the three days than the prescribed limit i.e. 2mg/l. the highest
BOD is shown 17 mg/l (20 hrs.) on 27/8/03 & also 17 mg/l on
28/8/03 (8.00 hrs) i.e. the end of the Shahi Snan sampling time.
SS: It is observed that SS are higher on all three days but it
is observed that more higher values are observed on day of Shahi
Snan i.e. 48mg/l (16 hrs) .As compare to the Date of Shahi Snan
the SS is reported on very higher side before the day of Shahi
Snan i.e. 26/8/03 at 20.00 hrs is 56 mg/l. & after Shahi Snan i.e.
28/8/03 at 8.00 hrs is 41 mg/l.
Ammonia: It is observed that the Ammonia value are also
observed always exceeding on 26/8/03, & 27/8/03 the highest
value is reported on day of Shahi Snan 2.045 (16 hrs) where as
lowest value is reported is 0.702 mg/l (12 hrs) on 28/8/03.
Detergent: It is observed that the quality of the water most of
the time within the limit with ref, to DO on all three days whereas
highest value is shown 0.759 mg./l (12.00 hrs.) on 27/8/03
whereas lowest value is shown 0.243 mg/l at 16.hrs on 28/8/03.
Bacteriological Quality
MPN/100ml: It is observed on all the day of monitoring the
bacteriological Quality with ref. To MPN/100 ml is found
deteriorated the lowest value is reported 550 (12hrs) on 26/8/03
where as highest value is reported 1600 on all the three days of
monitoring at 8.00 hrs. & At 16 hrs on 27/8/03 & 28/8/03.
Third Shahi Snan at Ahilya-Godavari Sangam (Trimbakeshwar): 6/9/03,7/9/03, 8/9/03.
pH : The pH value is observed all the times within the limit
on all the 3 days of sampling period. The lowest pH is reported
7.36 mg/l (12 hrs.) on date of Shahi Snan i./e 7/9/03. Whereas
highest pH is reported 7.37(8.00 hrs) on the next day of Shahi
Snan i.e. on 8/9/03.
DO: It is observed that the quality of water is deteriorated in
respect of DO & the lowest value is reported 4 mg/l (12 hrs) on day
of Shahi Snan. It is still further observed that the Do through out
the day on day of Shahi Snan was on lower side & hence quality
was not satisfactory. Whereas one day prior to Shahi Snan 6/9/03
Do is reported satisfactory & all the values are shown more than
6.2 mg/l.
BOD: In respect of BOD it is observed that the BOD is
reported on the very higher side on the day of Shahi Snan (7/9/03)
highest value is reported 16 mg/l (12 hrs). It is also observed that
BOD prior to one day Shahi Snan is observed on slightly higher
side i.e. range of 6 to 8.5 mg/l but whereas on the next day of
Shahi Snan 8/9/03 the BOD value is reported on lower side
compare to the one day of Shahi Snan.
SS: On 6/9/03 & 7/9/03 the values of SS are reported in the
range of 31 to 42 mg./l which is observed slightly on higher side.
Similar observations are also observed next day of Shahi Snan i.e.
on 8/9/03.
Ammonia: In respect of Ammonia the concentrations are
observed within the limit on one day advance of the Shahi Snan
whereas on the date of Shahi Snan the Ammonia is observed on
higher side of 3 occasions i.e. 1.497 mg/l (8 hrs), 1.147 (12 hrs) on
7/9/03. Whereas the ammonia is observed on the next day of
Shahi Snan i.e. on 8/9/03 within the limit.
Detergent: In respect of detergent it is observed on date of
Shahi Snan detergent values are reported within limit. Whereas on
the next day of Shahi Snan i.e. on 8/9/03 the detergent s are
reported on very higher side than the date of the Shahi Snan. &
The all the values on 8/9/03 are reported in the range of 1.399mg./l
to 1.598 mg/l.
Bacteriological Quality MPN/100ml: It is observed that the quality in respect of
bacteriological Parameters on date of Shahi Snan i.e. on 7/9/03
was on higher side on all occasions compare to the one day prior
to Shahi Snan (6/9/03) & one day after the Shahi Snan 8/9/03 the
lowest value is reported 550 (12.00 hrs). On 6/9/03 & 8/9/03 the
highest is reported 900 at 8.00 hrs & 16 hrs.
WATER QUALITY ASSESSMENT & COMMENT:
I) Physical chemical & Bacteriological parameters: First Shahi Snan At Victoria Bridge (Nashik) : 16/8/03, 17/8/03 &18/8/03. pH: The pH parameter is observed on all occasions of the
1st Shahi Snan monitoring programme from 16 Aug, to 18 Aug.
lowest pH is observed 7.87 (8.00 hrs) on day of Shahi Snan
17/8/03. Whereas highest pH is observed 8.35 (8.00 hrs) on
16/8/03 the one day prior to Shahi Snan.
DO: The DO is reported satisfactory on all the three day
occasion in the range of 5 to 6.8 mg/l. Whereas Do is observed
satisfactory on the date of Shahi Snan i.e. on17/8/03 & 18/8/03
BOD: BOD is reported on very higher side on 16/8/03 as well as
17/8/03 compare to the values reported on18/8/03. The BOD is in
the range of 5 to 9 mg/l on the date 18/8/03 whereas BOD is
reported in the range of 5 to 6.4 mg/l on 17/8/03 whereas BOD is
still reported in the range of 8 to 10 mg/l on 16/8/03.
SS: SS is reported unsatisfactory on all the three days of
monitoring. The highest value of SS on date of Shahi Snan is
reported 39 mg/l at 8.00 & 20.00 hrs. & it is observed that SS was
on higher side i.e. in the range of 44 to 51 mg/l on 18/8/03.
Ammonia: Ammonia is reported almost Nil on date of Shahi Snan
i.e. on 17/8/03 as well as on the next day of Shahi Snan.
Detergent: The concentration of Detergent is observed satisfactory
on all the days of Shahi Snan.
Bacteriological Quality
MPN/100ml: It is observed that only on all the three days occasion
bacteriological Parameters are observed exceeding limit, whereas
all the times the values are reported on higher side. The highest
value is reported 1800 on 16/8/03 at 8.00 hrs. &1600 on 17/8/03 &
18/8/03 at 8.00 hrs.
Second Shahi Snan At Victoria Bridge (Nashik) : 26/8/03, 27/8/03, 28/8/03
pH: It is observed that there is no deterioration in the
quality with reference to the pH parameter. All the time they are
found within the limit. The minimum pH is observed 7.8 mg/l (16.00
Hrs.) on 27/8/03 whereas highest pH is observed 7.85 at (20.00
hrs.) On one day prior to Shahi Snan the highest pH is observed
8.01mg/l at (20.00 hrs.) & minimum pH is observed is 7.62 (8.00
hrs.) i.e. on 26/8/03.
DO: It is observed that DO is reported within the limit on all
the three days of occasion. On date of Shahi Snan the maximum
DO is observed 6.8 mg/l at 12.00 hrs & 16.00 hrs. & minimum DO
is observed 6.5 mg/l at 8.00 hrs & 20.00 hrs.
BOD: It is observed that BOD is shown always exceeding on all
the three days than the prescribed limit i.e. 2mg/l. the highest BOD
is shown 5.5 mg/l (8.00 hrs.) on 27/8/03 & also 6 mg/l on 28/8/03
(12.00 hrs)
SS: It is observed that SS are higher on all three days. It is
observed that more higher values are observed on day of Shahi
Snan i.e. 42mg/l (16 hrs) .As compare to the Date of Shahi Snan
the SS is reported on very higher side before the day of Shahi
Snan i.e. 26/8/03 at 20.00 hrs is 46 mg/l. & after Shahi Snan i.e.
28/8/03 at 16.00 hrs is 44 mg/l.
Ammonia: It is observed that the Ammonia values are
almost nil on 26/8/03, & 27/8/03 & 28/8/03. Ammonia is reported
within the limit on all the three days occasion.
Detergent: It is observed that all the values of Detergent are
within the limit on all the three days of occasion. The lowest
Detergent is reported on date of Shahi Snan i.e. 27/8/03 is 0.261
at 12.00 hrs.
Bacteriological Quality
MPN/100ml: It is observed on all the day of monitoring the
bacteriological Quality with ref to MPN/100 ml is found deteriorated
the lowest value is reported 425 (12.00 hrs) on 26/8/03 where as
highest value is reported 1600 on the day of Shahi Snan at 8.00
hrs. & At 16 hrs on 26/8/03 & 27/8/03.
Third Shahi Snan at Victoria Bridge ( Nashik) : 31/8/03, 1/9/03, 2/9/03.
pH : The pH value is observed all the times in the range of
7.93 to 8.08 mg/l on the first two days of sampling period. The
lowest pH is reported 7.94 mg/l (16 hrs.) on date of Shahi Snan i./e
1/9/03, whereas highest pH is reported 8.08 (8.00 hrs) & on one
day prior to Shahi Snan i.e. on 31/8/03 the highest ph is observed
8.5 mg/l at 16.00 hrs.
DO: It is observed that in respect of DO & the lowest value
is reported 7 mg/l (8 hrs) on day of Shahi Snan. Whereas one day
prior to Shahi Snan 31/8/03 DO is reported satisfactory & all the
values are shown more than 6.4 mg/l.
BOD: In respect of BOD it is observed that the BOD is reported on
the very higher side on the day of Shahi Snan (1/9/03) highest
value is reported 7 mg/l (12 hrs). It is also observed that BOD prior
to one day Shahi Snan is observed in the range of 4.5 to 7 mg/l
but whereas on the next day of Shahi Snan 2/9/03 the BOD
value is reported in the range of 5 to
7.5 mg/l.
SS: On 31/8/03 & 1/9/03 the values of SS are reported in
the range of 40 to 49 mg./l which is observed on higher side.
Similar observations are also observed next day of Shahi Snan i.e.
on 2/9/03.
Ammonia: In respect of Ammonia the concentrations are
observed within the limit. Whereas the ammonia is observed on
the next day of Shahi Snan i.e. on 2/9/03 within the limit.
Detergent: In respect of detergent it is observed on date of
Shahi Snan detergent values are reported within limit. Whereas on
one day prior to Shahi Snan i.e. on 31/8/03 the value is reported
1.001 at 20.00 hrs.& on all other days the detergent is reported
within the limit.
Bacteriological Quality
MPN/100ml: It is observed that the quality in respect of
bacteriological Parameters on date of Shahi Snan i.e. on 2/9/03
was on higher side on all occasions compare to the one day prior
to Shahi Snan (31/8/03) & one day after the Shahi Snan 2/9/03 the
lowest value is reported 550 (12.00 hrs). On 31/8/03 & 2/9/03 the
highest is reported 900 at 8.00 hrs & 16 hrs.
WATER QUALITY ASSESSMENT & COMMENT:
I) Physical chemical & Bacteriological parameters : First Shahi Snan At Ramkund (Nashik) : 16/8/03, 17/8/03 &18/8/03. pH: The pH parameter is observed on all occasions of the
1st Shahi Snan monitoring programme from 16 Aug, to 18 Aug.
lowest pH is observed 7.80 (8.00 hrs) on day of Shahi Snan
17/8/03. Whereas highest pH is observed 8.45 (8.00 hrs) on
16/8/03 the one day prior to Shahi Snan.
DO: The DO is reported satisfactory on all the three day
occasion in the range of 5 to 6.8 mg/l. Whereas Do is observed
satisfactory on the date of Shahi Snan i.e. on17/8/03 & 18/8/03
BOD: BOD is reported on very higher side on 16/8/03 as compare
to the values reported on18/8/03. The BOD is in the range of 6.5 to
8 mg/l on the date 18/8/03 whereas BOD is reported in the range
of 5 to 6 mg/l on 17/8/03 whereas BOD is still reported in the range
of 6 to 7.5 mg/l on 16/8/03.
SS: SS is reported unsatisfactory on all the three days of
monitoring. The highest value of SS on date of Shahi Snan is
reported 41 mg/l at 20.00 hrs. & it is observed that SS was on
higher side i.e. in the range of 41 to 48 mg/l on 18/8/03.
Ammonia: Ammonia is reported almost Nil on date of Shahi Snan
i.e. on 17/8/03 as well as on the next day of Shahi Snan.
Detergent: The concentration of Detergent is observed satisfactory
on all the days of Shahi Snan.
Bacteriological Quality
MPN/100ml:It is observed that only on all the three days occasion
bacteriological Parameters are observed exceeding limit, whereas
all the times the values are reported on higher side. The highest
value is reported 1800 on 16/8/03 at 8.00 hrs. & 12.00 hrs. & 1800
on 17/8/03 at 8.00 hrs. & 1600 on 18/8/03 at 8.00 hrs.
Second Shahi Snan At Ramkund (Nashik) : 26/8/03, 27/8/03, 28/8/03:
pH: It is observed that there is no deterioration in the
quality with reference to the pH parameter. All the time they are
found within the limit. The minimum pH is observed 7.25 mg/l (8.00
Hrs.) on 27/8/03 whereas highest pH is observed 7.78 at (20.00
hrs.) On one day prior to Shahi Snan the highest pH is observed
8.02mg/l at (20.00 hrs.) & minimum pH is observed is 7.58 (8.00
hrs.) i.e. on 26/8/03.
DO: It is observed that DO is reported within the limit on all
the three days of occasion. Only on one day prior to the Shahi
Snan i.e. on 26/8/03 the DO is observed 4.5 mg/l at 8.00 hrs. On
date of Shahi Snan the maximum DO is observed 6.8 mg/l at
12.00 hrs & & minimum DO is observed 5.9 mg/l at 8.00 hrs.
BOD: It is observed that BOD is shown always exceeding on all the
three days than the prescribed limit i.e. 2mg/l. The highest BOD is
shown 9.5 mg/l (8.00 hrs.) on 27/8/03 & 8 mg/l on 28/8/03 (20.00
hrs)
SS: It is observed that SS was higher on all three days. It is
observed that more higher value is observed on day of Shahi Snan
i.e. 46mg/l (20.00 hrs) on 27/7/03. As compare to the Date of
Shahi Snan the SS is reported on very higher side before the day
of Shahi Snan i.e. 26/8/03 at 20.00 hrs is 51 mg/l. & after Shahi
Snan i.e. 28/8/03 at 16.00 hrs is 45 mg/l.
Ammonia: It is observed that the Ammonia values are
almost nil on 26/8/03, & 27/8/03 & 28/8/03. Ammonia is reported
within the limit on all the three days occasion.
Detergent: It is observed that all the values of Detergent are
within the limit on all the three days of occasion. The lowest
Detergent is reported on date of Shahi Snan i.e. 27/8/03 is 0.498
at 8.00 hrs.
Bacteriological Quality
MPN/100ml: The highest value is reported 1800 on the day of
Shahi Snan at 16.00 hrs. & At 8.00 hrs on 26/8/03 & 1600 at 12.00
hrs & 16.00 hrs. 28/8/03.
Third Shahi Snan at Ramkund ( Nashik) : 31/8/03, 1/9/03, 2/9/03.
pH : The pH value is observed all the times within the limit
on all the 3 days of sampling period. Whereas the pH is reported
8.06 at 20.00 hrs on one day prior to Shahi Snan.The lowest pH is
reported 7.60 mg/l (12 hrs.) on date of Shahi Snan i.e. 1/9/03.
Whereas highest pH is reported 7.97 at 20.00 hrs on the next day
of Shahi Snan i.e. on 2/9/03.
DO: It is observed that the quality of water is not
deteriorated in respect of DO & the lowest value is reported 5.9
mg/l at 16.00 & 20.00 hrs on day of Shahi Snan. Whereas one day
prior to Shahi Snan 31/8/03 DO is reported satisfactory & all the
values are shown more than 6.1 mg/l.
BOD: In respect of BOD it is observed that the BOD is reported on
the very higher side on the day of Shahi Snan (1/9/03) highest
value is reported 8 mg/l (16 hrs). It is also observed that BOD prior
to one day Shahi Snan is observed on slightly higher side i.e.
range of 5 to 8 mg/l but whereas on the next day of Shahi Snan
2/9/03 the BOD value is reported on lower side compare to the one
day of Shahi Snan.
SS: On 31/8/03 & 1/9/03 the values of SS are reported in
the range of 40 to 49 mg./l which is observed on higher side.
Similar observations are also observed next day of Shahi Snan i.e.
on 2/9/03.
Ammonia: In respect of Ammonia the concentrations are
observed within the limit on all the days of monitoring of the
sample.
Detergent: In respect of detergent it is observed on date of
Shahi Snan detergent values are reported within limit.
Bacteriological Quality
MPN/100ml: It is observed that the quality in respect of
bacteriological Parameters on date of Shahi Snan i.e. on 1/9/03
was on higher side i.e. 1800 at 8.00 hrs. on all occasions compare
to the one day prior to Shahi Snan i.e. 31/8/03 & one day after the
Shahi Snan 2/9/03 the lowest value is reported 900 (16.00 hrs &
20.00 hrs.).
WATER QUALITY ASSESSMENT & COMMENT:
I) Physical chemical & Bacteriological parameters: First Shahi Snan At D/s. of STP, Tapowan (Nashik) : 16/8/03,
17/8/03 &18/8/03. pH: The pH parameter is observed on all occasions of the
1st Shahi Snan monitoring programme from 16 Aug, to 18 Aug.
lowest pH is observed 7.6 (8.00 hrs) on day of Shahi Snan
17/8/03. Whereas highest pH is observed 8.23 (12.00 hrs) on
16/8/03 the one day prior to Shahi Snan.
DO: It is observed that in respect of DO the quality is
deteriorated on one day prior to Shahi Snan i.e. 3.5 mg/l at 16.00
hrs on 16/8/03 & on date of Shahi Snan i.e. 3.7 mg/l at 16.00 hrs.
Whereas it is observed that on next day of Shahi Snan i.e. on
18/8/03 the quality of DO is also deteriorated i.e. 4.9 mg/l at 12.00
hrs.
BOD: BOD is reported on very higher side on 16/8/03 as compare
to the values reported on18/8/03. The BOD is in the range of 6.5 to
12 mg/l on the date 18/8/03 whereas BOD is reported in the range
of 7.5 to 11 mg/l on 17/8/03 whereas BOD is still reported in the
range of 6 to 11 mg/l on 16/8/03.
SS: It is observed that SS was within the limit on one day
prior to Shahi Snan i.e. 21 mg/l at 8.00 & 12.00 hrs. on 16/8/03 is
reported satisfactory. The highest value of SS on date of Shahi
Snan is reported 44 mg/l at 16.00 hrs. & it is observed that SS
was on higher side i.e. in the range of 32 to 47 mg/l on 18/8/03.
Ammonia: Ammonia is reported almost Nil on date of Shahi Snan
i.e. on 17/8/03 as well as on the next day of Shahi Snan.
Detergent: The concentration of Detergent is observed satisfactory
on all the days of Shahi Snan, Whereas, only on the date of Shahi
Snan the vale of Detergent is reported 1.1 mg/l at 16.00 hrs.
Bacteriological Quality MPN/100ml: It is observed that on all the three days occasion
bacteriological Parameters are observed exceeding limit, whereas
all the times the values are reported on higher side. The highest
value is reported 1600 on 16/8/03 at 12.00 hrs. & 1800 on 17/8/03
at 8.00 hrs. & 1600 on 18/8/03 at 8.00 hrs.
Second Shahi Snan At D/s. of STP, Tapowan (Nashik) : 26/8/03, 27/8/03, 28/8/03:
pH: It is observed that there is no deterioration in the
quality with reference to the pH parameter. All the time they are
found within the limit. The minimum pH is observed 7.40 mg/l
(20.00 Hrs.) on 27/8/03 whereas highest pH is observed 7.94 at
(8.00 hrs.) On one day prior to Shahi Snan. The highest pH is
observed 7.52 mg/l at (16.00 hrs.) & minimum pH is observed is
7.48 (12.00 hrs.) i.e. on 28/8/03.
DO: It is observed that DO is reported within the limit on the
last two days of occasion. Only on one day prior to the Shahi Snan
i.e. on 26/8/03 the DO is observed satisfactory. On date of Shahi
Snan & on next day of Shahi Snan the quality of DO id
deteriorated i.e DO was in the range of 3.2 to 4.6 mg/l.
BOD: It is observed that BOD is shown always exceeding on all the
three days than the prescribed limit i.e. 2mg/l. The highest BOD is
shown 19 mg/l (8.00 hrs.) on 27/8/03 & 14 mg/l on 28/8/03 (20.00
hrs)
SS: It is observed that SS was higher on all three days. It is
observed that more higher value is observed on day of Shahi Snan
i.e. 52 mg/l (16.00 hrs) on 27/7/03. As compare to the Date of
Shahi Snan the SS is reported on very higher side before the day
of Shahi Snan i.e. 26/8/03 at 8.00 hrs is 55 mg/l. & after Shahi
Snan i.e. 28/8/03 at 16.00 hrs is 42 mg/l.
Ammonia: It is observed that the Ammonia values are
almost nil on 26/8/03, & 27/8/03 & 28/8/03. Ammonia is reported
within the limit on all the three days occasion.
Detergent: It is observed that all the values of Detergent are
within the limit on the first two days of occasion. The lowest
Detergent is reported on date of Shahi Snan i.e. 27/8/03 is 0.392
at 20.00 hrs. & after the day of Shahi Snan the Detergent is
observed exceeding the limits. The highest Detergent is reported
1.785 mg/l at 8.00 hrs. on 28/8/03.
Bacteriological Quality MPN/100ml: The highest value is reported 1600 on the day of
Shahi Snan at 12.00 hrs. & At 8.00 hrs on 26/8/03 & 1800 at 12.00
hrs. on 28/8/03.
Third Shahi Snan at D/s. of STP, Tapowan ( Nashik): 31/8/03, 1/9/03, 2/9/03.
pH : The pH value is observed all the times within the limit
on all the 3 days of sampling period. The lowest pH is reported
7.53 mg/l (20.00 hrs.) on date of Shahi Snan i.e. 1/9/03. Whereas
highest pH is reported 7.50 at 12.00 hrs on the next day of Shahi
Snan i.e. on 2/9/03.
DO: It is observed that the quality of water is deteriorated in
respect of DO on all the three days of monitoring the samples. The
lowest value is reported 4.4 mg/l at 16.00 on day of Shahi Snan &
highest DO is reported 5mg/l. Whereas one day prior to Shahi
Snan 31/8/03 DO is reported deteriorated i.e. 4.3 mg/l at 16.00 hrs.
& highest DO is reported 5.4 mg/l & the lowest DO is reported 4
mg/l at 16.00 hrs. & highest DO is reported 5 mg/l at 12.00 hrs.
after the day of Shahi Snan i.e. on 2/9/03
BOD: In respect of BOD it is observed that the BOD is reported on
the very higher side on the day of Shahi Snan (1/9/03) highest
value is reported 10 mg/l (16 hrs). It is also observed that BOD
prior to one day Shahi Snan is observed on slightly higher side i.e.
range of 7 to 10 mg/l mg/l but whereas on the next day of Shahi
Snan 2/9/03 the BOD value is reported on lower side compare to
the one day of Shahi Snan.
SS: On 31/8/03 & 1/9/03 the values of SS are reported in
the range of 38 to 48 mg./l which is observed on higher side.
Similar observations are also observed next day of Shahi Snan i.e.
on 2/9/03.
Ammonia: In respect of Ammonia the concentrations are
observed exceeding the limits on date of Shahi Snan & after the
date of Shahi Snan. The highest Ammonia is reported on date of
Shahi Snan 3.008 mg/l at 20.00 hrs. & after the date of Shahi Snan
i.e. 1.771 mg/l at 20.00 hrs.
Detergent: In respect of detergent all the values are reported
within the limit on all the three days of occasion.
Bacteriological Quality MPN/100ml: It is observed that the quality in respect of
bacteriological Parameters on date of Shahi Snan i.e. on 1/9/03
was on higher side i.e. 1800 at 8.00 hrs. on all occasions compare
to the one day prior to Shahi Snan i.e. 31/8/03 & one day after the
Shahi Snan 2/9/03 the lowest value is reported 550 (16.00 hrs).
WATER QUALITY ASSESSMENT & COMMENT:
I) Physical chemical & Bacteriological parameters: First Shahi Snan At Kapila - Godavari Sangam At Tapowan (Nashik): 16/8/03, 17/8/03 &18/8/03. pH: The pH parameter is observed on date of Shahi Snan
within the limit. The lowest pH is observed 7.52 (12.00 hrs) on day
of Shahi Snan 17/8/03. Whereas highest pH is observed 8.27
(8.00 hrs) on 16/8/03 the one day prior to Shahi Snan. On the next
day of Shahi Snan the pH is observed within the limit.
DO: The DO is reported satisfactory on one day prior to
Shahi Snan i.e. on 16/8/03 in the range of 5 to 6.2 mg/l. Whereas
the quality of water in respect of DO is observed deteriorated on
the date of Shahi Snan i.e. 4.8 mg/l at 12.00 hrs. on 17/8/03 & 4.8
mg/l at 12.00, 16.00, 20.00 hrs. on 18/8/03 .
BOD: BOD is reported on very higher side on 16/8/03 as compare
to the values reported on18/8/03. The BOD is in the range of 6.5 to
10 mg/l on the date 18/8/03 whereas BOD is reported in the range
of 6 to 10 mg/l on 17/8/03 whereas BOD is still reported in the
range of 6.5 to 9 mg/l on 16/8/03.
SS: SS is reported unsatisfactory on all the three days of
monitoring. The highest value of SS on date of Shahi Snan is
reported 49 mg/l at 8.00 hrs. & It is observed that SS was on
higher side i.e. in the range of 39 to 46 mg/l on 18/8/03.
Ammonia: Ammonia is reported almost Nil on date of Shahi Snan
i.e. on 17/8/03 as well as on the next day of Shahi Snan & one day
prior to Shahi Snan.
Detergent: The concentration of Detergent is observed satisfactory
on 16/8/03 & 18/8/03. Only on the date of Shahi Snan the
Detergent is observed exceeding the limit i.e. 1.032 mg/l at 20.00
hrs.
Bacteriological Quality MPN/100ml: It is observed that only on all the three days occasion
bacteriological Parameters are observed exceeding limit, whereas
all the times the values are reported on higher side. The highest
value is reported 1600 on 16/8/03 at 16.00 hrs. & 900 on 17/8/03
at 8.00 hrs. & 16.00 hrs & 1600 on 18/8/03 at 8.00 hrs.
Second Shahi Snan At Kapila-Godavari Sangam at Tapowan (Nashik) : 26/8/03, 27/8/03, 28/8/03:
pH: It is observed that there is deterioration in the quality of
water with reference to the pH parameter on one day prior to Shahi
Snan i.e. 8.04 mg/l at 8.00 hrs. & all the other time they are found
within the limit. The minimum pH is observed 7.21 mg/l (16.00
Hrs.) on 27/8/03 whereas highest pH is observed 7.39 at (8.00
hrs.). After the day of Shahi Snan pH is observed within the limit.
DO: It is observed that there is deterioration in the quality of
water with reference to DO parameter. Only on one day prior to the
Shahi Snan i.e. on 26/8/03 the DO is observed in the range of 5.2
to 6.4 mg/l. On date of Shahi Snan the quality of water in respect
of DO parameter is not satisfactory. It is observed in the range of
3.6 to 4 mg/l. & after the date of Shahi Snan it is observed more
unsatisfactory i.e. in the range of 3 to 3.6 mg/l.
BOD: It is observed that BOD is shown always exceeding on all the
three days than the prescribed limit i.e. 2mg/l. The highest BOD is
shown 14 mg/l (12.00 hrs. & 16.00 hrs.) on 27/8/03 & 16 mg/l on
28/8/03 (8.00 & 20.00 hrs)
SS: It is observed that SS was higher on all three days. It is
observed that more higher value is observed on day of Shahi Snan
i.e. 58 mg/l (160.00 hrs) & the lowest 46 mg/l at 8.00 hrs. on
27/7/03, as compare to the one day prior to Shahi Snan & After the
date of Shahi Snan. On 26/8/03 the highest SS is observed 50
mg/l at 8.00 hrs. & on 28/8/03 the highest SS is observed 46 mg/l.
Ammonia: It is observed that the Ammonia is reported
exceeding the limits on date od Shahi Snan i.e. the highest
Ammonia is observed 1.952 mg/l at 8.00 hrs. on 27/8/03 & lowest
is observed 1.557 mg/l at 20.00 hrs. & on one day prior to Shahi
Snan & After the day of Shahi Snan the Ammonia is observed
within the limits.
Detergent: It is observed that all the values of Detergent are
within the limit on all the three days of occasion. The lowest
Detergent is reported on date of Shahi Snan i.e. 27/8/03 is 0.398
at 20.00 hrs.
Bacteriological Quality
MPN/100ml: The highest value is reported 1800 on the day of
Shahi Snan at 8.00 hrs. & 1600 at 8.00 hrs. on 26/8/03 & 1600 at
8.00 hrs. on 28/8/03.
Third Shahi Snan at Kapila - Godavari Sangam at Tapowan (Nashik) : 31/8/03, 1/9/03, 2/9/03.
pH : The pH value is observed all the times within the limit
on all the 3 days of sampling period. Whereas the highest pH is
reported 7.77 at 20.00 hrs on one day prior to Shahi Snan.The
lowest pH is reported 7.45 mg/l (8.00 hrs.) on date of Shahi Snan
i.e. 1/9/03. Whereas highest pH is reported 7.54 at 20.00 hrs on
the next day of Shahi Snan i.e. on 2/9/03.
DO: It is observed that the quality of water is deteriorated in
respect of DO on date of Shahi Snan i.e. 4.5 mg/l at 20.00 hrs. on
1/9/03, 4.9 mg/l at 12.00 hrs on 31/8/03, & 4.1 mg/l on 2/9/03. All
the other time DO is reported satisfactory & all the values are
shown in the range of 5 to 6.4 mg/l.
BOD: In respect of BOD it is observed that the BOD is reported on
the very higher side on the day of Shahi Snan (1/9/03) highest
value is reported 10 mg/l (12.00 & 20.00 hrs). It is also observed
that BOD prior to one day Shahi Snan is observed i.e. range of 5.5
to 8.5 mg/l but whereas on the next day of Shahi Snan 2/9/03 the
BOD value is reported on higher side as compare to the one day of
Shahi Snan i.e. in the range of 8.5 to 11 mg/l.
SS: On 31/8/03 & 1/9/03 the values of SS are reported in
the range of 42 to 49 mg./l which is observed on higher side.
Similar observations are also observed next day of Shahi Snan i.e.
on 2/9/03 i.e. in the range of 41 to 48 mg/l.
Ammonia: In respect of Ammonia the concentrations are
observed within the limit only on one day prior to Shahi Snan i.e.
the highest Ammonia is reported 1.467 mg/l at 12.00 hrs. on
31/8/03 & all the other time Ammonia is reported exceeding the
limits on day of Shahi Snan as well as on the next day of Shahi
Snan. Whereas the highest Ammonia is reported 2.521 mg/l at
12.00 hrs. on 1/9/03 & 2.515 mg/l at 16.00 hrs. on 2/9/03.
Detergent: In respect of detergent it is observed on date of
Shahi Snan & one day prior to Shahi Snan Detergent values are
reported within limit. Only on next day of Shahi Snan the Detergent
value is observed exceeding the limit at 20.00 hrs. i.e. 1.368 mg/l
on 2/9/03.
Bacteriological Quality
MPN/100ml: It is observed that the quality in respect of
bacteriological Parameters was on higher side one day prior to
Shahi Snan i.e. 1800 at 8.00 hrs. on 31/8/03. On date of Shahi
Snan i.e. on 1/9/03 was on higher side i.e. 1600 at 8.00 hrs. & One
day after the Shahi Snan 2/9/03 the lowest value is reported 1600
(12.00 hrs.)
Difficulties :
Difficulties Experience during the monitoring work of river
water at Trimbakeshwar & Nashik City is observed as below:
1. At Trimbakeshwar: a. The staff of the MPCB has experience of the
restrictions of the entry at point to point as well as while
collecting the river water samples from the
Kushawarta.
b. Though the passes were given to vehicles as well as
monitoring team, there were restrictions even for
collection of samples by the security guards.
c. Monitoring staff has walk 2 to 3 Km for taking the
samples of Water from Kushawarta. As entry to the
vehicles even for the MPCB near Kushawarta is
restricted.
2. At Nashik:
a. Near Ramkund it is experience that due to the heavy
rush & non-availability of the space to get the power
connection for Mobile Van as well as to the operation
of High Volume Samples was trouble some.
b. Staff monitoring was worked in a abnormal situations &
they has exposed to the odorous atmosphere because
of continuous non removal of the solid waste created
by pilgrims near Ramkund.
c. Near Tapowan, the difficulty was found less compare
to the Ramkund & Police department helped for getting
the power supply to the operation of Mobile Van.
d. The Analysis report published in the News paper on
the demand of the reporters as well as local channels
& E TV, ZEE TV Etc. the district authority were not
happy for publishing the data to the news paper as the
pilgrims may fill that the Govt. is not able to maintain
the good quality of water for pilgrims for bathing g
purpose hence further publication of quality of river
water in to the news paper is restricted.
e. Monitoring staff has walk 2 to 3 Km for taking the
samples of Water from Ramkund entry to the vehicles
even for the MPCB near Ramkund is restricted.
Recommendations:The following are the recommendations based on investigation
studies:
1. Eliminate water contamination, various methods of
disinfections have been employed such massive cholorination
etc. in bathing water bodies. In swiftly flowing water bodies
however, the residual chlorine is eliminated from water during
its fast travel. But in confined water bodies the impact
of massive chlorination could be deleterious to aquatic life. The
application of chemical disinfectant therefore should be totally
prohibited in & around the confined water bodies such as
Kushawarta.
2. Ozonisation is being used in most of European countries
for the disinfections of drinking water for
Community/municipal Corporation etc. Although it is an
expensive technology but ozonization is much more
advantageous over disinfections by chlorine, bleaching
powder & any other disinfectant.
3. Raw water quality is required to be monitored regularly at
Kushawarta as well as Ahilya- Godavari Sangam in
Trimbakeshwar.
4. It has to be insure that if the raw water quality is not
suitable for bathing at Kushawarta then properly as well
as continuous treatment is required ,which is in complied
of the designed best use criteria for bathing purpose.
5. Stagnation of water in the tanks should be prevented &
continuous flow through systems shall be maintained to
avoid contaminant build up & to make water quality
uniform in the Kushawarta. Dredging & de-sludging of the
tanks should be practiced regularly in order to maintain
water quality.
6. Regular filtration of Kushwarta water may be undertaken
by installation of filtration plant exclusively for the purpose.
The filtration plant may be operated during the day of
heavy human congregation at the auspicious Kushawarta
site.
7. Accumulation of surface pollutants may be avoided by
continuous mixing of water from bathing zone to non-
banking zone. Growth of vegetation in bathing zone shall
be periodically removed.
8. To ascertain the incidence of Water borne diseases due
to impaired water quality during mass bathing episode the
presence of Salmonella may be considered as one of the
important indicator of faecal contamination besides Total
& Faecal coliform counts for water quality monitoring.
9. The health authorities should ensure non-prevalence of
any communicable diseases during such mass-bathing
congregation near Kushawarta. In future, epidemiological
studies may also be conducted in order to make
preventive measures prior to the mass bathing.
10. The health authorities shall ensure proper collection,
segregation & disposal of hospital & nursing home waste
from the municipal waste especially during susceptible
period of such religious congregation. The random
collection & disposal of garbage should be ensured by
local authorities immediately during & after the completion
of mass bathing episodes.
11. Low cost sanitation facilities may be provided by the
agencies such as “ Sulabh Shouchalayas” instead of
providing temporary set up of making shift toilets, which
causes more unhygienic conditions in absence of regular
cleaning during rains.
12. Safe drinking water facilities should be made available , to
ensure that the raw water may not be consumed without
disinfections by the pilgrims for drinking purposes.
13. The mass awareness campaign through posters,
exhibition, films etc. is not effective in maintaining
cleanliness since most of the public gathered for mass
bathing at Kushawarta are semi-literate or illiterate.
Primary education & health centers may be entrusted to
educate them.
14. The awareness should be created among all the pilgrims
for contributing towards cleanliness of sacred Kushawarta
& for maintaining sanitation conditions in the Kushawarta
instead of offering coins to the Kushawarta.
15. Instead of free entries of pilgrims into Kushawarta, paid
taken may be provided them allocating minimum time to
complete the holy bath. This will avoid unnecessary
settlement of the crowd inside the Kushawarta. The
number of bathers in Sannihit tank may be restricted with
respect to its total capacity compared to Kushawarta.
16. The long term settlement of the rural habitants & their
camp may be controlled in the surrounding of premises.
17. Cooking, washing utensils & clothes should not be
allowed in the Kushawarta. Such provisions developed
alternatively through different outlets.
18. The quality of Food supplied to the pilgrims shall be
periodically checked to prevent epidemic of diseases.
19. The Godavari rivers which is classified from origin to up to
the up stream of Gangapur Dam as A-I class of water.
Generally A-I class of water is classified where there
should be any activity of township, human habitation,
hospitals & other causing source. Of pollution whereas
Godavari Rivers immediately after the Hilly area & passes
through the Trimbakeshwar city & activity such as Human
habitations hotels, restaurants , hospitals , important Shiv
temple & people are gathering from all over India for
making POOJA like Kal-Sarpa, Narayan Nagbali Vidhi
due to which offering of Food, milk, flower, coconut,
leaves of tree etc. are being dump nearby the bank of
river or in the Godavari river. Hence, it is find difficult to
have a river water quality for limiting the value of BOD of 2
mg/l & DO of more than 5 mg/l particularly after the rainy
season when there is a least flow of Godavari river.hence
it is recommended the classification of River water may be
reexamined which is passing through the Trimbakeshwear
city & flowing to the Gangapur Dam. This stretch may be
classified I class of water.
References:
1. Report of the Water quality Assessment Durng
the Solar Eclipse of Mass Bathing at Braahm
Sarovar, Kurukshetra (Haryana) , Assessment &
Development Of River Basin Series:
ADSORBS/31/1999-2000.
2. Classification of River Water by MPCB.