Embed Size (px)
Citation preview

1
A BENCH-SCALE STUDY OF FOOD WASTE DEGRADATION IN SEPTIC TANKS
Hongjian Lin1, Maneewan Sinchai1, Carlos Zamalloa1, Michael Keleman2, and Bo Hu1,*
ABSTRACT
Solids in food waste (FW), when disposed in sink via food waste disposers, have a potential to
settle at the bottom of septic tanks and may contribute to an increased sludge accumulation rate
and therefore increase the sludge pump-out frequency. FW may also decrease water quality of tank
effluent with an increased nutrient loading. However, to the best of our knowledge, there has no
empirical peer-reviewed study of assessing the contribution of FW on the septic tank performance.
This study was designed based on the assumption that on average, FW increased the total chemical
oxygen demands (tCOD) by ca. 30% in influent, and was conducted in simulated bench-scale 1-L
tanks (boxes). Two tanks, the control tank fed with sewage and the treatment tank fed with sewage
plus additional FW suspension, were operated at 15 °C with an average hydraulic retention time
of 7.5 day for 209 days. In summary, it was found that FW solids were better degraded than sewage
solids (61.8% vs. 42.2%), and less proportion of FW solids than sewage solids contributed to
sludge accumulation (20.0% vs. 54.9%). Total suspended solids content in the effluent was
increased from 7 mg/L to 22 mg/L due to FW addition, but was substantially smaller than 60 mg/L
required by Minnesota Rules Part 7080.2150. In future study, larger scale operation with tank fed
with FW directly will need to confirm the better biodegradability of FW in septic tanks.
KEYWORDS
Food waste, Food waste disposers, Septic tanks, Water quality, Sludge accumulation
INTRODUCTION
A recent study conducted by Food and Agricultural Organization (FAO) estimated that roughly
one third of the global food production for human consumption is getting lost or wasted every year
(Gustavsson et al. 2011). Food waste (FW) is high in organic matter content, energy content and
nutrient contents, with an average dry weight composition of 30-60% starch, 5-10% proteins and
10-40% lipids (Pleissner and Lin 2013). Although it is suggested by some researchers to collect
and utilize FW as an enormous resource for energy, nutrient, and chemical production (Kiran et al.
2014, Lin et al. 2013, Pham et al. 2015), the mainstream method of FW handling is through the
landfill of solid wastes or wastewater/sewage treatment because of technical and economic
hindrance of recovery technologies. Food waste disposer (FWD, or garbage disposal/grinder)
grinds raw FW and other organic materials into smaller particle sizes of mostly between 0.01” to
0.5” by design as specified by the American Society of Sanitary Engineering Standard (ASSE)
#1008. The ground waste is then flushed with water and transports through plumbing or sewer
pipes to treatment facilities, either centralized wastewater treatment systems or in decentralized
(on-site) sewage treatment systems, commonly known as septic systems. Over 50% of US
1 Department of Bioproducts and Biosystems Engineering, University of Minnesota, St Paul, MN 55108 2 InSinkErator, Emerson Commercial & Residential Solutions, 4700 21st Street, Racine, WI 53406-5031
* Corresponding author. Department of Bioproducts & Biosystems Engineering, 1390 Eckles Ave., BAE Bldg,
University of Minnesota, St. Paul, MN 55108-6005; phone: 612-625-4215; e-mail: [email protected]

2
households installed FWD, and when installed, FWD unit is considered an cost-effective
component of waste management system over the landfill of solid waste (Iacovidou et al. 2012,
Marashlian and El-Fadel 2005).
Previous studies concluded that marginal (less than 3.5%) or no increase in household water
consumption and in the subsequent hydraulic load (Iacovidou et al. 2012, Keleman 2016) caused
by FWD installation, but many studies have shown the resulting sewage composition generally
goes up to a higher strength and the range of increase depends on the water characteristics under
discussion. This has raised concerns of stratifying FW from solids disposal to wastewater treatment
systems, and has probably affected the use of FWD in European countries. For example, the
country with the highest FWD installation rate in Europe is UK and the rate is estimated only
around 5% (Iacovidou et al. 2012). An important pattern of FW is that FW induces a higher
proportion of chemical oxygen demands (COD) and total suspended solids (TSS) concentration
increase over nitrogen (N) and phosphorus (P), e.g., 7.5% to 62% for COD, by 2% to 60% for
TSS, 1.4% to 19% for total N, and 1.2% to 14% for total P, compared with the domestic wastewater
without FW. This fact of strength increase led to experimentation on the treatment cost estimate in
centralized systems of WWTP due to additional aeration and nutrient control measures (NYCDEP
1997, Thomas 2011). But it was also suggested by some other studies that the higher loading of
organic carbon would improve the biological nutrient removal performance and therefore reduce
the associated cost of chemical nutrient removal methods (Battistoni et al. 2007).
Among all the households in US, nearly 25% of them are relying on septic systems, either at
individual or community cluster scales, for sewage treatment according to USEPA’s estimation
(EPA NA). However, to the best knowledge of the authors’, it is rarely seen any single piece of
peer-reviewed empirical study that assesses the impact of FWD on the treatment performance of a
septic system, or on septic tank effluent. An anecdotal study (Crites and Technobanoglous 1998)
stated that due to FWD installation, the septic tank effluent had a slight or no increase in terms of
COD (from 345 to 400 mg/L), TSS (from 80 to 85 mg/L), total ammoniacal N (from 40 to 44
mg/L), organic N (from 24 to 31 mg/L), and total P (no change, 16 mg/L). However, no influent
change or types and doses of the wastes were monitored in that study and therefore it was unknown
if the FW compounds and loading were typical or not in this particular work.
This study aimed to fill the knowledge gap of how a typical FW loading from FWD changed the
influent and effluent water qualities of septic tanks and how it affected the sludge accumulation in
septic tanks. As a starting point, the experiment was designed based on the assumption that FWD
induced a 30% of COD increase in the influent sewage according to previous estimation and results
(Abu-Orf et al. 2014, Iacovidou et al. 2012). Then both wastewater and FW supplemented
wastewater were individually fed to bench-scale 1-L simulated septic tanks (one control tank and
one study tank) and operated under the same conditions. The major water characteristics of influent
and effluent were analyzed. At the end of the operation, the sludge volume accumulation were
measured. Through the performance comparison between the control tank and the study tank, the
effect of FWD on septic tank effluent water quality and sludge accumulation can be assessed.
MATERIALS AND METHODS
Inoculum, sewage, and food waste preparation
Anaerobic sludge collected from Blue Lake Wastewater Treatment Plant (Shakopee, MN) was

3
processed to remove dissolved solids by centrifuging at 5k×g, decanting supernatant, washing
with deionized water, centrifuging again at 5k×g, and decanting supernatant. Two batches of
representative FW were formulated and provided by Emerson Commercial & Residential
Solutions, Racine, WI. 66.7 g of the provided FW was diluted with tap water to 1 L, and filtered
through 2 mm drum screen. The rejects were ground for 2 min, washed by FW filtrate and filtered
through the screen again. The grinding-washing cycle was repeated for another three times so that
there was only little amount of remaining fiber rejects, and the filtrate was in a form of FW
suspension. Raw sewage was collected from the same wastewater treatment plant and was filtered
with a 2 mm-pore drum screen to remove large debris, and FW suspension was added to sewage
at ratio that increased chemical oxygen demand (COD) by ~30%.
Setup and operation of simulated septic tanks
Simulated 1-liter septic tanks (made from LDPE plastics box, internal W×L×H as 110 mm × 165
mm × 55 mm) were inoculated with the processed anaerobic sludge, fed with sewage (the control
tank) or sewage plus FW (the treatment tank), with an initial COD ratio of the inoculum and
sewage at 3:1. The simulated septic tanks were then operated at an average hydraulic retention
time (HRT) of 7.5 days with two feeding/withdrawal events per HRT, and kept in a cooler set at
15°C for 209 days. The setup was shown in Figure 1.
Figure 1. Setup of simulated septic tanks (Note that the symbols of ST5 and ST6 indicate the
septic tanks fed with sewage and sewage plus FW suspension, respectively).
Water quality analysis of influent, effluent, mixed-liquor, and sludge accumulation
For each feeding and withdrawal event, influent and effluent samples were collected. Water
characteristics analysis on total COD (tCOD), soluble COD (sCOD), total phosphorus (TP), total
nitrogen (TN), pH, and total sulfide were performed using commercial colorimetric methods with
a UV-vis spectrophotometer or electrode probes. Total suspended solids (TSS) were calculated
from subtracting total dissolved solids from total solids (TS) obtained by drying filtered samples
and nonfiltered samples overnight at 105 °C, respectively. Volatile solids (VS) were obtained by
subtracting the ash content (combusted at 550 °C in muffle furnace for 30 min) from TS. After 209
days’ operation, the mixed liquor was obtained from the tank for solids analysis. The height of
sludge accumulated in each tank was indirectly measured after the mixed-liquor was transferred
to a transparent HDPE bottles and settled for three and half a day before reading the sludge depth.
RESULTS AND DISCUSSION
COD removal
This study aimed to add FW to induce a 30% of tCOD increase in sewage. The tCOD removal
efficiencies of both tanks gradually improved over operation (

4
Figure 2), indicating the maturity of the tanks due to the microbial community evolution and sludge
accumulation. The real tCOD increase in influent due to FW addition was 34.8% (from 639 to 861
mg/L, Table 1), and that of the sCOD increase was 35.0% (from 300 to 404 mg/L). The
corresponding tCOD and sCOD change in effluent due to FW addition were 17.7% and 10.0%,
respectively. This decreased impact of FW on effluent COD concentrations clearly suggest that
septic tank holds a better pretreatment on FW than on the other portion of sewage COD, either by
better degradability or better settleability, and will be further discussed in later section about TSS
and VS removal.
A
5
Figure 2. Time course of total COD removal efficiency: the control tank (A) and the study tank
(B).
Table 1. Major water quality data summary and the corresponding removal efficiency(SE:
standard error)
Influent Effluent
Average
removal
efficiency
Ave SE Ave SE %
pH (n=27)
Control tank 6.74 0.02 6.78 0.02 -
Treatment tank 6.73 0.01 6.80 0.01 -
Difference due to FW - - - - -
Sulfide
(n=38), mg/L
Control tank 1.83 0.31 5.16 0.68 -
Treatment tank 3.73 0.62 6.76 0.86 -
Difference due to FW 1.90 1.61 -
tCOD (n=48),
mg/L
Control tank 639 36 335 23 47.6
Treatment tank 861 45 394 27 54.3
Difference due to FW 223 - 59 -
B
6
sCOD
(n=48), mg/L
Control tank 300 23 332 29 -11.0
Treatment tank 404 26 366 32 9.6
Difference due to FW 105 - 33 - -
TP (n=53),
mg/L
Control tank 9.17 0.59 9.35 0.60 -2.0
Treatment tank 9.88 0.66 9.70 0.65 1.8
Difference due to FW 0.71 - 0.35 - -
TN (n=51),
mg/L
Control tank 66.45 0.82 61.47 0.84 7.5
Treatment tank 69.75 0.80 64.37 1.11 7.7
Difference due to FW 3.30 - 2.90 - -
TS (n=17),
mg/L
Control tank 1.912 0.038 1.699 0.032 11.2
Treatment tank 1.991 0.026 1.736 0.030 12.8
Difference due to FW 0.079 - 0.037 - -
VS (n=17),
mg/L
Control tank 0.445 0.031 0.250 0.032 43.8
Treatment tank 0.518 0.024 0.278 0.031 46.4
Difference due to FW 0.074 - 0.028 - -
TSS (n=17),
mg/L
Control tank 0.202 0.017 0.007 0.010 96.5
Treatment tank 0.278 0.023 0.022 0.010 92.0
Difference due to FW 0.076 - 0.015 - -
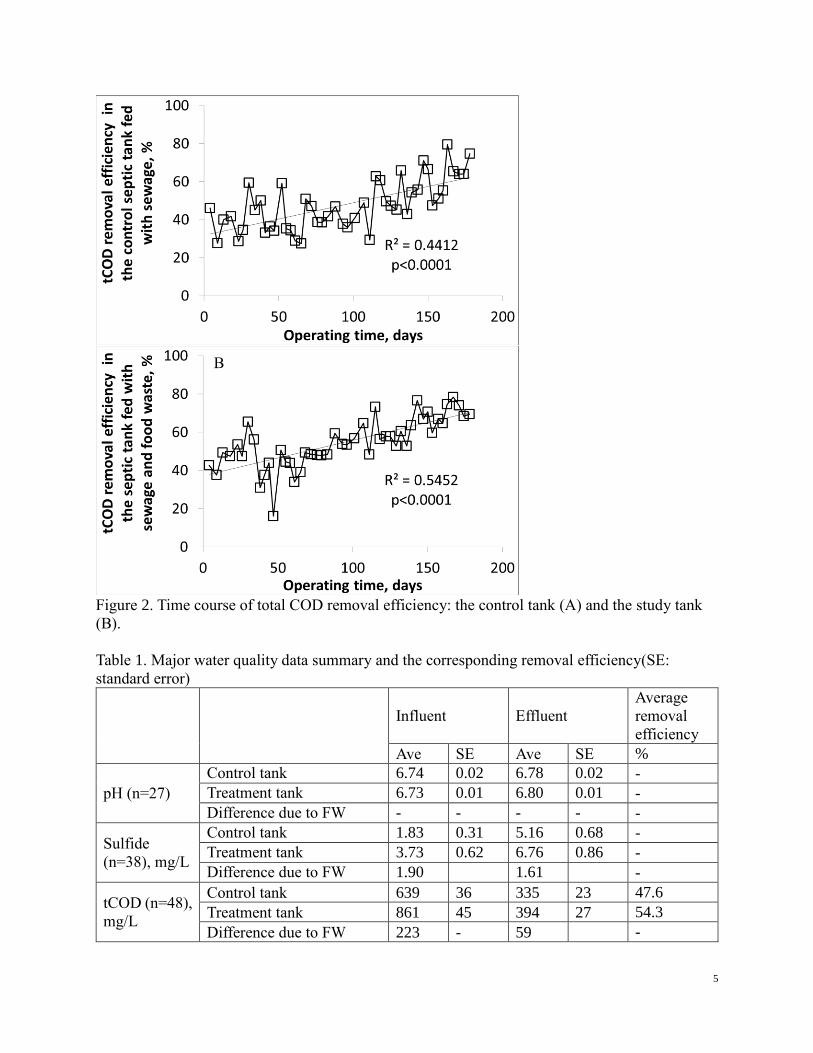
Total phosphorus and nitrogen removal
Data summary were given in Table 1 and the time course data were displayed in

7
Figure 3. The sewage and FW supplemented sewage had average TP content of 9.17 and 9.88
mg/L, respectively. The corresponding septic tank effluent had average TP content of 9.35 and
9.70 mg/L. The slight increases of TP in effluent of both the control and treatment tank were most
like released from the initially inoculated sewage, which had an initial TP content of 25.6 mg/L.
Generally, septic tank did not show noticeable TP removal efficiency. Influent TP was increased
by FW by 0.71 mg/L, while in the effluent, the corresponding TP increase was 0.35 mg/L,
suggesting that half of the TP induced by FW was removed by septic tank.
A

8
Figure 3. Time course profiles of major influent and effluent water characteristics: tCOD (A),
sCOD (B), total phosphorus (C), and total nitrogen (D).
Septic tanks showed a slight TN removal in both sewage and FW supplemented sewage, by 8%
and 8.7%, respectively.
B
D
C

9
Solids removal
Septic tank had TS removal of 11.1% and 12.8% for sewage and FW supplemented sewage,
respectively. It had better VS removal as 45.4% and 47.4%, respectively. TSS was a deciding water
quality in septic tank, because it had an impact on the hydraulic performance of the following leach
field. In this study, septic tank was observed to remove 98.4% of TSS from sewage, decreased
from 202 to 7 mg/L. FW addition decreased the TSS removal efficiency to 91.2%. Among the 22
mg-TSS/L in the tank effluent, 15 mg/L was therefore contributed by FW supplementation, which
was about 20% of the initial TSS contained in FW.
Sludge accumulation and solids balances
In the total tank depth of 55 mm, the control tank had a sludge depth of 8.6 mm, while the tank fed
with FW supplemented sewage had a sludge depth of 9.1 mm (Figure 4). This corresponded to a
6.4% sludge increase caused by FW. Concerning that there was a 37.9% of TSS increase in the
influent induced by FW addition, FW solids were either better degraded or more discharged to
effluent. A mass balance was needed to address the fate of TSS to see if there was a better
degradation.
Figure 4. Sludge depth in the control tank and treatment tank.
Figure 5 showed the TS, VS, and TSS in the mixed-liquor after 209 days operation. Since the
volume of the mixed-liquor was 1 L, it can be calculated that the tanks held 5.577 and 5.773 g of
TS, 3.127 and 3.423 g of VS, and 3.627 and 4.083 g of TSS, in the control and treatment tanks,
respectively. Further calculation results were summarized in Table 2. It can be seen that FW TSS
was better degraded than sewage TSS, 61.8% vs. 42.2%. The FW TSS had smaller effect on sludge
accumulation, since only 20.0% of FW TSS was accumulated in tank while 54.9% of sewage TSS
was accumulated. However, FW TSS had an adverse effect on water discharge TSS because a
higher proportion (18.1%) of this TSS went to effluent compared with sewage (2.9%).

10
A
B

11
Figure 5. Sludge depth in the control tank and treatment tank.
Table 2. Mass balance of total suspended solids
Fed to tanks Discharged in effluent Accumulated in tanks Degraded
Sewage TSS, g 6.61 0.19 3.63 2.79
Fraction in sewage TSS 100% 2.9% 54.9% 42.2%
FW TSS, g 2.28 0.41 0.46 1.41
Fraction in FW TSS 100% 18.1% 20.0% 61.8%
CONCLUSIONS
With 34.8% of tCOD increase induced by FW supplementation, this study found in the setting of
1-L simulated septic tank during 209 days’ operation, that:
In the influent, sCOD was increased by 35.0%, TP by 7.8%, and TN by 5.0%
When compared between the effluents of the control tank (fed with sewage) and the
treatment tank (fed with sewage plus FW suspension), tCOD was increased by 17.7%,
sCOD by 10.0%, TP by 3.8%, TN by 4.7%. All were smaller than the corresponding
increase in the influent
FW increased TSS content in effluent compared with the control tank effluent, 22 mg/L vs.
7 mg/L
FW increased TSS content in influent by 37.9%, but the sludge accumulation in tank was
only increased by 6.4% due to FW addition
61.8% of FW TSS was degraded, while 42.2% of sewage TSS was degraded
20.0% of FW TSS and 54.9% of sewage TSS were accumulated in tank, respectively
Future experiment based on larger-scale septic tanks will be designed and conducted to
confirm the effect of FW on sludge accumulation and characteristics of septic tank effluent
REFERENCES
Abu-Orf, M., Tchobanoglous, G., Stensel, H.D., Tsuchihashi, R., Burton, F., Bowden, G., Pfrang,
C

12
W., Metcalf and Eddy (2014) Wastewater engineering: treatment and Resource recovery, McGraw
Hill Education.
Battistoni, P., Fatone, F., Passacantando, D. and Bolzonella, D. (2007) Application of food waste
disposers and alternate cycles process in small-decentralized towns: A case study. Water research
41(4), 893-903.
Crites, R. and Technobanoglous, G. (1998) Small and decentralized wastewater management
systems, McGraw-Hill.
EPA (NA) EPA's Septic (Decentralized/Onsite) Program.
Gustavsson, J., Cederberg, C., Sonesson, U., Van Otterdijk, R. and Meybeck, A. (2011) Global
food losses and food waste. Food and Agriculture Organization of the United Nations, Rom.
Iacovidou, E., Ohandja, D.-G., Gronow, J. and Voulvoulis, N. (2012) The household use of food
waste disposal units as a waste management option: a review. Critical Reviews in Environmental
Science and Technology 42(14), 1485-1508.
Keleman, M. (2016) Food Waste Disposer Impacts on Septic Systems & the Current U.S.
Regulatory Landscape, Reno, Nevada.
Kiran, E.U., Trzcinski, A.P., Ng, W.J. and Liu, Y. (2014) Bioconversion of food waste to energy: a
review. Fuel 134, 389-399.
Lin, C.S.K., Pfaltzgraff, L.A., Herrero-Davila, L., Mubofu, E.B., Abderrahim, S., Clark, J.H.,
Koutinas, A.A., Kopsahelis, N., Stamatelatou, K. and Dickson, F. (2013) Food waste as a valuable
resource for the production of chemicals, materials and fuels. Current situation and global
perspective. Energy & Environmental Science 6(2), 426-464.
Marashlian, N. and El-Fadel, M. (2005) The effect of food waste disposers on municipal waste
and wastewater management. Waste Management & Research 23(1), 20-31.
NYCDEP (1997) The Impact of Food Waste Disposers in Combined Sewer Areas of New York
City. Protection, N.D.o.E. (ed), NYC Department of Environmental Protection, New York, NY.
Pham, T.P.T., Kaushik, R., Parshetti, G.K., Mahmood, R. and Balasubramanian, R. (2015) Food
waste-to-energy conversion technologies: Current status and future directions. Waste Management
38, 399-408.
Pleissner, D. and Lin, C.S.K. (2013) Valorisation of food waste in biotechnological processes.
Sustainable chemical processes 1(1), 21.
Thomas, P. (2011) The effects of food waste disposers on the wastewater system: a practical study.
Water and Environment Journal 25(2), 250-256.


![[XLS] Unclaimed Divided... · Web viewA/102 PADMAVATHI PARK NEW JAIN MANDIR ROAD VIRAR E VIRAR C/O G SINGHVI AWLAD NASSER CORP ALSALAM ST P O BOX 46611 ABUDHABI U A E A-14 SINCHAI](https://img.pdfslide.us/doc/110x75/5aad1bbb7f8b9a8f498dd606/xls-unclaimed-dividedweb-viewa102-padmavathi-park-new-jain-mandir-road-virar.jpg)