Embed Size (px)
Citation preview


3rd
NATIONAL CONFERENCE
on
TRENDS AND ADVANCES IN MECHANICAL
ENGINEERING (TAME-2017)
March 16-17, 2017
Chief Patron
Prof. Kaptan Singh Solanki
Hon’ble Governor, Haryana and
Chancellor, YMCAUST, Faridabad
Patron Prof. Dinesh Kumar
Hon’ble Vice Chancellor
YMCAUST, Faridabad
Conference Steering Committee Dr. S. K. Sharma
Registrar
Prof. Sandeep Grover
Dean (Institutions)
Prof. C.K. Nagpal
Dean (FET)
Conference Chair Convener Co-Convener Organizing Secretary
Prof. M.L. Aggarwal
Chairman & Professor
Mech. Engg.
Dr. Rajeev Saha
Asst. Prof.
Mech. Engg.
Dr. Nikhil Dev
Asst. Prof.
Mech. Engg.
Ms. Shefali Trivedi
Asst. Prof.
Mech. Engg.
Editors Dr. Krishan Kumar
Dr. Mahesh Chand
Dr. Rajeev Saha
Dr. Nikhil Dev
Ms. Shefali Trivedi
Dr. M. L. Aggarwal
Department of Mechanical Engineering,
YMCA University of Science and Technology,
Faridabad, Haryana 121006
www.ymcaust.ac.in
MESSAGE
It’s a matter of great pleasure that Department of Mechanical Engineering of YMCA University
of Science & Technology, Faridabad is organizing a National Conference on "Trends and
Advances in Mechanical Engineering (TAME 2017)" during March 16th - 17th, 2017.
In recent years, the advancement in the field of electronics, information technology and
computer science haschanged the facet of Mechanical Engineering. The integration of different
engineering branches has resulted in tremendous technological advances in Mechanical
Engineering. This is a proper time for researchers to meet their counterparts and discuss various
aspects of resources and utilization for increasing the productivity in industries.
I have no doubt that the conference will provide a common platform to Researchers, Industry
Personnel, Academicians and participating Professional for interaction and discussion about the
recent trends and advances in various areas of Mechanical Engineering.
I trust that this conference would also inspire the participants to develop and introduce new
research activities for the future corporate world. These researches will also be of incredible
value to the humankind.
I extend warm felicitations to the organizers &participating delegates and convey my best wishes
for the success of National Conference, TAME 2017.
Prof. Dinesh Kumar
VICE CHANCELLOR

3rd
National Conference on Trends and Advances in Mechanical Engineering TAME-2017 MARCH 16-17, 2017
Department of Mechanical Engineering, YMCA University of Science and Technology, Faridabad
i
PREFACE
New developments in technology bring change that usher the mankind to a better future.
Technological innovations have reached a stage that incorporates the integration of different fields
for the holistic developments. With innumerable specializations in the field of Mechanical
Engineering, it becomes obligatory for professionals and researchers to confer and transform their
thoughts into more meaningful developments.
To comply with such dynamic requirements, national conference on Trends and Advances in
Mechanical Engineering (TAME 2017), third in series, is being organised on March 16-17, 2017. The
conference is aimed at providing a common platform to researchers, industry personnel,
academicians, students and participating professionals to interact and discuss about the trends and
advances made in the various areas of Mechanical Engineering.
Conference Themes: Suggested themes include, but are not restricted to:
Theme I: Thermal Engineering
Thermal Engineering, Heat Transfer, Fluid Dynamics, Alternative refrigerants, Thermal Systems,
Turbo Machinery, Renewable Energy, Energy conservation, Refrigeration & A/C, Green Building.
Theme II: Design and Analysis
Design & Analysis, CAD/CAE, Robotics, Mechatronics, Vibration Analysis, Condition Monitoring,
Machine Design & Dynamics, Mechanisms, Tribology, Fracture Mechanics, 3D Printing.
Theme III: Production and Advanced Manufacturing Engineering
Production and Manufacturing Engineering, CIM, E-Manufacturing, Group Technology, Rapid
Prototyping & Reverse Engineering, Mechanical Metallurgy, Welding, Non Conventional Machining,
Material testing, Smart Materials, Nano Materials, Composite Materials, Plastics, Fibre Reinforced
Plastics, FMS.
Theme IV: Industrial Engineering
Industrial Engineering, TQM, JIT, Reliability, Waste Management, BPR, Concurrent Engineering,
Operations Research, Ergonomics, SCM, ERP, Production, Role of Computers & IT in Mechanical
Engineering, Planning & Control.
TAME 2017, 3rd
in series, is being organized by Department of Mechanical Engineering with ever
encouraging response from the research community and funds received from UGC. A total of 77
numbers of papers were received out of which 68 papers were found suitable for publishing after
review. The teamwork of students and faculty equally led to the success of this conference.
(Conveners)

3rd
National Conference on Trends and Advances in Mechanical Engineering TAME-2017 MARCH 16-17, 2017
Department of Mechanical Engineering, YMCA University of Science and Technology, Faridabad
ii
NATIONAL ADVISORY COMMITTEE
Prof. S.K. Saha, IIT, Delhi
Prof. Dinesh Kumar, IIT, Roorkee
Prof. S.P. Singh, IIT, Delhi
Prof. S.C. Kaushik, IIT, Delhi
Prof. Ravi Shankar, IIT, Delhi
Dr. P.M. Pandey, IIT, Delhi
Prof. Navneet Arora, IIT, Roorkee
Prof. S.K. Garg, Pro-VC, DTU
Prof. Samsher, Dean(SW), DTU
Prof. H.C. Garg, GJU, Hisar
Prof. R.A. Khan, IGDTUW, Delhi
Prof. R.K. Garg, NIT, Jalandhar
Prof. Hari Singh, NIT, Kurukshetra
Prof. R.K. Garg, DCRUST, Murthal
Prof. Rupinder Singh, GNDEC, Ludhiana
Prof. R.A. Kapgate, Dean (R&D), SCE, Maharashtra
Prof. Zainul Huda, University of Malaysia
Dr. Kannac C, DGM, IOCL, Faridabad
Shri P. Ravichandran, President, Danfoss Industries Ltd., Chennai
Shri A.K. Nehra, Belz Instruments Pvt. Ltd., Faridabad
Shri Kanwal Jeet Jawa, MD, Daikin Air-Conditioning India Pvt. Ltd.
Mr. Raj Bhatia, MD Bony polymers, Faridabad
Mr. Sukhdev Singh, Director, Hind Hydraulics, Faridabad
Mr. Naveen Sood, MD, VEEGEE Industries, Faridabad
Mr. Praveen Khanna – Promoter of Suvidha Engineers
Mr. Ramneek Bawa – Director & CEO of DS Construction Ltd
UNIVERSITY ADVISORY COMMITTEE
Prof. Tilak Raj (ME)
Prof. Raj Kumar, Dean (HAS)
Prof. S.K. Aggarwal, Dean (SW)
Prof. P.R. Sharma (EL)
Prof. Navdeep Malhotra (ME)
Prof. Vikram Singh, TPO
Prof. Vikas Turk (ME), CHW
Prof. Hari Om, COE
Prof. Arvind Gupta (ME), Dean (MBA)
Prof. Lakhwinder Singh (ME)
Prof. Rajesh Ahuja, Chairman (EL)
Prof. Komal Bhatia (CE)
Prof. Munish Vashishath, Chairman (EE)
Prof. Naresh Chauhan (CE)
Prof. Manjeet Singh (CE)
Prof. Atul Mishra (CE)
Dr. Pradeep Dimri, Director (Cultural Activities)
LOCAL ORGANIZING COMMITTEE
Dr. N.L. Mangla, Assoc. Prof.
Mr. Surinder Raina, Assoc. Prof.
Dr. Sanjeev Kumar, Assoc. Prof.
Mr. Naresh Yadav, Assoc. Prof.
Dr. Vasdev Malhotra, Assoc. Prof.
Mr. Mukesh Gupta, Asst. Prof.
Ms. Sandhya Dixit, Asst. Prof.
Dr. Sanjeev Goyal, Asst. Prof.
Dr. Bhaskar Nagar, Asst. Prof.
Dr. Rajesh Kumar Attri, Asst. Prof.
Dr. Krishan Verma, Asst. Prof.
Dr. Mahesh Chand, Asst. Prof.
Dr. Om Prakash Mishra, Asst. Prof.
Mr. Surender Singh, Asst. Prof.
Mr. Bhupender Singh, Asst. Prof.
Mr. Sanjay Kumar, Asst. Prof.
Mr. Nitin Panwar, Asst. Prof.
3rd
National Conference on Trends and Advances in Mechanical Engineering TAME-2017 MARCH 16-17, 2017
Department of Mechanical Engineering, YMCA University of Science and Technology, Faridabad
iii
ABOUT THE UNIVERSITY
(NAAC Accredited ‘A’ Grade State Govt. University)
YMCA University of Science and Technology, Faridabad, erstwhile, 'YMCA Institute of
Engineering, Faridabad' was established in the year 1969, as a joint venture of the National
Council of YMCAs of India, Govt. of Haryana and the Central Agencies for Development Aid,
Bonn, Germany. It started as an Indo-German project with an aim to impart technical education to
a developing India on German pattern. The Institute had been granted University status since 1st
Dec., 2009. (Established by Haryana State Legislative Act No. 21 of 2009 & Recognized by UGC
Act 1956 u/s 22 to Confer Degrees). It had been granted 12B status by UGC.
The University is situated right on the National Highway No. 2 (Mathura Road) 32 Kms. from the
National Capital New Delhi on way to the Taj Mahal, Agra. The University has its own Campus
on a plot area of 20 acres. It is located in the growing and sprawling Faridabad Ballabgarh
Industrial Complex of Haryana. The University is well connected with rail transport from New
Delhi.
YMCA University of Science & Technology is a pioneer Institution that has been providing
qualified, trained manpower to the industry since its inception. It has produced large number of
entrepreneurs who are actively contributing to the socio – economic development of the country
in general and the state of Haryana in particular. The University has contributed immensely in
the field of technical education and plays an important role in creating highly skilled technical
manpower which is employable in an equally competitive market.
University offers 4-year B.Tech. Degree courses in six disciplines i.e. Mechanical Engineering,
Information Technology, Computers, Electronics & Communication, Electrical and Electronics-
Instrumentation & Control. Post Graduate courses and Ph.D. is being offered in all the
departments of the University. YMCAUST has been conferred “Best upcoming University” award
by Associated Chamber of Commerce and Industry (ASSOCHAM) of India in Feb., 2014 under
National Education Excellence. YMCAUST was awarded ‘AAA+’ by the Career 360 magazine in
the year 2013, 2014 & 2015.

3rd
National Conference on Trends and Advances in Mechanical Engineering TAME-2017 MARCH 16-17, 2017
Department of Mechanical Engineering, YMCA University of Science and Technology, Faridabad
iv
ABOUT THE DEPARTMENT
The Department of Mechanical Engineering offers courses at UG and PG level. At UG level,
B.Tech. course in Mechanical Engineering, started in 1997 with an intake of 60 students and it
has been increased 120 student at present. M.Tech. programme in Mechanical Engineering with
specialization in Manufacturing Technology and Automation was started from the academic year
2003-04 and has an intake of 18 students. The University had started Ph.D. Course since 2010
and 55 students have registered themselves for the Ph.D. programme in the department.
The Department of Mechanical Engineering has a distinguished record in both teaching
and research. The department was shifted to the new building in January 2009 with modern
facilities and a dedicated technical and office staff to support the academic programs and
research.
The department is actively engaged in research work in the broad area of Design of
Mechanical Equipment, Design & Manufacturing, Thermal, Energy Conservation, TQM,
Product and Service Quality, Computer Integrated Manufacturing, Manufacturing, Industrial
Engineering, Computer Aided Engineering, Just in Time, etc.
The departmental facilities include 16 labs, 3 workshops (Machine Tools, Refrigeration
& Air conditioning, Fabrication & Sheet Metal Technology), 8 lecture halls, 1 conference room
and 1 seminar hall with Wi-Fi facilities. Department has two centres of excellence in
collaboration with Danfoss Industries (P) Ltd. (for Climate and Energy) and Daikin Air-
Conditioning (P) Ltd (for Air-Conditioning).
The department has highly qualified and experienced faculty including 10 professors, 4
Associate professors and 16 Assistant Professors. 21 of the faculty members are Ph.D. holders
with average experience of 14 years approximately.
During last 5 years, faculty members have published more than 500 papers in various National
and International Journals and Conferences of repute in India and abroad.
The Mechanical Engineering Department is also highly active in co-curricular and
technical activities. Two of its club namely MechNext Club and SAE India YMCA Collegiate
Club are actively engaged in practising latest developments for innovative design of automobile
vehicles and has won many prizes at National level.
Dr. M. L. Aggarwal
Professor & Chairman
Department of Mechanical Engineering

National Conference on Trends and Advances in Mechanical Engineering TAME-2017 MARCH 16-17, 2017
v
Department of Mechanical Engineering, YMCA University of Science and Technology, Faridabad
Paper
No.
Paper Title Authors Page No.
Theme I – Thermal Engineering
1. Hydrogen: Future Fuel For Engines Vimlesh Kumar Ojha,
M.L. Aggarwal
1-4
2. Extraction Of Waste Heat From Exhaust Of
Internal Combustion Engines, To Be Used For
Useful Purpose
Anil Kumar 5-13
3. Salinity Gradient Energy In India Dharmender Sharma,
Navdeep Malhotra,
Bhupender Sharma
14-18
4. A Review On High Pressure Processing (HPP)
Of Milk
Siba Prasad Nayaka,
Sudarshanna Karb,
Vinkel Kumar Arora
19-24
5. Design Of Multiejector Refrigeration System
For Constant Entrainment Ration And Its
Effect On COP Of System
Varun Saini, Gulshan
Sachdeva
25-29
6. Kitchen Waste: An Alternate Source Of
Energy
Navdeep Malhotra,
Pankaj Singh Routela
30-35
7. Comparative Analysis Of EGR And SCR
Systems Of High End Indian Automobile
Brands To Find Out Its Solution
Rohit Kumar Singh,
Aakash Sanghi, Aman
Kumar, Abhay Chouhan
36-43
8. An Overview: Four Stroke S.I. Engine Sahil Chugh, Abhay
Sharma
44-48
9. Status Of GSCM Adoption In Punjab Power
Industry
Rajiv Kumar Garg,
Sheetal Soda, Anish
Sachdeva
49-53
10. A Review On 2S LPG Direct Injection Engine Rahul Kumar, Sumit
Sharma, Vipin Kaushik
54-57
11. Some Studies Of Navigation System For Solar
Powered Autonomous Vehicle
Mohammad Waseem, A
F Sherwani, Mohd
Suhaib
58-64
12. The Effect Of Dedicated Mechanical
Subcooling On The Performance Of A Vapour
Compression Refrigeration System In Winter
Tushar Singh 65-71

National Conference on Trends and Advances in Mechanical Engineering TAME-2017 MARCH 16-17, 2017
vi
Department of Mechanical Engineering, YMCA University of Science and Technology, Faridabad
13. Limitations Of Lubrication Of A 2 Stroke SI
Engine
Yogya Khanna, Sumit
Sharma, Vipin Kaushik
72-75
14. Experimental Energetic, Economic &
Environmental (3E) Analysis Of Vapour
Compression Refrigeration System With
Dedicated Mechanical Sub-Cooling
Manoranjan Kumar 76-82
15. Thermohydrostatic Analysis Of Constant Flow
Valve Compensated Asymmetric Hole Entry
Journal Bearing.
Pankaj Khatak, H.C.
Garg
83-90
16. Technological Aspects Of Solar Concentrator:
A Critical Review
Aman Sharma, Santosh
Patel
91-95
17. Comparison Of Common Ejector Refrigeration
System And Ejector Refrigeration System
With Jet Pump
Gourav Barwal, Gulshan
Sachdeva
96-103
18. An Approach To Increase The Efficiency Of
Internal Combustion Engine
Satya Prakash,
Bhupender Singh
104-106
19. Analysis Of Barriers In Combined Cycle
power Plants- A Graph Theoretic Approach
Nikhil Dev
107-108
Theme II – Design & Analysis
20. Wing Design Of Radio Controlled Ornithopter Reshu Sharma 109-111
21. Design Of Tilling Shaft For 7HP Power Tiller
Under The Effect Of Fatique Loading On
Solidworks 2016
Anshul Ahuja, Navdeep
Malhotra
112-115
22. Sustainable Design Of Composite Parabolic
Leaf Springs
Krishan Kumar, M.L.
Aggarwal
116-119
23. Design And Fabrication Of An All-Wheel
Drive System In An ATV
Anshul Panchal, Karan
Arora, Nitin Sharma
120-124
24. Design Of Measuring Instrument For
Excavator Bucket Tooth
Sahil, Rajeev Saha,
Sanjeev Kumar
125-128
25. Ergonomics Of Mobility Scooter: An
Overview
Abhay Sharma, Sahil
Chugh
129-134
26. Tribological Applications Of
Electrorheological Fluid- A Review
Parveen Kumar, Suresh
Verma, Vijay Jadon
135-140
National Conference on Trends and Advances in Mechanical Engineering TAME-2017 MARCH 16-17, 2017
vii
Department of Mechanical Engineering, YMCA University of Science and Technology, Faridabad
27. Practical Considerations In Primary Vibration
Calibration: Calibration And Measurement
Capabilities And Their Validation
N. Garg, S. Dhruw, S.
Rapeswal, M. Pant, R. K.
Sharma
141-145
28. Influence And Machine Design: Lessons For
The Development Of Autonomous Machines
Arvind Kumar 146-150
Theme III – Production Engineering
29. Desirability Approach In RSM Applied To
Symmetrical Multi Leaf Spring
Vinkel Kumar Arora,
Gian Bhushan, M.L.
Aggarwal
151-157
30. Issues Related With Cellular Manufacturing
System
Sanjay Kumar, Vasdev
Malhotra, Vikas Kumar
158-162
31. Study On Mechanical Behavior Of Particulate
Reinforced Aluminum Matrix Composites
Developed By Stir Casting Route
Dhairya Pratap Singh,
Sudhir Kumar, Vikram
Singh
163-168
32. Stress Analysis For Different Material On
Double Helical Gear
Apoorv Saxena, Easwar
Ram, Vineet Kumar
169-173
33. Automated Testing Using Labview Jitisha Aggrawal 174-177
34. Implementation Of Group Technology In The
Field Of Cellular Manufacturing : A Review
Prince Deshwal 178-181
35. Optimization Of Process Parameters In
Electro-Discharge Machining Using Taguchi
Method On Mild Steel IS 2026
Anbesh Jamwal, Ankur
Aggarwal, Punj Lata
Singh
182-193
36. Aluminium Metal Matrix Composites- A
Review
Aasiya Parveen, Nathi
Ram Chauhan, Mohd.
Suhaib
194-199
37. Noise Reduction Using Glass Fiber Reinforced
Polymer Gear
Atul Sharma, M.L.
Aggarwal, Lakhwinder
Singh
200-202
38. Magnetic Abrasive Finishing Set Up Vipin Kaushik, Sumit
Sharma, Kumar Harshit
203-206
39. Review Of Bearing Faults And Their
Monitoring Techniques In Rotary Machines
Surender Singh, Vikas
Kumar, O. P. Mishra
207-211
National Conference on Trends and Advances in Mechanical Engineering TAME-2017 MARCH 16-17, 2017
viii
Department of Mechanical Engineering, YMCA University of Science and Technology, Faridabad
40. Tweel Tyre Technology Abhishek 212-214
41. A Comparative Study Of Optimization
Strategies Implemented In Ultrasonic
Vibration Assisted Wire Electrical Discharge
Machining
Sanjay Kumar, Sandeep
Grover, R S Walia
215-224
42. A Study On Designation System And
Reinforcement Types In Aluminum Alloys
Gurpreet Singh, Sanjeev
Goyal
225-230
43. A Review On Electro Chemical Discharge
Machining Process (ECDM)
Rajnish Saxena, Amitava
Kumar Mandal, Somnath
Chattopdhyay, B K
Bhuyan
231-237
44. Methodologies Of Composite Fabrication By
Rapid Prototyping Techniques: A Review
Ashish Kumar Dey, Arsh
Oberoi, Hemant Chouhan
238-242
45. Magneto Rheological Fluid Assisted Electrical
Discharge Machining
Lokesh Upadhyay, M L
Aggrawal, P M Pandey
243-249
46. A Literature Review On Plasma Arc Cutting
Process
Sahil Sharma, Mukesh
Gupta, Raj Kumar, N S
Bindra
250-255
47. Recent Trends And Advances In Gear
Manufacturing Technology
Pawan Kumar Taneja,
M.L. Aggarwal
256-262
48. Solar Operated Sand Molding Compaction
Process
Sarika Gupta, M.L.
Aggarwal
263-267
49. Analysis Of Factors Affecting Toxicity In A
Nanomaterial Using ISM
Rajeev Saha 268-275
50. Review On Performance Measurement For
Automobile Service Sector
Anil Kumar, Bhupender
Singh, Rajesh Attri
276-279
51. The Changing Manufacturing Environment
From The Mass Manufacturing To The
Flexible Manufacturing
Sandhya Dixit
280-284
52. Study of Various Flexibilities in a Flexible
Manufacturing system
Mohit Yadav, Sandhya
Dixit
285-290
National Conference on Trends and Advances in Mechanical Engineering TAME-2017 MARCH 16-17, 2017
ix
Department of Mechanical Engineering, YMCA University of Science and Technology, Faridabad
Theme IV – Industrial Engineering
53. Selection Of Appropriate Lean Manufacturing
Strategies For Different Lean Wastes: A
Literature Study
Virender Chahal, M.S.
Narwal
291-296
54. Selection of Vendor in a Manufacturing
Organization using Graph Theoretic Approach
and Analytic Hierarchy Process
Mohit Singh, Soumil
Arora
297-306
55. Environmental Noise Pollution in India: Status
and Control Strategies
N. Garg, M. K. Sharma,
A. K. Sinha, R. K. Singh
307-311
56. Enhancing Factors And Implementation
Strategy Used To Develop Benchmarking
Model of Internal Supply Chain Management
for Analysing Indian Manufacturing Industries
Kailash, Rajeev Saha,
Sanjeev Goyal
312-315
57. To Compare The Factors Affecting The
Service Quality Of Customers Using Fuzzy
Graph Theoretic Approach
Tarun Kumar Gupta,
Vikram Singh
316-319
58. An Overview Of: Alignment Of Supplier,
Manufacturer And Distributor In Jit Supply
Chain
O.P. Mishra, Krishan
Verma, Mahesh Chand,
Surender Singh
320-325
59. Identification Of Tools Of Leagile
Manufacturing System : A Case Study
Naveen Virmani, Rajeev
Saha, Rajeshwar Sahai
326-329
60. Analysis Of barriers Of Lean Manufacturing
System: A Fuzzy-ISM Approach
Vivek Kalsariya, Faizan
Iqbal, Varinder Kr.
Mittal, Punj Lata Singh
330-335
61. Automatic Movement Control System Of
Capsules Using Radio-Frequency
Identification (RFID)
Punj Lata Singh 336-338
62. Sustainable Industrial Manufacturing Subrata Kumar Patra,
Tilak Raj, B.B. Arora
339-343
63. Optimization Of Track Length In A Centre
Board Hopper
Girraj Kaushik 344-347
64. Supplier Selection And Evaluation For
Sustainable Supply Chain Management
Jitender Kumar, Ajay
Dabas
348-352

National Conference on Trends and Advances in Mechanical Engineering TAME-2017 MARCH 16-17, 2017
x
Department of Mechanical Engineering, YMCA University of Science and Technology, Faridabad
65. The Value Of Collaboration In Supply Chain Harjit Singh, R K Garg
And Anish Sachdeva
353-362
66. Development Of A Linear Programming (L.P)
Model For Maximization Of Profit With
Proper Tool Management In Flexible
Manufacturing System
Surinder Kumar, Tilak
Raj
363-369
67. A Literature Review On Reverse Supply Chain Swapnil Chauhan,
Bhupender Singh
370-376
68. The Impact Of The Cloud In Manufacturing In
Current Manufacturing Scenario: A Review
Mahesh, Bhaskar Nagar 377-382
Proceedings of the National Conference on
Trends and Advances in Mechanical Engineering
(TAME-2017) March 16-17, 2017 ISBN 978-93-5268-269-0
YMCA University of Science & Technology, Faridabad, Haryana
1
HYDROGEN: FUTURE FUEL FOR ENGINES
Vimlesh Kumar Ojha1, M.L. Aggarwal
2
1M.Tech. Student, Department of Mechanical Engineering, YMCA University of Science and Technology,
Faridabad-121006, Email: [email protected] 2Professor, Department of Mechanical Engineering, YMCA University of Science & Tech., Faridabad-121006,
Haryana, India
Abstract
Today most of our energy needs are fulfilled by the fossil fuels. The energy requirement is rapidly increasing
and the storage of fossil fuels are limited. The present scenario of the automotive and agricultural sectors is
fairly scared with the depletion of fossil fuel. The researchers are working towards to find out the best
replacement for the fossil fuel; if not at least to offset the total fuel demand. The emissions of fossil fuels making
environment very polluted day by day. So, the world is working on different kinds of alternate energy like solar
energy, wind energy etc. which should emit least pollutions. In regards to emission, the fuel in the form of
gaseous state is much better than liquid fuel. By considering the various aspects of fuel, hydrogen is expected as
a best option when consider as a gaseous state fuel. It is identified as a best alternate fuel for internal
combustion engines as well as power generation application, which can be produced easily by means of various
processes. The paper stresses the sustainability of hydrogen in the form of gas can be used as fuel in the engines
and fuel cells.
Keywords: Fossil fuel, energy, emissions, environment
1. Introduction
Hydrogen is an energy carrier that can transform our fossil-fuel dependent economy into a hydrogen economy,
which can provide an emissions-free transportation fuel. Hydrogen makes up 90% of the known universe, and it
is the third most abundant element on Earth. Hydrogen is colourless, odourless and nontoxic. It does not
produce acid rain, deplete the ozone layer or produce harmful emissions. Hydrogen has the highest combustion
energy per pound relative to any other fuel, meaning it is more efficient based on weight. Today, hydrogen is
being used to fuel buses, cars, scooters and forklifts. Hydrogen is also used as a fuel for the NASA space shuttle.
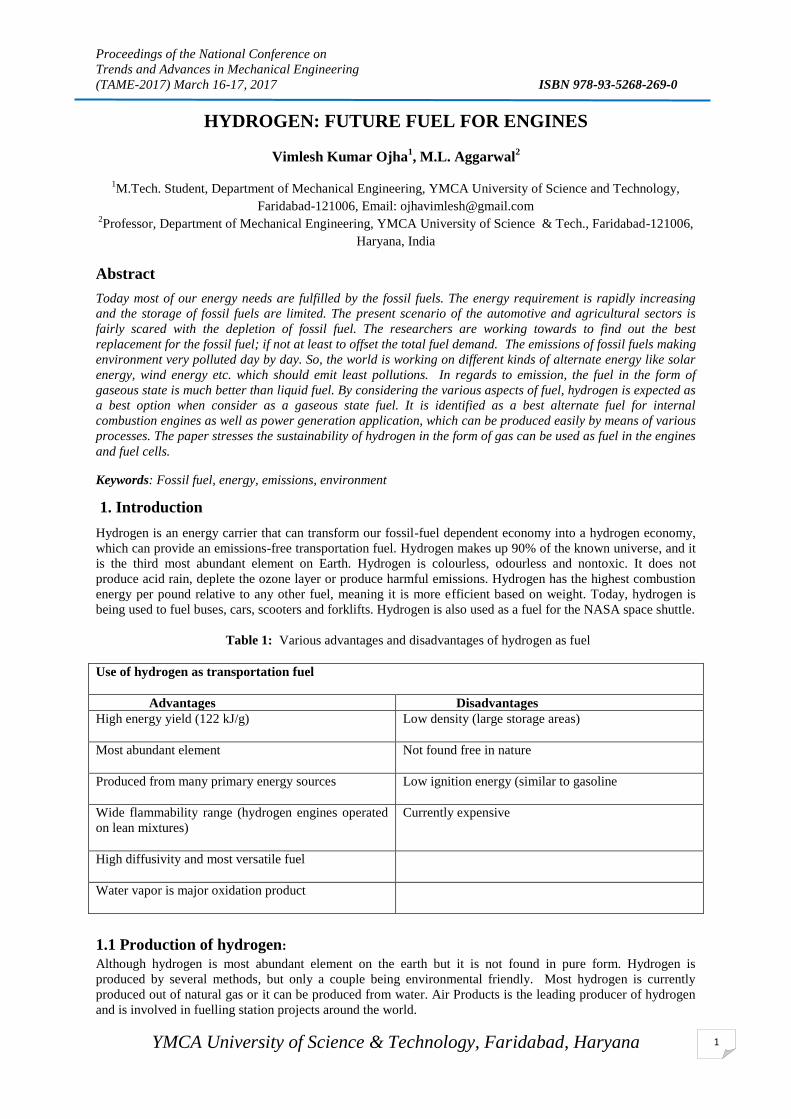
Table 1: Various advantages and disadvantages of hydrogen as fuel
Use of hydrogen as transportation fuel
Advantages Disadvantages
High energy yield (122 kJ/g)
Low density (large storage areas)
Most abundant element
Not found free in nature
Produced from many primary energy sources
Low ignition energy (similar to gasoline
Wide flammability range (hydrogen engines operated
on lean mixtures)
Currently expensive
High diffusivity and most versatile fuel
Water vapor is major oxidation product
1.1 Production of hydrogen:
Although hydrogen is most abundant element on the earth but it is not found in pure form. Hydrogen is
produced by several methods, but only a couple being environmental friendly. Most hydrogen is currently
produced out of natural gas or it can be produced from water. Air Products is the leading producer of hydrogen
and is involved in fuelling station projects around the world.

Proceedings of the National Conference on
Trends and Advances in Mechanical Engineering
(TAME-2017) March 16-17, 2017 ISBN 978-93-5268-269-0
YMCA University of Science & Technology, Faridabad, Haryana
2
Table2: Various methods to produce hydrogen
Method Process Implementation
Steam reforming of
methane gas
In presence of nickel catalyst & at 700 –
1100 °C:
CH4(g) + H2O(g) →CO(g) + 3H2(g)
Next reaction at lower temperature:
CO(g) + H2O(g) → CO2(g) + H2(g)
Current major source of hydrogen
Hydrogen from coal
(Gasification
At high temperature and pressure:
Coal + H2O(g) + O2(g) →syngas
Syngas = H2 + CO + CO2 + CH4
Current method of mass hydrogen
production
Electrolysis of water
Electric current passed through water:
2H2O(l) → 2H2(g) + O2(g)
Not in widespread use due to cost
of electricity
Solar – Hydrogen system
Electric current
passed through water:
2H2O(l) →2H2(g) + O2(g)
Not in widespread use due to cost
of renewable energy sources
Table3: Various methods with advantages and disadvantages
Method Advantages Disadvantages
Steam reforming of
CH4(g)
65 – 75% efficiency
Economical (least expensive method)
Established infrastructure
Nonrenewable resource
Produces CO2 emissions
Gasification
Large supplies of coal in US
Inexpensive resources
Produces CO2 emissions
Carbon sequestration would raise costs
45% efficiency
Electrolysis of water
Depend on electricity source
Input into production may require more
energy than released
Produces CO2 emissions if coal is
energy source
Solar – Hydrogen System No emissions 65% efficiency Expensive
1.2 Storage of hydrogen:
Hydrogen storage and transport is a critical issue involving intense research. The problem is the low density of
hydrogen gas. There are some methods to store hydrogen as :
Table4: Various storage forms with advantages and disadvantages
Storage form Advantages Disadvantages
Compressed gas Reliable
Indefinite storage time
Easy to use
Higher capital & operating costs
Heat can cause container rupture
Liquid High density at low pressure
High cost
Low temperatures needed
Escape can cause fire or
asphyxiation
Metal hydride High volume efficiencies
Easy recovery
Very safe
Expensive materials
Heavy storage tanks
Compressed gas is the most useful method to store hydrogen for stationary as well as transportation application.
In this method the gas is compressed at high pressure in the cylinders. There are mainly four types of these
storage cylinders: type 1, type 2, type 3 and type 4. Type 1 is a metallic container having very high weight. In
type 2 cylinders metal liner is reinforced by composite wrap (glass or fiber) around the middle in hoop wrap
pattern. Type 2 is of less weight but more costly compare to type 1. In type 3 cylinder metal liner reinforced by
composite in full wrap pattern over entire cylinder. It has light weight but expensive. Type 4 tank has plastic gas

Proceedings of the National Conference on
Trends and Advances in Mechanical Engineering
(TAME-2017) March 16-17, 2017 ISBN 978-93-5268-269-0
YMCA University of Science & Technology, Faridabad, Haryana
3
tight liner reinforced by composite wrap over entire cylinder. Entire strength of tank is on composite. It is of less
weight and expensive.
2.Emission comparison of hydrogen with gasoline
Emission produced by hydrogen is many times lower than that of gasoline used in internal combustion engine.
When we use hydrogen in the fuel cell technique then the byproduct is water (H2O) so emission is very lower or
in negligible amount.
2.1 NOx emission comparison:
Fig.1: NOX Comparison
The Fig.1 shows that level in both the engine used by gasoline and hydrogen. It may be observed that almost
10 times decrease in amount of in NOx for hydrogen as fuel.
2.2 CO emission comparison:
Fig.2: CO Comparison
The amount of carbon mono oxide emitted by both the engine versus the engine speed is shown in the above
Fig.2. In the gasoline engine although excess air is provided for the complete combustion of fuel in the cylinder
but some fuel remain unburnt and passes through exhaust. It is expected that hydrogen fuelled engine must have
zero CO emission.
3. Conclusion Specific features of the use of hydrogen as an engine fuel have been analyzed. NOx emission of hydrogen
fuelled engine is about 9-10 times lower than gasoline fuelled engine. Emission of CO, HC and CO2 of
hydrogen is very less so hydrogen is environment friendly. Short time of combustion produces lower exhaust
gas temperature for hydrogen. The scope for hydrogen economy over fossil fuel economy will most suitable for
countries like India where most of the fuel are imported and they lose their huge revenue. It is expected that
hydrogen is the future engine fuel. The hydrogen fuel is much cleaner and efficient than conventional fuel.

Proceedings of the National Conference on
Trends and Advances in Mechanical Engineering
(TAME-2017) March 16-17, 2017 ISBN 978-93-5268-269-0
YMCA University of Science & Technology, Faridabad, Haryana
4
References 1. Erol Kahramana, S. Cihangir Ozcanlib, Baris Ozerdemb,An experimental study on performance and emission
characteristics of a hydrogen fuelled spark ignition engine International Journal of Hydrogen Energy. 32 (2007)
2. United States Department of Energy. Annual Energy Review 2007.
http://www.eia.doe.gov/emeu/aer/contents.html (October 20, 2008).
3. Balat M. Potential importance of hydrogen as a future solution to environmental and transportation problems.
International Journal of Hydrogen Energy. 2008
4. Karim GA, A comparative evaluation of the performance characteristics of a spark ignition engine using
hydrogen and compressed natural gas as alternative fuels, International Journal of Hydrogen Energy. 2000.
Proceedings of the National Conference on
Trends and Advances in Mechanical Engineering
(TAME-2017) March 16-17, 2017 ISBN 978-93-5268-269-0
YMCA University of Science & Technology, Faridabad, Haryana
5
EXTRACTION OF WASTE HEAT FROM EXHAUST OF INTERNAL
COMBUSTION ENGINES TO BE USED FOR USEFUL PURPOSE
Anil Kumar
Department of Mechanical & Automation Engineering, G B Pant Engineering College, Okhla, Delhi-110020
Email: [email protected], Phone: 9355691075
Abstract
In Internal combustion engines, efficiency of engine is around 30%, roughly 30% of the fuel energy is wasted in
exhaust gases, and 30% in cooling and 10% are unaccountable losses. Efforts are made to catch this 30%
energy of exhaust gases. If this waste heat energy is tapped and converted into usable energy, the overall
efficiency of an engine can be improved. Here, we have modified an automobile for extracting heat from the
exhaust. We have demonstrated a concept of extracting heat in a moving vehicle by using copper coil as heat
exchanger. We allowed exhaust gases coming out of engine to pass through an insulated box. The Heat carried
by the exhaust gases is extracted inside the box through copper coil and can be used for various purposes.
Keywords: Heat exchanger, exhaust, four stroke engine, Exhaust Gas Temperature Gauge, LMTD
1. Introduction
In recent years the scientific and public awareness on environmental and energy issues has brought in major
interests to the research of advanced technologies particularly in highly efficient internal combustion engines.
Substantial thermal energy is available from the exhaust gases in modern automotive engines.Two-thirds of the
energy from combustion in a vehicle is lost as waste heat, of which 30-40% is in the form of hot exhaust Gas.
So the main problem is –“The large amount of heat carried by the exhaust gases goes waste into environment”.
This large amount of energy from the stream of exhausted gases could potentially be used for waste heat energy
recovery to increase the work output of the engine. The latest developments and technologies on waste heat
recovery of exhaust gas from internal combustion engines (ICE) includes thermoelectric generators (TEG),
Organic Rankine cycle (ORC), six-stroke cycle IC engine and new developments on turbocharger Technology.
2. Literature Review
A- Various researches done related to exhaust heat recovery are as under-
1. “A highly efficient six-stroke internal combustion engine cycle with water injection for in-cylinder exhaust
heat recovery” by Conklin JC, Szybist JP.
A concept adding two strokes to the Otto or Diesel engine cycle to increase fuel efficiency is presented here. It
can be thought of as a four-stroke Otto or Diesel cycle followed by a two-stroke heat recovery steam cycle. A
partial exhaust event coupled with water injection adds an additional power stroke. Waste heat from two sources
is effectively converted into usable work: engine coolant and exhaust gas. Conklin and Szybist investigated that
the percentage of fuel energy converted to useful work only 10.4% and also found the thermal energy lost
through exhaust gas about 27.7%.
2. “Performance of a Thermo acoustic Sound Wave Generator driven with WasteHeat of Automobile
Gasoline Engine” by Hatazawa M, Sugita H, Ogawa T, SeoY.
A new type of thermo acoustic sound wave generator driven with the waste heat of a 4cycle automobile gasoline
engine is described. The exhaust-pipe connected sound wave generator, in which the hot heat exchanger is set in
the exhaust pipe in order to recover the waste heat of exhaust gas, is proposed. A temperature of 780°C of
exhaust gas in the exhaust is observed. In a conventional thermo acoustic sound wave generator, sound waves
originate at a temperature of the hot heat exchanger, TH, of 200-300°C and become sufficient at 700°C. It is
confirmed that the new generator generates sufficient sound waves and its performance is almost equal to that of
the electric heater driven generator at a thermal input of 300 W, which corresponds to slightly more than 1% of

Proceedings of the National Conference on
Trends and Advances in Mechanical Engineering
(TAME-2017) March 16-17, 2017 ISBN 978-93-5268-269-0
YMCA University of Science & Technology, Faridabad, Haryana
6
the heat quantity of exhaust gas provided under the condition that the number of engine revolutions is 2 600 rpm
and that the throttle opening is 35%.
3. “Potential applications of thermoelectric waste heat recovery in the automotive industry” by Yang J.
Several proposed applications of thermoelectric (TE) waste heat recovery devices in the automotive industry are
reviewed. To assess the feasibility of these applications at a vehicle level, the effect of electrical load and weight
on fuel economy for a series of cars and trucks was investigated. These results will help us to identify the
appropriate vehicle platforms for TE waste heat recovery, and to establish a set of requirements for an
automotive TE waste heat recovery subsystem. The key to the realization of this technology is still the continued
development of new materials with increased efficiency.
4. “Automobile engine tribology — approaching the surface” by C.M. Taylor.
There has been relentless pressure in the second half of the 20th century to develop ever more fuel efficient and
compact automobile engines with reduced environmental impact.
From the viewpoint of the tribologist this means increasing specific loads, speeds and temperatures for the major
frictional components of the engine, namely, the piston assembly, the valve train and the journal bearings, and
lower viscosity engine oils with which to lubricate them. Inevitably, this leads to decreasing oil film thicknesses
between the interacting surfaces of these components and a more crucial role for the topography and surface
profile of the two surfaces in determining tribological performance. This paper reviews the nature of the
surfaces encountered in the piston assembly, valve train and journal bearings of the internal combustion engine
and how mathematical models of engine tribology are endeavoring to cope with the extreme complexities the
incorporation of surface topography potentially brings.
5. “Automotive Thermoelectric Generator Design Issues” by Francis Stabler.
Automotive applications for thermoelectric materials are growing in importance, driven by the customer’s desire
for high efficiency and for more features. Most thermoelectric applications can be divided into one of two
segments. One segment is based on the Peltier effect and it’s focused on various applications of heating or
cooling. The other segment is based on the Seebeck effect and is focused on power generation, primarily from
waste heat. The heating and cooling applications will be addressed first because some of these applications are
already in production.
Various Energy Losses in a Vehicle
As Per California Energy Commissiononly about 15 percent of the energy from the fuel you put in your tank
gets used to move your car down the road or run useful accessories, such as air conditioning. The rest of the
energy is lost to engine and driveline inefficiencies and idling. Therefore, the potential to improve fuel
efficiency with advanced technologies is enormous.
Engine Losses - 62.4 percent
Idling Losses - 17.2 percent
Accessories - 2.2 percent
Driveline Losses - 5.6 percent
Aerodynamic Drag - 2.6 percent
Rolling Resistance - 4.2 percent
Overcoming Inertia; Braking Losses - 5.8 percent
In addition, any time you use your brakes, energy initially used to overcome inertia is lost.Only about 15 percent
of the energy from the fuel you put in your tank gets used to move your car down the road or run useful
accessories, such as air conditioning. The rest of the energy is lost to engine and driveline inefficiencies and
idling. Therefore, the potential to improve fuel efficiency with advanced technologies is enormous.
1. Possibility of heat recovery and availability from I.C. Engine
Waste heat is heat, which is generated in a process by way of fuel combustion or chemical reaction, and then
“dumped” into the environment even though it could still be reused for some useful and economic purpose. This
heat depends in part on the temperature of the waste heat gases and mass flow rate of exhaust gas. Waste heat
losses arise both from equipment inefficiencies and from thermodynamic limitations on equipment and
processes. Exhaust gases immediately leaving the engine can have temperatures as high as 842-1112°F [450-

Proceedings of the National Conference on
Trends and Advances in Mechanical Engineering
(TAME-2017) March 16-17, 2017 ISBN 978-93-5268-269-0
YMCA University of Science & Technology, Faridabad, Haryana
7
600°C]. Consequently, these gases have high heat content, carrying away as exhaust emission. Fig. 1 shows
total energy distributions from internal combustion engine.
Figure 1-Heat distribution of an engine
B. Approximate Waste Heat from Internal Combustion Engine
C. Heat Exchanger
Heat exchangers are devices used to transfer heat energy from one fluid to another. Typical heat exchangers
experienced by us in our daily lives include condensers and evaporators used in air conditioning units and
refrigerators. Boilers and condensers in thermal power plants are examples of large industrial heat exchangers.
There are heat exchangers in our automobiles in the form of radiators and oil coolers. Heat exchangers are also
abundant in chemical and process industries.
Heat Transfer Considerations
The energy flow between hot and cold streams, with hot stream in the bigger diameter tube, is as shown in
Figure 7.1. Heat transfer mode is by convection on the inside as well as outside of the inner tube and by
conduction across the tube. Since the heat transfer occurs across the smaller tube, it is this internal surface which
controls the heat transfer process. By convention, it is the outer surface, termed Ao, of this central tube which is
referred to in describing heat exchanger area. Applying the principles of thermal resistance,
If we define overall the heat transfer coefficient, Uc, as:
Substituting the value of the thermal resistance R yields:

Proceedings of the National Conference on
Trends and Advances in Mechanical Engineering
(TAME-2017) March 16-17, 2017 ISBN 978-93-5268-269-0
YMCA University of Science & Technology, Faridabad, Haryana
8
Standard convective correlations are available in text books and handbooks for the convective coefficients, ho
and hi. The thermal conductivity, k, corresponds to that for the material of the internal tube. To evaluate the
thermal resistances, geometrical quantities (areas and radii) are determined from the internal tube dimensions
available.
Fouling
Material deposits on the surfaces of the heat exchanger tubes may add more thermal resistances to heat transfer.
Such deposits, which are detrimental to the heat exchange process, are known as fouling. Fouling can be caused
by a variety of reasons and may significantly affect heat exchanger performance. With the addition of fouling
resistance, the overall heat transfer coefficient, Uc, may be modified as:
Where R” is the fouling resistance.
With fouling, the expression for overall heat transfer coefficient becomes:
3. METHODOLOGY
Schematic Diagram:
Figure 2-Schematic diagram of proposal
1. Working:-
Apparatus is designed to extract the heat from exhaust of an IC engine. Exhaust from the engine flow
through an insulated tube, which is connected to exhaust pipe at one end and insulated box at the other.
Proceedings of the National Conference on
Trends and Advances in Mechanical Engineering
(TAME-2017) March 16-17, 2017 ISBN 978-93-5268-269-0
YMCA University of Science & Technology, Faridabad, Haryana
9
Insulated tube helps to maintain temperature of the exhaust with minimum atmospheric loss. In the box, exhaust
flow through copper coil here heat is extracted. Heat is transferred from exhaust to copper metal by convection,
further followed by conduction process. Rise in temperature of coil results in convection of heat to the box.
Heat transfer causes rise in temperature of the box. Exhaust exits from other side of box through the
insulated tube and connected to silencer. Continuous flow of exhaust from coil results in increase in temperature
of the box.
To maintain the desired temperature or to limit the temperature, a temperature sensor is installed in the
box. The sensor is connected to the battery fan. When the temperature exceeds the desired value, the sensor
sends signal to the fan. Fan starts and transfer heat to surrounding, resulting in decrease in temperature.
When the apparatus is not in use the valve on the exhaust exit is open so that no exhaust flows through
the insulated tube.
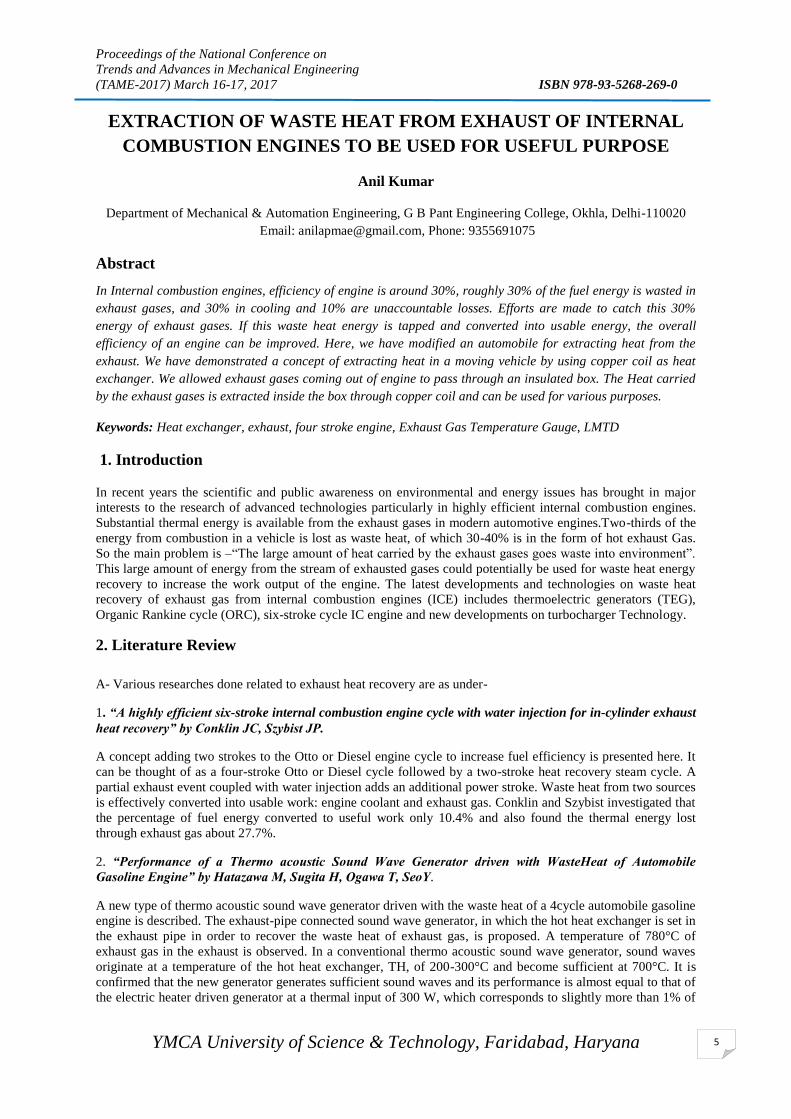
2. Components:-
1) Cylindrical box: - Cylindrical box is used to capture the extracted heat and acts as heating box.
2) Copper coil (Heat Exchanger): - A heat exchanger is a device used to transfer heat between one or
more fluids. The fluids may be separated by a solid wall to prevent mixing or they may be in direct contact.
Copper coil of outside diameter 0.5 inch is used.
3) Insulation: - Thermal insulation is the reduction of heat transfer (the transfer of thermal
energy between objects of differing temperature) between objects in thermal contact or in range of radiative
influence. A layer of insulation is fixed inside and outside cylindrical box to trap heat extracted.
4) Battery operated fan: - Fan is run by motor, which is used to distribute heat evenly in the cylinder.
5) Digital thermal sensor: - It is used to find the change in temperature with time
6) Switch: - It is used to on and off fan.
7) Cast iron connections: - Different types of socket are used to assemble the project components.
Figure 3- various components used for fabrication
2. Fabrication:-
I. Copper coil is folded in the shape of cylindrical box.
II. Insulated sheet is fixed inside the box.
III. Insulated is fixed on the outside of the cylindrical box.
IV. Universal is attached to exhaust tube.
V. Screw is welded on the copper coil.
VI. Elbow and other connections are joined with screw.
VII. Fan is attached to the lid of box.
VIII. Exhaust pipe is insulated
IX. Box is attached to bike.

Proceedings of the National Conference on
Trends and Advances in Mechanical Engineering
(TAME-2017) March 16-17, 2017 ISBN 978-93-5268-269-0
YMCA University of Science & Technology, Faridabad, Haryana
10

Proceedings of the National Conference on
Trends and Advances in Mechanical Engineering
(TAME-2017) March 16-17, 2017 ISBN 978-93-5268-269-0
YMCA University of Science & Technology, Faridabad, Haryana
11
Figure 4- Step by step assembly of project
Assumption and data used while calculating heat transfer:-
i. Taking heat transfer coefficient of copper-401W/m2K
ii. Convective coefficient of air- 10.45 W/m2K
iii. Exhaust temperature-150°C
iv. Copper coil with inner and outer radius-0.0056m and 0.00635m
v. Number of copper tubes-7
vi. Fouling factor is not considered.
vii. Room temperature - 30°C
viii. Cylindrical box diameter- 0.3048m
ix. Height of cylindrical box-0.3048m
x. Exhaust flow rate- 48 CFM(cubic feet per min)
xi. Density of air at 30 C- 1.165Kg/m3
5. RESULT
1. Temperature of Exhaust
Exhaust gas temperature gauge:-An exhaust gas temperature gauge (EGT gauge) is a meter used to monitor the
exhaust gas temperature of an internal combustion engine in conjunction with a thermocouple-type pyrometer.
EGT gauges are found in certain cars and airplanes. By monitoring EGT, the driver or pilot can get an idea of
the vehicle's air-fuel ratio.
*Temperature of exhaust gas is around 150-200°C for Bajaj Caliber 115cc.
2. Calculating increase in temperature with time:-
Table 2- Observation table
S. No. Time (in seconds) Temperature (in degree Celsius)
1 0 33.8
2 30 35
3 60 38.2
4 90 42.1

Proceedings of the National Conference on
Trends and Advances in Mechanical Engineering
(TAME-2017) March 16-17, 2017 ISBN 978-93-5268-269-0
YMCA University of Science & Technology, Faridabad, Haryana
12
5 120 45.6
6 150 50
7 180 52
8 210 53.4
9 240 54.8
10 270 56
11 300 58.1
Figure 5- Temperature vs. Time graph
Calculating Amount of Heat Transfer
Heat transferred- QT =U * A* F (LMTD)
So “Rate of heat transfer calculated from above formula is 250.67 J/min”.
6. Conclusion
SO by using this Method we will be able to find that we can use the heat of exhaust gases can be utilized or can
be used for a fruitful function. In our method the heat transfer rate is- is 250.67 J/min”
7. DISCUSSION
Objective of this project was to design, analyze and fabricate a method to extract heat from the exhaust of IC
engine. We found the amount of heat extracted and the increase in temperature of the box in a fixed interval of
time. The method has very vast application as the heat extracted is free of cost. It can be customized as per the
requirements.
05
101520253035404550556065
0 30 60 90 120 150 180 210 240 270 300 330
Tem
per
atu
re(i
n d
egre
e C
els
ius)
Time (in seconds)
Tempterature-Time relation for Apparatus
Temperature(in degree Celsius)

Proceedings of the National Conference on
Trends and Advances in Mechanical Engineering
(TAME-2017) March 16-17, 2017 ISBN 978-93-5268-269-0
YMCA University of Science & Technology, Faridabad, Haryana
13
8. SCOPE OF WORK
Delivery of food items for long distance.
Warming of insides of car during winter.
Could be used for the production of bio-fuel by growing of algae farms or could be used in greenhouses or even
used in Eco-industrial parks.
REFERENCES
1. Hatazawa M, SugitaH, OgawaT, SeoY. “Performance of a thermo acoustic sound wave generator driven with
waste heat of automobile gasoline engine”. Transactions of the Japan Society of Mechanical Engineers 2004;
70(689):292–9.
2. Stabler F. “Automotive applications of high efficiency thermoelectric”, in DARPA/ONR program review and
DOE high efficiency thermoelectric workshop. 2002: San Diego, CA.
3. Taylor CM. “Automobile engine tribology—design considerations for efficiency and durability”. Wear 1998;
221(1):1–8
4. Yang J. “Potential applications of thermoelectric waste heat recovery in the automotive industry”, in
International conference on thermoelectric 2005:155-159.
5. Omura, “Mastering Autocad 2000 for Mechanical Engineers” BPB Publications, 2nd
Edition, 1998.
6. P.K. Nag, “Engineering Thermodynamics”, Tata McGraw Hill
7. R.K. Rajput, “Thermal Engineering”, Laxmi Publications.
8. Conklin JC, Szybist JP.”A highly efficient six-stroke internal combustion engine cycle with water injection
for in-cylinder exhausts heat recovery”. Energy 2010; 35:1658–64.

Proceedings of the National Conference on
Trends and Advances in Mechanical Engineering
(TAME-2017) March 16-17, 2017 ISBN 978-93-5268-269-0
YMCA University of Science & Technology, Faridabad, Haryana
14
SALINITY GRADIENT ENERGY IN INDIA
Dharmender Sharma1, Navdeep Malhotra
2, Bhupender Sharma
3
1Research Scholar, YMCAUST Faridabad, Haryana, India, Email: [email protected]
2Mechanical Engineering Department, YMCAUST Faridabad, Haryana, India,
Email:[email protected] 3 Mechanical Engineering Department, Advanced educational institutions, Haryana, India
Email: [email protected]
Global climate change due to excessive green house gases concentration is a wide concern, and leading
researchers towards the renewable energy sources. Salinity Gradient Energy is a promising alternate to replace
the fossil fuel pollutants. The salinity gradient energy is an important renewable energy source with immense
capability to cater the high electricity generation demands in future. Salinity gradient energy is because of the
variation in salt concentration between two fluids. Two important methods are used to develop technological
advancement in the field. Pressure retarded osmosis (PRO) and Reversed electro dialysis (RED). According to
world power demand salinity gradient energy has a potential about 1000 TW that is equivalent as the 60 times
the required usage of the whole world. India contains lots of estuaries along coastlines, having significant
potential to produce green energy by mixing water streams. Mixing of two streams having salinity gradient
provides large osmotic power as available energy. The paper is a research done on to conclude the applicability
of salinity gradient energy PRO and RED in Indian Coastal lines.
Keywords: Renewable Energy, Salinity Gradient Energy, PRO Pressure retarded osmosis, RED Reversed
Electro Dialysis
1. Introduction
The harmful & dreading consequences of the exponentially rising pollutants have forced us to recognize the
importance to extract the Salinity Gradient energy as an alternate source of renewable energy as shown in figure
1.
Figure1: Harmful Carbon Emission Statistics
2. Salinity Gradient Energy
Salinity Gradient Energy is a promising alternate to replace the fossil fuel pollutants. The salinity gradient
energy is an important renewable energy source with immense capability to cater the high electricity generation
demands in future. Salinity gradient energy is because of the variation in salt concentration between two fluids.
A large estuary is capable to make green energy continuously, without producing any harmful effect to the
ecosystem and the fisheries. Salinity gradient energy is the extraction of power from the salinity difference
available between two sources. Salinity gradient energy is a clean energy source available where the fresh water

Proceedings of the National Conference on
Trends and Advances in Mechanical Engineering
(TAME-2017) March 16-17, 2017 ISBN 978-93-5268-269-0
YMCA University of Science & Technology, Faridabad, Haryana
15
and the sea water meets. Salinity concentration in the two different sources creates osmotic pressure difference
which is being used to harness energy and is equivalent to a water body having a head of 280 meters.
Figure 2.A simplified diagram explaining salinity gradient energy.
2.1. Pressure Retarded Osmosis PRO
This Technique is based on the Osmosis principle. Difference between the densities of water bodies is used to
extract the useful energy. A special membrane is used to separate the water bodies which generate huge
pressure. This high pressure is used to harness useful energy.
Figure 3.A simplified PRO diagram.

Proceedings of the National Conference on
Trends and Advances in Mechanical Engineering
(TAME-2017) March 16-17, 2017 ISBN 978-93-5268-269-0
YMCA University of Science & Technology, Faridabad, Haryana
16
2.2. Reversed Electro dialysis RED
This Technique is based on the exchange of ions between the fresh and salt water bodies. Special membranes
are used in the device to separate the water bodies. The membranes allow the ions to cross through it. A set of
membranes is used that allows crossing anions and cations. This Process generates energy.
Figure 4.A simplified RED diagram.
3. Salinity Gradient Energy Potential In India
Indian rivers provides a high amount of fresh water discharge that flows into the sea . Its volume is
approximately 23 x10³ m³/sec. This volume of fresh water is capable to produce power of the magnitude 54.8
x10³ MW.
PRO technique provides 50 % efficiency
Hydraulic Pressure Head = 0.5 Osmotic Pressure
Diffrence
PRO and RED techniques are applicable because of the low cost of membranes associated and less complexity
regarding the installation & maintainance.
Indian rivers discharge of fresh water :-
a) East Coast :- 1) Rivers discharging in Bay of Bengal.
2) Volume of fresh water : 16.6 x 10³ m³/sec.
3) High Osmotic Pressure : 24 atm.
4) Salinity Less than 34 %.
5) Power Estimated : 39.9 x 10³ m³/sec.
a) West Coast :- 1) Rivers discharging in Arabian Sea.
2) Volume of fresh water : 5.9 x 10³ m³/sec.
3) High Osmotic Pressure : 25 atm.
Proceedings of the National Conference on
Trends and Advances in Mechanical Engineering
(TAME-2017) March 16-17, 2017 ISBN 978-93-5268-269-0
YMCA University of Science & Technology, Faridabad, Haryana
17
4) Salinity Less than 35 %.
5) Power Estimated : 14.9 x 10³ m³/sec.
This data shows the immense power of the salinity gradient energy available in the indian subcontinent. Data
shown is estimated on the basis of extraction techniques Pressure Retarded Osmosis PRO and Reversed Electro
dialysis RED.
4.Conclusion
This Paper is an attempt to appraise the salinity gradient energy in the indian coastal regions. The Two
important tecniques PRO and RED seems viable. Plants have to be installed near the river ends as it decrease the
pumping cost. The salinity gradient energy is an important renewable energy source with immense capability to
cater the high electricity generation demands in future. It has immense capability to cater the Power demands in
comparison to the other renewable sources of energy.
References
[1] Kuleszo JT. The global and regional potential of salinity-gradient power. Dept. Environmental Sciences,
Environmental Systems Analysis Group. Wageningen University and Research centre; 2008.
[2] Wick GL, Schmitt WR. Prospects for renewable energy sea. Mar. Technol. Soc. J., 1997; 11:16-21.
[3] Energy Information Administration. [Online]. Avalable: http://www.eia.doe.gov [6] Loeb S. Osmotic
power plants. Science, 1975; 189:654-655.
[4] Loeb S. Production of energy from concentrated brines by pressure retarded osmosis. 1. Preliminary
technical and economic correlations. J. Membr. Sci., 1976; 1:49-63.
[5] Pattle RE. Electricity from fresh and salt water—without fuel.Chem. Proc. Eng., 1955; 35:351–354.
[6] Pattle RE. Improvements to electric batteries. Patent GB 731729 (1955).
[7] Pattle RE. Production of electric power by mixing fresh and salt water in the hydroelectric pile. Nature,
1954; 174:660.
[08] Olsson M, Wick GL, Isaacs JD. Salinity gradient power-utilizing vapor-pressure differences. Science,
1979; 206:452-454.
[09] Finley W, Pscheidt E. Hydrocratic generator. US Patent 6,313,545 B1 (2001).
[10] Sussman MW, Katchalsky A, Mechachemical turbine: a new power cycle.Science, 1970; 167:45-47.
[11] Lagger G, Jensen H, Josserand J, Girault HH.Hydro-voltaic cells. Part 1. Concentration cells. J.
Electroanal. Chem., 2003; 5445:1-6.
[12] Kniajev V. Energy of salinity gradient-new source of energy with minimal environmental impact. In:
Abstracts from the International Workshop “Result of Fundamental Research for Investments”
(IWRFRI’2001’), 2001.
[13] Pattle RE. Production of electric power by mixing fresh and salt water in the hydroelectric pile. Nature,
1954; 174: 660.
[14] Post JW, Veerman J ,Hamelers HVM, Euverink GJW, Metz SJ, Nymeijer DC, Buisman CJN. Salinity-
gradient power: Evaluation of pressure-retarded osmosis and reverse electrodialysis. J of Membr. Sci., 2007;
288(1-2): 218–230.

Proceedings of the National Conference on
Trends and Advances in Mechanical Engineering
(TAME-2017) March 16-17, 2017 ISBN 978-93-5268-269-0
YMCA University of Science & Technology, Faridabad, Haryana
18
[15] Forgacs C. Recent developments in the utilization of salinity power. Desalination, 1982; 40:191–195.
[16] Audinos R. Electric-power produced from 2 solutions of unequal salinity by reverse electrodialysis.Indian
J. Chem., Sect. A: Inorg. Bio-Inorg., Phys., Theor., Anal. Chem., 1992; 31:348-354.
[17] Jagur-Grodzinski J, Kramer J, Novel R. Process for direct conversion of free-energy of mixing into
electric-power.Ind. Eng. Chem. Process Des. Dev., 1986, 25(2):443–449.
[18] Murphy GW. Office of saline research and development report 4. U.S. Government Printing Office,
Washington, DC (1956).
[19] Lacey RE. Symposium on saline water conversion.National Academy of Sciences/National Research
Council Publication, Washington, DC; 1958.
[20] Lacey R.E. Dechema-Monagr. 47, 673 (1962)
[21] Weinstein I, Leitz F. Electric power from differences insalinity: the dialytic battery. Science, 1976,
191:557.
[22] Forgacs C. Generation of electricity by reverse electrodialysis (RED). Ben-Gurion University of the Negev,
Israel; 1975.
[23] Emren A, Bergstrom S. Miami lnt. Conf. on Alternative Energy Sources, 1977:887.
[24] Loeb S. Large-scale power production by pressure-retarded osmosis, using river water and sea water
passing through spiral modules. Desalination, 2002; 143(2):115-122.
[25] BromIey L, Singh S, Ray P, Srivhar S, Read S.Am. Inst. Chem. Engng J., 1971; 20:326.
[26] Amjad Z. Reverse osmosis membrane technology. In: Water Chemistry and Industrial Applications. New
York: Van Nostrand Reinhold, 1993.
[27] Skilhagen SE, Dugstad JE, Aaberg RJ. Pressure difference between waters with varying salt gradients
Osmotic power — power production based on the osmotic. Desalination, 2008; 220:476-482.
[28] Lee KL, Baker R, Lonsdale H. Membranes for power generation by pressure-retarded osmosis. J. of
Membr. Sci., 1981; 8:141-171.
[29] Lacey RE. Energy by reverse electrodialysis. Ocean Eng., 1980; 7:1-47.
[30] Ramon GZ, Feinberg BJ, Hoek EMV. Membrane-based production of salinity-gradient power.Energy &
Environmental
[31] Das Kesava V, RamaRaju V D. Estimation of Salinity Power Potential in India. Mahasagar- Bullitien Of
the National Insitute of Oceanography,19 (2) 1986, 113-118.

Proceedings of the National Conference on
Trends and Advances in Mechanical Engineering
(TAME-2017) March 16-17, 2017 ISBN 978-93-5268-269-0
YMCA University of Science & Technology, Faridabad, Haryana
19
A REVIEW ON HIGH PRESSURE PROCESSING (HPP) OF MILK
Siba Prasad Nayak1, Sudarshanna Kar
2, Vinkel Kumar Arora
3
1Research Scholar, National Institute of Food Technology Entrepreneurship & Management, Kundli, Haryana,
2Research Scholar, National Institute of Technology, Rourkela, India.
3Asst. Professor, National Institute of Food Technology Entrepreneurship & Management, Kundli, Haryana
Email:[email protected]
Abstract
In this paper high pressure processing (HPP) of milk is presented. High pressure processing of milk improves
its functional properties. High pressure processing of milk can reduce Escherichia coli, Listeria monocytogenes,
Staphylococcus aureus, Bacillus cereus, Pseudomonas fluorescens, Yersinia enterocolitica, Mycobacterium
avium, and Salmonella typhimurium in milk. However it has certain limitation towards its effect on milk
enzymes like plasmin, alkaline phosphatase, lactoperoxidase, xanthine oxidase, phosphohexoseisomerase, γ-
glutamyltransferase and lipase. This paper provides a review on the effect of HPP on milk and its effect on
various milk properties and enzymes.
Keywords: Milk, HPP, enzymes.
1. Introduction
High pressure processing generally uses pressure in range of 100-1000 MPa to process food products. High
pressure processing kills micro-organism was discovered in 1899. Hite investigated HPP as a means of
preserving milk in 1899, and later he extended his study to preserve fruits and vegetables (Hite, Giddings, and
Weakly, 1914). Due to lack of development in equipment design, it remained dormant for around 90 years. In
1900 first time, Meidiya launch high pressure processed foods in Japanese market. Due to its ability to
inactivate micro-organism as well as enzymes, with maintaining quality attributes, it is now being accepted by
more food companies to produce various HPP processed products like guacamole, fruit juices, oysters, raw
squids etc. Apart from food industries, it is more common to chemical, ceramic, carbon allotropy, steel/alloy,
composite materials and plastic industries. In food processing application it required much higher pressures,
faster cycling, high capacity and sanitation compared to non-food applications (Zimmerman and Bergman,
1993; Mertens and Deplace, 1993). HPP can inactivate some health related micro-organism like E. coli,
Salmonella, Listeria monocytogenes, Vibrio as well as food spoilage related organism like yeasts, molds, and
bacteria. Similarly HPP has significant effect over enzymes like Pectinmethylesterase (PME), Pectinesterase
(PE), Polygalacturonase (PG), Polyphenoloxidase(PPO), Peroxidase(POD) etc.
2. Microbial inactivation
It is thought that it does occur due to two reasons: (1) Protein denaturation: In bacteria, membrane bound
proteins are of fundamental importance. While doing HPP processing, this proteins denature. Thus microbial
inactivation happens. And (2) Cell injury: After pressurisation, during depressurisation cell membrane is
disrupted leading to the leakage of cell content, followed by cell death. Generally HPP causes a number of
changes in microbial cell like, changes in morphology, biochemical reaction, genetic mechanism, spore coats,
and cell membrane. These all are supposed to cause cell death.Research on microbial inactivation by HPP has
been done many researchers i.e. Escherichia coli (Isaacs et al, 1995), Listeria monocytogenes (Styles et al,
1991), Staphylococcus aureus (Patterson et al, 1995), Bacillus cereus (McClements et al, 2001), Pseudomonas
fluorescens (McClements et al, 2001), Yersinia enterocolitica (De Lampo-Castellvi et al, 2005), Mycobacterium
avium (Donaghy et al, 2007), and Salmonella typhimurium (Guan et al, 2005).
2.1 Factors affecting the microbial inactivation
Factor affecting microbial inactivation are: Intensity of pressure, Composition of medium, Composition of cell
membrane, Water activity, Treatment temperature, Stages of growth of micro-organism.
3. Enzyme inactivation
HPP treatment more than 300 MPa cause irreversible protein denaturation. Three dimensional configuration of
active site was affected due to pressure above 300MPa. This further leads to the changes in biological activity as

Proceedings of the National Conference on
Trends and Advances in Mechanical Engineering
(TAME-2017) March 16-17, 2017 ISBN 978-93-5268-269-0
YMCA University of Science & Technology, Faridabad, Haryana
20
well as substrate specificity. Tertiary structure which was mainly stabilised by electrostatic and hydrophobic
interaction, generally affected at pressure above 150- 200 MPa. Very often it was observed that pressure less
than 100 MPa cause enzyme activation, importantly monomeric enzyme like chymotrypsin and PPO (Buckow et
al., 2009). Order of resistivity of enzyme to HPP from less resistant to high resistant can be described as LOX,
lactoperoxidase, PME, lipase, alkaline phosphatase, catalase, PPO, and POD (Seyderhelm et al., 1996).It has
been observed that HPP has little effect on milk enzymes i.e. plasmin, alkaline phosphatase, lactoperoxidase,
xanthine oxidase, phosphohexoseisomerase, γ-glutamyltransferase and lipase 2001(Huppertz et al, 2010).
4. Effect of HPP on milk constituents and milk properties
Effect of HPP on milk is mostly depends on its influence on spatial arrangements of water molecules (Atkins,
1995). According to Le Chateliers principle as pressure will increase volume of the system will decrease and
hence volume reduction reactions are promoted and volume increase reactions are suppressed. It is also known
that milk mostly contain water and volume of the milk mostly influenced by volume of water; hence effect of
high pressure on milk mostly depends on its effect on spatial arrangement of water molecules. Considering milk
proteins, like globular whey protein, it unfolds under high pressure thus indicating amino acid residues getting
solvated under high pressure. However contrasting characters are observed in Rheomorphic caseins where lower
level of globular folding is observed and with β-casein micellisation is first suppressed up to 150 MPa and then
promoted at subsequent higher pressure thus indicating certain region of proteins get less solvated with increase
of pressure. Considering milk salt, Micellar calcium phosphate (MCP), its solubilisation increases with increase
in pressure and it was due to electrostrictive effect (Hubbard et al., 2002) and (Huppertz and De Kruif, 2007a).
The effect of HPP processing of milk and its effect on microbial and functional properties of milk is depicted in
the table 1.Considering skim milk, it was observed that with increase in pressure casein micelles disruption also
increases ((Kromkamp et al., 1996; Gebhart et al., 2005; Huppertz et al., 2006a, b; Huppertz and De Kruif,
2006, 2007b; Orlien et al., 2006; Huppertz and Smiddy, 2008). Above observation can be related to increase in
solubilisation of MCP with increase in pressure (Huppertz and De Kruif, 2006).Considering β-lactoglobulin (β-
Ig) under high pressure it was observed that it does not denature up to 100 MPa but as pressure increases further
β-lg denature and when it reaches 400 MPa, it was observed that 90% of β-Ig was denatured (Lopez-Fandino et
al., 1996; Gaucheron et al., 1997; Scollard et al., 2000; Huppertz et al., 2004a,c).
Considering α-lactalbumin (α-la), it was observed that pressure more than 400 MPa can only denature α-la and
at 800 MPa approximately 70% of α-la can be denatured (Huppertz et al., 2004a,c). Aforementioned results can
conclude that α-la is more pressure stable compared to β-Ig as more number of intra-molecular disulphide
bonds ((Hinrichs et al., 1996; Gaucheron et al., 1997) and no free sulphydral group (Lopez- Fandino et al., 1996
) is found in α-la.Fat globule size in bovine milk is not affected significantly up to 600 MPa pressure in HPP
treatment (Huppertz et al., 2003; Ye et al., 2004). Similar result was also obtained by Gervilla et al., 2001 where
high pressure treatment of ewes’ milk at 500 MPa had no effect on fat globule size.
In case of cream milk (30% fat) it was observed that fat globule size was increased when it was HPP treated for
10 min at 800 MPa (Kanno et al., 1998) but no effect was observed when treated at temperature lower than 40
C and in the pressure range of 100-600MPa (Dumay et al., 1996; Kanno et al., 1998).
Whipping properties of cream was improved with decrease in whipping time and reduce in serum loss following
high pressure processing of milk at 500-600 MPa pressure for 1-2 minute. Above result was may be due to
improved crystallisation of milk fat under high pressure (Eberhard et al, 1999). HPP treatment of milk also does
not rupture milk fat globule membrane (MFGM) when processed at up to 800 MPa pressure but aggregation of
MFGM was observed following High pressure treatment (Kanno et al., 1998). Due to aforementioned
advantages of HPP processing of milk, it can used to prepare yoghurt, cheese, ice-cream, and butter with
improved micro-structure and texture.
Table 1 HPP processing of milk and its effect on microbial and functional properties of milk
Product Pressur
e
(MPa)
Processin
g time
(Min)
Temperatur
e
(0C)
References Parameters
Analysed
Result obtained
Milk 250-900 5 15 (Rodríguez-
Alcalá,
Castro-
Gómez,
Neutral, polar
lipids and fatty
acids
No significant
changes in the fat
composition and
lipid classes

Proceedings of the National Conference on
Trends and Advances in Mechanical Engineering
(TAME-2017) March 16-17, 2017 ISBN 978-93-5268-269-0
YMCA University of Science & Technology, Faridabad, Haryana
21
Product Pressur
e
(MPa)
Processin
g time
(Min)
Temperatur
e
(0C)
References Parameters
Analysed
Result obtained
Felipe,
Noriega, &
Fontecha,
2015)
Reconstitute
d milk 200-600 40 70 (Silva, 2015) Psychrotropic
Bacillus cereus
spore
inactivation
HPP technology
further increase
thermal
inactivation of
B.cereus spore
Human milk 400-600 5 12 (Permanyer
et al., 2010)
Immunoglobulin
A content
IgA retention
was 87.9 % and
69.3 % at 500
and 600 MPa
respectively
Milk 200-400 10-110 3-21 (Pandey,
Ramaswamy
, & St-
Gelais,
2003)
Rennet
coagulation
Mean
coagulation rate
0.0034 min-1
(72
min, 275 MPa,
14 0C)
Milk 550 5 25 (Koseki,
Mizuno, &
Yamamoto,
2008)
Effect of mild
heat treatment
following hpp
treatment on
Bacterial growth
during storage
Mild heat of 37 0C for 240 min
following hpp
treatment results
no recovery of L.
monocytogenes
during storage at
25 0C for 70 days
Milk 100-700 Up to 30 - (Kelly,
Kothari,
Voigt, &
Huppertz,
2009)
Effect on milk
salts, caseins and
caesin micelles,
whey proteins,
milk fat
HPP induces
significant effect
on milk salt, high
pressure induces
disruption of
caesin micelles,
more
denaturation of
whey protein at
higer pressure
value, and no
effect on fat
globule size.
Milk 500 10 20 (Linton et al.
2008)
Inactivation of L.
monocytogenes
Not detected in
camembert
cheese prepared
from milk treated
with mentioned
conditions
Milk 483, 676 5 10-40 (San Martin-
Gonzales et
al. 2007)
Rheological
properties of
cheddar cheese
prepared from
milk treated with
More solid like
behavoiur as it is
having high
moisture and

Proceedings of the National Conference on
Trends and Advances in Mechanical Engineering
(TAME-2017) March 16-17, 2017 ISBN 978-93-5268-269-0
YMCA University of Science & Technology, Faridabad, Haryana
22
Product Pressur
e
(MPa)
Processin
g time
(Min)
Temperatur
e
(0C)
References Parameters
Analysed
Result obtained
mentioned
conditions
proteion content
Milk 345, 586 15 - (Drake et al.
1997)
Textural and
sensorial
properties of
cheddar cheese
Weak texture
and high acid,
bitter, whey taint
and lower
flavour
Mil;k 500 15 20 (Buffa et al.
2005)
Effect on
proteolysis
Following reuslts
are obtained
during ripening
of cheese, Higher
β-lactoglobulin,
faster proteolysis
of αS1 and β-CN
and higher level
arginine
Milk 400 20 20 (Sandra et al.
2004)
Yield and
moisutre content
of cheese
prepared from
mentioned
conditions
Increase in both
yield and
moisture content
of Queso-fresco
cheese
Milk 400 15 22 (Molina et
al. 2000)
Yield and
moisutre content
of cheese
prepared from
mentioned
conditions
Higher texture
score as well as
higher yield and
mositure content
in cheese
Milk 400-600 3-6 10 (Contador,
Delgado-
Adámez,
Delgado,
Cava, &
Ramírez,
2013)
Immunoglobulin
s and leukocyte
contents of
human milk
Processing at
400 MPa (3 or 6
min) manitain
original level of
Immunoglobulin
s in mlik but in
contrast it was
reduced when
treated at 600
MPa.
Milk 450, 600 15 18-20 (Bull,
Hayman,
Stewart,
Szabo, &
Knabel,
2005)
Effect of growth
temperature, type
of milk, type of
recovery
enrichment
media, storage
temp. and
storage time on
recovery of L.
monocytogenes
PSU broth
distinctly
increased the
recovery of
bactrial growth.
Storage at 15 0C
incrases the rate
of recovery
Proceedings of the National Conference on
Trends and Advances in Mechanical Engineering
(TAME-2017) March 16-17, 2017 ISBN 978-93-5268-269-0
YMCA University of Science & Technology, Faridabad, Haryana
23
Conclusion
High pressure processing of milk induces various changes in milk system like inactivation of micro-organism
and enzymes, improving whipping properties of cream, disruption of casein micelles, denaturation of β-
lactoglobulin (β-Ig) and α-lactalbumin (α-la) and solubilisation of milk salts. Although it is an expensive
technology it has got better benefits compared to thermal processing. More research needs to be carried out to
improve enzyme inactivation by HPP as enzymes are more resistant to high pressure. HPP of milk can
manufacture varieties of milk products with improved functional properties i.e. yoghurt, cheese, ice-cream, and
butter.
References:
Bull, M. K., Hayman, M. M., Stewart, C. M., Szabo, E. a, & Knabel, S. J. (2005). Effect of prior growth
temperature, type of enrichment medium, and temperature and time of storage on recovery of Listeria
monocytogenes following high pressure processing of milk. International Journal of Food Microbiology,
101(1), 53–61. http://doi.org/10.1016/j.ijfoodmicro.2004.10.045
Contador, R., Delgado-Adámez, J., Delgado, F. J., Cava, R., & Ramírez, R. (2013). Effect of thermal
pasteurisation or high pressure processing on immunoglobulin and leukocyte contents of human milk.
International Dairy Journal, 32(1), 1–5. http://doi.org/10.1016/j.idairyj.2013.03.006
Kelly, A. L., Kothari, K. I., Voigt, D. D., & Huppertz, T. (2009). 16 - Improving technological and functional
properties of milk by high-pressure processing. Dairy-Derived Ingredients, 417–441.
http://doi.org/http://dx.doi.org/10.1533/9781845697198.3.417
Koseki, S., Mizuno, Y., & Yamamoto, K. (2008). Use of mild-heat treatment following high-pressure
processing to prevent recovery of pressure-injured Listeria monocytogenes in milk. Food Microbiology, 25(2),
288–293. http://doi.org/10.1016/j.fm.2007.10.009
Pandey, P. K., Ramaswamy, H. S., & St-Gelais, D. (2003). Effect of high pressure processing on rennet
coagulation properties of milk. Innovative Food Science & Emerging Technologies, 4(3), 245–256.
http://doi.org/10.1016/S1466-8564(03)00034-1
Permanyer, M., Castellote, C., Ramírez-Santana, C., Audí, C., Pérez-Cano, F. J., Castell, M., … Franch, a.
(2010). Maintenance of breast milk Immunoglobulin A after high-pressure processing. Journal of Dairy
Science, 93(3), 877–883. http://doi.org/10.3168/jds.2009-2643
Rodríguez-Alcalá, L. M. M., Castro-Gómez, P., Felipe, X., Noriega, L., & Fontecha, J. (2015). Effect of
processing of cow milk by high pressures under conditions up to 900MPa on the composition of neutral, polar
lipids and fatty acids. LWT - Food Science and Technology, 62(1), 265–270.
http://doi.org/10.1016/j.lwt.2014.12.052
Silva, F. V. M. (2015). High pressure processing of milk: Modeling the inactivation of psychrotrophic Bacillus
cereus spores at 38–70°C. Journal of Food Engineering, 165, 141–148.
http://doi.org/10.1016/j.jfoodeng.2015.06.017
Huppertz T and De Kruif C G (2007a). High pressure-induced solubilisation of micel- lar calcium phosphate
from cross-linked casein micelles.Colloid Surface A, 295, 1–3, 264–268.
Huppertz T and De Kruif C G (2007b). Disruption and reassociation of casein micelles during high pressure
treatment: Influence of whey proteins.J Dairy Res, 74, 194–197.
Kanno C, Uchimura T, Hagiwara T, Ametani M and Azuma N (1998). Effect of hydrostatic pressure on the
physicochemical properties of bovine milk fat globules and the milk fat globule membrane. In Isaacs N S, High
Pressure Food Science, Bioscience and Chemistry, The Royal Society of Chemistry, Cambridge, 182–192.
Dumay E, Lambert C, Funtenberger S and Cheftel J C (1996).Effects of high pressure on the physico-chemical
characteristics of dairy creams and model oil/water emulsions.Lebensm-WissTechnol, 29, 606–625.
Eberhard P, Strahm W and Eyer H (1999). High pressure treatment of whipped cream, AgrarForschung, 6, 352–

Proceedings of the National Conference on
Trends and Advances in Mechanical Engineering
(TAME-2017) March 16-17, 2017 ISBN 978-93-5268-269-0
YMCA University of Science & Technology, Faridabad, Haryana
24
354.
López-Fandiño R, Carrascosa A V and Olano A (1996). The effects of high pressure on whey protein
denaturation and cheese-making properties of raw milk.J Dairy Sci, 79, 929–936.
Gaucheron F, Famelart M H, Mariette F, Raulot K, Michel F and Le Graet Y (1997). Combined effects of
temperature and high-pressure treatments on physicochemical characteristics of skim milk.Food Chem, 59, 439–
447.
Hinrichs J, Rademacher B and Kessler H G (1996). Reaction kinetics of pressure- induced denaturation of whey
proteins.Milchwissenschaft, 51, 504–509
Proceedings of the National Conference on
Trends and Advances in Mechanical Engineering
(TAME-2017) March 16-17, 2017 ISBN 978-93-5268-269-0
YMCA University of Science & Technology, Faridabad, Haryana
25
DESIGN OF MULTIEJECTOR REFRIGERATION SYSTEM FOR
CONSTANT ENTRAINMENT RATION AND ITS EFFECT ON COP OF
SYSTEM
Varun Saini
1, Gulshan Sachdeva
2
1,2Department of Mechanical Engineering, National Institution of Technology
Kurukshetra Haryana 136119
Phone: 9896068777, email:[email protected]
Abstract
Ejector refrigeration system utilizes the low grade energy like solar energy or industrial waste heat as energy
input. In this paper multiejector is used for constant entrainment ratio with refrigerant R141b.. Ejector may
perform well as long as condenser pressure is below the discharge pressure. However, even a slight increase
above such a pressure will cause the ejector efficiency to drop to practically zero and also cease to operate. By
the use of multiejector in parallel arrangement, we can obtain continuous working of system for different
pressure range. The condenser pressure governs the selection of operating ejector. Constant entrainment is
provided by changing the area ratio.
Keywords: Multiejector, Refrigerant; 141b, Entrainment Ratio, Performance
Nomenclature: Subscripts
A: Area (m2) as:After normal shock
D: Diameter (m) bs:Before normal shock
ER: Ejector refrigeration system c: Diffuser outlet
d: diffuser
h: Enthalpy (kj/Kg) e: Secondary inlet
M: Machnumber g:Primary nozzle inlet
P: Pressure (MPa) m:Mixing chamber
Q: Heat transfer ((kj/Kg) ms:At beginning of mixing process
T: Temperature (K) P1:At outlet of primary nozzle
V:Velocity (m/s) Py:Primaryfluid at hypothetical throat
𝜂: Isentropic efficiency
p: primary nozzle
sy:Secondary fluid at hypothetical t: Throat
VCR:Vapor compression
Refrigeration
s: Suction chamber
𝜌:Density (Kg/m3)
𝜔:Eentrainment ratio
ṁ:Mass flow rate (Kg/s)
Introduction As we know refrigeration is process of absorb heat from low temperature by refrigerant to lowering the
temperature of system and reject that heat to high temperature (atmosphere). In VCRS (vapor compression
system) compressor is used to increase the pressure. For working of compressor in conventional vapour
compression system high grade energy such as electricity. In ERS (ejector refrigeration system) ejectors are
used instead of compressor to increase the pressure of refrigerant up to condenser pressure without any moving
part. Ejector refrigeration system or air-conditioning system is powered by low grade energy. Low grade energy
may be in the form of heat like as solar energy, industrial waste heat. COP of ejector refrigeration system is very
low as compare to VCRS. But running cost of ERS is low because it uses waste heat or solar energy that’s why
it is economical to use. Performance of ERS system depends on the well design of ejector and its performance.
For analysis of ejector performance Keenan et al [1]assumed that mixing of two streams takes place inside the
suction chamber with a constant or uniform pressure from exit of nozzle to inlet of constant area section.
Munday and Bagster[3] assumed the primary flow fans out without mixing with entrained flow. This duct as
converging nozzle such that entrains flow is accelerated to a sonic velocity at some region. After that, mixing of
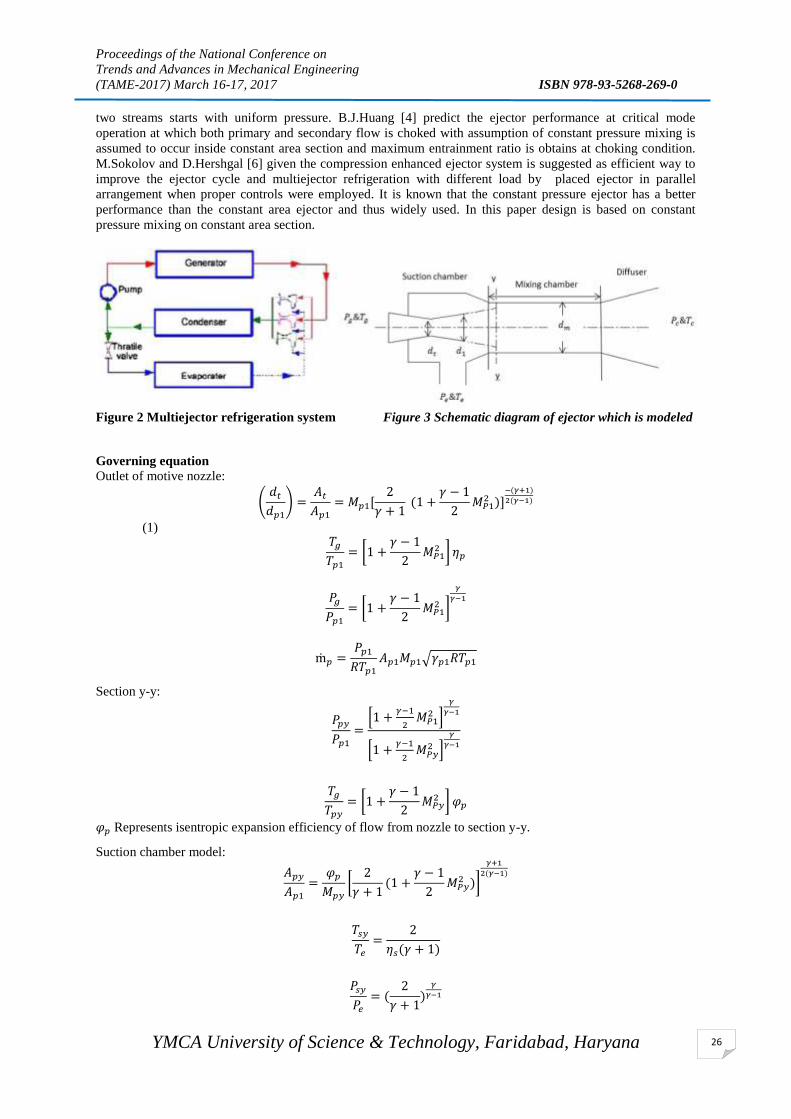
Proceedings of the National Conference on
Trends and Advances in Mechanical Engineering
(TAME-2017) March 16-17, 2017 ISBN 978-93-5268-269-0
YMCA University of Science & Technology, Faridabad, Haryana
26
two streams starts with uniform pressure. B.J.Huang [4] predict the ejector performance at critical mode
operation at which both primary and secondary flow is choked with assumption of constant pressure mixing is
assumed to occur inside constant area section and maximum entrainment ratio is obtains at choking condition.
M.Sokolov and D.Hershgal [6] given the compression enhanced ejector system is suggested as efficient way to
improve the ejector cycle and multiejector refrigeration with different load by placed ejector in parallel
arrangement when proper controls were employed. It is known that the constant pressure ejector has a better
performance than the constant area ejector and thus widely used. In this paper design is based on constant
pressure mixing on constant area section.
Figure 2 Multiejector refrigeration system Figure 3 Schematic diagram of ejector which is modeled
Governing equation
Outlet of motive nozzle:
(𝑑𝑡
𝑑𝑝1
) =𝐴𝑡
𝐴𝑝1
= 𝑀𝑝1[2
𝛾 + 1 (1 +
𝛾 − 1
2𝑀𝑃1
2 )]−(𝛾+1)
2(𝛾−1)
(1) 𝑇𝑔
𝑇𝑝1
= [1 +𝛾 − 1
2𝑀𝑃1
2 ] 𝜂𝑝
𝑃𝑔
𝑃𝑝1
= [1 +𝛾 − 1
2𝑀𝑃1
2 ]
𝛾
𝛾−1
ṁ𝑝 =𝑃𝑝1
𝑅𝑇𝑝1
𝐴𝑝1𝑀𝑝1√𝛾𝑝1𝑅𝑇𝑝1
Section y-y:
𝑃𝑝𝑦
𝑃𝑝1
=[1 +
𝛾−1
2𝑀𝑃1
2 ]
𝛾
𝛾−1
[1 +𝛾−1
2𝑀𝑃𝑦
2 ]
𝛾
𝛾−1
𝑇𝑔
𝑇𝑝𝑦
= [1 +𝛾 − 1
2𝑀𝑃𝑦
2 ] 𝜑𝑝
𝜑𝑝 Represents isentropic expansion efficiency of flow from nozzle to section y-y.
Suction chamber model:
𝐴𝑝𝑦
𝐴𝑝1
=𝜑𝑝
𝑀𝑝𝑦
[2
𝛾 + 1(1 +
𝛾 − 1
2𝑀𝑃𝑦
2 )]
𝛾+1
2(𝛾−1)
𝑇𝑠𝑦
𝑇𝑒
=2
𝜂𝑠(𝛾 + 1)
𝑃𝑠𝑦
𝑃𝑒
= (2
𝛾 + 1)
𝛾
𝛾−1

Proceedings of the National Conference on
Trends and Advances in Mechanical Engineering
(TAME-2017) March 16-17, 2017 ISBN 978-93-5268-269-0
YMCA University of Science & Technology, Faridabad, Haryana
27
𝐴𝑠𝑦 = 𝐴𝑚 − 𝐴𝑝𝑦
ṁ𝒔 =𝑃𝑠𝑦
𝑅𝑇𝑠𝑦
𝐴𝑠𝑦√𝛾𝑅𝑇𝑠𝑦
𝜔 =ṁ𝒔
ṁ𝒑
Mixing chamber model:
𝑃𝑚𝑠 = 𝑃𝑝𝑦 = 𝑃𝑠𝑦
The static temperature of the mixed fluid is determined by using the energy balance equation written below:
ṁ𝒑𝐶𝑝𝑇𝑝𝑦 + ṁ𝒔𝐶𝑝𝑇𝑠𝑦 = (ṁ𝒑 + ṁ𝒔)𝐶𝑝𝑇𝑚𝑠
The average velocity of the flow after mixing is given by momentum conservation principle:
ṁ𝒑𝑉𝑝𝑦 + ṁ𝒔𝑉𝑠𝑦 = (ṁ𝒑 + ṁ𝒔)𝑉𝑚𝑠
𝑉𝑝𝑦 = 𝑀𝑝𝑦√𝛾𝑅𝑇𝑝𝑦
𝑉𝑠𝑦 = √𝛾𝑅𝑇𝑠𝑦
𝑀𝑚𝑠 =𝑉𝑚𝑠
√𝛾𝑅𝑇𝑚𝑠
Friction in mixing chamber
𝐿𝑚
𝑑𝑚
𝐹𝑚 = [𝛾 + 1
2 𝛾] ln [
1 +(𝛾−1)
2𝑀𝑏𝑠
2
1 +(𝛾−1)𝑀𝑚𝑠
2
2
] −1
𝛾[
1
𝑀𝑏𝑠2 −
1
𝑀𝑚𝑠2
] − [𝛾 + 1
2𝛾] 𝑙𝑛 [
𝑀𝑏𝑠2
𝑀𝑚𝑠2
]
1
√𝑓=
2
2.303𝑙𝑛[𝑅𝑒𝑐𝑎√𝑓𝑚] − 0.8
𝑅𝑒𝑐𝑎 = 𝜌𝑐𝑎 .𝑉𝑚𝑠
𝜇𝑐𝑎
𝑇𝑏𝑠
𝑇𝑚𝑠
=1 +
(𝛾−1)𝑀𝑚𝑠2
2
1 +(𝛾−1)
2𝑀𝑏𝑠
2
𝑃𝑏𝑠
𝑃𝑚𝑠
=𝑀𝑚𝑠
𝑀𝑏𝑠√[(1 + ((𝛾 − 1)𝑀_𝑚𝑠^2)/2)/(1 + ((𝛾 − 1))/2 𝑀_𝑏𝑠^2 )]
𝑀𝑎𝑠2 =
(𝛾 − 1)𝑀𝑏𝑠2 + 2
2𝛾𝑀𝑏𝑠2 − (𝛾 − 1)
And the equations after shock are now given by:
𝑇𝑎𝑠
𝑇𝑏𝑠
= [2 + 𝑀𝑏𝑠2 (𝛾 − 1)]
2𝛾𝑀𝑏𝑠2 − (𝛾 − 1)
𝑀𝑏𝑠2 (𝛾 − 1)2
𝑃𝑎𝑠
𝑃𝑏𝑠
=1
𝛾 + 1[2𝛾𝑀𝑏𝑠
2 − (𝛾 − 1)]
Diffuser model:
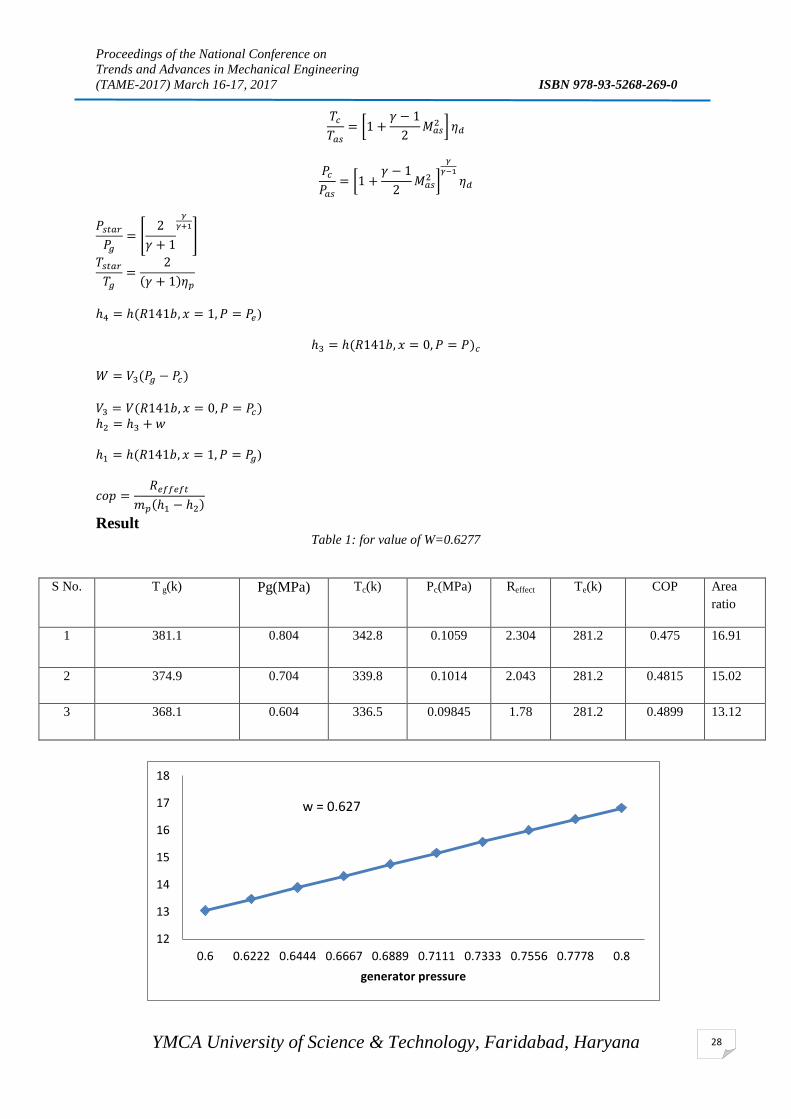
Proceedings of the National Conference on
Trends and Advances in Mechanical Engineering
(TAME-2017) March 16-17, 2017 ISBN 978-93-5268-269-0
YMCA University of Science & Technology, Faridabad, Haryana
28
𝑇𝑐
𝑇𝑎𝑠
= [1 +𝛾 − 1
2𝑀𝑎𝑠
2 ] 𝜂𝑑
𝑃𝑐
𝑃𝑎𝑠
= [1 +𝛾 − 1
2𝑀𝑎𝑠
2 ]
𝛾
𝛾−1
𝜂𝑑
𝑃𝑠𝑡𝑎𝑟
𝑃𝑔
= [2
𝛾 + 1
𝛾
𝛾+1
]
𝑇𝑠𝑡𝑎𝑟
𝑇𝑔
=2
(𝛾 + 1)𝜂𝑝
ℎ4 = ℎ(𝑅141𝑏, 𝑥 = 1, 𝑃 = 𝑃𝑒)
ℎ3 = ℎ(𝑅141𝑏, 𝑥 = 0, 𝑃 = 𝑃)𝑐
𝑊 = 𝑉3(𝑃𝑔 − 𝑃𝑐)
𝑉3 = 𝑉(𝑅141𝑏, 𝑥 = 0, 𝑃 = 𝑃𝑐)
ℎ2 = ℎ3 + 𝑤
ℎ1 = ℎ(𝑅141𝑏, 𝑥 = 1, 𝑃 = 𝑃𝑔)
𝑐𝑜𝑝 =𝑅𝑒𝑓𝑓𝑒𝑓𝑡
𝑚𝑝(ℎ1 − ℎ2)
Result
Table 1: for value of W=0.6277
S No. T g(k) Pg(MPa) Tc(k) Pc(MPa) Reffect Te(k) COP Area
ratio
1 381.1 0.804 342.8 0.1059 2.304 281.2 0.475 16.91
2 374.9 0.704 339.8 0.1014 2.043 281.2 0.4815 15.02
3 368.1 0.604 336.5 0.09845 1.78 281.2 0.4899 13.12
12
13
14
15
16
17
18
0.6 0.6222 0.6444 0.6667 0.6889 0.7111 0.7333 0.7556 0.7778 0.8
generator pressure
w = 0.627
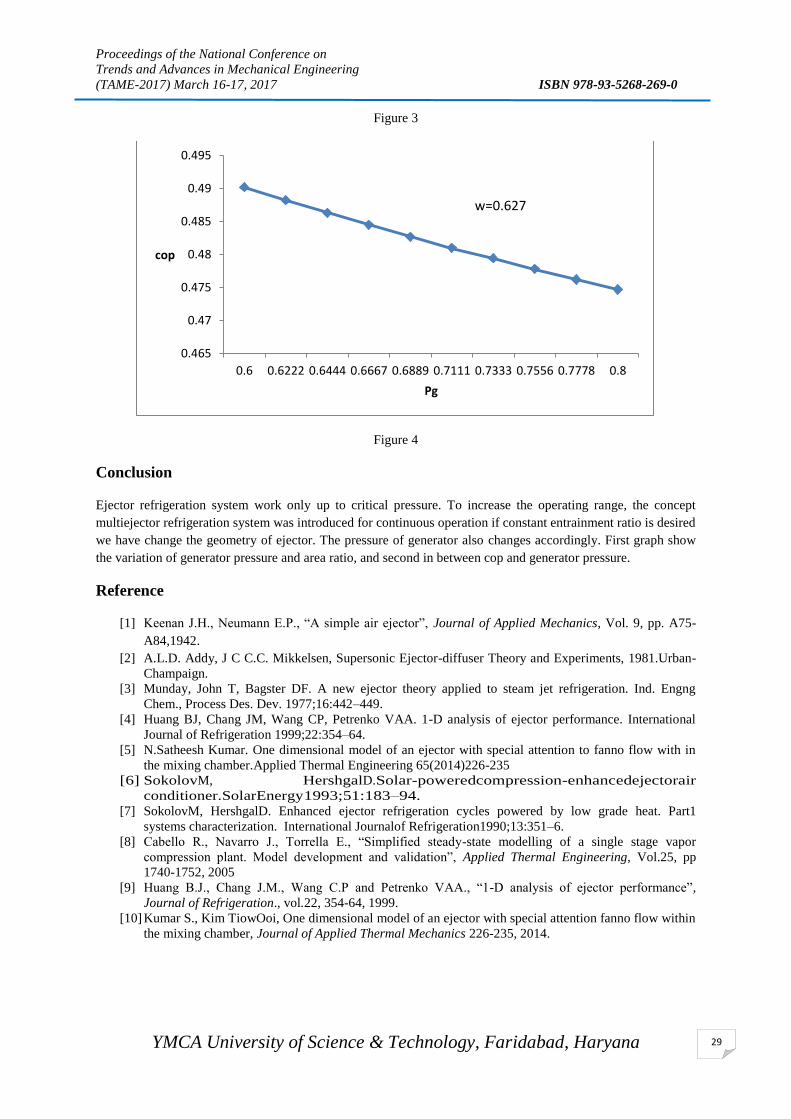
Proceedings of the National Conference on
Trends and Advances in Mechanical Engineering
(TAME-2017) March 16-17, 2017 ISBN 978-93-5268-269-0
YMCA University of Science & Technology, Faridabad, Haryana
29
Figure 3
Figure 4
Conclusion
Ejector refrigeration system work only up to critical pressure. To increase the operating range, the concept
multiejector refrigeration system was introduced for continuous operation if constant entrainment ratio is desired
we have change the geometry of ejector. The pressure of generator also changes accordingly. First graph show
the variation of generator pressure and area ratio, and second in between cop and generator pressure.
Reference
[1] Keenan J.H., Neumann E.P., “A simple air ejector”, Journal of Applied Mechanics, Vol. 9, pp. A75-
A84,1942.
[2] A.L.D. Addy, J C C.C. Mikkelsen, Supersonic Ejector-diffuser Theory and Experiments, 1981.Urban-
Champaign.
[3] Munday, John T, Bagster DF. A new ejector theory applied to steam jet refrigeration. Ind. Engng
Chem., Process Des. Dev. 1977;16:442–449.
[4] Huang BJ, Chang JM, Wang CP, Petrenko VAA. 1-D analysis of ejector performance. International
Journal of Refrigeration 1999;22:354–64.
[5] N.Satheesh Kumar. One dimensional model of an ejector with special attention to fanno flow with in
the mixing chamber.Applied Thermal Engineering 65(2014)226-235
[6] SokolovM, HershgalD.Solar-poweredcompression-enhancedejectorair
conditioner.SolarEnergy1993;51:183–94.
[7] SokolovM, HershgalD. Enhanced ejector refrigeration cycles powered by low grade heat. Part1
systems characterization. International Journalof Refrigeration1990;13:351–6.
[8] Cabello R., Navarro J., Torrella E., “Simplified steady-state modelling of a single stage vapor
compression plant. Model development and validation”, Applied Thermal Engineering, Vol.25, pp
1740-1752, 2005
[9] Huang B.J., Chang J.M., Wang C.P and Petrenko VAA., “1-D analysis of ejector performance”,
Journal of Refrigeration., vol.22, 354-64, 1999.
[10] Kumar S., Kim TiowOoi, One dimensional model of an ejector with special attention fanno flow within
the mixing chamber, Journal of Applied Thermal Mechanics 226-235, 2014.
0.465
0.47
0.475
0.48
0.485
0.49
0.495
0.6 0.6222 0.6444 0.6667 0.6889 0.7111 0.7333 0.7556 0.7778 0.8
cop
Pg
w=0.627

Proceedings of the National Conference on
Trends and Advances in Mechanical Engineering
(TAME-2017) March 16-17, 2017 ISBN 978-93-5268-269-0
YMCA University of Science & Technology, Faridabad, Haryana
30
KITCHEN WASTE: AN ALTERNATE SOURCE OF ENERGY
Navdeep Malhotra1 and Pankaj Singh Routela
2
1 Professor, Department of Mechanical Engineering, YMCA University of Science & Technology, Faridabad,
Haryana-121006, Phone: 9466175277, E-mail: [email protected]
2 M-tech 2
nd year, Department of Mechanical Engineering, YMCA University of Science & Technology,
Faridabad, Haryana-121006, Phone: 7065345032, E-mail: [email protected]
Abstract
Food waste is the second biggest class of municipal solid waste (MSW) sent to landfills in the vast majority
areas of the nation, In India representing roughly 18% of the waste stream alongside the other MSW. By putting
food waste into a landfill, we are simply squandering a significant asset. At the point when legitimately handled
food scraps can create renewable energy, improve the dirt as compost, and nourish creatures. Treating the soil
nourishment waste delivers characteristic manure, which can make more advantageous soil and decrease the
requirement for engineered composts. Through anaerobic assimilation, microorganisms can process the food
waste to generate methane, a significant energy source which we can use an alternative source of energy and
reduces the effect of global warming due to methane. This paper present an overview on the amount of kitchen
waste generated per day from hostel, industrial messes and each house of the society in Faridabad region &
corresponding potential in it for the generation of useful products like biogas, manure etc.
Keywords: Municipal Solid Waste (MSW), Food Waste, Kitchen Waste, Renewable energy
1. Introduction
Human activities create waste since they started living in the societies. In modern times, as the sizes of the town
and cities are increasing, waste generation rate by the human being is also increased in a very high magnitude
and thus to maintain a good hygienic condition in the society, collection and proper disposal of the waste is
necessary [K.R.Atali et al, 2015]. Everyday each household generates waste or garbage consisting of items
which are no longer needed or do not have any use, they all come under the category of waste and we usually
throw them away [Anuradha.S.Tanksali et al, 2014]. A major portion of the MSW is generated from urban areas
i.e. cities and bigger towns. India is primarily a country with a huge rural population. However, it is estimated
that about 40% of the Indian population will move towards urban areas by 2026. In India, 13 years ago, there
were 2.9 billion urban residents and each generating 0.64 kg/capita/day of MSW. Today, there are about 3.3
billion urban residents generating 1.25 kg/capita/day and it is estimated that these numbers will increase to 4.3
billion urban residents with 1.42 kg/capita/day of MSW by 2025 [A. Apte et al, 2013].MSW management is
becoming a critical problem in most of the megacities of the India and world as waste volume continues to rise,
which leads to the loss of resources and increased environmental risks [K.R.Atali et al, 2015]. Most of the solid
waste management professionals recognize that there is no single, simple solution to solid waste problems.
Instead an integrated approach, combining the elements of multiple techniques, is used in an increasing number
of cases [S. Uif, 1998, W.R Fromme, 1999]. Food or kitchen waste contributes in a large amount to municipal,
commercial and industrial waste [G. Tchobanoglous, et al, 2010]. Which continues to pose an environmental
and health issue in both industrialized and developing countries [B Shimelis, 2011].A study conducting on
global food waste by the Food and Agriculture Organization of the United Nation published in the year 2011
found that every year approx. 1/3rd
of total food produced for human consumption i.e. 1.3 billion tonnes goes to
waste. This food waste has the potential to generate 367 m3of biogas per dry tone at about 65% of methane
[N.Curry and P. Pillay, 2011]. Therefore we can utilize kitchen waste to generate biogas i.e. an alternate source
of energy through anaerobic digestion and it’s a viable economic option for the developing countries like India
[R. Agrahari and GN Tiwari, 2014], where landfilling is the most popular method for the disposal of Waste.
2. Municipal Solid Waste & its Classification
MSW is defined as any waste generated by household, commercial or institutional activities and is not
hazardous [P. Alonso and Themelis, 2011]. With rising urbanization and change in lifestyle & food habits of the
people, MSW generation rate is rapidly increasing and its composition changes continuously. In 1947 cities and
towns in India generated solid waste of around 6 million tonnes; in 1997 it was about 48 million tonnes. More
than 25 % of the MSW is not collected at all, 70% of the Indian cities lack adequate capacity to transport it and
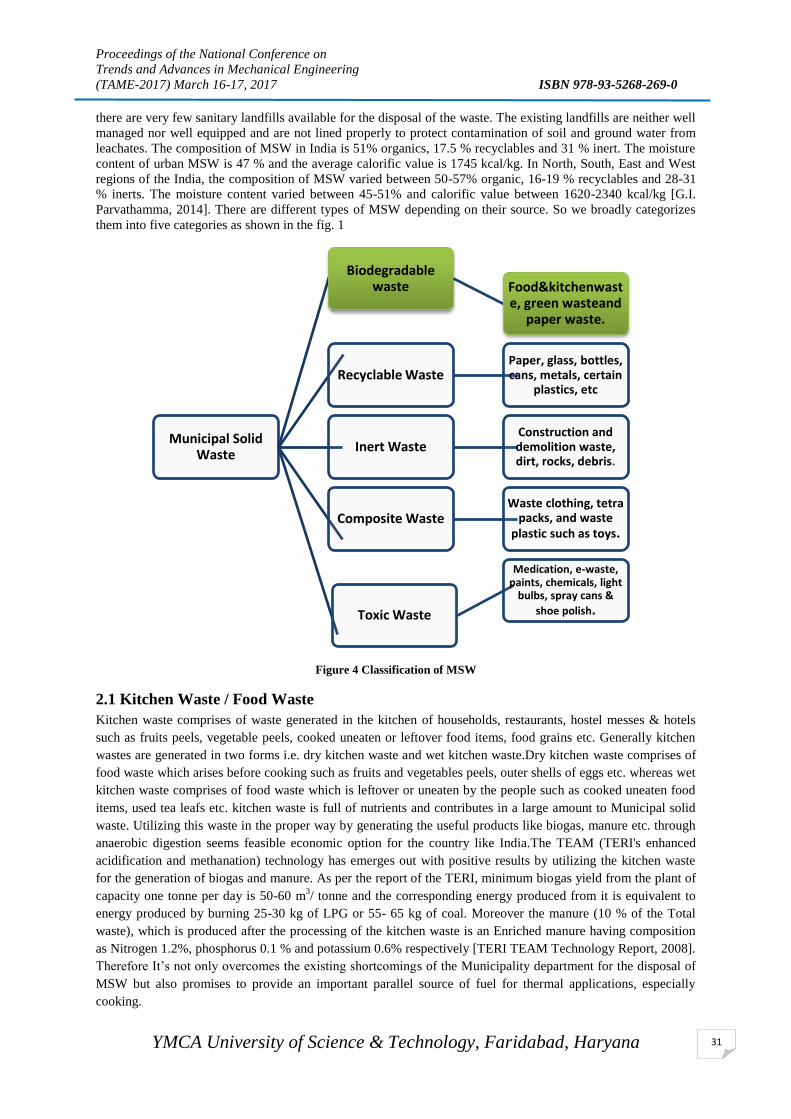
Proceedings of the National Conference on
Trends and Advances in Mechanical Engineering
(TAME-2017) March 16-17, 2017 ISBN 978-93-5268-269-0
YMCA University of Science & Technology, Faridabad, Haryana
31
there are very few sanitary landfills available for the disposal of the waste. The existing landfills are neither well
managed nor well equipped and are not lined properly to protect contamination of soil and ground water from
leachates. The composition of MSW in India is 51% organics, 17.5 % recyclables and 31 % inert. The moisture
content of urban MSW is 47 % and the average calorific value is 1745 kcal/kg. In North, South, East and West
regions of the India, the composition of MSW varied between 50-57% organic, 16-19 % recyclables and 28-31
% inerts. The moisture content varied between 45-51% and calorific value between 1620-2340 kcal/kg [G.I.
Parvathamma, 2014]. There are different types of MSW depending on their source. So we broadly categorizes
them into five categories as shown in the fig. 1
Figure 4 Classification of MSW
2.1 Kitchen Waste / Food Waste
Kitchen waste comprises of waste generated in the kitchen of households, restaurants, hostel messes & hotels
such as fruits peels, vegetable peels, cooked uneaten or leftover food items, food grains etc. Generally kitchen
wastes are generated in two forms i.e. dry kitchen waste and wet kitchen waste.Dry kitchen waste comprises of
food waste which arises before cooking such as fruits and vegetables peels, outer shells of eggs etc. whereas wet
kitchen waste comprises of food waste which is leftover or uneaten by the people such as cooked uneaten food
items, used tea leafs etc. kitchen waste is full of nutrients and contributes in a large amount to Municipal solid
waste. Utilizing this waste in the proper way by generating the useful products like biogas, manure etc. through
anaerobic digestion seems feasible economic option for the country like India.The TEAM (TERI's enhanced
acidification and methanation) technology has emerges out with positive results by utilizing the kitchen waste
for the generation of biogas and manure. As per the report of the TERI, minimum biogas yield from the plant of
capacity one tonne per day is 50-60 m3/ tonne and the corresponding energy produced from it is equivalent to
energy produced by burning 25-30 kg of LPG or 55- 65 kg of coal. Moreover the manure (10 % of the Total
waste), which is produced after the processing of the kitchen waste is an Enriched manure having composition
as Nitrogen 1.2%, phosphorus 0.1 % and potassium 0.6% respectively [TERI TEAM Technology Report, 2008].
Therefore It’s not only overcomes the existing shortcomings of the Municipality department for the disposal of
MSW but also promises to provide an important parallel source of fuel for thermal applications, especially
cooking.
Municipal Solid Waste
Biodegradable waste Food&kitchenwast
e, green wasteand paper waste.
Recyclable Waste Paper, glass, bottles, cans, metals, certain
plastics, etc
Inert Waste Construction and demolition waste, dirt, rocks, debris.
Composite Waste Waste clothing, tetra
packs, and waste plastic such as toys.
Toxic Waste
Medication, e-waste, paints, chemicals, light
bulbs, spray cans &
shoe polish.

Proceedings of the National Conference on
Trends and Advances in Mechanical Engineering
(TAME-2017) March 16-17, 2017 ISBN 978-93-5268-269-0
YMCA University of Science & Technology, Faridabad, Haryana
32
3. Materials and Methods
The research is carried out in the following way:
a) To identify the industries, institution and residential areas for sample study.
b) To prepare questionnaire for industrial and Institution messes to collect information about waste generations in
their respective messes.
c) To prepare questionnaire for the residential areas to collect information about waste generated in each house.
d) Use of questionnaires to understand the amount of waste actually generated and the feasibility of utilizing all the
waste for further research.
3.1 Questionnaire
Two types of questionnaires (for messes & residential areas) were prepared to collect information about waste
generation in the respective areas of the study. Questions in questionnaire were designed in such a way so as to
get basic information about the two important parameters of the waste generated i.e. quantity and disposal.
3.1.2 Questionnaire for industrial mess & institution mess
Table 1 Questionnaire for the mess
The questionnaire gave the basic idea about the amount of kitchen waste generated from the college and
industrial messes, which can be further processed to generate biogas through anaerobic assimilation.
Figure 5 Questionnaire for the Residents
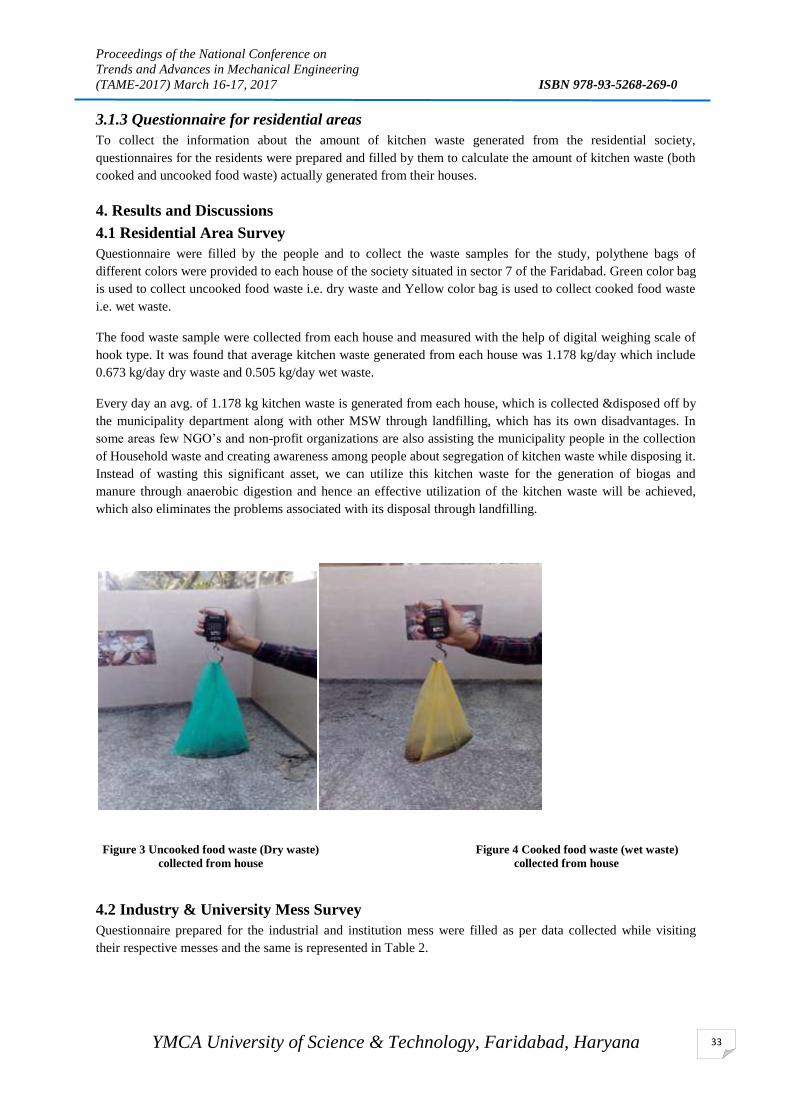
Proceedings of the National Conference on
Trends and Advances in Mechanical Engineering
(TAME-2017) March 16-17, 2017 ISBN 978-93-5268-269-0
YMCA University of Science & Technology, Faridabad, Haryana
33
3.1.3 Questionnaire for residential areas
To collect the information about the amount of kitchen waste generated from the residential society,
questionnaires for the residents were prepared and filled by them to calculate the amount of kitchen waste (both
cooked and uncooked food waste) actually generated from their houses.
4. Results and Discussions
4.1 Residential Area Survey
Questionnaire were filled by the people and to collect the waste samples for the study, polythene bags of
different colors were provided to each house of the society situated in sector 7 of the Faridabad. Green color bag
is used to collect uncooked food waste i.e. dry waste and Yellow color bag is used to collect cooked food waste
i.e. wet waste.
The food waste sample were collected from each house and measured with the help of digital weighing scale of
hook type. It was found that average kitchen waste generated from each house was 1.178 kg/day which include
0.673 kg/day dry waste and 0.505 kg/day wet waste.
Every day an avg. of 1.178 kg kitchen waste is generated from each house, which is collected &disposed off by
the municipality department along with other MSW through landfilling, which has its own disadvantages. In
some areas few NGO’s and non-profit organizations are also assisting the municipality people in the collection
of Household waste and creating awareness among people about segregation of kitchen waste while disposing it.
Instead of wasting this significant asset, we can utilize this kitchen waste for the generation of biogas and
manure through anaerobic digestion and hence an effective utilization of the kitchen waste will be achieved,
which also eliminates the problems associated with its disposal through landfilling.
4.2 Industry & University Mess Survey
Questionnaire prepared for the industrial and institution mess were filled as per data collected while visiting
their respective messes and the same is represented in Table 2.
Figure 3 Uncooked food waste (Dry waste)
collected from house
Figure 4 Cooked food waste (wet waste)
collected from house

Proceedings of the National Conference on
Trends and Advances in Mechanical Engineering
(TAME-2017) March 16-17, 2017 ISBN 978-93-5268-269-0
YMCA University of Science & Technology, Faridabad, Haryana
34
Table 2 Questionnaire Results
As observed from the questionnaire prepared, the quantity of waste generated from these 2 messes was different
due to various reasons. IOCL mess caters around 350 people three times in a day amounting for waste
generation as 0.357 kg per capita per day where as YMCAUST boys hostel mess caters around 500 students
living in a hostel three times in a day, which generates waste as 0.364 kg per capita per day respectively.
No proper method was followed by the YMCAUST boys hostel mess for the disposal of the waste, resulting in
bad odour and fly nuisance in and around campus.
5. Conclusion
Organic waste is the major constituent of MSW. Kitchen waste contributes in a large amount to organic waste.
As per the data received while conducting this research, everyday 1.178 kg of kitchen waste mostly organic
generated from each house of the society and approx. 125kg & 182kg kitchen waste i.e.0.361kg per capita per
person (combining the result of both mess) from the industrial and hostel messes respectively. By throwing this
large amount of kitchen waste into landfills increases the threats of global warming (as it emits methane during
decomposition) and brings various diseases along with them. Due to scarcity of land for the disposal of MSW
through landfilling is also a big problem of concern. Therefore, it is necessary for the countries like India to
search alternate methods for the disposal of MSW. Methods like composting, anaerobic digestion etc. can be
used for the disposal of kitchen waste in the colleges & industries premises as it does not required much
investment and Moreover these processes also converts organic waste into useful products like biogas, manure
etc. Further research in this area is also required to collect additional data and check the efficiency of the
processes for the generation of fuel from the kitchen waste.
References
Agrahari R and Tiwari GN, 2014, Comparative Study of Biogas Production: Utilization of Organic Waste,
International Journal of Environment and Resource.
Alonso P and Themelis, 2011, Generation and Disposition of Municipal Solid Waste in Mexico and Potential
for Improving Waste Management in Toluca Municipality, Waste-to-Energy Research andTechnology Council
(WTERT).
Apte A, Cheernam V, Kamat M, Kamat S, Kashikar P, and Jeswani H, 2013, Potential of Using Kitchen Waste
in a Biogas Plant, International Journal of Environmental Science and Development.
Atali K. R, Buha D.M, Bhavsar K.A, and Shah N.K, 2015, A Review on composting of Municipal Solid Waste,
IOSR Journal of Environmental Science, Toxicology and Food Technology (IOSR-JESTFT).
Curry N and Pillay P, 2011, Biogas prediction and design of a food waste to energy system for the urban
environment. Renewable Energy; 41:200-209.
Fromme W.R, 1999, Characterization of changes occurring in natural organic matter during the composting of a
synthetic compost and a municipal solid waste, Ph.D. Dissertation, University of Cincinnati, Cincinnati, USA.

Proceedings of the National Conference on
Trends and Advances in Mechanical Engineering
(TAME-2017) March 16-17, 2017 ISBN 978-93-5268-269-0
YMCA University of Science & Technology, Faridabad, Haryana
35
Parvathamma G.I, 2014, An analytical study on problems and policies of solid waste management in India-
special reference to Bangalore city, IOSR Journal of environmental science, toxicology and food
technology(IOSR-JESTFT).
Shimelis B, 2011, Generation Composition and Characteristics of Urban Solid Waste in a Major Khat Producing
and Marketing Area in Eastern Ethopia , International Journal of Environmental Protection.
Tanksali Anuradha,.Angadi Sridevi.S, Arwikar Asha, 2014, Treatment of kitchen waste by microbial culture,
IJRET: International Journal of Research in Engineering and Technology.
Tchobanoglous G, et al, 2010, Integrated Solid Waste Management, McGraw-Hill Inc, New York.
THE ENERGY AND RESOURCE INSTITUE (TERI) TEAM Process (TERI’s Enhanced Acidification and
Methanation Process) Report: A Tool to generate wealth from waste, 2008. [
www.teriin.org/ResUpdate/Team_Process_April_2008_Final.pdf ].
Uif S., 1998, systems analysis of waste management-the OWARE model, transport and compost sub-models.
Ph.D. Dissertation, Swedish University of agricultural sciences, Uppsala, Sweden.

Proceedings of the National Conference on
Trends and Advances in Mechanical Engineering
(TAME-2017) March 16-17, 2017 ISBN 978-93-5268-269-0
YMCA University of Science & Technology, Faridabad, Haryana
36
COMPARATIVE ANALYSIS OF EGR AND SCR SYSTEMS OF HIGH
END INDIAN AUTOMOBILE BRANDS TO FIND OUT ITS SOLUTION
Rohit Kumar Singh1; Aakash Sanghi
2; Aman Kumar
3; Abhay Chouhan
4
Vipin Kaushik5, Sumit Sharma
6
1,2,3,4 UG Student, ME Department, Amity University, Uttar Pradesh, Noida
5,6 Assistant Professor, ME Department, Amity University, Uttar Pradesh, NoidaAmity University, Uttar
Pradesh, Noida
Abstact
Currently in India, environmental air pollution is at peak especially in urban areas where passenger vehicles
remain major contributors and in few other localities with a high concentration of industries, manufacturing
plants and thermal power plants. Vehicle born GHG emissions are of particular concerns since these emissions
are ground level sources and thus have the significant impact on the health of general population in general and
local atmosphere in particular. Also, passenger as well as commercial vehicles contribute significantly to the
overall air pollution load in many urban localities. The chief sources, contributing to the progressively worse
air quality in Delhi NCR is vehicle born, that itself is accountable for approximately 70.00% of the overall air
pollution in the city. Air pollution through vehicle in capital has increased rapidly from 2.30 million in 1975
(MOEF, 1997) to 4.20 million in year 2004, which got estimated 7.20 million in 2016 on the behalf of transport
authority data which is obtained from Department of Transportation in 2004.
Keywords: Air Pollution; Automobile; EGR
1 Introduction
As of the intact overture of the new standard in the European countries the Euro-6 standard in September 2015
all fresh registerating diesel cars have to adhere to the new standard NOX emission limit that is 80 mg/km
drive, specially diesel light-duty vehicular emission certification cycle. While all such diesel powered car
companies have persauded to comply with the standard requirement during the standerdised laboratory test and
it is by now widely accepted that the “real-time” NOX emissions of numerous diesel passenger/utility cars are
considerably greater than the commissioned limits. This was one of the major reason behind the recent
amendments of the Euro 6 standard to make it compulsory for an on-road, real-driving emissions (RDE) test
with the help of portable emission measurement systems (PEMS) for the types approval of passenger cars in the
European countries. Indian authorities are also trying there level best to regulate emission levels of diesel
passanger vehicles as well as commercial utility diesel vehicles.Through this study, after in depth analysis of
Indian Passanger Diesel Vehicles, we identified following crucial points which are reasons of major concern.
The Problems related with air pollution Various emission Standards are there to regulate emissions of diesel passenger cars across the globe and India
have established emission limits that came in action, where CO2 is at the highest priority and for other emission
pollutants those effect the health adversely such as carbon monoxide, nitrogen oxide, particulate matter, and
total hydrocarbons pollutants. The limits for Indian emissions are coupled to a specific vehicle chassis
dynamometer test cycle, that is speed-time profile that is to be followed by the vehicle in an emissions check
laboratory, although its exhaust emissions are measured in factory site laboratory itself. But the passive test
carried out inside factory laboratory remain unable to detect the whole range of operating conditions that
vehicles encounters during practical use in real life. Similarly, the high levels of stringencies such as NOX
emission level for diesel passenger cars were reduced by 68.0% from Euro4 Standard to Euro6 Standard and
also lack of updations to the type-approval processes in some jurisdictions have encouraged engineering
strategies that ensure enhanced fuel efficiency and total compliance with the appropriate emission limits and
standards as long as the diesel vehicles are used within the narrow boundary conditions of the standardized test
performed in factory’s laboratory, but not necessarily during normal use conditions.
Availability of Fuel with Less Sulphur Content
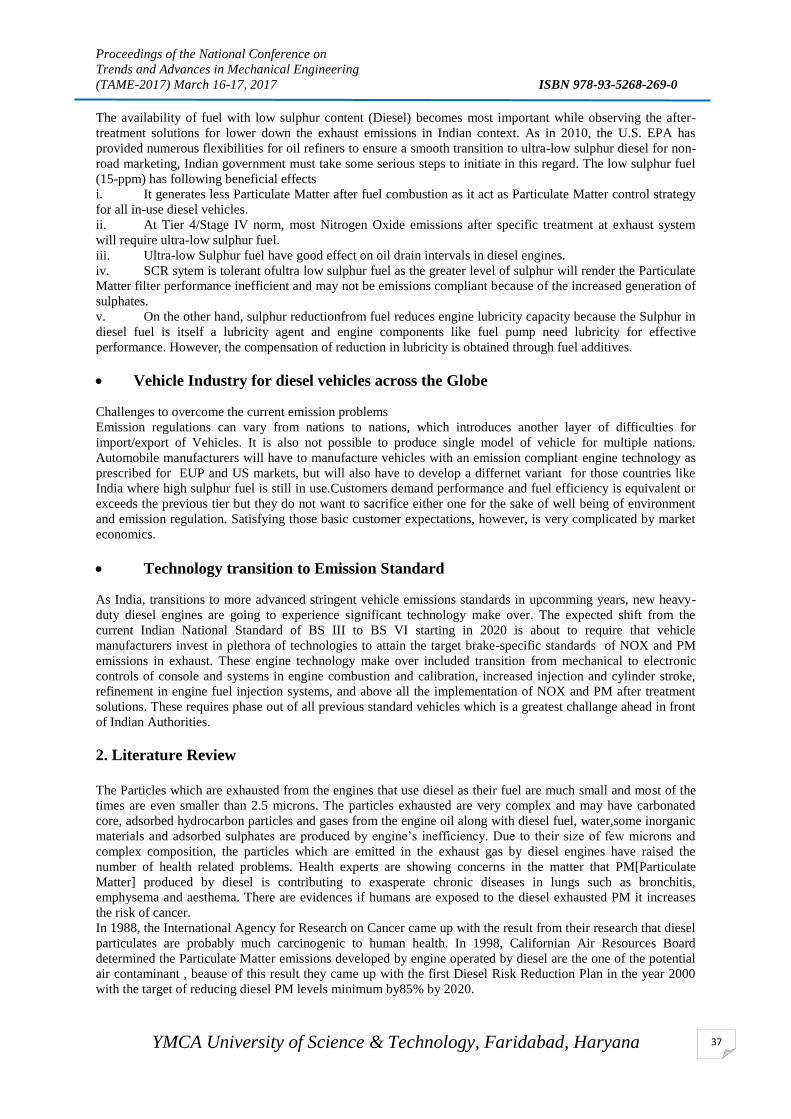
Proceedings of the National Conference on
Trends and Advances in Mechanical Engineering
(TAME-2017) March 16-17, 2017 ISBN 978-93-5268-269-0
YMCA University of Science & Technology, Faridabad, Haryana
37
The availability of fuel with low sulphur content (Diesel) becomes most important while observing the after-
treatment solutions for lower down the exhaust emissions in Indian context. As in 2010, the U.S. EPA has
provided numerous flexibilities for oil refiners to ensure a smooth transition to ultra-low sulphur diesel for non-
road marketing, Indian government must take some serious steps to initiate in this regard. The low sulphur fuel
(15-ppm) has following beneficial effects
i. It generates less Particulate Matter after fuel combustion as it act as Particulate Matter control strategy
for all in-use diesel vehicles.
ii. At Tier 4/Stage IV norm, most Nitrogen Oxide emissions after specific treatment at exhaust system
will require ultra-low sulphur fuel.
iii. Ultra-low Sulphur fuel have good effect on oil drain intervals in diesel engines.
iv. SCR sytem is tolerant ofultra low sulphur fuel as the greater level of sulphur will render the Particulate
Matter filter performance inefficient and may not be emissions compliant because of the increased generation of
sulphates.
v. On the other hand, sulphur reductionfrom fuel reduces engine lubricity capacity because the Sulphur in
diesel fuel is itself a lubricity agent and engine components like fuel pump need lubricity for effective
performance. However, the compensation of reduction in lubricity is obtained through fuel additives.
Vehicle Industry for diesel vehicles across the Globe
Challenges to overcome the current emission problems
Emission regulations can vary from nations to nations, which introduces another layer of difficulties for
import/export of Vehicles. It is also not possible to produce single model of vehicle for multiple nations.
Automobile manufacturers will have to manufacture vehicles with an emission compliant engine technology as
prescribed for EUP and US markets, but will also have to develop a differnet variant for those countries like
India where high sulphur fuel is still in use.Customers demand performance and fuel efficiency is equivalent or
exceeds the previous tier but they do not want to sacrifice either one for the sake of well being of environment
and emission regulation. Satisfying those basic customer expectations, however, is very complicated by market
economics.
Technology transition to Emission Standard
As India, transitions to more advanced stringent vehicle emissions standards in upcomming years, new heavy-
duty diesel engines are going to experience significant technology make over. The expected shift from the
current Indian National Standard of BS III to BS VI starting in 2020 is about to require that vehicle
manufacturers invest in plethora of technologies to attain the target brake-specific standards of NOX and PM
emissions in exhaust. These engine technology make over included transition from mechanical to electronic
controls of console and systems in engine combustion and calibration, increased injection and cylinder stroke,
refinement in engine fuel injection systems, and above all the implementation of NOX and PM after treatment
solutions. These requires phase out of all previous standard vehicles which is a greatest challange ahead in front
of Indian Authorities.
2. Literature Review
The Particles which are exhausted from the engines that use diesel as their fuel are much small and most of the
times are even smaller than 2.5 microns. The particles exhausted are very complex and may have carbonated
core, adsorbed hydrocarbon particles and gases from the engine oil along with diesel fuel, water,some inorganic
materials and adsorbed sulphates are produced by engine’s inefficiency. Due to their size of few microns and
complex composition, the particles which are emitted in the exhaust gas by diesel engines have raised the
number of health related problems. Health experts are showing concerns in the matter that PM[Particulate
Matter] produced by diesel is contributing to exasperate chronic diseases in lungs such as bronchitis,
emphysema and aesthema. There are evidences if humans are exposed to the diesel exhausted PM it increases
the risk of cancer.
In 1988, the International Agency for Research on Cancer came up with the result from their research that diesel
particulates are probably much carcinogenic to human health. In 1998, Californian Air Resources Board
determined the Particulate Matter emissions developed by engine operated by diesel are the one of the potential
air contaminant , beause of this result they came up with the first Diesel Risk Reduction Plan in the year 2000
with the target of reducing diesel PM levels minimum by85% by 2020.

Proceedings of the National Conference on
Trends and Advances in Mechanical Engineering
(TAME-2017) March 16-17, 2017 ISBN 978-93-5268-269-0
YMCA University of Science & Technology, Faridabad, Haryana
38
In 2000, it was declared by the U.S. EPA that PM from the diesel exhaust is “likely human carcinogenic
substances.” A neoteric research, “Diesel and Health in America: The Lingering Threat,” published by the Clean
Air Task Force (CATF) in the 2005, reveals the adverse effect of diesel particulate emissions on the human
health in the U.S. This particular report stated that the factor responsible for death of more than twenty one
thousand people in the U.S. per year is fine particulate pollution from diesel vehicles, with the damages
connated to health from the diesel PM is estimated to be total $139.00 billion in year 2010.
The emissions of Nitrogen Oxides produced from the diesel fueled engines are also responsible for the number
of problems related to health. Once in the particular atmosphere, nitrogenous oxides on reaction with other
volatile organic compounds (VOCs) in the existence of sunlight produced ozone gase. Ozone is highly corrosive
and reactive gaseous substance that lead to many respiratory disorders. Ozone harms the children and also the
elderly people. The respiratory organs can be damaged by the emission of NOx and it can also damage the lower
human body resistance offered to the infections in respiratory system. As with the ozone borned from
automobile emission, children as well as the senior citizens are explicitly susceptible to NOx emissions. The
American Lung Association estimated that in counties which have unhealthy levels of ozone as well as
particulate pollution over 55% of the U.S. population lives are shortened due to this.
However the diesel engine is responsible for health and environment related consequences, the diesel engine
remains prominent means of goods as well as heavy equipment transportation. Most public transport buses
along with heavyduty vehicles are powered by engines running on diesel for sound reasons as engines powered
by the diesel are the one on which we can rely upon, fuel-efficient, low maintainance as well as untroublesome
in repairing, and economic in operation.Most important key feature of the engines powered by the diesel is its
life span as it lasts for many years. In heavy-duty transport some diesel engines trucks have crossed the
operating lives of 10,00,000 miles or even beyond. In European countries, almost 50% of the new cars bought
by the buyers every year are completely dieselpowered. This is partially due to its noteworthy fuel economy ,
which delivers in excess of 30%greater miles per gallonsthan its gasoline counterpart. Automobie manufacturers
have made remarkable advancement in the performance characteristics of modern diesel power plants.
The old engines powered by diesel of just a decade ago, were considered to ear splitting and lumpish however
the next generation diesel engines havebrilliant low-end torque for sterling acceleration. This is associated with
advanced power transmission assemblies which eliminates the response lag of older vehicles that are operated
by diesel. For general public health concerns, a plethora of countries across the world including India have
established surprisingly lower exhaust emission limits for new diesel vehicles that are being phased in over the
decade between 2005-2015 timeframe. The emission control technologies such as SCR and EGR discussed in
this reserach paper represents state-of-the-art emission control technologies that new vehicle manufacturers are
upgraded their SOP to meet existing and future emissions regulations.
3. Study of EGR and SCR Systems
i. The EGR System
The working of the EGR systems of diesel engines is based on routing a portion which is additionally restrained
by the EGR valve of the exhaust gas by engine back to the intake manifold of the piston block. Since the air
taken in have low oxygenated content, the effect of EGR valve is to lower the oxygen content in the engine
cylinder, which is responsible for the cooler combustion and also responsible for the lowering the level of NOx
formed and emitted.
Some EGR systems are incorporated with a device to exchange heat to further cool down the exhaust gas before
it is recirculated. EGR is an effective technology that became popular after incorporation of Euro 4 and Euro 5
regulations in European countries, and is used in both petrol and diesel powered engines. A majorcons of EGR
system is that the maximum exhaust gases recirculation rate that can be applied at constant combustion level get
decreases with engine load (Zheng, Reader, & Hawley, 2004). It primarily reduces the NOX content during
operations at low load, and not during real-world higher-load events.
ii. The SCR System
NOx generated by the exhaust is broken down chemically using SCR.This particular system requires that an
external reducing agent whose quantity can vary must be injected, which is usually stored separately in tank and
is needed to be filled periodically. Various SCR systems that uses an aqueous urea solution for that particular
purpose. Urea vaporization in the exhaust emission to yield carbon dioxide and gaseous ammonia (NH3). The
exhausted NOX in the exhaust gas reacts with the NH3 gas in the catalyst to produce gaseous nitrogen (N2) and
water.After the adoption of Euro IV standard this SCR technology is widely used across the globe.Though there
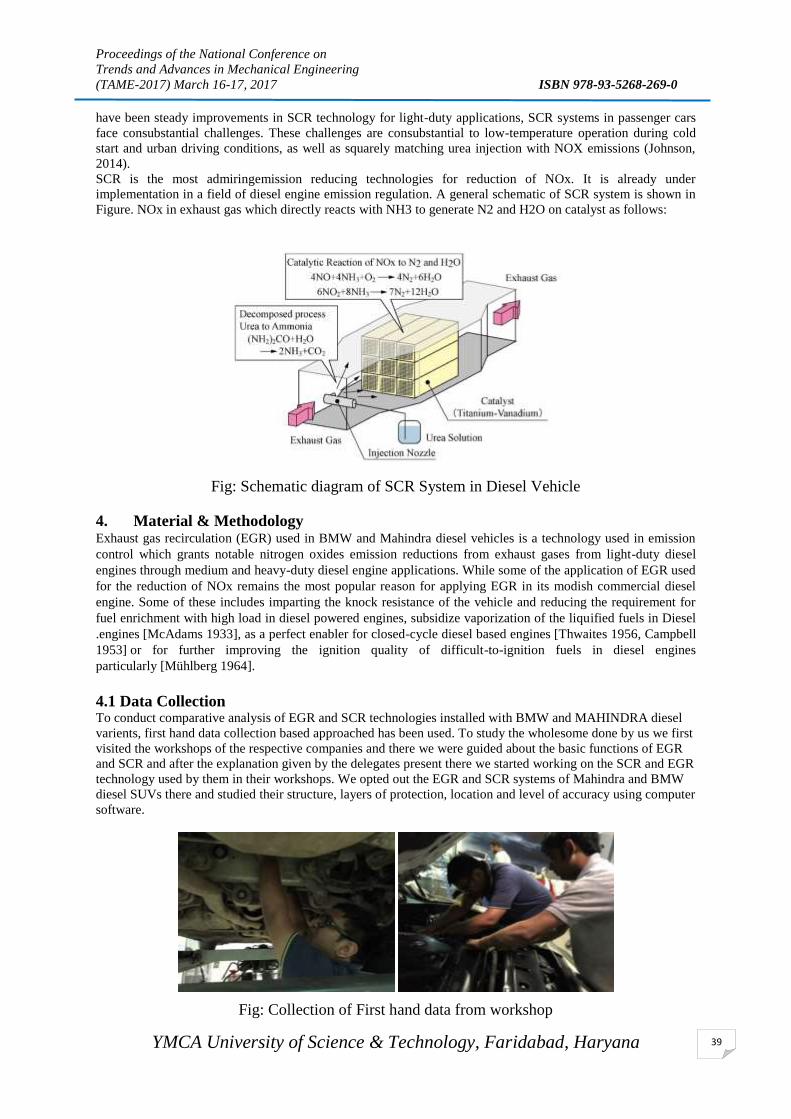
Proceedings of the National Conference on
Trends and Advances in Mechanical Engineering
(TAME-2017) March 16-17, 2017 ISBN 978-93-5268-269-0
YMCA University of Science & Technology, Faridabad, Haryana
39
have been steady improvements in SCR technology for light-duty applications, SCR systems in passenger cars
face consubstantial challenges. These challenges are consubstantial to low-temperature operation during cold
start and urban driving conditions, as well as squarely matching urea injection with NOX emissions (Johnson,
2014).
SCR is the most admiringemission reducing technologies for reduction of NOx. It is already under
implementation in a field of diesel engine emission regulation. A general schematic of SCR system is shown in
Figure. NOx in exhaust gas which directly reacts with NH3 to generate N2 and H2O on catalyst as follows:
Fig: Schematic diagram of SCR System in Diesel Vehicle
4. Material & Methodology Exhaust gas recirculation (EGR) used in BMW and Mahindra diesel vehicles is a technology used in emission
control which grants notable nitrogen oxides emission reductions from exhaust gases from light-duty diesel
engines through medium and heavy-duty diesel engine applications. While some of the application of EGR used
for the reduction of NOx remains the most popular reason for applying EGR in its modish commercial diesel
engine. Some of these includes imparting the knock resistance of the vehicle and reducing the requirement for
fuel enrichment with high load in diesel powered engines, subsidize vaporization of the liquified fuels in Diesel
.engines [McAdams 1933], as a perfect enabler for closed-cycle diesel based engines [Thwaites 1956, Campbell
1953] or for further improving the ignition quality of difficult-to-ignition fuels in diesel engines
particularly [Mühlberg 1964].
4.1 Data Collection To conduct comparative analysis of EGR and SCR technologies installed with BMW and MAHINDRA diesel
varients, first hand data collection based approached has been used. To study the wholesome done by us we first
visited the workshops of the respective companies and there we were guided about the basic functions of EGR
and SCR and after the explanation given by the delegates present there we started working on the SCR and EGR
technology used by them in their workshops. We opted out the EGR and SCR systems of Mahindra and BMW
diesel SUVs there and studied their structure, layers of protection, location and level of accuracy using computer
software.
Fig: Collection of First hand data from workshop
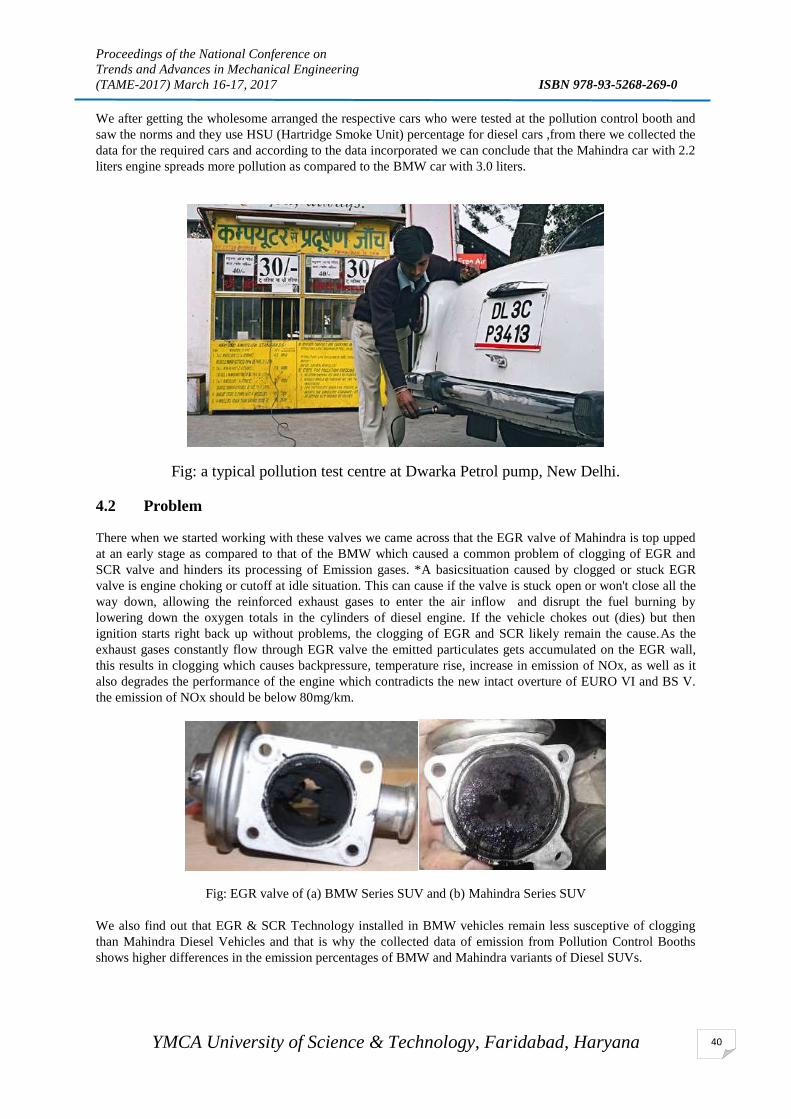
Proceedings of the National Conference on
Trends and Advances in Mechanical Engineering
(TAME-2017) March 16-17, 2017 ISBN 978-93-5268-269-0
YMCA University of Science & Technology, Faridabad, Haryana
40
We after getting the wholesome arranged the respective cars who were tested at the pollution control booth and
saw the norms and they use HSU (Hartridge Smoke Unit) percentage for diesel cars ,from there we collected the
data for the required cars and according to the data incorporated we can conclude that the Mahindra car with 2.2
liters engine spreads more pollution as compared to the BMW car with 3.0 liters.
Fig: a typical pollution test centre at Dwarka Petrol pump, New Delhi.
4.2 Problem
There when we started working with these valves we came across that the EGR valve of Mahindra is top upped
at an early stage as compared to that of the BMW which caused a common problem of clogging of EGR and
SCR valve and hinders its processing of Emission gases. *A basicsituation caused by clogged or stuck EGR
valve is engine choking or cutoff at idle situation. This can cause if the valve is stuck open or won't close all the
way down, allowing the reinforced exhaust gases to enter the air inflow and disrupt the fuel burning by
lowering down the oxygen totals in the cylinders of diesel engine. If the vehicle chokes out (dies) but then
ignition starts right back up without problems, the clogging of EGR and SCR likely remain the cause.As the
exhaust gases constantly flow through EGR valve the emitted particulates gets accumulated on the EGR wall,
this results in clogging which causes backpressure, temperature rise, increase in emission of NOx, as well as it
also degrades the performance of the engine which contradicts the new intact overture of EURO VI and BS V.
the emission of NOx should be below 80mg/km.
Fig: EGR valve of (a) BMW Series SUV and (b) Mahindra Series SUV
We also find out that EGR & SCR Technology installed in BMW vehicles remain less susceptive of clogging
than Mahindra Diesel Vehicles and that is why the collected data of emission from Pollution Control Booths
shows higher differences in the emission percentages of BMW and Mahindra variants of Diesel SUVs.

Proceedings of the National Conference on
Trends and Advances in Mechanical Engineering
(TAME-2017) March 16-17, 2017 ISBN 978-93-5268-269-0
YMCA University of Science & Technology, Faridabad, Haryana
41
Table.1: Emission Data of Mahindra SUVs collected from Local Pollution Checking Booths
S/No. Name of vehicle Engine
Capacity
RPM
Min.
RPM
Max.
HSU
1. Mahindra XUV
500
2.2 L 800 4560 25.6
2. Mahindra XUV
500
2.2 L 800 4560 25.4
3. Mahindra XUV
500
2.2 L 790 4550 26.0
4. Mahindra XUV
500
2.2 L 780 4540 25.4
5. Mahindra XUV
500
2.2 L 800 4530 26.4
6. Mahindra XUV
500
2.2 L 800 4560 25.4
7. Mahindra XUV
500
2.2 L 800 4550 25.0
8. Mahindra XUV
500
2.2 L 780 4540 25.0
9. Mahindra XUV
500
2.2 L 780 4540 24.9
10. Mahindra XUV
500
2.2 L 800 4560 23.8
25.29
Table.2: Emission Data of BMW SUVs collected from Local Pollution Checking Booths
S/No. Name of
vehicle
Engine
Capacity
RPM
Min.
RPM
Max.
HSU
1. BMW 530d 3.0 L 689 2751 23.4
2. BMW 530d 3.0 L 694 2709 26.4
3. BMW 530d 3.0 L 665 2742 22.0
4. BMW 530d 3.0 L 692 2701 21.4
5. BMW 530d 3.0 L 710 2732 22.4
6. BMW 530d 3.0 L 685 2726 21.4
7. BMW 530d 3.0 L 593 2555 23.0
8. BMW 530d 3.0 L 626 2516 24.0
9. BMW 530d 3.0 L 680 2682 25.9
10. BMW 530d 3.0 L 700 2735 22.8
21.18
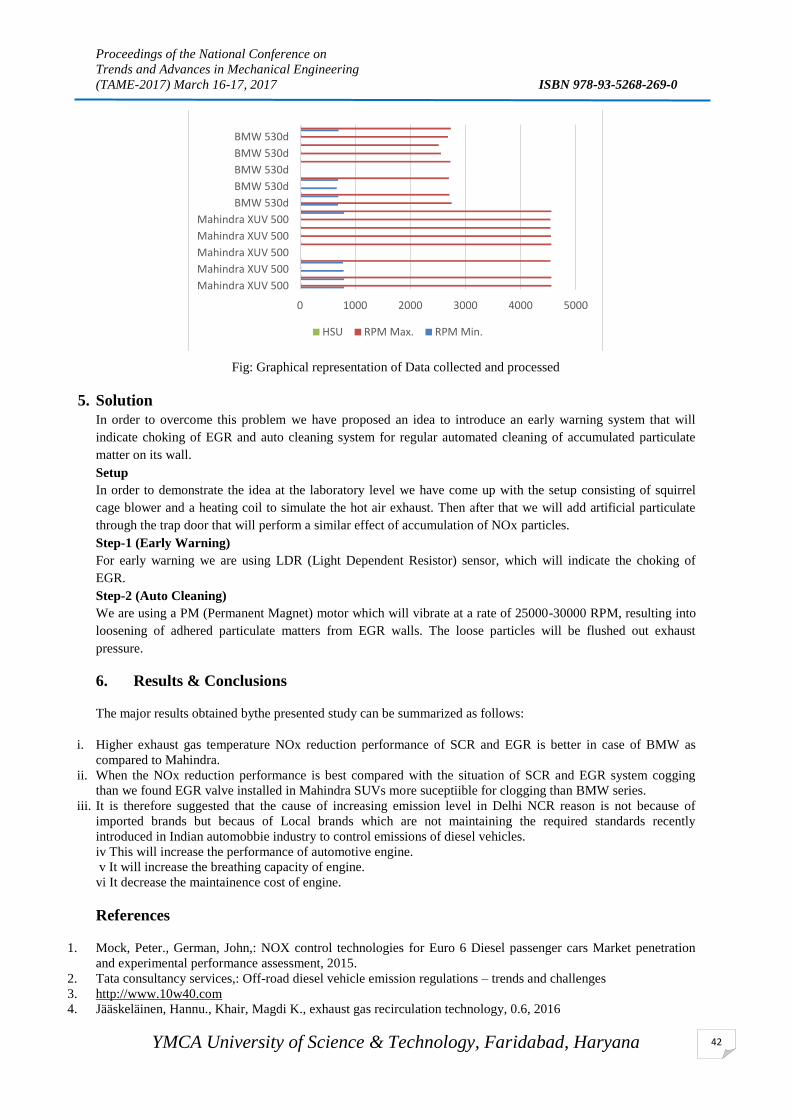
Proceedings of the National Conference on
Trends and Advances in Mechanical Engineering
(TAME-2017) March 16-17, 2017 ISBN 978-93-5268-269-0
YMCA University of Science & Technology, Faridabad, Haryana
42
Fig: Graphical representation of Data collected and processed
5. Solution
In order to overcome this problem we have proposed an idea to introduce an early warning system that will
indicate choking of EGR and auto cleaning system for regular automated cleaning of accumulated particulate
matter on its wall.
Setup
In order to demonstrate the idea at the laboratory level we have come up with the setup consisting of squirrel
cage blower and a heating coil to simulate the hot air exhaust. Then after that we will add artificial particulate
through the trap door that will perform a similar effect of accumulation of NOx particles.
Step-1 (Early Warning)
For early warning we are using LDR (Light Dependent Resistor) sensor, which will indicate the choking of
EGR.
Step-2 (Auto Cleaning)
We are using a PM (Permanent Magnet) motor which will vibrate at a rate of 25000-30000 RPM, resulting into
loosening of adhered particulate matters from EGR walls. The loose particles will be flushed out exhaust
pressure.
6. Results & Conclusions
The major results obtained bythe presented study can be summarized as follows:
i. Higher exhaust gas temperature NOx reduction performance of SCR and EGR is better in case of BMW as
compared to Mahindra.
ii. When the NOx reduction performance is best compared with the situation of SCR and EGR system cogging
than we found EGR valve installed in Mahindra SUVs more suceptiible for clogging than BMW series.
iii. It is therefore suggested that the cause of increasing emission level in Delhi NCR reason is not because of
imported brands but becaus of Local brands which are not maintaining the required standards recently
introduced in Indian automobbie industry to control emissions of diesel vehicles.
iv This will increase the performance of automotive engine.
v It will increase the breathing capacity of engine.
vi It decrease the maintainence cost of engine.
References
1. Mock, Peter., German, John,: NOX control technologies for Euro 6 Diesel passenger cars Market penetration
and experimental performance assessment, 2015.
2. Tata consultancy services,: Off-road diesel vehicle emission regulations – trends and challenges
3. http://www.10w40.com
4. Jääskeläinen, Hannu., Khair, Magdi K., exhaust gas recirculation technology, 0.6, 2016
0 1000 2000 3000 4000 5000
Mahindra XUV 500
Mahindra XUV 500
Mahindra XUV 500
Mahindra XUV 500
Mahindra XUV 500
BMW 530d
BMW 530d
BMW 530d
BMW 530d
BMW 530d
HSU RPM Max. RPM Min.

Proceedings of the National Conference on
Trends and Advances in Mechanical Engineering
(TAME-2017) March 16-17, 2017 ISBN 978-93-5268-269-0
YMCA University of Science & Technology, Faridabad, Haryana
43
5. Kishi, T., et al., “Studies on Deterioration of SCR NOx Removal Catalyst and its Provision Using Micro-
reactors”, ISME, Busan, (2009).
6. Hirata, K., et al., “Development of Marine SCR System and Field Test on Ship”, ISME, Busan, (2009).
7. Niki, Y., et al., “Basic Performance of SCR system in the Single Cylinder Diesel Engine”, ISME, Busan,
(2009).
8. Niki, Y., et al., “SCR system for NOx reduction of Medium Speed Marine Diesel Engine”, CIMAC, (2010),
No.228.
9. Inomata, M., ea al., “Mechanism of the Reaction of NO and NH3 on Vanadium Oxide catalyst in the Presence
of Oxygen under the Dilute Gas Condition”, Journal of Catalysis, vol.62, (1980), pp.140-148.
10. Kleemann, M., et al., “Hydrolysis of Isocyanic Acid on SCR Catalyst”, Ind. Eng. Chem. Res., vol.39, (2000),
pp4120-4126.
11. Yim, S.D., et al., “Decomposition of Urea into NH3 for the SCR Process”, Ind. Eng. Chem. Res., vol.43, (2004),
pp4856-4863.
12. Lietti, L., et al., “Dynamics of the SCR-DeNOx Reaction by the Transient-Response Method”, AIChE Journal,
Vol.43, (1997), pp.2559-2570.
13. Lietti, L., et al., “Transient kinetic study of the SCR-DeNOx reaction”, Catalysis Today, vol.45, (1998), pp.85-
92.
14. ADAC. (2015a). ADAC car database. Retrieved from https://www.adac.de/infotestrat/ autodatenbank/
15. Bergmann, D. (2013). Developing the Technology Innovation Process for Further Emissions Reduction.
Presented at the 6th Integer Diesel Emissions Conference and Diesel Exhaust Fluid Forum, Atlanta
16. Vicente Franco, Francisco Posada Sánchez, John German, and Peter Mock, REAL-WORLD EXHAUST
EMISSIONS FROM MODERN DIESEL CARS A META-ANALYSIS OF PEMS EMISSIONS DATA FROM
EU (EURO 6) AND US (TIER 2 BIN 5/ULEV II) DIESEL PASSENGER CARS.
17. Manufacturers of Emission Controls Association 1730 M Street, NW * Suite 206 * Washington, D.C. 20036,
Emission Control Technologies for Diesel-Powered Vehicles December 2007
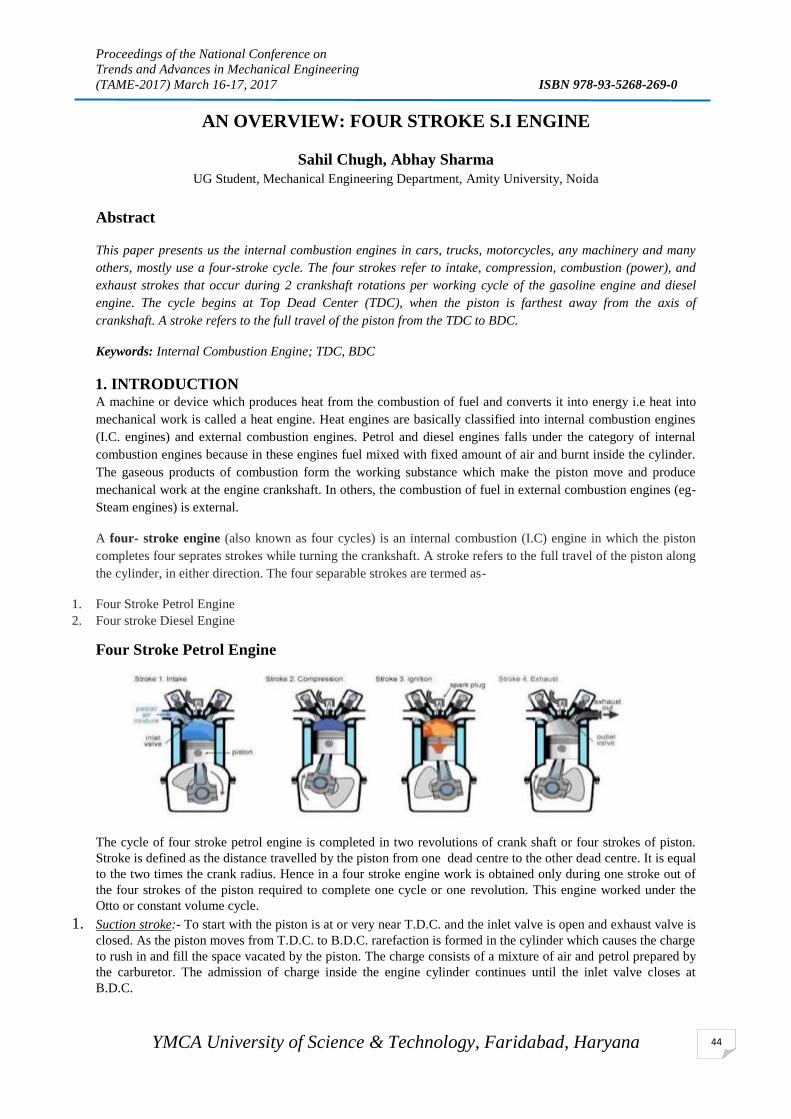
Proceedings of the National Conference on
Trends and Advances in Mechanical Engineering
(TAME-2017) March 16-17, 2017 ISBN 978-93-5268-269-0
YMCA University of Science & Technology, Faridabad, Haryana
44
AN OVERVIEW: FOUR STROKE S.I ENGINE
Sahil Chugh, Abhay Sharma
UG Student, Mechanical Engineering Department, Amity University, Noida
Abstract
This paper presents us the internal combustion engines in cars, trucks, motorcycles, any machinery and many
others, mostly use a four-stroke cycle. The four strokes refer to intake, compression, combustion (power), and
exhaust strokes that occur during 2 crankshaft rotations per working cycle of the gasoline engine and diesel
engine. The cycle begins at Top Dead Center (TDC), when the piston is farthest away from the axis of
crankshaft. A stroke refers to the full travel of the piston from the TDC to BDC.
Keywords: Internal Combustion Engine; TDC, BDC
1. INTRODUCTION A machine or device which produces heat from the combustion of fuel and converts it into energy i.e heat into
mechanical work is called a heat engine. Heat engines are basically classified into internal combustion engines
(I.C. engines) and external combustion engines. Petrol and diesel engines falls under the category of internal
combustion engines because in these engines fuel mixed with fixed amount of air and burnt inside the cylinder.
The gaseous products of combustion form the working substance which make the piston move and produce
mechanical work at the engine crankshaft. In others, the combustion of fuel in external combustion engines (eg-
Steam engines) is external.
A four- stroke engine (also known as four cycles) is an internal combustion (I.C) engine in which the piston
completes four seprates strokes while turning the crankshaft. A stroke refers to the full travel of the piston along
the cylinder, in either direction. The four separable strokes are termed as-
1. Four Stroke Petrol Engine
2. Four stroke Diesel Engine
Four Stroke Petrol Engine
The cycle of four stroke petrol engine is completed in two revolutions of crank shaft or four strokes of piston.
Stroke is defined as the distance travelled by the piston from one dead centre to the other dead centre. It is equal
to the two times the crank radius. Hence in a four stroke engine work is obtained only during one stroke out of
the four strokes of the piston required to complete one cycle or one revolution. This engine worked under the
Otto or constant volume cycle.
1. Suction stroke:- To start with the piston is at or very near T.D.C. and the inlet valve is open and exhaust valve is
closed. As the piston moves from T.D.C. to B.D.C. rarefaction is formed in the cylinder which causes the charge
to rush in and fill the space vacated by the piston. The charge consists of a mixture of air and petrol prepared by
the carburetor. The admission of charge inside the engine cylinder continues until the inlet valve closes at
B.D.C.

Proceedings of the National Conference on
Trends and Advances in Mechanical Engineering
(TAME-2017) March 16-17, 2017 ISBN 978-93-5268-269-0
YMCA University of Science & Technology, Faridabad, Haryana
45
2. Compression stroke:- Both the valves are closed now and the piston moves from B.D.C. to T.D.C. The charge
is compressed up to a compression ratio of 5:1 to 9:1 and pressure and temperature at the end of compression are about 6bar to 12 bar and 250º C to 300º C respectively.
3. Working, Power or Expansion stroke:- When the piston reaches T.D.C. position, the charge is ignited by
causing an electric spark between the electrodes of a spark plug, which is located somewhere in the walls of
cylinder head. During combustion the chemical energy of fuel is released and there is rise in temperature and
pressure of gases. The temperature of gases increases to about 1800º C to 2000º C and the pressure reaches
30bar to 40 bar. Upto till now the volume of gases formed however remains almost constant with both valves
closed. Now the combustion products expand and push the piston down the cylinder. The reciprocating piston
motion is converted into rotary motion of crankshaft by a connecting rod and crank. During expansion the
pressure drops due to increase in the volume of gases and absorption of heat by cylinder walls.
4. Exhaust stroke:- Theoretically exhaust valve opens at the end of working stroke when the piston is at B.D.C.
position. But actually exhaust valve begins to open when about 85 % of the working stroke is completed. A
pressure of 4 to 5 bar at this instant forces about 60 % of the burnt gases into the exhaust manifold at high speed.
The remaining burnt gases are cleared off the swept volume whenthe piston moves from B.D.C. to T.D.C.
During this strokethe pressure inside the cylinder is slightly above the atmospheric value. Some of the burnt
gases are however leftin the clearance space. The exhaust valve closes shortly afterthe piston reaches T.D.C.
The inlet valve opens slightly beforethe end of exhaust stroke and the cycle repeats.
Four Stroke Diesel Engine
The cycle of operation in a four stroke diesel engine is completed in two revolutions of crankshaft or four
strokes of piston using diesel oil as fuel. This engine works on diesel cycle.
1. Suction Stroke: Starting of engine is done by an electric motor or manually. In both cases the energy is supplied
to the engine. In this stroke the inlet valve opens and the outlet valve remains closed. Piston moves from T.D.C.
to B.D.C. and in this way a vacuum is created in the cylinder. This vacuum is filled by air alone and piston
reaches to B.D.C.
2. Compression Stroke: Both valves are closed. This time piston moves from B.D.C. to T.D.C. Air is compressed
in this stroke up to a compression ratio of 15:1 to 22:1 and a very high temperature is produced due to high
pressure. The high temperature is the only cause of combustion of the fuel. The piston takes the power in this
stroke from
the flywheel. During this stroke the pressure and temperature attain a high value of 40 to 60 bar and 600º C to
700º C.
3. Working Stroke: At the end of compression stroke or when the piston reaches the T.D.C. position, a fine spray
of diesel is injected in the cylinder through injector. The fuel burns by the heat of compressed air and due to its
burning the power is produced. This power pushes the piston downward i.e. from T.D.C. to B.D.C. The excess
energy of the piston is stored in the flywheel of the engine, which is further used for the remaining three strokes
of the engine. The reciprocating motion of the piston is converted into the rotary motion of the crankshaft by
connecting rod and crank. During expansion the pressure drops due to increase in volume of gases .
4. Exhaust Stroke: The exhaust valve begins to open when about 85% of the working stroke is completed. The
force of piston coming from B.D.C. to T.D.C. forces the burnt gases into the exhaust manifold. Some of the
gases are forced out due to higher pressure in the cylinder and the remaining gases are forced out by the piston.
Some of the burnt gases are however left inside the clearance space. The exhaust valve closes shortly after
T.D.C. The inlet valve opens slightly before the end of exhaust and in this way the cycle repeats.
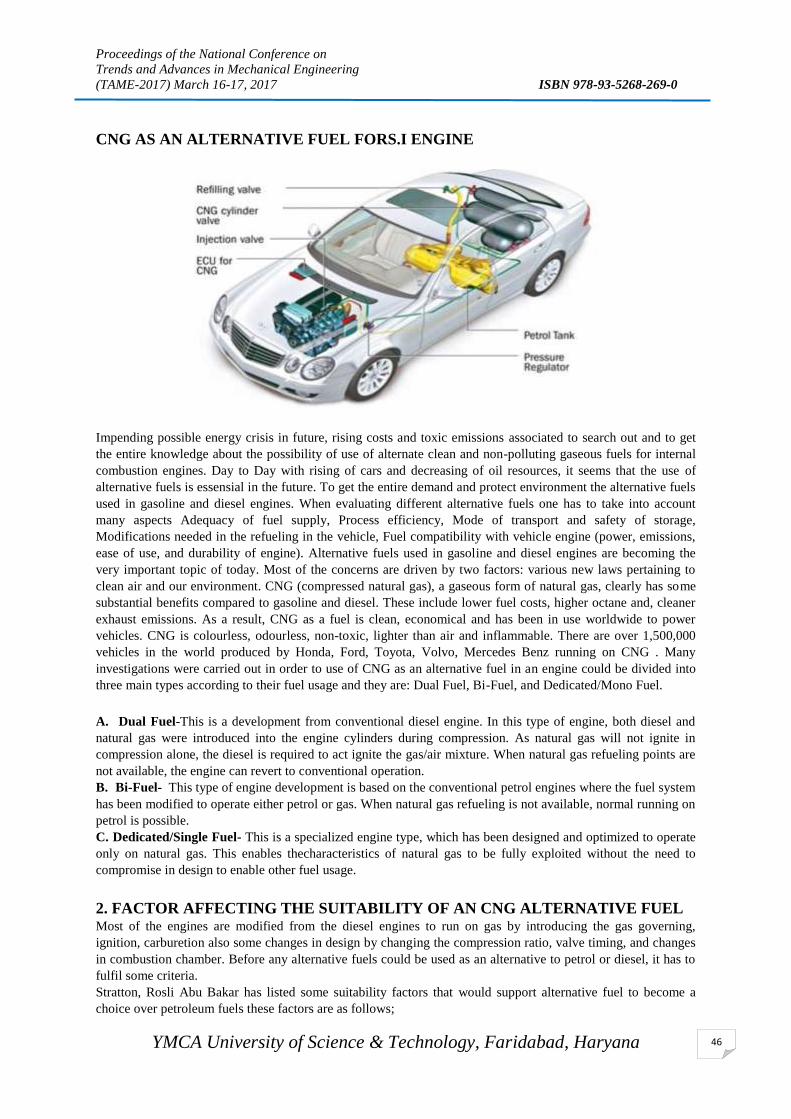
Proceedings of the National Conference on
Trends and Advances in Mechanical Engineering
(TAME-2017) March 16-17, 2017 ISBN 978-93-5268-269-0
YMCA University of Science & Technology, Faridabad, Haryana
46
CNG AS AN ALTERNATIVE FUEL FORS.I ENGINE
Impending possible energy crisis in future, rising costs and toxic emissions associated to search out and to get
the entire knowledge about the possibility of use of alternate clean and non-polluting gaseous fuels for internal
combustion engines. Day to Day with rising of cars and decreasing of oil resources, it seems that the use of
alternative fuels is essensial in the future. To get the entire demand and protect environment the alternative fuels
used in gasoline and diesel engines. When evaluating different alternative fuels one has to take into account
many aspects Adequacy of fuel supply, Process efficiency, Mode of transport and safety of storage,
Modifications needed in the refueling in the vehicle, Fuel compatibility with vehicle engine (power, emissions,
ease of use, and durability of engine). Alternative fuels used in gasoline and diesel engines are becoming the
very important topic of today. Most of the concerns are driven by two factors: various new laws pertaining to
clean air and our environment. CNG (compressed natural gas), a gaseous form of natural gas, clearly has some
substantial benefits compared to gasoline and diesel. These include lower fuel costs, higher octane and, cleaner
exhaust emissions. As a result, CNG as a fuel is clean, economical and has been in use worldwide to power
vehicles. CNG is colourless, odourless, non-toxic, lighter than air and inflammable. There are over 1,500,000
vehicles in the world produced by Honda, Ford, Toyota, Volvo, Mercedes Benz running on CNG . Many
investigations were carried out in order to use of CNG as an alternative fuel in an engine could be divided into
three main types according to their fuel usage and they are: Dual Fuel, Bi-Fuel, and Dedicated/Mono Fuel.
A. Dual Fuel-This is a development from conventional diesel engine. In this type of engine, both diesel and
natural gas were introduced into the engine cylinders during compression. As natural gas will not ignite in
compression alone, the diesel is required to act ignite the gas/air mixture. When natural gas refueling points are
not available, the engine can revert to conventional operation.
B. Bi-Fuel- This type of engine development is based on the conventional petrol engines where the fuel system
has been modified to operate either petrol or gas. When natural gas refueling is not available, normal running on
petrol is possible.
C. Dedicated/Single Fuel- This is a specialized engine type, which has been designed and optimized to operate
only on natural gas. This enables thecharacteristics of natural gas to be fully exploited without the need to
compromise in design to enable other fuel usage.
2. FACTOR AFFECTING THE SUITABILITY OF AN CNG ALTERNATIVE FUEL Most of the engines are modified from the diesel engines to run on gas by introducing the gas governing,
ignition, carburetion also some changes in design by changing the compression ratio, valve timing, and changes
in combustion chamber. Before any alternative fuels could be used as an alternative to petrol or diesel, it has to
fulfil some criteria.
Stratton, Rosli Abu Bakar has listed some suitability factors that would support alternative fuel to become a
choice over petroleum fuels these factors are as follows;
Proceedings of the National Conference on
Trends and Advances in Mechanical Engineering
(TAME-2017) March 16-17, 2017 ISBN 978-93-5268-269-0
YMCA University of Science & Technology, Faridabad, Haryana
47
Fuel Reserves
Refuelling infrastructure
Component availability
Emission potential
Safety
Financial requirement
From the literature survey it is observed that following several factors affecting the engine run on NG for low
engine power and torque are-
Loses in volumetric efficiency
Low flame speed
Low compression ratio (CR)
Absence of fuel evaporation
Change in stoichiometric air/fuel ratio
3. CONCLUSION
In this report I have gathered the information on how 4-stroke engines works in both petrol as well as diesel
engines. The process of 4 stroke engines is explained and all the strokes are illustrated in details. Moreover the
difference between 4-stroke petrol engine and 4-stroke diesel engine is shown in the form of a table which
compares both type of engines, this shows that diesel engine is more fuel efficient than petrol engine and the
running cost also is very less than the petrol engine, whereas the noise or vibration is very less in petrol engine
than in diesel engine and petrol engine is more ecofriendly than the diesel engine.
I conclude that the compressed natural gas represents a good alternative fuel for SI engine and therefore must be
taken into consideration in the future for transport purpose. These are follows-
The engine thermal efficiency and exhaust gas temperature produced by the CNG burning is always higher as
compared with that of the petrol/diesel
CNG produces less 8-16% of brake torque, brake power and BMEP compared to gasoline fuel due to reduced
volumetric efficiency and lower flame speed of CNG
On average the reduction of CO, CO2 and HC emission are 20-98%, 8-20% and 40-87% respectively by CNG.
Higher NOx emission is the main emission concern for CNG as automotive fuel that can be reduced by
increasing fuel density and blending small quantities of H2.
REFERENCES
Arsie, I., E De Franceschi, C. Pianese and G. Rizzo (1996). O.D.E.C.S. - A computer code for the optimal
design of S.I. engine control strategies. SAE Technical Paper 960357.
Brug~d, Jan, Lars Eriksson and Lars Nielsen (2001). Mean value engine modeling of a turbo charged spark
ignited engine - a principle study. Technical Report LiTH-ISY-R-2370, ISSN 1400-3902. Department of
Electrical Engineering.
Eriksson, Lars (2002). Mean value models for exhaust system temperatures. SAE Technical Paper 2002- 01-
0374.
Guzzella, L., U. Wenger and R. Martin (2000). IC engine Downsizing and Pressure-Wave Supercharging for
Fuel Economy. SAE Technical Paper 2000-01-1019.
Hendricks Elbert (2001). Isothermal vs. adiabatic mean value si engine models. In: 3rd IFAC Workshop,
Advances in Automotive Control, Preprints, Karlsruhe, Germany. pp. 373-378.
Heywood, J. B. (1988). Internal Combustion Engine Fundamentals. McGraw-Hill series in mechanical
engineering. McGraw-Hill.
Holman, J. P. (1997). Heat Transfer. 2 ed..McGrawHill.

Proceedings of the National Conference on
Trends and Advances in Mechanical Engineering
(TAME-2017) March 16-17, 2017 ISBN 978-93-5268-269-0
YMCA University of Science & Technology, Faridabad, Haryana
48
Krysander, Mattias (2000). Air mass flow through a throttle. Master's thesis. Link6ping University, SE-581 83
Link6ping.
Massey, Bernard (1998). Mechanics of Fluids. 7 ed..
Stanley Thornes. Moraal, Paul and Ilya Kolmanovsky (1999). Turbocharger Modeling for Automotive Control
Applications. SAE Technical Paper 1999-01-0908pp. 309-322.
Proceedings of the National Conference on
Trends and Advances in Mechanical Engineering
(TAME-2017) March 16-17, 2017 ISBN 978-93-5268-269-0
YMCA University of Science & Technology, Faridabad, Haryana
49
STATUS OF GSCM ADOPTION IN PUNJAB POWER INDUSTRY
Rajiv Kumar Garg1, Sheetal Soda
2*, and Anish Sachdeva
3
1, 2, 3
Department of Industrial and Production Engineering, National Institute of Technology, Jalandhar, India
*Corresponding author email:[email protected]
Abstract Increased industrialization and ever growing consumerism has led to a situation where industrial pursuits of
mankind have started to cast an unfavourable impact on environment that may prove self-destructive for the
former. Power Industry has been identified as one of the largest polluting industry, owing to Green House Gas
emissions caused by burning of fossil fuel. Green Supply Chain Management (GSCM) finds its extensive
application in power industry, and has the potential to deliver cleaner energy, coupled with economic gains for
the practicing organization. The study has attempted to assess the level of environmental consciousness as well
as the scale of implementation of environment-friendly practices in the working of state owned power companies
of the Punjab.
Keywords: Green Supply Chain Management, Power Industry, Status
1. Introduction
Across the world, an increased concern for ecology and environment is being witnessed, calling for conservation
of planet’s resources and its environment. As a significant outcome of the same, companies are being compelled
tacitly to adopt eco friendly practices all through their supply chain (Chien and Shih 2007). In present times,
issues like environmental conservation and climatic changes hold people’s attention like never before in past. In
business and management domains, organizations are assuming significant role as responsible centres in the
social set up to curtail the ill effects of their undertakings on ecology.
In context of the mentioned, Green Supply Chain Management (GSCM) has emerged as a fascinating concept
that is rapidly drawing interest at the end of industries in addressing and augmenting their eco-friendly
performance (Srivastava 2007). Rao and Holt state “GSCM is an important organizational philosophy, (which)
plays a significant role in promoting efficiency and synergy between partners, facilitating environmental
performance, minimal waste, cost savings to achieve corporate profit and market-share objectives, through
environmental risks and impacts reduction, while it improves the ecological efficiency of organizations and their
partners”(Rao and Holt 2005). If GSCM is effectually executed by a firm, it helps the later in preserving and
expanding their competitive gains amongst other contestants in the market (Zhu and Sarkis 2004).
With insatiable appetite for power; developed and developing economies all across the world are gearing up to
augment their power generation capacities- most of which are going to pose a serious threat to global
environment. Power Industry has been identified as the second largest polluting industry, owing to Green
House Gasses (GHG) emissions caused by burning of fossil fuels. Green Supply Chain Management (GSCM)
finds its extensive application in Power Industry, and has the potential to deliver cleaner energy, coupled with
economic gains for the practicing organization. The powers companies are waking up to the fact that green
operations are not only eco-friendly, but make acute business sense also. Certain Indian power companies have
re-worked on their supply chains, but still much has to be done by many others. The opportunities thrown
forward by intensive Green Supply Chain Management(GSCM) practices for State Owned Power Companies
(SOPCs) call for a comprehensive study about the possibilities that can be explored regarding making existing
supply chains greener.
This study is aimed at investigating the status of adoption of GSCM measures in context of Power Industry of
Punjab, a state in North India. Data for research is obtained with the help of primary research conducted through
structured questionnaire. The significance of the study manifests itself in the fact that the power utilities of the
state need to have a consolidated analysis of their supply chains, which can throw opportunities of prospective
gains. A study on Green Supply Chain Management (GSCM) practices prevalent in State Owned Power
Companies (SOPCs), along with the areas where improvisation can be done, will help the SOPCs’ managements
indecisively dealing with the problems of losses and inefficiencies in a number of operational domains,

Proceedings of the National Conference on
Trends and Advances in Mechanical Engineering
(TAME-2017) March 16-17, 2017 ISBN 978-93-5268-269-0
YMCA University of Science & Technology, Faridabad, Haryana
50
simultaneously attending to environmental concerns, as well. This study deals with SOPCs of Punjab a state in
North India, and tries to find status of GSCM practices implementation by power companies.
SOPCs of a particular state are reflective of similar set of power companies functioning in other parts of the
country; as their institutional structure, organizational culture and working domain is almost alike. In general,
SOPCs are representative of Indian power utilities as they signify the larger part of Indian power sector.
2. Supply Chain of Punjab Power Sector
Punjab has been one of the more economically developed states of the country, with high rate of per capita
energy consumption. The state’s power sector has been instrumental in its economic growth, as much of the
agriculture sector and MSMEs thrive on the power made available by the SOPCs. Any improvement in their
supply chain is sure to translate into perceptible growth in economy of the state. Punjab State Power
Corporation Limited (PSPCL) and Punjab State Transmission Corporation Limited (PSTCL) – the two SOPCs
of the state, are representative of most of the modern day power utilities operating in India, which have been
transformed into corporations from their erstwhile avatar of SEBs. The erstwhile PSEB, i.e, Punjab State
Electricity Board was bifurcated into PSPCL and PSTCL in 2010, in accordance with the recommendations of
CERC (Central Electricity Regulatory Committee), and thereby present an appropriate option to study a
modern-day state power utility in India.
Supply chain of SOPCs of Punjab has been studied which starts from supply of coal (Figure 1). Coal is supplied
to power plant by means of rail wagons. The coal is crushed to the size of few inches, and after that it is sent to
pulveriser by means of a conveyer belt. Coal is crushed to powdered form, and hot air is blown onto it, to push it
into the furnace. The walls of boiler are lined with water filled pipes. The coal on entering the boiler catches fire
and heats up the water in boiler pipes and converts it into steam. Emissions (carbon dioxide, sulphur dioxide &
nitrogen oxides) and ash produced from burning of coal are vented out from the boiler, up through the stack.
Electrostatic Precipitators remove nearly all the fly ash before releasing it into the atmosphere. The heavier ash
(bottom ash) settles at the bottom. Jets of high-pressure steam propel the blades of turbine causing it to spin
rapidly. Turbine is connected to a generator, and its spinning causes an electro-magnet to turn inside coils of
wire in the generator; thus producing electricity. Steam exits the turbines and passes through condenser, and
converts into water. The water is then pumped back to the boiler to repeat the heating process. Condensers are
cooled by reservoir water. Ash is removed and is disposed off from the plant. The ash is sold for use in
manufacturing cement, fertilisers, bricks etc. Step Up Transformers installed near generating station step up
voltage to 220 KV or 400 KV or higher voltages (as the case may be). Step-down transformers installed at
substation close to load centres step down the voltage to 220 KV or 132 KV (or still lower, as the case may be).
HV lines transport power over long distances, right up to sub stations located close to load centres. The
distribution network comprises of 11 KV feeders, distribution transformers and service mains. 11 KV feeders
terminate at Step-down transformers installed close to residential/commercial areas, stepping down voltage to
230 V, which is then provided to households through service mains.
Figure 1: Supply Chain of Power Industry
The supply chain of power industry is segmented into three major sections i.e. generation, transmission and
distribution. Apart from these, consumption is seen as an extension of the supply chain – as end users have
enormous potential to contribute in GSCM implementation by limiting the consumption to judicious usage and
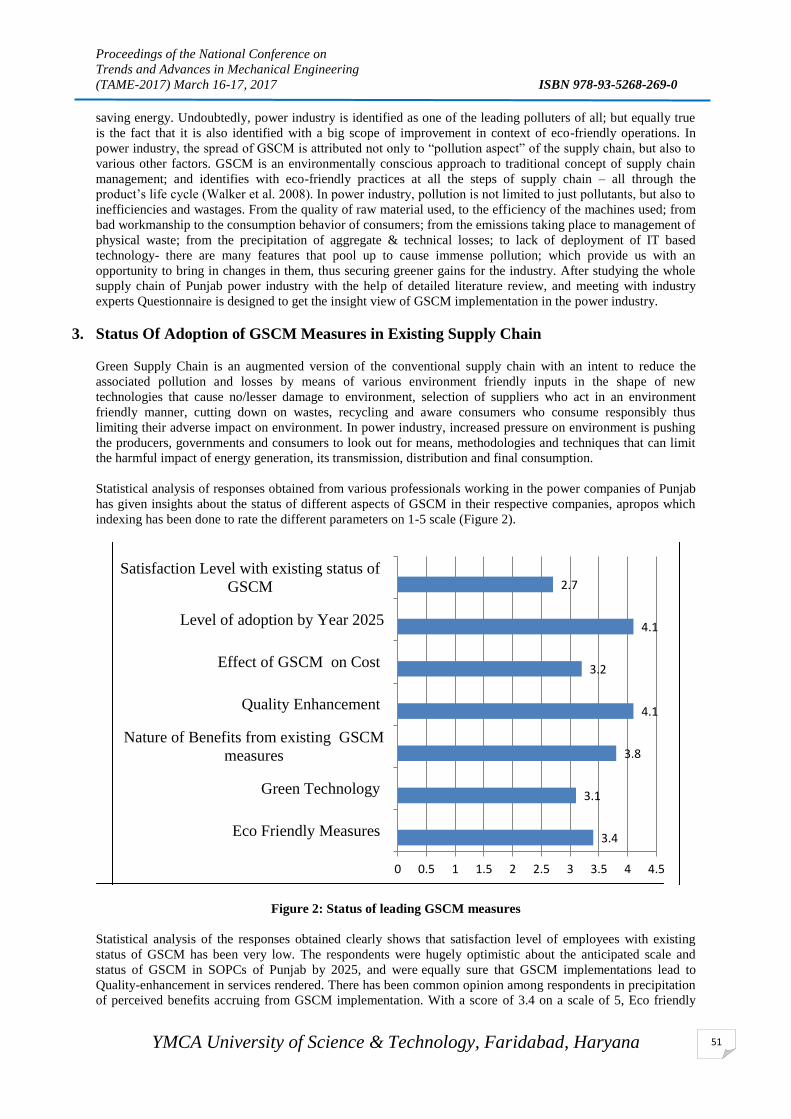
Proceedings of the National Conference on
Trends and Advances in Mechanical Engineering
(TAME-2017) March 16-17, 2017 ISBN 978-93-5268-269-0
YMCA University of Science & Technology, Faridabad, Haryana
51
saving energy. Undoubtedly, power industry is identified as one of the leading polluters of all; but equally true
is the fact that it is also identified with a big scope of improvement in context of eco-friendly operations. In
power industry, the spread of GSCM is attributed not only to “pollution aspect” of the supply chain, but also to
various other factors. GSCM is an environmentally conscious approach to traditional concept of supply chain
management; and identifies with eco-friendly practices at all the steps of supply chain – all through the
product’s life cycle (Walker et al. 2008). In power industry, pollution is not limited to just pollutants, but also to
inefficiencies and wastages. From the quality of raw material used, to the efficiency of the machines used; from
bad workmanship to the consumption behavior of consumers; from the emissions taking place to management of
physical waste; from the precipitation of aggregate & technical losses; to lack of deployment of IT based
technology- there are many features that pool up to cause immense pollution; which provide us with an
opportunity to bring in changes in them, thus securing greener gains for the industry. After studying the whole
supply chain of Punjab power industry with the help of detailed literature review, and meeting with industry
experts Questionnaire is designed to get the insight view of GSCM implementation in the power industry.
3. Status Of Adoption of GSCM Measures in Existing Supply Chain
Green Supply Chain is an augmented version of the conventional supply chain with an intent to reduce the
associated pollution and losses by means of various environment friendly inputs in the shape of new
technologies that cause no/lesser damage to environment, selection of suppliers who act in an environment
friendly manner, cutting down on wastes, recycling and aware consumers who consume responsibly thus
limiting their adverse impact on environment. In power industry, increased pressure on environment is pushing
the producers, governments and consumers to look out for means, methodologies and techniques that can limit
the harmful impact of energy generation, its transmission, distribution and final consumption.
Statistical analysis of responses obtained from various professionals working in the power companies of Punjab
has given insights about the status of different aspects of GSCM in their respective companies, apropos which
indexing has been done to rate the different parameters on 1-5 scale (Figure 2).
Figure 2: Status of leading GSCM measures
Statistical analysis of the responses obtained clearly shows that satisfaction level of employees with existing
status of GSCM has been very low. The respondents were hugely optimistic about the anticipated scale and
status of GSCM in SOPCs of Punjab by 2025, and were equally sure that GSCM implementations lead to
Quality-enhancement in services rendered. There has been common opinion among respondents in precipitation
of perceived benefits accruing from GSCM implementation. With a score of 3.4 on a scale of 5, Eco friendly
3.4
3.1
3.8
4.1
3.2
4.1
2.7
0 0.5 1 1.5 2 2.5 3 3.5 4 4.5
Eco Friendly Measures
Green Technology
Nature of Benefits from existing GSCM
measures
Quality Enhancement
Effect of GSCM on Cost
Level of adoption by Year 2025
Satisfaction Level with existing status of
GSCM

Proceedings of the National Conference on
Trends and Advances in Mechanical Engineering
(TAME-2017) March 16-17, 2017 ISBN 978-93-5268-269-0
YMCA University of Science & Technology, Faridabad, Haryana
52
measures taken by SOPCs have been rated appreciably. Though “Effect of GSCM on Cost” and “Status of
Green Technology” have been given a significant score of 3.2 and 3.1 respectively; they have scored lowly in
comparison to others. But overall, the respondents have exhibited their low satisfaction with existing level of
GSCM in SOPCs with a lowly score of 2.7.
The respondents are hugely optimistic about the anticipated scale and status of GSCM in SOPCs of Punjab by
2025, and are equally sure that GSCM implementations lead to Quality enhancement in services rendered.
There is common opinion among respondents in precipitation of perceived benefits accruing from GSCM
implementation
With a score of 3.4 on a scale of 5, Eco friendly measures taken by SOPCs have been rated appreciably.
Though “Effect of GSCM on Cost” and “Status of Green Technology” have been given a significant score of 3.2
and 3.1 respectively; they have scored lowly in comparison to others.
But overall, the respondents have exhibited their low satisfaction with existing level of GSCM in SOPCs with a
lowly score of 2.7.
It is revealed that there is certainly an awareness of GSCM among the power companies of Punjab. Though
SOPCs in Punjab are implementing GSCM practices, yet there is substantial scope for its growth. Nevertheless,
there is a need to raise awareness about GSCM to other stake holders of the supply chain for extracting desirable
results on the front of conserving environment. Consumers also play a significant role in making the supply
chain green. The cumulative quantum of energy lost due to reckless consumption behaviour has been huge; and
can be saved by raising awareness among consumers about GSCM issues, need-based consumption and energy-
saving measures. Mass awareness drives sponsored by government using various media platforms is
recommended in the current scenario. Punitive actions can be initiated against those who continue with a willful
reckless attitude towards energy consumption.
The big issue is that the management should be smart enough to design a green supply chain, by picking up
those measures, which eventually will help in securing larger gains for the organization. Notwithstanding that,
there certainly exists a cost attached with GSCM implementation, which in some cases exceeds the accruing
gains and thus do not make much business sense. Hence, the idea of adoption of GSCM measures is met with
doubts by a majority of enterprises, who feel that GSCM measures will increase the cost of production and
erode their profits. Interestingly, though in certain cases the proposed GSCM measures cost do outstrip the
tangible gains; yet there are many utilities, especially those from government sector/social service sector that
are ready to bear costs for the sake of a cleaner environment. Nowadays, most organizations are starting to go
green in their businesses as concern to environmental sustainability. They have realized the greater benefit of the
green technology adoption in business operation, which also affected suppliers and customers (Ninlawan et al.,
2011).
4. Conclusions
The study has attempted to assess the level of environmental consciousness as well as the scale of
implementation of environment-friendly practices in the working of state owned power companies of the
Punjab. Environment conservation is an issue that is attaining enhanced importance on a global level, and power
sector is at cross roads with the tag of being one of the major polluting industries, and simultaneously at the
brink of revolutionary transformation precipitating because of evolution of new age technologies leading to
clean/less-polluting power generation mechanisms. The effectiveness of the motivating factors can help the
managers of power companies in Punjab and elsewhere, to recalibrate their GSCM policies to make them more
effective and more delivering.
References
Chien, M.K., Shih, L.H., 2007. An empirical study of the implementation of green supply chain management
practices in the electrical and electronic industry and their relation to organizational performances. International
Journal of Environmental Science and Technology 4 (3), 383-394.
Ninlawan, C., Seksan, P., Tossapol, K. and Pilada, W. (2010). The implementation of green supply chain
management practices in electronics Industry, Proceedings of theInternational Multi Conference of Engineers
and Computer Scientists Hongkong, March 17-19, 2010, 3(1), 1563-1568.

Proceedings of the National Conference on
Trends and Advances in Mechanical Engineering
(TAME-2017) March 16-17, 2017 ISBN 978-93-5268-269-0
YMCA University of Science & Technology, Faridabad, Haryana
53
Rao, P., Holt, D., 2005. Do green supply chains lead to competitiveness and economic performance?
International Journal of Operations & Production Management, 25 (9), 898-916.
Srivastava, K.S., 2007. Green supply-chain management: a state-of-the-art literature review. International
Journal of Management Reviews 9 (1), 53-80.
Walker, H., Di Sisto, L. and Mc Brian, D. 2008. Drivers and barriers to environmental supply chain
management practices: Lessons from the public and private sectors, Journal of Purchasing and Supply Chain
Management, 4(1), 69- 85.
Zhu, Q., Sarkis, J., 2004. Relationships between operational practices and performance among early adopters of
green supply chain management practices in Chinese manufacturing, enterprises, Journal of Operations
Management, 22, 265-289.
Zhu, Q., Sarkis, J. and Lai, K.H. (2012), “Green supply chain management innovation diffusion and its
relationship to organizational improvement: An ecological modernization perspective”, Journal of Engineering
Technology Management, Vol. 29 No. 1, pp.168-185.

Proceedings of the National Conference on
Trends and Advances in Mechanical Engineering
(TAME-2017) March 16-17, 2017 ISBN 978-93-5268-269-0
YMCA University of Science & Technology, Faridabad, Haryana
54
A REVIEW ON 2S LPG DIRECT INJECTION ENGINE
1Rahul Kumar
2Sumit Sharma
3Vipin Kaushik
1 UG Student MAE ASET AUUP Noida
2 Assistant Professor, MAE ASET AUUP Noida
3 Assistant Professor, MAE ASET AUUP Noida
Abstract
Two-stroke engines have renewed the interest of researchers because of their design simplicity, significantly
lower mechanical losses and a higher power to weight ratio when compared with their four-stroke counterparts
having much sophisticated design which require higher mentainance and processing of fuel. In this review work
a comparative study on different methods for the improvement of performance and efficiency of two-stroke
engines has been done. From the study it was found that direct injection of fuel into combustion chamber is an
effective way to reduce the emissions and short circuiting losses. but no work on the lubrication system have
been done on these type of systems, employment of an effective lubrication system and design of an proper
mixing mechanism of fuel and charge in very less time can improve the performance of these engines
significantly.
Keywords: LPG, Top Dead Centre, Bottom Dead Centre, BPO
1. INTRODUCTION
Two-stroke engines are indemand for the situations where there is a requirement of high power to weight ratio,
significantly lower mechanical losses and design simplicity when compared with their four-stroke counterparts
having sophisticated design and higher mentainance and requirement of further processed fuels to reduce
knocking, these have renewed the interest of researchers towards the improvements which can be done to
overcome some of the limitations of two-stroke engines such as irregular combustion at low loads andshort
circuiting of charge in mixture scavenging engines. A considerable amount of improvement can be made by just
reducing the short-circuiting of the charge, our study aims to rectify all loopholes of 2S SI type IC engine coz it
gives major advantage to power generation in 360° rotation of crank shaft.
2. LITERATURE REVIEW
The restricting of short circuiting losses through direct injection of fuel into or in thecylinderby an injector on
cylinder head by Pradeep V [1] have given significant improvement in the thermal efficiency of 2-stroke spark
ignition type engines.the advancement of the engine has also resulted in reduced hydrocarbon emissions and a
better combustion of fuel. The brake thermal efficiency of theengine also improved significantly when
compared with manifold injection due to theformation of a much leaner mixture.In a recent paper a novel
method of direct cylinder barrel injection by twin injectors[2] which lead to a further reduction in the emissions
of hydrocarbons due to a better mixing of fuel with air due to twin injectors. These results give a scope of
improvement in 2-stroke engines with design of an efficient lubrication system and fuel injection system for
aproper mixture of charge.
From (figure. 1) it could be seen that injection process is initiated after the ejection of exhaust gas and clearing
of residual gases by air flow through boost port and transport port. To attain lower hydrocarbon emissions a
principle of engine downsizing have been adopted by 4-stroke engines but it is constrained by excessive
mechanical and thermal loads along with knocking combustions and pre-ignition at low speed[4]. a similar
concept mayhave beenapplied on 2-strokes by decreasing the no of cylindersand the swept volume and shifting
the operating region towards higher loads. these may lead to knocking and thermal stress in engines but with the
advantage of doubled firing frequency in 2-strokes[5], it can work. This concept seems to be efficient and cost
effective.
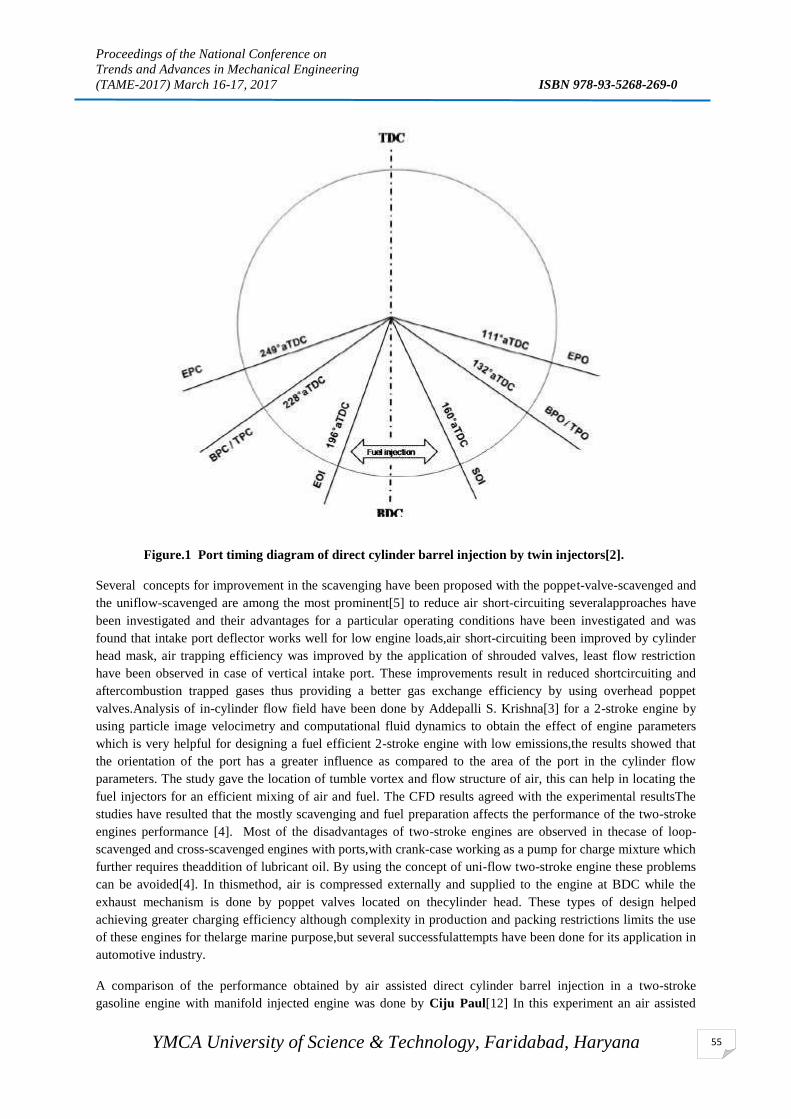
Proceedings of the National Conference on
Trends and Advances in Mechanical Engineering
(TAME-2017) March 16-17, 2017 ISBN 978-93-5268-269-0
YMCA University of Science & Technology, Faridabad, Haryana
55
Figure.1 Port timing diagram of direct cylinder barrel injection by twin injectors[2].
Several concepts for improvement in the scavenging have been proposed with the poppet-valve-scavenged and
the uniflow-scavenged are among the most prominent[5] to reduce air short-circuiting severalapproaches have
been investigated and their advantages for a particular operating conditions have been investigated and was
found that intake port deflector works well for low engine loads,air short-circuiting been improved by cylinder
head mask, air trapping efficiency was improved by the application of shrouded valves, least flow restriction
have been observed in case of vertical intake port. These improvements result in reduced shortcircuiting and
aftercombustion trapped gases thus providing a better gas exchange efficiency by using overhead poppet
valves.Analysis of in-cylinder flow field have been done by Addepalli S. Krishna[3] for a 2-stroke engine by
using particle image velocimetry and computational fluid dynamics to obtain the effect of engine parameters
which is very helpful for designing a fuel efficient 2-stroke engine with low emissions,the results showed that
the orientation of the port has a greater influence as compared to the area of the port in the cylinder flow
parameters. The study gave the location of tumble vortex and flow structure of air, this can help in locating the
fuel injectors for an efficient mixing of air and fuel. The CFD results agreed with the experimental resultsThe
studies have resulted that the mostly scavenging and fuel preparation affects the performance of the two-stroke
engines performance [4]. Most of the disadvantages of two-stroke engines are observed in thecase of loop-
scavenged and cross-scavenged engines with ports,with crank-case working as a pump for charge mixture which
further requires theaddition of lubricant oil. By using the concept of uni-flow two-stroke engine these problems
can be avoided[4]. In thismethod, air is compressed externally and supplied to the engine at BDC while the
exhaust mechanism is done by poppet valves located on thecylinder head. These types of design helped
achieving greater charging efficiency although complexity in production and packing restrictions limits the use
of these engines for thelarge marine purpose,but several successfulattempts have been done for its application in
automotive industry.
A comparison of the performance obtained by air assisted direct cylinder barrel injection in a two-stroke
gasoline engine with manifold injected engine was done by Ciju Paul[12] In this experiment an air assisted
Proceedings of the National Conference on
Trends and Advances in Mechanical Engineering
(TAME-2017) March 16-17, 2017 ISBN 978-93-5268-269-0
YMCA University of Science & Technology, Faridabad, Haryana
56
injector was mounted above the exhaust port and opposite to it on the cylinder barrel and pointing towards the
head. For supply of lubricating oil into intake air stream a separate lubricating oil pump was used.In most of the
papers there is not much work done for improvement in the lubrication system of two-stroke engines. In a crank
scavenged two-stroke engine lubricating oil is mixed with the fuel which during its circulation in engine
lubricates the crankshaft and cylinder but it is not as efficient as compared to the lubrication system of a 4-stroke
engine as the addition of lubricant in fuel causes improper combustion, In a recent studies on two-stroke
enginelubricating oil was supplied into the intake manifold in a metered quantity which was controlled by a
solenoid operated pump[1] but the efficiency of this lubrication system needs to be calculated and compared
with other lubrication systems, the large two-stroke marine engines employ alpha lubrication system[6-8] in
which the upper portion including cylinder unit is lubricated by cylinder oil which is injected into the cylinder
forming a fume of oil between cylinderwall and piston and after the stroke it is drained into sludge tank for
disposal while the lower parts including crankshaft is lubricated by a fluid called system oil. This lubrication
system might not be efficient for engines which work at larger speed, therefore an efficient lubrication system
needs to be employed for a two-stroke engine for durability.
3. RESULT AND DISCUSSION
In this paper, a review of the advantages of two-stroke engines over four-stroke have been done and the need for
further improvement in the two-strokes have been discussed as they can't be replaced from the applications
because of their unique features for the further improvement in two-stroke engines, it is suggested that
An effective lubrication system needs to be employed for two-stroke engines, in which there is a scope of re-
usability of lubricating oil so that the lubrication does not affect the combustion of charge inside the combustion
chamber for better performance, low exhaust emission, improved thermal efiiciency via betterment in
volumetric efficiency (breathing capacity of engine) and durability of theengine.
Design of engine should be done the specific application,CFD analysis is very helpful for preparing
homogeneous mixture of air and fuel via better turbulence.
Direct injection of fuel inside the combustion chamber have reduced the short-circuiting losses significantly
loop-scavenged and cross-scavenged two-stroke engines could be replaced by direct injection to prevent short
circuiting.
Emissions could be further reduced by design of an effective mixing mechanism and advanced timing along
with direct injection.
Better cleaning of combustion chamber can be done by letting initial air to be expelled outside in the
environment unburned for better combustion of fresh charge.
CONCLUSION
A review on the scope of further improvement in efficiency of two-stroke engines due to increasing demand
forhigher power to weight ratioand design simplicity. From the review of recent works on two-stroke engines, a
lot of scopes ofimprovement have been found. The further improvement in the lubrication system of two-strokes
which does notaffect the combustion process and reused as in four-strokes could improve the performance
significantly.Finally this review work can be concluded with remark that 2S can actually perform better if some
problems like short circuiting, lubrication and proper mixing of charge can resolved.
REFERENCE
[1] V. Pradeep, ShamitBakshi, Dr. A. Ramesh,” Direct injection of gaseous LPG in a two-stroke SI engine for
improved performance”Applied Thermal Engineering, Volume 89, 5 October 2015
[2] V. Pradeep, A. Ramesh ⇑ “A novel twin injector strategy for direct cylinder barrel injection of LPG in a 2S-
SI engine” Fuel, Volume 162 (2015) 128–137
[3]Addepalli S. Krishna a, J. M. Mallikarjuna a,⇑, Davinder Kumar b “Effect of engine parameters on in-
cylinder flows in a two-stroke gasoline

Proceedings of the National Conference on
Trends and Advances in Mechanical Engineering
(TAME-2017) March 16-17, 2017 ISBN 978-93-5268-269-0
YMCA University of Science & Technology, Faridabad, Haryana
57
direct injection engine” Applied Energy volume 176 (2016) 282–294
[4]MackliniDalla Nora ⇑, Hua Zhao “High load performance and combustion analysis of a four-valve direct
injection gasoline engine running in the two-stroke cycle” Applied Energy, Volume 159 (2015) 117–131
[5]MackliniDalla Nora ⇑, Thompson DiórdinisMetzkaLanzanova, Hua Zhao “Effects of valve timing, valve lift
and exhaust backpressure on performance and gas exchanging of a two-stroke GDI engine with overhead
valves” Energy Conversion and Management, Volume 123 (2016) 71–83
[6] David Boullosa⇑, Juan Luis Larrabe, Alberto Lopez, Miguel Angel Gomez “Monitoring through T2
Hotelling of cylinder lubrication process of
marine diesel engine” Applied Thermal Engineering, Volume 110 (2017) 32–38
[7] F.A. Sautermeister n, M.Priest,P.M.Lee,M.F.Fox “Impact of sulphuric acid on cylinder lubrication for large
2-stroke marine diesel engines: Contact angle, interfacial tension, and chemical interaction” Tribology
International, Volume 59 (2013) 47–56
[8] Alberto Villar a,⁎, Santiago Fernández a, EnekoGorritxategi b, José I. Ciria c, Luis A. Fernández d
“Optimization of the multivariate calibration of a Vis–NIR sensor for the on-line monitoring of marine diesel
engine lubricating oil by variable selection methods” Chemometrics and Intelligent Laboratory Systems,
Volume 130 (2014) 68–75
[9]Kaimin Liu a, Jing Yang a,⇑, Wu Jiang a, Yangtao Li c, Yi Wanga, Renhua Feng b, Xiaoqiang Chen a, Kai
Maa “Effect of asynchronous valve timing on combustion characteristic
and performance of a high-speed SI marine engine with five valves” Energy Conversion and Management,
Volume 123 (2016) 185–199
[10]Rui Liu, Minxiang Wei, Haiqing Yang “Cold Start Control Strategy for a Two-stroke Spark Ignition Diesel-
fuelled Engine with Air-assisted Direct Injection” Applied Thermal Engineering, 21 July 2016
[11] J. Benajes, J. Martín, R. Novella ⇑, K. Thein “Understanding the performance of the multiple injection
gasolinepartially premixed combustion concept implemented in a 2-Stroke high-speed direct injection
compression ignition engine” Applied Energy, Volume 161 (2016) 465–475
[12] Ciju Paul, Pradeep V, A Ramesh “Air assisted direct cylinder barrel injection of gasoline in a two-stroke
S.I. engine” SAE Technical Paper 2013-01-0583, 2013
[13] Pradeep V, Varuna N J, Shamit B, Ramesh A "Boost Port Injection of LPG in a Two - Stroke SI Engine
for Reduction in HC Emissions," SAE Technical Paper 2013-01-0584, 2013,
[14]Loganathan M, Ramesh A. “Development and testing of a novel direct mixture injection system for a two-
stroke SI engine”. SAE Technical Paper 2008-32-0077; 2008.
[15]Loganathan M, Ramesh A. Development and testing of a novel direct mixture injection system for a two-
stroke SI engine. SAE technical paper 2008-32-0077; 2008
Proceedings of the National Conference on
Trends and Advances in Mechanical Engineering
(TAME-2017) March 16-17, 2017 ISBN 978-93-5268-269-0
YMCA University of Science & Technology, Faridabad, Haryana
58
SOME STUDIES OF NAVIGATION SYSTEM FOR SOLAR
POWEREDAUTONOMOUS VEHICLE
MohammadWaseem1, A F Sherwani
2 and Mohd Suhaib
3
1Research Scholar, Department of Mechanical Engg,Jamia Millia Islamia,New Delhi-110025, India,e-mail:
[email protected] 2AssociateProfessors, Department of Mechanical Engg, Jamia Millia Islamia, New Delhi-110025, India
3Professors, Department of Mechanical Engg, Jamia Millia Islamia, New Delhi-110025, India
Abstract
Autonomous vehicle technology is getting increasing magnitude of attraction from Research and
Developmentdepartment due to numerous characteristics such asrobust design, more reliability and safety point
of view in future. Mechatronics is aversatile tool for enhancing automation technology. Renewable energy
resources (i.e. solar, wind, bio-energy) are getting more attention due to global sustainability challenge of
reducing greenhouse gas emissions and global warming. Solar powered autonomous vehicle is an automatic
guided Vehicle (AGV) or self-driven vehicle which is powered by photovoltaic (PV) solar energy, controlled by
power electronics and micro-controller and directed by avoidance IR sensors. The most essential part of any
mobile robot or AGV is its navigation system; it enables to sense the location of AGV, navigate its way
towarddesired destination, and then avoid obstacles it encounters for collision in dynamic environment.
Navigation serves as the major limitation of the overall performance, accuracy and robustness of an
autonomous vehicle. In the present work, implementation and integration of different navigation system for AGV
guidance have been studied and overviewed.
Keywords: Autonomous Guided Vehicle (AGV), Photovoltaic (PV), artificial intelligent (AE) and Infra-Red (IR)
1. Introduction
In the world at present time, energy crisis are the prime issue as fossils fuel and uranium are the only available
conventional energy resources while uranium is mostly used for nuclear power production and its need greater
attention. So the main sources of energy available are fossils fuels like petroleum, coal and natural gas.
Combustion by-products of fossils fuels contain a number of harmful gasses as carbon dioxide and carbon
monoxide etc. Masoodet al. (2014).Internal combustion engines technology is the most widely used technology
in existing transportation system while the world population and energy consumption increases, vehicles
emission are dominating environmental issues such as air, land and water pollution Alahmad et al. (2011).
Renewable resources of energy such as biomass production, wind kinetic energy, geo-thermal energy and solar
cells technology getting more attention due to their non-polluting nature, eco-friendly and environment safety
meritorious characteristics Simaes et al. (1998).
Seeking Electric drives not only troubleshoots the pollution issue but introduction of more electric controls
imparts accuracy and precision in the ways of power & vehicle handling. The automobile industries introduced
hybrid electrical vehicle to minimize the application of combustion engine by integrating electric drive system
i.e. electric motor. This technology has a positive environment effect and creating zero pollution Hannan et al.
(2014). Autonomous guided vehicles (AGVs) are the robots which employed intelligent system to transfer
effectively material and goods from one pick up point to another drop-up destination in ware houses,
manufacturing system, hospitals etc.Hossain and Ali (2010).
In case of solar power assisted robot, solar energy can be stored in batteries and electric drives are the best
means of converting this stored energy in batteries into useful mechanical work to drive the vehicle. How the
mobile robots interact with its surrounding environment to reach the desired destination without any human is
done by navigation system. In this paper, different navigation systems used in autonomous robots are reviewed.

Proceedings of the National Conference on
Trends and Advances in Mechanical Engineering
(TAME-2017) March 16-17, 2017 ISBN 978-93-5268-269-0
YMCA University of Science & Technology, Faridabad, Haryana
59
2. Review of Solar Powered Assisted Robot
Autonomous guided vehicles (AGVs) are an important issue in automotive industry due to their safety,
comfortability and flexibility.Autonomous guided vehicle which have the ability to self-locate their position and
find out the feasible path for motion execution on terrain, these vehicle are better referred as “self-moving
vehicle” or “unmanned guided vehicle”. AGVs play an important role for developing and under developing
countries to speed up production and accuracy of product in hazardous industrial environment for human
workers.
Villagra and Parez (2010) has presented fuzzy and vector pursuit based non-linear control techniques for robust
path tracking in industrial environment by automated guided vehicles during load transfer operation. Butdee
and Suebsomran (2009) and Amit Arup Nayaket al. (2012) has discussed image processing vision based
technique for automated guided vehicles moving from starting point to reach its destination while path is not
clear or discontinuity in guide line.Navigation system of an autonomous vehicle is primary aspect as it must be
able to sense its position, navigate its way toward goal and avoid obstacles it encounters. Abe et al. (1998) has
presented vision based navigation system with variable template matching for autonomous mobile robot to
diagnose landmark of different size by optimizing evolution strategy methodology. Wang et al. (2015) presented
improved vision based navigation system with fuzzy control algorithm for automatically transport equipment i.e.
AGV which has low cost, easy installation and electromagnetic interference. Cucchiara et al. (2007) addressed
stereo vision based navigation system to develop an integrated framework, obstacle detection, ability to impart
self-location and efficient monitoring in real time for autonomous guided vehicle at indoor as well as outdoor
working applications. Gulalkari et al. (2015) presented a kinect camera sensor operated object tracking and
following system for four wheel independent steering automated guided vehicle using kalman filter and stepping
control technique to calculate the global position and velocity coordinates of moving object. Sahoo et al. (2012),
proportional and proportional integral (PI) controllers has been designed and implemented to get the desired
heading angle during vehicle dynamics for an autonomous ground vehicle (AGV). Duinkerken and
Lodewijks(2015) summarized research towards performance improvement of automatic transport system for
free ranging and positioning capabilities of AGVs by creating promoted routing techniques. They designed and
developed an embedded vehicular controller with a real time operating vision navigation system for a two wheel
differential driven AGV to improve its working performance, cost and reliability.
3. Navigation System for Solar Powered Assisted Robot
Wissinget.al (2015) presents a hybrid navigation system for meacnum based omnidirectional Automated Guided
Vehicles (AGV). It is divided into a classical guidance system for the offline planning procedure and an online
reactive system for collision avoidance in dynamic environments. The authors AGV framework is implemented
as distributed system for advanced controllability and scalability.
Figure1. Omni directional AGV,Wissing et.al (2015)
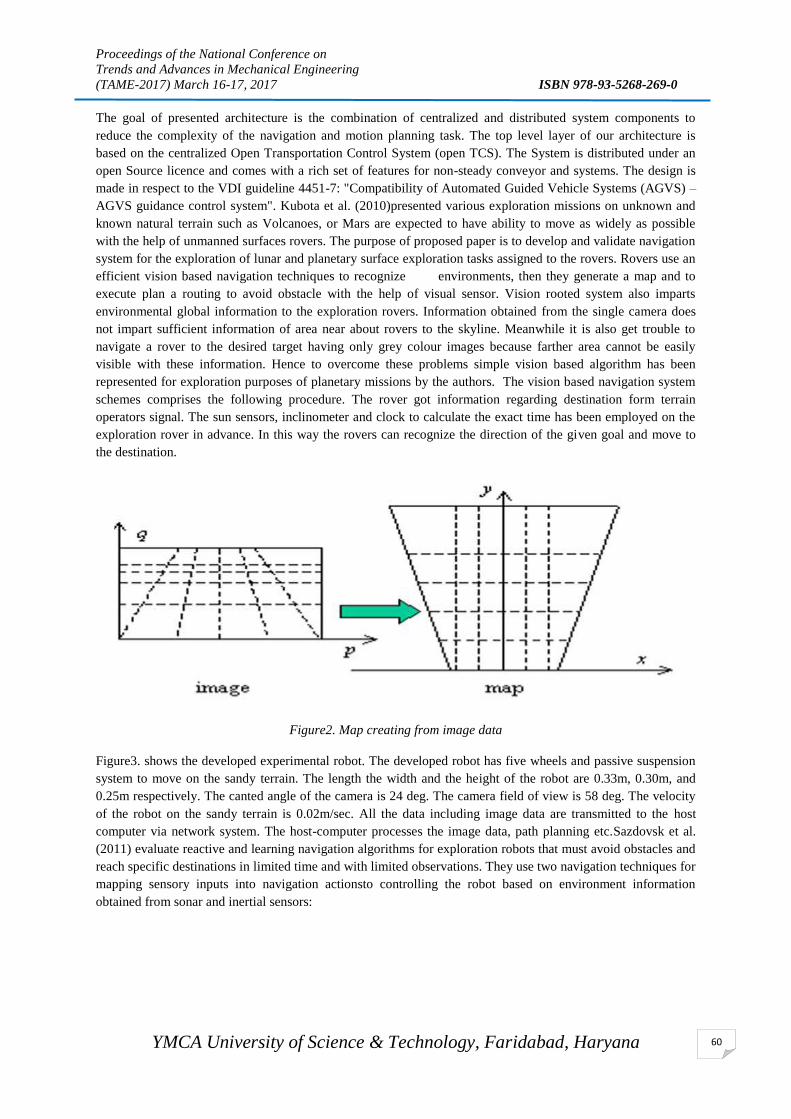
Proceedings of the National Conference on
Trends and Advances in Mechanical Engineering
(TAME-2017) March 16-17, 2017 ISBN 978-93-5268-269-0
YMCA University of Science & Technology, Faridabad, Haryana
60
The goal of presented architecture is the combination of centralized and distributed system components to
reduce the complexity of the navigation and motion planning task. The top level layer of our architecture is
based on the centralized Open Transportation Control System (open TCS). The System is distributed under an
open Source licence and comes with a rich set of features for non-steady conveyor and systems. The design is
made in respect to the VDI guideline 4451-7: "Compatibility of Automated Guided Vehicle Systems (AGVS) –
AGVS guidance control system". Kubota et al. (2010)presented various exploration missions on unknown and
known natural terrain such as Volcanoes, or Mars are expected to have ability to move as widely as possible
with the help of unmanned surfaces rovers. The purpose of proposed paper is to develop and validate navigation
system for the exploration of lunar and planetary surface exploration tasks assigned to the rovers. Rovers use an
efficient vision based navigation techniques to recognize environments, then they generate a map and to
execute plan a routing to avoid obstacle with the help of visual sensor. Vision rooted system also imparts
environmental global information to the exploration rovers. Information obtained from the single camera does
not impart sufficient information of area near about rovers to the skyline. Meanwhile it is also get trouble to
navigate a rover to the desired target having only grey colour images because farther area cannot be easily
visible with these information. Hence to overcome these problems simple vision based algorithm has been
represented for exploration purposes of planetary missions by the authors. The vision based navigation system
schemes comprises the following procedure. The rover got information regarding destination form terrain
operators signal. The sun sensors, inclinometer and clock to calculate the exact time has been employed on the
exploration rover in advance. In this way the rovers can recognize the direction of the given goal and move to
the destination.
Figure2. Map creating from image data
Figure3. shows the developed experimental robot. The developed robot has five wheels and passive suspension
system to move on the sandy terrain. The length the width and the height of the robot are 0.33m, 0.30m, and
0.25m respectively. The canted angle of the camera is 24 deg. The camera field of view is 58 deg. The velocity
of the robot on the sandy terrain is 0.02m/sec. All the data including image data are transmitted to the host
computer via network system. The host-computer processes the image data, path planning etc.Sazdovsk et al.
(2011) evaluate reactive and learning navigation algorithms for exploration robots that must avoid obstacles and
reach specific destinations in limited time and with limited observations. They use two navigation techniques for
mapping sensory inputs into navigation actionsto controlling the robot based on environment information
obtained from sonar and inertial sensors:

Proceedings of the National Conference on
Trends and Advances in Mechanical Engineering
(TAME-2017) March 16-17, 2017 ISBN 978-93-5268-269-0
YMCA University of Science & Technology, Faridabad, Haryana
61
Figure3. Overview of experimental environment, Kubota et al. (2010)
a. Rule-Based Navigation: This algorithm give action based on rule choice depends on state information
collected. The choice is rooted on distributions of predetermined probability constructed from predefined robot
capabilities and empirical behaviour of data.
b. Neuro-Evolved Navigation: it is a Multi-Layer Perceptron (MLP) rooted controller which interprets
environment information,for each potential path and a path quality value is suggested using the same state
information as the rule-based navigation algorithm. In this algorithm, the state information is fed directly to an
MLP and the output of the MLP is used as the path quality.
Two state variables are presented to encode the sensor information (i) object distance and (ii) destination
heading.
Figure4. Graphical representation of state and action space,Sazdovsk et al. (2011)
A fuzzy logic navigation controller for an inter row agriculture robot is developed and evaluated by Troyer et al.
(2016). One dimensional ranging sensor mounted on the robotic platform, sends signal to fuzzy controller then
ten fuzzy rules are employed for row following movement. Small track vehicle was employed for
experimentation robotic platform. The steady and transient state response of the controller was characterized
from the interfacing, defuzzification, step response. The main components used for robot platform are
sabertooth motor drive made by LLC, 5 Ah lithium cell of turnigy power system are two Lidar ranging sensors.
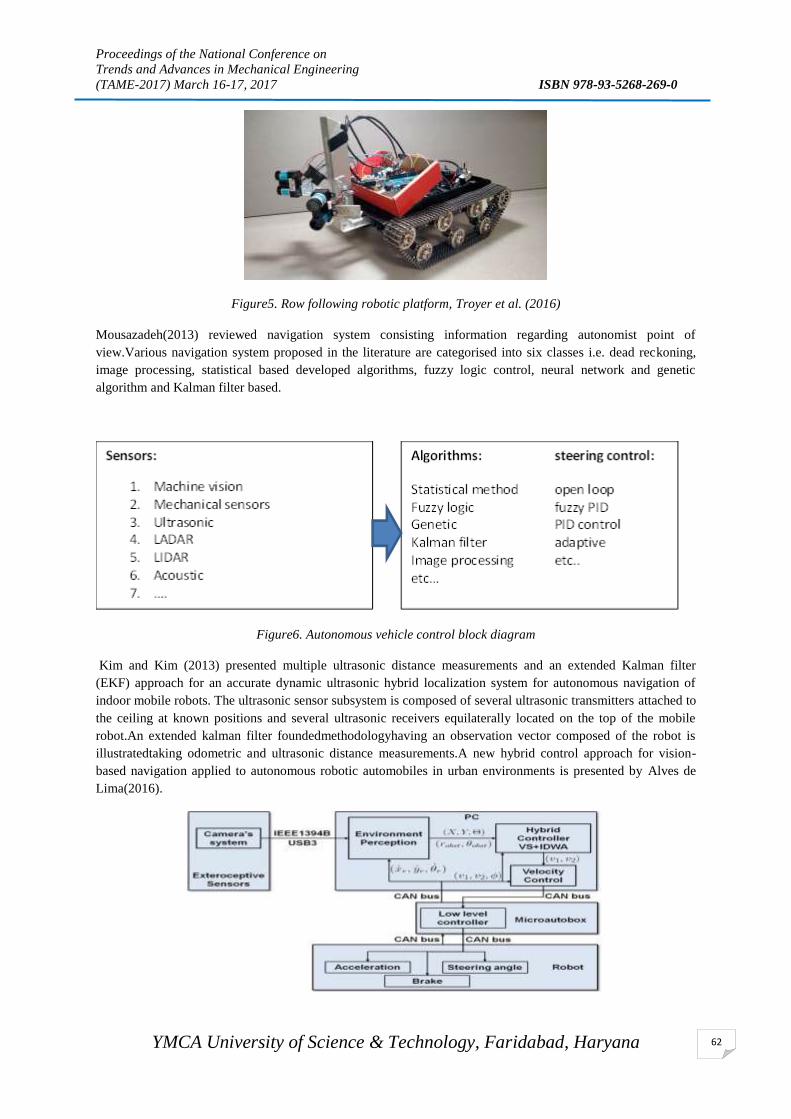
Proceedings of the National Conference on
Trends and Advances in Mechanical Engineering
(TAME-2017) March 16-17, 2017 ISBN 978-93-5268-269-0
YMCA University of Science & Technology, Faridabad, Haryana
62
Figure5. Row following robotic platform, Troyer et al. (2016)
Mousazadeh(2013) reviewed navigation system consisting information regarding autonomist point of
view.Various navigation system proposed in the literature are categorised into six classes i.e. dead reckoning,
image processing, statistical based developed algorithms, fuzzy logic control, neural network and genetic
algorithm and Kalman filter based.
Figure6. Autonomous vehicle control block diagram
Kim and Kim (2013) presented multiple ultrasonic distance measurements and an extended Kalman filter
(EKF) approach for an accurate dynamic ultrasonic hybrid localization system for autonomous navigation of
indoor mobile robots. The ultrasonic sensor subsystem is composed of several ultrasonic transmitters attached to
the ceiling at known positions and several ultrasonic receivers equilaterally located on the top of the mobile
robot.An extended kalman filter foundedmethodologyhaving an observation vector composed of the robot is
illustratedtaking odometric and ultrasonic distance measurements.A new hybrid control approach for vision-
based navigation applied to autonomous robotic automobiles in urban environments is presented by Alves de
Lima(2016).

Proceedings of the National Conference on
Trends and Advances in Mechanical Engineering
(TAME-2017) March 16-17, 2017 ISBN 978-93-5268-269-0
YMCA University of Science & Technology, Faridabad, Haryana
63
Figure7. System diagram for the experimental vehicle APACHE,Alves de Lima (2016)
Faraz and Azad (2012) and Shaha and Uddin (2013) proposed hybrid energy based electric auto rickshaw is
proposed for the purpose to find out an efficient model vehicle having enhanced range of driving capacity.
Paudel and Kreutzmann (2015) Globally, fossils fuel based transportation is the key transportation, causing
unexpected outcomes such as air, noise pollution, changes in climate, deficiency in natural visibility, accidental
issues and water as well ground sealing problems.Sarkar et al. (2014) presented electrical power system design
and development of a solar electrical vehicle which utilized the photovoltaic solar panel to extract solar energy
and converts into useful electrical energy to drive the electrical system.
4. Conclusion
Automated vehicles aremechatronics devices in modern world with various combinations of technologies to
minimize human effort and impart robust outcomes for the work assigned to them. Autonomous guided vehicles
are the mobile robots that automatically transport desired equipment/part to enhance automation in logistic
system. Navigation of robots is composed of sensors, algorithms and controllers to make it complete autonomic
machine. Various navigation systems proposed to make a robot an intelligent automatic machine are discussed
and reviewed. Future work involves implantation of hybrid navigation system in solar powered assisted
autonomous ground vehicle.
References
1. Abe, Y., Shikano, M., Fukuda, T., Arai, F. and Tanaka, Y. (1998). Vision based navigation system by variable
template matching for autonomous mobile robot. Proceedings. 1998 IEEE International Conference on
Robotics and Automation (Cat. No.98CH36146).
2. Alahmad M., Chaaban M. A. and Chaar L., 2011. A Novel Photovoltaic/Battery Structure for Solar Electrical
Vehicles [PVBS for SEV]. IEEE Vehicle Power and Propulsion Conference, pp. 1-4.
3. Alves de Lima, D. and Correa Victorino, A. (2016). A Hybrid Controller for Vision-Based Navigation of
Autonomous Vehicles in Urban Environments. IEEE Transactions on Intelligent Transportation Systems, 17(8),
pp.2310-2323.
4. Amit Arup Nayak, Deepankar Singh Purniya, GigyanshuRanjanPradhan, and Sa, P. (2012). Robotic navigation
in the presence of static and dynamic obstacles. 2012 Annual IEEE India Conference (INDICON).
5. Butdee S. and Suebsomran A., 2009. Automatic Guided Vehicle Control by Vision System. IEEE International
Conference on Industrial Engineering and Engineering Management, pp. 694-697.
6. Cucchiara R., Perini E., and Pistoni G., 2007. Efficient Stereo Vision for Obstacle Detection and AGV
Navigation. 14th International Conference on Image Analysis and Processing (ICIAP 2007), pp. 291-296.
7. Duinkerken M. B. and Lodewijks G., 2015. Routing Of AgvsOn Automated Container Terminals. IEEE 19th
International Conference on Computer Supported Cooperative Work in Design (CSCWD), pp. 401-406.
8. FarazT.and Azad A.. 2012. Solar Battery Charging Station and Torque Sensor Based Electrically Assisted
Tricycle. IEEE Global Humanitarian Technology Conference, pp. 18-22.
9. Gulalkari, A., Sheng, D., Pratama, P., Kim, H., Byun, G. and Kim, S. (2015). Kinect camera sensor-based object
tracking and following of four wheel independent steering automatic guided vehicle using Kalman filter. 2015
15th International Conference on Control, Automation and Systems (ICCAS).
10. Hannan M. A.,.Azidin F. A and.MohamedA, 2014. Hybrid electric vehicles and their challenges: A review.
Renewable and Sustainable Energy Reviews, vol. 29, pp. 135-150.
11. Hossain S. G. M. and Ali M. Y., 2010. Automated Guided Vehicles for Industrial Logistics - Development Of
Intelligent Prototypes Using Appropriate Technology. The 2nd International Conference on Computer and
Automation Engineering (ICCAE), vol. 5, pp. 237-241.
12. Kim, S. and Kim, B. (2013). Dynamic Ultrasonic Hybrid Localization System for Indoor Mobile Robots. IEEE
Transactions on Industrial Electronics, 60(10), pp.4562-4573.
13. Kubota T., Sato T., and Ejiri R., 2010. Experimental Study on Visual Navigation for Exploration Robot. IFAC
Proceedings Vol. 43, pp. 169-174.
14. Masood B., Naqvi R. A and Asif R. M., 2014. Designing of a Control Scheme for the Solar Rickshaw in
Comparative Study with Conventional Auto Rickshaw. 4th International Conference on Engineering
Technology and Technopreneuship (ICE2T), pp. 324-329.
15. MousazadehH.. 2013. A Technical Review on Navigation Systems of Agricultural Autonomous off-Road
Vehicles. Journal of Terramechanics pp.211-232.
Proceedings of the National Conference on
Trends and Advances in Mechanical Engineering
(TAME-2017) March 16-17, 2017 ISBN 978-93-5268-269-0
YMCA University of Science & Technology, Faridabad, Haryana
64
16. Paudel A. M., and Kreutzmann P., 2015. Design and Performance Analysis Of A Hybrid Solar Tricycle For A
Sustainable Local Commute. Renewable and Sustainable Energy Reviews, vol.41, pp. 473-482.
17. Sahoo S., Subramanian S. C., and SrivastavaS.. 2012. Design And Implementation Of A Controller For
Navigating An Autonomous Ground Vehicle. 2nd International Conference on Power, Control and Embedded
Systems, pp. 1-6.
18. Sarkar T., Sharma M., and. Gawre S. K., 2014. A Generalized Approach To Design The Electrical Power
System of A Solar Electric Vehicle. IEEE Students' Conference on Electrical, Electronics and Computer
Science, pp. 1-6, 2014.
19. Sazdovski, V., Stankovski, M., KolemisevskaGugulovska, T. and Deskovski, S. (2011). One Approach to the
Integration of Low-Cost Inertial Sensors and Global Positioning System for Mobile Robots. IFAC Proceedings
Volumes, 44(1), pp.10746-10751.
20. Shaha N. and Uddin M. B.. 2013. Hybrid Energy Assisted Electric Auto Rickshaw Three-Wheeler.
International Conference on Electrical Information and Communication Technology (EICT), pp.1-6.
21. Simaes M. G., Franceschetti N. N. and Adamowski J. C., 1998. Drive: System Control And Energy
Management Of A Solar Powered Electric Vehicle. Applied Power Electronics Conference and Exposition
(APEC). vol. 1, pp. 49 – 55.
22. Troyer, T., Pitla, S. and Nutter, E. (2016). Inter-row Robot Navigation using 1D Ranging Sensors. IFAC-
PapersOnLine, 49(16), pp.463-468.
23. Villagra J. and Herrero-Perez D., 2012. A Comparison of Control Techniques For Robust Docking Maneuvers
of An AGV. IEEE Transactions on Control Systems Technology, vol. 20, no..4, pp. 1116-1123.
24. Wang, C., Wang, L., Qin, J., Wu, Z., Duan, L., Cao, M., Li, Z., Weiguangli, Lu, Z., Ling, Y., Li, M., Wang, Y.,
Long, J., Huang, M., Li, Y. and Wang, Q. (2015). Development of a vision navigation system with Fuzzy
Control Algorithm for Automated Guided Vehicle. 2015 IEEE International Conference on Information and
Automation.
25. Wissing M, Kuenemund F, Hess D, Roehrig C., 2014. Hybrid Navigation System for Mecanum Based
Omnidirectional Automated Guided Vehicles. Proceedings of 41st International Symposium on Robotics
ISR/Robotik pp. 1-6.

Proceedings of the National Conference on
Trends and Advances in Mechanical Engineering
(TAME-2017) March 16-17, 2017 ISBN 978-93-5268-269-0
YMCA University of Science & Technology, Faridabad, Haryana
65
THE EFFECT OF DEDICATED MECHANICAL SUBCOOLING ON
THE PERFORMANCE OF A VAPOUR COMPRESSION
REFRIGERATION SYSTEM IN WINTER
Tushar Singh
Department of Mechanical Engineering, National Institute of Technology Kurukshetra, Haryana, 136119, India.
Phone: +91-8607455364, e-mail: [email protected]
Abstract
In this work, effects of employing a dedicated mechanical subcooling cycle with a conventional vapor
compression refrigeration system are experimentally investigated, in terms of energy, in winter season. An
experimental analysis of the performance of the system is performed with and without the subcooling loop. This
is conducted to find out the percentage increase in cooling capacity due to use of a dedicated mechanical
subcooling loop. R134a is used as the refrigerant in the main as well as dedicated subcooling cycle. The
experimental results indicate that the cooling capacity of the system increased by approximately 180 W due to
the effect of subcooling. Furthermore, general trend of results indicated that ambient temperature variation has
an inverse effect on the increase in capacity. The experimental study indicates that dedicated subcooling can be
utilized for increasing cooling capacity and efficiency of a conventional system.
Keywords: Subcooling, Refrigeration, Compressor, Subcooler, Capacity
Nomenclature
cp: specific heat (kJ kg-1
K-1
)
COP: coefficient of performance
h: specific enthalpy (kJ kg-1
)
: mass flow rate of refrigerant (kg s-1
)
: heat transfer rate (kW)
T: temperature (˚C or K)
: work load (kW)
𝜂: efficiency
Subscripts
am: ambient
comp: compressor
evp: evaporator
m: main cycle
max: maximum
sbc: subcooler cycle
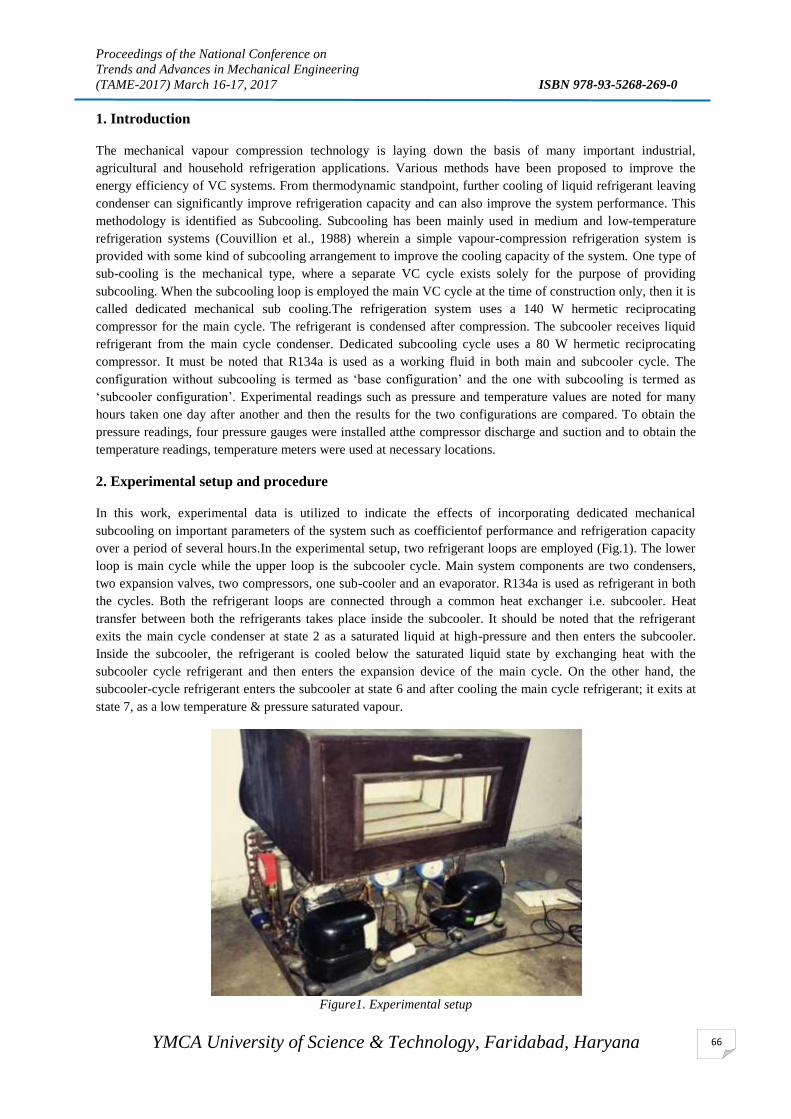
Proceedings of the National Conference on
Trends and Advances in Mechanical Engineering
(TAME-2017) March 16-17, 2017 ISBN 978-93-5268-269-0
YMCA University of Science & Technology, Faridabad, Haryana
66
1. Introduction
The mechanical vapour compression technology is laying down the basis of many important industrial,
agricultural and household refrigeration applications. Various methods have been proposed to improve the
energy efficiency of VC systems. From thermodynamic standpoint, further cooling of liquid refrigerant leaving
condenser can significantly improve refrigeration capacity and can also improve the system performance. This
methodology is identified as Subcooling. Subcooling has been mainly used in medium and low-temperature
refrigeration systems (Couvillion et al., 1988) wherein a simple vapour-compression refrigeration system is
provided with some kind of subcooling arrangement to improve the cooling capacity of the system. One type of
sub-cooling is the mechanical type, where a separate VC cycle exists solely for the purpose of providing
subcooling. When the subcooling loop is employed the main VC cycle at the time of construction only, then it is
called dedicated mechanical sub cooling.The refrigeration system uses a 140 W hermetic reciprocating
compressor for the main cycle. The refrigerant is condensed after compression. The subcooler receives liquid
refrigerant from the main cycle condenser. Dedicated subcooling cycle uses a 80 W hermetic reciprocating
compressor. It must be noted that R134a is used as a working fluid in both main and subcooler cycle. The
configuration without subcooling is termed as ‘base configuration’ and the one with subcooling is termed as
‘subcooler configuration’. Experimental readings such as pressure and temperature values are noted for many
hours taken one day after another and then the results for the two configurations are compared. To obtain the
pressure readings, four pressure gauges were installed atthe compressor discharge and suction and to obtain the
temperature readings, temperature meters were used at necessary locations.
2. Experimental setup and procedure
In this work, experimental data is utilized to indicate the effects of incorporating dedicated mechanical
subcooling on important parameters of the system such as coefficientof performance and refrigeration capacity
over a period of several hours.In the experimental setup, two refrigerant loops are employed (Fig.1). The lower
loop is main cycle while the upper loop is the subcooler cycle. Main system components are two condensers,
two expansion valves, two compressors, one sub-cooler and an evaporator. R134a is used as refrigerant in both
the cycles. Both the refrigerant loops are connected through a common heat exchanger i.e. subcooler. Heat
transfer between both the refrigerants takes place inside the subcooler. It should be noted that the refrigerant
exits the main cycle condenser at state 2 as a saturated liquid at high-pressure and then enters the subcooler.
Inside the subcooler, the refrigerant is cooled below the saturated liquid state by exchanging heat with the
subcooler cycle refrigerant and then enters the expansion device of the main cycle. On the other hand, the
subcooler-cycle refrigerant enters the subcooler at state 6 and after cooling the main cycle refrigerant; it exits at
state 7, as a low temperature & pressure saturated vapour.
Figure1. Experimental setup

Proceedings of the National Conference on
Trends and Advances in Mechanical Engineering
(TAME-2017) March 16-17, 2017 ISBN 978-93-5268-269-0
YMCA University of Science & Technology, Faridabad, Haryana
67
To perform this study we have to consider some assumptions: 1) There are no heat losses in the lines, 2) There
are no pressure losses in the lines.
Figure2. Vapour compression cycle with dedicated mechanical subcooling
Some important equations will now be used to calculate heat and work load in different heat exchangers of the
system. Which are:
The main cycle mass flow rate is calculated by applying energy balance on the main cycle compressor.
𝑐𝑜𝑚𝑝,𝑚 = 𝑚(ℎ1 − ℎ5) (1)
To obtain the subcooler cycle mass flow rate, energy balance is applied on the subcooler:
𝑠𝑏𝑐 = 𝑚ℎ2−ℎ3
ℎ7−ℎ6 (2)
Now, the cooling capacity can be obtained from the following equation:
𝑒𝑣𝑝 = 𝑚(ℎ5 − ℎ4) (3)
Here, COP is calculated as the ratio of cooling load to the work from both the compressors. The fan power is
neglected because its value is very small as compared to total consumption. The second-law efficiencyis
employed to evaluate both the configurations instead of the COP to handle the effect of changing ambient
conditions, which is defined as follows:
𝜂II = 𝐶𝑂𝑃
𝐶𝑂𝑃𝑚𝑎𝑥(4)
Where,
𝐶𝑂𝑃𝑚𝑎𝑥 = 𝑇𝑎𝑚
𝑇𝑎𝑚 − 𝑇𝑟𝑜𝑜𝑚
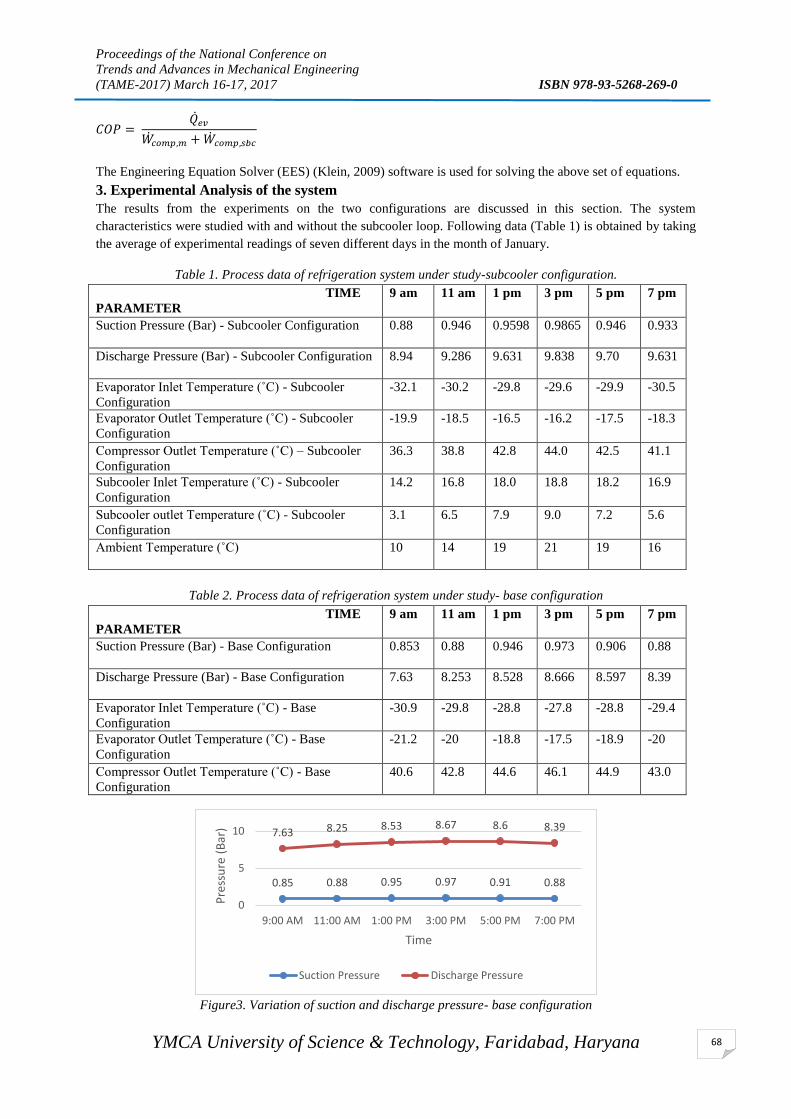
Proceedings of the National Conference on
Trends and Advances in Mechanical Engineering
(TAME-2017) March 16-17, 2017 ISBN 978-93-5268-269-0
YMCA University of Science & Technology, Faridabad, Haryana
68
𝐶𝑂𝑃 = 𝑒𝑣
𝑐𝑜𝑚𝑝,𝑚 + 𝑐𝑜𝑚𝑝,𝑠𝑏𝑐
The Engineering Equation Solver (EES) (Klein, 2009) software is used for solving the above set of equations.
3. Experimental Analysis of the system
The results from the experiments on the two configurations are discussed in this section. The system
characteristics were studied with and without the subcooler loop. Following data (Table 1) is obtained by taking
the average of experimental readings of seven different days in the month of January.
Table 1. Process data of refrigeration system under study-subcooler configuration.
TIME
PARAMETER
9 am 11 am 1 pm 3 pm 5 pm 7 pm
Suction Pressure (Bar) - Subcooler Configuration 0.88 0.946 0.9598 0.9865 0.946 0.933
Discharge Pressure (Bar) - Subcooler Configuration 8.94 9.286 9.631 9.838 9.70 9.631
Evaporator Inlet Temperature (˚C) - Subcooler
Configuration
-32.1 -30.2 -29.8 -29.6 -29.9 -30.5
Evaporator Outlet Temperature (˚C) - Subcooler
Configuration
-19.9 -18.5 -16.5 -16.2 -17.5 -18.3
Compressor Outlet Temperature (˚C) – Subcooler
Configuration
36.3 38.8 42.8 44.0 42.5 41.1
Subcooler Inlet Temperature (˚C) - Subcooler
Configuration
14.2 16.8 18.0 18.8 18.2 16.9
Subcooler outlet Temperature (˚C) - Subcooler
Configuration
3.1 6.5 7.9 9.0 7.2 5.6
Ambient Temperature (˚C) 10 14 19 21 19 16
Table 2. Process data of refrigeration system under study- base configuration
TIME
PARAMETER
9 am 11 am 1 pm 3 pm 5 pm 7 pm
Suction Pressure (Bar) - Base Configuration 0.853 0.88 0.946 0.973 0.906 0.88
Discharge Pressure (Bar) - Base Configuration 7.63 8.253 8.528 8.666 8.597 8.39
Evaporator Inlet Temperature (˚C) - Base
Configuration
-30.9 -29.8 -28.8 -27.8 -28.8 -29.4
Evaporator Outlet Temperature (˚C) - Base
Configuration
-21.2 -20 -18.8 -17.5 -18.9 -20
Compressor Outlet Temperature (˚C) - Base
Configuration
40.6 42.8 44.6 46.1 44.9 43.0
Figure3. Variation of suction and discharge pressure- base configuration
0.85 0.88 0.95 0.97 0.91 0.88
7.63 8.25 8.53 8.67 8.6 8.39
0
5
10
9:00 AM 11:00 AM 1:00 PM 3:00 PM 5:00 PM 7:00 PM
Pre
ssu
re (
Bar
)
Time
Suction Pressure Discharge Pressure
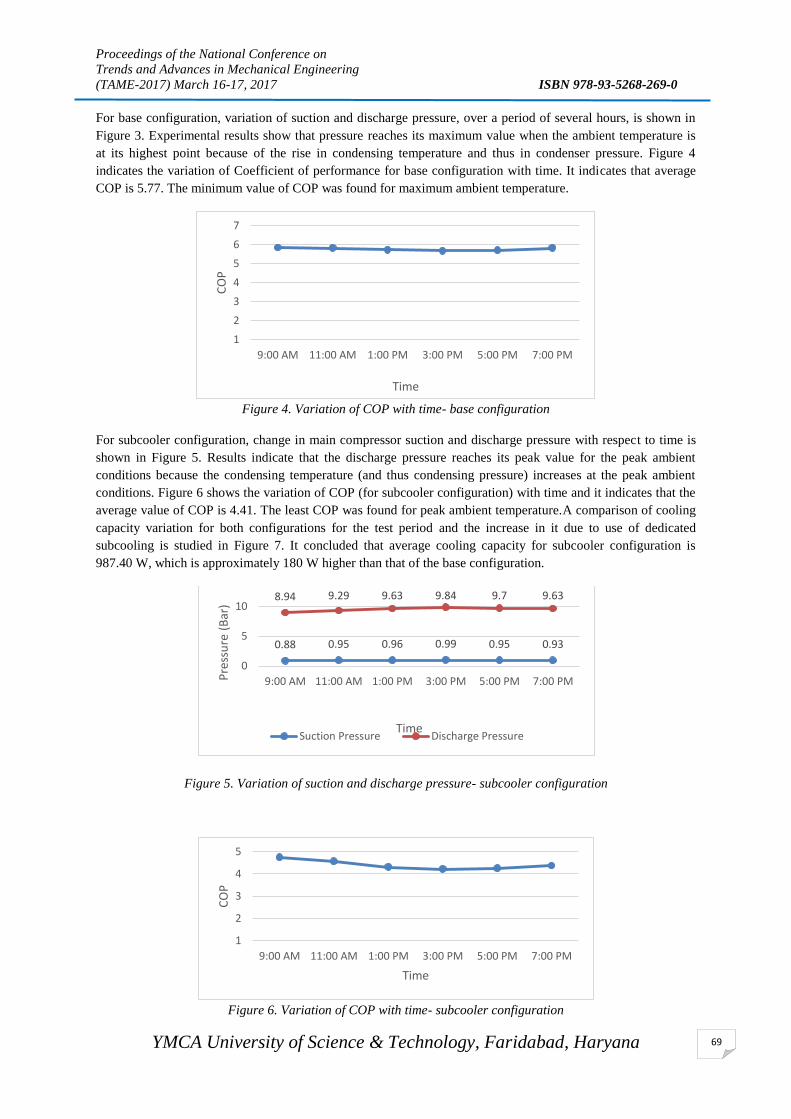
Proceedings of the National Conference on
Trends and Advances in Mechanical Engineering
(TAME-2017) March 16-17, 2017 ISBN 978-93-5268-269-0
YMCA University of Science & Technology, Faridabad, Haryana
69
For base configuration, variation of suction and discharge pressure, over a period of several hours, is shown in
Figure 3. Experimental results show that pressure reaches its maximum value when the ambient temperature is
at its highest point because of the rise in condensing temperature and thus in condenser pressure. Figure 4
indicates the variation of Coefficient of performance for base configuration with time. It indicates that average
COP is 5.77. The minimum value of COP was found for maximum ambient temperature.
Figure 4. Variation of COP with time- base configuration
For subcooler configuration, change in main compressor suction and discharge pressure with respect to time is
shown in Figure 5. Results indicate that the discharge pressure reaches its peak value for the peak ambient
conditions because the condensing temperature (and thus condensing pressure) increases at the peak ambient
conditions. Figure 6 shows the variation of COP (for subcooler configuration) with time and it indicates that the
average value of COP is 4.41. The least COP was found for peak ambient temperature.A comparison of cooling
capacity variation for both configurations for the test period and the increase in it due to use of dedicated
subcooling is studied in Figure 7. It concluded that average cooling capacity for subcooler configuration is
987.40 W, which is approximately 180 W higher than that of the base configuration.
Figure 5. Variation of suction and discharge pressure- subcooler configuration
Figure 6. Variation of COP with time- subcooler configuration
1
2
3
4
5
6
7
9:00 AM 11:00 AM 1:00 PM 3:00 PM 5:00 PM 7:00 PM
CO
P
Time
0.88 0.95 0.96 0.99 0.95 0.93
8.94 9.29 9.63 9.84 9.7 9.63
0
5
10
9:00 AM 11:00 AM 1:00 PM 3:00 PM 5:00 PM 7:00 PMPre
ssu
re (
Bar
)
Time Suction Pressure Discharge Pressure
1
2
3
4
5
9:00 AM 11:00 AM 1:00 PM 3:00 PM 5:00 PM 7:00 PM
CO
P
Time

Proceedings of the National Conference on
Trends and Advances in Mechanical Engineering
(TAME-2017) March 16-17, 2017 ISBN 978-93-5268-269-0
YMCA University of Science & Technology, Faridabad, Haryana
70
Figure 7. Variation of cooling capacity with time
Figure 8. Variation in amount of Subcooling
Figure 9. Comparison of variation of second-law efficiency for both configurations
An appreciable amount of subcooling in the range of 9-11˚C is obtained during the experiment (Figure 8). The
least amount of subcooling is obtained when the ambient temperature was at its peak, which is probably because
the main cycle condenser inlet temperature is at its maximum at this point of time. Thus, more heat transfer is
required to get saturated liquid state to start the subcooling.Second-law efficiency variation for both base and
subcooler configuration is compared in Figure 9. The general trend shows that use of subcooling is consistently
better than the simple vapour compression cycle in terms of second law efficiency.The average value for
second-law efficiency of the base configuration was estimated to be 0.373, whereas for subcooler configuration
it is 0.390. Thus, due to the use of subcooling a rise of 4.56% in second-law efficiency of the system, is
registered.
700
800
900
1000
1100
9:00 AM 11:00 AM 1:00 PM 3:00 PM 5:00 PM 7:00 PM
Co
olin
g C
pac
ity
(W)
Time Cooling Capacity (Base) Cooling Cpacity (Subcooler)
0
2
4
6
8
10
12
14
12:00 AM 12:00 AM 12:00 AM 12:00 AM 12:00 AM 12:00 AM
Am
ou
nt
of
Sbco
olin
g
Axis Title
25
30
35
40
45
9:00 AM 11:00 AM 1:00 PM 3:00 PM 5:00 PM 7:00 PM
Seco
nd
Law
Eff
icie
ncy
(%
)
Time
Subcooler Base

Proceedings of the National Conference on
Trends and Advances in Mechanical Engineering
(TAME-2017) March 16-17, 2017 ISBN 978-93-5268-269-0
YMCA University of Science & Technology, Faridabad, Haryana
71
4. Conclusion
This experimental work presents an experimental comparison between a simple vapor compression refrigeration
system and the improvement made to it by using a dedicated mechanical subcooling arrangement to augment the
theoretical studies performed in the past. . The outcomes of the experiments show that the amount of subcooling
ishigher in value when the ambient temperature is on lower side. Subcooling was found to be approximately in
the range of 9 to 11˚C, which improves the cooling capacity of the system by approximately 180 W.
The power consumption of the system is larger in value whenever the subcooler cycle is used as the
two compressors are in working. This is the reason of a lower COP in case of subcooler configuration. However,
the theoretical study has shown that if comparatively higher power rating compressor is used in main cycle than
the subcooler cycle then the COP of the subcooler configuration will be larger in value than that of the base
configuration. The percentage increase in second law efficiency increases when ambient temperature
decreases.This shows that dedicated mechanical subcooling is more useful & can be utilized in day hours when
ambient temperature is high, which is the time when it is most desirable. Experiments on larger systems need to
be performed to demonstrate that not only cooling capacity but also COP will be higher for subcooler
configuration.
References
COUVILLION RJ, LARSON MW, SOMERVILLER MH. Analysis of a vapour-compressionrefrigeration
systemwith mechanical-subcooling. ASHRAE Trans 1988;94(2):641–59. KLIEN SA. EES – engineering
equation solver: user’s manual for Microsoft windowsoperating systems, version8.609. F-Chart Software,
Madison, WI, USA; 2009.
YANG L, ZHANG C-L. On subcooler design for integrated two-temperature supermarketrefrigeration system.
Energy Build 2011;43:224–31.
QURESHI, B.A., INAM, M., Antar, M.A., ZUBAIR, S.M., 2013. Experimental energetic analysis of a vapor
compression refrigeration system with dedicated mechanical sub-cooling. Appl. Energy 102, 1035-1041.
THORNTON, J.F., KLEIN, S.A., MITCHELL, J.W., 1994. Dedicated mechanical-subcooling design strategies
for supermarket applications. Int. J. Refrigeration 17(8), 508e515.
QURESHI BA, ZUBAIR SM. The effect of refrigerant combinations on performance of a vapor compression
refrigeration system with dedicated mechanical subcooling. Int J Refrig 2012;35(1):47–57
MILLER, M., June 15 1981. Mechanical Subcooling Yields Gains in Efficiency, Capacity, Plus Lower
Maintenance Costs. Air-Conditioning, Heat. Refrigeration News.
ZUBAIR, S.M., YAQUB, M., KHAN, S.H., 1996. Second-law-based thermodynamic analysis of two-stage and
mechanical subcooling refrigeration cycles. Int. J. Refrigeration 19, 506-516.

Proceedings of the National Conference on
Trends and Advances in Mechanical Engineering
(TAME-2017) March 16-17, 2017 ISBN 978-93-5268-269-0
YMCA University of Science & Technology, Faridabad, Haryana
72
LIMITATIONS OF LUBRICATION OF A 2 STROKE SI ENGINE
1YogyaKhanna
2 Sumit Sharma
3Vipin Kaushik
1 UG Student MAE ASET AUUP Noida
2 Assistant Professor, MAE ASET AUUP Noida
3 Assistant Professor, MAE ASET AUUP Noida
Abstract
Over the past decade two stroke SI and CI type engines have been obsolete in usage as compared to 4 stroke
engines. Though these 2 stroke engines provide better power to weight ratio and high power density as
compared to their 4 stroke counterparts. However the 2 stroke engines have a few major limitations when
compared to a 4 stroke engine. 2 stroke engines do not use fuel efficiently. Theonly form of lubrication available
in a 2 stroke engine is the 2t oil that is mixed with the fuel and injected through the intake port. This review
paper deals with the limitations of the lubrication problems faced by the 2 stroke engine and suggesting some
counter measures to minimize the production of unwanted and harmful gases produced in a 2 stroke engine.
With the increase in technology and the amount of work started on a 2 stroke engine, there is still not sufficient
amount of data that gives a definite decrease in the PM, Soot formed and NOx formed at the exhaust. This paper
also shows some important graphs that depict the pollution levels of harmful exhaust (IN PPM) with a constant
engine speed. In this paper we have also highlighted the use of LPG limitations in HC emissions as compared to
its gasoline injection counterparts.
Keywords : FVO: Fuel valve open, FVC: Fuel valve close, EPO: Exhaust Port OpenEPC: Exhaust port
closeIPO: Intake port OpenIPC: Intake port closed.
1. Introduction
In comparison with the 4 stroke engine 2 stroke engines do provide some advantages. The design construction
of a 2 stroke engine is much more simpler than a 4 stroke engine. As compared to a 4 stroke engine, moving
components in a 2 stroke engine are lesser. The use of inlet and exhaust ports instead of valves makes it much
more simpler as compared to a 4 stroke engine. But the 2 stroke engine nowadays has problems with its
lubrication. Apart from lubrication 2 stroke engines have some other disadvantages or problems due to which
they have been obsolete. It is useful where the user needs more power in operation but at the same time the cost
of refueling has been a major disadvantage why manufacturers have shifted their work to a 4 stroke engine.
Another disadvantage that a 2 stroke engine suffers is the cost of lubrication. The main type of lubrication that is
used nowadays is mist lubrication for a 2 stroke engine. This alone causes a lot of pollution and the cost might
empty your pockets. Here the lubricating oil is usually mixed with the fuel in about 2-3%[8] or given into the
inlet port. Due to short circuiting of charge; when fresh charge comes in the combustion chamber the exhaust
port is also open at the same time with the inlet port. This results in the fuel and oil mixture to incompletely burn
in the chamber and go out the exhaust port.The system is preferred in a 2 stroke engine where crank base
lubrication is not required. Some other limitations of such type of lubrication is that when this mixture comes
into contact with the acidic vapor that are produced during combustion may get corroded and result in the
corrosion of bearing surfaces.
2. Literature review
With fewer advantages as compared to disadvantages, 2 stroke engines have been obsolete in the past few
decades due to the high emission gases produced by the exhaust. These gases are harmful and can be fatal to a
human [1]. When gaseous LPG was injected into a 2 stroke engine via manifold injection; A. Ramesh et al. [2]
investigated that the NO emissions increase with the use of manifold injection of LPG. This level was much
higher than its counterparts gasoline engines. Originally 2 stroke engines were used in light portable engines or
motorcycles in the 19th
and 20th
century. Having less mechanical elements gives these engines an edge over the
4 stroke engines with certain other factors like high specific power, less mentainance and better power to weight

Proceedings of the National Conference on
Trends and Advances in Mechanical Engineering
(TAME-2017) March 16-17, 2017 ISBN 978-93-5268-269-0
YMCA University of Science & Technology, Faridabad, Haryana
73
ratio. With these advantages one of the major disadvantage that the 2 stroke engine faces if the need for proper
lubrication in its system.[3]. Garret parker et all investigated that a 2 stroke engine has is the 2T stroke oil that is
mixed in a stoichiometric quantity with fuel which is generally in a ratio of 50:1(Approx)[6]. The oil mixed as a
lubrication is the main cause of the harmful emissions that have been one of the reason why manufacturers have
shifted their usage from a 2 stroke engine to a 4 stroke engine due to the stringent emission norms[4].
When we talk about the main limitations of this mixture of lubrication with the fuel it gives unburnt carbon
particles. There is a time in the port timing where both intake port and exhaust ports are open at the same time.
When the mixture of lubricant and fuel enters the inlet port and to the chamber to the transfer port there is a
great chance of short circuiting of charge. This mixture Is unburnt inside the combustion chamber and goes out
as unburnt carbon particles[5]. This mixture when unburnt generally produces PM, soot and NO in a very
harmful amount. These gases have a harmful effect on the health of people causing various respiratory diseases
and eventually cause a stroke[7].The exhaust port opens at some angle. After a certain time the intake port is
also open to inhale the fresh air and fuel mixture into the combustion chamber. We should note that the intake
port and exhaust port are open together at this point in time. The fuel valve then closes after all the fuel and air
charge has been inhaled and now the intake port closes. During this period where the intake and the exhaust port
is open together, the mixture of fuel and lubricant with air entering the chamber might go out without
combustion through the exhaust port. This condition of a 2 stroke engine is known as short circuit of charge.
During this interval the charge go out the exhaust port performing incomplete combustion and result in the
pollution caused by the 2 stroke engine.
3. Methodology
There is a lot of scope for improvement in this sector of the working of 2 stroke engines. Engine manufacturers
have been working on improving the fuel efficiency and improving the emission handling rate of the engine.
Researchers have had a keen interest in the improvements that a 2 stroke engine have had and the way it may be
used to improve efficiency replacing its counterparts 4 stroke engines. Though there have been many studies on
how to control the emission of a 2 stroke engine, these studies have been of developing a mechanical device
which monitors the exhaust activity by dividing it into high temperature and low temperature exhausts[4]. This
monitored significant decreased rate of NOx, HC, smoke but not to a level that might be in accordance to the
emission norms applied. There has been work conducted on LPG direct injection via twin injectors that has
results showing about 80% reduction in HC levels[2]. But this still does not solve the problem of lubrication that
still pertains for a 2 stroke engine. The engine is still in need for an efficient lubricating system which produces
minimal amount of deposits at the exhaust site and minimum emissions.
Stroke Engine
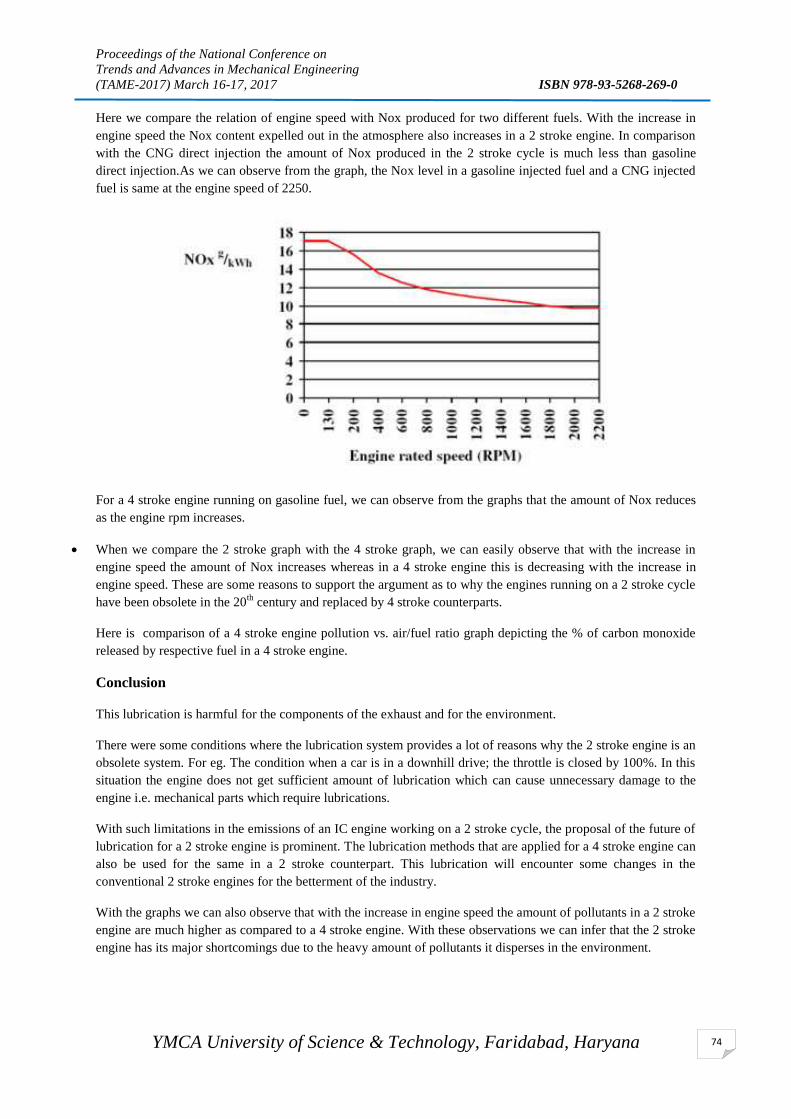
Proceedings of the National Conference on
Trends and Advances in Mechanical Engineering
(TAME-2017) March 16-17, 2017 ISBN 978-93-5268-269-0
YMCA University of Science & Technology, Faridabad, Haryana
74
Here we compare the relation of engine speed with Nox produced for two different fuels. With the increase in
engine speed the Nox content expelled out in the atmosphere also increases in a 2 stroke engine. In comparison
with the CNG direct injection the amount of Nox produced in the 2 stroke cycle is much less than gasoline
direct injection.As we can observe from the graph, the Nox level in a gasoline injected fuel and a CNG injected
fuel is same at the engine speed of 2250.
For a 4 stroke engine running on gasoline fuel, we can observe from the graphs that the amount of Nox reduces
as the engine rpm increases.
When we compare the 2 stroke graph with the 4 stroke graph, we can easily observe that with the increase in
engine speed the amount of Nox increases whereas in a 4 stroke engine this is decreasing with the increase in
engine speed. These are some reasons to support the argument as to why the engines running on a 2 stroke cycle
have been obsolete in the 20th
century and replaced by 4 stroke counterparts.
Here is comparison of a 4 stroke engine pollution vs. air/fuel ratio graph depicting the % of carbon monoxide
released by respective fuel in a 4 stroke engine.
Conclusion
This lubrication is harmful for the components of the exhaust and for the environment.
There were some conditions where the lubrication system provides a lot of reasons why the 2 stroke engine is an
obsolete system. For eg. The condition when a car is in a downhill drive; the throttle is closed by 100%. In this
situation the engine does not get sufficient amount of lubrication which can cause unnecessary damage to the
engine i.e. mechanical parts which require lubrications.
With such limitations in the emissions of an IC engine working on a 2 stroke cycle, the proposal of the future of
lubrication for a 2 stroke engine is prominent. The lubrication methods that are applied for a 4 stroke engine can
also be used for the same in a 2 stroke counterpart. This lubrication will encounter some changes in the
conventional 2 stroke engines for the betterment of the industry.
With the graphs we can also observe that with the increase in engine speed the amount of pollutants in a 2 stroke
engine are much higher as compared to a 4 stroke engine. With these observations we can infer that the 2 stroke
engine has its major shortcomings due to the heavy amount of pollutants it disperses in the environment.
Proceedings of the National Conference on
Trends and Advances in Mechanical Engineering
(TAME-2017) March 16-17, 2017 ISBN 978-93-5268-269-0
YMCA University of Science & Technology, Faridabad, Haryana
75
Future Scope
Though with all the shortcomings of an IC engine working on a 2 stroke cycle, there is still a lot of scope for
technological improvements that might come in handy in a country like India where emission norms are a top
priority for any engine to pass before being practically used on roads.
For a better lubricating system, The Wet sump lubrication can be used as a future reference to improve the
lubricating condition of the 2 stroke engines. These type of lubrication system incorporates the usage of a
sump or an oil pan which holds the oil or the lubricating fluid below the crank case. This method is a very
effective to provide a continuous lubrication to the IC engine through the crank case. The oil gets collected
in troughs which in turn is connected to the oil pan. These troughs are being monitored by the use of a oil
pressure sensor which monitors the level of oil.
Another type of lubrication method is the dry sump lubrication method. In this method oil is carried out in a
separate tank which aids cooling. Oil from the tank is fed to the engine in its various operations of
lubrication via a pressure pump. In this a scavenge pump is used which sends back the oil to the sump. The
main advantage of this type of lubrication is that it does not incorporate any leakage while the up and down
motion of the vehicle
References
1. S.M. urillo ,J.l. miguer , j Porteiro , I.M. lopez Gonzalez , E. grourad , J.L. Moran. LPG pollutant emission
and performance enhancement
2. A Ramesh, V. Pradeep ,ShamitBakshi. Direct injection of gaseous LPG in 2 stroke SI engine for improved
performance
3. V Pradeep, A. Ramesh: A novel twin injector strategy for direct cylinder barrel injection of LPG in 2S
Cycle engines
4. Hooper PR, Al shermeni, T Goodwin : Advanced modern low emission 2 Stroke cycle engines
5. M. dalla Nora, H. Zhao: Applied energy 159117-131.2005
6. Garett Parker, Stuart Bartley, Michael Nicholas: Two stroke engine cleanliness via fuel additive.SAE
technical paper 2016-32-0048.2016
7. Shin tsun- lai , Jack PM sheng, Cheng Shyong Lin Ron Sheng Lin , Chen yilin , Yo Fun shiau: The study of
exhaust emission reduction and lubricity of 2 stroke engines
8. M loganathan , A ramesh: Development and testing of a novel direct mixture injection system for 2 stroke
engines. SAE technical paper 2008-32-0077. 2008
9. Tom savioili .CFD analysis on a 2 stroke engine. 2015

Proceedings of the National Conference on
Trends and Advances in Mechanical Engineering
(TAME-2017) March 16-17, 2017 ISBN 978-93-5268-269-0
YMCA University of Science & Technology, Faridabad, Haryana
76
EXPERIMENTAL ENERGETIC, ECONOMIC & ENVIRONMENTAL
(3E) ANALYSIS OF VAPOUR COMPRESSION REFRIGERATION
SYSTEM WITH DEDICATED MECHANICAL SUB-COOLING
Manoranjan Kumar1
1Department of Mechanical Engineering, National Institute of Technology, Kurukshetra, 136119, India.
Phone: 9555398620, e-mail: [email protected]
Abstract
A large amount of electricity consumed by refrigeration and air conditioning system all over the world. An
energy saving way is using dedicated mechanical subcooling. This consist a separate subcooling loop in which
refrigerant after exist of condenser in vapour compression refrigeration system enters in to subcooler, which
allows the refrigerant enters in to evaporator with lower quality. Present work compares the performance of
140 W vapour compression refrigeration system with same system when dedicated mechanical subcooling is
used. This comparison is based on energetic, economic and environmental (3E) analysis with and without
subcooling. From this study it is found that the average system capacity is increases by 22 %. Also for a larger
system the environmental damage cost and total cost of system is less for same cooling capacity.
Keywords:Vapour compression, Subcooling, Performance, Cost
1. Introduction
High demand of air conditioning and refrigeration continuously increasing across the globe mainly due to
climate change, improvement of living standard, industrialization, and general population growth and widely
used in residential, commercial and industrial area.The percentage utilization of refrigeration systems is very
large and also energy consumption becomes very large. Researchers from all over the world are involves in
inventing of energy efficient, environment friendly, and economical refrigeration system. Due to large
temperature difference between evaporator and condenser, more power taken by the compressor and getting less
refrigeration effect per unit mass flow rate of the refrigerant. The idea of dedicated mechanical subcooling in
vapour compression refrigeration system is to subcooled refrigerant for getting more refrigeration effect at same
power consumed. In dedicated mechanical subcooling, subcooling of main cycle refrigerant is done by using
another separate vapour compression cycle called subcooler cycle. The evaporator of this cycle acts as a heat
exchanger, which takes heat from the main cycle refrigerant after condenser and subcooled that refrigerant.
Hence increasing refrigeration effect.
In both vapour compression cycle R134a is using as a refrigerant which is the nonflammable and non-explosive,
has toxicity within limits, good physical properties and good chemical stability. It has zero potential to cause the
depletion of the ozone layer and very low global warming potential. Hence it has low environmental impact.In
addition, while analysing environmental aspects, economic aspects of this system should also be considered.
2. System description and assumptions
In this system there are two vapour compression cycle which is coupled via a subcooler. The main components
of the cycle are two compressor, two condenser, two expansion valve, one subcooler, and one evaporator. The
component of both cycle is connected in a closed loop that has transfer heat to the surrounding. The lower cycle
is called main cycle and upper cycle is called subcooler cycle. In both cycle R134a is using as refrigerant. This
cycle shown in figure 1. In this system main cycle refrigerant enters the compressor at state 5 and leaves the
compressor at state 1 as high pressure and high temperature. Then it enters in to the condenser, where it rejects
heat to the surrounding at high pressure and comes in liquid at state 2. After that the refrigerant passes through
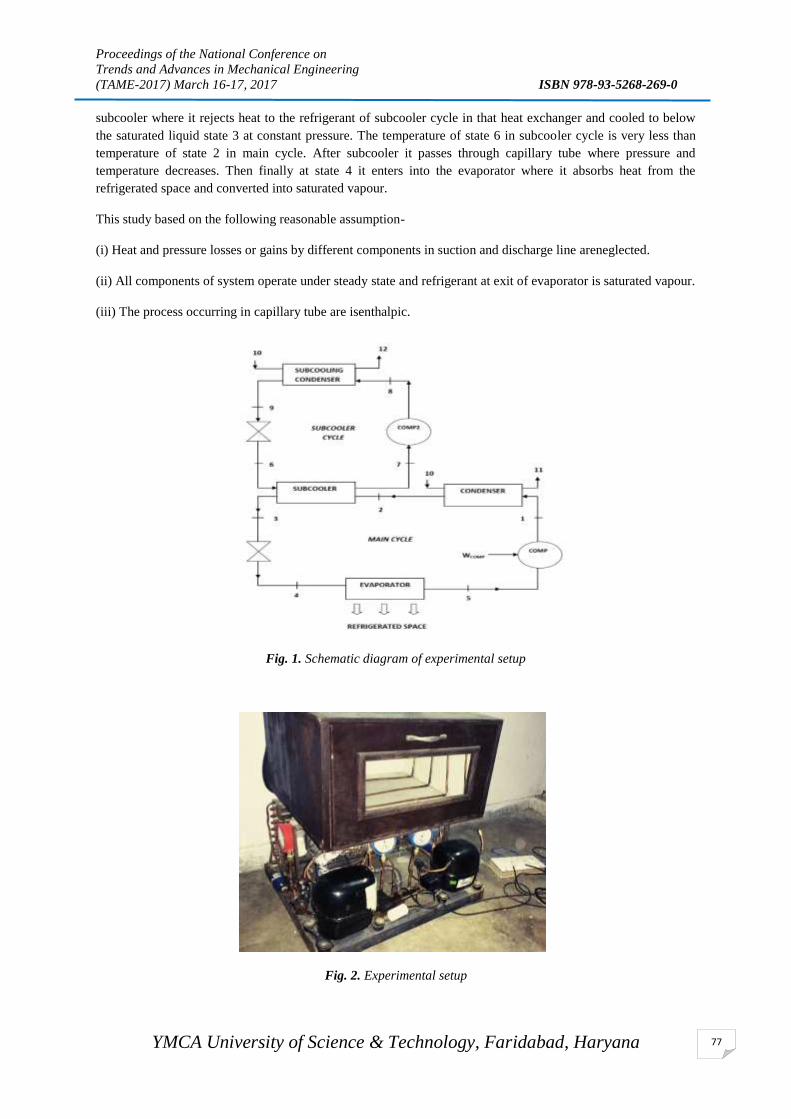
Proceedings of the National Conference on
Trends and Advances in Mechanical Engineering
(TAME-2017) March 16-17, 2017 ISBN 978-93-5268-269-0
YMCA University of Science & Technology, Faridabad, Haryana
77
subcooler where it rejects heat to the refrigerant of subcooler cycle in that heat exchanger and cooled to below
the saturated liquid state 3 at constant pressure. The temperature of state 6 in subcooler cycle is very less than
temperature of state 2 in main cycle. After subcooler it passes through capillary tube where pressure and
temperature decreases. Then finally at state 4 it enters into the evaporator where it absorbs heat from the
refrigerated space and converted into saturated vapour.
This study based on the following reasonable assumption-
(i) Heat and pressure losses or gains by different components in suction and discharge line areneglected.
(ii) All components of system operate under steady state and refrigerant at exit of evaporator is saturated vapour.
(iii) The process occurring in capillary tube are isenthalpic.
Fig. 1. Schematic diagram of experimental setup
Fig. 2. Experimental setup

Proceedings of the National Conference on
Trends and Advances in Mechanical Engineering
(TAME-2017) March 16-17, 2017 ISBN 978-93-5268-269-0
YMCA University of Science & Technology, Faridabad, Haryana
78
3. Data of experimental analysis
The experimental data obtained during the study are given below. This study is performed in the month of
January and it is average of seven days.
Table 1. Process data of base and subcooler configuration of refrigeration system under study.
TIME
PARAMETER
9 am 11 am 1 pm 3 pm 5 pm 7 pm
Suction Pressure (Bar) - Base Configuration 0.853 0.88 0.946 0.973 0.906 0.88
Discharge Pressure (Bar) - Base Configuration 7.63 8.253 8.528 8.666 8.597 8.39
Evaporator Inlet Temperature (˚C) - Base
Configuration
-30.9 -29.8 -28.8 -27.8 -28.8 -29.4
Evaporator Outlet Temperature (˚C) - Base
Configuration
-21.2 -20 -18.8 -17.5 -18.9 -20
Compressor Outlet Temperature (˚C) - Base
Configuration
40.6 42.8 44.6 46.1 44.9 43.0
Condenser Outlet Temperature (˚C) - Base
Configuration
14.5 15.4 17.8 18.3 18.2 16.9
Suction Pressure (Bar) - Subcooler Configuration 0.88 0.946 0.9598 0.9865 0.946 0.933
Discharge Pressure (Bar) - Subcooler Configuration 8.94 9.286 9.631 9.838 9.70 9.631
Evaporator Inlet Temperature (˚C) - Subcooler
Configuration
-32.1 -30.2 -29.8 -29.6 -29.9 -30.5
Evaporator Outlet Temperature (˚C) - Subcooler
Configuration
-19.9 -18.5 -16.5 -16.2 -17.5 -18.3
Main cycle Compressor Outlet Temperature (˚C) -
subcooler Configuration
36.3 38.8 42.8 44.0 43.0 41.1
Main cycle Condenser Outlet Temperature (˚C) –
Subcooler Configuration
13.5 16.8 18.0 18.8 18.2 16.9
Subcooler Inlet Temperature (˚C) - Subcooler
Configuration
14.2 16.8 18.0 18.8 18.2 16.9
Subcooler outlet Temperature (˚C) - subcooler
Configuration
3.1 6.5 7.9 9.0 7.2 5.6
Ambient Temperature (˚C) 10 14 19 21 19 16
3.1. Energetic analysis
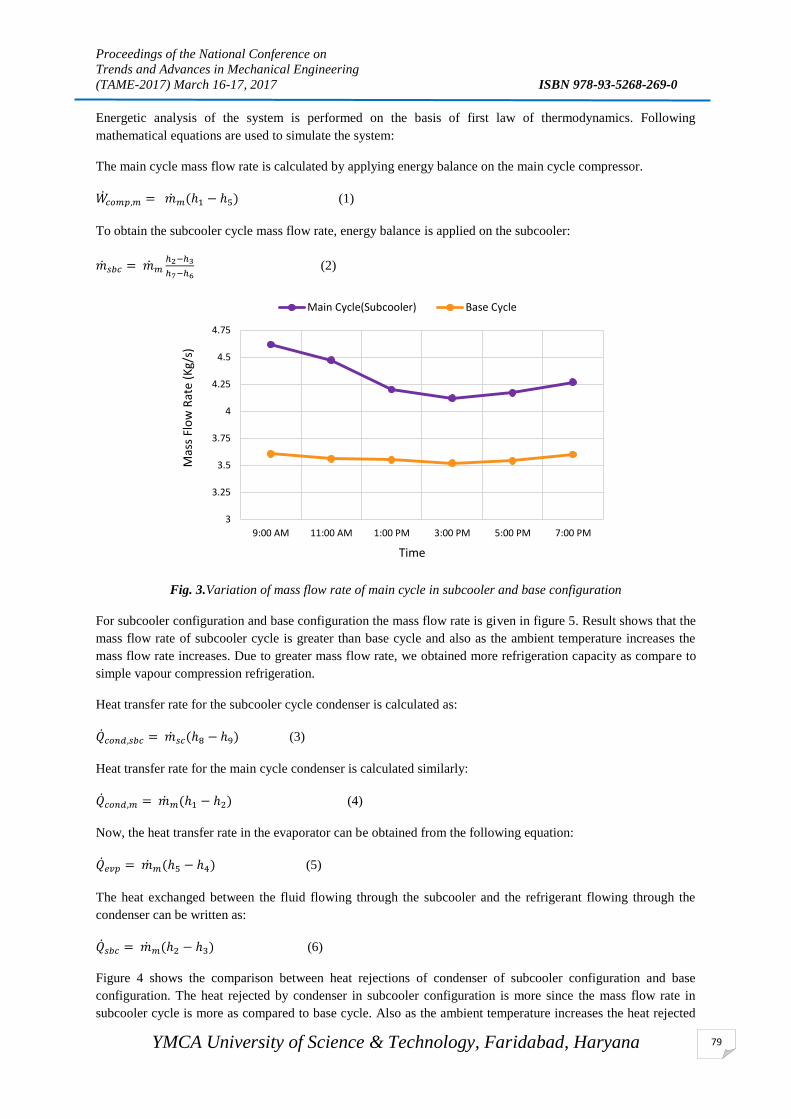
Proceedings of the National Conference on
Trends and Advances in Mechanical Engineering
(TAME-2017) March 16-17, 2017 ISBN 978-93-5268-269-0
YMCA University of Science & Technology, Faridabad, Haryana
79
Energetic analysis of the system is performed on the basis of first law of thermodynamics. Following
mathematical equations are used to simulate the system:
The main cycle mass flow rate is calculated by applying energy balance on the main cycle compressor.
𝑐𝑜𝑚𝑝,𝑚 = 𝑚(ℎ1 − ℎ5) (1)
To obtain the subcooler cycle mass flow rate, energy balance is applied on the subcooler:
𝑠𝑏𝑐 = 𝑚ℎ2−ℎ3
ℎ7−ℎ6 (2)
Fig. 3.Variation of mass flow rate of main cycle in subcooler and base configuration
For subcooler configuration and base configuration the mass flow rate is given in figure 5. Result shows that the
mass flow rate of subcooler cycle is greater than base cycle and also as the ambient temperature increases the
mass flow rate increases. Due to greater mass flow rate, we obtained more refrigeration capacity as compare to
simple vapour compression refrigeration.
Heat transfer rate for the subcooler cycle condenser is calculated as:
𝑐𝑜𝑛𝑑,𝑠𝑏𝑐 = 𝑠𝑐(ℎ8 − ℎ9) (3)
Heat transfer rate for the main cycle condenser is calculated similarly:
𝑐𝑜𝑛𝑑,𝑚 = 𝑚(ℎ1 − ℎ2) (4)
Now, the heat transfer rate in the evaporator can be obtained from the following equation:
𝑒𝑣𝑝 = 𝑚(ℎ5 − ℎ4) (5)
The heat exchanged between the fluid flowing through the subcooler and the refrigerant flowing through the
condenser can be written as:
𝑠𝑏𝑐 = 𝑚(ℎ2 − ℎ3) (6)
Figure 4 shows the comparison between heat rejections of condenser of subcooler configuration and base
configuration. The heat rejected by condenser in subcooler configuration is more since the mass flow rate in
subcooler cycle is more as compared to base cycle. Also as the ambient temperature increases the heat rejected
3
3.25
3.5
3.75
4
4.25
4.5
4.75
9:00 AM 11:00 AM 1:00 PM 3:00 PM 5:00 PM 7:00 PM
Mas
s Fl
ow
Rat
e (K
g/s)
Time
Main Cycle(Subcooler) Base Cycle
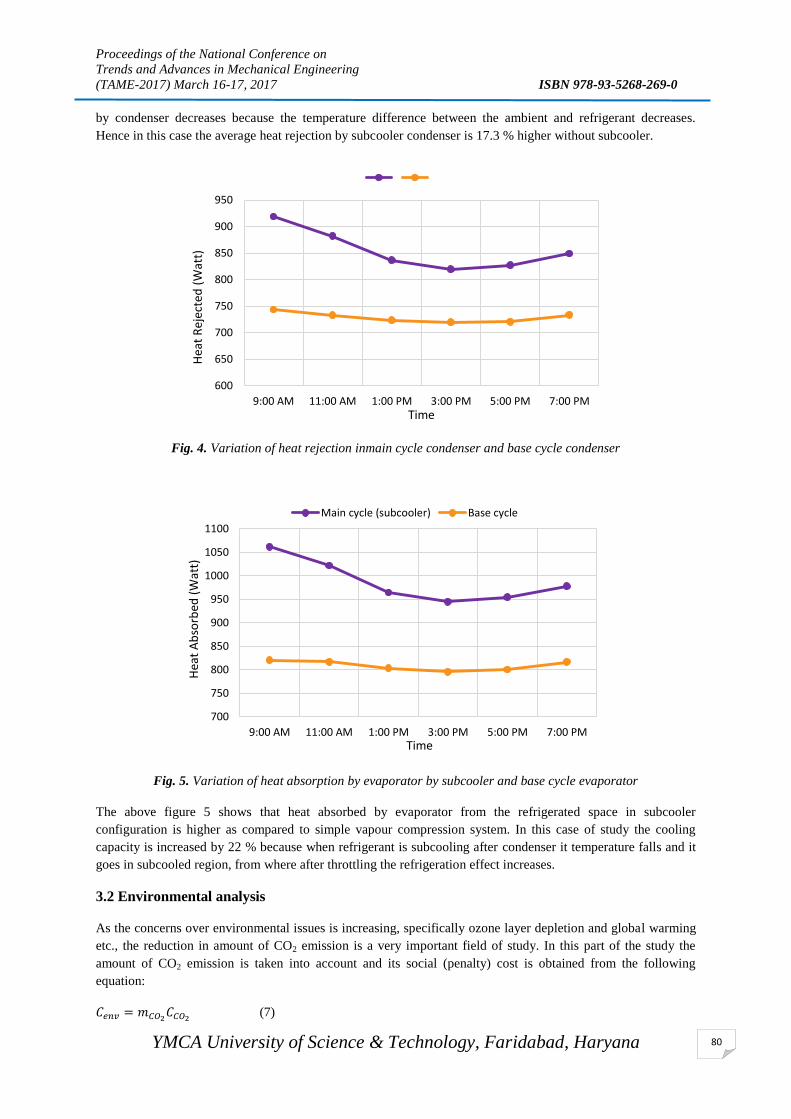
Proceedings of the National Conference on
Trends and Advances in Mechanical Engineering
(TAME-2017) March 16-17, 2017 ISBN 978-93-5268-269-0
YMCA University of Science & Technology, Faridabad, Haryana
80
by condenser decreases because the temperature difference between the ambient and refrigerant decreases.
Hence in this case the average heat rejection by subcooler condenser is 17.3 % higher without subcooler.
Fig. 4. Variation of heat rejection inmain cycle condenser and base cycle condenser
Fig. 5. Variation of heat absorption by evaporator by subcooler and base cycle evaporator
The above figure 5 shows that heat absorbed by evaporator from the refrigerated space in subcooler
configuration is higher as compared to simple vapour compression system. In this case of study the cooling
capacity is increased by 22 % because when refrigerant is subcooling after condenser it temperature falls and it
goes in subcooled region, from where after throttling the refrigeration effect increases.
3.2 Environmental analysis
As the concerns over environmental issues is increasing, specifically ozone layer depletion and global warming
etc., the reduction in amount of CO2 emission is a very important field of study. In this part of the study the
amount of CO2 emission is taken into account and its social (penalty) cost is obtained from the following
equation:
𝐶𝑒𝑛𝑣 = 𝑚𝐶𝑂2𝐶𝐶𝑂2
(7)
600
650
700
750
800
850
900
950
9:00 AM 11:00 AM 1:00 PM 3:00 PM 5:00 PM 7:00 PM
Hea
t R
ejec
ted
(W
att)
Time
700
750
800
850
900
950
1000
1050
1100
9:00 AM 11:00 AM 1:00 PM 3:00 PM 5:00 PM 7:00 PM
Hea
t A
bso
rbed
(W
att)
Time
Main cycle (subcooler) Base cycle
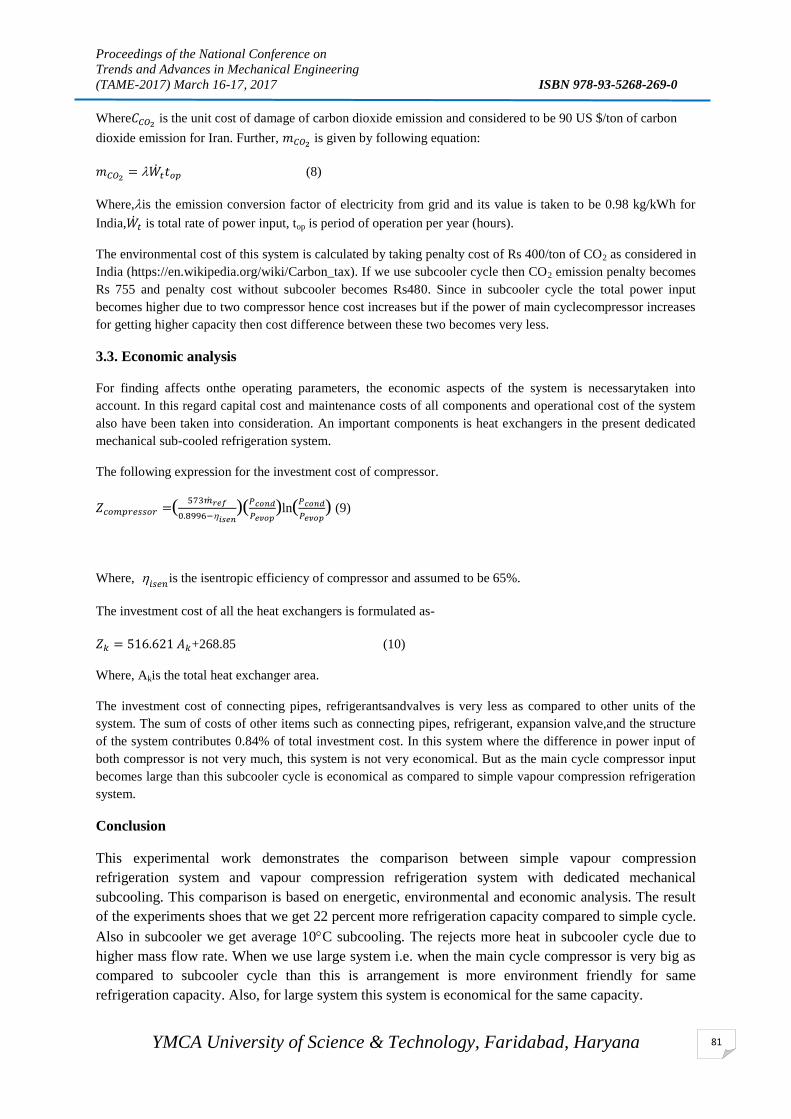
Proceedings of the National Conference on
Trends and Advances in Mechanical Engineering
(TAME-2017) March 16-17, 2017 ISBN 978-93-5268-269-0
YMCA University of Science & Technology, Faridabad, Haryana
81
Where𝐶𝐶𝑂2 is the unit cost of damage of carbon dioxide emission and considered to be 90 US $/ton of carbon
dioxide emission for Iran. Further, 𝑚𝐶𝑂2 is given by following equation:
𝑚𝐶𝑂2= 𝑡𝑡𝑜𝑝 (8)
Where,is the emission conversion factor of electricity from grid and its value is taken to be 0.98 kg/kWh for
India,𝑡 is total rate of power input, top is period of operation per year (hours).
The environmental cost of this system is calculated by taking penalty cost of Rs 400/ton of CO2 as considered in
India (https://en.wikipedia.org/wiki/Carbon_tax). If we use subcooler cycle then CO2 emission penalty becomes
Rs 755 and penalty cost without subcooler becomes Rs480. Since in subcooler cycle the total power input
becomes higher due to two compressor hence cost increases but if the power of main cyclecompressor increases
for getting higher capacity then cost difference between these two becomes very less.
3.3. Economic analysis
For finding affects onthe operating parameters, the economic aspects of the system is necessarytaken into
account. In this regard capital cost and maintenance costs of all components and operational cost of the system
also have been taken into consideration. An important components is heat exchangers in the present dedicated
mechanical sub-cooled refrigeration system.
The following expression for the investment cost of compressor.
𝑍𝑐𝑜𝑚𝑝𝑟𝑒𝑠𝑠𝑜𝑟 =(573𝑟𝑒𝑓
0.8996−𝑖𝑠𝑒𝑛
)(𝑃𝑐𝑜𝑛𝑑
𝑃𝑒𝑣𝑜𝑝)ln(𝑃𝑐𝑜𝑛𝑑
𝑃𝑒𝑣𝑜𝑝) (9)
Where, 𝑖𝑠𝑒𝑛
is the isentropic efficiency of compressor and assumed to be 65%.
The investment cost of all the heat exchangers is formulated as-
𝑍𝑘 = 516.621 𝐴𝑘+268.85 (10)
Where, Akis the total heat exchanger area.
The investment cost of connecting pipes, refrigerantsandvalves is very less as compared to other units of the
system. The sum of costs of other items such as connecting pipes, refrigerant, expansion valve,and the structure
of the system contributes 0.84% of total investment cost. In this system where the difference in power input of
both compressor is not very much, this system is not very economical. But as the main cycle compressor input
becomes large than this subcooler cycle is economical as compared to simple vapour compression refrigeration
system.
Conclusion
This experimental work demonstrates the comparison between simple vapour compression
refrigeration system and vapour compression refrigeration system with dedicated mechanical
subcooling. This comparison is based on energetic, environmental and economic analysis. The result
of the experiments shoes that we get 22 percent more refrigeration capacity compared to simple cycle.
Also in subcooler we get average 10C subcooling. The rejects more heat in subcooler cycle due to
higher mass flow rate. When we use large system i.e. when the main cycle compressor is very big as
compared to subcooler cycle than this is arrangement is more environment friendly for same
refrigeration capacity. Also, for large system this system is economical for the same capacity.
Proceedings of the National Conference on
Trends and Advances in Mechanical Engineering
(TAME-2017) March 16-17, 2017 ISBN 978-93-5268-269-0
YMCA University of Science & Technology, Faridabad, Haryana
82
Reference
QURESHI, B.A., INAM, M., Antar, M.A., ZUBAIR, S.M., 2013. Experimental energetic analysis of a vapour
compression refrigeration system with dedicated mechanical sub-cooling. Appl. Energy 102, 1035-1041.
AMINYAVARI M, NAJAFI B, SHIRAZI A, RINALDI F. Exergetic, economic and environmental (3E)
analyses, and multiobjective optimization of a CO2/NH3 cascade refrigeration system. Applied Thermal Engg.
2014; 65:42-50.
QURESHI BA, ZUBAIR SM. The effect of refrigerant combinations on performance of a vapour compression
refrigeration system with dedicated mechanical subcooling. Int. Journals of Refrigeration 2012; 35(1):47–57
GEBRESLASSIE BH, GROLL EA, GARIMELLA SV. Multiobjective optimization of sustainable single-effect
water/Lithium bromide absorption cycle. Renew Energy 2012; 46:100-10.
WANG J, ZHAI Z, JING Y, ZHANG C. Particle swarm optimization for redundant building cooling heating
and power system. Applied Energy 2010; 87:3668-79.
COUVILLION RJ, LARSON MW, SOMERVILLER MH. Analysis of a vapour-compression refrigeration
system with mechanical-subcooling. ASHRAE Trans 1988; 94(2):641–59.
SAYYAADI H, NEJATOLAHI M. Multi objective optimization of a cooling tower assisted vapour
compression refrigeration system. Int. Journals of Refrigeration. 2011; 34: 243-56.
SANAYE S, MALEKMOHAMMADI HR, Thermal and economical optimization of air conditioning units with
vapour compression refrigeration system.Applied Thermal Engineering. 2004; 24: 1807–1825
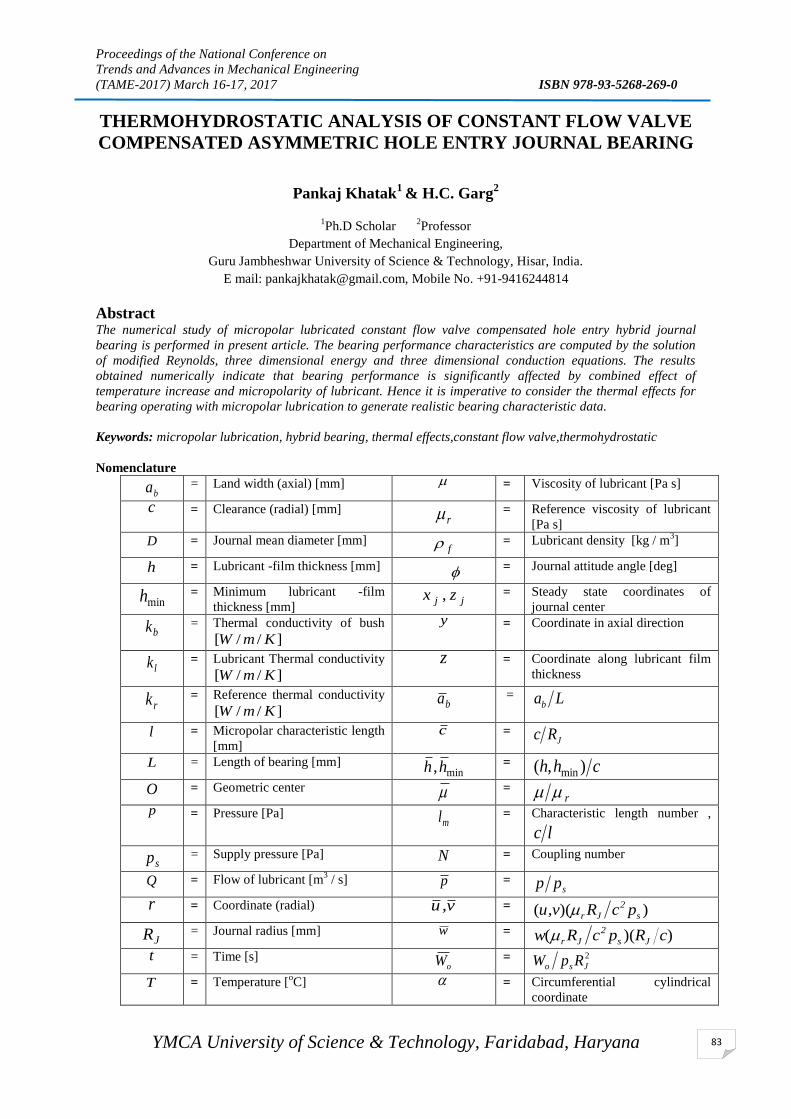
Proceedings of the National Conference on
Trends and Advances in Mechanical Engineering
(TAME-2017) March 16-17, 2017 ISBN 978-93-5268-269-0
YMCA University of Science & Technology, Faridabad, Haryana
83
THERMOHYDROSTATIC ANALYSIS OF CONSTANT FLOW VALVE
COMPENSATED ASYMMETRIC HOLE ENTRY JOURNAL BEARING
Pankaj Khatak1
& H.C. Garg2
1Ph.D Scholar
2Professor
Department of Mechanical Engineering,
Guru Jambheshwar University of Science & Technology, Hisar, India.
E mail: [email protected], Mobile No. +91-9416244814
Abstract The numerical study of micropolar lubricated constant flow valve compensated hole entry hybrid journal
bearing is performed in present article. The bearing performance characteristics are computed by the solution
of modified Reynolds, three dimensional energy and three dimensional conduction equations. The results
obtained numerically indicate that bearing performance is significantly affected by combined effect of
temperature increase and micropolarity of lubricant. Hence it is imperative to consider the thermal effects for
bearing operating with micropolar lubrication to generate realistic bearing characteristic data.
Keywords: micropolar lubrication, hybrid bearing, thermal effects,constant flow valve,thermohydrostatic
Nomenclature
ba = Land width (axial) [mm] = Viscosity of lubricant [Pa s]
c = Clearance (radial) [mm] r = Reference viscosity of lubricant
[Pa s]
D = Journal mean diameter [mm] f = Lubricant density [kg / m
3]
h = Lubricant -film thickness [mm] = Journal attitude angle [deg]
minh = Minimum lubricant -film
thickness [mm] jj zx , = Steady state coordinates of
journal center
bk = Thermal conductivity of bush
]//[ KmW
y = Coordinate in axial direction
lk = Lubricant Thermal conductivity
]//[ KmW
z = Coordinate along lubricant film
thickness
rk = Reference thermal conductivity
]//[ KmW ba = Lab
l = Micropolar characteristic length
[mm]
c = JRc
L = Length of bearing [mm] min,hh = chh ),( min
O = Geometric center = r
p = Pressure [Pa] ml = Characteristic length number ,
lc
sp = Supply pressure [Pa] N = Coupling number
Q = Flow of lubricant [m3 / s] p =
spp
r = Coordinate (radial) v,u = ))(( s
2
Jr pcRv,u
JR = Journal radius [mm] w = ))(( cRpcRw Js
2
Jr
t = Time [s] oW = 2
Jso RpW
T = Temperature [oC] = Circumferential cylindrical
coordinate
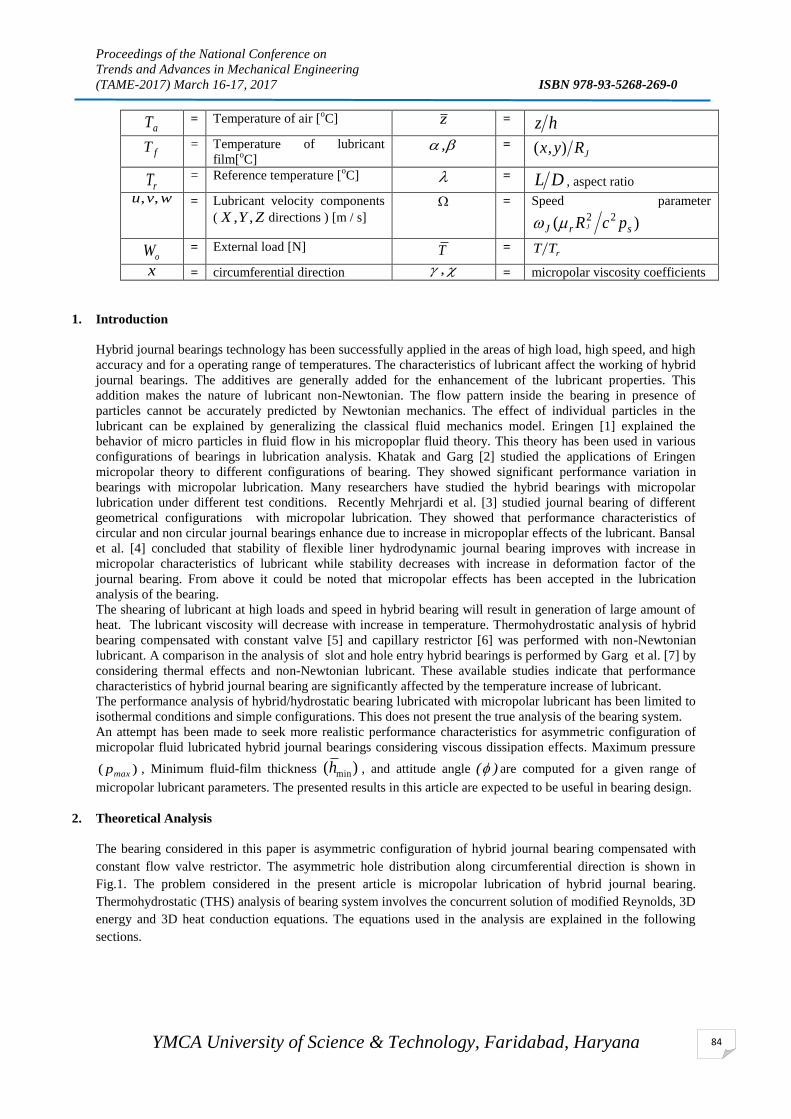
Proceedings of the National Conference on
Trends and Advances in Mechanical Engineering
(TAME-2017) March 16-17, 2017 ISBN 978-93-5268-269-0
YMCA University of Science & Technology, Faridabad, Haryana
84
aT = Temperature of air [oC] z = hz
fT = Temperature of lubricant
film[oC]
, = JRy,x )(
rT = Reference temperature [
oC] = DL , aspect ratio
wvu ,, = Lubricant velocity components
( ZYX ,, directions ) [m / s]
= Speed parameter
)( 22srJ pcR J
oW = External load [N] T = rTT
x = circumferential direction , = micropolar viscosity coefficients
1. Introduction
Hybrid journal bearings technology has been successfully applied in the areas of high load, high speed, and high
accuracy and for a operating range of temperatures. The characteristics of lubricant affect the working of hybrid
journal bearings. The additives are generally added for the enhancement of the lubricant properties. This
addition makes the nature of lubricant non-Newtonian. The flow pattern inside the bearing in presence of
particles cannot be accurately predicted by Newtonian mechanics. The effect of individual particles in the
lubricant can be explained by generalizing the classical fluid mechanics model. Eringen [1] explained the
behavior of micro particles in fluid flow in his micropoplar fluid theory. This theory has been used in various
configurations of bearings in lubrication analysis. Khatak and Garg [2] studied the applications of Eringen
micropolar theory to different configurations of bearing. They showed significant performance variation in
bearings with micropolar lubrication. Many researchers have studied the hybrid bearings with micropolar
lubrication under different test conditions. Recently Mehrjardi et al. [3] studied journal bearing of different
geometrical configurations with micropolar lubrication. They showed that performance characteristics of
circular and non circular journal bearings enhance due to increase in micropoplar effects of the lubricant. Bansal
et al. [4] concluded that stability of flexible liner hydrodynamic journal bearing improves with increase in
micropolar characteristics of lubricant while stability decreases with increase in deformation factor of the
journal bearing. From above it could be noted that micropolar effects has been accepted in the lubrication
analysis of the bearing.
The shearing of lubricant at high loads and speed in hybrid bearing will result in generation of large amount of
heat. The lubricant viscosity will decrease with increase in temperature. Thermohydrostatic analysis of hybrid
bearing compensated with constant valve [5] and capillary restrictor [6] was performed with non-Newtonian
lubricant. A comparison in the analysis of slot and hole entry hybrid bearings is performed by Garg et al. [7] by
considering thermal effects and non-Newtonian lubricant. These available studies indicate that performance
characteristics of hybrid journal bearing are significantly affected by the temperature increase of lubricant.
The performance analysis of hybrid/hydrostatic bearing lubricated with micropolar lubricant has been limited to
isothermal conditions and simple configurations. This does not present the true analysis of the bearing system.
An attempt has been made to seek more realistic performance characteristics for asymmetric configuration of
micropolar fluid lubricated hybrid journal bearings considering viscous dissipation effects. Maximum pressure
)( maxp , Minimum fluid-film thickness )( minh , and attitude angle )( are computed for a given range of
micropolar lubricant parameters. The presented results in this article are expected to be useful in bearing design.
2. Theoretical Analysis
The bearing considered in this paper is asymmetric configuration of hybrid journal bearing compensated with
constant flow valve restrictor. The asymmetric hole distribution along circumferential direction is shown in
Fig.1. The problem considered in the present article is micropolar lubrication of hybrid journal bearing.
Thermohydrostatic (THS) analysis of bearing system involves the concurrent solution of modified Reynolds, 3D
energy and 3D heat conduction equations. The equations used in the analysis are explained in the following
sections.
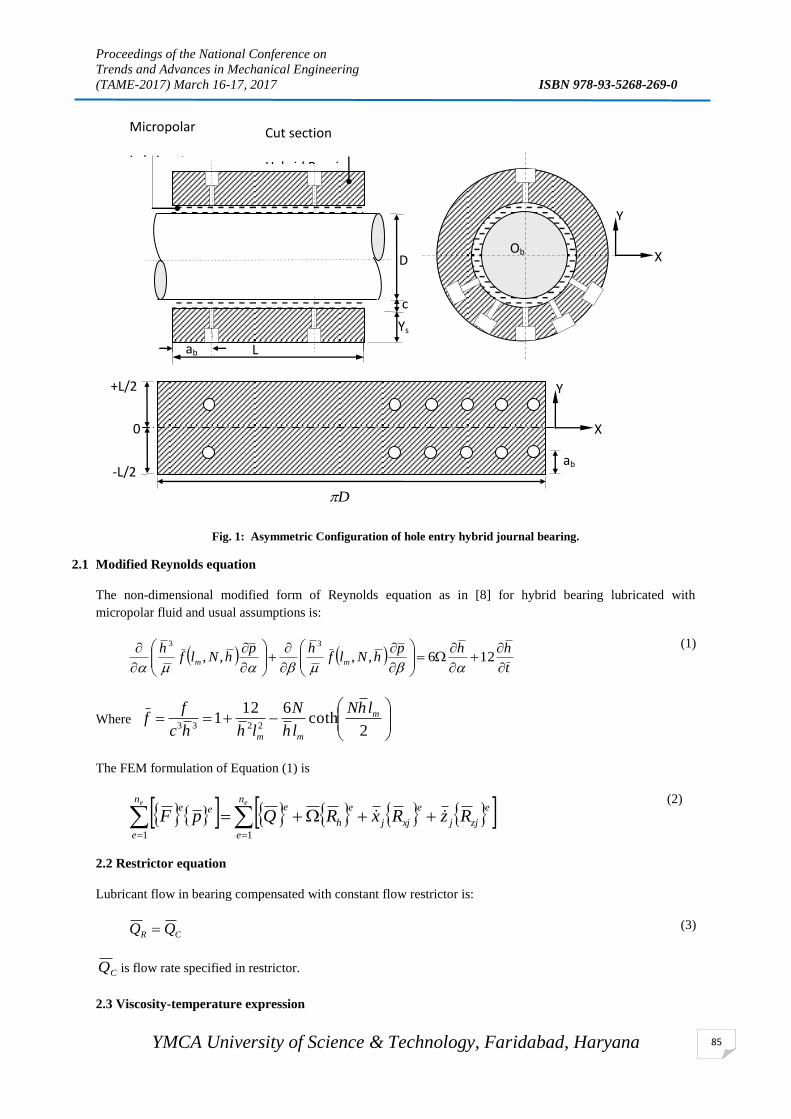
Proceedings of the National Conference on
Trends and Advances in Mechanical Engineering
(TAME-2017) March 16-17, 2017 ISBN 978-93-5268-269-0
YMCA University of Science & Technology, Faridabad, Haryana
85
Fig. 1: Asymmetric Configuration of hole entry hybrid journal bearing.
2.1 Modified Reynolds equation
The non-dimensional modified form of Reynolds equation as in [8] for hybrid bearing lubricated with
micropolar fluid and usual assumptions is:
t
hhphNlf
hphNlf
hmm
126,,,,
33
(1)
Where
2coth
6121
2233
m
mm
lhN
lh
N
lhhc
ff
The FEM formulation of Equation (1) is
ee n
e
e
zjj
e
xjj
e
h
en
e
eeRzRxRQpF
11
(2)
2.2 Restrictor equation
Lubricant flow in bearing compensated with constant flow restrictor is:
CR QQ
(3)
CQ is flow rate specified in restrictor.
2.3 Viscosity-temperature expression
D
ab
+L/2
0
-L/2
X
Y
Ob X
Y
As
y
m
m
et
ric
ho
le-
en
tr
y
hy
br
id
jo
ur
na
l
be
ari
ng
co
nf
ig
ur
ati
on
Ys
D
c
-
L
/
2
Micropolar
Lubricant
Cut section
Hybrid Bearing
ab L

Proceedings of the National Conference on
Trends and Advances in Mechanical Engineering
(TAME-2017) March 16-17, 2017 ISBN 978-93-5268-269-0
YMCA University of Science & Technology, Faridabad, Haryana
86
Viscosity of lubricant is supposed to be temperature dependent and is expressed as [8] :
2f2f10 TKTKK
(4)
Where 0K , 1K and 2K are nondimensional constants having values 3.287, 3.064 and 0.777 respectively.
2.4 Heat transfer equations
The heat transfer interaction between lubricant and the bearing can be expressed by three dimensional energy
equation for the lubricant flow and three dimensional conduction equation for the bearing shell. The modified
non-dimensional form of the micropolar energy equation [8] for the present application is :
e2
2*
e2 D
z
TP
z
T
h
wTv
Tuh
(5)
Temperature in bearing shell is computed by using the non-dimensional conduction equation in the cylindrical
form [8]:
0112
b
bb
bb
b
Tkr
Tk
rr
Trk
rr
(1)
2.5 Boundary Conditions
Boundary conditions used in the present study are [9]:
1. External boundary nodes in bearing have zero gage pressure.
2. Internal nodes have zero flow except external boundary and hole nodes.
3. It is assumed as per Swift-Stieber condition of cavitation that in the positive region of trailing edge of
bearingTemperatures along the interface surfaces of lubricant-fluid and fluid-bush are same i.e. Jf TT (at
0.1z ) and ( bf TT ) (at 0.0z ) respectively.
4. At lubricant-bush surface interface
10 Rr
bb
z
ff
r
Tk
z
T
ch
k
5. At lateral surface of bearing
abbb
j
b TThT
R
k
6. At hole inlet edge
bs TT
3. Solution Procedure
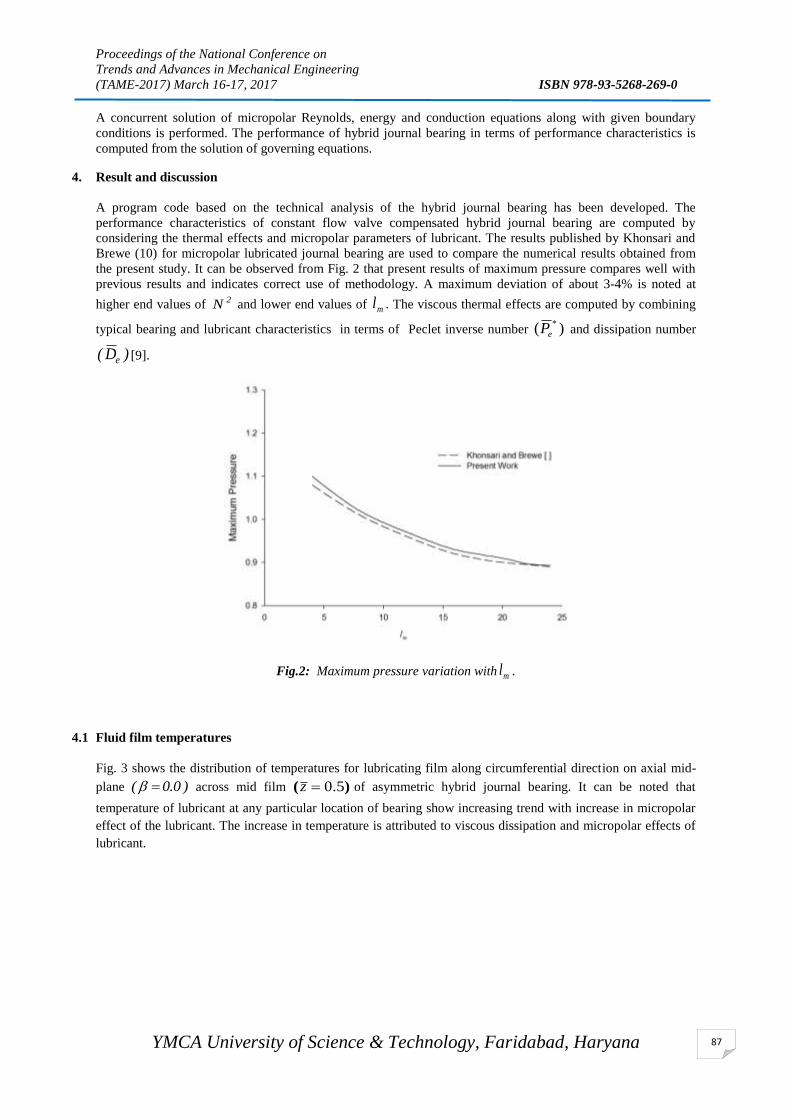
Proceedings of the National Conference on
Trends and Advances in Mechanical Engineering
(TAME-2017) March 16-17, 2017 ISBN 978-93-5268-269-0
YMCA University of Science & Technology, Faridabad, Haryana
87
A concurrent solution of micropolar Reynolds, energy and conduction equations along with given boundary
conditions is performed. The performance of hybrid journal bearing in terms of performance characteristics is
computed from the solution of governing equations.
4. Result and discussion
A program code based on the technical analysis of the hybrid journal bearing has been developed. The
performance characteristics of constant flow valve compensated hybrid journal bearing are computed by
considering the thermal effects and micropolar parameters of lubricant. The results published by Khonsari and
Brewe (10) for micropolar lubricated journal bearing are used to compare the numerical results obtained from
the present study. It can be observed from Fig. 2 that present results of maximum pressure compares well with
previous results and indicates correct use of methodology. A maximum deviation of about 3-4% is noted at
higher end values of 2N and lower end values of ml . The viscous thermal effects are computed by combining
typical bearing and lubricant characteristics in terms of Peclet inverse number )( *
eP and dissipation number
)D( e [9].
Fig.2: Maximum pressure variation with ml .
4.1 Fluid film temperatures
Fig. 3 shows the distribution of temperatures for lubricating film along circumferential direction on axial mid-
plane )0.0( across mid film )( 5.0z of asymmetric hybrid journal bearing. It can be noted that
temperature of lubricant at any particular location of bearing show increasing trend with increase in micropolar
effect of the lubricant. The increase in temperature is attributed to viscous dissipation and micropolar effects of
lubricant.

Proceedings of the National Conference on
Trends and Advances in Mechanical Engineering
(TAME-2017) March 16-17, 2017 ISBN 978-93-5268-269-0
YMCA University of Science & Technology, Faridabad, Haryana
88
Fig.3: Mid film temperature variation with .
4.2 Minimum fluid film thickness )( minh
The change in values of minimum fluid film thickness )( minh for Newtonian and micropolar lubricants is shown
in Fig. 4. The plot indicates that, for a given value of characteristics length )( ml , minh increases with increase in
coupling number )( 2N . A maximum increase of 5.74% is observed in minh for micropolar lubricant
10)0.8,( m2 lN in comparison to Newtonian lubricant.
Fig.4: Minimum fluid film thickness variation with characteristic length.
4.3 Maximum pressure )( maxp
The variation of maximum pressure )( maxp against characteristic length )( ml is represented in Fig. 5. It can be
observed that values of maxp are significantly increased at lower values of ml for lubricant at high values of
coupling number )( 2N . The maximum pressure is increased by 26.9% for micropolar lubricant
10)0.8,( m2 lN in comparison to Newtonian lubricant.

Proceedings of the National Conference on
Trends and Advances in Mechanical Engineering
(TAME-2017) March 16-17, 2017 ISBN 978-93-5268-269-0
YMCA University of Science & Technology, Faridabad, Haryana
89
Fig. 5:Variation of maximum pressure with characteristic length
4.4 Attitude angle )(
Figure 6 shows that attitude angle )( is highest for Newtonian lubricant for hybrid journal bearing. It can also
be observed that the values of decreases with increase in micropolar effects (high 2N and low ml ) in
lubricant. The maximum decrease can be observed for micropolar lubricant with 2N =0.8 and ml =18. It also
indicates the stable position of journal bearing.
Fig. 6:Variation of attitude angle with characteristic length .
Conclusions
The present work investigated the combined effect of temperature increase and change of micropolar effects in
lubricant on the performance of asymmetric configuration of hybrid journal bearing. From the study, it can be
concluded that:
1. The performance of asymmetric hybrid journal bearing compensated with constant flow valve is increased in
terms of maximum pressure with the consideration of micropolar effects in lubricant.
2. The minimum fluid film thickness is increased for lubricants with high coupling numbers.
3. The Hybrid journal bearings lubricated with higher values of micropolar effects show a significant decrease in
attitude angles.

Proceedings of the National Conference on
Trends and Advances in Mechanical Engineering
(TAME-2017) March 16-17, 2017 ISBN 978-93-5268-269-0
YMCA University of Science & Technology, Faridabad, Haryana
90
References
1. Eringen AC. Theory of Micropolar Fluids. J Math Mech. 1966;16:1–18.
2. Khatak P, Garg HC. Influence of micropolar lubricant on bearings performance: A review. Proc Inst Mech Eng
Part J J Eng Tribol. 2012;226(9):775–84.
3. Zare Mehrjardi M, Rahmatabadi AD, Rashidi Meybodi R. A Study on the Stability Performance of Noncircular
Lobed Journal Bearings with Micropolar Lubricant. Proc Inst Mech Eng Part J J Eng Tribol. 2015;
4. Bansal P, Chattopadhayay AK, Agrawal VP. Linear Stability Analysis of Hydrodynamic Journal Bearings with
a Flexible Liner and Micropolar Lubrication. Tribol Trans. 2015;58:316–26.
5. Garg HC, Kumar V, Sharda HB. Non-Newtonian and Thermal Effects in Constant Flow Valve Compensated
Symmetric Hole-entry Hybrid Journal Bearing. Lubr Sci. Wiley Online Library; 2007;19:269 – 286.
6. Garg HC, Kumar V. Analysis of Thermal Effects in Capillary Compensated Hole-entry Hybrid Journal Bearings
Lubricated with a Non-Newtonian Lubricant. Proc Inst Mech Eng Part J J Eng Tribol. 2010;224:317–34.
7. Garg HC, Kumar V, Sharda HB. A Comparative Thermal Analysis of Slot-entry and Hole Entry Hybrid Journal
Bearings Lubricated with Non-Newtonian Lubricant. J Tribol. 2010;132:41701-041701–11.
8. Khatak P, Garg HC. Performance Analysis Of Capillary Compensated Hybrid Journal Bearing By Considering
Combined Influence Of Thermal Effects And Micropolar Lubricant. J Tribol. 2016;
9. Khatak P, Garg HC. Thermohydrostatic analysis of hybrid journal bearing compensated by constant flow valve
operating with micropolar lubricant. Proc Inst Mech Eng Part J J Eng Tribol. 2016;230(9):1041–55.
10. Khonsari MM, Brewe DE. Effect of Viscous Dissipation on the Lubrication Characteristics of Micropolar
Fluids. Acta Mech. 1994;105:57–68.

Proceedings of the National Conference on
Trends and Advances in Mechanical Engineering
(TAME-2017) March 16-17, 2017 ISBN 978-93-5268-269-0
YMCA University of Science & Technology, Faridabad, Haryana
91
TECHNOLOGICAL ASPECTS OF SOLAR CONCENTRATOR: A
CRITICAL REVIEW
Aman Sharma, Santosh Patel
B.Tech. Final Year Student, Mechanical Engineering Department, National Institute of Technology
Kurukshetra-136119
[email protected], [email protected]
Abstract
The world is experiencing a rapid transition in energy requirements. Solar energy possesses a good potential to
satisfy the energy requirements. The major advantage of this form of energy is that it is a renewable source of
energy and does not cause any pollution. Concentrated solar power provides a good means to multiply the
energy output from these sources. The principle if utilized can fulfil our demands for energy by appropriately
multiplying energy output from solar cells. The aim of this study is to critically analyse the different solar
concentrators and suggest proper solutions. Results from the study indicate that solar concentrators have a
bright future for satisfying the needs for energy especially in places where solar energy is abundantly available.
Keywords: Solar Concentrators, Solar energy collectors, Concentrating Solar Power.
INTRODUCTION
The world is seeing a rapid transition in energy requirements. Most of our energy is fuelled by fossil fuels.
However these fossil fuels cause pollution and are expected to get exhausted in a few years. An alternative
source of energy especially solar energy provides a good opportunity to fuel the requirements of energy. Some
of these sources also have an additional benefit of being non-polluting along with the potential of satisfying the
need of energy. Concentrated solar power is a good method for increasing the power output from solar cells.
Solar concentrators generate power by using mirror or lens to concentrate large area of sunlight into a small
area. Energy is generated when concentrated light is converted into heat which generates electricity. This heat
can also be used to heat substance such as molten salt which can be used to produce electricity after sunset.
Proper sizing of the components is a complex problem. Simulation tool is a great resource to anticipate the
behaviour of components in complex and varied situation. Different types of concentrators produce different
peak temperatures and correspondingly varying thermodynamic efficiencies. New innovations in Concentrating
Solar power technology are leading the systems to become more and more cost effective.

Proceedings of the National Conference on
Trends and Advances in Mechanical Engineering
(TAME-2017) March 16-17, 2017 ISBN 978-93-5268-269-0
YMCA University of Science & Technology, Faridabad, Haryana
92
Fig1: Different Types of Solar Concentrators
Concentrated Solar Power has shown an increase in its uses. The table 1 shows about concentrated solar power
used in various plants worldwide. The Table presents about the concentrator type output and efficiency of
different plants which are based on CSP Technique.
Table 1: Worldwide Projects related to Solar Concentrators
Name and location Concentrator
type
Focus
(point/linear)
Output
(kW)
Sun
concentration
(X)2
Tracking
(yes/no)
Efficiency
of the
system
Alpha Solarco,
Pahrump, Nevada,
USA
Fresnel lens Point 15 n/a Yes n/a
AMONIX and
Arizona Public
Service Arizona,
USA
Fresnel lens Point 300 250 Yes 24.00%
Australian National
University Spring
Valley, Australia
Parabolic
trough Linear n/a 30 Yes 15%
PETAL Sede Boqer,
Israel
Parabolic
dishes Point 154,000 400 Yes 16.50%
BP Solar &
Polytechnical
University of
Madrid Tenerife,
Canary Island, USA
Parabolic
trough Linear 480 38 Yes 13.00%
Entech Inc Ft.
Davis, Texas, USA Fresnel lenses Linear 100 20 Yes 15.00%
Fraunhofer- Institute
for Solar Energy
Systems Freiburg,
Germany
Parabolic
trough and
CPC3
Linear and
point n/a 214 Yes 77.50%
Polytechnical
University of
Madrid Spain
Flat
concentration
devices (RXI)
Point n/a 1000 No n/a
Photovoltaics
International, LLC
Sacramento
California, USA
Fresnel lens Linear 30 10 Yes 12.70%
Solar Research
Corporation, Pvt.
Ltd. Australia
Parabolic dish Point 0.2 239 Yes 22.00%
SolFocus Ben
Gurien University,
Israel
Paraboloid
and
hyperboloid
Point and
point 0.25 500 Yes 81%
SunPower
Corporation USA Fresnel lens Point n/a 250-400 n/a 27
LITERATURE REVIEW
Garcia et al. (2010) studied an overview of the parabolic trough concentrators that have been built and
marketed in the past few century. It also presents a survey of systems which could incorporate this type of

Proceedings of the National Conference on
Trends and Advances in Mechanical Engineering
(TAME-2017) March 16-17, 2017 ISBN 978-93-5268-269-0
YMCA University of Science & Technology, Faridabad, Haryana
93
concentrating solar system to supply thermal energy up to 400 °C, especially steam power cycles for electricity
generation, including examples of each application.
Barlev et al. (2011) described about the various innovation in solar power concentrators over the last decade.
Their study gives a good view about the impact of various innovations which can be used to improve the
performance of solar concentrators.
Sharma (2011) studied the effect of solar power radiation. His work describes about the application of
concentrated solar power and also tells about its implication and classified various Indian states according to
their potential of solar photovoltaic and concentrated solar power.
Mahta et al.(2012) dealt about the solar power potential in India and discussed about solar power potential of
all states in India and also discussed about the scope of concentrating solar power in India.
Behar et al. (2013) worked on the need of concentrating solar power. They also compared various solar
concentrators on the basis of their working temperature, development status etc shown in Table 2.
Table 2. Comparison of Solar Concentrators
C.S.P Technology
Parabolic
Trough
Central Receiver Linear Fresnel Dish
Solar Collector Line focus Point focus Line focus Point Focus
Power Conversion
Cycle RC,CC RC,BC,CC RC RC,SC
Solar Receiver Mobile Fixed Fixed Mobile
Concentration
Ratio 70-80 >1000 >60 >1300
Solar Field Slope <1-2 <2-4 <4 10 or more
Working
temperature Medium Higher Relatively Lower Highest
Current Efficiency 15-16 16-17 8-10 20-25
Plant peak
Efficiency 14-20 23-35 18 30
Typical Capacity
(MW) 10-300 10-200 10-200 0.01-0.025
Development status Commercial
Proven Commercial Pilot Project
Demonstration
stage
Technology
Development status Low Medium Medium Medium
Outlooks for
improvement Limited Very significant Significant
Via mass
production
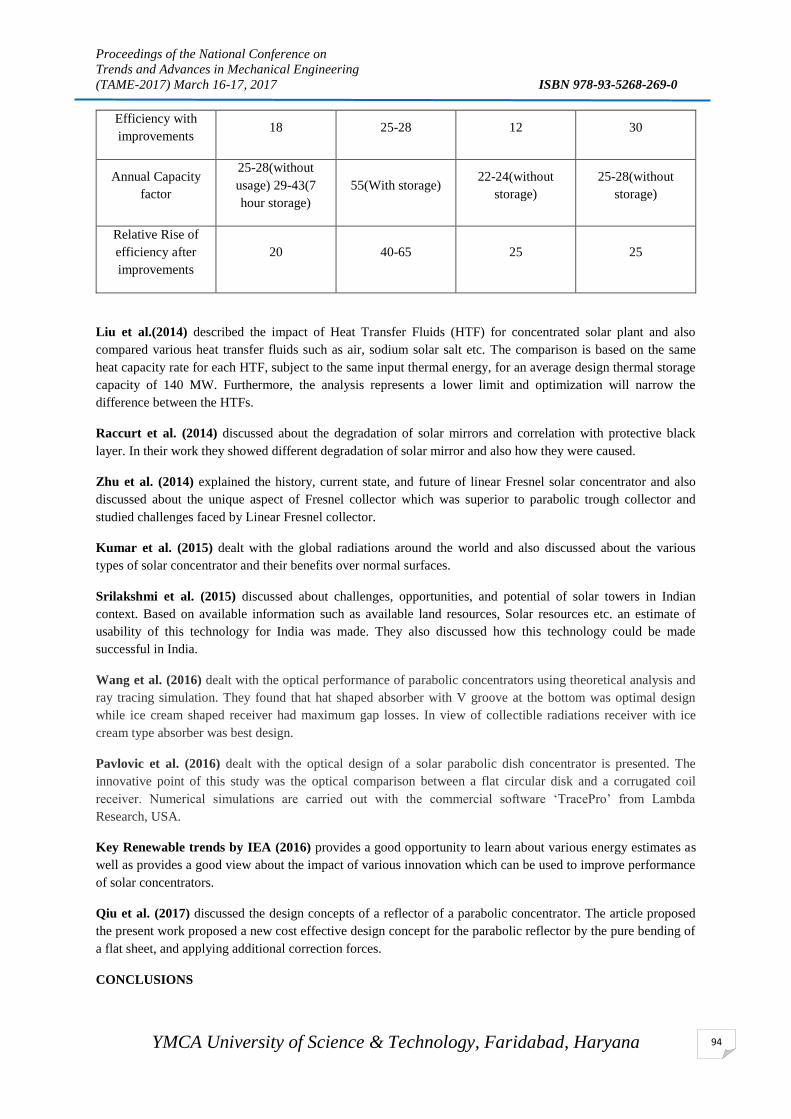
Proceedings of the National Conference on
Trends and Advances in Mechanical Engineering
(TAME-2017) March 16-17, 2017 ISBN 978-93-5268-269-0
YMCA University of Science & Technology, Faridabad, Haryana
94
Efficiency with
improvements 18 25-28 12 30
Annual Capacity
factor
25-28(without
usage) 29-43(7
hour storage)
55(With storage) 22-24(without
storage)
25-28(without
storage)
Relative Rise of
efficiency after
improvements
20 40-65 25 25
Liu et al.(2014) described the impact of Heat Transfer Fluids (HTF) for concentrated solar plant and also
compared various heat transfer fluids such as air, sodium solar salt etc. The comparison is based on the same
heat capacity rate for each HTF, subject to the same input thermal energy, for an average design thermal storage
capacity of 140 MW. Furthermore, the analysis represents a lower limit and optimization will narrow the
difference between the HTFs.
Raccurt et al. (2014) discussed about the degradation of solar mirrors and correlation with protective black
layer. In their work they showed different degradation of solar mirror and also how they were caused.
Zhu et al. (2014) explained the history, current state, and future of linear Fresnel solar concentrator and also
discussed about the unique aspect of Fresnel collector which was superior to parabolic trough collector and
studied challenges faced by Linear Fresnel collector.
Kumar et al. (2015) dealt with the global radiations around the world and also discussed about the various
types of solar concentrator and their benefits over normal surfaces.
Srilakshmi et al. (2015) discussed about challenges, opportunities, and potential of solar towers in Indian
context. Based on available information such as available land resources, Solar resources etc. an estimate of
usability of this technology for India was made. They also discussed how this technology could be made
successful in India.
Wang et al. (2016) dealt with the optical performance of parabolic concentrators using theoretical analysis and
ray tracing simulation. They found that hat shaped absorber with V groove at the bottom was optimal design
while ice cream shaped receiver had maximum gap losses. In view of collectible radiations receiver with ice
cream type absorber was best design.
Pavlovic et al. (2016) dealt with the optical design of a solar parabolic dish concentrator is presented. The
innovative point of this study was the optical comparison between a flat circular disk and a corrugated coil
receiver. Numerical simulations are carried out with the commercial software ‘TracePro’ from Lambda
Research, USA.
Key Renewable trends by IEA (2016) provides a good opportunity to learn about various energy estimates as
well as provides a good view about the impact of various innovation which can be used to improve performance
of solar concentrators.
Qiu et al. (2017) discussed the design concepts of a reflector of a parabolic concentrator. The article proposed
the present work proposed a new cost effective design concept for the parabolic reflector by the pure bending of
a flat sheet, and applying additional correction forces.
CONCLUSIONS
Proceedings of the National Conference on
Trends and Advances in Mechanical Engineering
(TAME-2017) March 16-17, 2017 ISBN 978-93-5268-269-0
YMCA University of Science & Technology, Faridabad, Haryana
95
It has been concluded that Concentrated Solar Power (CSP) plants are used for power productions worldwide.
Depending on the type of concentrators concentrated solar plant can be classified as parabolic trough solar plant,
solar tower power plant, parabolic dish power plant and Fresnel reflector power plant. There lies a very vast
scope for improving the efficiency as well as cost of solar concentrators. If proper research and development is
made in this field we can drastically reduce the setup cost of solar concentrators and also improve the output
from such plants. Studies have shown that with concentration of solar power it can be used for large power
generation from small area. Other than generating power this concentrated power can also be utilized for boiling
water as well as for cooking. A vast potential also lies for development of concentrators especially those with
parabolic dish which can also be used to run the Stirling engine which can in turn generate power.
Solar towers also possess a high potential since they can be used to heat substances such as molten salt which
can also be used to generate power even in the non-availability of sun. If it is done we can easily reduce our
dependence on fossil fuels since one of the disadvantages of solar energy was not usable in the night. If it could
be used then we can reduce our dependence on fossil fuel and reduce greenhouse gas emission. It can spark off a
new energy revolution which would be cleaner and greener and healthier for our planet. Parabolic trough type
concentrator also has potential in the refrigeration and air conditioning industry and prototypes of this type of
system is being tested for its uses in Vapour absorption system besides power generation.Further research is
needed to optimize output and have cost saving as well as consider more power generation configuration.
REFERENCES
1. S.A. Kalogirou (2013) Solar energy engineering: processes and systems Academic Press.
2. Renewable energy essentials: concentrating solar thermal power (2009), International Energy Agency.
3. F. Muhammad-Sukki, R. Ramirez-Iniguez, S.G. McMeekin, B.G. Stewart, B. Clive (2010), Solar
Concentrators, International Journal of Applied Science, Vol. 1, p.1.
4. C. Kennedy, (2010), Advanced reflector and absorber materials, thermal systems group: CSP capabilities
national renewable energy laboratory (NREL), USA.
5. S. Florian, P. Heller, S. Meyen, R. Pitz-Paal (2010), A new method to characterize degradation of first surface
aluminum reflectors SolarPACES.
6. C.E. Kennedy, K. Terwilliger, G.J. Jorgensen (2007), Further analysis of accelerated exposure testing of thin-
glass mirror, Energy sustainability, June 27–30, Long Beach, CA ES2007-36182.
7. O. Raccurt, C. Delord, C. Bouquet, R. Couturier (2014), Correlation between solar mirror degradation and
colorimetric measurement of protective back layer, SolarPACES 2013, Energy Procedia, 49.
8. C. Kennedy, K. Terwilliger, M. Milbourne (2005), Development and testing of solar reflectors. In: 2004 DOE
solar energy technologies program review meeting. October 25–28, 2004, Denver, CO.
9. C. Kennedy, K. Terwilliger, M. Milbourne (2005), Optical durability of candidate solar reflectors, ASME J Sol
Energy Eng, 127.
10. Y. Naichia (2010), Analysis of spectrum distribution and optical losses under Fresnel lenses, Renewable
Sustainable Energy Rev, 14.
11. K. Peter, L. P.Wen, M. Matthew (2013), Modelling of solar tracking for giant Fresnel lens solar stoves, Sol
Energy, 96 (2013).
12. V. Kumar, R.L. Srivastava, S.P. Untawale (2016), Fresnel lens: A promising alternative of reflectors in
concentrated solar power, International Energy Agency.
13. O. Behar A. Khellaf, K. Mohammedi (2014), A review of studies on central receiver solar thermal power plants.

Proceedings of the National Conference on
Trends and Advances in Mechanical Engineering
(TAME-2017) March 16-17, 2017 ISBN 978-93-5268-269-0
YMCA University of Science & Technology, Faridabad, Haryana
96
COMPARISON OF COMMON EJECTOR REFRIGERATION SYSTEM
AND EJECTOR REFRIGERATION SYSTEM WITH JET PUMP
Gourav Barwal1 Gulshan Sachdeva
2
Department of Mechanical Engineering National Institute of Technology, Kurukshetra(136119),Haryana
Phone: 9459163346 , e-mail: [email protected]
Abstract
In ejector refrigeration system the external work required for refrigeration is supplied in the form of low grade
energy generally solar energy or industrial waste heat. With the addition of jet pump the performance of
common ejector refrigeration system can be increased. The jet pump reduces the back pressure at the ejector
outlet increasing the entrainment ratio of the ejector. The paper carries out a theoretical analysis of the
variation of COP, entrainment ratio and generator heat load with the generator temperature for common and
modified ejector refrigeration system for refrigerant R134a.
Keywords: Refrigeration system, heat, COP, pump
Nomenclature
CERS Common ejector refrigeration system Subscripts
MERS Modified ejector refrigeration systemc condenser
h enthalpyd diffuser section of ejector
m mass flow ratee evaporator
P Pressuren nozzle
Pb back pressure mf mixed fluid
Q heat load g generator
T Temperature p pump
u velocity m mixing section
η enthalpy d diffuser
μ entrainment ratiosf secondary fluid , v specific volume
Introduction
From second law of thermodynamics to transfer heat from a low temperature body to a high temperature body
we require energy input from an external source. Refrigeration is a cyclic process of maintaining the
temperature of a system less than that of its surrounding. Refrigeration requires external work, In conventional
VCR systems this external energy input is in the form of high grade electrical energy. However in ER systems
this external energy input is in form of low grade energy. This is the fundamental difference between the VCR
system and ER system
Ejector is the fundamental component of ER system. Ejector has two inlets one is of primary fluid and the other
of secondary fluid. If both the primary and secondary fluids are in vapor state the term “ejector” is used to

Proceedings of the National Conference on
Trends and Advances in Mechanical Engineering
(TAME-2017) March 16-17, 2017 ISBN 978-93-5268-269-0
YMCA University of Science & Technology, Faridabad, Haryana
97
describe the system. However if one of the two fluids is in liquid state the term “Jet pump” is used. So the jet
pump can be called an ejector with one inlet in vapor form and the other in liquid form.
Fig. 1 ejector refrigeration system
Fig. 2 modified ejector refrigeration system
In the modified form of ejector refrigeration system the mixed fluid of the ejector act as secondary fluid of the
jet pump. The pumped fluid is divided into two streams one passing into the generator and the other acting as
the primary fluid for the jet pump. The primary fluid to the jet pump is in liquid form and the secondary fluid is
in vapor form. The jet pump at the outlet of ejector further reduces the back pressure and increases the mass
flow rate of secondary fluid resulting in an increase in the refrigerating effect.
Literature survey
He et al.[1] describes the operating principle of ER system and concluded that ejector is the critical component
impacting the performance and physical characteristics of the whole system. Keenan and Henry[2] introduced
the constant pressure model(CPM) of the ejector .In this model the mixing of both fluids occur at constant
pressure at the outlet of primary nozzle. For constant pressure model the exit of the motive nozzle is assumed to
coincide with the converging part of the suction chamber.
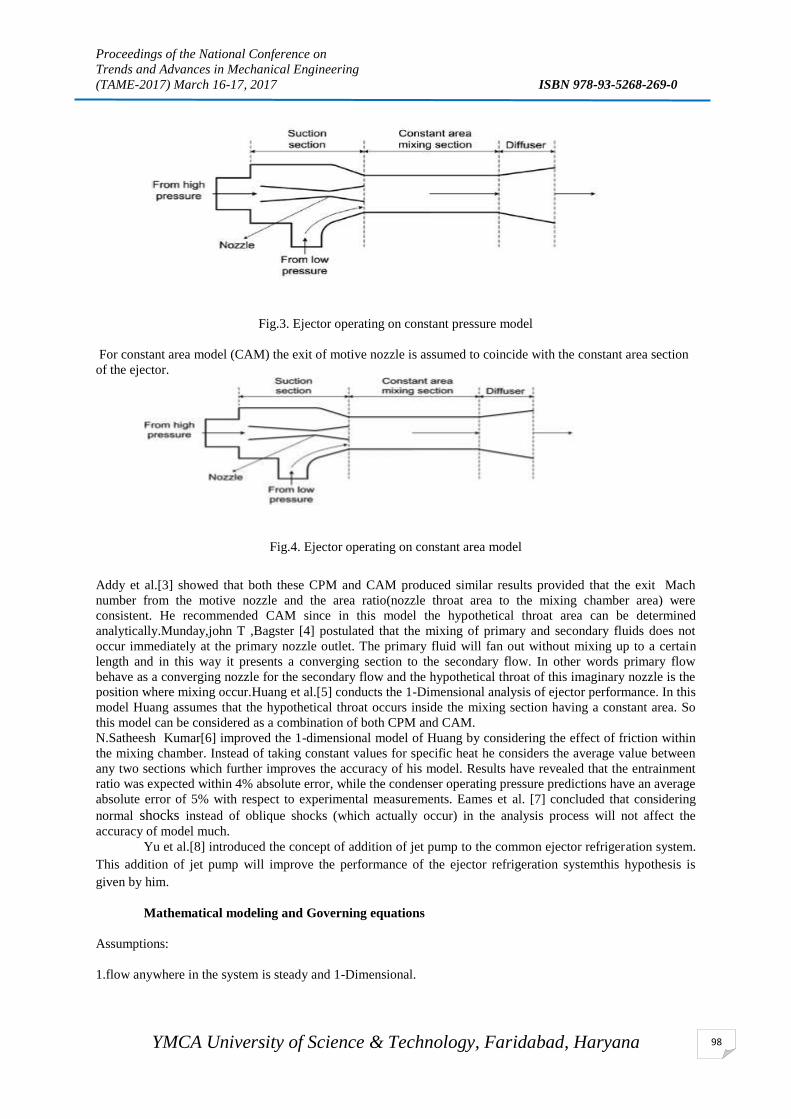
Proceedings of the National Conference on
Trends and Advances in Mechanical Engineering
(TAME-2017) March 16-17, 2017 ISBN 978-93-5268-269-0
YMCA University of Science & Technology, Faridabad, Haryana
98
Fig.3. Ejector operating on constant pressure model
For constant area model (CAM) the exit of motive nozzle is assumed to coincide with the constant area section
of the ejector.
Fig.4. Ejector operating on constant area model
Addy et al.[3] showed that both these CPM and CAM produced similar results provided that the exit Mach
number from the motive nozzle and the area ratio(nozzle throat area to the mixing chamber area) were
consistent. He recommended CAM since in this model the hypothetical throat area can be determined
analytically.Munday,john T ,Bagster [4] postulated that the mixing of primary and secondary fluids does not
occur immediately at the primary nozzle outlet. The primary fluid will fan out without mixing up to a certain
length and in this way it presents a converging section to the secondary flow. In other words primary flow
behave as a converging nozzle for the secondary flow and the hypothetical throat of this imaginary nozzle is the
position where mixing occur.Huang et al.[5] conducts the 1-Dimensional analysis of ejector performance. In this
model Huang assumes that the hypothetical throat occurs inside the mixing section having a constant area. So
this model can be considered as a combination of both CPM and CAM.
N.Satheesh Kumar[6] improved the 1-dimensional model of Huang by considering the effect of friction within
the mixing chamber. Instead of taking constant values for specific heat he considers the average value between
any two sections which further improves the accuracy of his model. Results have revealed that the entrainment
ratio was expected within 4% absolute error, while the condenser operating pressure predictions have an average
absolute error of 5% with respect to experimental measurements. Eames et al. [7] concluded that considering
normal shocks instead of oblique shocks (which actually occur) in the analysis process will not affect the
accuracy of model much. Yu et al.[8] introduced the concept of addition of jet pump to the common ejector refrigeration system.
This addition of jet pump will improve the performance of the ejector refrigeration systemthis hypothesis is
given by him.
Mathematical modeling and Governing equations
Assumptions:
1.flow anywhere in the system is steady and 1-Dimensional.

Proceedings of the National Conference on
Trends and Advances in Mechanical Engineering
(TAME-2017) March 16-17, 2017 ISBN 978-93-5268-269-0
YMCA University of Science & Technology, Faridabad, Haryana
99
2.flow inside the ejector is considered adiabatic and friction losses are taken into consideration by using
isentropic efficiency values wherever required.
3.for jet pump a homogenous two phase flow is considered.
4.mixing is considered to occur at constant pressure.
Nozzle section:
Neglecting the velocity at nozzle inlet the velocity at nozzle exit is given by
𝑢𝑝𝑓 = √2𝜂𝑛(ℎ1𝑛 − ℎ2𝑛)
ℎ1𝑛 = 𝑓(𝑇𝑔, 𝑥 = 0)
𝑠1𝑛 = 𝑓(𝑇𝑔, 𝑥 = 0)
ℎ2𝑛 = 𝑓(𝑃𝑓𝑛 , 𝑠 = 𝑠2𝑛)
𝑠1𝑛 = 𝑠2𝑛
ℎ2𝑛 = 𝑓(𝑠2𝑛, 𝑃 = 𝑃𝑓𝑛)
Mixing section:
𝑢𝑚𝑓 = 𝑢𝑝𝑓
√𝜂𝑚
1 + 𝜇
ℎ𝑚𝑓 =ℎ1𝑛 + 𝜇ℎ𝑠𝑓
1 + 𝜇−
𝑢𝑚𝑓2
2
ℎ𝑠𝑓 = 𝑓(𝑃𝑠𝑓 , 𝑥 = 1)
𝑠𝑚𝑓 = 𝑓(ℎ𝑚𝑓 , 𝑃𝑚)
𝑃𝑏𝑒
𝑃𝑚
= [1 +ᵞ − 1
2]
ᵞ
ᵞ−1

Proceedings of the National Conference on
Trends and Advances in Mechanical Engineering
(TAME-2017) March 16-17, 2017 ISBN 978-93-5268-269-0
YMCA University of Science & Technology, Faridabad, Haryana
100
ᵞ =𝐶𝑝
𝐶𝑣
𝐶𝑝 = 𝑓(𝑃𝑏𝑒 , 𝑥 = 1)
𝐶𝑣 = 𝑓(𝑃𝑏𝑒 , 𝑥 = 1)
Diffuser section:
If exit velocity of mixed fluid is neglected, actual enthalpy of mixed fluid is given by
ℎ𝑚𝑓1 = ℎ𝑚𝑓 +𝑢𝑚𝑓
2
2
Also from the concept of isentropic efficiency the actual exit enthalpy of mixed fluid can also be written as:
ℎ𝑚𝑓1 = ℎ𝑚𝑓 +ℎ𝑚𝑓𝑑𝑠 − ℎ𝑚𝑓
𝜂𝑑
ℎ𝑚𝑓𝑑𝑠 = 𝑓(𝑠𝑚𝑓𝑑𝑠 , 𝑃𝑚𝑓𝑑𝑠)
𝑃𝑚𝑓𝑑𝑠 = 𝑃𝑏
𝑠𝑚𝑓𝑑𝑠 = 𝑠𝑚𝑓
𝜂𝑛 = 0.85 , 𝜂𝑑 = 0.85 , 𝜂𝑚 = 0.95 ,
𝑃𝑏is the condenser pressure corresponding to 308K
𝑃𝑏𝑒 = 𝑃𝑠𝑓is the pressure of secondary fluid, refrigerating effect is assumed to be 1000W,𝑃𝑏𝑒=0.65MPa
For evaporator: 𝑄𝑒 = 𝑚𝑒(ℎ6 − ℎ5)
For generator: 𝑄𝑒 = 𝑚𝑔(ℎ1 − ℎ4)
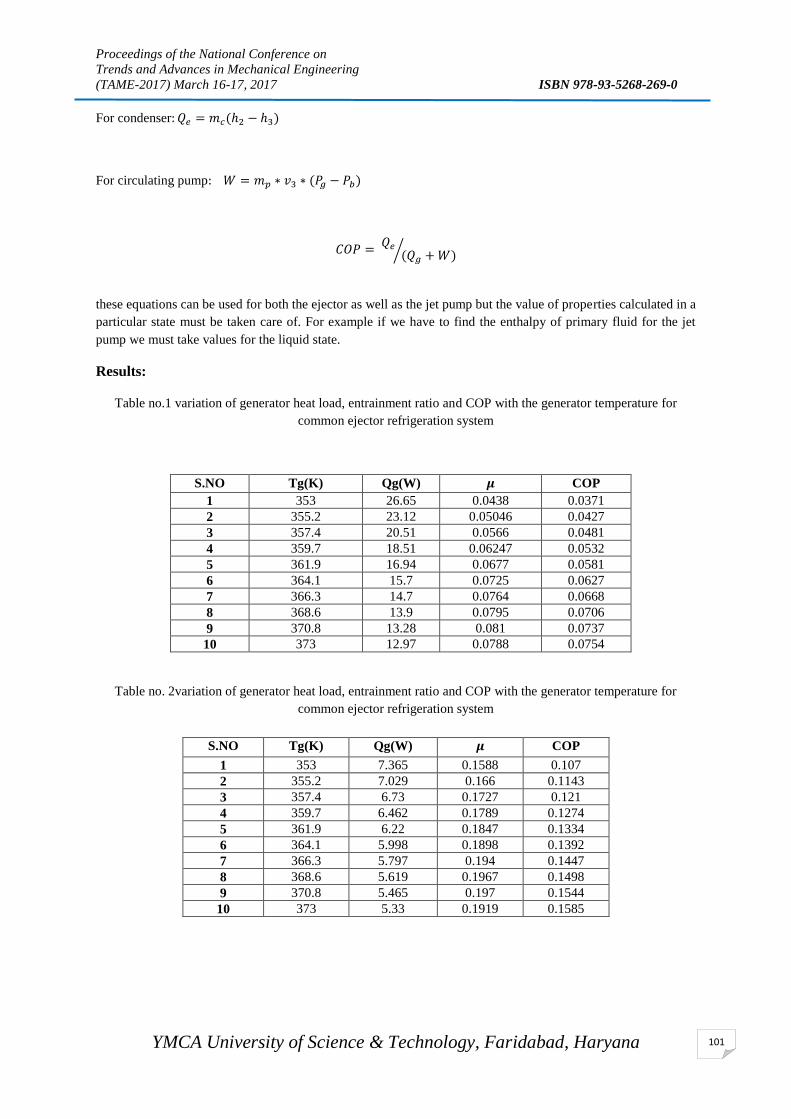
Proceedings of the National Conference on
Trends and Advances in Mechanical Engineering
(TAME-2017) March 16-17, 2017 ISBN 978-93-5268-269-0
YMCA University of Science & Technology, Faridabad, Haryana
101
For condenser: 𝑄𝑒 = 𝑚𝑐(ℎ2 − ℎ3)
For circulating pump: 𝑊 = 𝑚𝑝 ∗ 𝑣3 ∗ (𝑃𝑔 − 𝑃𝑏)
𝐶𝑂𝑃 = 𝑄𝑒
(𝑄𝑔 + 𝑊)⁄
these equations can be used for both the ejector as well as the jet pump but the value of properties calculated in a
particular state must be taken care of. For example if we have to find the enthalpy of primary fluid for the jet
pump we must take values for the liquid state.
Results:
Table no.1 variation of generator heat load, entrainment ratio and COP with the generator temperature for
common ejector refrigeration system
S.NO Tg(K) Qg(W) 𝝁 COP
1 353 26.65 0.0438 0.0371
2 355.2 23.12 0.05046 0.0427
3 357.4 20.51 0.0566 0.0481
4 359.7 18.51 0.06247 0.0532
5 361.9 16.94 0.0677 0.0581
6 364.1 15.7 0.0725 0.0627
7 366.3 14.7 0.0764 0.0668
8 368.6 13.9 0.0795 0.0706
9 370.8 13.28 0.081 0.0737
10 373 12.97 0.0788 0.0754
Table no. 2variation of generator heat load, entrainment ratio and COP with the generator temperature for
common ejector refrigeration system
S.NO Tg(K) Qg(W) 𝝁 COP
1 353 7.365 0.1588 0.107
2 355.2 7.029 0.166 0.1143
3 357.4 6.73 0.1727 0.121
4 359.7 6.462 0.1789 0.1274
5 361.9 6.22 0.1847 0.1334
6 364.1 5.998 0.1898 0.1392
7 366.3 5.797 0.194 0.1447
8 368.6 5.619 0.1967 0.1498
9 370.8 5.465 0.197 0.1544
10 373 5.33 0.1919 0.1585

Proceedings of the National Conference on
Trends and Advances in Mechanical Engineering
(TAME-2017) March 16-17, 2017 ISBN 978-93-5268-269-0
YMCA University of Science & Technology, Faridabad, Haryana
102
Graphs:
Fig. 5 variation of COP with generator temperature
Fig. 6 variation of entrainment ratio with generator temperature
Fig. 7 variation of generator heat load with generator temperature
00.020.040.060.08
0.10.120.140.160.18
353 355.2 357.4 359.7 361.9 364.1 366.3 368.6 370.8 373
COP
Tg
MERS
CERS
0
0.05
0.1
0.15
0.2
0.25
353 355.2 357.4 359.7 361.9 364.1 366.3 368.6 370.8 373
𝜇
Tg
MERS
CERS
0
5
10
15
20
25
30
353 355.2 357.4 359.7 361.9 364.1 366.3 368.6 370.8 373
Qg
Tg
CERS
MERS
Proceedings of the National Conference on
Trends and Advances in Mechanical Engineering
(TAME-2017) March 16-17, 2017 ISBN 978-93-5268-269-0
YMCA University of Science & Technology, Faridabad, Haryana
103
Discussion &Conclusion:
The addition of jet pump improves the COP and entrainment ratio of the common ejector refrigeration system.
At any temperature there is a significant difference in the COP of CERS and MERS and this difference
increases with increase in temperature. At any temperature the entrainment ratio of MERS is more than the
CERS and the difference between the two remains almost constant. The generator heating load decreases with
increase in temperature for both the CERS and MERS.
With the addition of a simple component the efficiency and other performance parameters of the common
ejector refrigeration system can be improved. More experimental work in this regard is needed to be done.
References:
1.S.He,Y. Li, R.Z. Wang, Progress of mathematical modeling ejectors. Renew. Sustain. Energy ev. 13(10/2009)
1760-1780.
2.Keenan J.H., Neumann E.P., “A simple air ejector”, Journal of Applied Mechanics, Vol. 9, pp. A75-A84,1942.
3.A.L.D. Addy, J C C.C. Mikkelsen, Supersonic Ejector-diffuser Theory and Experiments, 1981.Urban-
Champaign.
4.Munday, John T, Bagster DF. A new ejector theory applied to steam jet refrigeration. Ind. Engng Chem.,
Process Des. Dev. 1977;16:442–449.
5. Huang BJ, Chang JM, Wang CP, Petrenko VAA.1-D analysis of ejector performance. International Journal of
Refrigeration 1999;22:354–64.
6. N.Satheesh Kumar. One dimensional model of an ejector with special attention to fanno flow with in the
mixing chamber.Applied Thermal Engineering 65(2014)226-235
7.I.W. Eames, S. Wu, M. Worall, S. Aphornratana, An experiment investigation of steam ejector for
applications in jet pump refrigerators powered by low grade heat , Proc. Inst. Mech. Eng. Part A J Power Energy
213 (1999) 351-361.
8.Jianlin Yu , Hua Chen , YunfengRen,Yanzhong Li , A new refrigeration system with an addition of jet
pump,Applied thermal engineering 26(2006)312-319
9. Khalil A., Fatouh M., Elgendy E., “Ejector design and theoretical study of R134a ejector refrigeration cycle”,
International Journal of Energy, Vol. 34, pp. 1684-1698, 2011.
10.Yari M. and Sirousazar M., “Performance analysis of the ejector-vapors compression refrigeration cycle”,
Journal of Power and Energy. Vol. 221, pp. 1089-1098, 2007
11.Selvaraju A., Mani A., “Experimental investigation on R134a vapor ejector refrigeration system”,
International Journal of Refrigeration, Vol.29, pp.1160-1166, 2006.
12.Kornhauser, “The use of an ejector as a refrigerant expander”, (USNC/IIR Refrigeration conference, USA
1990)9-10.
13.Sarkar J., “Geometric parameter optimization of ejector –expansion refrigeration cycle with natural
refrigerants”, International Journal of Energy Research. Vol. 34 (1), pp. 89-94, 2010.
14.Qureshi, B.A., Zubair, S.M., “Performance degradation of a vapor compression refrigeration system under
fouled conditions”, International Journal of Refrigeration, Vol. 34(4), pp. 1016-1027, 2011.

Proceedings of the National Conference on
Trends and Advances in Mechanical Engineering
(TAME-2017) March 16-17, 2017 ISBN 978-93-5268-269-0
YMCA University of Science & Technology, Faridabad, Haryana
104
AN APPROACH TO INCREASE THE EFFICIENCY OF INTERNAL
COMBUSTION ENGINE
Satya Prakash1, Bhupender Singh
2
1M.Tech Student,
2Asst. Prof, Mechanical Engg. Department, YMCAUST, Faridabad.
Email- [email protected], Mob. No.- 9560399271
Abstract
In the field of engineering it is always the effort of the scientists and the engineers to improve the efficiency of
the IC engines by doing various R&D in this field. And they have developed many methods like turbocharging,
cam-less engines, direct fuel injection, VIT(Variable Injection Timing), regenerative braking, etc. In this paper I
am discussing the factors which are limiting the efficiency of ICE and various ways to increase it.
Keywords: IC engine, efficiency, friction, turbocharger
1. Introduction
There is a lot of concern nowadays about the efficiency of the internal combustion engine (ICE), and
a lot of research is being done to improve it. But what exactly is the efficiency of the internal
combustion engine and how do we measure it? The efficiency of any engine is simply calculated from
the ratio (work output/ energy supplied). Where work output is the final power output at the shaft of
the engine after subtracting all the losses. It can be measured from a brake dynamometer. And energy
supplied is the energy of the fuel which is supplied per unit time to do the work. And it can be
obtained as the mass of the fuel multiplied by its calorific value. The average ICE has efficiency
between 20 to 30%, which is very low.If we see a heat balance sheet of the internal combustion
engines for a spark ignition or gasoline engine we find that the brake load efficiency is between 21 to
28%, whereas loss to convecting medium is between 12 to 27%, loss to exhaust is between 30 to 55
%, and loss due to incomplete combustion is between 0 to 45%.Similarly when we analyze the heat
balance sheet of a compression ignition or diesel engine we find that it has a brake load efficiency
between 29 to 42 % and loss to convecting medium is between 15 to 35 %, losses to exhaust is
between 25 to 45 %, and losses due to incomplete combustion is 0 to 5 %.
2. Carnot Theorem for Efficiency
The Kelvin-Plank statement of 2nd
law of Thermodynamics states that,” it is impossible for a heat
engine to produce net work in a complete cycle if it exchanges heat only with a single heat reservoir”
and this may lead to the conclusion that total conversion of input energy to the work completely, is
impossible. There should be some energy rejection to the sink (lower temperature thermal reservoir).
So, the work output must be less than the energy supplied. This led us to the final conclusion that
efficiency of the heat engine cannot be 100%.Sadi Carnot, a French military engineer had studied the
second law and makes a hypothetical cycle in which all the processes constituting the cycles are
reversible. The cycle consist of two reversible isothermal processes and two reversible adiabatic
processes. After this experiment he stated that, “ No heat engine working in a cycle between two
constant temperature reservoirs can be more efficient than areversible engine working between the
same two reservoirs." Thus the maximum efficiency any heat engine can have, is obtained by using
the Carnot’s cycle. Upto this date the highest efficiency which has been obtained is 52% in a
Maritime diesel engine of 90,000 horsepower.

Proceedings of the National Conference on
Trends and Advances in Mechanical Engineering
(TAME-2017) March 16-17, 2017 ISBN 978-93-5268-269-0
YMCA University of Science & Technology, Faridabad, Haryana
105
3. Factors Affecting the Efficiency Are:-
As we know from 2nd
law of thermodynamics that there should be some energy rejection in the form
of exhaust gas and in cooling through convection. So this is the thermodynamic factor for lesser
efficiency. But there are many more factors such as mechanical losses which affects the total output
obtained for automobile movement.
By analysing we find that the factors limiting the efficiency of an internal combustion engine are as
follows:-
Heat losses during cooling of engine.
Heat losses in exhaust gases.
Friction loss
Transmission efficiency losses. Losses in clutches and fluid couplings, etc.
Friction losses in tires.
Losses due to incomplete and imperfect combustion. Perfect combustion would result in the
production of carbon dioxide and water.
Loss due to braking
Losses due to viscosity of lubricating oil.
Compression ratio:- The higher the compression ratio the higher the thermal efficiency. As in spark
ignition or gasoline engines the compression ratio is limited by pre-ignition (not in compression
ignition or diesel engines). The diesel engines are about 30% more efficient than petrol engines.
Drag of the vehicle
Imperfect valve timing
Losses in driving cam shafts
Energy consumed by auxiliaries like water pumps and oil pumps
4. Various Methods and Technology to Improve the Efficiency of IC ENGINE
The practical methods and new technology that help in increasing the efficiency of the
internal combustion engines are as follows:
Regenerative braking: As braking a car or automobile wastes the kinetic energy in the form of heat,
regenerative braking is ideal method when you want to brake your vehicle to control speed (like when
going downhill). In this electromagnetic braking is done as small motors absorb the energy and
convert it into battery energy.
Variable Injection Timing: This is already used in Maritime engines. At low loads and speeds, the
injection is advanced allowing same mean effective pressure to be maintained. This not only increases
the efficiency of the engine as the scavenge pressure is maintained, it also allows for lower quality
fuel to be burnt.
Variable valve timing: In this method the exhaust and inlet valves opening and closing time can be
varied, affecting the efficiency of the engine. This method can increase the efficiency by 4 to 5%.
Cutting off cylinders: In large engines in cruising or going downhill, half of the cylinders can be cut
off thus reducing fuel demand. It cannot be done on small engines as the engine would become rough.
Turbochargers: It is a turbine-driven forced induction device that increases an internal combustion
engine's efficiency and power output by forcing extra air into the combustion chamber. This
improvement over a naturally aspirated engine's power output is due to the fact that the compressor
can force more air—and proportionately more fuel—into the combustion chamber than atmospheric
pressure alone. It increases efficiency by 7 to 8%.
Direct Fuel Injection: In previous engines, the fuel was mixed with air and injected, but nowadays
fuel is directly injected into the combustion chamber and mixing takes place according to the profile
of the combustion chamber. It increases efficiency by 11 to 13%.

Proceedings of the National Conference on
Trends and Advances in Mechanical Engineering
(TAME-2017) March 16-17, 2017 ISBN 978-93-5268-269-0
YMCA University of Science & Technology, Faridabad, Haryana
106
Twin spark plugs and multiple injectors: As the flame front starts from the spark plug and proceeds
outward, some fuel remains unburnt as ejected before the flame front can reach it. In a twin spark plug
cylinder two flame fronts are created, causing better combustion.
Using the correct viscosity of lubricating oil, as viscous oil can result in losses due to friction.
Integrated starter and generator systems: In this system the engine is immediately stopped when idling
and started when the accelerator is pressed.
5. Conclusion
The various factors which are reducing the efficiency of engine can be removed or eliminate to a
certain extent and not to be completely. Such as losses to friction (can be minimised by using good
viscous oil) and the energy rejection to the atmosphere, these can not to be eliminated. But energy loss
due to fuel unburnt in the cylinder, braking, transmission can be reduced by using different methods
described above.
From the above discussed methods of improving efficiency, some methods such as turbocharging,
twin spark plug, variable valve timing etc. are taken into consideration at this time. But some
techniques are developing stage such as regenerative braking and variable injection timing.
References
http://ecen.com/content/eee7/motoref.htm
http://mb-soft.com/public2/engine.html
http://www.fueleconomy.gov/feg/tech_adv.shtml
Proceedings of the National Conference on
Trends and Advances in Mechanical Engineering
(TAME-2017) March 16-17, 2017 ISBN 978-93-5268-269-0
YMCA University of Science & Technology, Faridabad, Haryana
107
ANALYSIS OF BARRIERS IN COMBINED CYCLE
POWER PLANTS- A GRAPH THEORETIC APPROACH
Nikhil Dev
Assistant Professor, Department of Mechanical Engineering, YMCA University of Science & Tech.,
Faridabad-121006, Haryana, India
Abstract
Energy conversion is necessary so that resources of lesser importance can be improved to serve the society in a
better way. A lot of human behavioural barriers, technical barriers, operational and maintenance barriers,
financial barriers, strategic barriers and supply chain barriers are there for power generation industries. In the
present work barriers related to power generation are identified and categorized into six divisions. These
divisions are interdependent. Therefore, methodology of analysis is also suggested so that power generation in
combined cycle power plants may be improved.
Keywords: Power Plants, Power generation barriers
1. Introduction
Efficient use of fuel and reliable operation of the combined cycle power plant is a function of skilled man power
and proper mix of maintenance strategies [1]. The objective of maximum utilization of resources can’t be met
without apt planning at management level [2]. Evaluation impact of policies decided by the management on the
performance of the labor is to be evaluated constantly so that pros and cons may be studied and epitomized for
the future [3]. In comparison to other organisations electricity generation industry effects more today’s dynamic
market more in terms of production. Market conditions are affected by shortened electricity supply, poor
transmission system, technological advancements and pressure from competitors and high quality with low cost
expectations from customers [4]. Electricity generation activity includes installation of a plant in accordance
with the availability of fuel, operation and maintenance of the plant and transmission system for the end delivery
of the product [5]. Mismanagement in any of these jobs leads to the inefficient utilization of resources (man,
material and machine) and results in to higher generation cost of per unit electricity. In the present work, the
objective is to identify and categories the barriers in the efficient operation of the combined cycle power plant.
2. Identification and categorization of barriers
On the basis of the literature review and experiences of power plant managers and operators, it has been found
that the efficient utilization of available resources in a very large organisation such as CCPP is a very
complicated task. There are certain barriers which inhibit the efficient utilization of resources. These barriers
have been identified and grouped into six major categories:
1. Human Behaviour (S
1)
2. Technical barriers (S2)
3. Operational and Maintenance barriers (S3)
4. Financial barriers (S4)
5. Strategic barriers (S5)
6. Supply chain barriers (S6)
2.1Human Behaviour barriers (S1)
These barriers are related to human nature and are effected with the psychology. Human behaviour plays a
significant role in the efficient utilization of resources [6]. The way of thinking and decision-making capability
of top management, fear of failure and risk-taking capacity of top management, employee’s acceptance or
resistance to the decisions of top management and availability of cheap and skilled labour are the behavioural
barriers. The impact of a barrier is time and region dependent.
Proceedings of the National Conference on
Trends and Advances in Mechanical Engineering
(TAME-2017) March 16-17, 2017 ISBN 978-93-5268-269-0
YMCA University of Science & Technology, Faridabad, Haryana
108
2.2 Technical barriers (S2)
Every system is to be improved with time because day to day research is changing the type, operation and
maintenance of power generation systems [5]. Computerized sensors and controls, cooling system requirements,
fuel supply system etc. are the important components of CCPPs. The non-availability of these equipment and
difficulty in their integration, non-availability of reliable vendors, poor technical knowledge of operators and
poor training facilities for their use are some important dimensions that reflect the existence of technical
barriers.
2.3 Operational and Maintenance barriers (S3)
These barriers are significant in the context of operation and maintenance of a CCPP. Maintainability is one of
the system design parameter that has a great impact in terms of ease of maintenance. Operational and
maintenance barriers include tool management problems, resource failures, maintenance problems and design
and layout problems [7].
3. Graph-theoretic approach
GTA is a three step decision making approach in which graph theory and matrix method is used to analyse the
determinant. In determinant alternative positive and negative sign appears, due to which some of the information
is lost in the complete analysis. In the permanent matrix information regarding the loops and dyads is stored.
These loops and dyads carry information about the inheritance and interdependence. For the successful
implementation of the methodology it is required that all of the information must be added in the index.
Therefore, permanent function is more useful than determinant. For evaluating relative index inheritance is
decreased from nine to one. In future if it is felt by some researcher that index value is required to be taken on
any other scale then it may be done with altering the methodology developed in the present work.
As the index value is the relative value, therefore, it is not affected with change in scale. From earlier experience
it is found that inheritance value on the scale of 1-9 is easy to handle than other scale. Secondly relative index
converts the index value on the scale 0-1, due to which it is easy to estimate performance.
4. Conclusion
In the present work different barriers in power generation are identified. In the present work barriers are
categorized into six types. Each and every type of barrier is suitable for different applications. With the help of
the barriers presented in the present work it is easy to evaluate the performance of combined cycle power plants.
References:
1. Dev N, Samsher, S.S.Kachhwaha “System modeling and analysis of a combined cycle power plant”
International Journal of System Assurance and Engineering Management, (2013) 4(4):353–364.
2. Dev N, Samsher, S.S.Kachhwaha, Attri R “GTA-based framework for evaluating the role of design
parameters in cogeneration cycle power plant efficiency” Ain Shams Engineering Journal (2013) 4, 273–
284.
3. Dev N, Samsher, S.S.Kachhwaha, Attri R “Exergy analysis and simulation of a 30MW cogeneration
cycle” Frontiers of Mechanical Engineering, 2013, 8(2): 169–180.
4. Dev N, Samsher, S.S. Kachhwaha and Attri R “Development of Reliability Index for Combined Cycle
Power Plant using graph theoretic approach”, Ain Shams Engineering Journal (2014) 5, 193–203.
5. Dev N, Samsher, S.S. Kachhwaha and Attri R, (2014), “Development of Reliability Index for
Cogeneration Cycle Power Plant Using Graph Theoretic approach”, International Journal of Systems
Assurance Engineering and Management, DOI 10.1007/s13198-014-0235-4.
6. Dev N, Samsher, S.S. Kachhwaha and Attri R “GTA Modelling of combined cycle power plant
efficiency analysis”, Ain Shams Engineering Journal (2015), 6, 217-237.
7. Dev N, Attri R “Performance analysis of combined cycle power plant” Frontiers in Energy ,Volume 9,
Issue 4 , pp 371-386, DOI10.1007/s11708-015-0371-9.

Proceedings of the National Conference on
Trends and Advances in Mechanical Engineering
(TAME-2017) March 16-17, 2017 ISBN 978-93-5268-269-0
YMCA University of Science & Technology, Faridabad, Haryana
109
WING DESIGN OF RADIO CONTROLLED ORNITHOPTER
RESHU SHARMA
M.Tech Student, Mechanical Engineerung Department,
YMCA University of Science &Technology, Faridabad.
Email id:- [email protected]
Abstract
In recent years the subject of flying vehicles propelled by flapping wings, also known as ornithopters, has been
an area of interest because of its application to micro aerial vehicles (MAVs). These miniature vehicles seek to
mimic small birds and insects to achieve never before seen agility in flight. These small flying machines have
struck the imaginations of many as ideal platforms for a variety of tasks including system monitoring and
surveillance where a swarm of tiny agents would be unconstructive and have better access to confined areas
than flying vehicles.In order to better understand the control of flapping wing flight, design analysis of the
large scale ornithopter is presented. This paper presents the knowledge of wing flight theory and design and
analysis of mechanical components consisting an ornithopter.
Keywords: Ornithopter wing, span, airfoil, bird.
Introduction
An ornithopter (from Greek ornithos “bird” and pteron “wing”) is an aircraft that lies by flapping its wings.
Those machines are driven by rotating airfoils. In an ornithopter, the driving airfoils have an oscillating motion
instead. This imitates nature, because no animals have any rotating parts. Difference between Ornithopter &
airplane or helicopter is described as follow: Unlike airplanes and helicopters, the driving airfoils of the
ornithopter have a flapping or oscillating motion, instead of rotary. As with helicopters, the wings usually have a
combined function of providing both lift and thrust. Theoretically, the flapping wing can be set to zero angle of
attack on the upstroke, so it passes easily through the air. Since typically the flapping airfoils produce both lift
and thrust, drag-inducing structures are minimized. These two advantages potentially allow a high degree of
efficiency. In propeller- or jet-driven aircraft, the propeller creates a relatively narrow stream of relatively fast
moving air. The energy carried by the air is lost. The same amount of force can be produced by accelerating a
larger mass of air to a smaller velocity, for example by using a larger propeller or adding a bypass fan to a jet
engine. Use of flapping wings offers even larger displaced air mass, moved at lower velocity, thus improving
efficiency. In order to create an effective ornithopter, it had to be able to flap its wings to generate enough
power to get off the ground and travel through the air. Efficient flapping of the wing is characterized by
pitching angles, lagging plunging displacements by approximately 90 degrees. Flapping wings increase drag
and are not as efficient as propeller-powered aircraft. To increase efficiency of the ornithopter, more power
is required on the down stroke than on the upstroke. If the wing on the ornithopter was not flexible and
flapped at the same angle while moving up and down, it would act like a huge board moving in two dimensions,
not producing lift or thrust. The flexibility and move-ability of the wing let it twist and bend to the
reactions of the ornithopter while in flight.
METHODOLOGY:
Wing construction consists of nylon stretched over a network of carbon fiber spars and fingers. There are two
spars, one at the leading edge and another placed diagonally from the leading edge to the rear of the
fuselage. Each spar is held in place by a Dacron tape pocket to add stiffness and durability. This spar
arrangement creates two regions in the wing, the triangular “luff” region, which is a loose membrane, and the
“flap” region which is kept taught by a series of fingers that run from the diagonal spar to the trailing edge.

Proceedings of the National Conference on
Trends and Advances in Mechanical Engineering
(TAME-2017) March 16-17, 2017 ISBN 978-93-5268-269-0
YMCA University of Science & Technology, Faridabad, Haryana
110
Fig.1: Regions of Wing
Ornithopters, like birds or insects, have a stiff spar at the leading edge of the wing. The rest of the wing is
flexible. The right amount of flexibility allows each part of the wing to stay correctly aligned with the local
airflow at various stages of the wing beat cycle.
RESULTS & DISCUSSIONS:-
For a wing span of around 70cm using formulae for wing beat frequency :
For birds with the body mass ranging from 20g to nearly 5kg the wing beat frequency is correlated by
the following formula:
Where m=1kg, density=1.25kg/m3, g=9.81m/s2, b=1 m, s=0.1m2
f5.5 Hz
With 8x60 rpm of gear connected to crank and reduction of 50:1,
The speed of motor should be = 50x5.5x60 = 16500rpm (max)
Wing span consider during design = 100 cm
Flapping angle as calculated in mechanism design = 62°
Aspect Ratio (b2 / planform area) should lie between 5-7 for high efficiency and good
maneuverability. So assuming A.R=5, planform area is
Leading
edge spar
Diagonal
spar
Taught
region Flap
region

Proceedings of the National Conference on
Trends and Advances in Mechanical Engineering
(TAME-2017) March 16-17, 2017 ISBN 978-93-5268-269-0
YMCA University of Science & Technology, Faridabad, Haryana
111
A=(12/5)=0.2m
So chord length = A/b = 0.128/1 ≈ 0.2m
Conclusion
In order to better understand the control of flapping wing flight, the design and analyze of the large scale
ornithopter is presented. Wing flight theory and design and analysis of mechanical components consisting an
ornithopte is described. Wings should be made up of polycarbonate coated polyester fabric which has got much
more resistance to tear resistance.
References
1. Lin, Che-shu Hwu, Chyanbin Young, Wen-Bin March 2006. “The thrust and lift of an ornithopter’s membrane
wings with simple flapping motion”.
2. Djojodihardjo, Harijono Ramli, Alif Syamim Syazwan and Wiriadidjaja, March 2012. “Kinematic and
aerodynamic modelling of flapping wing ornithopter”.
3. Tsai, Bor-Jang Fu,Yu-Chun Oct-Nov 2009. “Design and aerodynamic analysis of a flapping wing micro-
aerial vehicle”.
4. Zachary John Jackowski. “Design and construction of autonomous ornithopter” BS in Mechanical Engg.,
MASSACHUSETTS INSTITUTE OF TECHNOLOGY (MIT), June 2009.
5. Christopher T. Orlowski ,Anouck R. Girard. “Dynamics, stability, and control analyses of flapping wing micro-
air vehicles”.
6. Nathan Chronister. Ornithopter with independently controlled wings. US Patent 11147044,June7,2005.

Proceedings of the National Conference on
Trends and Advances in Mechanical Engineering
(TAME-2017) March 16-17, 2017 ISBN 978-93-5268-269-0
YMCA University of Science & Technology, Faridabad, Haryana
112
DESIGN OF TILLING SHAFT FOR 7HP POWER TILLER UNDER
THE EFFECT OF FATIGUE LOADING ON SOLIDWORKS 2016
Anshul Ahuja1 and Navdeep Malhotra
2
1 Department of Mechanical Engineering, YMCA University of science and technology, 121006, India.
e-mail: [email protected], [email protected]
Abstract
Power Tiller is equipment used in farming operation to increase the permeability of air and ingredient require
for flourishing for growth crop. As 85% of farmers have less than 2 hectares of land so it is difficult to afford
the tractors and various arrangements for agriculture equipment so for this optimization of power tiller is
necessary for the value improvement and cost reduction. Research is done for identification of those factors
which are essential for the designing of the tilling shaft for power tiller and finding those factors which affect
the performance of power tiller. Design analysis of rotor shaft is done under fatigue loading. Project also
includes the design of tilling blade using the preferred specification and Design of tilling portion is done using
SOLIDWORKS.
Keywords: Tiller, Agriculture, Shaft
1. Introduction Tiller is equipment used for farming which inverts the soil by its blade movements. Tiller helps to increase the
soil and water penetration and help to dig so that root of crop can go deeper. Tilling has been reformed from
animal driven to power tilling. Power tiller which is more frequently known as mini tractor powered based
arrangement used for the aeration of soil. Tiling operation is somehow different from cultivating operation.
Different Tiller is used to prepare a seedbed for the crop to be planted, where as cultivator is used to pick out the
waste from the soil after cutting of crop. Power tilling can be done either by rotary motion or linear motion
Tiller having linear motion cause an impact force on the soil and dig into it as a result an impact stress in
induced that may cause an impact stress tilling blade and enhance the probability of failure from critical portion
of blade. Blade having rotary motion provides a gradual force due to its rotation; as a consequence less stress is
generated on the blade as well as shaft. It was introduced in 1911 at Berlin by the Siemens Company
[2].powered tiller came into existence as a better substitute for the farmer of small land capacity in 20th
century
Power tiller has been so developed that it has market of about 60,000 units in the India which is mainly
concentrated in southern and north eastern region [1].
Fig. 1 A pictorial view of power tiller
Apart from India great market has been developed by Italy and Chinese made power tiller in whole globe [1]
Power tilling operation is more effective because of its simplicity in design and ease in working. From the day
of invention of power tiller many modification and development in this field has been made for ease of farming

Proceedings of the National Conference on
Trends and Advances in Mechanical Engineering
(TAME-2017) March 16-17, 2017 ISBN 978-93-5268-269-0
YMCA University of Science & Technology, Faridabad, Haryana
113
operation. Implementers initially offered the power tiller included rotavator attachments, trailer attachment and
in some cases plough and ridger.
2. Design of shaft Rotor shaft or tilling shaft get the power from the transmission shaft i.e joining gear box and speed reduction
gear attached to tilling shaft. Shaft is subjected to torsional stress because of twisting moment. As the blades are
at inclined position with respect to the ground level so an inclined force is applied on each of the blade and
transferred to the shaft. On resolving these forces a shear force which try to induce shear stress as well as
bending moment and axial force which try to give an axial thrust on either side. To cancel these axial thrust
blades on the each half of shaft is mounted in the opposite direction. So generally shaft is designed for bending
and twisting moment.
2.1 Design calculations
Calculation of the rotor power consumption with drawbar force and machine forward speed method Drawbar
power can be calculated using [3]:
Pdb =𝑣∗𝐷𝑏
3.6 (1)
Db = 𝐷𝑎∗𝑎∗𝑏
1000 (2)
Pdb = 83.055 N (for traction velocity to be20 m/s)
Where Pdb is the drawbar power in kW; V is the forward speed in km/h;
2.2 Tilling Specifications
Table 1 Desired Specification and Constants
C0 Ko,
kg/dm2
a, dm b, dm
ᵑz
ᵑc
U (rpm)
1.5 50 6.5 1 0.75 0.9 350
Db is the drawbar force in kN; a is the working depth in cm; b is the working width in mm;
Da is the average of the rotary tiller specific resistance in kN that is equal with 21 N/cm2 for loam and silty-
clay-loam soils and 23 N/cm2 for clay-loam and clay soils.[3]
Fig.2 Shear Force Acting on Tiller Shaft
21.33cm
25.5 N 25.5 N 398.8 N 398.8 N 398.8 N 25.5 N 398.8 N 25.5 N

Proceedings of the National Conference on
Trends and Advances in Mechanical Engineering
(TAME-2017) March 16-17, 2017 ISBN 978-93-5268-269-0
YMCA University of Science & Technology, Faridabad, Haryana
114
Force acting on the soil Ke
Ke = 𝑘𝑠∗𝑐𝑝
𝑖∗𝑧𝑐∗𝑛𝑒 (3)
For designing the rotor shaft, there must be consideration of maximum tangential stress that is being endured by
the rotor. The maximum tangential force occurs at the minimum of blades tangential speed is calculated by the
following [3]
KS = 𝑐𝑧∗75∗𝑛𝑧∗𝑛𝑐∗𝑁𝑧
𝑈𝑚𝑖𝑛 (4)
Ks = 60.93 kg = 597.79 N
Torque Generated On the Shaft
T = 597.79 * 0.23 m= 134.4 N-m
Force acting on the blade. This force induce a bending force on the shaft
Ke = 398.52 N
Max bending moment will be generated in the mid region of the shaft.
Me =44.65 N-m
So acc to tensile strength EN-36C will be preferred.
Ultimate tensile strength, S*. (Mpa) =1110 MPa
Fig. 3 design of shaft on Solidworks
Also considering the effect of stress concentration

Proceedings of the National Conference on
Trends and Advances in Mechanical Engineering
(TAME-2017) March 16-17, 2017 ISBN 978-93-5268-269-0
YMCA University of Science & Technology, Faridabad, Haryana
115
Allowable strength S (MPa) =370 MPa
Under combined loading max dia will be [4]
d3 =
16
𝑝𝑖∗𝑆𝑝𝑒𝑟(1−𝑘4)√(𝑘𝑏𝑀2 + 𝑘𝑡𝑇2) (5)
Outer dia = 7.86 cm say 8 cm
Inner dia = 4 cm
3. Conclusion Project also includes the design of shaft of rotary tiller in SOLID WORKS. Project work is done for 7HP
gasoline engine and for tilling width of 65 cm and 15 cm tilling depth hollow shaft with 6 cm outer dia and 3 cm
inner dia. Design of existing blade is also done on SOLID WORKS. Assembly of shaft with flange and blade is
done in SOLID WORKS. Future aspects for the project are designing of double drive transmission system.
References 1. “surender sud power tiler are back in business”15.06.16
file:///I:/power%20tiller/Surinder%20Sud_%20Power%20tillers%20are%20back%20in%20business%20_%20B
usiness%20Standard%20Column.pdf“surender sud power tiler are back in business”15.06.16
file:///I:/power%20tiller/Surinder%20Sud_%20Power%20tillers%20are%20back%20in%20business%20_%20B
usiness%20Standard%20Column.pdf
2. https://en.wikipedia.org/wiki/Two-wheel_tractor dated 11/23//2016
3. Rotary Tiller Design Proportional to a Power Tiller using Specific Work Method (SWM) Hemad
Zareiforoush1,*, Mohammad Hasan Komarizadeh1, Mohammad Reza Alizadeh Department of Mechanical
Engineering of Agricultural Machinery, [email protected]
4. “Forms and design analysis of mechanical shafts used in agricultural machineries: A Review” Emmanuel
Adeleke Fagbemi, *, Agbolahan Okeeseni, Baldwin Omonigho, Ebike Iseru, Teddy Akpovwovwo, Emmanuel
Kayode Awolola.
5. P.S Tiwari and A.C Varshney “Power tillers in India - prospects and future role”
6. Gupta, J.P, S.Kumar 2001. Status of Power Tiller Use in Binar A case Study Nalanda District. Agricultural
Mechanization in Asia, Africa and Latin America, 32 (No 1): 19 22.
7. Akdeniz üniversitesi ziraat fakültesi dergisi, 2008, 21(2), 155–160 155 “stress analysis on transmission gears of
a rotary tiller using finite element method mehmet topakcia h. Kursat celik deniz yilmaz ibrahim akinci” akdeniz
university, faculty of agriculture, department of agricultural machinery, antalya, turkey accepted 12 august
2008.
8. The performance of rotary power tiller using prototype rotary blades in dry-land field Sirisak Chertkiattipol *,
Tanya Niyamapa , Wanwisa Jantaradach , and Kridsada Saensuwan ,Department of Agricultural Engineering,
Faculty of Engineering at Khamphaengsaen, Kasetsart University, 73140, Thailand)
9. Rotary Tiller Design Proportional to a Power Tiller using Specific Work Method (SWM) Hemad
Zareiforoush1,*, Mohammad Hasan Komarizadeh1, Mohammad Reza Alizadeh Department of Mechanical
Engineering of Agricultural Machinery, [email protected].

Proceedings of the National Conference on
Trends and Advances in Mechanical Engineering
(TAME-2017) March 16-17, 2017 ISBN 978-93-5268-269-0
YMCA University of Science & Technology, Faridabad, Haryana
116
SUSTAINABLE DESIGN OF COMPOSITE PARABOLIC LEAF
SPRINGS
Krishan Kumar1
& M.L. Aggarwal2
1Asstt. Professor,
2Professor, Department of Mechanical Engineering,
YMCA University of Sc. & Tech., Faridabad-121006, Haryana, India
Abstract
In today’s scenario the automotive sector concentrating towards reliable and light weight vehicles. Primarily
conventional leaf springs are made of steel and contribute in increasing weight of vehicles and secondly
produce noise due to interleaf friction between leaves. Use of composite material leaf springs can handle with
both of the problems because of having light in weight and lesser noise level due to high damping capabilities.
However, the utility of composite leaf springs in automobile sector is limited due to higher cost and lower
stiffness. The paper discusses the design and stiffness aspects of parabolic leaf springs made of composite
materials to be used in automotive vehicles.
Keywords: Conventional leaf springs, composite materials, stiffness
1. Introduction
A spring is a resilient object used to soak up unwanted mechanical energy which is available in the form of
shocks & vibrations. Springs are usually made out of hardened steel called spring steel. Small springs can be
wound from pre-hardened stock, while larger ones are made from annealed steel and hardened after
fabrication.Springs are the vital component of suspension system in automotive vehicles. There are a variety of
different types of leaf springs which are being used by different type or category of vehicles. The advantage of
leaf springs over helical spring is that the spring may be guided along a definite path as it deflects. The leaf
springs act as structural member as well as shocks & vibrations energy absorbing device. One end of leaf spring
is fixed and the other end permits small fluctuations in spring length.Some developments are always necessary
to bring the present level of technology to newer altitudes. This can be achieved by adopting new technologies
for production, modification in designs or replacing the existing materials with the newer ones having better
properties. Therefore parabolic leaf spring was optimized with composite material. The parabolic leaves were
designed with decreasing thickness from centre to both longitudinal edges as shown in figure 1 below.
Figure-1: Parabolic Leaf Spring
The material of leaf springs was replaced from 65Si7 spring steel to composite material to make it lighter
without compromising with strength. A composite material is a combination of two or more basic materials with

Proceedings of the National Conference on
Trends and Advances in Mechanical Engineering
(TAME-2017) March 16-17, 2017 ISBN 978-93-5268-269-0
YMCA University of Science & Technology, Faridabad, Haryana
117
distinct properties to produce a new material with different behavior from the basic materials used. Unlike alloys
the individual material remains distinct in the new material called composite. The formation of composite
requires two essential constituents termed as matrix and reinforcement. The matrix helps to form the environs
and sustaining purpose while reinforcement imparts its specialty in terms of mechanical properties. Usually
individual material can’t fulfill the required properties but composites can be prepared as optimum combination.
Composite materials can be classified normally on the basis of reinforcement used.
Figure-2: Composite Material Manufacturing Process
A brilliant model of composite is glass reinforced plastic (GRP) which can also be termed as Fiberglass because
the reinforcement media used for this is glass strands. These glass strands are of very fine shape and knitted to
form an elastic stuff. This stuff is then put in to a mould of polyester resin termed as matrix which covers the
knitted stuff all around. This polymer coated reinforcement is then passed through a die and heat source
resulting the composite dried out. The whole process is illustrated as shown in above figure 2 with numeric
notations. These notations are glass strands (1), tension roller (2), resin impregnator (3), resin flooded fiber (4),
heat source (5), pull mechanism (6), finished GRP. The procedure may be repeated to allow number of layers of
fiber glass & polymer resin. The final outcome offers a light weight and strong material i.e. composite material.
Improved performance of the products made of composite materials makes them too much popular because of
having tremendous properties. Improved performance of the products made of composite materials makes them
too much popular because of having tremendous properties of composites.
2. Stiffness Analysis
2.1 Spring Steel
According to IS: 1135, the spring steels conforming to 55Si7, 60Si7, 65Si7, 50Cr4V2, 60Cr4V2 having similar
hardenability, toughness and physical properties, are suitable for manufacturing the leaf springs. The selection
of the spring material is based upon the application and section required to attain required load rate. The basic
requirement of leaf spring steel is having sufficient hardenability for selected thickness of leaves for the size
involved to ensure a full martensitic structure throughout the leaf section. In general terms higher alloy content
is mandatory to ensure adequate hardenability. The material used for manufacturing this light commercial
vehicle leaf spring is 65Si7. The chemical composition and mechanical properties of the spring steel are shown
in the table 1 & table 2 respectively. Table-1: Chemical Composition of 65Si7
Element Mn C S Si P
% age (by weight) 0.80 0.65 0.07 1.65 0.02
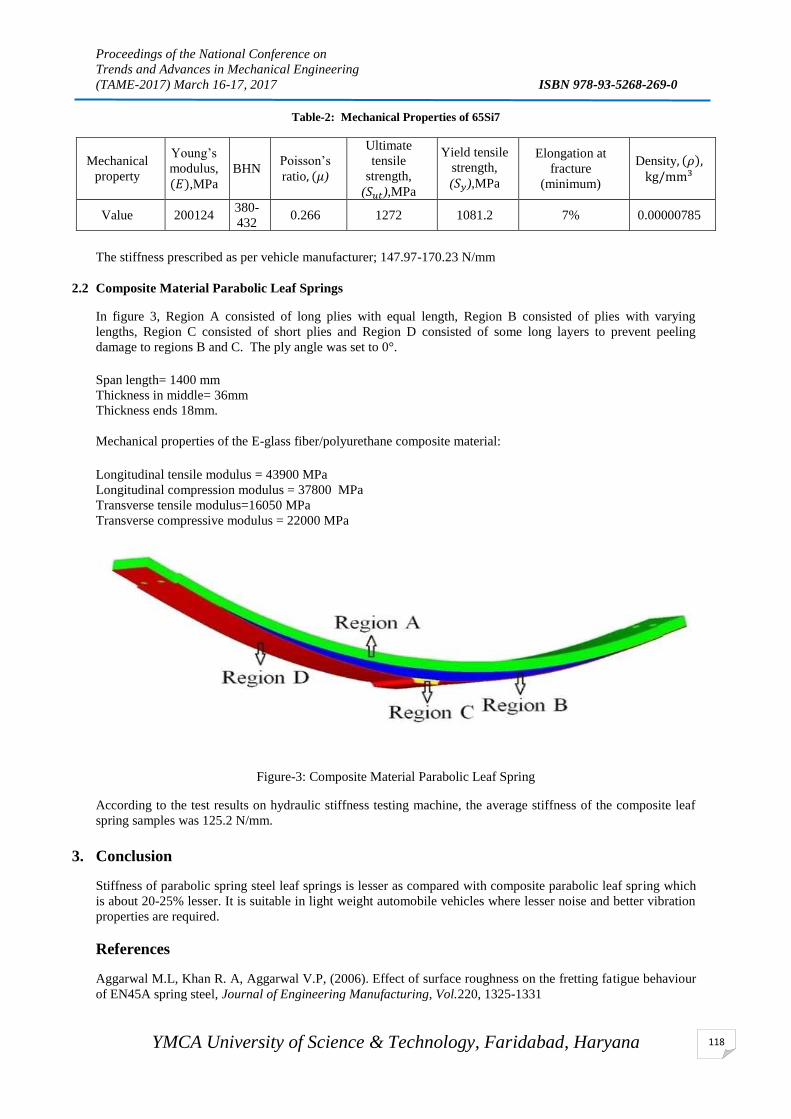
Proceedings of the National Conference on
Trends and Advances in Mechanical Engineering
(TAME-2017) March 16-17, 2017 ISBN 978-93-5268-269-0
YMCA University of Science & Technology, Faridabad, Haryana
118
Table-2: Mechanical Properties of 65Si7
Mechanical
property
Young’s
modulus,
(𝐸),MPa
BHN Poisson’s
ratio, (𝜇)
Ultimate
tensile
strength,
(𝑆𝑢𝑡),MPa
Yield tensile
strength,
(𝑆𝑦),MPa
Elongation at
fracture
(minimum)
Density, (𝜌), kg/mm3
Value 200124 380-
432 0.266 1272 1081.2 7% 0.00000785
The stiffness prescribed as per vehicle manufacturer; 147.97-170.23 N/mm
2.2 Composite Material Parabolic Leaf Springs
In figure 3, Region A consisted of long plies with equal length, Region B consisted of plies with varying
lengths, Region C consisted of short plies and Region D consisted of some long layers to prevent peeling
damage to regions B and C. The ply angle was set to 0°.
Span length= 1400 mm
Thickness in middle= 36mm
Thickness ends 18mm.
Mechanical properties of the E-glass fiber/polyurethane composite material:
Longitudinal tensile modulus = 43900 MPa
Longitudinal compression modulus = 37800 MPa
Transverse tensile modulus=16050 MPa
Transverse compressive modulus = 22000 MPa
Figure-3: Composite Material Parabolic Leaf Spring
According to the test results on hydraulic stiffness testing machine, the average stiffness of the composite leaf
spring samples was 125.2 N/mm.
3. Conclusion
Stiffness of parabolic spring steel leaf springs is lesser as compared with composite parabolic leaf spring which
is about 20-25% lesser. It is suitable in light weight automobile vehicles where lesser noise and better vibration
properties are required.
References
Aggarwal M.L, Khan R. A, Aggarwal V.P, (2006). Effect of surface roughness on the fretting fatigue behaviour
of EN45A spring steel, Journal of Engineering Manufacturing, Vol.220, 1325-1331

Proceedings of the National Conference on
Trends and Advances in Mechanical Engineering
(TAME-2017) March 16-17, 2017 ISBN 978-93-5268-269-0
YMCA University of Science & Technology, Faridabad, Haryana
119
Gulur Siddaramanna Shiva Shankar, Sambagam Vijayarangan, (2006). Mono composite leaf spring for Light
Weight Vehicle – Design, End Joint Analysis and Testing, Materials Science, ISSN 1392–1320, Vol. 12, No. 3,
220-225
Krishan Kumar & M.L. Aggarwal (2015) “Finite element analysis and optimization of a mono parabolic leaf
spring using CAE software”, Engineering Solid Mechanics: An International Journal, Vol 3, Issue 2, pp: 85-92
Krishan Kumar & M.L. Aggarwal (2015) “Simulation for optimized modeling of EN45A leaf spring”,
International Journal of Recent advances in Mechanical Engineering, Vol.4, No.3, pp: 129-142
Liu, H., Yu, H., Jiang, W. Li, X. Fan, S. Lei, B. Chen, (2016). “An accelerometer with integrative intensity-
modulated optical encoder and patterned leaf spring for low-frequency vibration monitoring”, Sensors and
Actuators, http://doi.org/10.1016/j.sna.2016.06.026
Liu, X., Chadda, Y. (1993). Automated optimal design of a leaf spring. SAE Technical Paper 933044,
http://doi.org/10.4271/933044
Malikoutsakis, M., Savaidis, G., Savaidis, A., Ertelt, C., & Schwaiger, F. (2016) “Design, analysis and multi-
disciplinary optimization of high-performance front leaf springs”, Theoretical and Applied Fracture Mechanics,
Vol. 83, pp; 42–50.
M. M. Patunkar, D. R. Dolas, (2011). Modelling and analysis of composite leaf spring under the static load
condition by using FEA, International Journal of Mechanical & Industrial Engineering, Volume 1(1), 1-4
W. J. Yu & H. C. Kim, (1988). Double tapered FRP beam for automotive suspension leaf spring,Composite
Structures, Vol. 9, 279-300
Proceedings of the National Conference on
Trends and Advances in Mechanical Engineering
(TAME-2017) March 16-17, 2017 ISBN 978-93-5268-269-0
YMCA University of Science & Technology, Faridabad, Haryana
120
DESIGN AND FABRICATION OF AN ALL-WHEEL DRIVE SYSTEM
IN AN ATV
Anshul Panchal, Karan Arora, Nitin Sharma
Department of Mechanical Engineering, YMCAUST, Faridabad
Abstract
The aim of this project is to install an All-Wheel Drive (AWD) system to be fitted in the ATV built by Team
Mechnext Racing of YMCA UST, Faridabad for competing in Mega-ATV Championship. The car is an open
wheeled All-Terrain Vehicle, capable of enduring the rough terrain. All Wheel Drive system was designed and
installed in the vehicle to achieve greater torque on the wheels when required and have even better enduring
capacity in rough areas.
Keywords: All Wheel Drive, ATV, driveline, transfer case
Introduction
The purpose of installing an AWD system is to provide higher torque on wheels and achieve maximum forward
traction. This is done by feeding power to all four wheels of the vehicle, instead of two. An AWD system may
be of two types - full time and on-demand. In full time AWD system both axles are permanently connected to
drive line. While an On-demand or selectable AWD system provides an option to feed power to two wheels or
four wheels as per requirement.
The goal was to build an on-demand all-wheel drive system for the ATV designed and fabricated by the team.
Method of Research
A. Study of AWD equipped in commercial vehicles
Before designing AWD for our ATV, the commercially available vehicles having an all-wheel drive system
were studied and different components of an AWD drive line were considered. The main components of a
commercial AWD system are the two differentials (front and rear) and the transfer case. In addition, part time
systems have locking hubs.
Path travelled by different wheels while cornering
When a car goes around a turn, the inside wheels follow a different path than the outside wheels, and the front
wheels follow a different path than therear wheels, so each of the wheels is spinning at a different speed. The
differentials enable the speed difference between the inside and outside wheels. In all-wheel drive, the speed

Proceedings of the National Conference on
Trends and Advances in Mechanical Engineering
(TAME-2017) March 16-17, 2017 ISBN 978-93-5268-269-0
YMCA University of Science & Technology, Faridabad, Haryana
121
difference between the front and rear wheels is handled by the transfer case. When four-wheel drive is not
engaged, the locking hubs are used to disconnect the front wheels from thefront differential, half-shafts and
propeller shaft.
A Commercial All Wheel Drive system
B. Deciding basic components for our AWD system
In a commercial vehicle the speed difference between front and rear wheels and shifting between 2-wheel drive
and 4-wheel drive is done using a transfer case. But keeping in mind the budget, addition in weight, and the
space constraints, the transfer case is not used. Instead the division of power is done using a bevel gear assembly
incorporated in a custom made gear box. The input shaft of custom gear box is connected to the input shaft of
main gear box using a set of timing gears and belt. The output shaft of the custom gear box is connected to the
propeller shaft using a dog clutch. This dog clutch is also used for shifting between 2-wheel drive and 4-wheel
drive. The propeller shaft is further connected to another differential at the front, which allowed speed
difference in front wheels. Due to space restrictions, the front differential could not be placed between the wheel
centers. Thus the front half-shafts could not connect to the wheels maintaining proper angle. So each half-shaft
is made in two parts. The shaft from differential and the front axle is to be joined using chain drive.
C. Designing each component of the system
i. Belt drive and bevel gear assembly
Considering the track of the competition where the ATV has to perform, it will face frequent turns and very less
straight paths. So the designing to have a constant ratio of front axle rpm and rear axle rpm. With little
calculation taking minimum turning radius to be 12 feet (competition rule), the ratio is assumed to be
ɷfront/ɷrear= 1.5/1 ... (i)
Gear reduction from engine to rear axle is done using Mahindra Alfa gear box. We designed the AWD system to
work with the above speed ratio when the main gear box has 2nd
gear engaged.
For Mahindra Alfa gear box, gear ratio in 2nd
gear is 2.733:1. So the gear ratio for rear axle under design
condition is
ɷrear/ɷinput= 1 : 2.733 ...(ii)
From equation (i) & (ii)..

Proceedings of the National Conference on
Trends and Advances in Mechanical Engineering
(TAME-2017) March 16-17, 2017 ISBN 978-93-5268-269-0
YMCA University of Science & Technology, Faridabad, Haryana
122
ɷfront/ɷinput = 1.5 : 2.733 Or
ɷfront/ɷinput = 1 : 1.822 …(iii)
Timing gear and belt assembly
This gear reduction is done in two steps - first by using Maruti 800 timing gear and belt which has a reduction
ratio of 1 : 2, and then through a set of bevel gears whose gear ratio is calculated to be 0.911 : 1.
To achieve this ratio two bevel gears are designed having 19 and 17 teeth respectively. Due to quantized number
of teeth the calculated ratio of 0.911 : 1 is not achieved. The actual ratio is 0.895 : 1.
Hence practically obtained overall ratio is
ɷfront/ɷinput = 1.789 : 1 And
ɷfront/ɷrear= 1.52 : 1
Bevel Gearbox
The bevel gear assembly is housed in a custom made gearbox. The output of this gearbox is connected to the
propeller shaft.
ii. Propeller shaft and gear shifter
The output shaft is connected to the propeller shaft through a dog clutch, which allows shifting between 2-wheel
drive and 4-wheel drive.
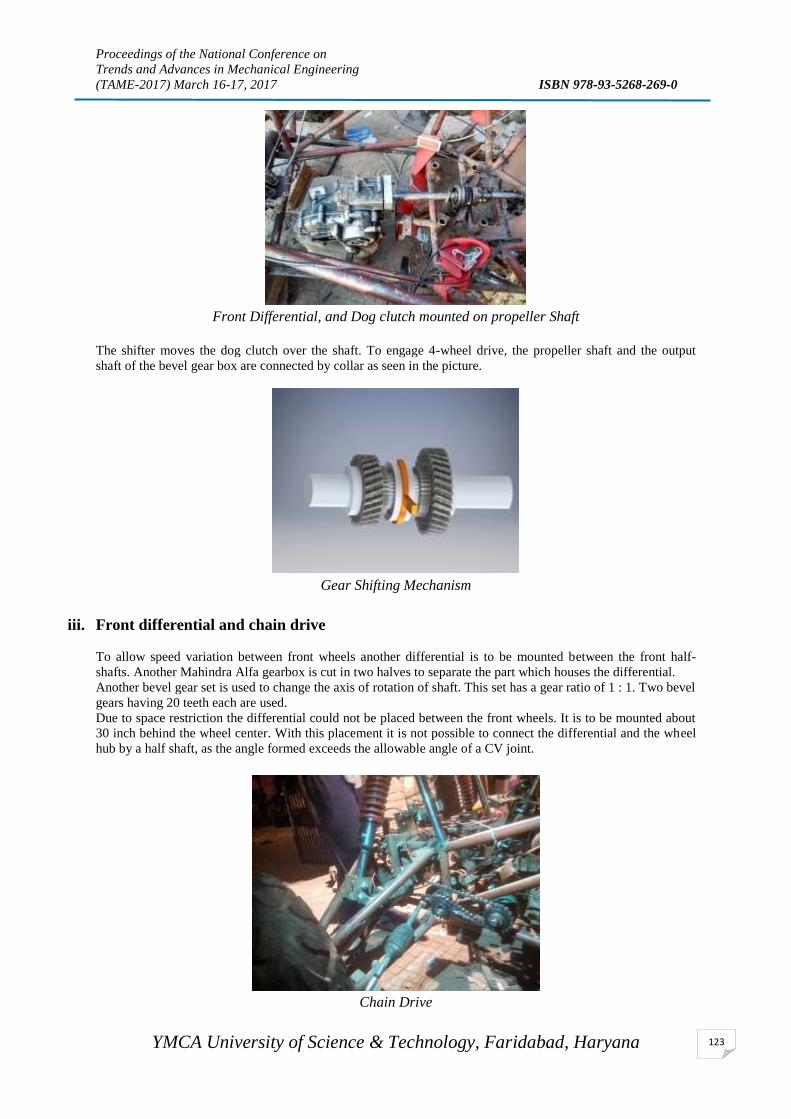
Proceedings of the National Conference on
Trends and Advances in Mechanical Engineering
(TAME-2017) March 16-17, 2017 ISBN 978-93-5268-269-0
YMCA University of Science & Technology, Faridabad, Haryana
123
Front Differential, and Dog clutch mounted on propeller Shaft
The shifter moves the dog clutch over the shaft. To engage 4-wheel drive, the propeller shaft and the output
shaft of the bevel gear box are connected by collar as seen in the picture.
Gear Shifting Mechanism
iii. Front differential and chain drive
To allow speed variation between front wheels another differential is to be mounted between the front half-
shafts. Another Mahindra Alfa gearbox is cut in two halves to separate the part which houses the differential.
Another bevel gear set is used to change the axis of rotation of shaft. This set has a gear ratio of 1 : 1. Two bevel
gears having 20 teeth each are used.
Due to space restriction the differential could not be placed between the front wheels. It is to be mounted about
30 inch behind the wheel center. With this placement it is not possible to connect the differential and the wheel
hub by a half shaft, as the angle formed exceeds the allowable angle of a CV joint.
Chain Drive

Proceedings of the National Conference on
Trends and Advances in Mechanical Engineering
(TAME-2017) March 16-17, 2017 ISBN 978-93-5268-269-0
YMCA University of Science & Technology, Faridabad, Haryana
124
So to connect the differential with wheel hub and transmit power, a chain drive is used on either side. On each
side, one sprocket is mounted on the shaft coming out of differential, and another sprocket on the drive axle, and
they are joined by a bicycle chain.
Conclusion
The goal was to achieve greater torque on the wheels by feeding power to all the four wheels. Providing power
to four wheels increased traction and would have helped in performing better in off-road conditions. After
installing this system the ATV performed better in test runs. Using this system caused the overall weight of the
ATV to increase from 250 Kg to about 272 Kg. AWD was not a part of the initial design. Due to this we might
have faced some problems related to ergonomics of driver. Beside that we would have to make casing for each
rotating part of the driveline. It could have caused us problems during the event. So we decided to not use it in
the event, and removed the complete system just before the event.
We will try to incorporate AWD system in our design in upcoming competitions as per our desired requirement
for that particular event.
References
1. Race Car Vehicle Dynamics : Milliken and Milliken
2. Automobile Engineering : Dr. Kripal Singh
3. https://en.wikipedia.org/wiki/Four-wheel_drive : Wikipedia
4. auto.howstuffworks.com/four-wheel-drive.htm : How Stuff Works
Proceedings of the National Conference on
Trends and Advances in Mechanical Engineering
(TAME-2017) March 16-17, 2017 ISBN 978-93-5268-269-0
YMCA University of Science & Technology, Faridabad, Haryana
125
DESIGN OF MEASURING INSTRUMENT FOR EXCAVATOR
BUCKET TOOTH
Sahil1, Rajeev Saha
2, Sanjeev Kumar
3
1M.Tech. Student,
2Asstt. Professor,
3Assoc. Professor, Department of Mechanical Engineering,
YMCA University of Sc. & Tech., Faridabad-121006, Haryana, India
Email: [email protected]
Abstract
An excavator is a heavy duty earthmoving machine used in mining work; construction etc. Excavator bucket
tooth is one of the major parts of the machine which firstly comes in contact with the ground. Poor design of
excavator teeth results in poor excavation and hazardous for the operator. A good design is meaningless
without the use of good measuring instruments. This paper concentrates on the design of measuring instrument
for accurate measuring of dimensions of excavator tooth. The purpose of this instrument is to reduce the time
and error of measurement.
Keywords: Excavator, Tooth, Measurement
Introduction
An excavator is a heavy duty earthmoving machine used in mining, construction, for foundation, digging holes,
trenches and other things. Excavator machine has to work under unpredictable conditions therefore all the parts
of excavator must be strong enough and reliable in these conditions. Excavator tooth is one of the major part of
excavator which firstly comes in contact with the ground. For the proper working of excavator the dimensions
of tooth should be accurate and within the tolerance limit. Design and measurement both have their own
importance.
Many researchers had done eminent work in designing and optimizing the excavator bucket tooth. Some of the
work is explained in this section. Singla.S et al. (2015) studied the relative abrasive wear behavior of
commercially available hard facing alloys for excavator bucket tooth. Dagwar kalpak..S, Telrandhe.R.G (2015)
discussed the failure of bucket tooth due to abrasive wear and impact loading. Singla.S et al. (2011) suggested
four different type of hard facing material using manual metal arc welding process to protect the excavator
bucket tooth against abrasive wear. Farnandez et al. (2001) discussed the material selection in mining industry
for excavation from that it is found that alloys on basis of vanadium, boron, chromium and niobium have low
wear ratio. Khan Sabah, Mahashin Shikh (2016) compared the wear analysis of excavator bucket tooth using
different material.
From the above discussion it is found that a lot of work had done in designing and wear analysis of the
excavator bucket tooth but no work had done related to the measurement of excavator bucket tooth.
Case study
Present study was conducted in ABC industry situated in Faridabad. Company was established in 1960 for
production of various kind of gear blank, tool kits, automotive parts etc. company also produce a wide variety
of products for other companies.
Excavator bucket tooth is one of the components produce by the company. It is one of the major parts of
excavator machine. Efficiency and effectiveness of excavator machine is mainly depends on excavator tooth.
Process flow diagram of excavator tooth In this section, the various processes involved in manufacturing of various types of components through a
common process flow chart are explained. Manufacturing processes for different components are same but the
difference is type of heat treatment, so this can be described through a common process flow chart.

Proceedings of the National Conference on
Trends and Advances in Mechanical Engineering
(TAME-2017) March 16-17, 2017 ISBN 978-93-5268-269-0
YMCA University of Science & Technology, Faridabad, Haryana
126
Raw material
Inspection
Rejection
Billet cutting
Upsetting
Inspection
Rejection
Press forging
Heat treatment
Shot blasting
Inspection
Profile cutting
Hardening
Drilling
Hexa cutting
Rejection

Proceedings of the National Conference on
Trends and Advances in Mechanical Engineering
(TAME-2017) March 16-17, 2017 ISBN 978-93-5268-269-0
YMCA University of Science & Technology, Faridabad, Haryana
127
Problem identification During the investigation that done within the industry, the main problem was find out that the centre distance
between the two holes of bucket tooth was undersized. Due to which fitting problem of tooth with the bucket
arises. The cause and effect of the problem was studied with the help of fishbone diagram. Another problem was
that all the dimensions have to be check separately by the operator which was very time consuming and error
prone.
Use of fishbone diagram
Figure 7 Fishbone diagram
Figure 6 Process flow chart
Grinding
Gauging
Shotblasting
Painting
Packaging
Inspection
Dispatch
Rejection
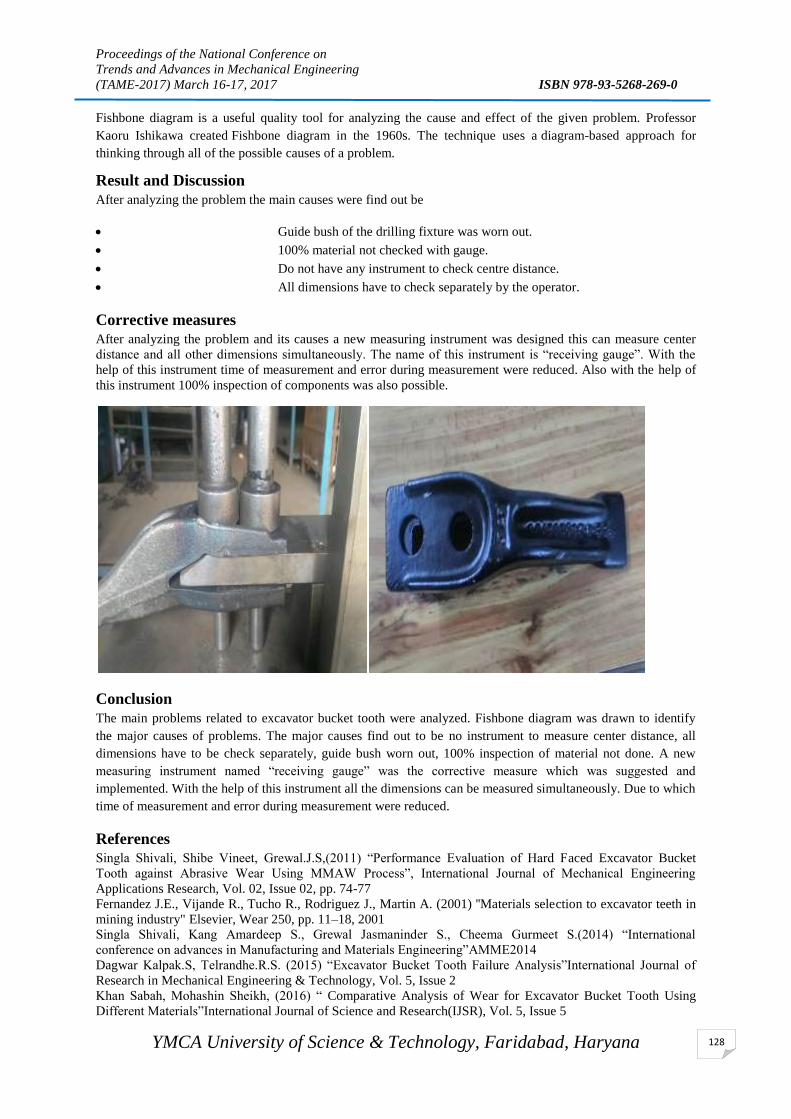
Proceedings of the National Conference on
Trends and Advances in Mechanical Engineering
(TAME-2017) March 16-17, 2017 ISBN 978-93-5268-269-0
YMCA University of Science & Technology, Faridabad, Haryana
128
Fishbone diagram is a useful quality tool for analyzing the cause and effect of the given problem. Professor
Kaoru Ishikawa created Fishbone diagram in the 1960s. The technique uses a diagram-based approach for
thinking through all of the possible causes of a problem.
Result and Discussion
After analyzing the problem the main causes were find out be
Guide bush of the drilling fixture was worn out.
100% material not checked with gauge.
Do not have any instrument to check centre distance.
All dimensions have to check separately by the operator.
Corrective measures
After analyzing the problem and its causes a new measuring instrument was designed this can measure center
distance and all other dimensions simultaneously. The name of this instrument is “receiving gauge”. With the
help of this instrument time of measurement and error during measurement were reduced. Also with the help of
this instrument 100% inspection of components was also possible.
Conclusion
The main problems related to excavator bucket tooth were analyzed. Fishbone diagram was drawn to identify
the major causes of problems. The major causes find out to be no instrument to measure center distance, all
dimensions have to be check separately, guide bush worn out, 100% inspection of material not done. A new
measuring instrument named “receiving gauge” was the corrective measure which was suggested and
implemented. With the help of this instrument all the dimensions can be measured simultaneously. Due to which
time of measurement and error during measurement were reduced.
References
Singla Shivali, Shibe Vineet, Grewal.J.S,(2011) “Performance Evaluation of Hard Faced Excavator Bucket
Tooth against Abrasive Wear Using MMAW Process”, International Journal of Mechanical Engineering
Applications Research, Vol. 02, Issue 02, pp. 74-77
Fernandez J.E., Vijande R., Tucho R., Rodriguez J., Martin A. (2001) ''Materials selection to excavator teeth in
mining industry" Elsevier, Wear 250, pp. 11–18, 2001
Singla Shivali, Kang Amardeep S., Grewal Jasmaninder S., Cheema Gurmeet S.(2014) “International
conference on advances in Manufacturing and Materials Engineering”AMME2014
Dagwar Kalpak.S, Telrandhe.R.S. (2015) “Excavator Bucket Tooth Failure Analysis”International Journal of
Research in Mechanical Engineering & Technology, Vol. 5, Issue 2
Khan Sabah, Mohashin Sheikh, (2016) “ Comparative Analysis of Wear for Excavator Bucket Tooth Using
Different Materials”International Journal of Science and Research(IJSR), Vol. 5, Issue 5

Proceedings of the National Conference on
Trends and Advances in Mechanical Engineering
(TAME-2017) March 16-17, 2017 ISBN 978-93-5268-269-0
YMCA University of Science & Technology, Faridabad, Haryana
129
ERGONOMICS OF MOBILITY SCOOTER: AN OVERVIEW
Abhay Sharma & Sahil Chugh
UG Student
ME Department
Amity University, Uttar Pradesh, Noida
Abstract
This research is not about designing new products, it's about researching and studying all the factors that are
considered while designing a product according to consumers need. Factors such as body proportions, body
dimensions, and sitting postures have to be considered while designing the new product, in our case mobility
scooter. This research also includes exploring and studying existing designs of mobility scooters, this includes
studying their shape, dimensions, key elements and many more things. Ergonomics in itself is a deep subject
and it requires a lot of homework before you start designing the product according to its requirement. Factors
such as psychology, physical and organizational factors have been kept in mind while exploring the possibilities
of the mobility scooter. A key element of ergonomics, the material selection have been kept into consideration in
my research. Material properties, their availability and their current usage have been studied as well to widen
our horizon of knowledge. With the help of this research, people would get to know what ergonomics really
mean in real means when you design a new product.
Keywords: Mobility; Ergonomics; Selection
1. INTRODUCTION
A mobility scooter has a seat over three, four or now five wheels, a flat area or foot plates for the feet, and
handlebars or a delta-style steering arrangement in front to turn one, two or three steerable wheels. The seat may
swivel to allow access when the front is blocked by the handlebars. Mobility scooters are
usually battery powered. A battery or two is stored on board the scooter and is charged via an onboard or
separate battery charger unit from standard electric power. A major selling point of mobility scooters for many
users is that they do not look like a wheelchair, disability still being seen by many as shameful. Mobility
scooters are in general more affordable than powered wheelchairs, leading to them being procured as a cheaper
alternative.
Importance of Ergonomics:
Ergonomics involves the scientific application of human data when designing the working environment. The
purpose of work place ergonomics is to increase the comfort, safety and efficiency of workers by fitting the
environment to them not the other way around. Adapt utilize their professional training and experience to
specialize in ergonomic design for the workplace, giving consideration to both the individual worker and the
company as a whole.
Ergonomics in mobility scooter:
Just like any other product. Ergonomics is equally important while designing mobility scooter. Aim is to design
the shape and the features in order to meet the demand of consumers. Every key element, seat height, handle
height, angles and dimensions have to be kept in mind while developing the model.
All the factors that make up the elements of ergonomics are essential in determining the experience that the
consumer will have while consuming that product.
2. CONDUCTING RESEARCH
Studying the existing products:
In order to know more about the point of view of existing designers of mobility scooter I explored thought the
existing products that relate to what I am doing

Proceedings of the National Conference on
Trends and Advances in Mechanical Engineering
(TAME-2017) March 16-17, 2017 ISBN 978-93-5268-269-0
YMCA University of Science & Technology, Faridabad, Haryana
130
Studying BODY proportions:
While there is significant variation in anatomical proportions between people, there are many references to body
proportions that are intended to be canonical, either in art, measurement, or medicine.
In measurement, body proportions are often used to relate two or more measurements
based on the body. A cubit, for instance, is supposed to be six palms. A span is taken to
be 9 inches and was previously considered as half a cubit. While convenient, these ratios
may not reflect the physiognomic variation of the individuals using them.
The basic body parts that I will study are.
Hand size
Arm span
Sitting posture
Shoulder length
Arm span:
The average human arm span of a woman is 5 feet 4 inches and the average arm span of a man is 5 feet 9
inches. In typical humans, the arm span is almost equal to the height; that is why, the average arm span is also
roughly the same as the average height, with males generally having longer arm spans compare to females.
Body proportions play very important role in ergonomics:
The average dimension of the body part can be calculated using the average height of the people. The graph on
right, is plotted keeping height on the X-axis and the No; of people on the Y-axis.

Proceedings of the National Conference on
Trends and Advances in Mechanical Engineering
(TAME-2017) March 16-17, 2017 ISBN 978-93-5268-269-0
YMCA University of Science & Technology, Faridabad, Haryana
131
Seat design: The seats in any vehicle are one of the primary focal points of OEM design studios because seats determine the
position of the occupants relative to everything else. Seating ergonomics and occupant anthropometrics with
work places or domestic spaces , where people spend extended periods of time sitting.
Seats are designed to withstand thousands of hours of durability, safety and performance, testing to ensure the
seat is meeting a high degree of comfort , craftsmanship, safety and legal compliance for the long-term; not the
short-term usage.
Arm rest
Lumber support
Thigh support
Side support
Upholstery
Arm rest: In an automotive context, an armrest (or arm rest) is a feature found in many
modern vehicles on which occupants can rest their arms. Armrests are also
found on chairs in general.
Lumber support: Lumbar support is the process of providing adequate support to the muscles and skeletal structure of the lower
back. In many instances, the focus of the support is on providing adequate support for the lower back while the
individual is in a seated position. However, there are other devices that may lend support to the back while an
individual is standing or walking. A lumbar support cushion is especially important for anyone who sits for long
periods of time on a regular basis. With the exception of those involved in physical labor jobs, this means
virtually everyone.
Upholstery: Selecting the correct material is one of the seat is one of the most important factor to concede. Mobility scooter
has to be used in outdoor and has to be comfortable too, that is the reason why mostly leather is used.
Durability. Leather is an extremely durable material, especially if it is of high quality.
Timelessness. Speaking of durability, we also need to speak about the timeless fabric leather is. Leather goods
are always in style and are the mark of a person who is steady and who values strong foundations.
Style. Leather is a very elegant material. In its natural color or dyed, leather will always add a certain degree of
quality to any design.
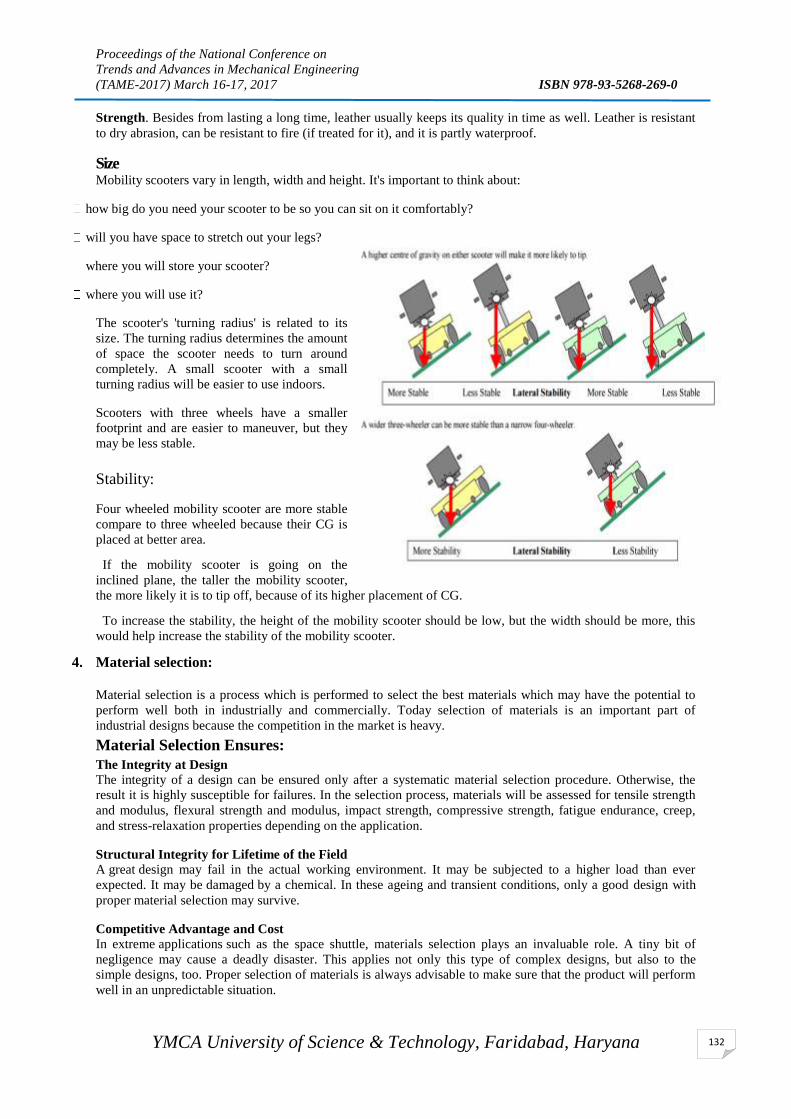
Proceedings of the National Conference on
Trends and Advances in Mechanical Engineering
(TAME-2017) March 16-17, 2017 ISBN 978-93-5268-269-0
YMCA University of Science & Technology, Faridabad, Haryana
132
Strength. Besides from lasting a long time, leather usually keeps its quality in time as well. Leather is resistant
to dry abrasion, can be resistant to fire (if treated for it), and it is partly waterproof.
Size Mobility scooters vary in length, width and height. It's important to think about:
how big do you need your scooter to be so you can sit on it comfortably?
will you have space to stretch out your legs?
where you will store your scooter?
where you will use it?
The scooter's 'turning radius' is related to its
size. The turning radius determines the amount
of space the scooter needs to turn around
completely. A small scooter with a small
turning radius will be easier to use indoors.
Scooters with three wheels have a smaller
footprint and are easier to maneuver, but they
may be less stable.
Stability:
Four wheeled mobility scooter are more stable
compare to three wheeled because their CG is
placed at better area.
If the mobility scooter is going on the
inclined plane, the taller the mobility scooter,
the more likely it is to tip off, because of its higher placement of CG.
To increase the stability, the height of the mobility scooter should be low, but the width should be more, this
would help increase the stability of the mobility scooter.
4. Material selection:
Material selection is a process which is performed to select the best materials which may have the potential to
perform well both in industrially and commercially. Today selection of materials is an important part of
industrial designs because the competition in the market is heavy.
Material Selection Ensures:
The Integrity at Design
The integrity of a design can be ensured only after a systematic material selection procedure. Otherwise, the
result it is highly susceptible for failures. In the selection process, materials will be assessed for tensile strength
and modulus, flexural strength and modulus, impact strength, compressive strength, fatigue endurance, creep,
and stress-relaxation properties depending on the application.
Structural Integrity for Lifetime of the Field
A great design may fail in the actual working environment. It may be subjected to a higher load than ever
expected. It may be damaged by a chemical. In these ageing and transient conditions, only a good design with
proper material selection may survive.
Competitive Advantage and Cost
In extreme applications such as the space shuttle, materials selection plays an invaluable role. A tiny bit of
negligence may cause a deadly disaster. This applies not only this type of complex designs, but also to the
simple designs, too. Proper selection of materials is always advisable to make sure that the product will perform
well in an unpredictable situation.

Proceedings of the National Conference on
Trends and Advances in Mechanical Engineering
(TAME-2017) March 16-17, 2017 ISBN 978-93-5268-269-0
YMCA University of Science & Technology, Faridabad, Haryana
133
Design Flexibility
One of significant importance of material selection is the fact that it provides the designer a greater flexibility to
his design process. He may design several alternative designs and processes and the best performing material
can be evaluated by proper material selection procedures.
Material used for chassis:
After looking at the properties of different metals, I concluded that aluminum would be the best option for
construction of the chassis of the mobility scooter. The use of aluminum metal is the common denominator for
all Sapa’s businesses. Around 8% of the Earth’s crust consists of aluminum in the form of
different minerals. So aluminum is one of the few metals for which the availability of raw
materials is literally unlimited.
Aluminum - the properties
Material properties such as light weight combined with high strength and resistance to
corrosion contribute to low environmental loading. After iron, aluminum is now the second
most widely used metal in the world.
This is because aluminum has a unique combination of attractive properties:
• Low weight
• High strength
• Superior malleability
• Easy machining
• Excellent corrosion resistance
• Easy to mill, drill, cut, punch, bend, weld, bond, tape..
Material used for Body panel:
Body panel is just used to cover up the chassis and make
the final product look more esthetically pleasing. Polyester
resin would be used to make body panel. With its lower
fusing temperature and superior dispersion properties
Polyester resins and its derivate can offer high-speed
printing and improved color application.
If you compare polyester -based products with styrene
acrylate or styrene butadiene derivates resin you will also
find lower energy need for the fusing which contributes to
more environmentally friendly products. In addition, Polyester-based products also offers a better Health &
Safety alternative in order to avoid residual styrene and benzene.
4. Additional features to increase productivity:
The productive of the product is not only increase by choosing the correct material or by the making the design
and dimensions in proportions, productivity is also increased by providing additional features such as: cup
holder, basket, headlights, sunglass holder, e.t.c.
Cup Holder/ bottle holder : You may simply look at the cup holders in your car or another area as something that is not really a necessity.
But if you think about it, cup holders are much more important than that. For many people, they offer tons of
benefits day in and day out. Although you may never use the cup holders that are right in front of you that does
not mean that they do not have any benefits.
Basket: A bicycle basket carries is for carrying, usually light, cargo on a bicycle. They are usually used for light shopping duties
such as going on daily visits to the shops for fresh bread or milk. Baskets are often mounted on the handlebars and made of

Proceedings of the National Conference on
Trends and Advances in Mechanical Engineering
(TAME-2017) March 16-17, 2017 ISBN 978-93-5268-269-0
YMCA University of Science & Technology, Faridabad, Haryana
134
traditional basket weaving materials such as wicker and cane or even woven plastic that merely looks like wicker or cane.
They can also be made of other materials such as metal mesh.
Lights, Head light and backlight: Scooter lighting is illumination attached to bicycles whose purpose above all is, along with reflectors, to
improve the visibility of the scooter and its rider to other road users under circumstances of poor ambient
illumination. A secondary purpose is to illuminate reflective materials such as cat's eyes and traffic signs. A
third purpose may be to illuminate the roadway so that the rider can see the way ahead. Serving the latter
purposes require much more luminous flux and thus more power.
5. Outcomes from this research:
Mechanical structure and ergonomics play equally important role in developing new product and creating new
design ideas. While conducting this research I came across all the factors that come under ergonomic.
Before starting my research my perception towards the concept of ergonomics was narrow but gradually as I
moved on and researched more about its core elements and factors, I realized the vastness and the potential
scope of this subject of ergonomics. Every factor stated in this research has to be considered equally to get the
best experience out of the mobility scooter.
The design of the mobility is not only limited to its looks and its dimensions and materials, it is much more
than that. Additional features such as cup holder and light can increase the productivity of the product more than
once can imagine. The combination of such type of additional feature and minute corrections and improvements,
when combined together it will create a big positive impact on the type of experience that the consumer will
have.
References:
Steinfeld E, Paquet V, Feathers D. Space requirements for wheeled mobility devices, In: Proceedings of the
Human Factors and Ergonomics Society 48th Annual Meeting; 2004. Buffalo, NY: IDeA Centre. pp 1121–
1125.
Steinfeld E, Paquet V. Space requirements for wheeled mobility: an international
workshop. Washington, DC; 2004.
Ministry of Municipal Affairs and Housing Building and Development Branch. 2006
Building Code Compendium. Toronto, Ontario: Queen’s Printer for Ontario; IDeA
Center, 2008.
Seeger B, Costi J, Hartridge M. Final report of consultancy on wheelchair user
requirements for the National Accessible Transport Committee Commonwealth
Department of Transport. Kilkenny, South Australia: Regency Park Centre for Young Disabled; 1994.
Stait R, Stone J, Savill T. A survey of occupied wheelchairs to determine their overall dimensions and weight:
1999 survey. Berkshire, UK: TRL Limited; 2000.
Hitchcock D, Hussey M, Bruchill S, Galley M. Survey of occupied wheelchairs and scooters: conducted in
2005. Leicestershire, UK: Centre for Employment and Disadvantage Studies; 2006.
Ringaert L, Rapson D, Qui J, Cooper J, Shwedyk E. Determination of new dimensions for universal design
codes and standards with consideration of powered wheelchair and scooter users. Winnipeg, Manitoba:
Universal Design Institute; 2001
Proceedings of the National Conference on
Trends and Advances in Mechanical Engineering
(TAME-2017) March 16-17, 2017 ISBN 978-93-5268-269-0
YMCA University of Science & Technology, Faridabad, Haryana
135
TRIBOLOGICAL APPLICATIONS OF
ELECTRORHEOLOGICAL FLUID-A REVIEW
Parveen Kumar1, Suresh Verma
2 and Vijay Jadon
3
1 Research Scholar, Department of Mechanical Engineering, DCRUST Murthal, 131039, India.
2 Faculty, Department of Mechanical Engineering, DCRUST Murthal, 131039, India.
3 Faculty, Department of Mechanical Engineering, Chandigarh University, 131039, India.
Phone: 9654203789, E-mail: [email protected]
Abstract
Electrorheology is the phenomenon in which rheology of fluid is modified by application of electric field. When
an electric field is applied, the fluid undergoes a seemingly reversible transition to a solid in milliseconds, being
able to support considerable stress under static load without yield. In this type of fluid, fluidity is controlled by
phase transition of semiconducting and polarisable particles with the help of electricity provided. Due to the
electromechanical interface, Electrorheological (ER) fluid can be used for controlling the mechanical devices
by altering their rheological characteristics upon application of electric field. Various attractive features like
fast response, simple interface between electrical power input and mechanical power output, precise
controllability make ER fluid more attractive for various applications like seismic vibration dampers, advance
polishing technology, drug delivery and many more. This review paper is divided in the form of applications of
Electrorheological fluid .
Keywords: Electrorheological fluid, Tribological Applications
1. Introduction
Rheology is the study of the flow of matter: mainly liquids but also soft solids or a solid under conditions in
which they flow rather than deform elastically and it is the one of the most frequently used techniques in order
to characterize heterogeneous systems, particularly suspensions and emulsions. Although first called
"Electroviscous" fluids by Winslow, "Electrorheological" fluids soon replaced the previous name. This is
because while the apparent viscosity of these fluids does increase dramatically with the application of an electric
field, "Electrorheological" better describes the changes in viscoelastic properties of these fluids under
deformation.In simple terms it is linked not only with the viscosity variation but also with the origination and
increase of the liquid plasticity. Thus, the term "Electrorheological" was introduced. Electrorheological fluids
can be used as electric -mechanical interface. When sensors are used for the activation of many ER
(Electrorheological) operated mechanical devices , these devices may capable of responding to environmental
change .Hence ER fluids are sometimes referred as smart fluids. Main difference between these field responsive
fluids and the traditional “smart” materials is the fact that they are soft materials (dispersions or gels) rather than
solids, which makes them usable in other types of applications .
Electrorheological devices are better than mechanical and electromechanical systems in terms of response,
working life, output characteristics (strength, frequency), energy consumption etc. Electrorheological Fluid is
type of hydraulic semiconductor comprising polarisable particles suspended in carrier fluid. Phenomenon of ER
has potential in variety of light and heavy machinery and devices [1]. So, a fluid which have solid –liquid phase
transformation on application of electric voltage can replace more mechanical mechanism .Slurries can be
protected against sedimentation using ER effect [2] .Voltage required are also high since field strength of
several KV/mm are needed and these have to be achieved over appropriate electric gaps. What is appropriate
gap is often determined by flow requirements of device (Valve, Damper, and Clutch) in its non activated state.
Some application requires much less fluid flow in off state and narrower inter electrode spacing become
possible.
Proceedings of the National Conference on
Trends and Advances in Mechanical Engineering
(TAME-2017) March 16-17, 2017 ISBN 978-93-5268-269-0
YMCA University of Science & Technology, Faridabad, Haryana
136
Smart Technology is developing an ERF-based Braille display tablet for the visually impaired. Current devices
on the market allow users to either read or write. The proposed design by Smart Technology is an integrated
ERF input-output interface that enables users to do both. A single line displays about 40 Braille characters. The
full size graphical array will feature 128×64 individual actuators that display either Braille characters or even
simple graphics. ERFs mimic the rheology of biological tissues, Bar-Cohen also developed a training system for
surgeons by having them operate on virtual patients using smart fluids to simulate the resistance of human flesh
[3].It is possible to sense the touching force normal to the display’s surface by monitoring the change of current
passing through the ER fluid [4]. Exercising bicycle based on ER fluid has many advantages like its resistant
torque can be adjusted by applied electric field and electric power consumption is very low [5]. Rheological
characteristics of the tested ER fluids differ significantly showing great influence of fluid type on brake’s
performance. The smaller influence of temperature on brake rheological characteristics is connected with better
heat transfer by the brake walls [6].
The origination of the ERLs (ER lubricants) with improved characteristics allowed inventors to come up with
original proposals aimed at perfecting and designing mechanical devices, such as fishing rods, appliances for
rehabilitation of convalescent persons, and seismometers. Possibilities were also widened of using ERLs also for
chemical technologies, specifically, in comminution of a dispersive material by increasing viscosity in the gap
between rubbing surfaces of colloid mills, batching of various liquid dispersive materials, filtration when
vibrational electric precipitators are used, sedimentation, regulation of separation processes, and voltage control
in gas cleaning. The use of the Electrorheological effect is also promising for controlling the thermal boundary
layer and can serve as an efficient tool for studying the action of temperature fields and the characteristics of
various heat exchangers. An experimental investigation of convective heat transfer of ERLs allowed
determining the heat transfer coefficient as a function of strength of the electric field and recommending them
for cooling objects with a high potential on their surface. Measurement of acoustic properties of ERLs in electric
fields (such as supersonic velocity and absorptivity) allow proposing designs of controllable acoustic devices
with readjustable parameters, such as hydrolocators, hydrophones, delay lines, filters, and lenses. By the
estimates of experts, the predicted market for Electrorheological liquids is very large. Potentially, they can
replace 50% of liquids currently used for hydraulic systems and hydrodynamics, and this can yield a significant
economic gain. Great interest in the ERL problems is shown by the automobile giants, such as Chrysler and
Japanese Toyota and Bridgestone. They focus on applying the Electrorheological technology to designing a
stepless gearbox, controllable suspension, smooth couplings, brakes, and fuel supply systems. Shut-off units
(throttles) of hydraulic systems, controlled shock absorbers, hydraulic pumps, brake pushers, hydraulic vibrators
and other new-generation devices based on them were developed, which operated in the "open– closed" mode
[7].
ER fluid can be utilized for torque-transferring applications such as torque transducer, damper, actuator and
other control system fields such as micro fluidics and digital droplet display [8]. Electrorheological fluid-
assisted polishing process is the ultra precision finishing technologies has been presented to polish micro
aspherical lenses and dies. Surface roughness and material removal are the great concerns in the ER fluid-
assisted polishing [9]. Use of ERF based on mineral oils to lubricate friction joints whose contacting surfaces
are covered with insulating oxide-ceramic coatings results in reversible changes of the sliding friction
coefficient depending on the applied voltage. Purposeful application of ERF makes it possible to develop
friction joints with controllable tribological parameters like viscosity and thickness of lubricating films, friction
force, etc. and therefore to affect actively the improvement of the durability of such tribosystem, especially
those undergoing frequent starts and stops, by means of greatly increasing their wear resistance [10]. There are
lot of devices developed at institute in terms of their application like Hydraulic valves with ER fluid, Dielectric
Suspension pump, Monitoring device, Distributor, Safety device, Liquid pressure oscillator, Electro hydraulic
brake pusher, Tracking device for copying machine, packing device, fan, Measuring Device, Rotary Viscometer,
Recuperative Heat Exchanger [11].Apart above application there are some applications on which a lot of work is
done .Review of that work is explained as below.
Proceedings of the National Conference on
Trends and Advances in Mechanical Engineering
(TAME-2017) March 16-17, 2017 ISBN 978-93-5268-269-0
YMCA University of Science & Technology, Faridabad, Haryana
137
Vibration control application
In vibration control applications one is mostly concerned with the inertial and viscoelastic properties quantified
in terms of the mass, stiffness and damping respectively. With the increase in electric field across the ER fluid
from 0 kV/mm to 2 kV/mm, an increase of 25% to 50% in equivalent viscous damping is observed [12]. The
attenuation of longitudinal vibrations in structures can be achieved through a change in the impedance of the
structure. This impedance change can be produced by an Electrorheological fluid [13].An Electrorheological
dynamic torsional absorber, called Smart Houdaille ER Dynamic Absorber (SHERDA), is proposed in order to
control the torsional vibrations of a rotor system. The equivalent damping and stiffness increase quickly with the
electric field, but damping shows a tendency for saturation at very high electric fields[14]. The change in
apparent material behavior makes ERF interesting for use in the on-line tuning of dynamic systems such as
tuned vibration absorbers (TVAs). An existing prototype semi active TVA, designed to fit into the steering
wheel of a luxury automobile and influence lateral vibrations in the steering wheel plane [15]. Formulae for the
critical load, natural frequency, and loss factor of a simply supported adaptive beam with embedded
Electrorheological fluid [16]. Some applications like vibration control using ER as working fluid, to couple two
disc for power transmission, switching the shape of airfoil in flight are discussed in detail [17].
Damper
The implementation of ER damper allows the system to adjust its damping level due to the road profile by
controlling the electric field applied [18]. The rheological properties of ER materials (yield stress and
viscoelasticity) are extremely sensitive to electric fields. Modulations of the electric field in an
Electrorheological damper results in a corresponding change in device forces. The annular ducts are formed by a
set of concentric metallic tubes, which may be electrically charged with a high voltage potential, or electrically
grounded [19]. To achieve the same performance, a flow-mode ER damper is not as compact and efficient as a
shear-mode ER damper. With the same ER damping force, a mixed-mode damper is more compact than a shear-
mode damper [20]. Force-displacement hysteresis loop can be predicted by FE calculation for any damper
design. The loop may then be simplified so as to be described by only two parameters for ensuing transient
response analysis [21]. Simple mechanical design of ER damper involves only few moving parts and ensure
high technical reliability and exhibit almost no wear [22]. The Electrorheological valve using serial multi
electrode is suitable for vehicle dampers that especially require short stroke and high damping force [23]. This
ER damper is able to produce a relatively high damping coefficient with medium stroke and low ER fluid
effectiveness, this is done by selecting appropriate gap between electrodes and electrode length [24].
Bearings
Implicit viscosity variation effects according to shear strain rates of fluid are included in generalized Reynolds’
equation for submerged journal bearing. Stability region for simple rotor-bearing system is computed. It is found
that there are no big differences in load capacities with the selected electric field parameters at low eccentric
region and higher electric field can support more load with stability at low eccentric region [25]. A high speed
journal bearing (16000 to 35000 s-1), with small radial clearance is presented. The alternation of the attitude
locus (eccentricity and attitude angle) and the stiffness coefficients in a loaded journal bearing lubricated with
ER fluid is investigated [26]. Under the influence of an applied electric field, the variation of apparent viscosity
of Electrorheological (ER) fluid flow causes ER effects. According to the Bingham model, which is widely used
for describing the rheological properties of ER fluids, this variation should be very weak at high shear rates.
Under the influence of the applied electric field, ER effects in ER journal bearings can be affected by not only
the apparent viscosity of ER fluids but also the movement of yield surface in the clearance of ER journal
bearing[27]. The magnitude of force obtainable using the electro viscous bearing has been shown to be adequate
to provide the required control action [28]. ER effects enhance the load-carrying capacity, but have little effect
on the attitude angle. The quantitative effects on load-carrying capacity are more pronounced for journal
bearings operating at higher values of eccentricity ratio. The friction parameter is also increased due to the ER
effects [29]. A numerical analysis is performed on the hydrodynamic characteristics of Electrorheological (ER)
fluid flows in journal bearings based on computational fluid dynamics (CFD) techniques. ER effects provide an
enhancement in the load-carrying capacity, but do have little effects on the attitude angle [30]. The bearing static

Proceedings of the National Conference on
Trends and Advances in Mechanical Engineering
(TAME-2017) March 16-17, 2017 ISBN 978-93-5268-269-0
YMCA University of Science & Technology, Faridabad, Haryana
138
and dynamic characteristic parameters presented in the study indicate that the effect of journal misalignment is
in general to cause a reduction in bearing dynamic characteristic parameters whereas the electric field in the ER
fluid is to partially compensate this loss [31]. Applied electrical field has a substantial influence on load carrying
capacity and misaligned attitude of journal bearings. Possibility for control of high speed journal bearing using
ER fluid exists [32]. At high shear rate viscosity did not increase dramatically but the increase affects the
dynamic properties of bearing (eccentricity, film thickness, pressure distribution and stiffness and dynamic
coefficients) [33]. Electrorheological (ER) lubricant is applied to a rigid rotor system supported by a
hydrodynamic bearing that is subjected to a sudden imbalance and a dynamic periodic rotating load. The ER
lubricant was found to offer a good load capacity relative to a Newtonian lubricant and its performance could be
controlled to handle sudden dynamic loads[34]. A detail study of available literature indicates that performance
analysis of hybrid journal bearings together with Electrorheological lubricants have been ignored .To the best of
author’s knowledge, limited number of study is available which deals with performance analysis of journal
bearings operating with Electrorheological lubricants. The performance of hybrid journal bearing also depends
on the type of flow controlling devices used. The commonly used flow control devices are capillary, orifice and
constant flow valve and hence a comparative study of journal bearing operating with ER fluid can be carried out
in future research .
End effector and Actuators
Forces applied at a robot end-effector due to a compliant environment can be reflected to the user using such an
ERF device where a change in the system viscosity in proportion to the force to be transmitted [35,36]. To
design ER actuators with higher force performance, tensile and compressive behaviors of ER fluids have been
investigated during recent years. The tensile stress and compressive stress of ER fluids have been found to be
much higher than the shear yield stress. The difference between the nominal yield stress curves increased with a
decrease in the gap distance and an increase in the applied voltages [37]. Current hydraulic actuators use high-
precision mechanical fluid valves, which are very expensive, have long lead times and limited lifetimes due to
wear. However, because the valves for the ERF actuator are not mechanical, an ERF-based hydraulic actuator
can theoretically have a longer operational life and cost less [38]. It can be shown experimentally that by
changing electrical field of an ER fluid ,Machining chatter can be reduced [39].
Application considering Wear Problems
Application devices using ER fluids expose wear problem of moving component caused by ER particles. This
wear problem eventually causes the lubricant leakage and hence leads to poor performance of the system. Wear
and friction properties of the silica-based ER fluids were significantly influenced by the base liquid property,
while the effect of the existence of the particles was small [40]. Lingard et al concentrates on the wear and
tribological aspects of the fluid . Severe wear under ER fluid lubrication may preclude the use of such materials
in applications where metallic contact is a characteristic of tribosystem unless suitable surfactants with good
mixed/ boundary lubricating properties can be introduced without at same time diminishing electrical
performance . By comparison with a commercial lubricating oil working under the same conditions it is
concluded that the ER fluid tested is likely to cause severe wear problems in some engineering situations [41].
Challenges
A key design consideration is the amount of energy to be dissipated in the ER fluid itself. One of the most
difficult tasks in the synthesis of ER fluids is the creation of fluids with properties that are stable over a large
temperature range. Thus, applications such as clutches, in which a great deal of energy must be dissipated in the
fluid, are intrinsically more challenging [42]. Only easily purchased inorganic Zeolite and biomaterials (Starch)
are applied frequently in study of ER mechanism and models. Therefore, it is important to develop synthesis
methods with mass production not only for a study of their mechanism but also for application research. ER
fluids generating high yield stress always have other problems, for example, serious sedimentation in an
inorganic-based ER fluid and high zero field viscosity of a GER fluid.
Conclusion

Proceedings of the National Conference on
Trends and Advances in Mechanical Engineering
(TAME-2017) March 16-17, 2017 ISBN 978-93-5268-269-0
YMCA University of Science & Technology, Faridabad, Haryana
139
ER fluids are smart materials of vast potential applications in many fields. A lot of materials ranging from
inorganic to liquid crystal and to semi conductive polymeric materials can be used for fabricating the ER fluids,
forming the heterogeneous and homogeneous fluids in view of the miscibility of dispersed/dispersing phases, or
hydrous and anhydrous fluids in view of the water content. The positive ER effect is usually used for
transmitting electric mechanical signals, while the negative ER effect may be mainly used for material
processing. For example, processing a high loading ceramic or polymeric composite system would be extremely
difficult due to the high viscosity. In such a case, the negative ER effect can be used to reduce the viscosity,
allowing the processing to become possible and easier. The interesting smart electro responsive characteristics
of fine tuning and the quick response make them appropriate candidates in broad engineering areas, such as
clutches, seismic vibration dampers, breaks, optical finishing systems, medical therapies, artificial muscle
stimulators, actuators, Haptic master, micro-fluidic control, and viscosity reduction of crude oil. The very high
yield stresses obtained in the new ER fluids have opened the door to the practical implementation of this
fantastic material. However, the disadvantages including complicated preparation process, nanofiber
aggregation, etc. and the further understanding about physical and chemical mechanisms behind the
Electrorheology of nanofiber suspensions need to be noted in the future works.
References 1. Patil Swapnil , Patil Santosh .Synthesis & Characterization of high yield stress Smart Fluid useful in heavy duty
applications. International Journal on Mechanical Engineering and Robotics (IJMER) 2014; Volume-2, Issue-2.
2. Lu Y, Shen et al .The synthesis and Electrorheological effect of a strontium titanyl oxalate suspension. Smart
Materials and Structures 2009; Volume 18, Number 2.
3. Szary M. L. The phenomena of Electrorheological fluid behavior between two barriers under alternative voltage.
Archives of acoustics 2004;29, 2:243–258 .
4. Liu Yanju, Davidson Rob, Taylor Paul .Investigation of the touch sensitivity of ER fluid based tactile display.In:
Smart Structures and Materials 2005: Smart Structures and Integrated Systems, edited by Alison B. Flatau, Proc.
of SPIE Vol. 5764 (SPIE, Bellingham, WA, 2005)
5. Tian Yu, Yu et al .A prototype of an exercise based bicycle based on Electrorheological fluid. Journal of
Intelligent Material Systems and Structures 2006;vol.17 .
6. Kesy Z., Kesy et al .An example of design—Embodiment for Electrorheological fluid based mechatronic
transmission components. Mechatronics 2006; 16 :33–39.
7. Korobko E. V., Matsepuro A. D. Electrorheology: From its beginning to the present. Journal of Engineering
Physics and Thermophysics 2010; Vol. 83, No. 4.
8. Fang Fei Fei, Choi Hyoung Jin, Ahn Wha-Seung .Electrorheology of a mesoporous silica having conducting
polypyrrole inside expanded pores. Microporous and Mesoporous Materials 2010;130 :338–343.
9. Zhao Yunwei, Geng Dexu, Liu Xiaomin .An Investigation on Electrorheological Fluid assisted Polishing
Process for Tungsten Carbide. Journal of Computers 2012 Vol. 7, no. 11.
10. Ermakov S. F. Effect of Lubricants and Additives on the Tribological Performance of Solids. Part 2. Active
Friction Control. Journal of Friction and Wear 2012; Vol. 33, No. 3: 217–223.
11. Shulman Z P, Gorodkin et al .The Electrorheological effect and its possible uses. Journal of Non-Newtonian
Fluid Mechanics 1981; 8 :29-41.
12. Phani A. Srikanth, Venkatraman Kartik .Vibration Control of Sandwich Beams Using Electro-Rheological
Fluids. Mechanical Systems and Signal Processing 2003; Volume 17, Issue 5: 1083–1095.
13. Austin S. A. The Vibration Damping Effect of an Electrorheological Fluid. Transactions of the ASME 1993;
136 / Vol. 115.
14. Sun Yulan, Thomas Marc .A smart Electrorheological dynamic absorber for controlling torsional vibrations of
rotors.In:12th Pan-American Congress of Applied Mechanics, Port of Spain, Trinidad, January 02-06, 2012
15. Norrick Nicklas .Electrorheological Fluid Power Dissipation and Requirements for an Adaptive Tunable
Vibration Absorber. International Journal of Innovations in Materials Science and Engineering (IMSE) 2013;
Vol. 1, No. 2.
16. Yeh Zi-Fong, Shih Yan-Shin .Critical load, dynamic characteristics and parametric instability of
Electrorheological material-based adaptive beams. Computers and Structures 2005; 83 :2162–2174.
17. Truong Tam Dinh .Engineering Application of Electrorheological fluid”. thesis submitted for Master of
Engineering in Victoria University,2000
18. Mohamed Nik Abdullah et al .Compromising vehicle handling and passenger ride comfort using ER-damper.
MECHANIKA. 2005.
19. Gavin Henri P. Multi-duct ER Dampers. Journal of Intelligent Material Systems and Structures 2001.

Proceedings of the National Conference on
Trends and Advances in Mechanical Engineering
(TAME-2017) March 16-17, 2017 ISBN 978-93-5268-269-0
YMCA University of Science & Technology, Faridabad, Haryana
140
20. Lou Z., Ervin R. D., Filisko F. E. A Preliminary Parametric Study of Electrorheological Dampers. Transactions
of the ASME 1994, 570/Vol. 116
21. Noresson V., Ohlson N.G., Nilsson M. Design of Electrorheological dampers by means of finite element
analysis: theory and applications. Materials and Design 2002;23 :361–369.
22. Butz, T. and von Stryk, O. Modelling and Simulation of ER and MR Fluid Dampers. Zamm · Z. angew. Math.
Mech. 1998;78:1–22.
23. Kuo W. H., Lin et al .Study on the Controllable Characteristics of Electrorheological Valve Using Serial
Multielectrode. Tamkang Journal of Science and Engineering 2009; Vol. 12, No. 3: 351-358.
24. Suliman Meshaal, Pawar S.R. Design and Performance Analysis of an Electro Rheological Damper. IJSR 2015;
Volume - 4 , Issue - 8.
25. Jang Siyoul, Tichy John A. Internal Damper Characteristics of Rotor System with Submerged ER Fluid Journal
Bearing. International Journal of Rotating Machinery 1997; Vol. 3, 1:61-71.
26. Nikolakopoulos P. G., Papadopoulos C. A. Controllable high speed journal bearings, lubricated with
Electrorheological fluids. An analytical and experimental approach. Tribology International 1998;Vol. 31, No.
5:. 225–234.
27. Zhun Zhang, Ke-qin Zhu .Characteristics of Electrorheological Fluid Flow in Journal Bearings. chin. phys. letter
2002; Vol. 19, No. 2 :273.
28. Metcalfe Andrew, Burdess et al .Electro viscous Journal Bearing for Active Control of Vibration of an Out-of-
Balance Rotor.In: 6th Engineering Mathematics and Applications Conference (EMAC) 2003; 143-146.
29. Peng Jie, Zhu Ke-Qin .Hydrodynamic Characteristics of ER Journal Bearings with External Electric Field
Imposed on the Contractive Part. Journal of Intelligent Material Systems And Structures 2005; Vol. 16
30. Peng Jie , Zhu Ke-Qin .Effects of electric field on hydrodynamic characteristics of finite-length ER journal
bearings. Tribology International 2006; 39 :533–540.
31. Basavaraja J. Sharana , Sharma Satish C. , Jain Satish C. A study of misaligned Electrorheological fluid
lubricated hole-entry hybrid journal bearing. Tribology International 2010 ;43 :1059–1064.
32. Nikolakopoulos P. G., Papadopoulos C. A. Controllable Misaligned Journal Bearings, Lubricated with Smart
Fluids. Journal of Intelligent Material Systems and Structures 1997 8: 125
33. Nikolakopoulos P. G., Papadopoulos C. A. .High speed journal bearing lubricated with Electrorheological
Fluids-An experimental investigation .International journal of modern physics B 1996; vol.10,No.23&24: 3045-
3055.
34. Lee Yong-Bok. Behavior Analysis of Controllable Electrorheology Fluid Plain Journal Bearings. Journal of
Dynamic Systems, Measurement, and Control, ASME 2015; Vol. 137 : 061013-1.
35. Pfeiffer Charles, Mavroidis et al .Electrorheological Fluid Based Force Feedback Device.In: Proceedings of the
1999 SPIE Tele manipulator and Tele presence Technologies VI Conference, Boston, MA, September 1999.,
Vol. 3840, pp. 88-99.
36. Mavroidis C., Pfeiffer et al . Design and Modelling of an Electro-Rheological Fluid Based Haptic Interface. In:
Proceedings of the 2000 ASME Mechanisms and Robotics Conference, Baltimore MD, September 10-13
37. Tian Yu, Wen Shizhu, Meng Yonggang .Compressions of Electrorheological fluids under different initial gap
distances. Physical review E 2003; 67:051501.
38. Nguyen Quang-Anh, Jorgensen et al .Characterization and Testing of an Electrorheological Fluid Valve for
Control of ERF Actuators. Actuators 2015; 4: 135-155.
39. Lei Yuan Zhong .Use of Electrorheological technique for chatter control.In: International Conference on
Intelligent Manufacturing 1995; 762 .
40. Jeon Juncheol, Ha et al .Wear Characteristics of Electrorheological Fluids with Different Base Oil and Particle
Concentration. International Journal of Civil Engineering and Building Materials 2011; Vol. 1 No.1.
41. Lingard s, Bullough W A, Shek W M .Tribological performance of an electro-rheological fluid. J. Phys. D:
Appl. Phys. 1989; 22 :1639-1645.
42. Halsey Thomas c .Rheology of Electro rheological Fluids. Physical review letters 1992.
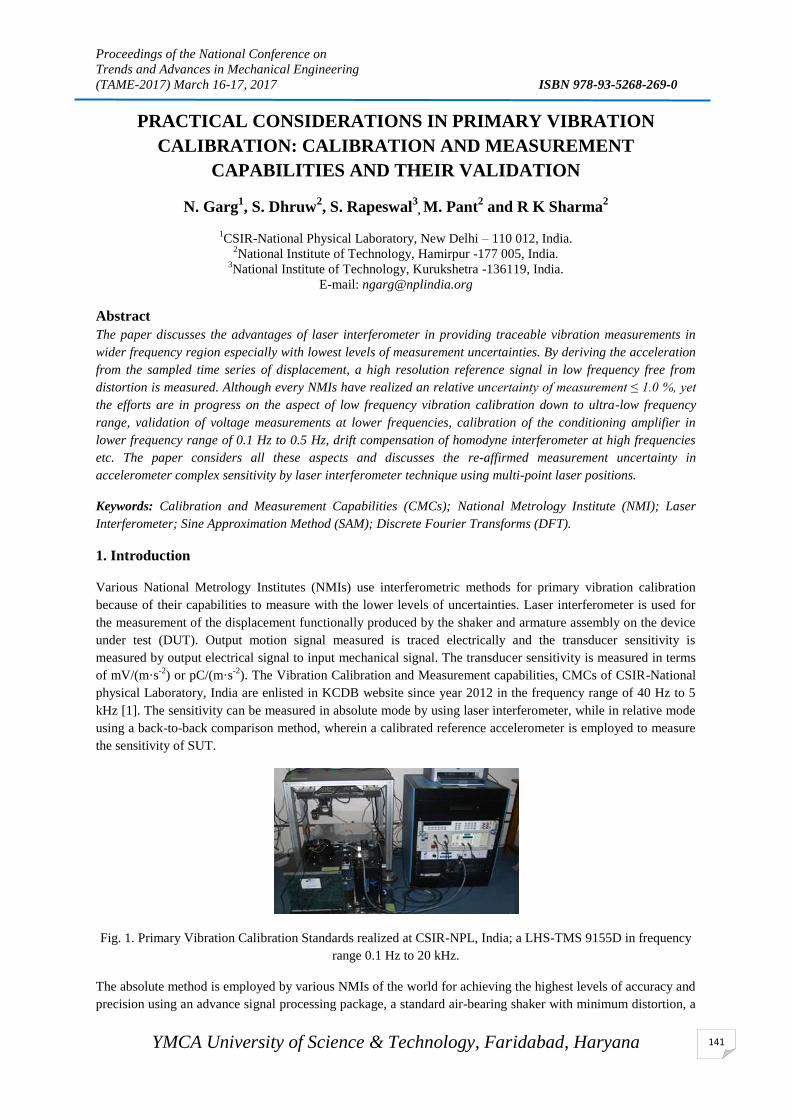
Proceedings of the National Conference on
Trends and Advances in Mechanical Engineering
(TAME-2017) March 16-17, 2017 ISBN 978-93-5268-269-0
YMCA University of Science & Technology, Faridabad, Haryana
141
PRACTICAL CONSIDERATIONS IN PRIMARY VIBRATION
CALIBRATION: CALIBRATION AND MEASUREMENT
CAPABILITIES AND THEIR VALIDATION
N. Garg1, S. Dhruw
2, S. Rapeswal
3, M. Pant
2 and R K Sharma
2
1CSIR-National Physical Laboratory, New Delhi – 110 012, India.
2National Institute of Technology, Hamirpur -177 005, India.
3National Institute of Technology, Kurukshetra -136119, India.
E-mail: [email protected]
Abstract
The paper discusses the advantages of laser interferometer in providing traceable vibration measurements in
wider frequency region especially with lowest levels of measurement uncertainties. By deriving the acceleration
from the sampled time series of displacement, a high resolution reference signal in low frequency free from
distortion is measured. Although every NMIs have realized an relative uncertainty of measurement ≤ 1.0 %, yet
the efforts are in progress on the aspect of low frequency vibration calibration down to ultra-low frequency
range, validation of voltage measurements at lower frequencies, calibration of the conditioning amplifier in
lower frequency range of 0.1 Hz to 0.5 Hz, drift compensation of homodyne interferometer at high frequencies
etc. The paper considers all these aspects and discusses the re-affirmed measurement uncertainty in
accelerometer complex sensitivity by laser interferometer technique using multi-point laser positions.
Keywords: Calibration and Measurement Capabilities (CMCs); National Metrology Institute (NMI); Laser
Interferometer; Sine Approximation Method (SAM); Discrete Fourier Transforms (DFT).
1. Introduction
Various National Metrology Institutes (NMIs) use interferometric methods for primary vibration calibration
because of their capabilities to measure with the lower levels of uncertainties. Laser interferometer is used for
the measurement of the displacement functionally produced by the shaker and armature assembly on the device
under test (DUT). Output motion signal measured is traced electrically and the transducer sensitivity is
measured by output electrical signal to input mechanical signal. The transducer sensitivity is measured in terms
of mV/(m·s-2
) or pC/(m·s-2
). The Vibration Calibration and Measurement capabilities, CMCs of CSIR-National
physical Laboratory, India are enlisted in KCDB website since year 2012 in the frequency range of 40 Hz to 5
kHz [1]. The sensitivity can be measured in absolute mode by using laser interferometer, while in relative mode
using a back-to-back comparison method, wherein a calibrated reference accelerometer is employed to measure
the sensitivity of SUT.
Fig. 1. Primary Vibration Calibration Standards realized at CSIR-NPL, India; a LHS-TMS 9155D in frequency
range 0.1 Hz to 20 kHz.
The absolute method is employed by various NMIs of the world for achieving the highest levels of accuracy and
precision using an advance signal processing package, a standard air-bearing shaker with minimum distortion, a
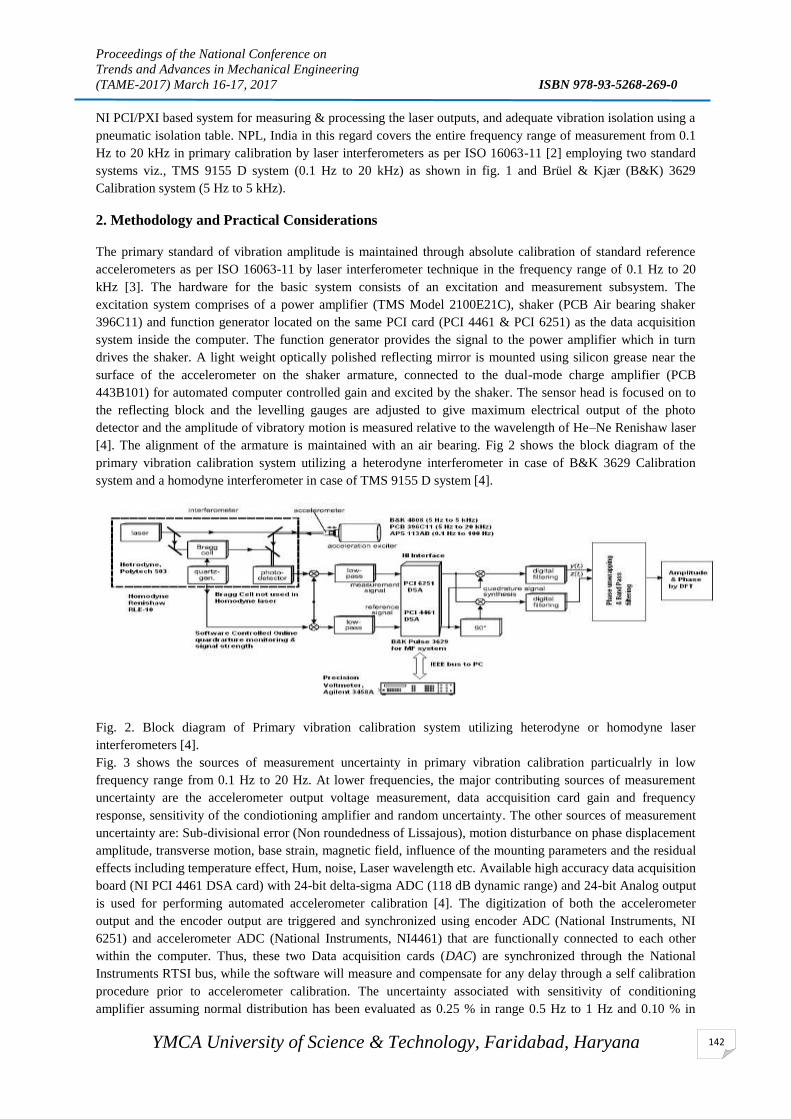
Proceedings of the National Conference on
Trends and Advances in Mechanical Engineering
(TAME-2017) March 16-17, 2017 ISBN 978-93-5268-269-0
YMCA University of Science & Technology, Faridabad, Haryana
142
NI PCI/PXI based system for measuring & processing the laser outputs, and adequate vibration isolation using a
pneumatic isolation table. NPL, India in this regard covers the entire frequency range of measurement from 0.1
Hz to 20 kHz in primary calibration by laser interferometers as per ISO 16063-11 [2] employing two standard
systems viz., TMS 9155 D system (0.1 Hz to 20 kHz) as shown in fig. 1 and Brüel & Kjær (B&K) 3629
Calibration system (5 Hz to 5 kHz).
2. Methodology and Practical Considerations
The primary standard of vibration amplitude is maintained through absolute calibration of standard reference
accelerometers as per ISO 16063-11 by laser interferometer technique in the frequency range of 0.1 Hz to 20
kHz [3]. The hardware for the basic system consists of an excitation and measurement subsystem. The
excitation system comprises of a power amplifier (TMS Model 2100E21C), shaker (PCB Air bearing shaker
396C11) and function generator located on the same PCI card (PCI 4461 & PCI 6251) as the data acquisition
system inside the computer. The function generator provides the signal to the power amplifier which in turn
drives the shaker. A light weight optically polished reflecting mirror is mounted using silicon grease near the
surface of the accelerometer on the shaker armature, connected to the dual-mode charge amplifier (PCB
443B101) for automated computer controlled gain and excited by the shaker. The sensor head is focused on to
the reflecting block and the levelling gauges are adjusted to give maximum electrical output of the photo
detector and the amplitude of vibratory motion is measured relative to the wavelength of He–Ne Renishaw laser
[4]. The alignment of the armature is maintained with an air bearing. Fig 2 shows the block diagram of the
primary vibration calibration system utilizing a heterodyne interferometer in case of B&K 3629 Calibration
system and a homodyne interferometer in case of TMS 9155 D system [4].
Fig. 2. Block diagram of Primary vibration calibration system utilizing heterodyne or homodyne laser
interferometers [4].
Fig. 3 shows the sources of measurement uncertainty in primary vibration calibration particualrly in low
frequency range from 0.1 Hz to 20 Hz. At lower frequencies, the major contributing sources of measurement
uncertainty are the accelerometer output voltage measurement, data accquisition card gain and frequency
response, sensitivity of the condiotioning amplifier and random uncertainty. The other sources of measurement
uncertainty are: Sub-divisional error (Non roundedness of Lissajous), motion disturbance on phase displacement
amplitude, transverse motion, base strain, magnetic field, influence of the mounting parameters and the residual
effects including temperature effect, Hum, noise, Laser wavelength etc. Available high accuracy data acquisition
board (NI PCI 4461 DSA card) with 24-bit delta-sigma ADC (118 dB dynamic range) and 24-bit Analog output
is used for performing automated accelerometer calibration [4]. The digitization of both the accelerometer
output and the encoder output are triggered and synchronized using encoder ADC (National Instruments, NI
6251) and accelerometer ADC (National Instruments, NI4461) that are functionally connected to each other
within the computer. Thus, these two Data acquisition cards (DAC) are synchronized through the National
Instruments RTSI bus, while the software will measure and compensate for any delay through a self calibration
procedure prior to accelerometer calibration. The uncertainty associated with sensitivity of conditioning
amplifier assuming normal distribution has been evaluated as 0.25 % in range 0.5 Hz to 1 Hz and 0.10 % in
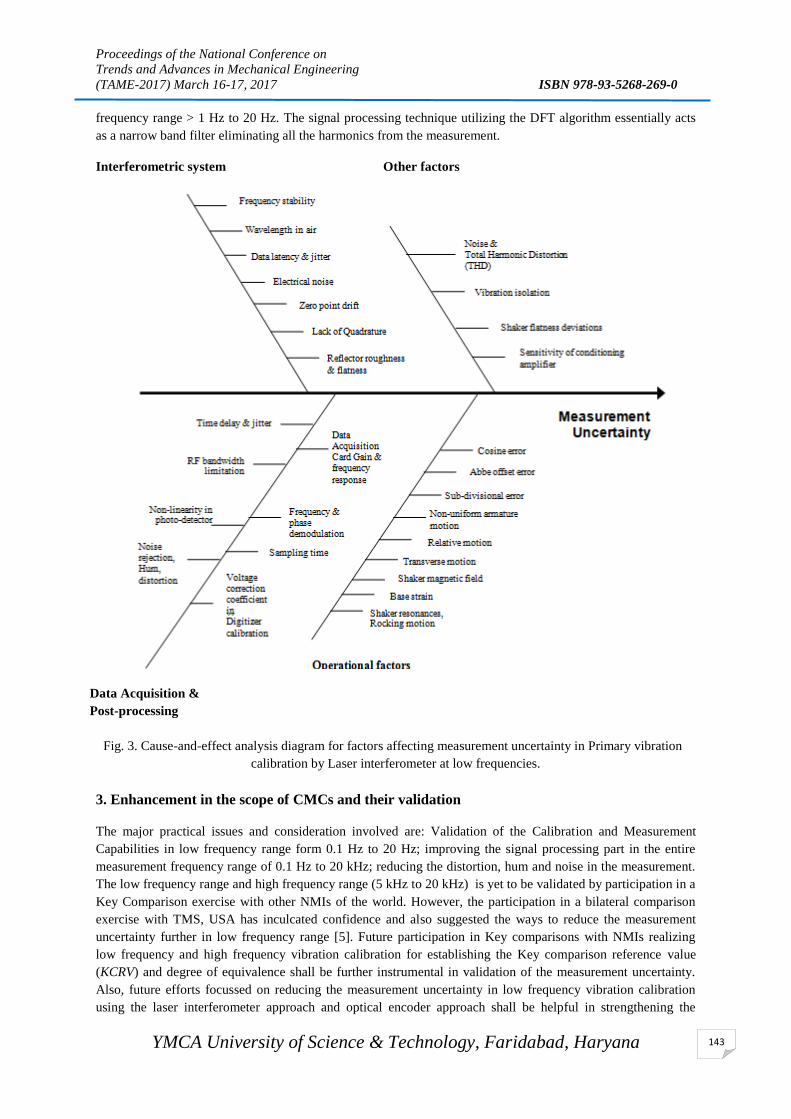
Proceedings of the National Conference on
Trends and Advances in Mechanical Engineering
(TAME-2017) March 16-17, 2017 ISBN 978-93-5268-269-0
YMCA University of Science & Technology, Faridabad, Haryana
143
frequency range > 1 Hz to 20 Hz. The signal processing technique utilizing the DFT algorithm essentially acts
as a narrow band filter eliminating all the harmonics from the measurement.
Interferometric system Other factors
Data Acquisition &
Post-processing
Fig. 3. Cause-and-effect analysis diagram for factors affecting measurement uncertainty in Primary vibration
calibration by Laser interferometer at low frequencies.
3. Enhancement in the scope of CMCs and their validation
The major practical issues and consideration involved are: Validation of the Calibration and Measurement
Capabilities in low frequency range form 0.1 Hz to 20 Hz; improving the signal processing part in the entire
measurement frequency range of 0.1 Hz to 20 kHz; reducing the distortion, hum and noise in the measurement.
The low frequency range and high frequency range (5 kHz to 20 kHz) is yet to be validated by participation in a
Key Comparison exercise with other NMIs of the world. However, the participation in a bilateral comparison
exercise with TMS, USA has inculcated confidence and also suggested the ways to reduce the measurement
uncertainty further in low frequency range [5]. Future participation in Key comparisons with NMIs realizing
low frequency and high frequency vibration calibration for establishing the Key comparison reference value
(KCRV) and degree of equivalence shall be further instrumental in validation of the measurement uncertainty.
Also, future efforts focussed on reducing the measurement uncertainty in low frequency vibration calibration
using the laser interferometer approach and optical encoder approach shall be helpful in strengthening the

Proceedings of the National Conference on
Trends and Advances in Mechanical Engineering
(TAME-2017) March 16-17, 2017 ISBN 978-93-5268-269-0
YMCA University of Science & Technology, Faridabad, Haryana
144
traceability chain of vibration measurements through out the country [6-10]. The accuracy of optical encoder
technology associated with the read-head dynamic issues and encoder resolution serves a major limitation
although its potential applications in ultra-low frequency range accelerometer calibration is tremendous [6].
Efforts are in progress for reducing the measurement uncertainty in higher frequency range of 5 kHz to 20 kHz
also. The drift error in homodyne interferometer and suppression of the resonance modes in the shaker induced
at higher frequencies are the major practical considerations involved for reducing the measurement uncertainty
in higher frequency range [11,12]. Experiments are planned to validate the displacement measured by the laser
interferometer with a He-Ne laser of Dimension standards, CSIR-National Physical Laboratory, India so as to
ensure traceability and assess the magnitude of measurement error in displacement measurements at higher
frequencies.
4. Conclusions
The paper presented the practical considerations in primary vibration calibration employing the laser
interferometer reference standard. The displacement so measured is traceable to the wavelength of He–Ne
homodyne/heterodyne laser. The use of laser interferometer in conjunction with air bearing exciters of beryllium
armature having minimum transverse motion, special vibration isolation provided and by data acquisition at a
high sampling rate i.e. with use of National instruments PCI cards inculcates highest levels of accuracy and
precision associated with vibration calibration measurements. The expanded uncertainty (k = 2) of 0.3–1.8 % in
range 5 Hz to 20 kHz is re-affirmed by absolute calibration of standard reference accelerometers by laser
interferometer technique using multi-point laser positions. The expanded uncertainty (k = 2) of 0.80 -1.30 % is
calculated for determination of sensitivity of accelerometer in frequency range 0.1 Hz to 20 Hz. The
participation in Key comparisons with other NMIs of the world in frequency range 40 Hz to 5 kHz have
revealed a high degree of equivalence in measuring the sensitivity of back-to-back and single ended
accelerometers, which in turn validates the measurement methodology and instrumentation used. However,
efforts are in progress to enhance the scope of Calibration and Measurement Capabilities in the low frequency
range and high frequency range. Also, the establishment of shock standards and upgradation of secondary
vibration standards are targeted to meet the industry demands so as to provide the traceability in the field of
vibration and shock measurements. Efforts are also in progress to reduce the measurement uncertainty in the
entire frequency range so as to strengthen the traceability chain in the field of vibration measurements in India.
Acknowledgements
The authors are very thankful to Director, CSIR-National Physical Laboratory, India and Head, Physico-
Mechanical Standards for sanctioning special grant for the establishment of Primary Vibration Calibration
Standard at AUV laboratory, CSIR-NPL under NWP-45 networking project and Up-gradation in Secondary
Vibration Standard under MIST and OLP 120532 projects.
5. References
[1] Acoustics and Vibration Calibration and Measurement Capabilities (CMCs), CSIR-National Physical
Laboratory, India, http://www.bipm.org.
[2] ISO 16063-11:1999, Methods for the calibration of vibration and shock transducers – Part 11: Primary vibration
calibration by laser interferometry.
[3] Garg N, Sharma O, Kumar A and Schiefer M I, A novel approach for realization of Primary Vibration
Calibration Standard by homodyne laser interferometer in frequency range of 0.1 Hz to 20 kHz, Measurement
2012; 45:1941–1950.
[4] Garg N, Soni K, Kumar A and Saxena T K, Applications of Laser Interferometry in providing traceable
vibration measurements in India, MAPAN-J. Metrology Society of India2015; 30 (2): 91-104.
[5] Garg N, Saxena T K and Schieffer M I, Bilateral Comparison in Primary vibration calibration of NPL, India and
The Modal Shop, USA, Proceedings IMEKO Conference 22nd
TC3, 12th
TC5 and 3rd
TC22, 3rd
to 5th
February,

Proceedings of the National Conference on
Trends and Advances in Mechanical Engineering
(TAME-2017) March 16-17, 2017 ISBN 978-93-5268-269-0
YMCA University of Science & Technology, Faridabad, Haryana
145
2014, Cape Town, Republic of South Africa, 24-27. http://www.imeko.org/publications/tc22-2014/IMEKO-
TC22-2014-006.pdf
[6] Schiefer M I and Garg N, Low frequency accelerometer calibration: Challenges, Analysis and New
developments, Proceedings of XX IMEKO World Congress, Korea, 2012
[7] Sun Q and Liu A, Final report on the Key Comparison, APMP.AUV.V-K1.2, Metrologia, 47 09004, 2010.
[8] Veldman C S, Traceable low frequency AC voltage measurement, IMEKO 20th
International Conference
Cultivating Metrological Knowledge, 1-7, 2007.
[9] Scott D A and Dickinson L P, Distortion effects in primary calibration of low-frequency accelerometer,
Metrologia 2014; 51: 212-224.
[10] Bruns T and Gazioch S, Correction of shaker flatness deviations in very low frequency primary accelerometer
calibration, Metrologia, 2016; 53: 986-990. [11] Sun Q, Wabinski W and Bruns Th, Investigation of primary vibration calibration at high frequencies using the
homodyne quadrature sine-approximation method: problems and solutions, Measurement Science and
Technology 2006: 17 (8):2197
[12] Bruns Th, Link A and Taübner A, The influence of different vibration exciter systems on high frequency
primary calibration of single-ended accelerometer: II, Metrologia 2012:49, 27-31.

Proceedings of the National Conference on
Trends and Advances in Mechanical Engineering
(TAME-2017) March 16-17, 2017 ISBN 978-93-5268-269-0
YMCA University of Science & Technology, Faridabad, Haryana
146
INFLUENCE AND MACHINE DESIGN: LESSONS FOR THE
DEVELOPMENT OF AUTONOMOUS MACHINES Arvind Kumar
M.Tech student, MDU Rhotak, Haryana Email: [email protected]
Abstract
People have advanced a rich and advanced arrangement of procedures for locks in with the world in which
cognizance and influence play two diverse however similarly essential parts. Perception translates and
comprehends the world. Influence assesses and judges, balancing the working parameters of perception and
giving a notice about conceivable perils. The investigation of how these two systems . cooperate gives direction
to the outline of complex autonomous systems that must manage an assortment of errands in a dynamic,
frequently flighty, and once in a while dangerous condition. This paper is expected to begin a talk about how the
investigation of effect in natural frameworks may add to the advancement of autonomous PC systems.Wesuspect
that from a practical point of view, a portion of the evolutionary forces that probably prompted to the rise of
effect in creatures are probably going to be applicable to the plan of counterfeit frameworks. Notwithstanding,
we see this paper as just setting the phase for further research, acknowledging very well indeed that it brings up
numerous a bigger number of issues than it answers.
Keywords: Automotive machines, system, design
A model of effect and insight: Three levels of conduct
In this segment we layout the substance of our threelevel hypothesis of human conduct, a work that is still in
advance, after which we talk about how these thoughts may be connected to the advancement of vast PC
frameworks or computational relics. the thoughts we talk about are still fragmented, and their suggestions for
the outline of PC frameworks still very theoretical. In any case, we trust that even our skeleton, inadequate as it
may be, gives potential lessons for the outline of frameworks that have an assortment of assignments what's
more, objectives, that must run unattended and autonomously, also, that need high unwavering quality. For sure,
thought of the plan limitations on autonomous robots was one of the main thrusts that prompted to this work.The
three levels that we propose we allude to as the Response level, the Routine level, and the Reflection level .
Handling at each level serves two distinct capacities: assessment of the world and what is occurring in it—
influence; and the elucidation of what is occurring on the planet—insight. Larger amounts include more
prominent profundity of preparing and accompanying slower handling. intellectual and emotional data streams
from level to level. Control data, as initiation on the other hand hindrance, streams descending
The lowest level: Reaction
The Reaction level comprises of the most reduced level procedures. In creatures, these procedures are
hereditarily decided and natural. No learning happens. The Reaction level includes quick reactions to state data
originating from the tangible frameworks. Its capacity is fast response to the present state.
The Reaction level screens the present condition of both the creature and nature through quick, hard-wired
finders that require at least preparing. When it distinguishes risky or perilous circumstances, it hinders
continuous more elevated amount preparing (on the off chance that there is any), it elevates excitement, and it
starts a quick reaction, or reaction arrangement, alongside an accompanying redirection of assets.
The yield from the Reaction level is an arrangement of quick and moderately straightforward intrudes, full of
feeling signs, and engine activities. Due to the quick and generally basic preparing, the Reaction level can't
decide causes or do a great deal more than react in a basic design coordinated way. This level is the most
Proceedings of the National Conference on
Trends and Advances in Mechanical Engineering
(TAME-2017) March 16-17, 2017 ISBN 978-93-5268-269-0
YMCA University of Science & Technology, Faridabad, Haryana
147
punctual of evolutionary procedures, and in straightforward creatures it is the main handling that happens. In
higher creatures and people, hinders from the Reaction level trigger larger amounts of preparing (at the Routine
and Reflection levels) with a specific end goal to decide the cause and select a suitable reaction. Reactions at the
Reaction level can be potentiated or repressed by contributions from these more elevated amounts, and they can
habituate, diminishing affectability to expected signs. The mid-level: Routine. In people, the Routine level is the
level of gifted and all around adapted, to a great extent "routinized" practices. This level is the home of most
engine abilities, including dialect era. The
Routine level is very intricate, including impressive preparing to choose and direct conduct. It must have entry
to both working and more changeless memory, and additionally evaluative and arranging components.
Contributions to the Routine level originate from the tangible frameworks, the Reaction level underneath, and
the Reflection level above as control signs (hindrance and actuation). The Routine level can both hinder and
actuate Reaction level reactions and can leave full of feeling data behind to the Reflection level when gone up
against with inconsistencies from standards or routine desires. The Routine level performs evaluation, bringing
about values on three measurements, which are alluded to in the logical writing on influence and feeling as
positive effect, negative effect, and (lively) excitement. Many feeling analysts now concur that positive and
negative influence are basically free dimensions as when the inspiration of a man on an eating regimen to eat up
a delectable looking treat (a source of positive effect) coincides with the inspiration to maintain a strategic
distance from the same, swelling, treat (a wellspring of negative influence). As implied over, a key element of
the Routine level is that of default desires. At the point when these desires are not met, the framework can make
conformities and learn. We come back to this point later in our discourse of conceivable applications. Be that as
it may, take note of the force of desires in flagging potential challenges. In people, these desires trigger full of
feeling forms that assume an essential part at the higher level of handling.
The most abnormal amount: Reflection
Reflection is a metaprocess in which the psyche ponders about itself. That is, it performs operations upon its
own particular inward portrayals of its encounters, of its physical encapsulation (what Damasio1 calls the "self-
perception"), its present conduct, and the present condition, alongside the yields of arranging, thinking, and
critical thinking. This level has input as it were from lower levels and neither gets immediate tactile input nor is
able to do coordinate control of conduct. Be that as it may, hinders from lower levels can coordinate and divert
Reflection-level handling. There is some proof that influence changes the handling mode for comprehension.
The system is neurochemical incitement that alters the weights and edges that represent the working attributes of
the intellectual systems, biasing them and changing the way of the progressing preparing. These changes impact
how more elevated amount preparing takes put, the locus of consideration, and the assignment of attentional
assets. Along these lines, negative effect, particularly at the point when joined by high excitement, shows up to
prompt to more engaged and profound handling— profundity first handling. In the extraordinary case, this sort
of handling prompts to the "limited focus" of stress. Conversely, positive influence seems to prompt to
expansive, all the more broadly spread preparing—expansiveness first handling. Therefore, people have
upgraded imagination at the point when in a pleasurable state. Both changes are, by and large, developmentally
versatile (one being reliable with expanded watchfulness, the other with expanded interest), regardless of the
possibility that on occasion they are counterproductive.
Take note of that we suggest that Reflection has just backhanded control (intervened through restraint and
initiation) over conduct exuding from the Routine level. The instruments of this control have been investigated
all the more completely by Norman and Shallice. Suggestions for machine plan Our counterfeit frameworks
today have something much the same as the three distinct levels of Reaction, Routine (activity), and Reflection,
yet they don't recognize influence (assessment) and comprehension (understanding). In this area we talk about
how a model of effect and comprehension along the lines of the one we have proposed might apply to machines.
In particular, we propose that influence can enhance general frameworks conduct, especially in unpredictable or
troublesome conditions.
Proceedings of the National Conference on
Trends and Advances in Mechanical Engineering
(TAME-2017) March 16-17, 2017 ISBN 978-93-5268-269-0
YMCA University of Science & Technology, Faridabad, Haryana
148
The Reaction level in machines
Response is the home of implicit sensors, more often than not with prewired or prearranged, settled reactions.
This level is fundamental for wellbeing and other basic contemplations for which a quick reaction is basic. The
Reaction level is fundamental to machine operation, and undoubtedly, is as of now entirely all around perceived
and executed. It is normal for PC frameworks to screen control and temperature, equipment working, and
checksums. In robots and other versatile frameworks, Reactionlevel gadgets incorporate contact sensors and
precipice indicators that keep the gadgets from hitting other questions or tumbling down stairs. In creatures,
when risky conditions are taken note, are larger amounts of preparing told, as well as continuous conduct is
regularly adjusted. These changes are for the most part just executed, and the conditions for their elicitation are
effectively perceived. Machines can benefit even from this rudimentary level of adjustment to imperative
changes in their working conditions and, as showed over, some do.
The Routine level in machines
The Routine level is the locus of routine computational work and so includes significant calculation and
reference to earlier occasions (memory). This action varies uniquely from examinations at the Reaction level. In
this manner, the discovery of typical infections and interlopers requires examination at the Routine level. (As
infections and gatecrashers turn out to be progressively complex, it is more probable that their recognition and
the relating therapeutic activities should be started at the Reflection level.) A key component of people and
creatures is the capacity to react to deviations from standards. Consider the esteem for PCs were they to have
some instrument for perceiving such deviations. Assume that as projects navigated checkpoints, they were
capable to recognize deviations from sensible asset andtime demands and that the identification of such a
deviation would trigger a caution. Along these lines, inordinate time (or disappointment) to achieve a checkpoint
or the utilization of exorbitant assets would trigger a scan for causes and conceivable end of the program.
Additionally, too quick an execution or too little utilization of assets would flag degenerate
operations.Webelieve that abilities of this kind would extraordinarily improve the unwavering quality and
constancy of our computational antiquities. These abilities are probably going to be especially critical for
autonomous robots.
The Reflection level in machines
The Reflection level is the level at which the framework consistently screens its own particular operations.19
This is both the most elevated level of investigation and the weakest in today's frameworks. Maybe the most
common utilization of reflection is in frameworks that screen such framework conduct as load adjust and
whipping. Reflection could prompt to rebuilding lines, needs, or asset portion. Likewise, location of errant
projects generally requires examinations at the level of Reflection. By and by, be that as it may, the programmed
era of preventative conduct alternately even end or shirking of basic employments does not appear to be normal.
Autonomous frameworks must have the adaptability to stop programs that could possibly prompt to mischief,
that utilization exorbitant assets, on the other hand that have all the earmarks of being in a halt
Example: redundant array of independent disks (RAID) Despite the fact that RAID models are intended to offer hearty, quick access to information put away in circle
clusters, alongside high unwavering quality, information are still lost. Very frequently misfortune comes about
because of the endeavor to benefit a plate failure. In theory, a circle disappointment ought to do no mischief,
since RAID clusters are intended to handle this possibility: the fizzled drive is hauled out and a decent one put
in. Be that as it may, every so often the administrator swaps out the wrong one, bringing about a moment
disappointment, and so information are lost. There are a few methodologies accessible to lessen information
misfortune. One is make the RAID safe, indeed, even with two disappointments (e.g., RAID-6).Asecond would
be to plan the interface better to limit such blunders. This approach is unmistakably better: the estimation of
effective human-PC cooperation is notable, though as well at times honed. In any case, the principal approach
includes some major disadvantages, in particular, expanded cost and loss of productivity. Here is the place the

Proceedings of the National Conference on
Trends and Advances in Mechanical Engineering
(TAME-2017) March 16-17, 2017 ISBN 978-93-5268-269-0
YMCA University of Science & Technology, Faridabad, Haryana
149
full of feeling framework would be helpful. Assume that the departure of a circle drive is distinguished at the
Reaction level and used to trigger an alarm: in pith, the framework would get to be "restless." Yes, the human
administrator would be summoned, yet here the Routine level would kick in, recovering past occasions where
benefit by the human administrator had prompted to expanded issues: this would serve to increment the
nervousness level. The aftereffect of this expanded nervousness would prompt to an operations change—to a
more moderate approach actualized by a change in arrangements. Since the edge of security has been brought
down, the framework could organize more successive checkpoint spares, maybe to a remote area (all things
considered, the RAID is no longer completely reliable), and maybe the framework could run a parallel shadow
operation or delay basic occupations. An option operation is rebuild the RAID on the travel to make it endure
further plate disappointment without harm, even at the cost of diminishing its ability on the other hand
moderating its operation. In other words, why ought to PC frameworks not have the capacity to carry on like
people who have turned out to be restless? They would be wary even while endeavoring to expel the cause.
With people, conduct gets to be more engaged; they have a tendency to take part in inside and out critical
thinking first until the cause and a fitting reaction are resolved. Whatever the reaction for machine frameworks,
some adjustment in typical conduct is required. Absence of caution is really a typical issue in mechanized
systems.21 The frameworks are very much outlined to work even on account of part disappointment, be that as
it may, they at times report these disappointments to more elevated amount frameworks or change their conduct.
Accordingly, the human administrator, or larger amount screens of the framework, might be ignorant that any
issues have happened despite the fact that mistake resilience is presently tremendously decreased. Once in a
while, further disappointments convey the framework over the edge of recoverability, regularly leaving the
human administrator to adapt to the subsequent startling crisis
Why utilize influence? Why not simply program the framework to defend itself against
issues?
For a particular issue that may emerge, once that issue is known and comprehended, the best arrangement will
dependably be to compose a suitable calculation to manage it. So why are we proposing the presentation of
another framework, that of effect? Why not just break down every potential disappointment and manage it
proficiently? Regularly, when pondering PC frameworks outline, we think as far as what in manmade
brainpower are alluded to as solid techniques, that is, strategies that adventure particular space information and
structure. In other words, we think as far as particular calculations that tackle particular issues by joining
considerable learning about the issue into the calculation. By complexity, powerless techniques and heuristics
don't join area learning since they are intended to be significantly more broad. The outcome is that they are for
the most part much slower, significantly less proficient, and frequently are not ensured to succeed. Feeble
techniques exchange effectiveness for all inclusive statement.
In this way, for instance, slope climbing is a powerless strategy that has awesome sweeping statement, however
is frequently wasteful and can get to be distinctly caught by nearby maxima. Solid strategies are constantly best
when the circumstances are known and comprehended and the earth unsurprising and generally constrained in
degree. Be that as it may at the point when these conditions don't hold, feeble techniques are ideal. Influence is a
computationally frail strategy. Its energy lies in its ability to help bargain with sudden issues, so it supplements
solid, algorithmic techniques by including heartiness in unforeseen circumstances. This present reality is
portrayed by vulnerability and fluctuation. For these cases, science utilizes powerless strategies—techniques
that are general and material to a wide assortment of circumstances.
As machines turn out to be more autonomous and more presented to instability, influence will turn into an
undeniably proper answer for them also. Science, obviously, is not without its solid strategies. Indeed, even
people with their huge brains have held various wired-in, proficient reactions to specific circumstances.
Reflexes and tropisms react quickly to specific jolt conditions, for example, absence of support, unbalance,
intense taste, the possess an aroma similar to rot, and hot or sharp surfaces. These reactions are fast, design
driven answers for particular classes of occasions. In any case, science additionally utilizes more unpredictable,
slower, intelligent critical thinking and wanting to manage novel circumstances. Along these lines, organic

Proceedings of the National Conference on
Trends and Advances in Mechanical Engineering
(TAME-2017) March 16-17, 2017 ISBN 978-93-5268-269-0
YMCA University of Science & Technology, Faridabad, Haryana
150
frameworks make quick reactions to circumstances that require them, and moderate, considered reactions when
conditions demand them and time licenses
Suggestions
A full of feeling PC would have the capacity to detect the condition of its own operations and that of its
condition. It is ready to contrast its conduct and its desires, and it is ready to reflect upon its own particular
operations. It would know about its own particular dependability and about that of the other frameworks with
which it cooperates, and it would be capable to adjust its general conduct toward better execution by detecting
things that are not presently taken into record, acting circumspectly where suitable and forcefully where
conceivable. It would consequently reconfigure itself to assess expanded hazard and would ceaselessly know
about the state of its own wellbeing, at any rate from a foundation and computational perspective. Wepropose
that by consistently detecting its own state and that of its condition, the framework would basically be
controlling its level of fulfillment or nervousness. At the point when segments required administration, the level
of tension would ascend, for the requirement for administration implies that blunder resiliences are brought
down and the very demonstration of administration can bring about blunders. Similarly as human administrators
know not to do framework upkeep or a product redesign amid or just before some basic employment needs to be
performed, so PC frameworks themselves ought to have a similar feeling of nervousness. Envision a lattice PC,
amassing various machines preceding doing a calculation. Assume that each machine were questioned about its
condition of status, basically asking "How are you feeling?" The scope of conceivable reactions given
underneath is enlightening:
"I had a plate disappointment in my RAID, so if this is an imperative figuring, you would be wise to not rely on
me."
"I am feeling somewhat on edge since I have had a few blunders, so I will be eased back by the need to do
continual checks." (This reaction demonstrates how a machine might give an evaluated level of administration.)
"I am feeling on edge as a result of late infection or programmer assaults." Creatures have created complex
components for making due in a flighty, dynamic world, coupling the examinations and assessments of effect to
strategies for balancing the general framework. The outcome is expanded heartiness and mistake resilience.
Fashioners of PC frameworks may benefit from their case.
References
1. D. A. Norman, “The ‘Problem’ of Automation: InappropriateFeedback and Interaction, Not ‘Over-Automation,’
” HumanFactors in Hazardous Situations, D. E. Broadbent, A. Baddeley, and J. T. Reason, Editors, Oxford
University Press,Oxford (1990), pp. 585–593
2. A. R. Damasio, Descartes’ Error: Emotion, Reason, and theHuman Brain, G. P. Putnam, New York (1994).
3. M. Minsky, The Emotion Machine, Pantheon, New York,forthcoming.
4. N. Frijda and J. Swagerman, “Can Computers Feel? Theoryand Design of an Emotional System,” Cognition &
Emotion1, No. 3, 235–257 (1987).
5. H. A. Simon, “Motivational and Emotional Controls of Cognition,”Psychological Review 74, 29–39 (1967).
6. A. Sloman and M. Croucher, “Why Robots Will Have Emotions,”Proceedings of the Seventh International
Conference onArtificial Intelligence (1981).
7. Originally presented at theIBMAutonomic Computing Summitat the Thomas J. Watson Research Center, May
14–15,2002.
8. D. A. Norman, A. Ortony, and W. Revelle, “Effective Functioning:A Three Level Model of Affect, Behavior,
and Cognition,”in Who Needs Emotions? The Brain Meets the Machine,J. M. Fellous and M. A. Arbib, Editors,
to be published.

Proceedings of the National Conference on
Trends and Advances in Mechanical Engineering
(TAME-2017) March 16-17, 2017 ISBN 978-93-5268-269-0
YMCA University of Science & Technology, Faridabad, Haryana
151
DESIRABILITY APPROACH IN RSM APPLIED TO SYMMETRICAL
MULTI LEAF SPRING
Vinkel Kumar Arora1*, Gian Bhushan
2, M.L. Aggarwal
3
1Department of Engineering, NIFTEM, HSIIDC, Kundli.-131028, Haryana, India
2Department of Mechanical Engineering, National Institute of Technology, Kurukshetra-136019, Haryana, India
3Department of Mechanical Engineering, YMCA University of Sci. & Tech., Faridabad-121006, Haryana, India
Abstract
A structural analysis tool SAT ver. 1.0 has been developed for the static and dynamic analysis of the
symmetrical multi leaf spring. The software has the capability to predict the individual leaf camber, overhang or
stepping, assembly camber, assembly and individual leaf weight, load deflection behaviour and the fatigue life
of the leaf spring. The software is based on the analytical approach specified by SAE spring design manual
approach. The stress induced, deflection and fatigue life is predicted by the SAT ver. 1.0 with a variation of 3%,
6% and 8.13% respectively. This tool is used to predict the effect of various factors like geometry (span and
width), material (ultimate tensile strength) and overall strength reduction factors on fatigue life of the leaf
spring. The DOE tool of the Design Expert software for designing the experiments. . The multiple regression
analysis in the response surface methodology (RSM) is used to propose the mathematical model for the fatigue
life of the multi leaf spring. The ANOVA is utilized to determine the significant terms and interactions. The
optimization of parameters is done for the maximization of the fatigue life of the leaf spring using the
desirability approach in RSM.
Keywords: SAT ver. 1.0, leaf spring, RSM
Introduction The experimental investigations to predict the effect of mechanical processing, strength reduction factor, design,
material and geometric tolerances on the fatigue life of a leaf spring is costly and time intensive process. A
mathematical model, which can predict the fatigue life of a multi leaf spring by considering the effect of these
factors and their interactions, will reduce the product development time and cost.
Yong-Hai & Qin-Man, (2011) established a multi objective optimization model of a multi leaf spring of a truck.
They used a multi-disciplinary optimization tool i-SIGHT and worked on genetic algorithm and NSGA-II based
on Pereto optimal concept. The redesign variables were length, width and thickness of the rectangular cross
section. The main objective was to minimize the weight of the leaf spring while keeping the stiffness closer to
the theoretical stiffness. Dhoshi et al., (2011) worked on the improvement of an existing leaf spring used in the
tractor trailer. They used analytical and finite element method to modify and improve the existing design
keeping the cost low. The geometric parameters like thickness and width were varied while keeping the load
carrying capacity intact. Gonzalez et al., (2011) proposed an adjustable stiffness actuator which consisted of two
antagonistic non-linear springs. The elastic device consisted of two pairs of leaf springs working in bending
conditions under large displacements. Owing to this geometric non-linearity, the global stiffness of the actuator
could be adjusted by modifying the shape of the leaf springs. A mathematical model was also developed to
predict the mechanical behaviour of the leaf spring. V. Arora et al., (2014) proposed various methods for the
fatigue life prediction of the multi leaf spring. The method which predicts the fatigue life close to the
experimental fatigue life was suggested.V. K. Arora et al., (2014) investigated the effect of assembly stresses on
the fatigue life of a leaf spring. They proposed a combination of individual leaf camber and stepping, so that the
stress in the leaves does not exceed maximum design stress. The theoretical fatigue life results were compared
with experimental results for validation. V. Arora et al., (2015) studied the effect of surface decarburization,
scragging stress and individual leaf camber on the fatigue life of the multi leaf spring. Park et al., (2015)
achieved the weight reduction of the suspension link by replacing steel with aluminium alloy without any
compromise on the factor of safety. They used the design of experiment approach to optimize the weight of the
suspension link by replacing STKM11A steel with aluminium alloy (A356). The effects of the stress and
stiffness on shape variations of the suspension link were also investigated and compared. V. K. Arora et al.,
(2015) investigated the method for precise estimation of individual leaf camber and stepping of the symmetrical
multi leaf spring. V. K. Arora et al., (2016) investigated the effect of variation of an individual factor ratio on
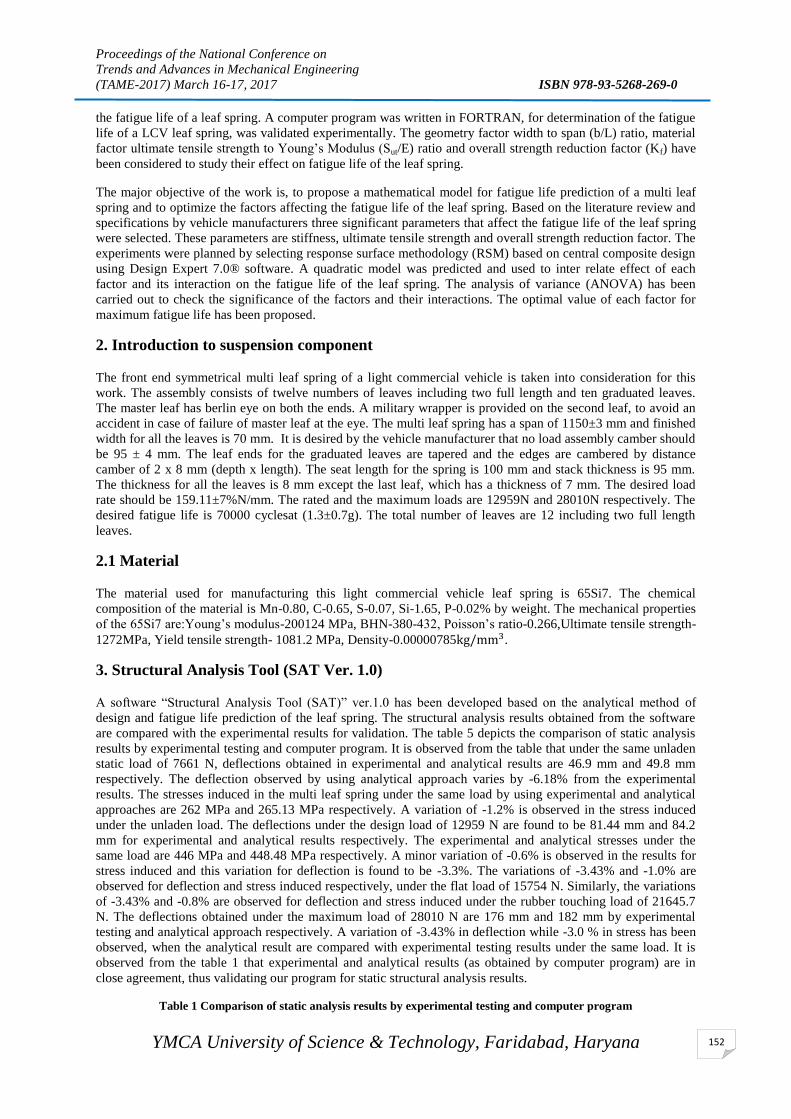
Proceedings of the National Conference on
Trends and Advances in Mechanical Engineering
(TAME-2017) March 16-17, 2017 ISBN 978-93-5268-269-0
YMCA University of Science & Technology, Faridabad, Haryana
152
the fatigue life of a leaf spring. A computer program was written in FORTRAN, for determination of the fatigue
life of a LCV leaf spring, was validated experimentally. The geometry factor width to span (b/L) ratio, material
factor ultimate tensile strength to Young’s Modulus (Sut/E) ratio and overall strength reduction factor (Kf) have
been considered to study their effect on fatigue life of the leaf spring.
The major objective of the work is, to propose a mathematical model for fatigue life prediction of a multi leaf
spring and to optimize the factors affecting the fatigue life of the leaf spring. Based on the literature review and
specifications by vehicle manufacturers three significant parameters that affect the fatigue life of the leaf spring
were selected. These parameters are stiffness, ultimate tensile strength and overall strength reduction factor. The
experiments were planned by selecting response surface methodology (RSM) based on central composite design
using Design Expert 7.0® software. A quadratic model was predicted and used to inter relate effect of each
factor and its interaction on the fatigue life of the leaf spring. The analysis of variance (ANOVA) has been
carried out to check the significance of the factors and their interactions. The optimal value of each factor for
maximum fatigue life has been proposed.
2. Introduction to suspension component
The front end symmetrical multi leaf spring of a light commercial vehicle is taken into consideration for this
work. The assembly consists of twelve numbers of leaves including two full length and ten graduated leaves.
The master leaf has berlin eye on both the ends. A military wrapper is provided on the second leaf, to avoid an
accident in case of failure of master leaf at the eye. The multi leaf spring has a span of 1150±3 mm and finished
width for all the leaves is 70 mm. It is desired by the vehicle manufacturer that no load assembly camber should
be 95 ± 4 mm. The leaf ends for the graduated leaves are tapered and the edges are cambered by distance
camber of 2 x 8 mm (depth x length). The seat length for the spring is 100 mm and stack thickness is 95 mm.
The thickness for all the leaves is 8 mm except the last leaf, which has a thickness of 7 mm. The desired load
rate should be 159.11±7%N/mm. The rated and the maximum loads are 12959N and 28010N respectively. The
desired fatigue life is 70000 cyclesat (1.3±0.7g). The total number of leaves are 12 including two full length
leaves.
2.1 Material
The material used for manufacturing this light commercial vehicle leaf spring is 65Si7. The chemical
composition of the material is Mn-0.80, C-0.65, S-0.07, Si-1.65, P-0.02% by weight. The mechanical properties
of the 65Si7 are:Young’s modulus-200124 MPa, BHN-380-432, Poisson’s ratio-0.266,Ultimate tensile strength-
1272MPa, Yield tensile strength- 1081.2 MPa, Density-0.00000785kg/mm3.
3. Structural Analysis Tool (SAT Ver. 1.0)
A software “Structural Analysis Tool (SAT)” ver.1.0 has been developed based on the analytical method of
design and fatigue life prediction of the leaf spring. The structural analysis results obtained from the software
are compared with the experimental results for validation. The table 5 depicts the comparison of static analysis
results by experimental testing and computer program. It is observed from the table that under the same unladen
static load of 7661 N, deflections obtained in experimental and analytical results are 46.9 mm and 49.8 mm
respectively. The deflection observed by using analytical approach varies by -6.18% from the experimental
results. The stresses induced in the multi leaf spring under the same load by using experimental and analytical
approaches are 262 MPa and 265.13 MPa respectively. A variation of -1.2% is observed in the stress induced
under the unladen load. The deflections under the design load of 12959 N are found to be 81.44 mm and 84.2
mm for experimental and analytical results respectively. The experimental and analytical stresses under the
same load are 446 MPa and 448.48 MPa respectively. A minor variation of -0.6% is observed in the results for
stress induced and this variation for deflection is found to be -3.3%. The variations of -3.43% and -1.0% are
observed for deflection and stress induced respectively, under the flat load of 15754 N. Similarly, the variations
of -3.43% and -0.8% are observed for deflection and stress induced under the rubber touching load of 21645.7
N. The deflections obtained under the maximum load of 28010 N are 176 mm and 182 mm by experimental
testing and analytical approach respectively. A variation of -3.43% in deflection while -3.0 % in stress has been
observed, when the analytical result are compared with experimental testing results under the same load. It is
observed from the table 1 that experimental and analytical results (as obtained by computer program) are in
close agreement, thus validating our program for static structural analysis results.
Table 1 Comparison of static analysis results by experimental testing and computer program
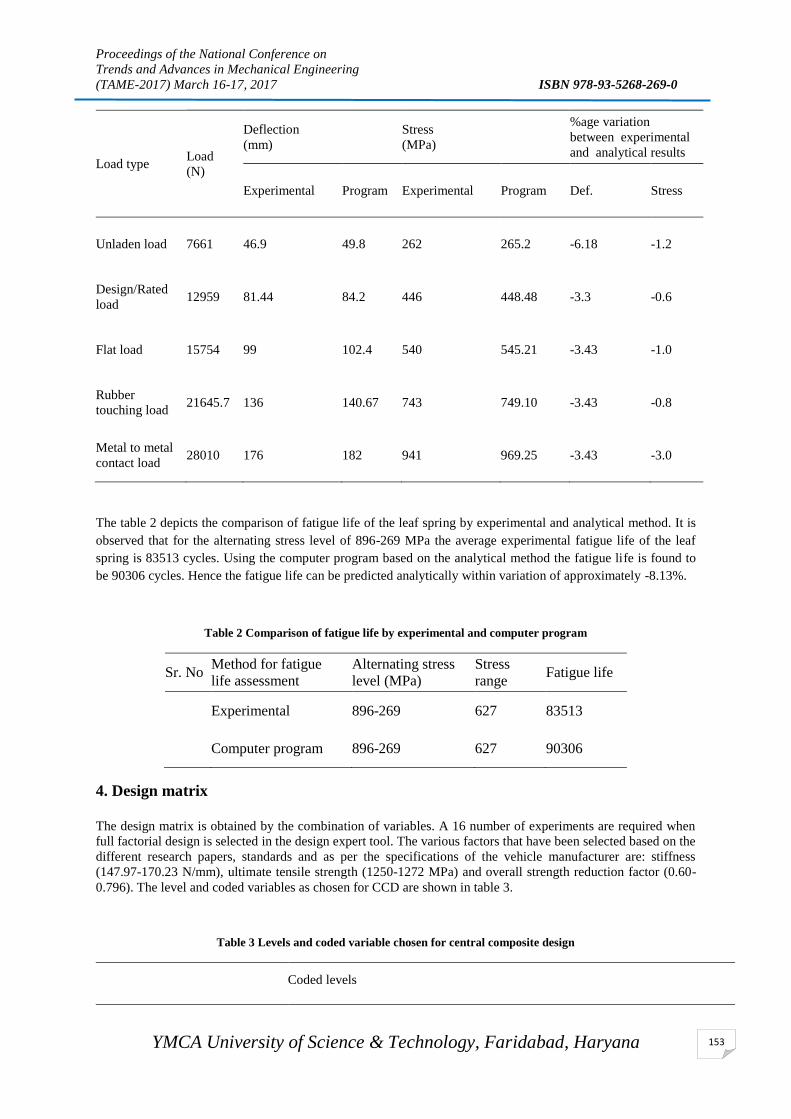
Proceedings of the National Conference on
Trends and Advances in Mechanical Engineering
(TAME-2017) March 16-17, 2017 ISBN 978-93-5268-269-0
YMCA University of Science & Technology, Faridabad, Haryana
153
Load type Load
(N)
Deflection
(mm)
Stress
(MPa)
%age variation
between experimental
and analytical results
Experimental Program Experimental Program Def. Stress
Unladen load 7661 46.9 49.8 262 265.2 -6.18 -1.2
Design/Rated
load 12959 81.44 84.2 446 448.48 -3.3 -0.6
Flat load 15754 99 102.4 540 545.21 -3.43 -1.0
Rubber
touching load 21645.7 136 140.67 743 749.10 -3.43 -0.8
Metal to metal
contact load 28010 176 182 941 969.25 -3.43 -3.0
The table 2 depicts the comparison of fatigue life of the leaf spring by experimental and analytical method. It is
observed that for the alternating stress level of 896-269 MPa the average experimental fatigue life of the leaf
spring is 83513 cycles. Using the computer program based on the analytical method the fatigue life is found to
be 90306 cycles. Hence the fatigue life can be predicted analytically within variation of approximately -8.13%.
Table 2 Comparison of fatigue life by experimental and computer program
Sr. No Method for fatigue
life assessment
Alternating stress
level (MPa)
Stress
range Fatigue life
1. Experimental 896-269 627 83513
2. Computer program 896-269 627 90306
4. Design matrix
The design matrix is obtained by the combination of variables. A 16 number of experiments are required when
full factorial design is selected in the design expert tool. The various factors that have been selected based on the
different research papers, standards and as per the specifications of the vehicle manufacturer are: stiffness
(147.97-170.23 N/mm), ultimate tensile strength (1250-1272 MPa) and overall strength reduction factor (0.60-
0.796). The level and coded variables as chosen for CCD are shown in table 3.
Table 3 Levels and coded variable chosen for central composite design
Coded levels
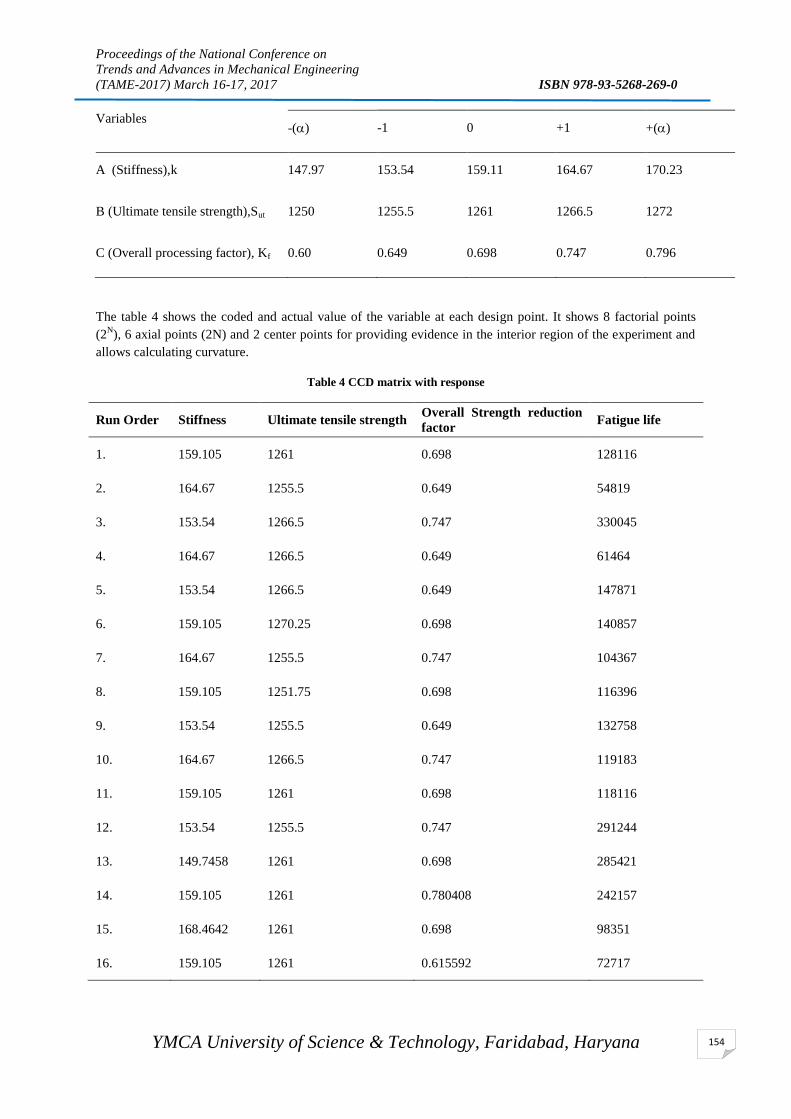
Proceedings of the National Conference on
Trends and Advances in Mechanical Engineering
(TAME-2017) March 16-17, 2017 ISBN 978-93-5268-269-0
YMCA University of Science & Technology, Faridabad, Haryana
154
Variables -() -1 0 +1 +()
A (Stiffness),k 147.97 153.54 159.11 164.67 170.23
B (Ultimate tensile strength),Sut 1250 1255.5 1261 1266.5 1272
C (Overall processing factor), Kf 0.60 0.649 0.698 0.747 0.796
The table 4 shows the coded and actual value of the variable at each design point. It shows 8 factorial points
(2N), 6 axial points (2N) and 2 center points for providing evidence in the interior region of the experiment and
allows calculating curvature.
Table 4 CCD matrix with response
Run Order Stiffness Ultimate tensile strength Overall Strength reduction
factor Fatigue life
1. 159.105 1261 0.698 128116
2. 164.67 1255.5 0.649 54819
3. 153.54 1266.5 0.747 330045
4. 164.67 1266.5 0.649 61464
5. 153.54 1266.5 0.649 147871
6. 159.105 1270.25 0.698 140857
7. 164.67 1255.5 0.747 104367
8. 159.105 1251.75 0.698 116396
9. 153.54 1255.5 0.649 132758
10. 164.67 1266.5 0.747 119183
11. 159.105 1261 0.698 118116
12. 153.54 1255.5 0.747 291244
13. 149.7458 1261 0.698 285421
14. 159.105 1261 0.780408 242157
15. 168.4642 1261 0.698 98351
16. 159.105 1261 0.615592 72717
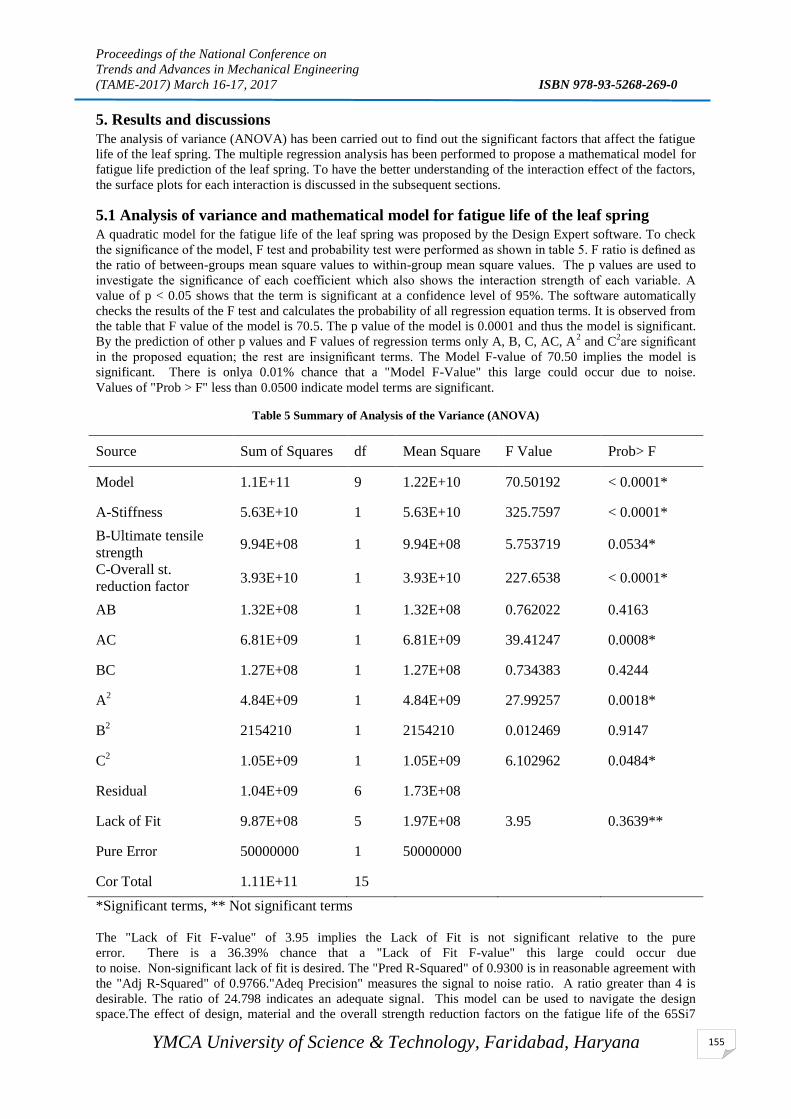
Proceedings of the National Conference on
Trends and Advances in Mechanical Engineering
(TAME-2017) March 16-17, 2017 ISBN 978-93-5268-269-0
YMCA University of Science & Technology, Faridabad, Haryana
155
5. Results and discussions
The analysis of variance (ANOVA) has been carried out to find out the significant factors that affect the fatigue
life of the leaf spring. The multiple regression analysis has been performed to propose a mathematical model for
fatigue life prediction of the leaf spring. To have the better understanding of the interaction effect of the factors,
the surface plots for each interaction is discussed in the subsequent sections.
5.1 Analysis of variance and mathematical model for fatigue life of the leaf spring
A quadratic model for the fatigue life of the leaf spring was proposed by the Design Expert software. To check
the significance of the model, F test and probability test were performed as shown in table 5. F ratio is defined as
the ratio of between-groups mean square values to within-group mean square values. The p values are used to
investigate the significance of each coefficient which also shows the interaction strength of each variable. A
value of p < 0.05 shows that the term is significant at a confidence level of 95%. The software automatically
checks the results of the F test and calculates the probability of all regression equation terms. It is observed from
the table that F value of the model is 70.5. The p value of the model is 0.0001 and thus the model is significant.
By the prediction of other p values and F values of regression terms only A, B, C, AC, A2 and C
2are significant
in the proposed equation; the rest are insignificant terms. The Model F-value of 70.50 implies the model is
significant. There is onlya 0.01% chance that a "Model F-Value" this large could occur due to noise.
Values of "Prob > F" less than 0.0500 indicate model terms are significant.
Table 5 Summary of Analysis of the Variance (ANOVA)
Source Sum of Squares df Mean Square F Value Prob> F
Model 1.1E+11 9 1.22E+10 70.50192 < 0.0001*
A-Stiffness 5.63E+10 1 5.63E+10 325.7597 < 0.0001*
B-Ultimate tensile
strength 9.94E+08 1 9.94E+08 5.753719 0.0534*
C-Overall st.
reduction factor 3.93E+10 1 3.93E+10 227.6538 < 0.0001*
AB 1.32E+08 1 1.32E+08 0.762022 0.4163
AC 6.81E+09 1 6.81E+09 39.41247 0.0008*
BC 1.27E+08 1 1.27E+08 0.734383 0.4244
A2 4.84E+09 1 4.84E+09 27.99257 0.0018*
B2 2154210 1 2154210 0.012469 0.9147
C2 1.05E+09 1 1.05E+09 6.102962 0.0484*
Residual 1.04E+09 6 1.73E+08
Lack of Fit 9.87E+08 5 1.97E+08 3.95 0.3639**
Pure Error 50000000 1 50000000
Cor Total 1.11E+11 15
*Significant terms, ** Not significant terms
The "Lack of Fit F-value" of 3.95 implies the Lack of Fit is not significant relative to the pure
error. There is a 36.39% chance that a "Lack of Fit F-value" this large could occur due
to noise. Non-significant lack of fit is desired. The "Pred R-Squared" of 0.9300 is in reasonable agreement with
the "Adj R-Squared" of 0.9766."Adeq Precision" measures the signal to noise ratio. A ratio greater than 4 is
desirable. The ratio of 24.798 indicates an adequate signal. This model can be used to navigate the design
space.The effect of design, material and the overall strength reduction factors on the fatigue life of the 65Si7

Proceedings of the National Conference on
Trends and Advances in Mechanical Engineering
(TAME-2017) March 16-17, 2017 ISBN 978-93-5268-269-0
YMCA University of Science & Technology, Faridabad, Haryana
156
leaf spring is predicted using RSM. The fatigue life obtained by varying these factors is indicated in the table 5
above. Based on the experimental data, multiple regression analysis has given the following second-order
polynomial equation:
Fatigue life = +1.99610E+007- 4490.76 * k - 27879.05* Sut -6.71888E+006 *Kf -132.53* k * Sut -
1.06988E+005 * k * Kf +14776.90 * Sut * Kf +737.75* k2+ 15.94* Sut
2 + 4.44326E+006 * Kf
2
6. Optimum value of parameters as predicted by RSM using desirability approach
In this method different solutions are obtained and the solution with the highest desirability is preferred. The
range of all the factors has been kept same except the overall strength reduction factor. The range of overall
strength reduction factor is taken as 0.600-0.649, it is due to the fact that increasing the value of overall strength
reduction factor will increase the manufacturing cost of the leaf spring. It was desired that the fatigue life of the
leaf spring should increase without any substantial increase in the manufacturing cost. A feasible solution was
proposed to increase the fatigue life of the leaf spring by increasing the manufacturing cost marginally. There
are 10 solutions generated for enhancement of fatigue life of the leaf spring. The optimum conditions are
predicted by applying numerical optimization of Design Expert software using RSM as shown in table 6. The
solution 1 with desirability 0.698 is selected. The optimal fatigue life predicted is 246878.
Table 6 Optimization of the factors based on desirability approach
Sol.
No
k
(A)
Sut
(B)
Kf
(C) Fatigue life Desirability
1 149 1272 0.65 246878.1 0.698 selected
Conclusions The effect of design, material and strength reduction factors and their interactions on the fatigue life of the
65Si7 leaf spring of a light commercial vehicle was investigated. The response surface methodology was used to
develop mathematical model for fatigue life prediction of the leaf spring. Consequently, the developed model
was utilized for the enhancement of fatigue life of the leaf spring using the desirability approach. The results of
optimization were validated by carrying out confirmatory experiments. From the present study, the following
inference can be drawn:
The response surface methodology may be used to develop mathematical model for fatigue life prediction of the
leaf spring. Consequently, the developed model has been utilized for the enhancement of fatigue life of the leaf
spring using the desirability approach. The optimum combinations of the factors to get this fatigue life are:
stiffness=149 N/mm, ultimate tensile strength=1272 MPa and overall strength reduction factor= 0.698.
References Arora, V., Bhushan, G., & Aggarwal, M. L. (2014). Fatigue life prediction of leaf springs in automotive vehicles
using CAE tools Vinkel Arora * Gian Bhushan. International Journal of Computer Aided Engineering and
Technology, 6(3), 271–292.
Arora, V., Bhushan, G., & Aggarwal, M. L. (2015). Effect of surface decarburisation , scragging stress and
individual leaf camber on fatigue life of 65Si7 leaf springs Vinkel Kumar Arora * Gian Bhushan. International
Journal of Design Engineering, Vol., 2(2).
Arora, V. K., Bhushan, G., & Aggarwal, M. L. (2014). Effect of assembly stresses on fatigue life of symmetrical
65Si7 leaf springs. International Scholarly Research Notices, 2014(1), 1–11.
Arora, V. K., Bhushan, G., & Aggarwal, M. L. (2015). Precise estimation of individual leaf camber and stepping
in symmetrical 65Si7 leaf springs. Journal of the Brazilian Society of Mechanical Sciences and Engineering, 1–
13.

Proceedings of the National Conference on
Trends and Advances in Mechanical Engineering
(TAME-2017) March 16-17, 2017 ISBN 978-93-5268-269-0
YMCA University of Science & Technology, Faridabad, Haryana
157
Arora, V. K., Bhushan, G., & Aggarwal, M. L. (2016). Effect of geometry , material and strength reduction
factor on the fatigue Life of the symmetrical leaf spring. International Journal of Advance Materials
Manufacturing & Characterization, 6(1), 51–57.
Dhoshi, N. P., Ingole, N. K., & Gulhane, U. D. (2011). Analysis and Modification of Leaf Spring of Tractor
Trailer Using Analytical and Finite Element Method. International Journal of Modern Engineering Research
(IJMER), 1(2), 719–722. Retrieved from http://www.ijmer.com/papers/vol 1 issue 2/BP012719722.pdf
Gonzalez, R. A., Chacon, J. M., Donoso, A., & Gonzalez, R. A. G. (2011). Design of an adjustable-stiffness
spring: Mathematical modeling and simulation, fabrication and experimental validation. Mechanism and
Machine Theory, 43(12), 1970–1979.
Park, J. H., Kim, K. J., Lee, J. W., & Yoon, J. K. (2015). Light-weight design of automotive suspension link
based on design of experiment. International Journal of Automotive Technology, 16(1), 66–71.
Yong-Hai, W., & Qin-Man, F. (2011). Multi-objective optimization design of multi-piece leaf springs based on
Pareto. International Conference on Computer Science and Education, Final Program and Proceedings, (Iccse),
445–448. http://doi.org/10.1109/ICCSE.2011.6028675
Proceedings of the National Conference on
Trends and Advances in Mechanical Engineering
(TAME-2017) March 16-17, 2017 ISBN 978-93-5268-269-0
YMCA University of Science & Technology, Faridabad, Haryana
158
ISSUES RELATED WITH CELLULAR MANUFACTURING SYSTEM
Sanjay kumar1, Vasdev Malhotra
2, Vikas Kumar
3
1Research Scholar,
2Associate Professor,
3Professor, Department of Mechanical Engineering YMCAUST,
Faridabad, Haryana, India E-mail : [email protected],
Abstract
This paper presents a brief note on introduction of issues that overcomes the previously and presently (in
developing and underdeveloped nations) used traditional manufacturing for meeting customers demand which
has got a new direction since the industrial revolution has emerged. The nature of customer’s demands has
changed; it is very dynamic in nature. Ever changing demands of customers has become a major problem for
traditional manufacturing organizations. Unlike before, the manufacturing needs to be flexible so that it can
respond quickly and profitably to demands of customers. Various companies following traditional
manufacturing system failed to satisfy the global and dynamic market. This forced the researches to come up
with new technique which is flexible and capable of responding pro-actively to demands of customers, this
technique is called cellular manufacturing.
Keywords: Cellular Manufacturing, Issues, Dynamic, Market
1. Introduction
The customer demands change continuously is creating a requirement for new technology of manufacturing
systems. In order to survive in competitive and dynamic markets, Industries should have sufficient flexibility to
produce a range of products on the same platform (Datta et.al. 1992). In this way, cellular manufacturing
systems are required to scrutinize economical background as well as engineering concerns; without it they will
not be able to get a remarkable share of competitive market to prove their investments. cellular manufacturing
systems (CMSs) are fabricated to continuously produce different product families in the shortest time and with
different machine cells at the lowest cost without compromising with the quality (Ahuja and Khamba, 2008).
The major characteristic of such systems is called flexibility, which is the ability of manufacturing and changing
manufacturing items directed at tailoring the new environmental and technological changes. Similarly,
manufacturing flexibility has shortly become a new solvent principle along with humanistic objectives such as
low cost and high quality (Sundharam et al., 2013).
There are various issues described by many researchers and scientists in the field of cellular manufacturing for
detailed and systematic description of cellular manufacturing. And with the help of these issues, one can
implement cellular manufacturing techniques step by step in traditional manufacturing organisation and can
achieve flexibility in well planned and systematic manner. There are various scientists who want to provide a
firm structure for future works in the field of cellular manufacturing. The literature available on cellular
manufacturing has been classified based on the nature and the focus of cellular manufacturing enablers which
include criteria such as strategies, technologies, systems and people. A classification scheme based on the nature
and application of the models is proposed for easy understanding of the research work on Cellular
manufacturing. (Gunasekaran et al.1999)
Soon after the the principles of cellular manufacturing were formalized, several researchers have identified the
criteria that would establish cellular manufacturing environment. Most of these researchers enumerated
management oriented criteria for attaining flexibilty in organisation. Some researchers have enumerated both
management and technology oriented criteria for effecting flexibilty in organisation .keeping these contributions
as the basis, the conceptual characteristics of cellular manufacturing paradigm are depicted (Wemmerlov &
Hyer, 1987).
2. Issues related to cellular manufacturing System
From thecontributions of the researchers, twenty criteria were drawn to design the twenty criteria cellular
manufacturing system. The issues are as follows:

Proceedings of the National Conference on
Trends and Advances in Mechanical Engineering
(TAME-2017) March 16-17, 2017 ISBN 978-93-5268-269-0
YMCA University of Science & Technology, Faridabad, Haryana
159
Organisational structure: It describes the flow of responsibility at various
level in organisation.
Flexibility: It describes the range of production means how many parts can be produced with same set up.
Devolution of authority : It describes the there should not be rigid set of rules for each level so that each ones
ideas can be listened.
Manufacturing set-ups : It tells about the machines set-up and workplace layout.
Quality-It tells about the quality of products and services.
Productivity-It gives information of productivity of an organisation.
Employee’s status-This criterion tells about the knowledge and skills of employee.
Employee Training : This is the programme under which skills of the employees are enhanced.
Employee’s involvement-It tells about up to what extent employees are ideas and suggestions are considered in
organisation.
Nature of management-It tells about the rules and regulations of an organisation under which the management
design it policies.
Customer response adoption –It tells about the response of an organisation towards customer feedback,
complaints and suggestions.
Product life cycle-It tells about the life span of the product without failures.
Product service life-It tells about the operating condition of the product and how much time is taken for its
restoration of the product after its failure during its life span.
Design improvement –It tells about the improvement in design of product with time.
Production methodology-It tells about whether the components of the product are manufactured within the
organisation or brought from outside (other manufacturing plant).
Manufacturing planning-It tells about the planning for manufacturing of the product with consideration of cost
of bill of material.
Cost management-It tells about the management of cost of raw material and various operations performed for
obtaining finished product.
Automation type-It tells about the manufacturing automation use of work shop for product manufacturing.
Change in business process-This criterion tells up to what extent any change in business can be incorporated in
the organisation.
Time management-It tells about the time management in various activities in an organisation

Proceedings of the National Conference on
Trends and Advances in Mechanical Engineering
(TAME-2017) March 16-17, 2017 ISBN 978-93-5268-269-0
YMCA University of Science & Technology, Faridabad, Haryana
160
3. Comparision Of Traditional And Cellular Organisation
A bird eye view of this model can be had by pursuing the contents of Table 1. As this table also distinguish
between the activities carried out in traditional and cellular manufacturing companies.
Table 1: Comparison of Traditional and Cellular Manufacturing Company
Criteri
on no.
Criterion Traditional manufacturing company Cellular manufacturing company
1 Organisational
structure
Vertical, Traditional and line
organisation
Flattened, and team managed
organisation
2 Flexibility Very Poor flexibility Flexible and easily collapsible
manufacturing set-ups which can
quickly respond to the changes.
3 Devolution of
authority
Lack of empowerment, centralised and
informal authority
Self-autonomous and empowered
authorities
4 Manufacturing set-
ups
Rigid and long lasting manufacturing
set-ups which are intolerable to changes.
Flexible and easily collapsible
manufacturing set-ups which can
quickly respond to the changes.
5 Quality Customer satisfaction is the target Customer delight is the target
6 Productivity Stagnant productivity with no reasonable
evaluation and improvement
Rapid increase in productivity with
practically feasible evaluation,
productivity and quality are
integrated
7 Employee’s status Existence of specialists. Employees are
not exposed to other functions and skills.
Employees are inflexible and ignorant to
changes.
Learning employees, multi-skilled
and multi-functional and self
committed
8 Employee Training Employees training is not or scarily
provided
Employee training is provided in
regular interval of time as per
requirments
9 Employees
involvement
Very little involvement of employees in
decision making. Ideas and knowledge of
employees are seldom shared or utilised.
Fully empowered employees, ideas
and knowledge of employees are
fully utilised
10 Nature of
management
Autocratic and stagnant style of
management.
Participation based management
which is susceptible to changes and
improvements.
11 Customers response
adoption
Customer response adoption takes place
very slowly due to beauracracy
Very fast and 100% response
achieved
12 Product life cycle Products produced have long life span
but frequent failures and ineffective
operations are encountered
Produced products have short life
span but are free from failures and
are effectively operated.

Proceedings of the National Conference on
Trends and Advances in Mechanical Engineering
(TAME-2017) March 16-17, 2017 ISBN 978-93-5268-269-0
YMCA University of Science & Technology, Faridabad, Haryana
161
13 Product service life In case of failure of products it takes
long time to repair. thus these products
have long mean down time (MDT)
In case of failure of products it
takes very little time to restore the
status que. Thus, these products
have no or short MDT.
14 Design improvement Design improvement is very rarely
practised. Generally only modifications
are made to the existing design.
Design improvement is very
frequently and systematically
practised by conducting
experiment.
15 Production
methodology
Production is dominated by internal
manufacturing.
Production is dominated by main
assembly of components, external
manufacturing and outsourcing.
16 Manufacturing
planning
Manufacture planning is carried out for a
long period which is cost ineffective in
nature.
Manufacturing planning is carried
for short period with the focus to
adopt just in time (JIT) purchase
with zero or little capital
investment.
17 Cost management Traditional costing procedure is adopted
(with classification namely prime and
overhead cost).
Cost is managed using activity,
strategy, quality and productivity
based costing system.
18 Automation type Direct and rigid automation is adopted. Flexible, smart and adaptable
automation is adopted.
19 Change in business
process
Very difficult to incorporate change in
business processes, it is a almost
impossible task.
The flexible set-up enables to effect
changes in business processes
economically and quickly.
20 Time management Time is managed very efficiently. Time is managed very efficiently.
4. CONCLUSION
Cellular manufacturing has been able to successfully satisfy the dynamic demands of customers over the period
of time. Many of the organisations have adopted cellular manufacturing and have been benefited by it in every
possible ways. The philosophy of cellular manufacturing is dynamic and it’s touching every aspect of
organisation from management to production floor, quality to customer relation. Cellular manufacturing has
provided organisations a platform to excel and react proactively to demands of customers.
Though, there are organisations which are not completely suitable because of this reason implementation of
cellular manufacturing is not possible. Surely, the dynamic nature of customer needs and innovation driven
technology is going to force such organisation in coming years to adopt cellular manufacturing.
REFERENCES
1. Ahuja, I.P.S. and Khamba, J.S. 2008 ‘Total productive maintenance – literature review and directions’,
International Journal of Quality and Reliability Management, Vol. 25, No. 7, pp. 709–756.
2. Datta, V., Samasivarao, K.V., Rambabu, K. and Deshmukh, S.G. 1992. ‘Multi-attribute decision model using
the AHP for justification of manufacturing systems’, International Journal of Production Economics, Vol. 28,
pp.227–234.

Proceedings of the National Conference on
Trends and Advances in Mechanical Engineering
(TAME-2017) March 16-17, 2017 ISBN 978-93-5268-269-0
YMCA University of Science & Technology, Faridabad, Haryana
162
3. Gunasekaran,A.(1999) ‘Agile manufacturing: A framework for research and development’, International
Journal of Production Economics, vol. 62 pp. 87-105.
4. Sundharam, V.N., Sharma, V. and Thangaiah, I.S.S. 2013 ‘An integration of BSC and AHP for sustainable
growth of manufacturing industries’, International Journal of Business Excellence, Vol. 6, No. 1, pp.77–92.
5. Wemmerlov, U. & Hyer, N. 1987, “Research Issues in Cellular manufacturing”, International Journal of
Production Research, Vol. 25 No.3, pp.413-431.

Proceedings of the National Conference on
Trends and Advances in Mechanical Engineering
(TAME-2017) March 16-17, 2017 ISBN 978-93-5268-269-0
YMCA University of Science & Technology, Faridabad, Haryana
163
STUDY ON MECHANICAL BEHAVIOR OF PARTICULATE
REINFORCED ALUMINUM MATRIX COMPOSITES DEVELOPED
BY STIR CASTING ROUTE
Dhairya Pratap Singh1, Sudhir Kumar
2, Vikram Singh
3
1 Research Scholar, Department of Mechanical Engineering, YMCAUST, Faridabad (H.R), India
2 Professor, Department of Mechanical Engineering, GNIoT, Greater Noida (UP), India 3 Professor, Department of Mechanical Engineering, YMCAUST, Faridabad (HR), India
*corresponding author e-mail: [email protected]
Abstract Aluminum 7075 alloy with SiC Metal Matrix Composite constitutes a good engineering material as widely used
in the automobile and aerospace industry for the manufacturing of different parts and components, due to its
high strength to weight ratio, high stiffness, high hardness, wear resistance, high temperature resistance etc.
Objective of this work is the fabrication, microstructural investigations and analysis of mechanical properties
of AA7075–SiCp Metal Matrix Composite. The stir casting method was used for fabrication of 7075 aluminum
alloy with 5 and 10 wt.% SiC particles of size 20-40 μm. The optical microstructure revealed a homogenous
distribution of SiC particles which were well bonded with the aluminum matrix. The mechanical properties of
the composite is increase with increasing silicone carbide particles as compared to unreinforced alloy.
Keywords: Microstructure, Tensile test, Hardness test,7075 Al alloy, Metal Matrix Composites (MMC’s).
1.Introduction Metal matrix Composite are made from two or more constituent materials with significantly different physical
or chemical properties that when combined, produce a material with characteristics different from the individual
components. Composite materials are generally used for buildings, bridges and structures such as boat hulls,
automobile bodies and air craft bodies etc. Silicon carbide particles used as reinforcement have been
considered as an excellent structural materials in the aeronautic–aerospace transport, the automotive industry,
because of their excellent combination of low density and high thermal conductivity. Metal–matrix composites
are conventionally fabricated using different techniques such as power metallurgy, squeeze casting, and the stir
casting. Stir casting is very cost effective technique, Powder metallurgy is expensive. An inherent difficulty
encountered in the fabrication of SiC–Al alloy composites is that the molten Al alloys normally do not wet
considerably the ceramic reinforcements. It is well known that the SiC reinforcements tend to react with
aluminum during processing, leading to the formation of Al4C3 and Si at the interface. Efforts have been
directed to prevent the chemical reaction at interfaces by oxidation of SiC, coating of SiCp, or alloying of Al
matrix with Mg or Si.
2.Literature Review
Aluminium metal matrix composites are one of the potentially attractive class of materials and are useful for
structural, and transportation applications. Metal matrix composites (MMCs) are the combination of metal and
reinforcement. Aluminum, magnesium, and titanium are the common matrix metals with characteristics such as
light weight and high temperature resistance. The typical reinforcing ceramics are Al2O3, SiC, and B4C. These
can be used as long fibers, short whiskers, or particles in either an irregular or spherical shape [1-2]. The
fabrication techniques vary considerably depending upon the choice of matrix and the reinforcement material.
Among the variety of manufacturing processes available for discontinuous MMC production, stir casting is
generally accepted [3]. Mechanical properties of the composites are mainly depended on the appropriate
selection of the process parameters of the casting. Most significant process parameters of the stir casting process
like molten temperature of the base matrix alloy, rotating speed of the stirrer, preheating temperature of the
reinforcement particles etc. In this paper, the AA7075 matrix metal is melted in a graphite crucible in an
induction type electric furnace. The preheated reinforcement particles AIN and 2wt.% of Mg[4]. Kalkani and
Yilmaz investigated the squeeze casting of aluminum alloy 7075 reinforced with 10, 15, and 20 wt.% SiC
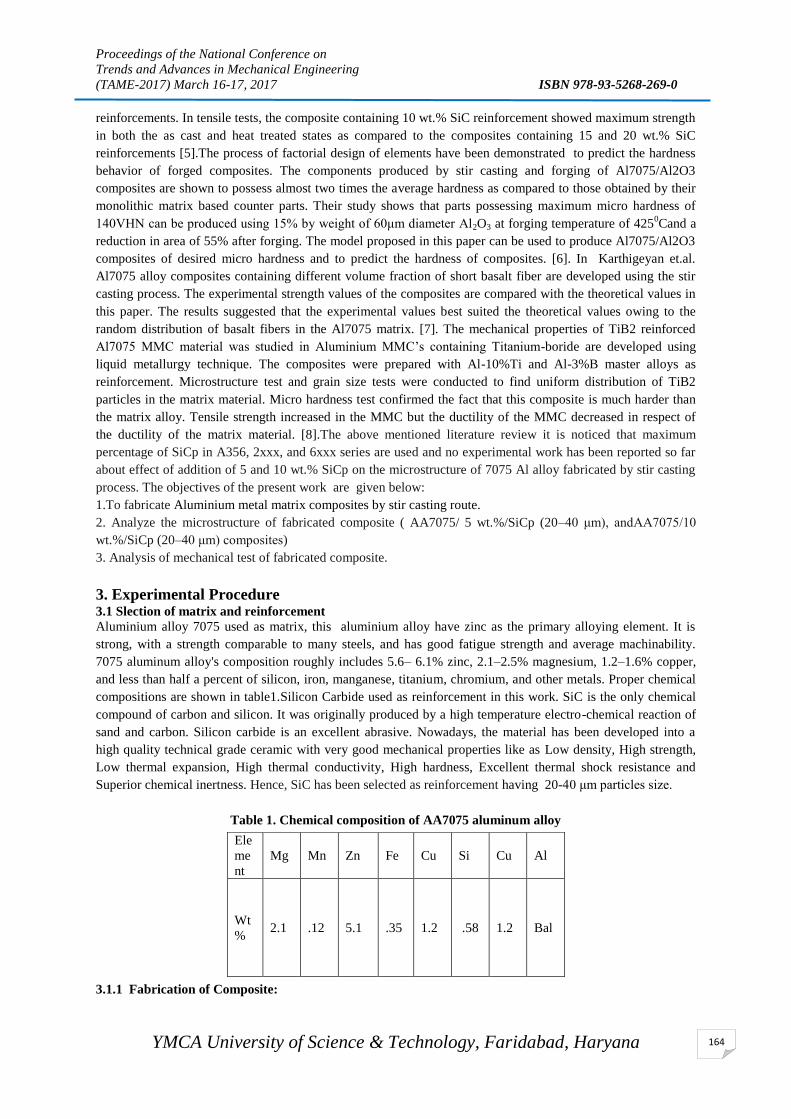
Proceedings of the National Conference on
Trends and Advances in Mechanical Engineering
(TAME-2017) March 16-17, 2017 ISBN 978-93-5268-269-0
YMCA University of Science & Technology, Faridabad, Haryana
164
reinforcements. In tensile tests, the composite containing 10 wt.% SiC reinforcement showed maximum strength
in both the as cast and heat treated states as compared to the composites containing 15 and 20 wt.% SiC
reinforcements [5].The process of factorial design of elements have been demonstrated to predict the hardness
behavior of forged composites. The components produced by stir casting and forging of Al7075/Al2O3
composites are shown to possess almost two times the average hardness as compared to those obtained by their
monolithic matrix based counter parts. Their study shows that parts possessing maximum micro hardness of
140VHN can be produced using 15% by weight of 60μm diameter Al2O3 at forging temperature of 4250Cand a
reduction in area of 55% after forging. The model proposed in this paper can be used to produce Al7075/Al2O3
composites of desired micro hardness and to predict the hardness of composites. [6]. In Karthigeyan et.al.
Al7075 alloy composites containing different volume fraction of short basalt fiber are developed using the stir
casting process. The experimental strength values of the composites are compared with the theoretical values in
this paper. The results suggested that the experimental values best suited the theoretical values owing to the
random distribution of basalt fibers in the Al7075 matrix. [7]. The mechanical properties of TiB2 reinforced
Al7075 MMC material was studied in Aluminium MMC’s containing Titanium-boride are developed using
liquid metallurgy technique. The composites were prepared with Al-10%Ti and Al-3%B master alloys as
reinforcement. Microstructure test and grain size tests were conducted to find uniform distribution of TiB2
particles in the matrix material. Micro hardness test confirmed the fact that this composite is much harder than
the matrix alloy. Tensile strength increased in the MMC but the ductility of the MMC decreased in respect of
the ductility of the matrix material. [8].The above mentioned literature review it is noticed that maximum
percentage of SiCp in A356, 2xxx, and 6xxx series are used and no experimental work has been reported so far
about effect of addition of 5 and 10 wt.% SiCp on the microstructure of 7075 Al alloy fabricated by stir casting
process. The objectives of the present work are given below:
1.To fabricate Aluminium metal matrix composites by stir casting route.
2. Analyze the microstructure of fabricated composite ( AA7075/ 5 wt.%/SiCp (20–40 μm), andAA7075/10
wt.%/SiCp (20–40 μm) composites)
3. Analysis of mechanical test of fabricated composite.
3. Experimental Procedure 3.1 Slection of matrix and reinforcement
Aluminium alloy 7075 used as matrix, this aluminium alloy have zinc as the primary alloying element. It is
strong, with a strength comparable to many steels, and has good fatigue strength and average machinability.
7075 aluminum alloy's composition roughly includes 5.6– 6.1% zinc, 2.1–2.5% magnesium, 1.2–1.6% copper,
and less than half a percent of silicon, iron, manganese, titanium, chromium, and other metals. Proper chemical
compositions are shown in table1.Silicon Carbide used as reinforcement in this work. SiC is the only chemical
compound of carbon and silicon. It was originally produced by a high temperature electro-chemical reaction of
sand and carbon. Silicon carbide is an excellent abrasive. Nowadays, the material has been developed into a
high quality technical grade ceramic with very good mechanical properties like as Low density, High strength,
Low thermal expansion, High thermal conductivity, High hardness, Excellent thermal shock resistance and
Superior chemical inertness. Hence, SiC has been selected as reinforcement having 20-40 μm particles size.
Table 1. Chemical composition of AA7075 aluminum alloy
3.1.1 Fabrication of Composite:
Ele
me
nt
Mg Mn Zn Fe Cu Si Cu Al
Wt
% 2.1 .12 5.1 .35 1.2 .58 1.2 Bal
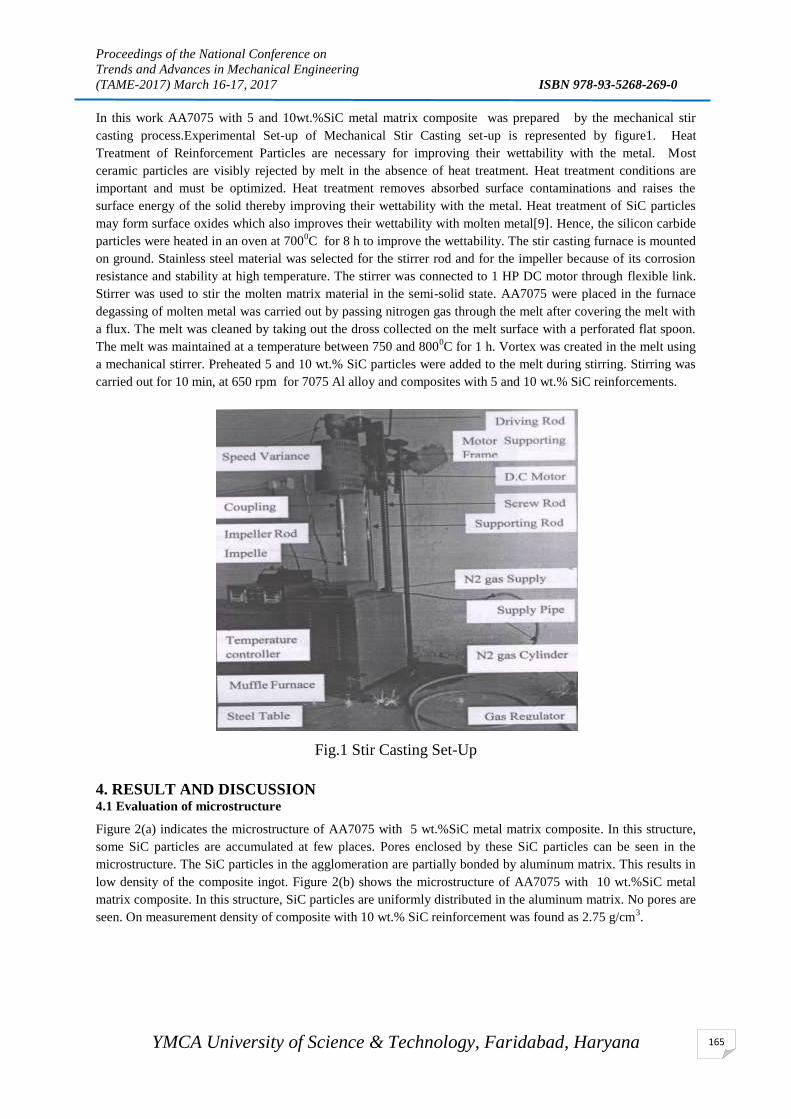
Proceedings of the National Conference on
Trends and Advances in Mechanical Engineering
(TAME-2017) March 16-17, 2017 ISBN 978-93-5268-269-0
YMCA University of Science & Technology, Faridabad, Haryana
165
In this work AA7075 with 5 and 10wt.%SiC metal matrix composite was prepared by the mechanical stir
casting process.Experimental Set-up of Mechanical Stir Casting set-up is represented by figure1. Heat
Treatment of Reinforcement Particles are necessary for improving their wettability with the metal. Most
ceramic particles are visibly rejected by melt in the absence of heat treatment. Heat treatment conditions are
important and must be optimized. Heat treatment removes absorbed surface contaminations and raises the
surface energy of the solid thereby improving their wettability with the metal. Heat treatment of SiC particles
may form surface oxides which also improves their wettability with molten metal[9]. Hence, the silicon carbide
particles were heated in an oven at 7000C for 8 h to improve the wettability. The stir casting furnace is mounted
on ground. Stainless steel material was selected for the stirrer rod and for the impeller because of its corrosion
resistance and stability at high temperature. The stirrer was connected to 1 HP DC motor through flexible link.
Stirrer was used to stir the molten matrix material in the semi-solid state. AA7075 were placed in the furnace
degassing of molten metal was carried out by passing nitrogen gas through the melt after covering the melt with
a flux. The melt was cleaned by taking out the dross collected on the melt surface with a perforated flat spoon.
The melt was maintained at a temperature between 750 and 8000C for 1 h. Vortex was created in the melt using
a mechanical stirrer. Preheated 5 and 10 wt.% SiC particles were added to the melt during stirring. Stirring was
carried out for 10 min, at 650 rpm for 7075 Al alloy and composites with 5 and 10 wt.% SiC reinforcements.
Fig.1 Stir Casting Set-Up
4. RESULT AND DISCUSSION 4.1 Evaluation of microstructure
Figure 2(a) indicates the microstructure of AA7075 with 5 wt.%SiC metal matrix composite. In this structure,
some SiC particles are accumulated at few places. Pores enclosed by these SiC particles can be seen in the
microstructure. The SiC particles in the agglomeration are partially bonded by aluminum matrix. This results in
low density of the composite ingot. Figure 2(b) shows the microstructure of AA7075 with 10 wt.%SiC metal
matrix composite. In this structure, SiC particles are uniformly distributed in the aluminum matrix. No pores are
seen. On measurement density of composite with 10 wt.% SiC reinforcement was found as 2.75 g/cm3.

Proceedings of the National Conference on
Trends and Advances in Mechanical Engineering
(TAME-2017) March 16-17, 2017 ISBN 978-93-5268-269-0
YMCA University of Science & Technology, Faridabad, Haryana
166
SiC particle (a)
(b)
4.1.1 Tensile strength
Fig.3(a) shows the graphical representation of tensile strength of AA7075 alloy and AA7075/SiC composites. It
can be observed that tensile strength shows increasing trend with increasing wt. percentage of SiC particulates.
This increase was observed from 151MPa for AA7075 alloy to 324 MPa at 10% of reinforced composite. The
tensile strength of the composites increases slightly with increasing the wt. percentages of SiC particles. This
could be due the AA7075 aluminum alloy and silicon carbide have different thermal expansion coefficients. As
a result, strain fields are created around SiC particles during solidification of the AMCs. The propagation cracks
during tensile loading encounters resi stance due to the interaction between dislocations and the SiC particles.
The detachment of SiC particles is delayed due to the presence of a clean and sharp interface and better
interfacial bonding. Therefore, ultimate tensile strength of the composites is improved [10]. Fig.2(a,b). Optical
microstructures of cast AA7075-SiC composites: (a) 5% SiCp and (b) 10% SiCp.
4.1.2 Hardness
Fig.3(b) shows relation between wt.% of SiCp and hardness of fabricated composites. It is observed that macro
hardness of the aluminum matrix composites increased by appropriate increment of SiC particles [11]. The hard
SiC particles was added, it can refine the grain structure of the matrix and also act as the obstacles to the
movement of dislocation. Therefore, hardness is improved. The result of macrohardness of the composite
material is much higher than that of its base metal.
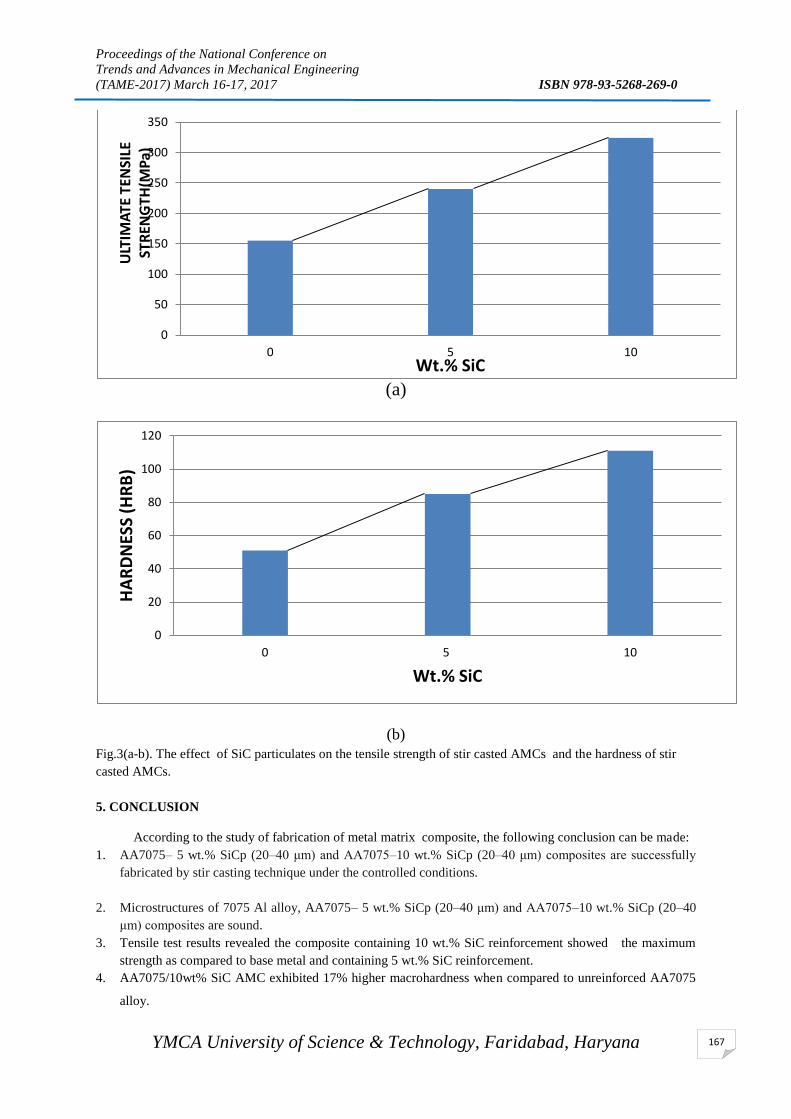
Proceedings of the National Conference on
Trends and Advances in Mechanical Engineering
(TAME-2017) March 16-17, 2017 ISBN 978-93-5268-269-0
YMCA University of Science & Technology, Faridabad, Haryana
167
(a)
(b)
Fig.3(a-b). The effect of SiC particulates on the tensile strength of stir casted AMCs and the hardness of stir
casted AMCs.
5. CONCLUSION
According to the study of fabrication of metal matrix composite, the following conclusion can be made:
1. AA7075– 5 wt.% SiCp (20–40 μm) and AA7075–10 wt.% SiCp (20–40 μm) composites are successfully
fabricated by stir casting technique under the controlled conditions.
2. Microstructures of 7075 Al alloy, AA7075– 5 wt.% SiCp (20–40 μm) and AA7075–10 wt.% SiCp (20–40
μm) composites are sound.
3. Tensile test results revealed the composite containing 10 wt.% SiC reinforcement showed the maximum
strength as compared to base metal and containing 5 wt.% SiC reinforcement.
4. AA7075/10wt% SiC AMC exhibited 17% higher macrohardness when compared to unreinforced AA7075
alloy.
0
50
100
150
200
250
300
350
0 5 10
ULT
IMA
TE T
ENSI
LE
STR
ENG
TH
(MP
a)
Wt.% SiC
0
20
40
60
80
100
120
0 5 10
HA
RD
NES
S (H
RB
)
Wt.% SiC
Proceedings of the National Conference on
Trends and Advances in Mechanical Engineering
(TAME-2017) March 16-17, 2017 ISBN 978-93-5268-269-0
YMCA University of Science & Technology, Faridabad, Haryana
168
5. The ductility of the composite was found to be slightly lower than that of aluminium 7075 alloy.
References:
1.XUE jing, Wang Jun, HAN Yan-feng, CHEN Chong and SUN Bao-de, “Behavior of CeO2 additive in-situ
TiB2 particles reinforced 2014 Al alloy composite”, Transactions of Nonferrous Metal Society of China, Vol.
22, No. 5, May 2012, pp: 1012-1017.
2. T. Clyne and P. Withers, An Introduction to Metal Matrix Composites, Cambridge Solid State Science Series,
Cambridge University Press,1995, p 1–10
3. Y.H. Seo and C.G. Kang, Effects of Hot Extrusion Through a Curved Die on the Mechanical Properties of
SiCp/Al Composites Fabricated by Melt Stirring, Compos. Sci. Technol., 1999, 59, p 643–654
4.Nassaj, E.T, Kobashi, M., and Choh, T., “Fabrication of an AlN particulate aluminium matrix composite by a
melt stirring method”, Scripta Metallurgica et Materialia, Vol. 32, No. 12, June 1995, pp: 1923-1929.
5.A. Kalkanh and S. Yilmaz, Synthesis and Characterization of Aluminium Alloy 7075 Reinforced with
Silicon Carbide Particulates, Mater. Design, 2008, 29, p 741–756
6.Indumati.B.Deshmanya and G.K. Purohit, “Prediction of hardness of forged Al7075/Al2O3 composites using
factorial design of experiments”, International Journal of Engineering Research and Applications,Vol. 2, Issue
1, pp. 84-90,2012.
7. R. Karthigeyan, G. Ranganath and S. Sankaranarayanan, “Mechanical properties and microstructure studies
of Aluminium (7075) alloy matrix composite reinforced with short Basalt Fibre”, European Journal of
Scientific Research, Vol. 68. No. 4, pp. 606-615, 2012.
8.B.M. Ravi Kumar, S.N. Harishand B.M. Preetha, “Study on mechanical properties of TiB2 reinforced Al7075
metal matrix composite material”, International Journal of Advanced Scientific and Technical Research, Vol. 4,
Issue 3, pp. 429-434, 2013.
9. V. Agarwal and D. Dixit, Fabrication of Aluminium Base Composite by Foundry Technique, Trans. Jpn. Inst.
Metall., 1981, 22(8), p 521–526
10.Michael Rajan, H.B., Rambalan, S., Dinaharan, I., andVijay, S.J., “Synthesis and characterization of in situ
formed titanium diboride particulate reinforced AA7075 aluminum alloy cast composites”, Materials & Design,
Vol. 44, February 2013, pp: 438-445.
11.Veeresh Kumar, G.B., Rao, C.S.P.,and Selvaraj, N.,“Studies on mechanical and dry sliding wear of Al6061-
SiC composites”, Composite Part- B, Vol. 43, No. 3, April 2012, pp: 1185- 1191.
Proceedings of the National Conference on
Trends and Advances in Mechanical Engineering
(TAME-2017) March 16-17, 2017 ISBN 978-93-5268-269-0
YMCA University of Science & Technology, Faridabad, Haryana
169
STRESS ANALYSIS FOR DIFFERENT MATERIAL ON DOUBLE
HELICAL GEAR
Apoorv Saxena1, Easwar Ram S.
2, Vineet Kumar
3
1Student, Mechanical and Automation Engineering, G B Pant Govt Engineering College, Okhla, New Delhi. 2Student,Mechanical and Automation Engineering, G B Pant Govt Engineering College, Okhla, New Delhi
3Asst. Professor, Mechanical and Automation Engineering, G B Pant Govt Engineering College, Okhla,New
Delhi.
Abstract
The work is intended to focus upon the stress analysis of double helical gears for different material. Gears being
one of the prime components involved in the power transmission process are subjected to failure because of the
bending and surface stresses incurred at their teeth which causes a surface fatigue failure known as pitting. The
specific category of gear systems selected for the work is the double helical gears, wherein the FEA analysis has
been carried out to determine the stresses so induced at the time of meshing of gears with involute profile in the
commonly used materials for gear which are EN24, Aluminium bronze and chromium stainless steel. 3D
modeling and analysis have been performed to determine the contact stresses on finite element software
packages (Ansys). The results have been then compared for different materials.
Keywords: double helical gears, EN24, Aluminum bronze, chromium stainless steel, stress
Introduction Gears mesh with one another and transmit torque and power, in other words, meshing of the gear teeth permit
motion transmission or alter the change in speed or direction.Gear drives are more prominent in various
industries like automobile, marine and aviation more than belt or chain drives because of their wider range of
operating torque, better load holding capacities and longer design lives. To achieve better overall efficiency out
of the gear drive, the transmission system needs to be more effective which is achieved by using reliable and
light weight gears.
Gear failure occurs primarily due to bending and pitting of gear teeth. Bending failure occurs when the bending
loads are large, and is determined via comparison of theoretically and experimentally obtained fatigue values
within working limits. When the surface of gear is subjected to repeated contact stresses of high magnitudes
while transmitting power, pitting of gear tooth takes place. In machine design, failures are observed when two
members having curved surfaces deform on pressing against one another thus exposing the patch area to the
compressive stresses.
However, on considering the downsides of employing single helical gears, it is observed that these gears tend to
exert undesired axial forces on the shaft to which they are attached. These axial forces produce unwanted thrust
on the end bearings.In order to eliminate these axial forces, there is a requirement of another equal and opposite
force in the axial direction to nullify the undesired forces. This is achieved by having another single helical gear
whose helix is the mirror image profile of the former gear. Such unison of two single helical gears of same
module, pitch circle diameter, number of teeth but opposite hand of helix forms a double helical gear. The axial
forces exerted by the two helices of the double helical gear are balanced, thus nullifying the overall axial thrust.
This results in higher capacities of power transmission. The drawbacks are the sophisticated manufacturing
processes involved and the time consumed by the process. Also, double helical gears are slightly heavier than
single helical gears.
Helical gears are normally preferred to work under heavy load efficiently. When silent operation or functioning
such as in automobile applications, helical gears are preferred as such gears work silently and smoothly.Areas of
applications of helical gears are very large but below are the few applications where helical gears are preferred
to use-
1. Helical gears are used in fertilizer industries, Printing industries and earth moving industries 2. Helical gears are also used in steel, Rolling mills, section rolling mills, power and port industries.

Proceedings of the National Conference on
Trends and Advances in Mechanical Engineering
(TAME-2017) March 16-17, 2017 ISBN 978-93-5268-269-0
YMCA University of Science & Technology, Faridabad, Haryana
170
3. Helical gears are also used in textile industries, plastic industries, food industries, conveyors, elevators,
blowers, compressors, oil industries & cutters.
The properties of the different materials which are commonly used in the manufacturing of gears which are
chromium stainless steel, aluminium bronze, EN 24 are compared in the following table.
Table1: Material properties
EN 24 Chromium Stainless steel Aluminium Bronze
Elastic Modulus(N/m2) 2.05e+11 2e+11 1.1e+11
Poisson’s Ratio 0.285 0.28 0.3
Shear Modulus(N/m2) 8e+10 7.7e+10 4.3e+10
Mass Density(kg/m3) 7850 7800 7400
Yield Strength(N/m2) 470000000 172339000 275742000
The 3D model of the gear has been analysed for the stresses involved while loading the double helical gears, and
its variations with respect to the design parameters of the gear including helix angle, face width, etc.
Deva Ganesh et al. (2015)studied that the meshing between two gears contact stresses are evolved, which are
determined by using analyzing software called ANSYS. Finding stresses has become most popular in research
on gears to minimize the vibrations, bending stresses and also reducing the mass percentage in gears. These
stresses are used to find the optimum design in the gears which reduces the chances of failure. The model is
generated by using Catia and ANSYS is used for numerical analysis. The analytical study is based on Hertz,s
equation. Study is conducted by varying the geometrical profile of the teeth and to find the change in contact
stresses between gears. It is therefore observed that more contact stresses are obtained in modified gears. Both
the results calculated using ANSYS and compared according to the given moment of inertia.
Sarfraz Ali N. Quadri and Dhananjay R. Dolas (2015)experimented an attempt to summarize about stresses
developed in a mating spur gear which has involute teeth. A pair of spur gears are taken from a lathe gear box
and progressed onward to calculate stresses. Conventionally the analysis is carried out analytically using Lewis
formulae and then Finite Element Analysis is used for the same. Some stress relieving features have been
incorporated in the teeth to know their effect on the stress concentrations. A finite element model of teeth is
considered for analysis and geometrical features of various sizes are introduced at various locations and their
effect is analyzed.
Experimental Setup Table 2: Dimensions for helical gear
The following steps were gone through while modeling and analysis of the gear
Step 1: Model the gears as per the dimensions and making assembly of two gears to make one reduction stage
using Solid Works.
Constraint Value
No. of teeth o small gear 17
No. of teeth on large gear 52
Pitch Diameter for large gear(mm) 234
Pitch Diameter for small gear(mm) 675
Module 12
Pressure Angle 20
Helix Angle 15
Face Width(mm) 100
Width of gear(mm) 229
Shaft bore diameter(mm) 75
Torque transmitted(N-m) 156000
No of nodes(mesh) 111706
No of elements(mesh) 65466

Proceedings of the National Conference on
Trends and Advances in Mechanical Engineering
(TAME-2017) March 16-17, 2017 ISBN 978-93-5268-269-0
YMCA University of Science & Technology, Faridabad, Haryana
171
Step 2: The 3D model was imported in Ansys Workbench.
Step 3: Material Property was defined in Engineering Data in Ansys Workbench.
Step 4: Frictional contact was specified between the faces of the gears mating each other and the shaft bore.
Step 5: The shaft bore of small gear was fixed and moment was applied at shaft bore of large gear. A moment of
156,000 N-m was applied at shaft bore.
Step 5: Analysis solution was performed and stress values were checked for the gears. Von Misses stress and
total deformation was used to compare the results.
Step 6: The gear geometry was modified in Solid Works and all the steps from Step 1 to Step 6 were performed
again for different material and were then compared.
Fig 1:Small gear Fig 2: Large gear
Fig 3: Gear in mesh Fig 4:Boundary conditions
Fig 5: Von-mises stress distribution and deformation for chromium stainless steel
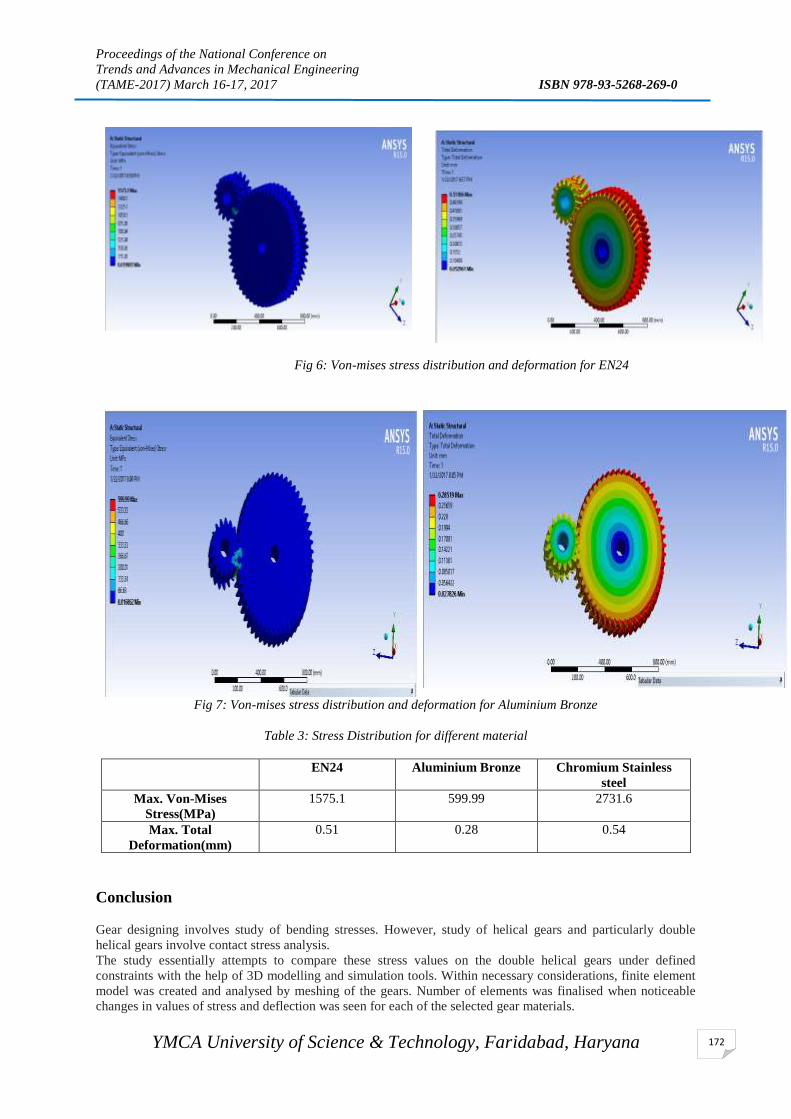
Proceedings of the National Conference on
Trends and Advances in Mechanical Engineering
(TAME-2017) March 16-17, 2017 ISBN 978-93-5268-269-0
YMCA University of Science & Technology, Faridabad, Haryana
172
Fig 6: Von-mises stress distribution and deformation for EN24
Fig 7: Von-mises stress distribution and deformation for Aluminium Bronze
Table 3: Stress Distribution for different material
EN24 Aluminium Bronze Chromium Stainless
steel
Max. Von-Mises
Stress(MPa)
1575.1 599.99 2731.6
Max. Total
Deformation(mm)
0.51 0.28 0.54
Conclusion
Gear designing involves study of bending stresses. However, study of helical gears and particularly double
helical gears involve contact stress analysis.
The study essentially attempts to compare these stress values on the double helical gears under defined
constraints with the help of 3D modelling and simulation tools. Within necessary considerations, finite element
model was created and analysed by meshing of the gears. Number of elements was finalised when noticeable
changes in values of stress and deflection was seen for each of the selected gear materials.
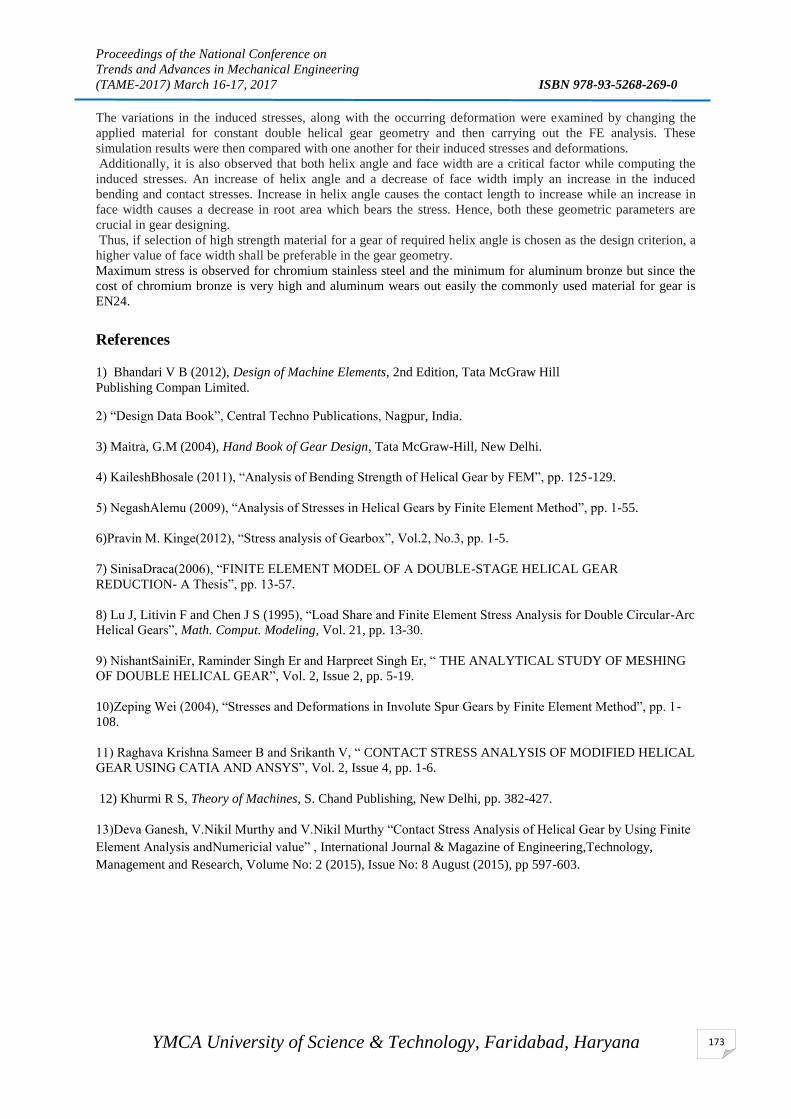
Proceedings of the National Conference on
Trends and Advances in Mechanical Engineering
(TAME-2017) March 16-17, 2017 ISBN 978-93-5268-269-0
YMCA University of Science & Technology, Faridabad, Haryana
173
The variations in the induced stresses, along with the occurring deformation were examined by changing the
applied material for constant double helical gear geometry and then carrying out the FE analysis. These
simulation results were then compared with one another for their induced stresses and deformations.
Additionally, it is also observed that both helix angle and face width are a critical factor while computing the
induced stresses. An increase of helix angle and a decrease of face width imply an increase in the induced
bending and contact stresses. Increase in helix angle causes the contact length to increase while an increase in
face width causes a decrease in root area which bears the stress. Hence, both these geometric parameters are
crucial in gear designing.
Thus, if selection of high strength material for a gear of required helix angle is chosen as the design criterion, a
higher value of face width shall be preferable in the gear geometry.
Maximum stress is observed for chromium stainless steel and the minimum for aluminum bronze but since the
cost of chromium bronze is very high and aluminum wears out easily the commonly used material for gear is
EN24.
References
1) Bhandari V B (2012), Design of Machine Elements, 2nd Edition, Tata McGraw Hill
Publishing Compan Limited.
2) “Design Data Book”, Central Techno Publications, Nagpur, India.
3) Maitra, G.M (2004), Hand Book of Gear Design, Tata McGraw-Hill, New Delhi.
4) KaileshBhosale (2011), “Analysis of Bending Strength of Helical Gear by FEM”, pp. 125-129.
5) NegashAlemu (2009), “Analysis of Stresses in Helical Gears by Finite Element Method”, pp. 1-55.
6)Pravin M. Kinge(2012), “Stress analysis of Gearbox”, Vol.2, No.3, pp. 1-5.
7) SinisaDraca(2006), “FINITE ELEMENT MODEL OF A DOUBLE-STAGE HELICAL GEAR
REDUCTION- A Thesis”, pp. 13-57.
8) Lu J, Litivin F and Chen J S (1995), “Load Share and Finite Element Stress Analysis for Double Circular-Arc
Helical Gears”, Math. Comput. Modeling, Vol. 21, pp. 13-30.
9) NishantSainiEr, Raminder Singh Er and Harpreet Singh Er, “ THE ANALYTICAL STUDY OF MESHING
OF DOUBLE HELICAL GEAR”, Vol. 2, Issue 2, pp. 5-19.
10)Zeping Wei (2004), “Stresses and Deformations in Involute Spur Gears by Finite Element Method”, pp. 1-
108.
11) Raghava Krishna Sameer B and Srikanth V, “ CONTACT STRESS ANALYSIS OF MODIFIED HELICAL
GEAR USING CATIA AND ANSYS”, Vol. 2, Issue 4, pp. 1-6.
12) Khurmi R S, Theory of Machines, S. Chand Publishing, New Delhi, pp. 382-427.
13)Deva Ganesh, V.Nikil Murthy and V.Nikil Murthy “Contact Stress Analysis of Helical Gear by Using Finite
Element Analysis andNumericial value” , International Journal & Magazine of Engineering,Technology,
Management and Research, Volume No: 2 (2015), Issue No: 8 August (2015), pp 597-603.
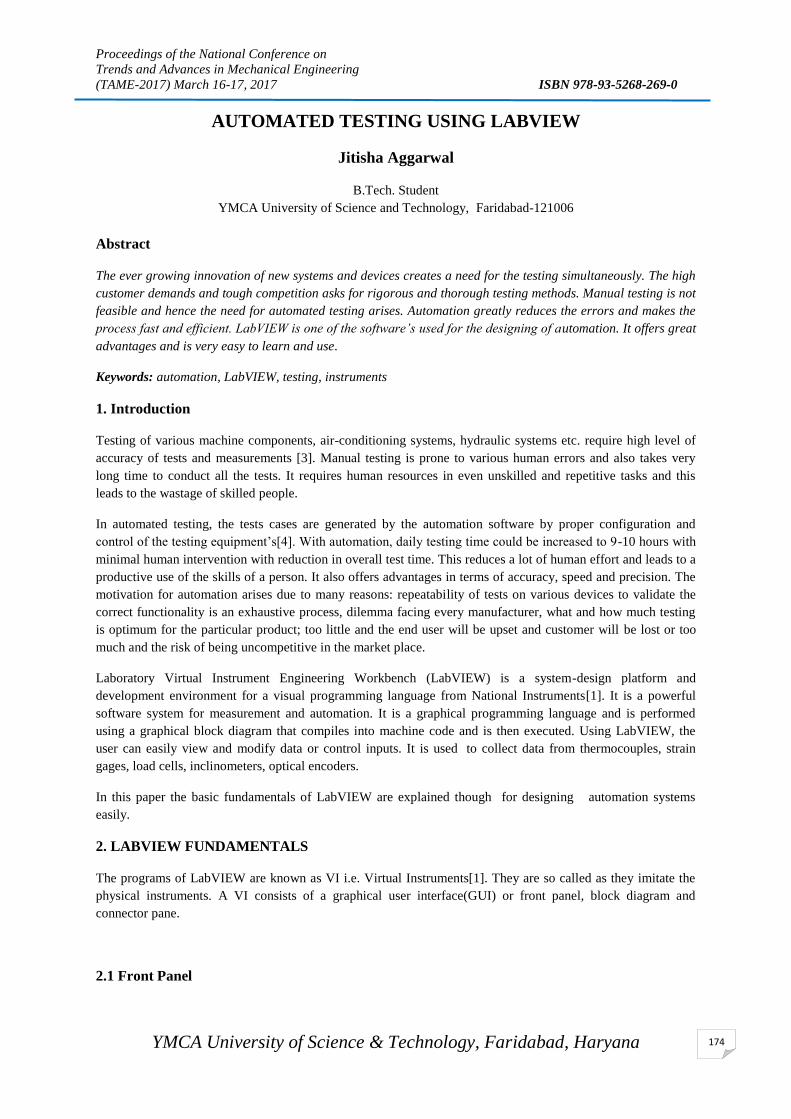
Proceedings of the National Conference on
Trends and Advances in Mechanical Engineering
(TAME-2017) March 16-17, 2017 ISBN 978-93-5268-269-0
YMCA University of Science & Technology, Faridabad, Haryana
174
AUTOMATED TESTING USING LABVIEW
Jitisha Aggarwal
B.Tech. Student
YMCA University of Science and Technology, Faridabad-121006
Abstract
The ever growing innovation of new systems and devices creates a need for the testing simultaneously. The high
customer demands and tough competition asks for rigorous and thorough testing methods. Manual testing is not
feasible and hence the need for automated testing arises. Automation greatly reduces the errors and makes the
process fast and efficient. LabVIEW is one of the software’s used for the designing of automation. It offers great
advantages and is very easy to learn and use.
Keywords: automation, LabVIEW, testing, instruments
1. Introduction
Testing of various machine components, air-conditioning systems, hydraulic systems etc. require high level of
accuracy of tests and measurements [3]. Manual testing is prone to various human errors and also takes very
long time to conduct all the tests. It requires human resources in even unskilled and repetitive tasks and this
leads to the wastage of skilled people.
In automated testing, the tests cases are generated by the automation software by proper configuration and
control of the testing equipment’s[4]. With automation, daily testing time could be increased to 9-10 hours with
minimal human intervention with reduction in overall test time. This reduces a lot of human effort and leads to a
productive use of the skills of a person. It also offers advantages in terms of accuracy, speed and precision. The
motivation for automation arises due to many reasons: repeatability of tests on various devices to validate the
correct functionality is an exhaustive process, dilemma facing every manufacturer, what and how much testing
is optimum for the particular product; too little and the end user will be upset and customer will be lost or too
much and the risk of being uncompetitive in the market place.
Laboratory Virtual Instrument Engineering Workbench (LabVIEW) is a system-design platform and
development environment for a visual programming language from National Instruments[1]. It is a powerful
software system for measurement and automation. It is a graphical programming language and is performed
using a graphical block diagram that compiles into machine code and is then executed. Using LabVIEW, the
user can easily view and modify data or control inputs. It is used to collect data from thermocouples, strain
gages, load cells, inclinometers, optical encoders.
In this paper the basic fundamentals of LabVIEW are explained though for designing automation systems
easily.
2. LABVIEW FUNDAMENTALS
The programs of LabVIEW are known as VI i.e. Virtual Instruments[1]. They are so called as they imitate the
physical instruments. A VI consists of a graphical user interface(GUI) or front panel, block diagram and
connector pane.
2.1 Front Panel

Proceedings of the National Conference on
Trends and Advances in Mechanical Engineering
(TAME-2017) March 16-17, 2017 ISBN 978-93-5268-269-0
YMCA University of Science & Technology, Faridabad, Haryana
175
The front panel is the user interface. The user inserts various values, selects the tests to be performed, how to be
performed and observes the measurement values in this front panel. The front panel consists of various
indicators, buttons, text fields, knobs etc[2]. Running a VI runs it and abort execution button immediately stops
the VI without any time lag. The front panel offers various options for designing (figure 1).
Figure 1.Front panel palette
A sample GUI is shown(figure 2) in which several text fields, push buttons and check boxes are used to enter
the values and select specific options from the user.
Figure 2.Sample GUI
2.2 Block Diagram
The block diagrams accompany the program for the front panel. Once you build your frontpanel, now you can
include code using graphical representations of functions (it is availableon block diagram panel) to control the
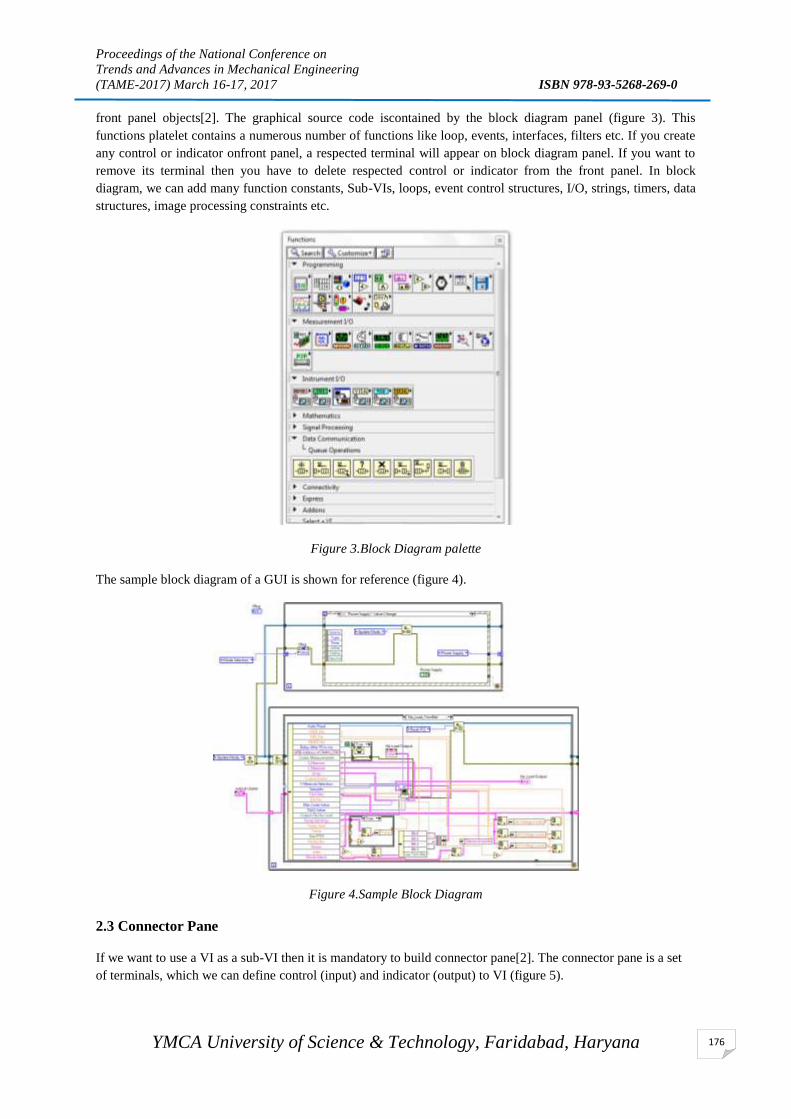
Proceedings of the National Conference on
Trends and Advances in Mechanical Engineering
(TAME-2017) March 16-17, 2017 ISBN 978-93-5268-269-0
YMCA University of Science & Technology, Faridabad, Haryana
176
front panel objects[2]. The graphical source code iscontained by the block diagram panel (figure 3). This
functions platelet contains a numerous number of functions like loop, events, interfaces, filters etc. If you create
any control or indicator onfront panel, a respected terminal will appear on block diagram panel. If you want to
remove its terminal then you have to delete respected control or indicator from the front panel. In block
diagram, we can add many function constants, Sub-VIs, loops, event control structures, I/O, strings, timers, data
structures, image processing constraints etc.
Figure 3.Block Diagram palette
The sample block diagram of a GUI is shown for reference (figure 4).
Figure 4.Sample Block Diagram
2.3 Connector Pane
If we want to use a VI as a sub-VI then it is mandatory to build connector pane[2]. The connector pane is a set
of terminals, which we can define control (input) and indicator (output) to VI (figure 5).
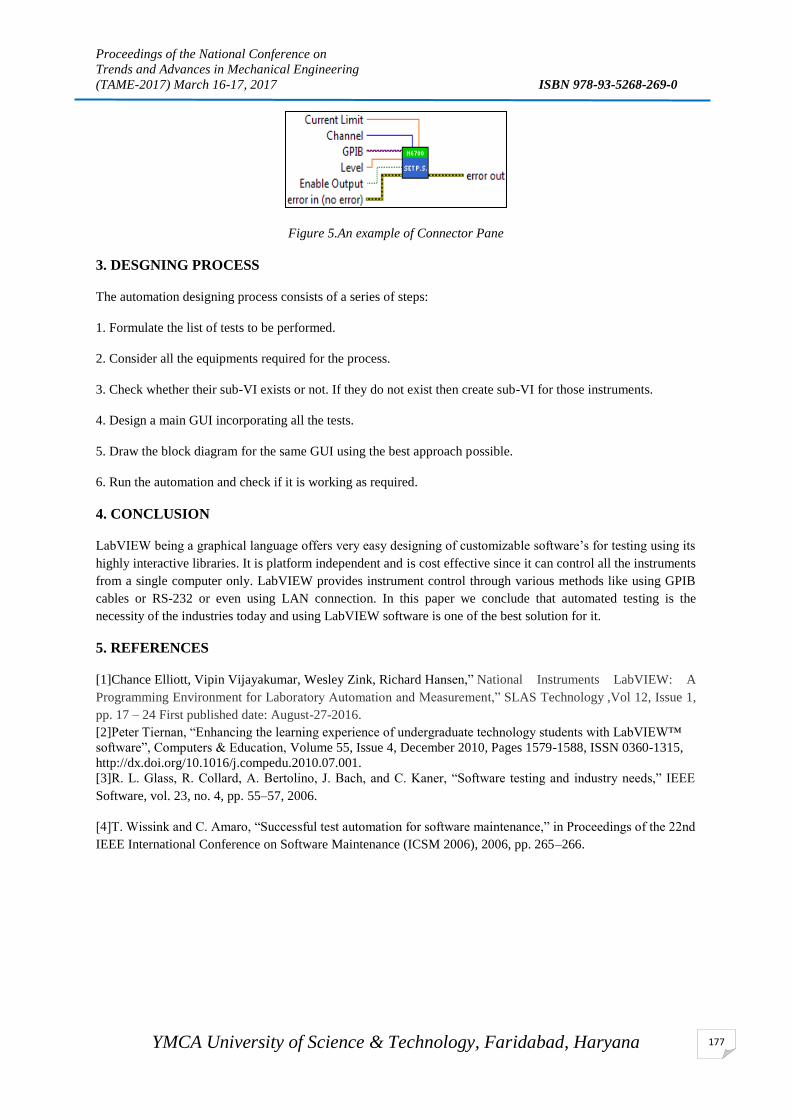
Proceedings of the National Conference on
Trends and Advances in Mechanical Engineering
(TAME-2017) March 16-17, 2017 ISBN 978-93-5268-269-0
YMCA University of Science & Technology, Faridabad, Haryana
177
Figure 5.An example of Connector Pane
3. DESGNING PROCESS
The automation designing process consists of a series of steps:
1. Formulate the list of tests to be performed.
2. Consider all the equipments required for the process.
3. Check whether their sub-VI exists or not. If they do not exist then create sub-VI for those instruments.
4. Design a main GUI incorporating all the tests.
5. Draw the block diagram for the same GUI using the best approach possible.
6. Run the automation and check if it is working as required.
4. CONCLUSION
LabVIEW being a graphical language offers very easy designing of customizable software’s for testing using its
highly interactive libraries. It is platform independent and is cost effective since it can control all the instruments
from a single computer only. LabVIEW provides instrument control through various methods like using GPIB
cables or RS-232 or even using LAN connection. In this paper we conclude that automated testing is the
necessity of the industries today and using LabVIEW software is one of the best solution for it.
5. REFERENCES
[1]Chance Elliott, Vipin Vijayakumar, Wesley Zink, Richard Hansen,” National Instruments LabVIEW: A
Programming Environment for Laboratory Automation and Measurement,” SLAS Technology ,Vol 12, Issue 1,
pp. 17 – 24 First published date: August-27-2016.
[2]Peter Tiernan, “Enhancing the learning experience of undergraduate technology students with LabVIEW™
software”, Computers & Education, Volume 55, Issue 4, December 2010, Pages 1579-1588, ISSN 0360-1315,
http://dx.doi.org/10.1016/j.compedu.2010.07.001.
[3]R. L. Glass, R. Collard, A. Bertolino, J. Bach, and C. Kaner, “Software testing and industry needs,” IEEE
Software, vol. 23, no. 4, pp. 55–57, 2006.
[4]T. Wissink and C. Amaro, “Successful test automation for software maintenance,” in Proceedings of the 22nd
IEEE International Conference on Software Maintenance (ICSM 2006), 2006, pp. 265–266.
Proceedings of the National Conference on
Trends and Advances in Mechanical Engineering
(TAME-2017) March 16-17, 2017 ISBN 978-93-5268-269-0
YMCA University of Science & Technology, Faridabad, Haryana
178
IMPLEMENTATION OF GROUP TECHNOLOGY IN THE FIELD OF
CELLULAR MANUFACTURING: A REVIEW
Prince Deshwal
M.Tech. Student ,Department of Mechanical Engineering, YMCA University of Science & Technology,
Faridabad , 121006, India. e-mail: [email protected], 8607972358(M).
Abstract
In this paper we have planned to give the detailed examination of group technology (GT) and its principle of
implementation in the field of cellular manufacturing to achieve the drastic change in output of
production.Several small batch manufacturers have started using GT to increase productivity and reduce
manufacturing costs. It is therefore important to understand what it means and how it is applied. The present
paper is an attempt to provide a succinct review of the literature on this issue in three parts. First part deals
with review of drawbacks of various classical manufacturing system model. In the second part the emergence of
various modern manufacturing system model is chronologically discussed in the light of drawbacks of classical
paradigms. The second part will also attempt to bring out how Group Technology has emerged as the backbone
of all these paradigms. In the third part of the paper, an exhaustive review of the research works on part
classification used across various modern manufacturing systems. Finally, it sums up with a vision for future
research in this area
Keywords: Group Technology, manufacturing systems, cost aspect.
1. Introduction
Group technology is drawing increasing interest from manufacturers because of its many applications for
boosting productivity and from the global marketplace. There is growing need to make manufacturing more
efficient and productive. In addition there is increasing trend toward achieving a higher level of integration
between the design and manufacturing functions in a firm. In addition, manufacturing systems must be able to
manufacture products with low production costs and high quality as quickly as possible in order to deliver the
products to customers in time. Traditional manufacturing systems, such as job shops and flow lines, are not
capable of satisfying such requirements.
Group technology is a manufacturing philosophy in which similar parts are identified and grouped together to
take advantage of their similarities in design and production. Similar parts are arranged into parts families,
where each part family possesses similar design or manufacturing characteristics. The principle of group
technology is to divide the manufacturing facility into small groups or cells of machines. The term cellular
manufacturing is often used in this regard. Each of these cells is dedicated to a specified family or set of part
types. Typically, a cell is a small group of machines (as a rule of thumb not more than five). An example would
be a machining center with inspection and monitoring devices, tool and Part Storage, a robot for part handling,
and the associated control hardware. The idea of GT can also be used to build larger groups, such as for
instance, a department, possibly composed of several automated cells or several manned machines of various
types
2. Classical Manufacturing system and GT
The Job shop, project shop, cellular system, flow line are four basic processes to structuring the processing area
for discrete manufacturing in industries.In a job shop, machines with the same or similar material processing
capabilities are grouped together i.e,all parts travel through the entire shop..In a project shop, a product’s
position remains fixed during manufacturing because of its size and/or weight. Man, machine, material are
carried to the product when required. In cellular system machines are arranged/grouped according to process
combination occur in part family. Each cell consists of machines which produces a particular family of parts.

Proceedings of the National Conference on
Trends and Advances in Mechanical Engineering
(TAME-2017) March 16-17, 2017 ISBN 978-93-5268-269-0
YMCA University of Science & Technology, Faridabad, Haryana
179
GT can produce considerable improvements where it is appropriate and the basic idea can be utilized in all
manufacturing environments:
To the manufacturing engineer GT can be viewed as a role model to obtain the advantages of flow line systems
in environments previously ruled by job shop layouts. The idea is to form groups and to aim at a product-type
layout within each group (for a family of parts). Whenever possible, new parts are designed to be compatible
with the processes and tooling of an existing part family. This way, production experience is quickly obtained,
and standard process plans and tooling can be developed for this restricted part set.
To the design engineer the idea of GT can mean to standardize products and process plans. If a new part should
be designed, first retrieve the design for a similar, existing part. Maybe, the need for the new part is eliminated if
an existing part will suffice. If a new part is actually needed, the new plan can be developed quickly by relying
on decisions and documentation previously made for similar parts. Hence, the resulting plan will match current
manufacturing procedures and document preparation time is reduced. The design engineer is freed to
concentrate on optimal design.
In general, GT simplifies and standardizes. The approach to simplify, standardize, and internalize through
repetition produces efficiency.Since a work-center will work only on a family of similar parts generic fixtures
can be developed and used. Tooling can be stored locally since parts will always be processed through the same
machines.
Tool changes may be required due to tool wear only, not part changeovers (e.g. a press may have a generic
fixture that can hold all the parts in a family without any change or simply by changing a part specific insert
secured by a single screw. Hence setup time is reduced, and tooling cost is reduced. Using queuing theory
(M/M/1 model) it is possible to show that if setup time is reduced, also the throughput time for the system is
reduced by the same percentage.
3. Parts classification and Coding
In parts classification and coding, similarities among parts are identified , these similarities are related in a
coding system. Two categories of part similarities can be distinguished: (1) Design attributes, which are
concerned with sequence of processing steps required to make a part. Reason for using a coding scheme include:
Design Retrieval- A simple change in existing part would take much less time than designing a whole
new part from scratch.
Automated process planning- The part code for a new part can be used to search for process plans for
existing parts with identical and similar parts.
Machine cell design- The part codes can used to design machine cells capable of producing all
members of a particular part family.
The principal functional areas that utilizes a part classification and coding system are design and manufacturing
Three structures used in classification and coding schemes: 1. Hierachical structure- also known as monocode,
in which each successive symbol, depends on the value of preceding symbols. 2.Chain type- also called
polycode in which interpretation of each symbol in sequence is always same i.e. not depend on previous vale. 3.
Mixed mode- combination of above two and most commonly found in GT parts classification.
Examples of parts classification and coding systems
1. Optiz classification system- It is intended for machined parts. The basic code consists of nine
digits , which can be extended by adding four more digits. The first nine invented to convey both design and
manufacturing data.
12345 6789 ABCD

Proceedings of the National Conference on
Trends and Advances in Mechanical Engineering
(TAME-2017) March 16-17, 2017 ISBN 978-93-5268-269-0
YMCA University of Science & Technology, Faridabad, Haryana
180
First five are called form code which describes primary design attributes such as external shape (eg. Rotational
vs rectangular ) and machined features (like holes , threads)
The next four digits 6789 constitute supplementary code which indicates attributes like dimension, work
material, starting shape and accuracy. The extra four digits ABCD are known secondary code which are
intended to identify the production operation type and sequence.
2. Multiclass classification system- used for variety of different types of manufactured items, including
machined and sheet metal parts, tooling, assemblies, machine tools etc. It uses a hierarchical or decision-tree
coding system structure in which the succeeding digits depend on values of previous digits. The coding
structural consists of up to 30 digits.
Digit Function
0 Code system prefix
1 Main shape category
2,3 External and internal configuration
4 Machined secondary elements
5,6 Functional descriptors
7-12 Dimensional data(length, diameter, etc.)
13 Tolerances
4. Conclusion
Group technology in various manufacturing system and methodology , help to understand the need of
manufacturing system for best suitable performance. Material handling is reduced because parts are moved
within a machine cell rather than within the entire factory. Work in process and setup times are reduced,
resulting in reducing manufacturing lead times from weeks to days.There is a need to develop more efficient
tools enabling manufacturing system designer to achieve optimal solution in reasonable processing time.
References
1. Al-Ahmari A et al (2009) Design of cellular manufacturing systems with labor and tools consideration 2009.
Computer Ind. Eng Conference (CIE 2009) , 678–68.
2. Anjard SR, Ronald P (1995) Computer integrated manufacturing: a dream becoming a reality. Ind Manage
Data System 95(1):3–4.
3. Askin & Standridge, 1993, Modelling and Analysis of Manufacturing Systems, John Wiley and Sons.
4. Askin, R.G., Standridge, and C.R.: Modelling & Analysis of Manufacturing Systems, John Wiley & Sons,
1993.
5.15. Groover, M. P., And Zimmer’s, E. W., 1984,CAD/CAM: Computer-Aided Design and Manufacturing
(Englewood Cliffs, NJ: Prentice Hall).
6. H., 1999, “Reconfigurable Manufacturing Systems,” (Also a Keynote paper presented at the General
Assembly.) Annals of the CIRP, Vol. 48/ 2, pp. 6-12.

Proceedings of the National Conference on
Trends and Advances in Mechanical Engineering
(TAME-2017) March 16-17, 2017 ISBN 978-93-5268-269-0
YMCA University of Science & Technology, Faridabad, Haryana
181
7. Ham, I., Hitomi, K., and Yoshida, T., 1985, Group Technology: Applications to Production Management
(Hingham, Ma: Kluwer-Nijhoff Publishing).
8. Helle, P. F., 1989, Group Technology on A Tight Budget, Apics 1989 Conference Proceedings, 239-241.
9. Hyder, W. F., 1981, Improving Productivity By Classification, Coding, And Data Base Standardization (New
York: Marcel Dekker).
10. Hyer, N. L, Wemmerlov, U., 1984, Group Technology and Productivity. Harvard Business Review, July-
August, 140-149.
11. DeGarmo EP, Black JT, Kohser RA (2002) Materials and processes in manufacturing, 9th edn. Wiley, New
York.
12.Elliot, P. M., 1985, Non-significant part numbering: the better choice for MRP, Production and Inventory
Management, 26 (4), 102-108.
Proceedings of the National Conference on
Trends and Advances in Mechanical Engineering
(TAME-2017) March 16-17, 2017 ISBN 978-93-5268-269-0
YMCA University of Science & Technology, Faridabad, Haryana
182
OPTIMIZATION OF PROCESS PARAMETERS IN ELECTRO-
DISCHARGE MACHINING USING TAGUCHI METHOD ON MILD
STEEL IS 2026
Anbesh Jamwal1, Ankur Aggarwal
1, Punj Lata Singh
2
1PG Student,
2Assistant Professor, CE Department, Amity University, Uttar Pradesh, Noida
Abstract
Optimization is a process or a technique to make something perfect or effective as much as possible.
Optimization is one of the best methodologies used in manufacturing and production sectors to attain the
optimal manufacturing conditions at lower cost with the optimal results. Electric discharge machining is the
non-traditional machining process. Basically, EDM is used for the hard metals or those materials which are
difficult to machine by some other traditional processes. The electric discharge machining process based upon
the thermo electric energy between the work piece and the electrode. In this the material removal is occurred
electro thermally by a series of successive discharges that are between the electrode and work piece. Aim of this
paper was to investigate the optimal set of process parameters such as Voltage, Current and Pulse on time in
the electric discharge machining to identify the variations in the three characteristics such as Material removal
rate (MRR), Tool wear rate (TWR), and Surface roughness (Ra) on the work piece Mild Steel IS 2026 and the
electrode is Copper. Machining process is done to achieve results like higher material removal rate, better
surface finish and lesser tool wear rate. Taguchi method and ANOVA technique is used to get the optimized
result. Graphs and response table are used to find the optimal levels of the parameters in the Electric discharge
machining. The result revealed that the current, voltage & pulse on time have a great influence on the
MRR,TWR and surface roughness. At higher value of Voltage, lower value of current & lower value of pulse on
time we get the best optimal values of MRR, Ra & TWR.
Keywords: Electric discharge machining, Mild Steel IS 2026 work-piece, copper electrode, Current, Voltage,
Pulse on time, Taguchi L9 orthogonal array, Miinitab-17, ANOVA, S/N ratio, Surface Roughness (Ra), Material
Removal Rate(MRR), Tool Wear Rate(TWR).
INTRODUCTION
The Word EDM is derived from Electric Discharge Machining. The EDM process started firstly with the
observations of Joseph Preistly in 1770’s. He observed that electrical discharge plays a vital role in removal of
material from the electrode. The process is also known as electro-discharge erosion. Then later in the 1940’s two
Soviet researchers, developed a machining process that formed the foundation for modern EDM. In the middle
of 1980’s machining process on EDM were converted to a production instrument. The main aim of EDM is to
improved the technology to increases in both the component precision and cutting speed. EDM machining
originated to be a feasible practice that facilitated to run-through the metallic operational industry we have seen
nowadays.
Nowadays there are so many changes in the area of non-traditional machining process are not to be considered
as replacements for conventional machining methods of metal working. Electro Discharge Machining (EDM) is
an electro-thermal non-traditional machining process in which there is electrical energy is used to generate the
electrical spark and material removal occurs due to thermal energy of the spark. Electric discharge machining is
basically used for machine those type of materials which are difficult to machine by the other traditional
processes. There is no direct contact between the electrode and work piece in EDM. So the machining problems
like the stresses and the vibrations do not arise during the machining of material. EDM is the thermal erosion
process in which the removal of metal is done by a series of recurring electrical discharges between the cutting
tool which act as an electrode and a conductive work piece, in the presence of the dielectric fluid. A voltage gap
between the electrode and work piece is occur due to the electric discharge. Heat from the discharge vaporizes
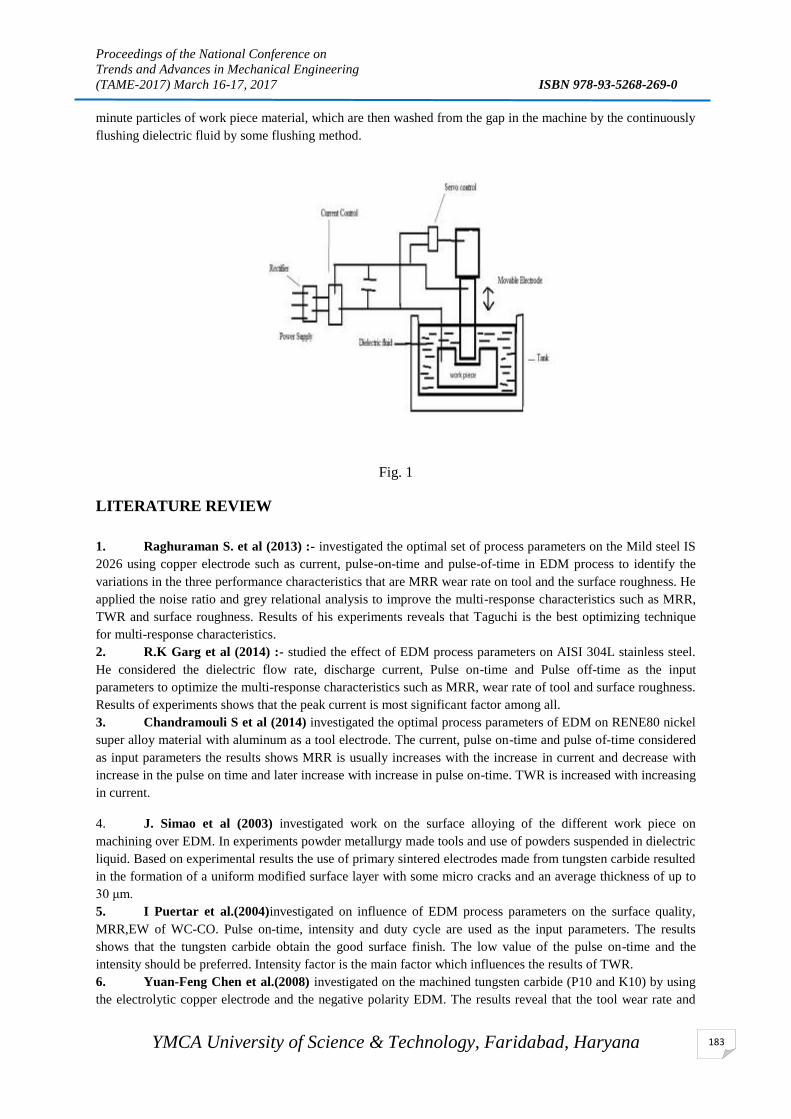
Proceedings of the National Conference on
Trends and Advances in Mechanical Engineering
(TAME-2017) March 16-17, 2017 ISBN 978-93-5268-269-0
YMCA University of Science & Technology, Faridabad, Haryana
183
minute particles of work piece material, which are then washed from the gap in the machine by the continuously
flushing dielectric fluid by some flushing method.
Fig. 1
LITERATURE REVIEW
1. Raghuraman S. et al (2013) :- investigated the optimal set of process parameters on the Mild steel IS
2026 using copper electrode such as current, pulse-on-time and pulse-of-time in EDM process to identify the
variations in the three performance characteristics that are MRR wear rate on tool and the surface roughness. He
applied the noise ratio and grey relational analysis to improve the multi-response characteristics such as MRR,
TWR and surface roughness. Results of his experiments reveals that Taguchi is the best optimizing technique
for multi-response characteristics.
2. R.K Garg et al (2014) :- studied the effect of EDM process parameters on AISI 304L stainless steel.
He considered the dielectric flow rate, discharge current, Pulse on-time and Pulse off-time as the input
parameters to optimize the multi-response characteristics such as MRR, wear rate of tool and surface roughness.
Results of experiments shows that the peak current is most significant factor among all.
3. Chandramouli S et al (2014) investigated the optimal process parameters of EDM on RENE80 nickel
super alloy material with aluminum as a tool electrode. The current, pulse on-time and pulse of-time considered
as input parameters the results shows MRR is usually increases with the increase in current and decrease with
increase in the pulse on time and later increase with increase in pulse on-time. TWR is increased with increasing
in current.
4. J. Simao et al (2003) investigated work on the surface alloying of the different work piece on
machining over EDM. In experiments powder metallurgy made tools and use of powders suspended in dielectric
liquid. Based on experimental results the use of primary sintered electrodes made from tungsten carbide resulted
in the formation of a uniform modified surface layer with some micro cracks and an average thickness of up to
30 μm.
5. I Puertar et al.(2004)investigated on influence of EDM process parameters on the surface quality,
MRR,EW of WC-CO. Pulse on-time, intensity and duty cycle are used as the input parameters. The results
shows that the tungsten carbide obtain the good surface finish. The low value of the pulse on-time and the
intensity should be preferred. Intensity factor is the main factor which influences the results of TWR.
6. Yuan-Feng Chen et al.(2008) investigated on the machined tungsten carbide (P10 and K10) by using
the electrolytic copper electrode and the negative polarity EDM. The results reveal that the tool wear rate and
Proceedings of the National Conference on
Trends and Advances in Mechanical Engineering
(TAME-2017) March 16-17, 2017 ISBN 978-93-5268-269-0
YMCA University of Science & Technology, Faridabad, Haryana
184
Material removal rate are increased with increase in discharge energy for both work piece and tool (K10 and
P10). Debris diameter is increased with increase in the electrical discharge energy. Base metal is slightly harder
than the heat affected zone with the higher discharge energy.
7. Kamaljit Singh, et al.(2013) has carried out ainvestigation of machining of Oil Hardening Non
Shrinking Die steel by the EDM process. The Pulse on-time, peak current, flushing pressure and voltage are
taken as input parameters. To optimizing the machining parameters ANOVA technique and Taguchi method are
used. The results shows that the current is the main influencing factor for material removal rate of flushing
pressure and Oil Hardening Non Shrinking die steel.
8. Vasmi Krishna Pasam et al. (2010) investigated on WEDM on the titanium alloy for the good surface
finish of various process parameters by using the Taguchi method. He developed a mathematical model by
means of linear regression analysis to establish relation between the surface finish as a response and the process
parameters. That attempt to optimize the surfaceroughness prediction model by using the Genetic Algorithm.
9. Azmir et al. (2011) carried out an experiment on the effect of machining polarity on the Alloy Steel
(AISI P20 GRADE 1.2738) with the use of copper tool electrode by DOE using L18 orthogonal array. The
results comes reveals that the positive polarity gives an optimum result for the MRR, surface roughness and
TWR.
10. Lin et al. (2000) investigated the applications of the taguchi method with the fuzzy logic to optimize
the EDM process having the multiple performance characteristics. Based on the number of experiments
performance characteristics such as TWR and MRR are improved.
11. Huang et al. (2003) determine the optimal selection of machining parameters for the WEDM by the
use of GRA ( Grey Relational Analysis). L18 mixed-OA table is chosen for the number of experiments by
applying the Taguchi Design concept. It is found that MRR is great influenced by the table feed rate and pulse
on time influence the surface roughness and gap width. The optimal results are obtained for maximum MRR and
the minimum surface roughness.
12. Singh et al. (2004) has suggested that the Grey relational analysis is useful for the optimization of
multi-response characteristics which are more composite in nature as compared to the optimization of single
performance characteristics. They obtained optimal EDM parameters settings of Material removal rate, tool
wear rate, DOC, T and surface roughness during the machining of Al-10%SiCP as cast metal matrix composites.
13. Nalbant et al. (2007) used the taguchi design concept for the optimal cutting parameters for the
Surface roughness in the turning operation of AISI 1030 Steel bars by the use of TiN coated tools. Three cutting
parameters are optimized with the consideration of surface roughness that are feed rate, depth of cut and the
insert radius.
MATERIALS AND METHODS
EXPERIMENT DETAILS
The experiments were conducted on “Press Mach-A25” Machine as shown in figure 1. There is a work table, a
servo control system, a dielectric supply system. Commercial grade EDM oil (specific gravity= 0.763, freezing
point= 94°C) was used as dielectric fluid. The machine has nine current settings varies from 4Amp to 8Amp,
Nine settings of pulse on time varies from 75 microseconds to 125 Microseconds and also nine settings of
voltage varies from 30volts to 50volts with the spark gap of 50-75 microns. The experiments are conducted on
Mild Steel IS 2026 and work piece dimensions are 85×55×10 mm3. Work piece. The tool material used is
copper having cylindrical shape. The diameter of cylindrical shape copper electrode is 12.55mm. The density of
copper tungsten is 8.96 gm./cm3 . The number of experiments and, input levels are decided based on the design
of experiments and the input parameters are shown in table below:-
EXPERIMENT PROCESS PARAMETERS FOR EDM

Proceedings of the National Conference on
Trends and Advances in Mechanical Engineering
(TAME-2017) March 16-17, 2017 ISBN 978-93-5268-269-0
YMCA University of Science & Technology, Faridabad, Haryana
185
TABLE 1.
EDM Process
Parameter
Parameter
Designation
Level-1 Level-2 Level-3
Discharge Current Amp 4 6 8
Pulse on Time Micro-seconds 75 100 125
Voltage Volt 30 40 50
Figure 2
EDM MACHINE (PRESS MACH-A25)
The “Press Mach-A25” EDM machine made by TOOLCRAFT is used to carry out the
experimentation.
Table 2 Specification Of The Edm Machine (Press Mach A-25)
Pulse Generator A25
Working Current 5-9 Amp
Type of Pulse STD/EQUI-ENERGY
Pulse Time ON/OFF 2-2000 micro sec.
Max. MRR Cu-Steel
Gr-Steel 165mm/min.-190mm/min.
Working Voltage 40-50 volts
Surface Finish Cu-Steel ≤0.5 microns CLA
Electrode Wear ≤0.3 %
SELECTION OF MACHINING TOOL
Copper is selected as the cutting tool for the experiment. The copper electrode has cylindrical shape of
diameter 12.50 mm. The density of copper is 8.96 gm./cm3 .
SELECTION OF WORK PIECE MATERIAL
The Mild steel AISI 1018 is used for the current work having density 7.87 gm/cm³.
SELECTION OF MACHINING PARAMETERS
The following process parameters, used in this work are shown in table:

Proceedings of the National Conference on
Trends and Advances in Mechanical Engineering
(TAME-2017) March 16-17, 2017 ISBN 978-93-5268-269-0
YMCA University of Science & Technology, Faridabad, Haryana
186
Table 3- Machining Parameters
Polarity Positive
Current 4-8 amp
Voltage 30-50 volt
Pulse on time 75-125µs
Duty factor 0.7
DESIGN MATRIX
According to the present work there are three levels and three factors. So according to Taguchi
approach we selected L9 orthogonal array. With the help of minitab-17 following design matrix has
been formed.
Table 3- Design Matrix
OVERVIEW OF TAGUCHI METHOD
Taguchi method associate with reducing the variation in a process through the design of experiments. The
overall objective of the using the Taguchi method is to achieve some of basic goals that are: Produce high
quality products at the lower cost to the manufacturer .It helps in improving the quality of production of having
different designs. Taguchi developed a technique for designing experiments to examine how different
parameters influence the mean and variance of a process performance characteristic that describes how well the
process is working. The experimental design given by Taguchi involves using orthogonal arrays to organize the
parameters affecting the process and the levels at which they should be varied; it allows for the collection of the
necessary required data to determine that what the and which the factors are giving better product quality with
the minimum number of experimentation, that helps us in saving our time and resources. Taguchi method is
used to analyze the parameter settings which give the quality of the product or the process robust to inescapable
variations in the external noise. The relative “quality” of the particular parameter design is calculated using the
signal-to-noise (S/N) ratio. Depends on the particular problem, different S/N ratios are applicable, including
“lower is good” (LB), “nominal is best” (NB), or “higher is better” (HB). As our main objective is to obtain the
high material removal rate in process with low tool wear rate and the best surface finishing, it is concerned with
obtaining “larger the better” value for MRR, “smaller the better” value for tool wear rate and smaller the better”
value of surface roughness, which states that the output must be as low as possible.
Experiment Voltage Current Pulse on
time
1 1 1 1
2 1 2 2
3 1 3 3
4 2 1 2
5 2 2 3
6 2 3 1
7 3 1 3
8 3 2 1
9 3 3 2

Proceedings of the National Conference on
Trends and Advances in Mechanical Engineering
(TAME-2017) March 16-17, 2017 ISBN 978-93-5268-269-0
YMCA University of Science & Technology, Faridabad, Haryana
187
RESULTS AND DISCUSSIONS The design matrix is made by using minitab 17 software. According to the design matrix, experiments are
performed. By using the readings of experiments we calculate MRR, Ra & TWR as follows:
MATERIAL REMOVAL RATE (MRR)
The material removal rate, MRR, can be defined as the volume of material removed divided by the machining
time. Another way to define MRR is to imagine an "instantaneous" material removal rate as the the rate at which
the cross-section area of material being removed moves through the work piece. To calculate MRR following
equation is used to calculate the Material Removal Rate (MRR):
𝑀𝑅𝑅(𝑚𝑚3 𝑚𝑖𝑛.⁄ )
=[Initial Weight of workpiece (gm. ) − Final Weight of workpiece (gm. )]
Density (gm. mm3⁄ ) × Machining Time (min. )
SURFACE ROUGHNESS (RA)
Surface roughness often shortened to roughness, is a component of surface texture. It is quantified by the
deviations in the direction of the normal vector of a real surface from its ideal form. If these deviations are large,
the surface is rough; if they are small, the surface is smooth. Roughness measurement has been done using a
portable stylus-type profilometer, Mitutoyo- Surftest SJ- 201P/M. The evaluation length of 2.5 mm is used to
measure response Ra value in µm.
TOOL WEAR RATE (TWR)
Tool wear describes the gradual failure of cutting tools due to regular operation. The Tool Wear Rate is
generally described as the volume of metal removed per unit time. To calculate TWR, following equation is
used:
𝑇𝑊𝑅(𝑚𝑚3 𝑚𝑖𝑛.⁄ ) =[Initial Weight of Tool (gm. ) − Final Weight of Tool (gm. )]
Density (gm. mm3⁄ ) × Machining Time (min. )
RESPONSE TABLE
Response table for the experimental design matrix is shown in table.
Table 4. Response Table Of Mrr, Ra& Twr
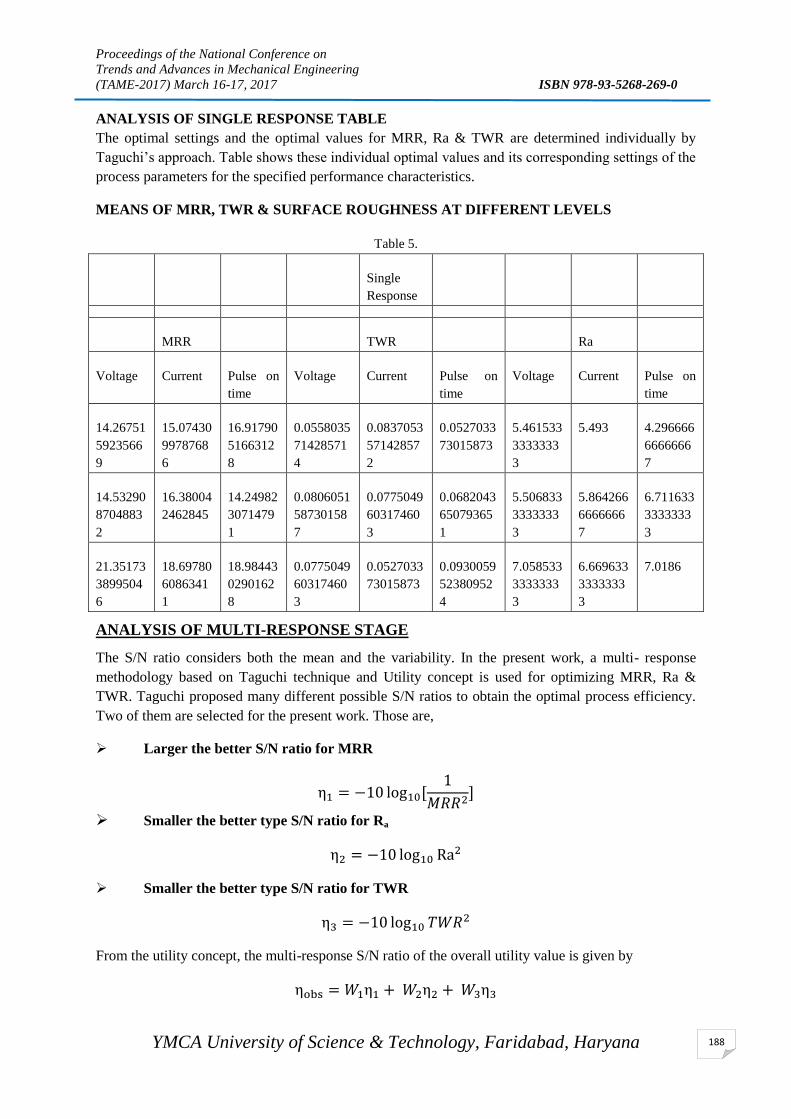
Proceedings of the National Conference on
Trends and Advances in Mechanical Engineering
(TAME-2017) March 16-17, 2017 ISBN 978-93-5268-269-0
YMCA University of Science & Technology, Faridabad, Haryana
188
ANALYSIS OF SINGLE RESPONSE TABLE
The optimal settings and the optimal values for MRR, Ra & TWR are determined individually by
Taguchi’s approach. Table shows these individual optimal values and its corresponding settings of the
process parameters for the specified performance characteristics.
MEANS OF MRR, TWR & SURFACE ROUGHNESS AT DIFFERENT LEVELS
Table 5.
Single
Response
MRR TWR Ra
Voltage Current Pulse on
time
Voltage Current Pulse on
time
Voltage Current Pulse on
time
14.26751
5923566
9
15.07430
9978768
6
16.91790
5166312
8
0.0558035
71428571
4
0.0837053
57142857
2
0.0527033
73015873
5.461533
3333333
3
5.493 4.296666
6666666
7
14.53290
8704883
2
16.38004
2462845
14.24982
3071479
1
0.0806051
58730158
7
0.0775049
60317460
3
0.0682043
65079365
1
5.506833
3333333
3
5.864266
6666666
7
6.711633
3333333
3
21.35173
3899504
6
18.69780
6086341
1
18.98443
0290162
8
0.0775049
60317460
3
0.0527033
73015873
0.0930059
52380952
4
7.058533
3333333
3
6.669633
3333333
3
7.0186
ANALYSIS OF MULTI-RESPONSE STAGE
The S/N ratio considers both the mean and the variability. In the present work, a multi- response
methodology based on Taguchi technique and Utility concept is used for optimizing MRR, Ra &
TWR. Taguchi proposed many different possible S/N ratios to obtain the optimal process efficiency.
Two of them are selected for the present work. Those are,
Larger the better S/N ratio for MRR
η1 = −10 log10[1
𝑀𝑅𝑅2]
Smaller the better type S/N ratio for Ra
η2 = −10 log10 Ra2
Smaller the better type S/N ratio for TWR
η3 = −10 log10 𝑇𝑊𝑅2
From the utility concept, the multi-response S/N ratio of the overall utility value is given by
ηobs = 𝑊1η1 + 𝑊2η2 + 𝑊3η3
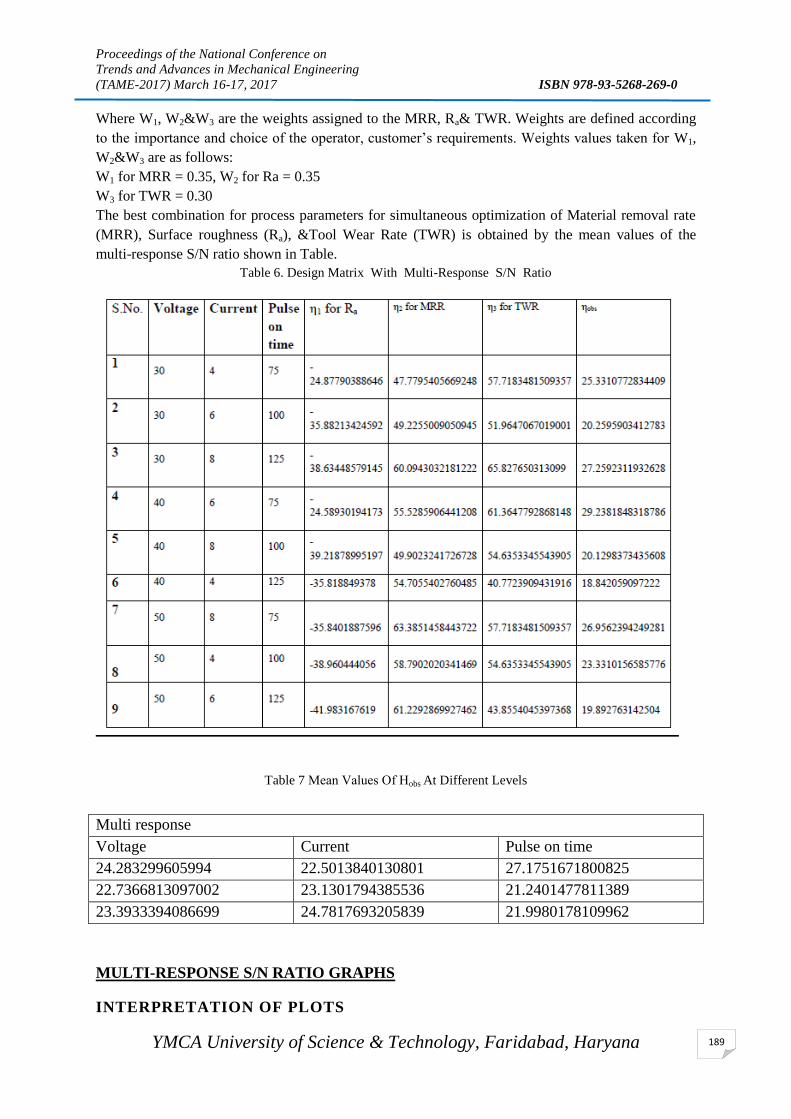
Proceedings of the National Conference on
Trends and Advances in Mechanical Engineering
(TAME-2017) March 16-17, 2017 ISBN 978-93-5268-269-0
YMCA University of Science & Technology, Faridabad, Haryana
189
Where W1, W2&W3 are the weights assigned to the MRR, Ra& TWR. Weights are defined according
to the importance and choice of the operator, customer’s requirements. Weights values taken for W1,
W2&W3 are as follows:
W1 for MRR = 0.35, W2 for Ra = 0.35
W3 for TWR = 0.30
The best combination for process parameters for simultaneous optimization of Material removal rate
(MRR), Surface roughness (Ra), &Tool Wear Rate (TWR) is obtained by the mean values of the
multi-response S/N ratio shown in Table. Table 6. Design Matrix With Multi-Response S/N Ratio
Table 7 Mean Values Of Ηobs At Different Levels
Multi response
Voltage Current Pulse on time
24.283299605994 22.5013840130801 27.1751671800825
22.7366813097002 23.1301794385536 21.2401477811389
23.3933394086699 24.7817693205839 21.9980178109962
MULTI-RESPONSE S/N RATIO GRAPHS
INTERPRETATION OF PLOTS

Proceedings of the National Conference on
Trends and Advances in Mechanical Engineering
(TAME-2017) March 16-17, 2017 ISBN 978-93-5268-269-0
YMCA University of Science & Technology, Faridabad, Haryana
190
The multi response S/N ratio graphs shows the optimal level of MRR, Ra & TWR with the variation
in parameters i.e. Voltage, Curret & Pulse on time. As there are three process parameters, so there are
three graphs: one based on Voltage and another two based on current & pulse on time.
BASED ON VOLTAGE
This graph is a plot between the process parameter i.e. Voltage on x-axis and the optimum values
obtained from Multi-response table on the y-axis. As the voltage is increased from its initial value 30
volts the multi response value for MRR, Ra & TWR also increases. We get the optimum value for
MRR, Ra & TWR at voltage 40 volts.
Fig. 3
BASED ON THE CURRENT
This graph is a plot between the process parameter i.e. Current on x-axis and the optimum values
obtained from Multi-response table on the y-axis. From the graph the max. value of multi response is
at current value of 8 Amp. So we get the optimum values of MRR, Ra & TWR, at lower value of
current.
Fig.4
BASED ON PULSE ON TIME
This graph is a plot between the process parameter i.e. Pulse on time on x-axis and the optimum
values obtained from Multi-response table on the y-axis. With the increase in pulse on time the value
5045403530
24.5
24.0
23.5
23.0
Applied Voltage
Mea
n V
alu
e o
f V
olt
age
Voltage Graph
87654
25.0
24.5
24.0
23.5
23.0
22.5
Applied Current
Mea
n v
alu
e o
f C
urr
ent
Current graph

Proceedings of the National Conference on
Trends and Advances in Mechanical Engineering
(TAME-2017) March 16-17, 2017 ISBN 978-93-5268-269-0
YMCA University of Science & Technology, Faridabad, Haryana
191
obtained from multi response reduces then starts increasing. So the optimum values for MRR, Ra &
TWR at lower value of pulse on time i.e. 100µm.
Fig. 5
CONCLUSION
A set of experiments are performed on IS 2026 mild steel work pieces with the use of copper
electrode in Electric discharge machining. The experimental studies are conducted by varying the
parameters like Current, Voltage and Pulse on time.The result shows that current, pulse on time and
Voltage have significant effect on MRR,TWR and SR. The results of the present work reveal that
proper selection of input parameters will play a significant role in Electric Discharge Machining: At
40 volts of Voltage, lower value current & at 100 microseconds of pulse of time we get the optimal
results for MRR, Ra & TWR. So the machining parameters should be set as mid range voltage values,
lower current and mid range values for pulse on time.
REFERENCES
i Dr. S. Senthil, Unconventional Machining Process (A.R.S. Publications).
ii Raghuraman, S., Thiruppathi, K., Panneerselvam, T., & Santosh, S. (2013). Optimization of
EDM parameters using Taguchi method and Grey relational analysis for Mild steel IS
2026. International Journal of Innovative Research in Science, Engineering and Technology, 2(7),
3095-3104.
iii Garg, R. K., Singh, K. K., Sachdeva, A., Sharma, V. S., Ojha, K., & Singh, S. (2010). Review
of research work in sinking EDM and WEDM on metal matrix composite materials. The International
Journal of Advanced Manufacturing Technology, 50(5-8), 611-624.
iv Chandramouli, S., Shrinivas Balraj, U., & Eswaraiah, K. (2014). Optimization of electrical
discharge machining process parameters using Taguchi method. International Journal of Advanced
Mechanical Engineering, 4(4), 425-434.
v Simao, J., Lee, H. G., Aspinwall, D. K., Dewes, R. C., & Aspinwall, E. M. (2003). Workpiece
surface modification using electrical discharge machining. International Journal of Machine Tools
and Manufacture, 43(2), 121-128.
130120110100908070
28
27
26
25
24
23
22
21
Applied Pulse on time
Mean
valu
e o
f p
uls
e o
n t
ime
Pulse on time graph
Proceedings of the National Conference on
Trends and Advances in Mechanical Engineering
(TAME-2017) March 16-17, 2017 ISBN 978-93-5268-269-0
YMCA University of Science & Technology, Faridabad, Haryana
192
vi Puertas, I., Luis, C. J., & Alvarez, L. (2004). Analysis of the influence of EDM parameters on
surface quality, MRR and EW of WC–Co. Journal of Materials Processing Technology, 153, 1026-
1032.
vii Lin, Y. C., Chen, Y. F., Wang, D. A., & Lee, H. S. (2009). Optimization of machining
parameters in magnetic force assisted EDM based on Taguchi method. Journal of materials
processing technology, 209(7), 3374-3383.
viii Singh, K., & Kalra, C. S. (2013). An experimental investigation: machining of OHNS steel by
EDM. Delta, 19(1.484), 5-459.
ix Pasam, V. K., Battula, S. B., Madar Valli, P., & Swapna, M. (2010). Optimizing surface
finish in WEDM using the Taguchi parameter design method. Journal of the Brazilian Society of
Mechanical Sciences and Engineering, 32(2), 107-113.
x Reza, M. S., Hamdi, M., & Azmir, M. A. (2010, May). Optimization of EDM injection
flushing type control parameters using grey relational analysis on AISI 304 stainless steel work piece.
In National Conference in Mechanical Engineering Research and Postgraduate Students (pp. 26-27).
xi Lin, C. L., Lin, J. L., & Ko, T. C. (2002). Optimisation of the EDM process based on the
orthogonal array with fuzzy logic and grey relational analysis method. The International Journal of
Advanced Manufacturing Technology, 19(4), 271-277.
xii Huang, J. T., & Liao, Y. S. (2003). Optimization of machining parameters of wire-EDM
based on grey relational and statistical analyses. International Journal of Production Research, 41(8),
1707-1720.
xiii Singh, P. N., Raghukandan, K., & Pai, B. C. (2004). Optimization by grey relational analysis
of EDM parameters on machining Al–10% SiC P composites. Journal of Materials Processing
Technology, 155, 1658-1661.
xiv Yildiz, Y., Sundaram, M. M., Rajurkar, K. P., & Nalbant, M. (2011). The effects of cold and
cryogenic treatments on the machinability of beryllium-copper alloy in electro discharge machining.
xv Goyal, S., Jamwal, A., & Pandey, R. Optimization of Process Parameters in Electro-
Discharge Machining using Taguchi Method. Carbon, 100, 0-14.
xvi Goyal, S., & Singh, R. K. (2014). Parametric Study of Powder Mixed EDM and Optimization
of MRR & Surface Roughness. Carbon, 100, 0-43.
xvii Goyal, S., & Rastogi, S. Experimental Investigation of Machining Parameters of Powder
Mixed EDM and Optimization of MRR, Surface Roughness & Tool Wear Rate Using Taguchi
Method. Carbon, 100, 0-14.
xviii Karunakaran, K., & Chandrasekaran, M. (2006). INVESTIGATION OF INFLUENCE OF
SOME PROCESS PARAMETERS IN EDM OF INCONEL-800 WITH SIVER COATED
ELECTRODE.
xix Jung, J. H., & Kwon, W. T. (2010). Optimization of EDM process for multiple performance
characteristics using Taguchi method and Grey relational analysis. Journal of Mechanical Science and
Technology, 24(5), 1083-1090.
xx Mahapatra, S. S., & Patnaik, A. (2006). Parametric optimization of wire electrical discharge
machining (WEDM) process using Taguchi method. Journal of the Brazilian Society of Mechanical
Sciences and Engineering, 28(4), 422-429.
xxi Durairaj, M., Sudharsun, D., & Swamynathan, N. (2013). Analysis of process parameters in
wire EDM with stainless steel using single objective Taguchi method and multi objective grey
relational grade. Procedia Engineering, 64, 868-877.
xxii Beri, N., Maheshwari, S., Sharma, C., & Kumar, A. (2008). Performance evaluation of
powder metallurgy electrode in electrical discharge machining of AISI D2 steel using Taguchi
method. parameters, 10(18), 19-20.
Proceedings of the National Conference on
Trends and Advances in Mechanical Engineering
(TAME-2017) March 16-17, 2017 ISBN 978-93-5268-269-0
YMCA University of Science & Technology, Faridabad, Haryana
193
xxiii George, P. M., Raghunath, B. K., Manocha, L. M., & Warrier, A. M. (2004). EDM machining
of carbon–carbon composite—a Taguchi approach. Journal of Materials Processing
Technology, 145(1), 66-71.
xxiv Nikalje, A. M., Kumar, A., & Srinadh, K. S. (2013). Influence of parameters and optimization
of EDM performance measures on MDN 300 steel using Taguchi method. The International Journal
of Advanced Manufacturing Technology, 69(1-4), 41-49.
xxv Jailani, H. S., Rajadurai, A., Mohan, B., Kumar, A. S., & Sornakumar, T. (2009). Multi-
response optimisation of sintering parameters of Al–Si alloy/fly ash composite using Taguchi method
and grey relational analysis. The International Journal of Advanced Manufacturing Technology, 45(3-
4), 362.
xxvi Lin, Y. C., Wang, A. C., Wang, D. A., & Chen, C. C. (2009). Machining performance and
optimizing machining parameters of Al2O3–TiC ceramics using EDM based on the Taguchi
method. Materials and manufacturing processes, 24(6), 667-674.
xxvii Singh, P. N., Raghukandan, K., & Pai, B. C. (2004). Optimization by grey relational analysis
of EDM parameters on machining Al–10% SiC P composites. Journal of Materials Processing
Technology, 155, 1658-1661.
xxviii Tsao, C. C., & Hocheng, H. (2008). Evaluation of thrust force and surface roughness in
drilling composite material using Taguchi analysis and neural network. Journal of materials
processing technology, 203(1), 342-348.
xxix Rajyalakshmi, G., & Ramaiah, P. V. (2013). Multiple process parameter optimization of wire
electrical discharge machining on Inconel 825 using Taguchi grey relational analysis. The
International Journal of Advanced Manufacturing Technology, 69(5-8), 1249-1262.
xxx Tzeng, C. J., Lin, Y. H., Yang, Y. K., & Jeng, M. C. (2009). Optimization of turning
operations with multiple performance characteristics using the Taguchi method and Grey relational
analysis. Journal of materials processing technology, 209(6), 2753-2759.
xxxi Singh, S., & Bhardwaj, A. (2011). Review to EDM by using water and powder-mixed
dielectric fluid. Journal of Minerals and Materials Characterization and Engineering, 10(02), 199.

Proceedings of the National Conference on
Trends and Advances in Mechanical Engineering
(TAME-2017) March 16-17, 2017 ISBN 978-93-5268-269-0
YMCA University of Science & Technology, Faridabad, Haryana
194
ALUMINIUM METAL MATRIX COMPOSITES- A REVIEW
Aasiya Parveen1*
, Nathi Ram Chauhan1, Mohd. Suhaib
2
1Department of Mechanical& Automation Engineering, Indira Gandhi Delhi Technical University for Women
(IGDTUW), Delhi-110006, India 2Department of MechanicalEngineering, Jamia Millia Islamia, New Delhi-110025, India
*Corresponding author: Research Scholar, IGDTUW, email- [email protected]
Abstract
Aluminium metal matrix composites (AMMC) are significant materials for various advanced engineering
applications i.e.; aerospace, automotive and industrial applications due to their superior physical and
mechanical properties. Aluminium metal matrix composites (AMMC) are produced from the addition of
reinforcement material into Aluminium as a base metal. Due to various types of reinforcement, the properties of
the AMMC gets improved depending upon the selection of the combination of reinforcement and Aluminium
base metal. Aluminium metal matrix composites (AMMC) have more advantages than unreinforced materials
because of the inclusion of reinforcement materials to enhance its properties. This review paper presents the
various types of reinforcement, its processing methods and application.
Keywords- Reinforcement; Aluminium metal matrix composites (AMMC), Matrix, Unreinforced materials.
1. Introduction
“Composite” materials are the combination of two or more insoluble materials which are of different chemical
and physical properties. Metal matrix composites (MMC) consist of the primary constituent i.e.; matrix as a base
metal and the other constituent i.e.; reinforcement that can be in the form of metallic (Aluminium, titanium,
etc.), organic (polymers) or inorganic (ceramic or glass). MMC are formed by the dispersion of reinforcing
material into a metal matrix to improve its various important properties.
Aluminium metal matrix composites (AMMC) consists of one primary constituent ‘Aluminium’ as a base metal
which provides load transfer and structural integrity and other constituent ‘reinforcement’ materials like silicon
and boroncarbides, graphite, Aluminium oxide, etc. to enhance the mechanical properties. AMMC have more
advantages than unreinforced materials because of the inclusion of reinforcement materials to enhance its
properties which are as follows:
1) Higher strength
2) Low density
3) Improved stiffness
4) Excellent fatigue resistance
5) High heat resistant
6) Improved corrosion resistant
7) Improved damping capabilities, etc.
1.1 Types of AMMC Reinforcements
AMMC can be reinforced with continuous and discontinuous reinforcements on the basis of specific
application. Reinforcement is further categorized as continuous fibres (monofilament), short fibres
(staple); whiskers and particulate (or platelet). Reinforcements are ceramics, typically oxides, nitrides
and carbides. The most commonly used reinforcements of AMMC are silicon carbide, silicon nitride,
Aluminium oxide and also titanium carbide, graphite, etc.
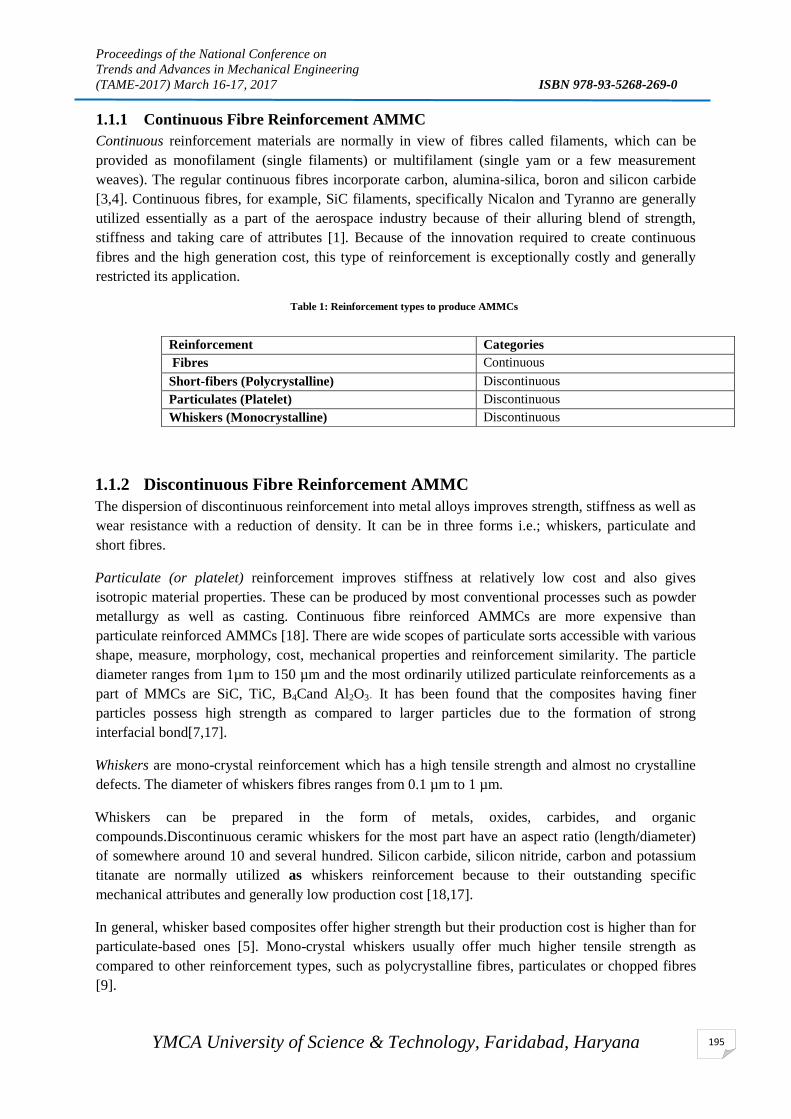
Proceedings of the National Conference on
Trends and Advances in Mechanical Engineering
(TAME-2017) March 16-17, 2017 ISBN 978-93-5268-269-0
YMCA University of Science & Technology, Faridabad, Haryana
195
1.1.1 Continuous Fibre Reinforcement AMMC
Continuous reinforcement materials are normally in view of fibres called filaments, which can be
provided as monofilament (single filaments) or multifilament (single yam or a few measurement
weaves). The regular continuous fibres incorporate carbon, alumina-silica, boron and silicon carbide
[3,4]. Continuous fibres, for example, SiC filaments, specifically Nicalon and Tyranno are generally
utilized essentially as a part of the aerospace industry because of their alluring blend of strength,
stiffness and taking care of attributes [1]. Because of the innovation required to create continuous
fibres and the high generation cost, this type of reinforcement is exceptionally costly and generally
restricted its application.
Table 1: Reinforcement types to produce AMMCs
1.1.2 Discontinuous Fibre Reinforcement AMMC
The dispersion of discontinuous reinforcement into metal alloys improves strength, stiffness as well as
wear resistance with a reduction of density. It can be in three forms i.e.; whiskers, particulate and
short fibres.
Particulate (or platelet) reinforcement improves stiffness at relatively low cost and also gives
isotropic material properties. These can be produced by most conventional processes such as powder
metallurgy as well as casting. Continuous fibre reinforced AMMCs are more expensive than
particulate reinforced AMMCs [18]. There are wide scopes of particulate sorts accessible with various
shape, measure, morphology, cost, mechanical properties and reinforcement similarity. The particle
diameter ranges from 1µm to 150 µm and the most ordinarily utilized particulate reinforcements as a
part of MMCs are SiC, TiC, B4Cand Al2O3. It has been found that the composites having finer
particles possess high strength as compared to larger particles due to the formation of strong
interfacial bond[7,17].
Whiskers are mono-crystal reinforcement which has a high tensile strength and almost no crystalline
defects. The diameter of whiskers fibres ranges from 0.1 µm to 1 µm.
Whiskers can be prepared in the form of metals, oxides, carbides, and organic
compounds.Discontinuous ceramic whiskers for the most part have an aspect ratio (length/diameter)
of somewhere around 10 and several hundred. Silicon carbide, silicon nitride, carbon and potassium
titanate are normally utilized as whiskers reinforcement because to their outstanding specific
mechanical attributes and generally low production cost [18,17].
In general, whisker based composites offer higher strength but their production cost is higher than for
particulate-based ones [5]. Mono-crystal whiskers usually offer much higher tensile strength as
compared to other reinforcement types, such as polycrystalline fibres, particulates or chopped fibres
[9].
Reinforcement Categories
Fibres Continuous
Short-fibers (Polycrystalline) Discontinuous
Particulates (Platelet) Discontinuous
Whiskers (Monocrystalline) Discontinuous
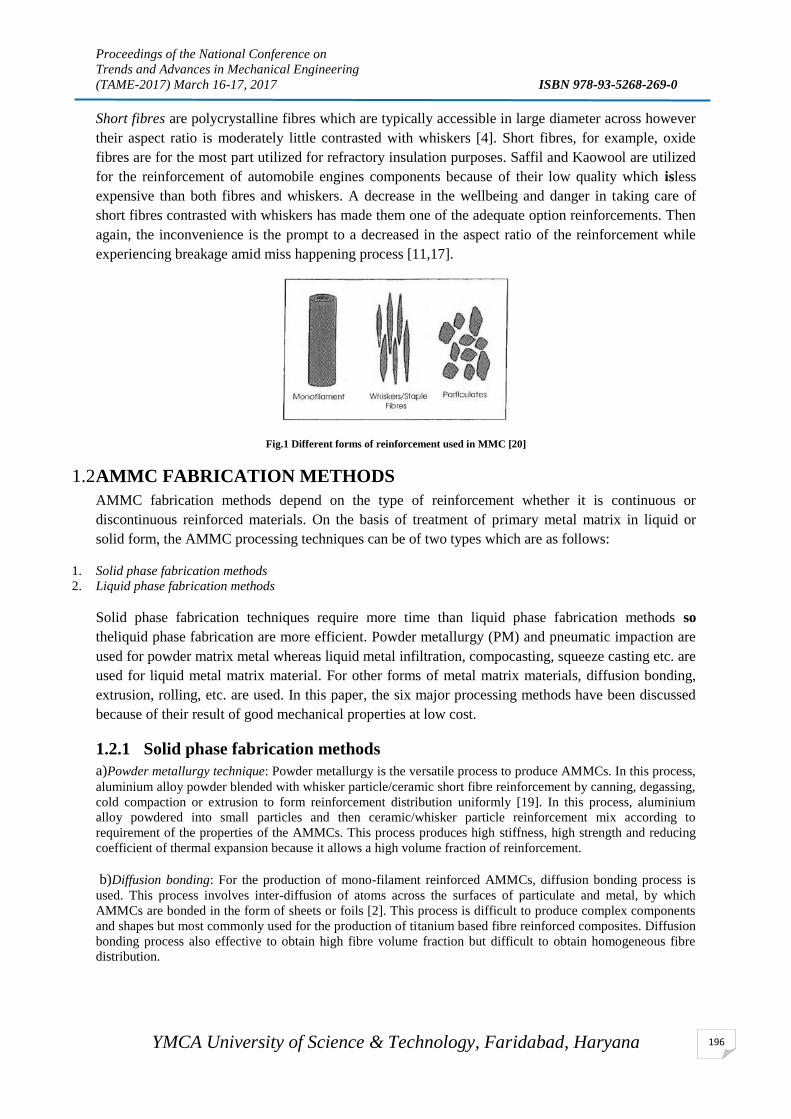
Proceedings of the National Conference on
Trends and Advances in Mechanical Engineering
(TAME-2017) March 16-17, 2017 ISBN 978-93-5268-269-0
YMCA University of Science & Technology, Faridabad, Haryana
196
Short fibres are polycrystalline fibres which are typically accessible in large diameter across however
their aspect ratio is moderately little contrasted with whiskers [4]. Short fibres, for example, oxide
fibres are for the most part utilized for refractory insulation purposes. Saffil and Kaowool are utilized
for the reinforcement of automobile engines components because of their low quality which isless
expensive than both fibres and whiskers. A decrease in the wellbeing and danger in taking care of
short fibres contrasted with whiskers has made them one of the adequate option reinforcements. Then
again, the inconvenience is the prompt to a decreased in the aspect ratio of the reinforcement while
experiencing breakage amid miss happening process [11,17].
Fig.1 Different forms of reinforcement used in MMC [20]
1.2 AMMC FABRICATION METHODS
AMMC fabrication methods depend on the type of reinforcement whether it is continuous or
discontinuous reinforced materials. On the basis of treatment of primary metal matrix in liquid or
solid form, the AMMC processing techniques can be of two types which are as follows:
1. Solid phase fabrication methods
2. Liquid phase fabrication methods
Solid phase fabrication techniques require more time than liquid phase fabrication methods so
theliquid phase fabrication are more efficient. Powder metallurgy (PM) and pneumatic impaction are
used for powder matrix metal whereas liquid metal infiltration, compocasting, squeeze casting etc. are
used for liquid metal matrix material. For other forms of metal matrix materials, diffusion bonding,
extrusion, rolling, etc. are used. In this paper, the six major processing methods have been discussed
because of their result of good mechanical properties at low cost.
1.2.1 Solid phase fabrication methods
a)Powder metallurgy technique: Powder metallurgy is the versatile process to produce AMMCs. In this process,
aluminium alloy powder blended with whisker particle/ceramic short fibre reinforcement by canning, degassing,
cold compaction or extrusion to form reinforcement distribution uniformly [19]. In this process, aluminium
alloy powdered into small particles and then ceramic/whisker particle reinforcement mix according to
requirement of the properties of the AMMCs. This process produces high stiffness, high strength and reducing
coefficient of thermal expansion because it allows a high volume fraction of reinforcement.
b)Diffusion bonding: For the production of mono-filament reinforced AMMCs, diffusion bonding process is
used. This process involves inter-diffusion of atoms across the surfaces of particulate and metal, by which
AMMCs are bonded in the form of sheets or foils [2]. This process is difficult to produce complex components
and shapes but most commonly used for the production of titanium based fibre reinforced composites. Diffusion
bonding process also effective to obtain high fibre volume fraction but difficult to obtain homogeneous fibre
distribution.

Proceedings of the National Conference on
Trends and Advances in Mechanical Engineering
(TAME-2017) March 16-17, 2017 ISBN 978-93-5268-269-0
YMCA University of Science & Technology, Faridabad, Haryana
197
1.2.2 Liquid phase fabrication methods
Liquid Infiltration Process: It is the process of producing AMMCs by infiltrating a porous reinforcement with a
molten matrix material [11,17]. This process should be possible under inert gas pressure, atmospheric pressure
or vacuum [6,17]. Vacuum infiltration process is most commonly used method for the production of AMMCs
because of higher fibres surface activity and better wettability. In this method, alumina whisker reinforcement
with aluminium alloy can be fabricated [17]. Due to low melting points of metal matrix alloys such as
Magnesium and Aluminium, liquid infiltration process is used[14].
Squeeze casting: Because of the way that the greater part of the support materials, for example, silicon carbide,
carbon and alumina don't wet appropriately in liquid metals, it is hard to create composites by liquid infiltration
method. The procedure of squeeze casting begins with a fibre or particulate preform which is preheated to a few
hundred degrees centigrade, which is less than the melting temperature of matrix and after that put into a metal
die. Matrix metal such as aluminium or magnesium is then heated to its melting temperature and after that
firmly pressed into the fibre preform using hydraulic pressure (70-200MPa) press to shape the blend of molten
metal and fibfre. This is followed by solidification under high pressure (70 to l00MPa). The high pressure
connected is to guarantee that the metal wets the fibres and strengths the liquid metal to stream into the preform,
filling it totally [1,17]. The aftereffect of this procedure is that a response zone and voids won't create at the
interface of the matrix and reinforcement. It is for the most part pertinent to composites utilizing a wide range of
reinforcement, for example, Al2O3/Al, SiC/Al and C/Mg composites [12].
Compocasting technique: Compocasting is the enhanced procedure of slush/stir casting which additionally is
the most conservative technique to produce composite by means of discontinuous reinforcement when
contrasted with powder metallurgy, high pressure squeeze casting [13,17].The compo casting procedure begins
with a metal alloy being set in the framework by blade assembly to get jointly set up. Chamber is then emptied
and composite issuperheated over its melting temperature and blending is started. Reinforcement is included,
stirring is kept on advancing wetting between the reinforcement and matrix. The dissolve is at that point
superheated to over its liquidus temperature and base filled into a mould of graphite. The expanded time at
lower temperatures after expansion will help in advancing wetting and enhance bond development. Finally, the
melt which contained non-metallic substance is moved into lower half of die of the press and the top half of die
is converted into shape and harden the composite by applying an appropriate pressure [15,12].
In-situ processing (reactive processing): There are a few unique procedures that would fall under this
classification including liquid-gas, liquid-solid, liduid-liquid and blended salt responses. In these procedures,
refractory reinforcement are made in the AMMC. One of the illustrations is directional oxidation of aluminum
otherwise it is called DIMOX process. In this procedure, the composite of Al–Mg is put on the highest point of
ceramic preform in a crucible. The whole assembly is heated to an appropriate temperature in the climate of free
streaming nitrogen bearing gas blend. Al–Mg composite soon after melting, infiltrates into the preform and
composite is formed. Martin–Marietta's exothermic scattering process or the XDTm procedure is another in-situ
method for composite handling.XDTm process is utilized to create TiB2 reinforced AMMCs. The procedure is
adaptable and permits development of both hard and delicate periods of different sizes and morphologies that
incorporates whiskers, particles and platelets in AMMCs.
2 Applications of ammc
AMMCs now have a demonstrated reputation as effective "innovative" materials in a scope of uses. AMMC use
gives noteworthy advantages including execution benefits (component lifetime, enhanced efficiency), financial
advantages and ecological advantages. AMMCs have different kind of reinforcements and produced both by
solid state and liquid state handling, have discovered their approach to various practical applications.
Particulate reinforcedaluminium metal matrix composites (PAMMC) are fabricated by powder metallurgy/stir
casting/liquid infiltration/in situ fabricating methods. The reinforcements of PAMMCs are particulates of TiC,
Al2O3, TiB2, B4C. PAMMCs have been effectively utilized as components of automobile, aviation, missile, gas
turbine engine, etc. Short fibre reinforced AMMCs are being utilized as a part of cylinder and barrel liner
applications. The production of whisker-reinforced AMMCs has been extremely constrained due to handling
issue of ceramic whiskers.However, with proper security handling,SiC whisker reinforced AMMCs have been
delivered and utilized as track shoes as a part of military tanks. Utilization of whisker-reinforced AMMCs as
track shoes helps in diminishing the heaviness of the tank. Carbon fibre (continuous) reinforced AMMCs have
been utilized as receiving wave guides for the Hubble Space Telescope.

Proceedings of the National Conference on
Trends and Advances in Mechanical Engineering
(TAME-2017) March 16-17, 2017 ISBN 978-93-5268-269-0
YMCA University of Science & Technology, Faridabad, Haryana
198
3 Summary and concluding remarks
This paper presents the various types of reinforcement, used for the production of Aluminium metal matrix
composites and itseffects on performance.
1. On the basis of literature reviewed, it is clear that in the field of metallurgy, AMMCs plays an important role.
2. Ratio of reinforcements and type of reinforcements used, are the controlling factors of important properties of
the composites.
3. Mechanical assemblies, automotive and aerospace industries uses particle reinforced aluminium metal matrix
composites.
4. Although, the continuous fibre reinforced AMMCs are having good strength and stiffness but still they are a bit
costly particulate fibre reinforced AMMCs.
5. The addition of reinforcements into the metallic matrix improves the stiffness, specific strength, wear, creep and
fatigue properties compared to the conventional engineering materials.
6. Due to its light weight and high strength, AMMCs are rapidly finding their way to be commercially used in the
industries.
7. There is need to improve the damage tolerant properties particularly fracture toughness and ductility of
AMMCs.
8. Optimum work should be done to produce high quality and low cost reinforcements from industrial wastes and
by-products.
9. There is a greater need to classify different grades of AMMCs based on properties profile and manufacturing
cost.
10. There is an urgent need to develop simple, economical and portable non-destructive kits to quantify undesirable
defects in AMMCs.
References [1] MK Surappa, Aluminium Matrix Composites: Challenges and Opportunities, Sadhana 28, Parts 1 and 2, 2003,
28 (1-2), 319-334.
[2] RK Gangaram and PM Sonawane, Preparation of Aluminium Matrix Composites by using Stir Casting Method, International Journal of Engineering and Advanced Technology, 2013, 3 (2), 61-65.
[3] Stacey M.H., Production and Characterisation of Fibres for MMC, Materials Science Technology, Vol. 4, pp. 227-239, March 1988.
[4] Degischer H.P., Schulz P., Lacom W., Properties of Continuous Fibre Reinforced A l- and Mg- Matrix Composites Produced by Gas Pressure Infiltration, Key Engineering Materials, Vol. 127-131, pp 99-110, 1997.
[5] Webster D., Effect of Lithium on the Mechanical Properties and Microstructure of SiC Whisker Reinforced Aluminium Alloys, Metallurgical Transactions A, Vol. 13A, pp.1511-1519, August, 1982.
[6] Suresh S., Mortensen A., Needleman A., Fundamentals of Metal Matrix Composites, Butterworth-Heinemann, 1993.
[7] Lloyd D.J., Particle Reinforced Aluminium and Magnesium Matrix Composites, International Materials Reviews, Vol. 39, pp. 1-23, 1994.
[8] LA Dobrazanski, M Kremzer, AJ Nowak and A Nagel, Aluminium Matrix Composites Fabricated by Infiltration Method,Archieves of Materials Science and Engineering, 2009, 36 (1), 5-11.
[9] ASM Handbook, Vol. 19: Fatigue and Fracture, A SM International, Metal Park, Ohio, 1997.
[10] XQ Zhang, HW Wang, LH Liao, XY Teng and NH Ma, Processing, Structure and Mechanical Properties of Composites, Journal of Material Science Letters, 2005, 59, 2105.
[11] Clyne T.W., Withers P.J., An Introduction to Metal Matrix Composites, Cambridge University Press, 1993.
[12] William G., Squeeze forms - Combines Casting with Forging, Metallurgia,pp.228-232,Jun,1983.
[13] Midling T ., Grong O., Processing and Properties of Particle Reinforced Al-SiC MMCs, Key Engineering Material, Vol. 104-107, Transaction Technology Publication, Switzerland, pp. 329-354, 1995.
[14] Clyne T.W., Mason J.F., The Squeeze Infiltration Process for Fabrication of Metal Matrix Composites, Metallurgical Transaction A, Vol. 18A, pp. 1519- 1530, August, 1987
[15] Me Kimpson M.G., Scott T.E., Processing and Properties of Metal Matrix Composites Containing Discontinuous Reinforcement, Materials Science and Engineering, Vol. A107, pp. 93-106, 1989.
[16] BC Kandpal, J Kumar and H Singh, Production Technologies of Metal Matrix Composite: A Review, International Journal of Research in Mechanical Engineering and Technology, 2014, 2(2), 27-32.
[17] Gareth O ’Donnell,, Processing Optimisation and Numerical Modelling of Powder Metallurgical Aluminium Matrix Composites, Ph.D. Thesis, Dublin City University, Dublin, Ireland, 1999.
[18] Fluda M.D., Hashmi M.S.J., El-Baradie M.A., MMCs: Materials Manufacturing and Mechanical Properties, Key Engineering Materials, Vol. 104-107, Transaction Technology Publication, Switzerland, pp. 37-64, 1995.

Proceedings of the National Conference on
Trends and Advances in Mechanical Engineering
(TAME-2017) March 16-17, 2017 ISBN 978-93-5268-269-0
YMCA University of Science & Technology, Faridabad, Haryana
199
[19] DK Koli, G Agnihotri and R Purohit, Properties and Characterisation of Al-Al2O3Processed by Casting and PM Routes, International Journal of Latest Trends in Engineering and Technology, 2013, 2(4), 486-496.
[20] Rees D.W.A., Gatehouse W., Liddiard M, Tensile and Compressive Behaviour of a Particulate Metal Matrix Composites, Proceeding of Euroworkshop, pp. 155-168, August 1995.
[21] SV Nair, JKTien and RC Bates, International Metals Reviews, 1985, 30 (1), 285-297.
[22] B. V. Ramnath , C. Elanchezhian , R.M. Annamalai, S.Aravind , T. Sri Ananda Atreya , V. Vignesh, ‘Aluminium Metal Matrix Composites - A Review’, Rev.Adv. Mater. Sci. 38 (2014) 55-60.

Proceedings of the National Conference on
Trends and Advances in Mechanical Engineering
(TAME-2017) March 16-17, 2017 ISBN 978-93-5268-269-0
YMCA University of Science & Technology, Faridabad, Haryana
200
NOISE REDUCTION USING GLASS FIBRE REINFORCED
POLYMER GEAR
Atul Sharma1, M.L.Aggarwal
2 & Lakhwinder Singh
3
1Research Scholar, Mechanical Engineering. Department, YMCA University of Sc. &Tech., Faridabad,
Haryana, India 2,3
Professor, Mechanical Engg. Department, YMCA University of Sc &Tech., Faridabad, Haryana, India
Abstract
Gears are the machine elements that transmit power, rotation and torque. Noise is one of the factor which
demands proper selection of cutting speed during generation of teeth. Here an attempt has been made to study
the effect of cutting speed, while machining using gear hobbing process for the material of glass fiber
reinforced polymer and steel. The noise level of these cut gears are tested on a test rig with the help of sound
meter. By cutting the gears of this material at cutting speed of 20,30 and 40 m/minute. It has been found that
glass fibre reinforced polymer gears cut at higher cutting speed resulted in decreased noise level than steel .
Keywords: Cutting speed , GFRP, gear noise, steel.
1. Introduction Gear failure due to teeth breaking is not a problem but noise reduction in operation is required for reducing
vibration level in vehicles. Noise is result of vibration that needs to be controlled during operation. With the
demands for silent gear boxes transmitting more power at higher speeds, non metallic gears are used to reduce
noise. Feed rate is an important parameter in the machining of tooth profile to minimize noise, structural
instability and fatigue failure of components. Non metallic gears need controlled cutting speed.
GFRP material plays an important role in reducing the gear noise. Defining the tolerances of gear are the most
common approaches, design engineers take to minimize noise, but both add cost to the finished part and strain
the relationship between the machine shop and the end user. A third, but often overlooked, alternative is to use a
material that has high noise damping capabilities [1]. Most of the researchers put their efforts on replacement of
steel with glass fiber composites in the web of the gear between the gear teeth and the metallic hub that attaches
to the torque-applying shaft [2]. Cutter speeds up to 450-500 strokes per minute are generally suitable for finish
cut applications. The exact speed of course depends on the actual machinabilty of the gear materials. With the
increase in surface finish, the noise of the gears reduces for GFRP. It is desirable to increase to the feed rates for
GFRP. Visco elastic behavior of the polymer, which is mainly responsible for the sound absorption, is altered
by the addition of short fibers [3]. Addition of high modulus fibers to the base polymer matrix reduces the
damping characteristics of the composite [4]. Dynamic mechanical analysis carried out on unreinforced Nylon
6/6, 20% short glass and 20% carbon fiber reinforced Nylon 6/6 gear materials indicates the reduction of
damping factor due to the incorporation of fibers [5]. Test results indicated that the reinforced gears generate
less gear mesh noise than unreinforced gears.
2. Method The proposed gear pair was constructed by taking pinion with 24 teeth and gear with 48 teeth .It was rotated by
12V, DC motor. The speed of revolution of gear was recorded by non-contact type tachometer. The module,
number of teeth, face width and other parameters are given in the Table 1.
The mechanical properties of AISI 4140 annealed steels is having ultimate tensile strength of 655 MPa, Yield
strength of 417 MPa, elongation 25.7%, reduction in area 57%, Brinell hardness of 197 HB, izod impact
strength of 54.5J.
For the gears of two materials, machining is carried out on gear hobbing machine at cutting speed of 20,30 and
40 m/min for hob dia of 105mm.
Table 1.: Specification of gear and pinion.
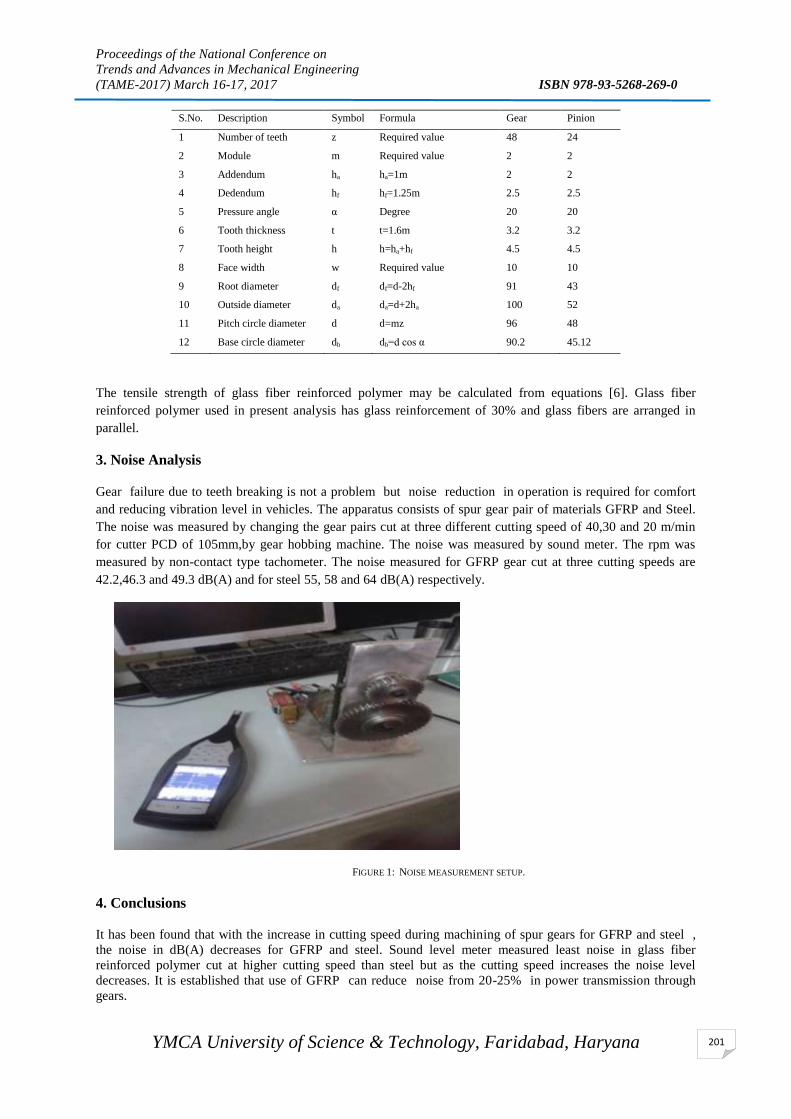
Proceedings of the National Conference on
Trends and Advances in Mechanical Engineering
(TAME-2017) March 16-17, 2017 ISBN 978-93-5268-269-0
YMCA University of Science & Technology, Faridabad, Haryana
201
S.No. Description Symbol Formula Gear Pinion
1 Number of teeth z Required value 48 24
2 Module m Required value 2 2
3 Addendum ha ha=1m 2 2
4 Dedendum hf hf=1.25m 2.5 2.5
5 Pressure angle α Degree 20 20
6 Tooth thickness t t=1.6m 3.2 3.2
7 Tooth height h h=ha+hf 4.5 4.5
8 Face width w Required value 10 10
9 Root diameter df df=d-2hf 91 43
10 Outside diameter da da=d+2ha 100 52
11 Pitch circle diameter d d=mz 96 48
12 Base circle diameter db db=d cos α 90.2 45.12
The tensile strength of glass fiber reinforced polymer may be calculated from equations [6]. Glass fiber
reinforced polymer used in present analysis has glass reinforcement of 30% and glass fibers are arranged in
parallel.
3. Noise Analysis
Gear failure due to teeth breaking is not a problem but noise reduction in operation is required for comfort
and reducing vibration level in vehicles. The apparatus consists of spur gear pair of materials GFRP and Steel.
The noise was measured by changing the gear pairs cut at three different cutting speed of 40,30 and 20 m/min
for cutter PCD of 105mm,by gear hobbing machine. The noise was measured by sound meter. The rpm was
measured by non-contact type tachometer. The noise measured for GFRP gear cut at three cutting speeds are
42.2,46.3 and 49.3 dB(A) and for steel 55, 58 and 64 dB(A) respectively.
FIGURE 1: NOISE MEASUREMENT SETUP.
4. Conclusions
It has been found that with the increase in cutting speed during machining of spur gears for GFRP and steel ,
the noise in dB(A) decreases for GFRP and steel. Sound level meter measured least noise in glass fiber
reinforced polymer cut at higher cutting speed than steel but as the cutting speed increases the noise level
decreases. It is established that use of GFRP can reduce noise from 20-25% in power transmission through
gears.

Proceedings of the National Conference on
Trends and Advances in Mechanical Engineering
(TAME-2017) March 16-17, 2017 ISBN 978-93-5268-269-0
YMCA University of Science & Technology, Faridabad, Haryana
202
5. References
1. Robert O’Rourke, Cast Iron: A Solid Choice for Reducing Gear Noise, Gear Technology, Sept.1999.
2. Ghosh S;Sahoo P;Goutam S.Wear characteristics optimization of Al-7.5% Sic Metal Matrix Composite Using Taguchi Method,Advanced Materials Manufacturing & Characteristics,Vol4 Issue2 (2014),Journal home page:www.ijammc-griet.com.
3. Gun-Hee Kim, Jeong-Won Lee, and Tae-Il Seo, Durability Characteristics Analysis of Plastic Worm Wheel with Glass Fiber
Reinforced Polyamide, Materials 2013, 6, 1873-1890; doi:10.3390/ma6051873
4. El-Sayed Youssef El-Kady, Tamer Samir Mahmoud, Ahmed Abdel-Fattah El-Betar, Mohamed Abdel-Aziz Sayed , Dynamic
Behaviour of Cast A356/Al2O3 Aluminum Metal Matrix Nanocomposites , Materials Sciences and Applications, 2012, 3, 815-820. 5.
6. Gun-Hee Kim, Jeong-Won Lee, and Tae-Il Seo, Durability Characteristics Analysis of Plastic Worm Wheel with Glass Fiber Reinforced Polyamide, Materials 2013, 6, 1873-1890; doi:10.3390/ma6051873
7. El-Sayed Youssef El-Kady, Tamer Samir Mahmoud, Ahmed Abdel-Fattah El-Betar, Mohamed Abdel-Aziz Sayed , Dynamic Behaviour of Cast A356/Al2O3 Aluminum Metal Matrix Nanocomposites , Materials Sciences and Applications, 2012, 3, 815-820.
8. Z.H.Li, R.Y.Rong,Y.X.Li, J. Li,Effect of Fiber Length on Mechanical Properties of Short Carbon Fiber Reinforced PTFE Composite, Advanced Materials Research, Vols. 311-313, pp. 193-196, Aug. 2011.
9. Zhong Hu & Mohammad Robiul Hossan,Strength Evaluation and Failure Prediction of Short Carbon Fiber Reinforced Nylon Spur Gears by Finite Element Modeling, Appl Compos Mater, DOI 10.1007/s10443-012-9274-7.
10. Senthilvelan, S., Gnanamoorthy, R.: Damping characteristics of unreinforced, glass and carbon fibre reinforced nylon 6/6 spur gears. Polym. Test. 25, 56–62 (2006).

Proceedings of the National Conference on
Trends and Advances in Mechanical Engineering
(TAME-2017) March 16-17, 2017 ISBN 978-93-5268-269-0
YMCA University of Science & Technology, Faridabad, Haryana
203
MAGNETIC ABRASIVE FINISHING SET UP
Vipin Kaushik1 , Sumit Sharma
2 Kumar Harshit
3
1,2
Assistant Professor, ME Department, Amity University, Uttar Pradesh, Noida
3 UG Student, ME Department, Amity University, Uttar Pradesh, Noida
Abstract
This paper presents us the finishing and smoothening of different complex shapes by the introduction of an
electromagnets. This set up provides us with the external as well as internal finishing of shapes. It is an
advanced finishing process in which work piece is kept between two electromagnets and controlled amount of
force is provided for the finishing of the work piece.The setup is placed on any of the lathe machine and can be
used for finishing of all kinds of work piece i.e. cylindrical, spherical etc. The abrasive powder is prepared
which is used for the finishing process, the finishing of the work piece depends upon various parameters like:
cutting speed, feed, depth of cut etc. The abrasive material and the electromagnets play a crucial role in
providing the finishing of the work piece.
Keywords: Magnetic abrasive, conventional and nonconventional machining, electromagnets.
1. INTRODUCTION
Magnetic Abrasive finishing was first mentioned by a Japanese scientist Harry Coats in the year 1938 and later
on scientist worked upon the external and internal finishing of the work piece. This process is used for the
finishing of the various complex and simple work piece by the use of electromagnetic force generated in the
finishing region.
Working Principle:
In this finishing process the air gap between the work piece and the electromagnets is filled with the abrasive
powder and then controlled amount of force is generated by the means of electromagnets and finishing took
place. The finishing of the work piece takes place by removing the surface in the form of the debris particles by
the use of the abrasive materials in the finishing zone. The abrasives can be of silicon carbide (SiC) , boron
nitride, diamond .The line of magnetic force is when power is applied and the electromagnets and abrasive
particles join each other and formation of abrasive brush takes place between the poles and work piece. The
finishing depends upon the amount of force generated by the force generated by the electromagnets and the
abrasive powder .
Mechanism of MAF:
The abrasive brush produced during the finishing process have various cutting edges depending upon the effects
produced by the electromagnet and quality of abrasive used. The abrasive brush plays a crucial role in finishing
of the work piece . The effects of the abrasive brush can be controlled and changed by the amount of
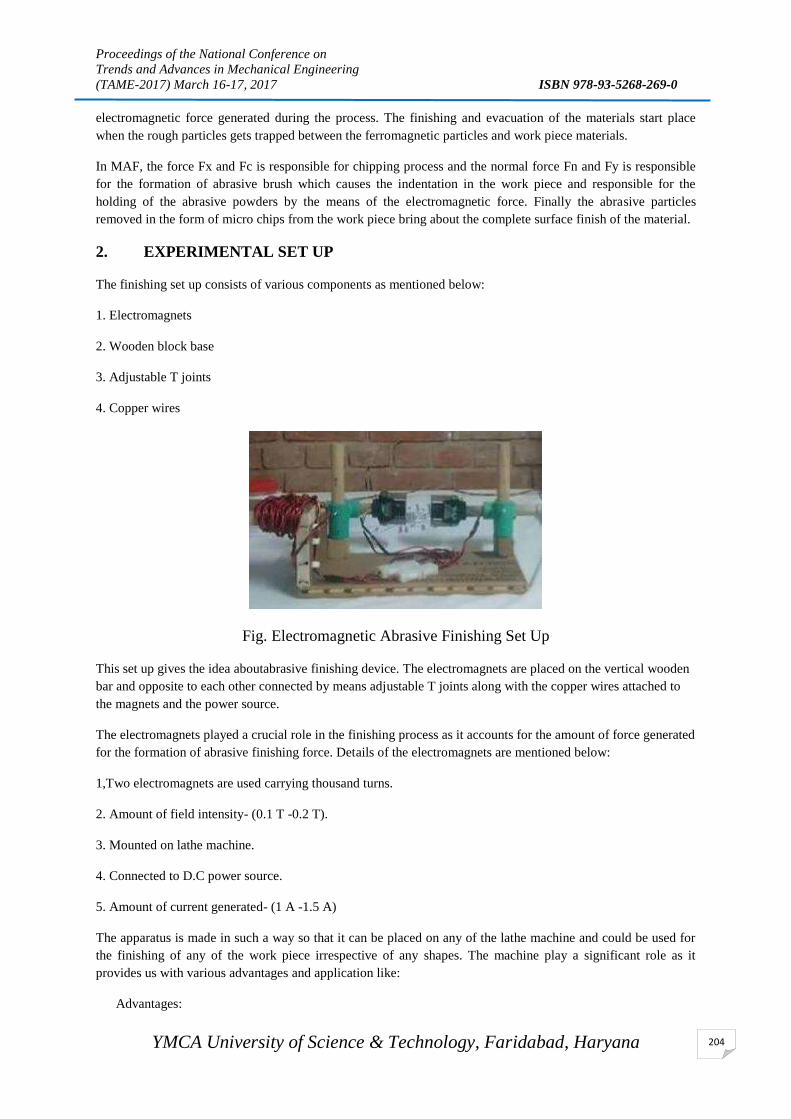
Proceedings of the National Conference on
Trends and Advances in Mechanical Engineering
(TAME-2017) March 16-17, 2017 ISBN 978-93-5268-269-0
YMCA University of Science & Technology, Faridabad, Haryana
204
electromagnetic force generated during the process. The finishing and evacuation of the materials start place
when the rough particles gets trapped between the ferromagnetic particles and work piece materials.
In MAF, the force Fx and Fc is responsible for chipping process and the normal force Fn and Fy is responsible
for the formation of abrasive brush which causes the indentation in the work piece and responsible for the
holding of the abrasive powders by the means of the electromagnetic force. Finally the abrasive particles
removed in the form of micro chips from the work piece bring about the complete surface finish of the material.
2. EXPERIMENTAL SET UP
The finishing set up consists of various components as mentioned below:
1. Electromagnets
2. Wooden block base
3. Adjustable T joints
4. Copper wires
Fig. Electromagnetic Abrasive Finishing Set Up
This set up gives the idea aboutabrasive finishing device. The electromagnets are placed on the vertical wooden
bar and opposite to each other connected by means adjustable T joints along with the copper wires attached to
the magnets and the power source.
The electromagnets played a crucial role in the finishing process as it accounts for the amount of force generated
for the formation of abrasive finishing force. Details of the electromagnets are mentioned below:
1,Two electromagnets are used carrying thousand turns.
2. Amount of field intensity- (0.1 T -0.2 T).
3. Mounted on lathe machine.
4. Connected to D.C power source.
5. Amount of current generated- (1 A -1.5 A)
The apparatus is made in such a way so that it can be placed on any of the lathe machine and could be used for
the finishing of any of the work piece irrespective of any shapes. The machine play a significant role as it
provides us with various advantages and application like:
Advantages:

Proceedings of the National Conference on
Trends and Advances in Mechanical Engineering
(TAME-2017) March 16-17, 2017 ISBN 978-93-5268-269-0
YMCA University of Science & Technology, Faridabad, Haryana
205
1. Surface finishing is of the optimum level.
2. Minimizes the damage of the work piece.
3. No requirement of any dressing as it operates on the abrasive finishing brush.
4. It can be placed on any of the Lathe machine as it comprises if an adjustable electromagnets hold by T
joints.
3. Applications:
1. Used in aerospace components.
2. Finishing and smoothing of bearings.
3. Components required with roughness of micro meter range.
4. DESIGNING PROCESS:
The components as well as the detail of the set up have been explained above , this content will give us an idea
about the designing of the set up. The set up is designed in such a way so that it could be get hold to any of the
lathe machine in the world i.e. made according to the generalization of all the available lathe machine. The
electromagnets are placed opposite to each other and through adjustable joints it is made free to move in any
direction which makes it more significant in finishing of the work piece of any shapes. The abrasive powder
used are made of alumina for the experimentation purpose and the electromagnets are used in such a way that it
produces the required field intensity and provides with the best surface finish of the optimum range. The set up
is made up of wooden base which makes it potable so that it can be easily carried from one place to other. This
set up sets a benchmark in the manufacturing industry in terms of the finishing of any of the work piece
available in the market.
5. CONCLUSIONS AND FUTURE SCOPE
The set up provides with the best surface finish by the use of the electromagnetic force and the abrasives which
is responsible for the formation of the abrasive finishing brush. It can be concluded that the rotational speed of
the electromagnets and the weight of abrasive powder play a significant role in the finishing of the work piece
and any alteration in these parameters can make a wide difference in the finishing of the work piece. The
theoretical aspects used in the manufacturing industry which is responsible for the finishing depends upon the
quality and features of abrasives used and for this set up alumina plays a significant role in the finishing of the
work piece.
Future Scope:
1. Replacement of abrasive powders with gel.
2. Parameters including feed rate and the electromagnetic turns can be improvised and studies further.
3. The shape of the work piece can also be made more advanced and complex.
References
Shinmura T, Takajava K, Hatano E (1985) Study on magnetic abrasive process—application to plane finishing.
Bull JpnSocPrecisEng 19(4):289–291
Yamaguchi H, Shinmura T (1999) Study of the surface modification resulting from an internal magnetic
abrasive finishing process. Wear 225–229:246–255
Jain VK, Kumar P, Behera PK, Jayaswal SC (2001) Effects of working gap and circumferential speed on the
performance of magnetic abrasive finishing process. Wear 250:384–390

Proceedings of the National Conference on
Trends and Advances in Mechanical Engineering
(TAME-2017) March 16-17, 2017 ISBN 978-93-5268-269-0
YMCA University of Science & Technology, Faridabad, Haryana
206
Kim J, Choi M (1995) Simulation for the prediction of surface accuracy in magnetic abrasive machining. J
Mater Process Technol 53:630–642
Fox M, Agarwal K, Shinmura T, Komanduri R (1994) Magnetic abrasive finishing of rollers. Annals CIRP
43(1):181–184
Yamaguchi H, Shinmura T (2000) Study of an internal magnetic abrasive finishing using a pole rotation system:
discussion of characteristic abrasive behavior. PrecisEng 24:237–244
Proceedings of the National Conference on
Trends and Advances in Mechanical Engineering
(TAME-2017) March 16-17, 2017 ISBN 978-93-5268-269-0
YMCA University of Science & Technology, Faridabad, Haryana
207
REVIEW OF BEARING FAULTS AND THEIR MONITORING TECHNIQUES IN
ROTARY MACHINES
Surender Singh1, Vikas Kumar
2, O. P. Mishra
3
1,3Asst. Prof.,
2Prof. Department of Mechanical Engineering
YMCA University of Science and Technology
Email: [email protected]
Abstract
This paper attempts to summarise and review the recent researches and developments of faults in the bearings.
Different condition monitoring techniques such as vibration monitoring, current monitoring, temperature
monitoring, Acoustic emission and chemical monitoring are discussed in this paper. It is found that there is
increase in sensor based techniques for the fault detection. To get the complete knowledge, a number of
research papers are studied during the writing of this paper. It is found that vibration monitoring techniques
widely used by the researchers.
Keywords: Vibration Monitoring, Bearing Faults, Current Monitoring.
1. Introduction:
Bearing is major part of the rotating machines. Bearings are highly engineered, precision made components that
enable machinery to move at extremely high speeds and carry remarkable loads with ease and efficiency.
Bearings must be able to offer high precision, reliability and durability, as well as the ability to rotate at high
speeds with minimal noise and vibration. Bearings are found in applications ranging from automobiles,
airplanes, computers, construction equipment, machine tools, DVD players, refrigerators and ceiling fans
1.1 Types of bearings and their applications; Various kind of bearings are found in applications as
well in research articles, some are listed here.
1.1.1 Ball Bearings: Roller blades, wheel bearings,
1.1.2 Cylindrical & Needle Roller Bearings: Gearboxes and transmissions, machine tool and construction
equipment.
1.1.3 Tapered Roller Bearings: Heavy industrial, truck and wheel applications with combined radial and axial
loads. Some examples are manual transmissions, gearboxes, power generation and other process equipment.
1.1.4 Spherical Roller Bearings: Gearboxes, conveyors, pulp and paper machines and other process equipment
1.2 Types of faults: The rolling-elements of a bearing ride on races. The large race that goes into a bore is
called the outer race, and the small race that the shaft rides in is called the inner race. Due to fault there is
development of vibrations in the bearing which transferred to the whole machinery lead to the machine
breakdown.
1.2.1 Inner race fault: When inner race is damaged as shown in figure we called it inner race fault.
1.2.2 Outer race fault: When outer race is damaged we call it outer race fault
1.2.3 Ball defects: When the ball of the bearing is damaged we called it ball defect.
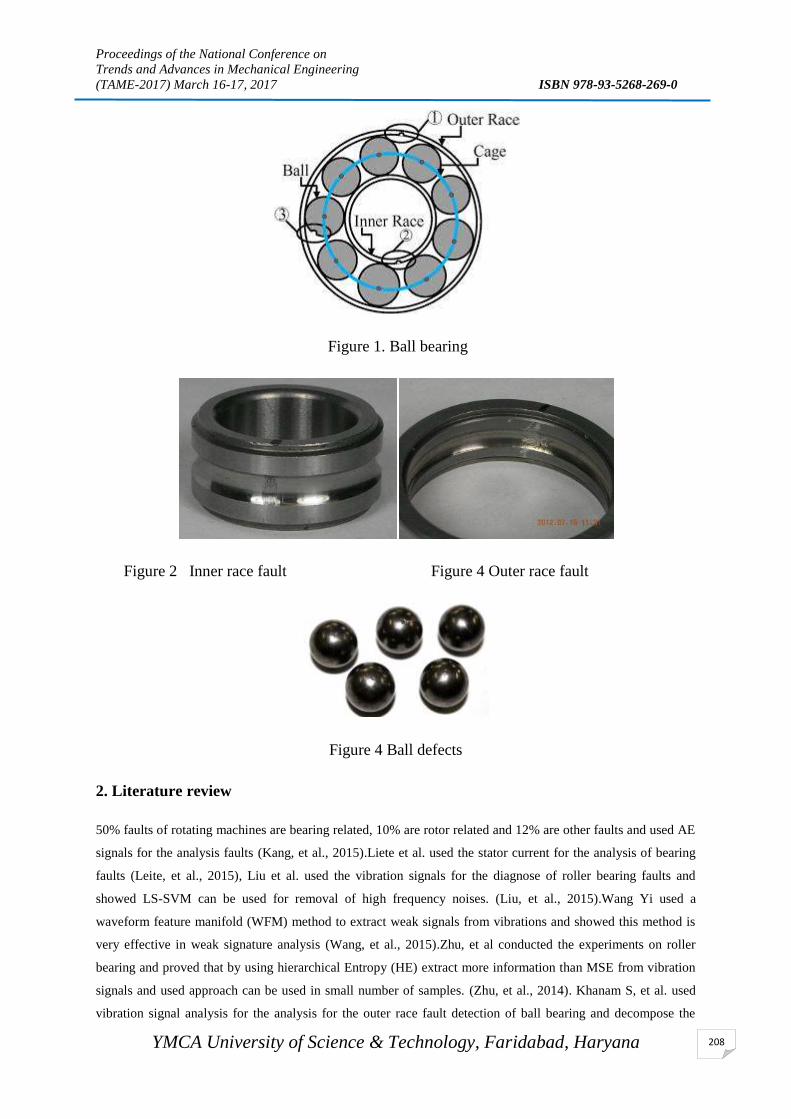
Proceedings of the National Conference on
Trends and Advances in Mechanical Engineering
(TAME-2017) March 16-17, 2017 ISBN 978-93-5268-269-0
YMCA University of Science & Technology, Faridabad, Haryana
208
Figure 1. Ball bearing
Figure 2 Inner race fault Figure 4 Outer race fault
Figure 4 Ball defects
2. Literature review
50% faults of rotating machines are bearing related, 10% are rotor related and 12% are other faults and used AE
signals for the analysis faults (Kang, et al., 2015).Liete et al. used the stator current for the analysis of bearing
faults (Leite, et al., 2015), Liu et al. used the vibration signals for the diagnose of roller bearing faults and
showed LS-SVM can be used for removal of high frequency noises. (Liu, et al., 2015).Wang Yi used a
waveform feature manifold (WFM) method to extract weak signals from vibrations and showed this method is
very effective in weak signature analysis (Wang, et al., 2015).Zhu, et al conducted the experiments on roller
bearing and proved that by using hierarchical Entropy (HE) extract more information than MSE from vibration
signals and used approach can be used in small number of samples. (Zhu, et al., 2014). Khanam S, et al. used
vibration signal analysis for the analysis for the outer race fault detection of ball bearing and decompose the
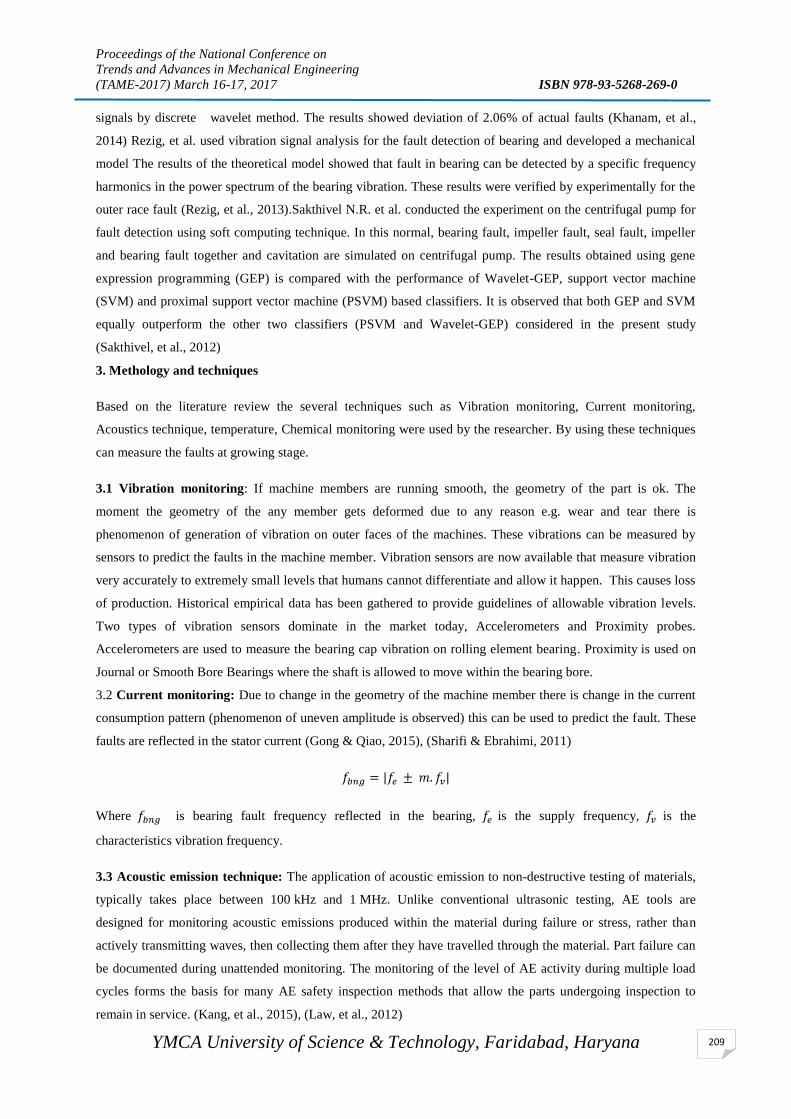
Proceedings of the National Conference on
Trends and Advances in Mechanical Engineering
(TAME-2017) March 16-17, 2017 ISBN 978-93-5268-269-0
YMCA University of Science & Technology, Faridabad, Haryana
209
signals by discrete wavelet method. The results showed deviation of 2.06% of actual faults (Khanam, et al.,
2014) Rezig, et al. used vibration signal analysis for the fault detection of bearing and developed a mechanical
model The results of the theoretical model showed that fault in bearing can be detected by a specific frequency
harmonics in the power spectrum of the bearing vibration. These results were verified by experimentally for the
outer race fault (Rezig, et al., 2013).Sakthivel N.R. et al. conducted the experiment on the centrifugal pump for
fault detection using soft computing technique. In this normal, bearing fault, impeller fault, seal fault, impeller
and bearing fault together and cavitation are simulated on centrifugal pump. The results obtained using gene
expression programming (GEP) is compared with the performance of Wavelet-GEP, support vector machine
(SVM) and proximal support vector machine (PSVM) based classifiers. It is observed that both GEP and SVM
equally outperform the other two classifiers (PSVM and Wavelet-GEP) considered in the present study
(Sakthivel, et al., 2012)
3. Methology and techniques
Based on the literature review the several techniques such as Vibration monitoring, Current monitoring,
Acoustics technique, temperature, Chemical monitoring were used by the researcher. By using these techniques
can measure the faults at growing stage.
3.1 Vibration monitoring: If machine members are running smooth, the geometry of the part is ok. The
moment the geometry of the any member gets deformed due to any reason e.g. wear and tear there is
phenomenon of generation of vibration on outer faces of the machines. These vibrations can be measured by
sensors to predict the faults in the machine member. Vibration sensors are now available that measure vibration
very accurately to extremely small levels that humans cannot differentiate and allow it happen. This causes loss
of production. Historical empirical data has been gathered to provide guidelines of allowable vibration levels.
Two types of vibration sensors dominate in the market today, Accelerometers and Proximity probes.
Accelerometers are used to measure the bearing cap vibration on rolling element bearing. Proximity is used on
Journal or Smooth Bore Bearings where the shaft is allowed to move within the bearing bore.
3.2 Current monitoring: Due to change in the geometry of the machine member there is change in the current
consumption pattern (phenomenon of uneven amplitude is observed) this can be used to predict the fault. These
faults are reflected in the stator current (Gong & Qiao, 2015), (Sharifi & Ebrahimi, 2011)
𝑓𝑏𝑛𝑔 = |𝑓𝑒 ± 𝑚. 𝑓𝑣|
Where 𝑓𝑏𝑛𝑔 is bearing fault frequency reflected in the bearing, 𝑓𝑒 is the supply frequency, 𝑓𝑣 is the
characteristics vibration frequency.
3.3 Acoustic emission technique: The application of acoustic emission to non-destructive testing of materials,
typically takes place between 100 kHz and 1 MHz. Unlike conventional ultrasonic testing, AE tools are
designed for monitoring acoustic emissions produced within the material during failure or stress, rather than
actively transmitting waves, then collecting them after they have travelled through the material. Part failure can
be documented during unattended monitoring. The monitoring of the level of AE activity during multiple load
cycles forms the basis for many AE safety inspection methods that allow the parts undergoing inspection to
remain in service. (Kang, et al., 2015), (Law, et al., 2012)

Proceedings of the National Conference on
Trends and Advances in Mechanical Engineering
(TAME-2017) March 16-17, 2017 ISBN 978-93-5268-269-0
YMCA University of Science & Technology, Faridabad, Haryana
210
3.4 Temperature monitoring:
Bearing temperature should not increase the fixed limit defined by the manufacture. There have relationship of
heat to bearing life and have designed formulas to accurately calculate safe operating temperatures. The results
show a temperature band in which both bearings and lubricants will operate at peak performance with the least
stress. Once outside the ideal temperature range, they will degrade at an accelerated rate.(Tjernberg &
Tjernberg, 2015)
Figure 5 Heat Ranges of Bearings
Figure 3.4 shows the thermal range of a typical rolling element bearing. Note that bearing metal temperature
is often higher (10 to 25 degrees Celsius) than the oil temperature in the bearing within an oil circulation system.
The green zone represents the sweet spot for bearing and lubrication temperature; operating in the yellow zone
reduces lubricant and bearing life; and if your bearings are in the red zone, expects both the bearing and the
lubricant to be destroyed rapidly. There are different temperature bands for different combinations of bearing
and lubricant, but they will have the same general trend regarding the best operating temperature and its effect
on accelerated wear and failure. In most standard lubricants, for every 15°C increase in temperature above 70°C,
the lubricant life is more than halved and there is a negative effect on bearing life. Any mineral oil operating at a
temperature above 80°C or 90°C will have a greatly diminished life. In no case should bearing temperature ever
exceed the maximum rating of either the bearing or the lubricant.
Chemical analysis: when lubricating oil degraded by high temperature and heat. They produce a large number
of chemical compounds. Also when bearing wears debris these are carried by oil. By proper analysis of oil we
can measure the measure the amount of wear to the bearing. (Mishra, et al., 2015)
Conclusion
The present study addresses the various faults taking place in rotating machinery due to any reasons. Faults can
be monitored by various methods like vibration, current, acoustics, chemical and temperature monitoring. Study
from various research papers are outlined and it is found that sensor based techniques are mostly used by the
researchers and Vibration monitoring is most widely used technique.

Proceedings of the National Conference on
Trends and Advances in Mechanical Engineering
(TAME-2017) March 16-17, 2017 ISBN 978-93-5268-269-0
YMCA University of Science & Technology, Faridabad, Haryana
211
References
Gong, X. & Qiao, W., 2015. Current-Based Mechanical Fault Detection for Direct-Drive Wind Turbines via
Synchronous Sampling and Impulse Detection. IEEE TRANSACTIONS ON INDUSTRIAL ELECTRONICS,
62(3), pp. 1693-1703.
Kang, M., Kim, J. & kim, J. M., 2015. An FPGA-Based Multicore System for Real-Time Bearing Fault
Diagnosis Using Ultrasampling Rate AE Signals. IEEE TRANSACTIONS ON INDUSTRIAL ELECTRONICS,,
62(4), pp. 2319-2329.
Kang, M., Kim, J. & Kim, J. M., 2015. Reliable fault diagnosis for incipient low-speed bearings using fault
feature analysis based on a binary bat algorithm. Information Sciences, Volume 294, pp. 423-438.
Khanam, S., Tondon, N. & Dutt, J. K., 2014. Fault Size Estimation in the Outer Race of Ball Bearing Using
Discrete Wavelet Transform of the Vibration Signal. Proceedia Technology, Volume 14, pp. 12-19.
Law, L.-S., Kim, J.-H., Liew, W. Y. & Lee, S.-K., 2012. An approach based on wavelet packet decomposition
and Hilbert–Huang transform (WPD–HHT) for spindle bearings condition monitoring. Mechanical Systems and
Signal Processing, Volume 33, pp. 197-211.
Leite, V. C. et al., 2015. Detection of Localized Bearing Faults in Induction Machines by Spectral Kurtosis and
Envelope Analysis of Stator Current. IEEE TRANSACTIONS ON INDUSTRIAL ELECTRONICS, 62(3), pp.
1855-1865.
Liu, X., Bo, L. & Luo, H., 2015. Bearing faults diagnostics based on hybrid LS-SVM and EMD meyhod.
Measurement, Volume 59, pp. 145-166.
Mishra, R. K., Muduli, S. K., Srinivasan, K. & Ahmed, S. I., 2015. Failure Analysis of an Inter-shaft Bearing of
an Aero Gas Turbine Engine. Journal of Failure Analysis and Prevention, 15(2), pp. 205-210.
P. & Tjernberg, L. B., 2015. An Artificial Neural Network Approach for Early Fault Detection of Gearbox
Bearings. IEEE Transaction on smart Grid, 6(2), pp. 980-987.
Rezig, A., N'diye, A., Djerdir, A. & Mekideche, M., 2013. Experimental investigation of vibration monitoring
technique for online detection of bearing fault in induction motors. Journal of Electromagnetic Waves and
Applications, 27(4), pp. 496-506.
Sakthivel, N., Nair, B. & Sugumaran, V., 2012. Soft computing approach to fault diagnosis of centrifugal pump.
Applied Soft Computing, Volume 12, pp. 1574-1581.
Sharifi, R. & Ebrahimi, M., 2011. Detection of stator winding faults in induction motors using three phase
current monitoring. ISA transactions, Volume 50, pp. 14-20.
Wang, Y., Xu, G., Liang, L. & Ijang, K., 2015. Detection of weak transient signals based on wavelet packet
transform and manifold learning for rolling element bearing fault diagnosis. Mechanical Systems and Signal
Processing, Volume 54-55, pp. 259-276.
Zhu, K., Song, X. & Xue, D., 2014. A roller bearing fault diagnosis method based on hierarchical entropy and
support vector machine with particle swarm optimization algorithm. Measurement, Volume 47, pp. 669-675.

Proceedings of the National Conference on
Trends and Advances in Mechanical Engineering
(TAME-2017) March 16-17, 2017 ISBN 978-93-5268-269-0
YMCA University of Science & Technology, Faridabad, Haryana
212
TWEEL TYRE TECHNOLOGY
Abhishek
B.Tech. Student, Department of Mechanical Engineering,
YMCA University of Science andTechnology, Faridabad-121006
Email:[email protected]
Abstract
The paper introduces the new advanced developing tire technology which is used mainly in automobile industry.
As we come across different types of accidents in our day to day life so in order to avoid such accidents, we had
developed new technology as tweel tyre.As compare to normal tyre these tyres are less expensive, cheaper in
cost, prevents from global warming and are fuel efficient. Thus we are going to discuss the benefits of the tweel
tire as its huge applications in various fields.We are hoping for a good future scope and can be fulfill by the
tweel technology.
Key Words: Tweel tyres, NPT, Polyurethane, Lunar Rover, Rolling
1. Introduction
For more than 100 years, vehicles have been rolling along on cushions of air encased in rubber. The pneumatic
tire has served drivers and passengers well on road and off since its discovery, but a new design by Michelin
could change all that – the tweel airless tyre . The tyre uses no air, and therefore cannot burst or become flat.
Instead, the Tweel's hub connects to flexible polyurethane spokes which are used to support an outer rim and
assume the shock-absorbing role of a traditional tire’ pneumatic properties.By taking into consideration,
increasing number of accident, day to day, because of bursting of tires of vehicles at higher speeds, less
efficiency due to heavy structure of pneumatic tires, scientist started searching for the non-pneumatic based
solution for the tire and resulted in invention of NPT. Non-pneumatic, or airless, tires (NPT) have historically
been comprised largely of an entirely solid substance.These solid tires made the ride rather uncomfortable for
passengers and caused greater damaged to the suspension of a vehicle, which had to compensate for the lack of
“give” in a solid tire. Eventually, it was found that putting pressurized air in tires created a more comfortable
ride. However, along with their advantages there are a lot more disadvantages which leads in research of NPT.
2. DESIGN CONSIDERATION & MATRIAL USED
The Tweel consists of a cable-reinforced band of conventional "tyre" rubber with molded tread, a shear band
just below the tread that creates a compliant contact patch, and a series of energy-absorbing polyurethane
spokes. Both the shear beam and the polyurethane spokes can be designed to provide a calibrated directional
stiffness in order that design engineers are able to control both how the Tweel handles and how it handles loads.
The inner hub structure may be either rigid or compliant depending on the application requirements and as such
may contain a matrix of deformable plastic structures that flex under load and subsequently return to their
original shape. By varying the thickness and size of the spokes, Michelin can manipulate the design elements to
engineer a wide array of ride and handling qualities. The tread can be as specialized as any of today's tires and is
replaceable when worn.
III. IMPORTANCE OF TWEEL TYRE OVER PNEUMATIC TYRES
Pneumatic tires do have drawbacks, especially in high-performance or highly dangerous applications.The main
problem, of course, is that a puncture of the tire results in total failure. A blowout at high speeds can lead to a
dangerous car accident. Military planners are concerned with tires getting blown outby gunfire or explosion
shrapnel. A vehicle crew’s worst nightmare is getting trapped in a fire zonebecause their tires are all flat.
Obviously, an airless tire can't be disabled by a single puncture.

Proceedings of the National Conference on
Trends and Advances in Mechanical Engineering
(TAME-2017) March 16-17, 2017 ISBN 978-93-5268-269-0
YMCA University of Science & Technology, Faridabad, Haryana
213
IV. DEMONSTRATION AND TESTING
The Tweel doesn’t use a traditional wheel hub assembly. A solid inner hub mounts to the axle and is surrounded
by polyurethane spokes arrayed in a pattern of wedges. A shear band is stretched across the spokes, forming the
outer edge of the tyre. On it sits the tread, the part that comes in contact with the surface of the road. The
cushion formed by the air trapped inside a conventional tire is replaced by the strength of the spokes, which
receive the tension of the shear band. Placed on the shear band is the tread, the part that makes contact with the
surface of the road. When the Tweel is running on the road, the spokes absorb road defects the same way air
pressure does in the case of pneumatic tires. The flexible tread and shear bands deform temporarily as the
spokes bend, then quickly go back to the initial shape.
A. Workability on Sand Surface
From the simulation model, soil deformation, distributions of different stresses in both sand and Tweel and
distributions of contact pressure along the contact patch at all instances are expected.
A pneumatic, or air-filled, tire is made of an airtight inner core filled with pressurized air. A tread, usually
reinforced with steel belting or other materials, covers this inner core and provides the contact area with the
road. The pressure of the air inside the tire is greater than atmospheric air pressure, so the tire remains inflated
even with the weight of a vehicle resting on it. The tire’s air pressure provides resistance against forces that try
to deform the tire, but it gives to a certain degree -a cushioning effect as the tire hits bumps in the road. If
you’ve ever taken a ride in an old-fashioned carriage with wooden wheels, you know what a difference a
pneumatic tire makes.
C. Tire Flexibility

Proceedings of the National Conference on
Trends and Advances in Mechanical Engineering
(TAME-2017) March 16-17, 2017 ISBN 978-93-5268-269-0
YMCA University of Science & Technology, Faridabad, Haryana
214
V . ADVANTAGES
A. Non-Hazardous
B. Stability Improvement
Two loading steps:
Initial loading to deform Tweel
Final step for displacing the Tweel
Deformation in Tweel is more because the spokes can’t withstand compression.
B. Workability On Wet Surface
C. Increased Fuel Efficiency
D. Prevents Global Warming
VI. CONCLUSION
It is concluded that tyres featuring low noise and low rolling resistance will be required in near future and
receive much more attention and priority in the tyres of the next 10 years than for present market tyres.
If the climate changes will force a sudden and dramatic change in transportation and vehicle emissions policies, which is not an unlikely scenario, the tyre and vehicle manufacturer who fails to consider
unconventional solutions may suddenly find itself in an inferior position to the one who can see and actually
explore the possibilities of new technologies.There are possibilities to reduce noise and rolling resistance further
than today by traditional tire design measures; in particular if the extreme high-speed demands (speeds in excess
of 200 km/h) can be abandoned.
An airless tire under development may eventually obsolete conventional air-filled tires. While Michelin
researchers are still years away from offering a production ready non-pneumatic tire.
REFERENCES
Gent AN, Walter JD. The pneumatic tire. Washington DC: National Highway ,Traffic SafetyAdminister
Alfredo RV. Airless tire. US patent, US 3,329192; 1967.
Palinkas RL, Page GJ. Non pneumatic tire with supporting and cushioning
Zevenhoven, R., Treatment and disposal of polyurethane wastes: options for recovery
Numerical Simulation of the new generation Non-Pneumatic Tweel™ and Sand : United States

Proceedings of the National Conference on
Trends and Advances in Mechanical Engineering
(TAME-2017) March 16-17, 2017 ISBN 978-93-5268-269-0
YMCA University of Science & Technology, Faridabad, Haryana
215
A COMPARITIVE STUDY OF OPTIMIZATION STRATEGIES
IMPLEMENTED IN ULTRASONIC VIBRATION ASSISTED WIRE
ELECTRICAL DISCHARGE MACHINING
Sanjay Kumar1, Sandeep Grover
1, R S Walia
2
1Department of Mechanical Engineering YMCA University of Science and Technology, Faridabad-121006
INDIA 2Mechanical and Production Engineering Department Delhi Technological University, Delhi-110042, INDIA
E-mail: [email protected], TEL: 7838721130
Abstract
The objective of this study is to compare the various optimizations strategies implemented in ultrasonic
vibration assisted wire electrical discharge machining (US-WEDM)) in literature from advanced machining
technologies (AMTs). Generally, ultrasonic vibration assistance in traditional EDM is used to meet the
necessary discharge condition requirements efficiently and economically. The problems associated with
traditional EDM process have also been discussed in this study. The main emphasis is given on classification of
US-WEDM process on the basis of mode of ultrasonic vibration action imparted to EDM system, which includes
Wire tool Electrode and Work piece vibration. The ultimate purpose of this study is to discuss the variable
relationships of various proposed strategies, so may be applied in industries to improve further the performance
of US-WEDM. The benefits of the hybrid US-WEDM such as metal removing rate MRR, Surface integrity and
Surface Morphology are discussed in comparison to traditional Wire- EDM system. The results show that the
workpiece vibration of Wire-EDM has different effect with than the wire vibration, which can improve the
machining rate and kerf width, but increase the surface roughness. At the end of this study some limitations of
implementing Ultrasonic vibration in EDM has been discussed.
Keywords: Ultrasonic, Piezoelectric, USWEDM, Abrasive, Vibration and Wire-EDM.
1.Introduction
This era of Advance manufacturing technology is undergoing sweeping changes. Specific examples include the
super-precise die-sinking EDM, the super-precise wire-cut EDM and the super-precise micro-hole EDM, each
of which can provide precision in the 0.002mm class. There are consistent developments going on in advanced
engineering materials for aircraft, automobile, cutting tools, die and mold making industries. Higher costs
associated with the machining of these materials, and the damage caused during their machining is major
impediments in the processing and hence limited applications [1]. Further, stringent design requirements also
pose major challenges to their manufacturing industries. These include precise machining of complex and
complicated shapes and/or sizes (i.e. an aerofoil section of a turbine blade, complex cavities in dies and molds,
etc.), various hole-drilling requirements (i.e. non-circular, small or micro size holes, holes at shallow entry
angles, very deep holes, and burr less curved holes), machining of low rigidity structures, machining at micro or
nano levels with tight tolerances, machining of inaccessible areas, machining of honeycomb structured
materials, fabrication of micro-electro mechanical systems (MEMS), and nanofinish and surface integrity
requirements. Advanced machining Technologies (AMTs) have been developed since the World War II largely
in response to new, challenging, and unusual machining and or shaping requirements [2]. Alting (1982)[3]
classified the AMTs into four categories according to the type of energy used in material removal: chemical,
electro-chemical, mechanical and thermal. Generally AMTs are characterized by low value of material removal
rate (MRR) and high specific energy consumption. AMTs are used only when no other traditional machining
process can meet the necessary requirements efficiently and economically because most of the AMTs are
associated with relatively higher initial investment cost, power consumption and operating cost, tooling and
fixture cost, and maintenance cost. Electrical Discharge Machining (EDM) is one of these method in which
machining is performed using electro-thermal energy while maintaining a constant gap from the work piece. In
this machining method metal removal is due to thermal erosive phenomenon, a local temperature in specific

Proceedings of the National Conference on
Trends and Advances in Mechanical Engineering
(TAME-2017) March 16-17, 2017 ISBN 978-93-5268-269-0
YMCA University of Science & Technology, Faridabad, Haryana
216
region of order 8000-12000 0C [4]. Figure 1 shows a Schematic diagram of Die-sink Electric Discharge
machining (EDM) machine tool. A tool electrode (anode) with the same shape and dimensions but mirror image
as that of final shape on work surface required is fed with a controlled mechanism into the work piece (cathode).
Fig. 1. A Schematic diagram of Die-sink Electric Discharge machining (EDM) machine tool.
A thin layer of metal is melted from the machining surface and ejected due to discontinues electric discharges
between tool electrode and workpiece gap in the presence of ionized dielectric medium. This machining process
is preferred where high quality, repetitive complex shape and accuracy are required. These include such as: high
surface finishing and precision die-making processes for full net shapes, micro holes parameters (diameter,
roundness, concentricity, straightness) accuracy.
Although some extensive work has been carried out on vibration assisted EDM, little information can be found
on vibration assisted wire-EDM (WEDM) in the available literature domain. Some very early work was
undertaken in the late 1980’s by Kavtaradze et al. (1989)[5] and Lipchanskii (1991) [6], however little
information was provided on the machining mechanism. A rather detailed study was attempted by Guo et al.
(1997a,b)[7,8], where the wire was vibrated along and perpendicular to the cutting direction. It was found that
there exists an optimum relationship between the vibration amplitude of the wire and the discharge energy, by
which the highest cutting rate and the best machined surface quality, can be obtained. An attempt has been made
through this paper to accent the major problems associated with EDM process. The prime focus is on to
highlight various strategies explored in USWEDM process. A retrospective review on developments in
USWEDM has also been discussed with an objective to increase the industrial applications for machining of
advanced materials. Ultrasonic vibration system used in USWEDM also has some inherent limitations. Authors
have state a thoughtful section on Ultrasonic vibration with its limitations in implementation in traditional EDM.
2.Limitation of Traditional EDM Process
The advanced materials (Nimonic, Titanium, Inconel, Composite Materials, TiNi SMA, Niobium, Tungsten and Aluminum Alloys) ignite the necessity to develop further this traditional EDM processes because of the limitations as discussed hear. Researchers have been consistently working on traditional EDM with an aim to accomplish better dissemination of dielectric liquid and stable discharge conditions that outcomes enhanced MRR, thin recast layer, better process stability, high aspect ratio, and vitality productive arcing and short-circuit [9].
But traditional EDM alone unable to meet the today’s industrial metal cutting challenges. There is a need of innovative brain storming to providing better control over EDM machining conditions. The limitations with traditional EDM are;
- Poor flushing away of machined debris
- Frequent adhesion of the tool electrode to the workpiece
- Higher fraction of unwanted discharge states for manufacturing of high aspect ratio micro geometries holes
- Stagnation of debris
- Extensive tool wear
- Low material removal rate
- Unwanted gases generate during machining pollute the environment
- Residual stresses and micro-cracks deteriorated strength of material

Proceedings of the National Conference on
Trends and Advances in Mechanical Engineering
(TAME-2017) March 16-17, 2017 ISBN 978-93-5268-269-0
YMCA University of Science & Technology, Faridabad, Haryana
217
- Thick recast layer and heat effect zone of machined surface
The unpredictability of gap dimensions especially with intricate work piece geometry reduces the desired
achievable accuracy. Hybrid Electrical Discharge Machining is a splendid concept gaining attentions of
researchers to meet these limitations
The researchers have tried to hybrid various non-conventional methods with traditional EDM, such as
electrochemical machining, ultrasonic machining and abrasive jet machining etc [10]. In literature, several
descriptions of the term hybrid machining are found. Kozak and Rajurkar (2001)[11] define hybrid machining
as a combination of two or more processes to improve productivity. These hybrid processes were introduced to
take advantages of individual processes profitably and to minimize potential disadvantages of two’s. A Hybrid
EDM can be classified on the basis of utility of secondary Non-conventional method used with traditional EDM
as discussed following:
– The method which facilitates control of necessary EDM process condition such as flushing, normal electric
discharge condition and gap etc.
– The method which improve machining characteristics for EDM process such as MRR, Surface finish,
Dimensional accuracy and reduce Tool wear etc.
3.Ultrasonic wire vibration Assisted EDM (USEDM)
Assisted vibration is considered as the most popular and effective method among the methods of improving
the flushing condition and machining efficiency. It is an effective way of improving the flushing condition in
vibration-assisted EDM. Many researches had been carried out to examine the effect of imparted vibration on
EDM. Kremer et al. (1989)[12] investigated the effect of the ultrasonic vibration on the EDM machining
characteristics and surface modification. Their results showed that with ultrasonic vibration the removal rate
significantly increased. High pressure variation was found to be the main reason for this improvement.
Many researches on ultrasonic vibration-assisted EDM in subsequent years also acknowledged the benefit of the
method for improving machining efficiency. Wansheng et al. (2002)[13] successfully machined deep and small
hole on titanium alloy using ultrasonic EDM. Zhang et al. (2002)[14] presented a study on ultrasonic vibration-
assisted EDM in gas with vibration applied to the workpiece and concluded that their proposed system could
achieve higher efficiency than conventional EDM in dielectric liquid. The advantage of workpiece vibration
which can significantly increase the machining efficiency and reduce the complexity of the system was further
proved by Singh et al. (2012)[15]. Using ultrasonic vibration-assisted EDM Huang et al. (2003)[16] described
the effect of ultrasonic vibration on machining of micro holes in Nitinol. Their research showed that ultrasonic
vibration can improve the machining efficiency but also increase the tool wear. Moreover, electrode size,
applied voltage and vibration amplitude also affected the machining efficiency and tool wear. Recently non-
ultrasonic vibration-assisted EDM has received increased attention. Moreover the authors mentioned that for a
favorable discharge gap length the increase in vibration amplitude beyond the gap length has no effect.
Applications of ultrasonic vibration to Wire-EDM had been presented by Guo et al. (1997a,b)[7][8] and
developed by Lee et al. (1997)[17]. The surface roughness and the surface residual stress were also improved.
By studying the mechanism of the system, the authors proved that the improvement of surface finish and
material removal rate attribute to the forming of multi-channel discharges and the increased energy utilization
ratio respectively. Schematic diagram for the wire-excited method is shown in Fig. 2(a). The PZT actuator is
attached to the wire system which includes wire electrode and wire guides. The wire electrode and the PZT
actuator are coupled through the wire holder, thus when the PZT actuator is activated the wire electrode will be
excited under a forced vibration state (Guo et al., 1997a, b) [7][8]. The vibration will create a number of nodes
and antinodes. The number of nodes and antinodes will increase if the frequency of vibration increases. The
displacement of antinodes will increase the liquid pressure variation and circulation of dielectric flow and hence
improve the flushing of melted materials. Fig. 2(b) shows the schematic diagram of the workpiece-excited
method. The workpiece and the PZT actuator are coupled simply through an insulating adapter. Thus the
workpiece will be displaced in a periodic motion when the PZT actuator is activated. When the workpiece is
vibrated, it can be very close or in contact with the wire. Short circuit will occur as a result.
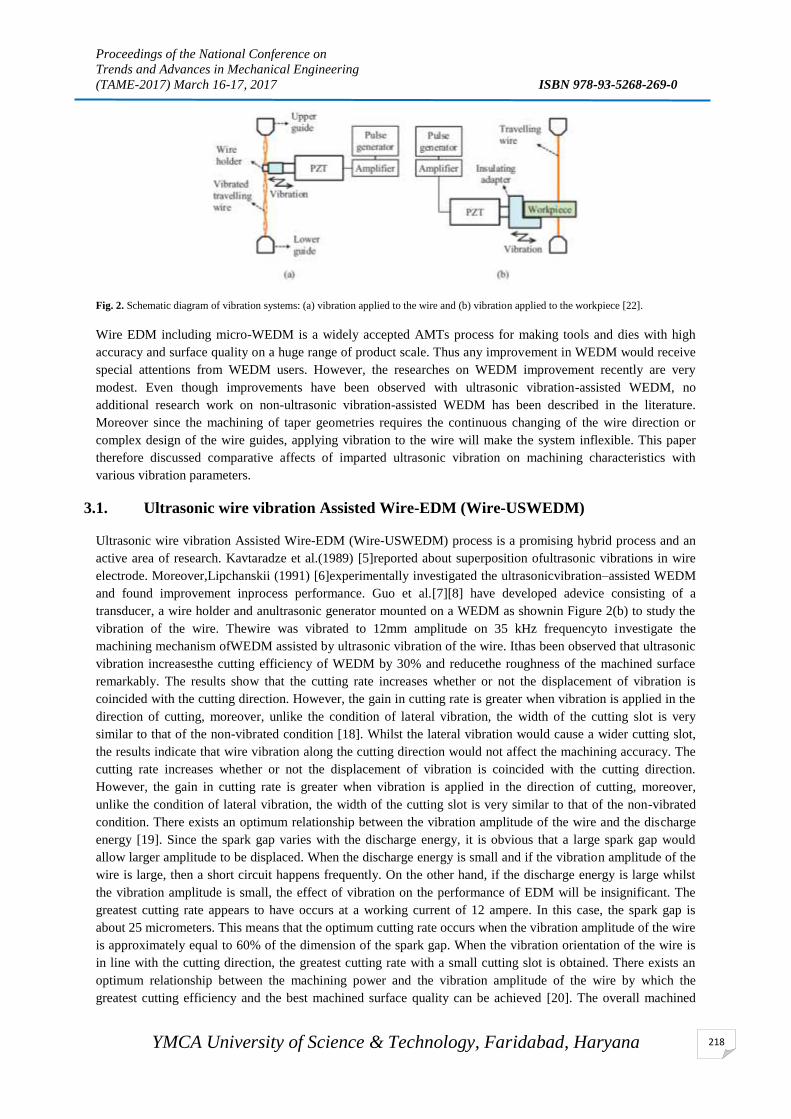
Proceedings of the National Conference on
Trends and Advances in Mechanical Engineering
(TAME-2017) March 16-17, 2017 ISBN 978-93-5268-269-0
YMCA University of Science & Technology, Faridabad, Haryana
218
Fig. 2. Schematic diagram of vibration systems: (a) vibration applied to the wire and (b) vibration applied to the workpiece [22].
Wire EDM including micro-WEDM is a widely accepted AMTs process for making tools and dies with high
accuracy and surface quality on a huge range of product scale. Thus any improvement in WEDM would receive
special attentions from WEDM users. However, the researches on WEDM improvement recently are very
modest. Even though improvements have been observed with ultrasonic vibration-assisted WEDM, no
additional research work on non-ultrasonic vibration-assisted WEDM has been described in the literature.
Moreover since the machining of taper geometries requires the continuous changing of the wire direction or
complex design of the wire guides, applying vibration to the wire will make the system inflexible. This paper
therefore discussed comparative affects of imparted ultrasonic vibration on machining characteristics with
various vibration parameters.
3.1. Ultrasonic wire vibration Assisted Wire-EDM (Wire-USWEDM)
Ultrasonic wire vibration Assisted Wire-EDM (Wire-USWEDM) process is a promising hybrid process and an
active area of research. Kavtaradze et al.(1989) [5]reported about superposition ofultrasonic vibrations in wire
electrode. Moreover,Lipchanskii (1991) [6]experimentally investigated the ultrasonicvibration–assisted WEDM
and found improvement inprocess performance. Guo et al.[7][8] have developed adevice consisting of a
transducer, a wire holder and anultrasonic generator mounted on a WEDM as shownin Figure 2(b) to study the
vibration of the wire. Thewire was vibrated to 12mm amplitude on 35 kHz frequencyto investigate the
machining mechanism ofWEDM assisted by ultrasonic vibration of the wire. Ithas been observed that ultrasonic
vibration increasesthe cutting efficiency of WEDM by 30% and reducethe roughness of the machined surface
remarkably. The results show that the cutting rate increases whether or not the displacement of vibration is
coincided with the cutting direction. However, the gain in cutting rate is greater when vibration is applied in the
direction of cutting, moreover, unlike the condition of lateral vibration, the width of the cutting slot is very
similar to that of the non-vibrated condition [18]. Whilst the lateral vibration would cause a wider cutting slot,
the results indicate that wire vibration along the cutting direction would not affect the machining accuracy. The
cutting rate increases whether or not the displacement of vibration is coincided with the cutting direction.
However, the gain in cutting rate is greater when vibration is applied in the direction of cutting, moreover,
unlike the condition of lateral vibration, the width of the cutting slot is very similar to that of the non-vibrated
condition. There exists an optimum relationship between the vibration amplitude of the wire and the discharge
energy [19]. Since the spark gap varies with the discharge energy, it is obvious that a large spark gap would
allow larger amplitude to be displaced. When the discharge energy is small and if the vibration amplitude of the
wire is large, then a short circuit happens frequently. On the other hand, if the discharge energy is large whilst
the vibration amplitude is small, the effect of vibration on the performance of EDM will be insignificant. The
greatest cutting rate appears to have occurs at a working current of 12 ampere. In this case, the spark gap is
about 25 micrometers. This means that the optimum cutting rate occurs when the vibration amplitude of the wire
is approximately equal to 60% of the dimension of the spark gap. When the vibration orientation of the wire is
in line with the cutting direction, the greatest cutting rate with a small cutting slot is obtained. There exists an
optimum relationship between the machining power and the vibration amplitude of the wire by which the
greatest cutting efficiency and the best machined surface quality can be achieved [20]. The overall machined

Proceedings of the National Conference on
Trends and Advances in Mechanical Engineering
(TAME-2017) March 16-17, 2017 ISBN 978-93-5268-269-0
YMCA University of Science & Technology, Faridabad, Haryana
219
surface tolerance is found to be dependent on the modes of vibration of the wire under the conditions of
ultrasonic assistance.The surface residual tensile stress is reduced with ultrasonic vibration.
3.2. Ultrasonic work-piece vibration assisted Wire-EDM (Workpiece-USWEDM)
In the previous studies, vibration was imparted to the wire whereas very few researchers have ever disclosed
about vibrating the workpiece. The restriction comes from the weight and the random shape of workpiece,
which make it difficult to vibrate at the resonant frequency. The main problem associated with this optimization
strategy is to study the basic regularity of applying workpiece vibration to the WEDM process by contriving a
special design and fixture. In the USWEDM experiments proposed by Han et al. (2013)[21], the rough cutting
process was tested and the vibration of Ti6/4 workpiece was employed parallel to the cutting direction by a
horizontally placed transducer (the experimental set-up is shown in Figure 3(a)). A 150W Kerry Ultrasonic
generator was used to transmit vibration to the Ti6/4 workpiece with the help of a 23 kHz transducer and a
booster. The workpiece was made in the form of a stepped horn and was allowed to vibrate horizontally along
the cutting direction of the wire shown in Figure 3(b). The workpiece (horn)-booster transducer assembly was
not submerged in the dielectric water in order to prevent the ingress of water inside the transducer, instead
deionised water was flushed to the machining zone at a pressure of 1.5Pa from top and bottom sides of the
workpiece. The experimental results show that the machining rate increased with an increase of vibration
amplitude up to 14μm and slightly decreased thereafter, which improve maximum over 10% compared with the
machining rate without vibration. It was further observed that the machining rate is higher for the thinner
workpiece (5mm) than that for the thicker one (10mm) as the machining area is greater in the latter case.
Comparing with the vibration of wire, the horizontal vibration of workpiece changes the spark gap of whole
spark area at the same time, not just changing some spark points of wire vibrating [22]. So it can accelerate the
slurry circulation between the wire and workpiece more violently and increase the cutting speed.
(a) (b)
Fig.3. (a) Structure of the WEDM machine with; (b) Schematic of Ti6/4 three-step horns horizontal vibrating workpiece [21]
The kerf width reduced with the application of vibration comparing with the conventional one and the effect is
more prominent for the thinner workpiece. However it was further noticed that kerf width increased with an
increase of vibration amplitude. Although a higher amplitude seemed to be little detrimental for the thinner
workpiece, it is proven to be helpful for the thicker one. Hence it could be inferred that higher amplitude is
required to vibrate a thick workpiece more effectively, however for the thinner one, there lies an optimum value
of amplitude which rendered lower kerf width. Generally, surface roughness (Ra) is higher for vibration assisted
WEDM in comparison to the conventional one and Ra is also higher for the thinner workpiece with respect to
that for the thicker one. The better surface roughness obtained at higher amplitude of vibration is maybe a
consequence of better average spark gap and more uniform spark energy produced by proper higher vibration
amplitude. The effect of peak current during WEDM was also studied on the aforementioned responses when
machining was carried out with and without the ultrasonic assistances. Based on the experimental results, with
ultrasonic assistance, horizontal vibration of the workpiece can increase the machining rate of wire-EDM over
10%, which is better for the thicker workpiece and smaller peak currents. The vibration of workpiece with
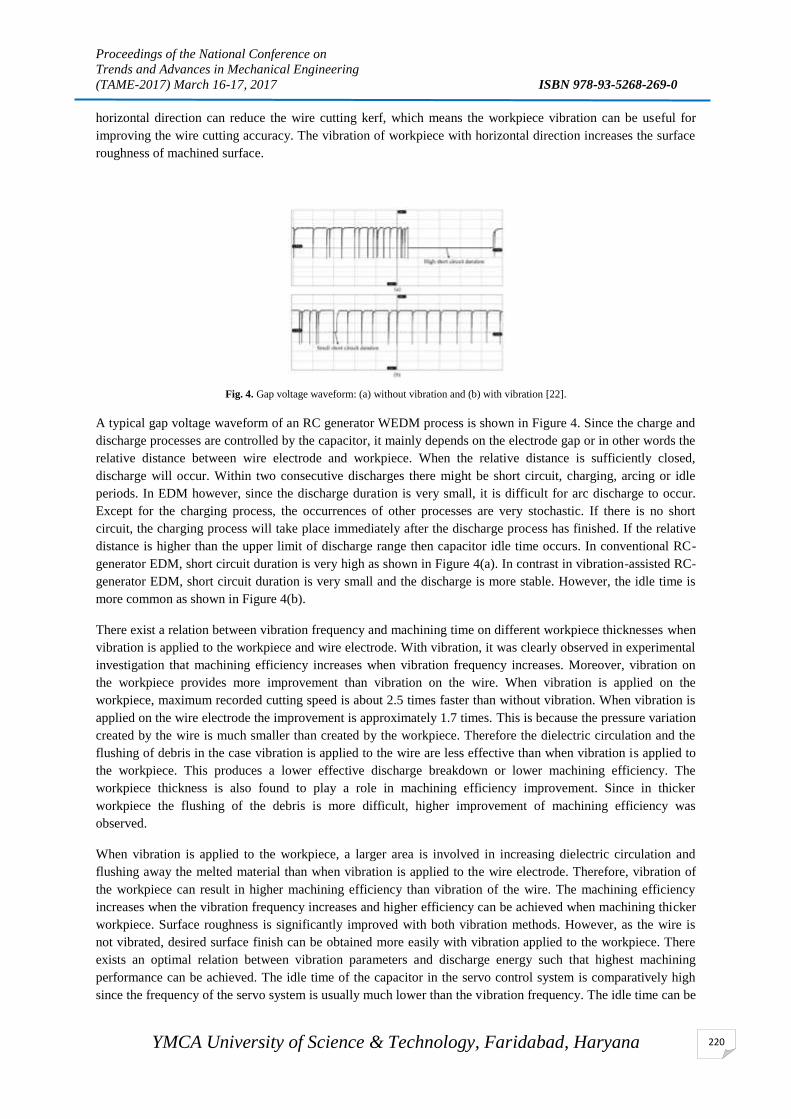
Proceedings of the National Conference on
Trends and Advances in Mechanical Engineering
(TAME-2017) March 16-17, 2017 ISBN 978-93-5268-269-0
YMCA University of Science & Technology, Faridabad, Haryana
220
horizontal direction can reduce the wire cutting kerf, which means the workpiece vibration can be useful for
improving the wire cutting accuracy. The vibration of workpiece with horizontal direction increases the surface
roughness of machined surface.
Fig. 4. Gap voltage waveform: (a) without vibration and (b) with vibration [22].
A typical gap voltage waveform of an RC generator WEDM process is shown in Figure 4. Since the charge and
discharge processes are controlled by the capacitor, it mainly depends on the electrode gap or in other words the
relative distance between wire electrode and workpiece. When the relative distance is sufficiently closed,
discharge will occur. Within two consecutive discharges there might be short circuit, charging, arcing or idle
periods. In EDM however, since the discharge duration is very small, it is difficult for arc discharge to occur.
Except for the charging process, the occurrences of other processes are very stochastic. If there is no short
circuit, the charging process will take place immediately after the discharge process has finished. If the relative
distance is higher than the upper limit of discharge range then capacitor idle time occurs. In conventional RC-
generator EDM, short circuit duration is very high as shown in Figure 4(a). In contrast in vibration-assisted RC-
generator EDM, short circuit duration is very small and the discharge is more stable. However, the idle time is
more common as shown in Figure 4(b).
There exist a relation between vibration frequency and machining time on different workpiece thicknesses when
vibration is applied to the workpiece and wire electrode. With vibration, it was clearly observed in experimental
investigation that machining efficiency increases when vibration frequency increases. Moreover, vibration on
the workpiece provides more improvement than vibration on the wire. When vibration is applied on the
workpiece, maximum recorded cutting speed is about 2.5 times faster than without vibration. When vibration is
applied on the wire electrode the improvement is approximately 1.7 times. This is because the pressure variation
created by the wire is much smaller than created by the workpiece. Therefore the dielectric circulation and the
flushing of debris in the case vibration is applied to the wire are less effective than when vibration is applied to
the workpiece. This produces a lower effective discharge breakdown or lower machining efficiency. The
workpiece thickness is also found to play a role in machining efficiency improvement. Since in thicker
workpiece the flushing of the debris is more difficult, higher improvement of machining efficiency was
observed.
When vibration is applied to the workpiece, a larger area is involved in increasing dielectric circulation and
flushing away the melted material than when vibration is applied to the wire electrode. Therefore, vibration of
the workpiece can result in higher machining efficiency than vibration of the wire. The machining efficiency
increases when the vibration frequency increases and higher efficiency can be achieved when machining thicker
workpiece. Surface roughness is significantly improved with both vibration methods. However, as the wire is
not vibrated, desired surface finish can be obtained more easily with vibration applied to the workpiece. There
exists an optimal relation between vibration parameters and discharge energy such that highest machining
performance can be achieved. The idle time of the capacitor in the servo control system is comparatively high
since the frequency of the servo system is usually much lower than the vibration frequency. The idle time can be

Proceedings of the National Conference on
Trends and Advances in Mechanical Engineering
(TAME-2017) March 16-17, 2017 ISBN 978-93-5268-269-0
YMCA University of Science & Technology, Faridabad, Haryana
221
minimized by operating the vibration-assisted micro WEDM process in constant feed-rate mode at the optimal
feed-rate.
On the whole, this comparative study provides significant proof of the role of assisted vibration in improving the
efficiency of Wire-EDM. Moreover, with the advantages of workpiece-excited method the application of micro-
WEDM in tools and dies machining industry can be more widely expanded.
3.3. Abrasive assisted wire electrical discharge (AWEDM)
The jet action also improves the flushing of contaminated dielectric medium. Lin et al (2012) [23] incorporated
the AJM with EDM process to permute the machining performance. They used Al2O3 and SiC abrasive grains
directed on to the machining surface. The experimental results show this combined process is superior to the dry
EDM both in MRR and Surface Roughness. The author claimed increase in MRR between 32-46% at peak
current 9-6 A individually. They observed a relationship between SR and peak currents only up to a certain
limit, which increases with peak current. Beside, the SR increased with the pulse duration first, and then it
reduce with the further extended the pulse duration. Menzies and Koshy (2008)[24] proposed an abrasive
assisted wire electrical discharge (AWEDM) machining by coating the surface of wire in Figure 5 with diamond
abrasive particles significant improvement in MRR.
Fig. 5. Surface and section of diamond wire [24].
4.Limitations in Implementing of Ultrasonic vibration to EDM process
Ultrasonic vibration in EDM as ascientific approach has its limitations. The resonance is crucial problem in
ultrasonic vibration device. Especially, when imparted to tool or work piece in EDM system. It produces huge
noise that hinders in successful implementation of UV action in USEDM process [25]. A special attention is
required for design and manufacture of the horn. An incorrectly manufactured horn assembly will decrease
machining performance and can lead to the destruction of the vibration system or may cause significant damage
to the ultrasonic generator. Ultrasonic vibration generating assembly consists of basic components such as
generator, transducer, booster and horn shown in Figure 6.
Fig. 6. Piezoelectric ultrasonic vibration generating assembly components.
All these elements that compose the ultrasonic assembly must be properly sized so that the system to perform at
the resonant frequency [26]. At excessively high amplitude, the increase in number of cavitation bubbles might
block the dielectric fluid from flowing into the sparking gap. This phenomenon makes the machining process
unstable, leading to the reduction o f material removal rate [27]. With ultrasonic cavitation in pure EDM oil, the
surface of the micro-hole is very rough and covered with resolidified material. The surface roughness value of
the ultrasonic vibration assisted EDM is slightly higher than EDM [28]. Ultrasonic vibration reduces the ignition
Proceedings of the National Conference on
Trends and Advances in Mechanical Engineering
(TAME-2017) March 16-17, 2017 ISBN 978-93-5268-269-0
YMCA University of Science & Technology, Faridabad, Haryana
222
delay which can generate a coarser surface and increase in electrode wear rate. Also, acoustic cavitations lead to
larger Over Cut [29]. Although TWR is less for short pulse durations in USEDM, but form larger duration of
pulses TWR affected inversely [30]. In literature, ultrasonic vibration has been applied for quantitative analysis
with quantitative controllable parameters, not for qualitative parameters. Authors have categories some
qualitative parameter also such as flushing (Evacuation of debris, pumping effect and stirring effect) and
abnormal discharge (arcing and short circuit, discharge wave distribution) etc. Performance of ultrasonic
vibration assisted EDM system became difficult to evaluate because of the complex inter-relationships among
quantitative and qualitative factors. It required basically a logical and systematical approach for modeling and
analyzing such complex machining process with scientific approach alone in not sufficient as of technological
problems associated with this method [31].
5.Conclusion & Future Scope
Traditional Wire-EDM process alone cannot meet the present industrial metal cutting requirements for complex geometry and advanced materials. It needs more innovative brain storming. The concepts of introducing wire or workpiece ultrasonic vibration to wire-EDM system have been proved to be a solution for the problems mentioned in this study. Researchers have explored these hybrid methods in various fields and found very beneficial as compared to traditional EDM. Hybrid EDM increases the performance of various parameters which improve the overall performance of Wire-EDM process. Hybrid EDM results show higher MRR, better surface finishing, less short circuit and improved flushing of debris and improved surface integrity. Hybridization of EDM process induces capability to machine hard and brittle material and makes it as one of the important machining method. Powder mixed EDM and Ultrasonic assisted EDM has not only reduces tool wear but also increases material removal rate significantly.
The researchers formulated and tested various applied hypothesis experimentally under various controllable parameters to evaluate the probability rather than certainty of affects. Although pervious experimentation have proved effectiveness of ultrasonic vibration on performance index of EDM process but still a generalized mathematical relationship which can be acceptable for each modes of vibration is required.
REFERENCES
[1] Pandey, P.C., Shan, H.S., (2009). Modern Machining Process. Tata McGraw Hill publishing.
[2] Groover, M.K., (1996). Fundamentals of Modern Manufacturing: Materials, Processes, and Systems, Prentice-
Hall International Inc.
[3] Alting, L. (1982). Manufacturing Engineering Processes, Marcel Dekker Inc., New York, 1982.
[4] Garmo, E.P. D., Black, J.T., Kohser, R.A., (1997). Materials and Processes in Manufacturing, Prentice-Hall
Inc., New Jersey, 1997.
[5] Kavtaradze, O. N., Lipchanskii A. B., Nechaev, G. G.(1989) Vibration of wire electrode during electro erosion
machining with the superposition of ultrasonic vibrations. Sov Surf Eng Appl Electrochem; 4: 13–17.
[6] Lipchanskii, A. B., (1991). Experimental investigation of wire electrical discharge machining assisted with
ultrasonic vibration. Sov Surf Eng Appl Electrochem; 1: 5–9.
[7] Guo, Z. N., Lee, T. C., Yue, T. M., Lau, W. S., (1997). Study on the machining mechanism of WEDM with
ultrasonic vibration of the wire. Journal of Materials Processing Technology 69, pp212-221.
[8] Guo, Z.N., Lee, T.C., Yue, T.M., Lau, W.S., (1997). A Study of Ultrasonic- Aided Wire Electrical Discharge
Machining. Journal of Materials Processing Technology 63, pp823–828.
[9] Praneetpongrung, C., Fukuzawa, Y., Nagasawa, S., Yamashita, K., (2010). Effects of the EDM Combined
Ultrasonic Vibration on the Machining Properties of Si3N4. Materials Transactions 51(11), pp 2113-2120
[10] Rajagopal, S. P., Ganesh, V., Lanjewar, A. V., Sankar, M. R., (2013). Past and Current Status of Hybrid
Electric Discharge Machining (H-EDM) Processes. Advanced Materials Manufacturing & Characterization Vol
3 Issue 1, pp 111-118.
[11] Kozak, J., Rajurkar, K. P., (2001). Hybrid machining process evaluation and development. Proceedings of the
2nd International Conference on Machining and Measurement of Sculptured Surfaces, Krakow, pp501–536.

Proceedings of the National Conference on
Trends and Advances in Mechanical Engineering
(TAME-2017) March 16-17, 2017 ISBN 978-93-5268-269-0
YMCA University of Science & Technology, Faridabad, Haryana
223
[12] Kremer, D., Lebrun, J. L., Hosari, B., Moisan, A., (1989). Effects of Ultrasonic Vibrations on the Performances
in EDM. Annals of the ClRP, Vol. 38(1), pp199-202.
[13] Wansheng, Z., Zhenlong, W., Shichun, D., Guanxin, C., Hongyu, W., (2002). Ultrasonic and Electric Discharge
machining of deep hole Titanium alloy. Journal of materials processing technology 120, pp 101-106.
[14] Zhang, J.H., Zhang, H., Su, D. S., Qin, Y., Huo, M. Y., Zhang, Q. H., Wang, L., (2002). Adaptive fuzzy control
System Servomechanism for Electro-discharge Machining Combined with Ultrasonic Vibration. Journal of
Materials Processing Technology 129, pp45-49.
[15] Singh, J., Walia, R.S., Satsangi, P. S., Singh, V. P., (2012). Hybrid Electric Discharge Machining Process with
Continuous and Discontinuous Ultrasonic Vibrations on Work piece. International Journal of Mechanic Systems
Engineering 2(1) pp 22-33.
[16] Huang, H., Zhang, H., Zhou, L., Zheng, H. Y., (2003). Ultrasonic vibration assisted electro-discharge machining
of microholes in nitinol. Journal of Micromechanical andMicroengineering 13, pp693–700.
[17] Lee, T. C., Zhang, J. H., Lau, W. S., (1998). Machining of Engineering Ceramics by UltrasonicVibration
Assisted EDM Method. Materials and Manufacturing Processes 13:1, pp133-146.
[18] Khatri, B. C., Rathod, P., Valaki J. B., (2016) Ultrasonic vibration–assisted electric discharge machining: A
research review Proc IMechE Part B: J Engineering Manufacture, Vol. 230(2) 319–330.
[19] Nani V. M., (2017). Effect of wire electrode’s ultrasonic vibration on erosive capacity to W-EDM machines. Int
J Adv Manuf Technol 88:425–441.
[20] Nani V. M., (2017). The ultrasound effect on technological parameters for increasein performances of W-EDM
machines. Int J Adv Manuf Technol (2017) 88:519–528.
[21] Han, G., Soo, S. L., Aspinwall, D. K., Bhaduri, D., (2013). Research on the ultrasonic assisted WEDM of Ti-
6Al-4V. Advanced Materials Research Vol. 797 pp 315-319.
[22] Hoang, K. T., Yang, S. H.,( 2013)A study on the effect of different vibration-assisted methods in micro-WEDM.
Journal of Materials Processing Technology 213 1616– 1622.
[23] Lin, Y. C., Chen, Y. F., Wang, A., Sei, W., (2012). Machining performance on hybrid process of abrasive jet
machining and electrical discharge machining. Trans. Nonferrous Met. Soc. China 22, pps775−s780.
[24] Mesee, J., Fukuzawa, Y., Shigeru, N., Daiki, H., Muttamara, A., (2014). Surface Modification Using EDM
Combined Ultrasonic Vibration. The Japan Society of Precision Engineering P32, pp1213-1214.
[25] Xu, M. G., Zhang, J. H., LI, Y., Zhang, Q. H., Ren, S. F., (2009). Material removal mechanisms of cemented
carbides machined by ultrasonic vibration assisted EDM in gasmedium”, Journal of Materials Processing
Technology 209, pp 1742–1746.
[26] Nanu, A. S., Marinesu, N. I., Ghiculesu, D., (2011). Study on Ultrasonic stepped horn geometry design and
FEA simulation. Nonconventional Technologies Review – no. 4/2011, pp25-30.
[27] Liew, P.J., Yan, J., Kuriyagawaa, T., (2014). Fabrication o f deep micro-holes in reaction-bonded SiC by
ultrasoniccavitation assisted micro-EDM. International Journal o f Machine Tools & Manufacture 76, pp13-20.
[28] Shabgard, M.R., Sadizadeh, B., Kakoulvand, H., (2009). The Effect of Ultrasonic Vibration of Work-piece in
Electrical Discharge Machining of AISIH13 Tool Steel. World Academy of Science, Engineering and
Technology 52, pp392-396.
[29] Teimouri, R., Baseri, H., (2013). Experimental study of rotary magnetic field-assisted dry EDM with ultrasonic
vibration of work piece. Int J Adv Manuf Technol, 67, DOI 10.1007/s00170-012-4573-6, PP1371–1384.
[30] Shabgard, M. H., Alenabi, H., (2015). Ultrasonic vibration assisted Electrical Discharge Machining of Ti–6Al–
4V Alloy. Materials and Manufacturing Processes 30, pp 991–1000.

Proceedings of the National Conference on
Trends and Advances in Mechanical Engineering
(TAME-2017) March 16-17, 2017 ISBN 978-93-5268-269-0
YMCA University of Science & Technology, Faridabad, Haryana
224
[31] Kumar, S., Grover, S., Walia, R. S., (2016) Analyzing and modeling the performance index of
ultrasonicvibration assisted EDM using graph theory and matrix approach. Int J Interact Des Manuf DOI
10.1007/s12008-016-0355-y.
Proceedings of the National Conference on
Trends and Advances in Mechanical Engineering
(TAME-2017) March 16-17, 2017 ISBN 978-93-5268-269-0
YMCA University of Science & Technology, Faridabad, Haryana
225
A STUDY ON DESIGNATION SYSTEM AND REINFORCEMENT
TYPES IN ALUMINUM ALLOYS Gurpreet Singh
1 and Sanjeev Goyal
2
1Department of Mechanical Engineering, Thapar University, Patiala, Punjab, India - 147004.
Phone: 09646726195, e-mail: [email protected]
2Department of Mechanical Engineering, YMCA University of Science and Technology, Faridabad, Haryana,
India – 121006.
Abstract
Aluminum alloys can be categorized into a number of groups based on the particular material’s characteristics
such as its ability to respond to thermal and mechanical treatment and the primary alloying element added to
the aluminum alloy. When we consider the numbering or identification system used for aluminum alloys, the
above characteristics are identified. The wrought and cast aluminum’s have different systems of identification;
the wrought having a 4-digit system, and the castings having a 3-digit and 1-decimal place system. The authors
in the present work explain the temper designation system in a more comprehensive way to help researchers and
academicians to understand the system. The paper also reveals with the study of reinforcement types that are
mainly used for aluminum alloys to fabricate composites and enhance mechanical properties.
Keywords: Aluminum alloy, Temper Designation; Reinforcement types.
1. Introduction
Aluminium alloysis the one in which aluminum (Al) is the predominant metal. The typical alloying elements
are copper, magnesium, manganese, silicon, tin and zinc(Poovazhagan et al, 2013). There are two principal
classifications, namely casting alloys and wrought alloys, both of which are further subdivided into the
categories heat-treatable and non-heat-treatable. About 85% of aluminum is used for wrought products, for
example rolled plate, foils and extrusions. Cast aluminum alloys yield cost-effective products due to the low
melting point, although they generally have lower tensile strengths than wrought alloys (Singh et al, 2012). The
most important cast aluminum alloy system is Al–Si, where the high levels of silicon (4.0–13%) contribute to
give good casting characteristics. Aluminium alloys are widely used in engineering structures and components
where light weight or corrosion resistance is required (Polmear, 1995).Alloys composed mostly of aluminum
have been very important in aerospace manufacturing since the introduction of metal-skinned aircraft.
Aluminium-magnesium alloys are both lighter than other aluminum alloys and much less flammable than alloys
that contain a very high percentage of magnesium. With the growth of aluminum within the welding fabrication
industry, and its acceptance as an excellent alternative to steel for many applications, there are increasing
requirements for those involved with developing aluminum projects to become more familiar with this group of
materials. To fully understand aluminum, it is advisable to start by becoming acquainted with the aluminum
identification or designation system, the many aluminum alloys available and their characteristics. The present
work is the study of Designation system and explains briefly the reinforcement types added to aluminum alloys
to form composites in order to enhance material properties.
2. Aluminum alloy designation
With the increasing demand of Al alloy in the fabrication industry and its acceptance as an excellent alternate to
steel alloys, it becomes necessary to become familiar with this group of alloys. For this purpose one need to
understand the Al alloy temper and designation system. The Aluminium Association (AA) is the one which
allocate and register Al alloys. There are over 400 wrought Al alloys and over 200 cast Al alloys registered with
AA [5]. Al alloys can be designated depending upon their characteristics. The wrought and cast Al alloys uses
different systems for identification. Wrought alloys uses 4-digit number system whereas castings have 3-digit
number system along with 1-decimal place system.
2.1 Wrought Alloy designation system

Proceedings of the National Conference on
Trends and Advances in Mechanical Engineering
(TAME-2017) March 16-17, 2017 ISBN 978-93-5268-269-0
YMCA University of Science & Technology, Faridabad, Haryana
226
Wrought alloy has 8 series namely 1000, 2000, 3000, 4000, 5000, 6000, 7000 and 8000 series. Table 1 shows
the different wrought alloy series along with the major alloying element.
Table 1. The Major Constituents for wrought alloyseries
Wrought Alloy Series Parent Material Major Constituents Heat/Non Heat Treatable
1xxx Al 99% min Al, Fe Non Heat treatable
2xxx Al Cu Heat Treatable
3xxx Al Mn Non Heat treatable
4xxx Al Si Both
5xxx Al Mg Non Heat treatable
6xxx Al Mg, Si Heat Treatable
7xxx Al Zn Heat Treatable
8xxx Al Li, Ca, Sn, Mn, Si Heat Treatable
The first digit of a series (Xxxx) represents the major constituent in the Al alloy and is used to describe the
specific series. If the second single digit is not zero (xXxx), it represents the modification of the alloy. Third
(xxXx) and fourth (xxxX) number represents a specific alloy in the series (Sorensen et al., 1995). For example
in Alloy 6106, the first digit ‘6’ represents that it is of magnesium and silicon alloy series, second digit ‘1’
indicates that it is the first modification of original alloy 6006 and the last two digits ‘06’ identifies it in 6xxx
series (Mukhopadhyay, 2012).
The only exception is with 1xxx series (99% pure aluminum) alloys in which the last two digits provides the
percentage of aluminum above 99%. For example Alloy 1050 has 99.50% pure aluminum.
2.2 Cast Alloy Designation
The designation of cast alloy is based on 3-digit number along with 1-decimal place system xxx.x; the first
number (Xxx.x) indicates the major constituent which is to be added in the aluminium alloy (Budinski, 2009).
The second (xXx.x) and third (xxX.x) number represents a specific alloy in a particular series. The number after
decimal (xxx.X) shows weather the alloy is a casting (.0) or an ingot (.1 or .2) (Budinski, 2009). The bold letter
in the beginning shows that the modification has been done for the given alloy (Kaufman, 2009). Table 2 shows
the different cast alloy series along with the major alloying element.
Take an example of A357.0 to better understand the designation. The prefix A (Axxx.x) represents that the alloy
is modification of alloy 357. The second number ‘3’ (A3xx.x) indicates that it belongs to magnesium series. The
third and fourth number ‘57’ identifies the alloy in the series 3xx.x series and the last number after decimal
place (.0) indicates that it is the casting of final shape and not an ingot (Kaufman, 2009).
2.3 Aluminium Temper Designation System
Aluminium alloys can be heat treatable as well as non-heat treatable. As we see in Table 1 and Table 2 that for
wrought alloy series 2xxx, 4xxx, 6xxx, 7xxx, and 8xxx series are heat treatable and for cast alloy 2xx.x, 3xx.x,
4xx.x and 7xx.x series are heat treatable (Kaufman, 2009).
Table 2. The Major Constituents for cast alloyseries
Cast Alloy Series Parent Material Major Constituents Heat/Non Heat Treatable
1xx.x Al 99% min Al, Fe Non Heat treatable
2xx.x Al Cu Heat Treatable
3xx.x Al Mg Heat Treatable
4xx.x Al Si Heat Treatable
5xx.x Al Mg Non Heat treatable
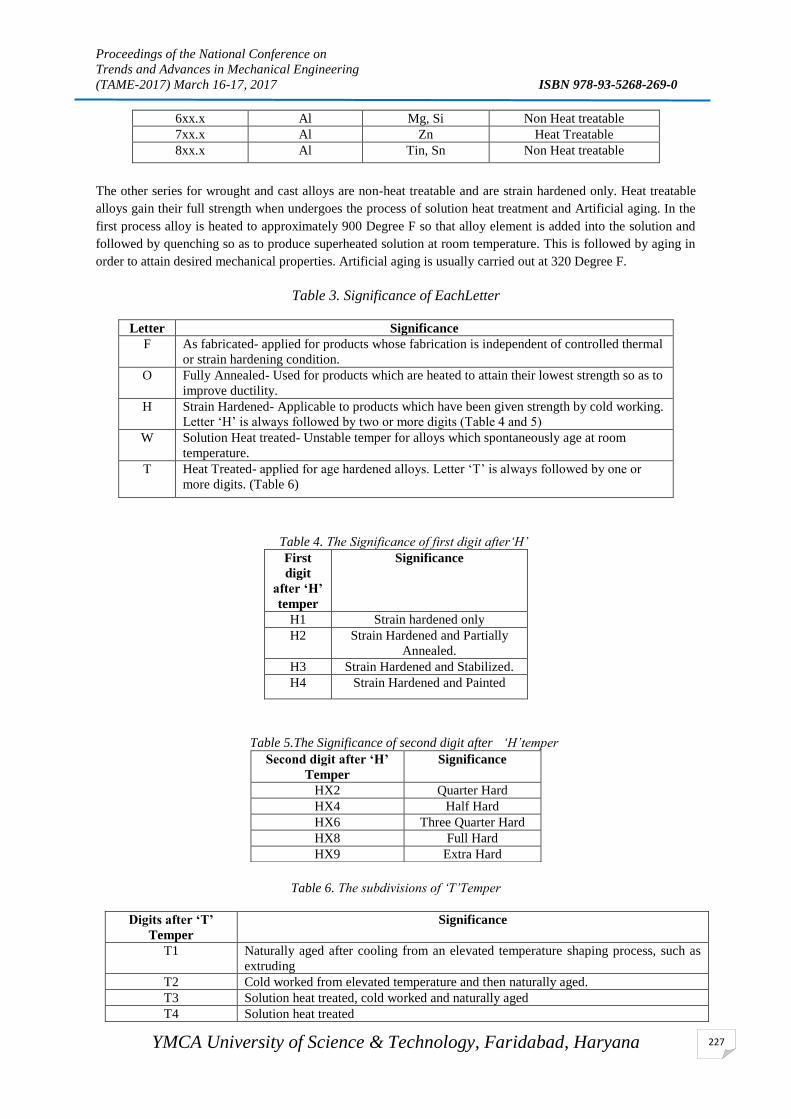
Proceedings of the National Conference on
Trends and Advances in Mechanical Engineering
(TAME-2017) March 16-17, 2017 ISBN 978-93-5268-269-0
YMCA University of Science & Technology, Faridabad, Haryana
227
6xx.x Al Mg, Si Non Heat treatable
7xx.x Al Zn Heat Treatable
8xx.x Al Tin, Sn Non Heat treatable
The other series for wrought and cast alloys are non-heat treatable and are strain hardened only. Heat treatable
alloys gain their full strength when undergoes the process of solution heat treatment and Artificial aging. In the
first process alloy is heated to approximately 900 Degree F so that alloy element is added into the solution and
followed by quenching so as to produce superheated solution at room temperature. This is followed by aging in
order to attain desired mechanical properties. Artificial aging is usually carried out at 320 Degree F.
Table 3. Significance of EachLetter
Letter Significance
F As fabricated- applied for products whose fabrication is independent of controlled thermal
or strain hardening condition.
O Fully Annealed- Used for products which are heated to attain their lowest strength so as to
improve ductility.
H Strain Hardened- Applicable to products which have been given strength by cold working.
Letter ‘H’ is always followed by two or more digits (Table 4 and 5)
W Solution Heat treated- Unstable temper for alloys which spontaneously age at room
temperature.
T Heat Treated- applied for age hardened alloys. Letter ‘T’ is always followed by one or
more digits. (Table 6)
Table 4. The Significance of first digit after‘H’
First
digit
after ‘H’
temper
Significance
H1 Strain hardened only
H2 Strain Hardened and Partially
Annealed.
H3 Strain Hardened and Stabilized.
H4 Strain Hardened and Painted
Table 5.The Significance of second digit after ‘H’temper
Table 6. The subdivisions of ‘T’Temper
Digits after ‘T’
Temper
Significance
T1 Naturally aged after cooling from an elevated temperature shaping process, such as
extruding
T2 Cold worked from elevated temperature and then naturally aged.
T3 Solution heat treated, cold worked and naturally aged
T4 Solution heat treated
Second digit after ‘H’
Temper
Significance
HX2 Quarter Hard
HX4 Half Hard
HX6 Three Quarter Hard
HX8 Full Hard
HX9 Extra Hard
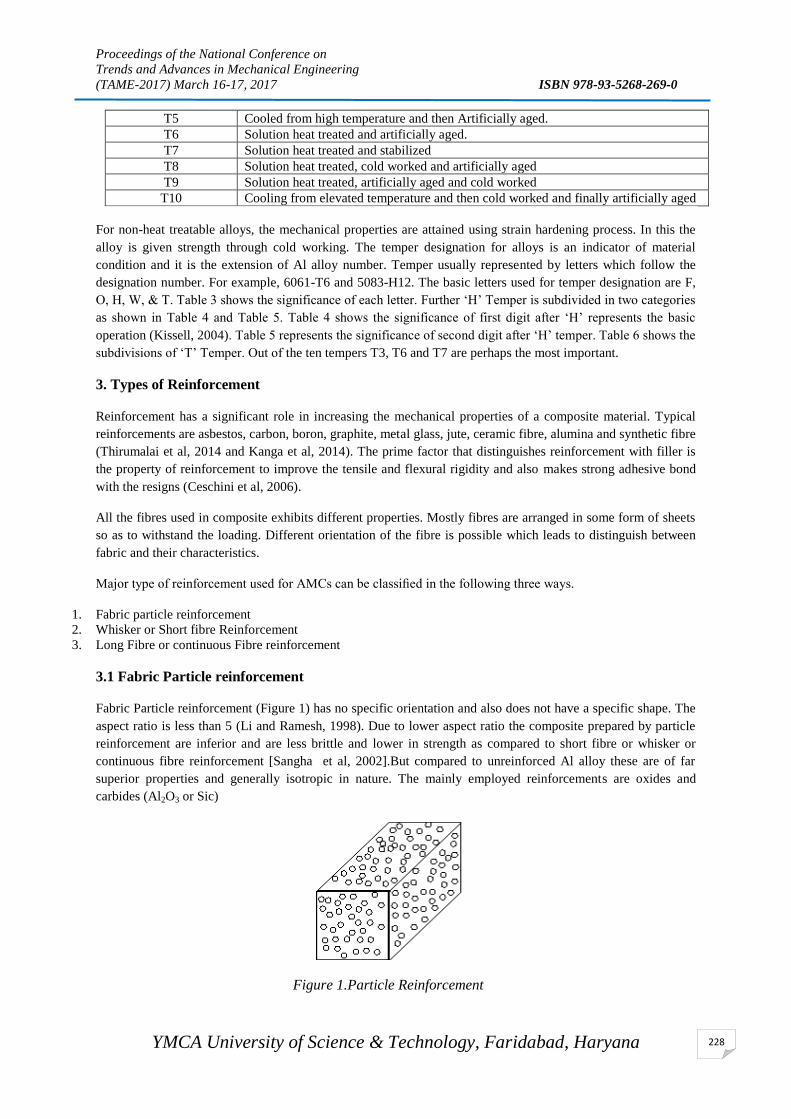
Proceedings of the National Conference on
Trends and Advances in Mechanical Engineering
(TAME-2017) March 16-17, 2017 ISBN 978-93-5268-269-0
YMCA University of Science & Technology, Faridabad, Haryana
228
T5 Cooled from high temperature and then Artificially aged.
T6 Solution heat treated and artificially aged.
T7 Solution heat treated and stabilized
T8 Solution heat treated, cold worked and artificially aged
T9 Solution heat treated, artificially aged and cold worked
T10 Cooling from elevated temperature and then cold worked and finally artificially aged
For non-heat treatable alloys, the mechanical properties are attained using strain hardening process. In this the
alloy is given strength through cold working. The temper designation for alloys is an indicator of material
condition and it is the extension of Al alloy number. Temper usually represented by letters which follow the
designation number. For example, 6061-T6 and 5083-H12. The basic letters used for temper designation are F,
O, H, W, & T. Table 3 shows the significance of each letter. Further ‘H’ Temper is subdivided in two categories
as shown in Table 4 and Table 5. Table 4 shows the significance of first digit after ‘H’ represents the basic
operation (Kissell, 2004). Table 5 represents the significance of second digit after ‘H’ temper. Table 6 shows the
subdivisions of ‘T’ Temper. Out of the ten tempers T3, T6 and T7 are perhaps the most important.
3. Types of Reinforcement
Reinforcement has a significant role in increasing the mechanical properties of a composite material. Typical
reinforcements are asbestos, carbon, boron, graphite, metal glass, jute, ceramic fibre, alumina and synthetic fibre
(Thirumalai et al, 2014 and Kanga et al, 2014). The prime factor that distinguishes reinforcement with filler is
the property of reinforcement to improve the tensile and flexural rigidity and also makes strong adhesive bond
with the resigns (Ceschini et al, 2006).
All the fibres used in composite exhibits different properties. Mostly fibres are arranged in some form of sheets
so as to withstand the loading. Different orientation of the fibre is possible which leads to distinguish between
fabric and their characteristics.
Major type of reinforcement used for AMCs can be classified in the following three ways.
1. Fabric particle reinforcement
2. Whisker or Short fibre Reinforcement
3. Long Fibre or continuous Fibre reinforcement
3.1 Fabric Particle reinforcement
Fabric Particle reinforcement (Figure 1) has no specific orientation and also does not have a specific shape. The
aspect ratio is less than 5 (Li and Ramesh, 1998). Due to lower aspect ratio the composite prepared by particle
reinforcement are inferior and are less brittle and lower in strength as compared to short fibre or whisker or
continuous fibre reinforcement [Sangha et al, 2002].But compared to unreinforced Al alloy these are of far
superior properties and generally isotropic in nature. The mainly employed reinforcements are oxides and
carbides (Al2O3 or Sic)
Figure 1.Particle Reinforcement

Proceedings of the National Conference on
Trends and Advances in Mechanical Engineering
(TAME-2017) March 16-17, 2017 ISBN 978-93-5268-269-0
YMCA University of Science & Technology, Faridabad, Haryana
229
3.2 Whisker or Short fibre Reinforcement
Single crystals grown having zero defects are termed as whiskers. The aspect ratio of whiskers/short fibre is
greater than 5. The whiskers have preferred shape, but have smaller diameter and length as compared to long
fibres. Whiskers are short fibres made from material such as graphite, silicon carbide, copper, iron etc. Whiskers
are differ from particles in the manner that whiskers have definite length to diameter ratio and have an
extraordinary strength of up to 7000 MPa. Fig 2 shows the orientation of short fibre reinforcement. Whisker
reinforcement is generally employed using the methods of powder metallurgy and slip casting techniques. Early
research shows the strength of the composite varies inversely with the effective diameter. The combination of
metal-whisker giving strength to the system at elevated temperature has been conducted at the laboratory level,
but whiskers being small sized and very fine in nature found difficult to handle and this comes as a drawback in
incorporating them into engineering material and to make a composite of superior quality (Chen and Wang,
2002).
However study on crystal structure and generation of newer metals ignited the interest in short fibres as give
high modulus, greater strength and found suitable for low weight structure composites. Reinforced composite
exhibits characteristics in between particle reinforced composite and continuous fibre reinforced composite.
3.3 Long Fibre or continuous Fibre reinforcement:
Continuous fibres as shown in Figure 3 are characterized as long axis fibre in one direction and often circular at
the other two. The particle size is usually less than 20 𝜇𝑚 in diameter. The orientation, shape, length and
composite of a fibre are the main factors which decide the performance of a fibre and properties of matrix. The
orientation of the fibre indicates the strength of the composite, and strength is great when the load is applied
parallel to the axis of the fibre (Lauke, 1990). If the loading shifts to slightest of an angle, the fibre may not give
the optimum performance and correspondingly reduce the strength of the composite
Figure 2Whisker or Short Reinforcement Figure 3Long Fiber Reinforcement
4. Conclusion
Today’s aluminum alloys, together with their various tempers, comprise a wide and versatile range of
manufacturing materials. The authors believe that an important part of understanding these differences is to
become familiar with the various alloys, their characteristics. The temper designation helps to find out the
discrete characteristics of an alloy and better understanding of the identification system. With the help of
reinforcement material the properties can be enhanced to a great level and adding adequate proportions of the
alloying elements aluminum exhibits unique characteristics that make it accessible for all types of application.
References
Budinski, Kg., Budinski, Mk., 2009, Engineering Materials, Properties And Selection
Ceschini, L., Minak, G., And Morri., A, 2006, Tensile And Fatigue Properties Of The Aa6061/20 Vol.% Al2o3p
And Aa7005/10 Vol.% Al2o3p Composites, Composites Science And Technology, 66, 333–342
Proceedings of the National Conference on
Trends and Advances in Mechanical Engineering
(TAME-2017) March 16-17, 2017 ISBN 978-93-5268-269-0
YMCA University of Science & Technology, Faridabad, Haryana
230
Chen, Sh., And Wang, Tc., 2002, Size Effects In The Particle-Reinforced Metal-Matrix Composites. Acta
Mechanica, 157, 113-127
Kanga, Yc., And Chan, Sl., 2004, Tensile Properties Of Nanometric Al2o3 Particulate-Reinforced Aluminum
Matrix Composites, Materials Chemistry And Physics, 85, 438–443
Kaufman, Jg., 2009, Introduction To Aluminum Alloys And Tempers
Kissell, Jr., 2004, Aluminium And Aluminium Alloys, Handbook Of Advanced Materials
Lauke, B., 1990, Theoretical Considerations Of Toughness Of Short-Fibr-Reinforced Thermoplastics, Polymer-
Plastics Technology And Engineering 29, 607-617
Li, Y., And Ramesh, Kt., 1998, Influence Of Particle Volume Fraction, Shape, And Aspect Ratio On The
Behavior Of Particle-Reinforced Metal–Matrix Composites At High Rates Of Strain, Acta Materialia, 46, 5633–
5646
Mukhopadhyay, P., 2012, Alloy Designation, Processing, And Use Of Aa6xxx Series Aluminium Alloys,
International Scholarly Research Network Isrn Metallurgy, 1-15
Poovazhagan, L., Kalaichelvan, K., Rajadurai, A And Senthilvelan, V. 2013, Characterization Of Hybrid Silicon
Carbide And Boron Carbide Nanoparticles-Reinforced Aluminum Alloy Composites, International Conference
On Design And Manufacturing, Icondm 2013; Procedia Engineering 64: 681 – 689
Singh, D., Singh, H., And Kumar, S., 2012, An Experimental Investigation Of Mechanical Behavior Of
Aluminum By Adding Sic And Alumina, International Journal On Emerging Technologies, 29, 178-184
Sorensen, Nj., Suresh, S., Tvergaard, V., And Needleman, A., 1995, Effects Of Reinforcement Orientation On
The Tensile Response Of Metal-Matrix Composites, Materials Science And Engineering: A, 197, 1-10
Thirumalai, T., Subramanian, R., Kumaran, S., Dharmalingam, S., And Ramakrishnan, Ss., 2014, Production
And Characterisation Of Hybrid Aluminum Matrix Composites Reinforced With Boron Carbide (B4c) And
Graphite, Journal Of Scientific And Industrial Research, 73, 667-670

Proceedings of the National Conference on
Trends and Advances in Mechanical Engineering
(TAME-2017) March 16-17, 2017 ISBN 978-93-5268-269-0
YMCA University of Science & Technology, Faridabad, Haryana
231
A REVIEW ON ELECTRO CHEMICAL DISCHARGE MACHINING
PROCESS (ECDM)
Rajnish Saxena1,
Amitava Kumar Mandal2, Somnath Chattopdhyay
3and B.K.Bhuyan
4
1 Research Scholar IIT (ISM) Dhanbad, Astt. Prof. Department of Mechanical Engineering, FET, MRIU
Faridabad 121001, India 2 Astt. Prof. MED IIT (ISM) Dhanbad
3 Assoc. Prof. MED IIT (ISM) Dhanbad
Assoc. Prof. MED FET, MRIU Faridabad
Phone: 9911269824, e-mail: [email protected], [email protected]
Abstract
Today the demand of advance engineering materials increases and these advance engineering materials are
tough to machining due to their specific purpose. So for machining of these non conductive material like
Glass, Ceramics, composite material, a new recent hybrid non traditional machining technique called Electro
Chemical Discharge Machining (ECDM) proposed by Kurafugi sudda. It can be applied in micro fabrication,
heat treatment, welding. Advanced ceramics and composites have high potential for their application in various
field of engineering due to their superior properties such as high compressive strength, good thermal shock
resistance, high wear resistance, high hardness, high strength, to weight ratio such improved material
properties have new challenges in manufacturing. ECDM may be the one of the best solution of these such
problems In this review paper a study about conventional, unconventional manufacturing, hybrid process,
ECDM literature & a fish bone diagram of process performance like work piece, tool electrode, Electric,
Auxiliary electrode, electrolyte etc are discussed.
Keywords: ECDM, ECM, EDM, NTM, Hybrid process.
1. Introduction Now a days demand of non conductive ceramic materials such as Zicronium oxide, Aluminium oxide, Epoxy
fiber composite, Glass has been increase day by day, these advance materials used in Aeronautical, Jwellery
industries, Bio medical, Space, Power plant, Medical . Glass is widely used advance material because of its
unique mechanical properties, but these materials are tough to machining by conventional method but can easily
machine by non conventional machining method. Machining is a manufacturing process involving removal of
thin layer of material (called chip) from a work piece using a tool. Most common machining operations include
milling, drilling, boring, turning and broaching. In all machining process there is a contact between tool and
work piece, but through these process removal of material is a very typical task now a days. As in modern
machining Method [1] harder, tough and stronger materials are difficult to machining by this process.
Conventional machining involves direct contact between the tool and the work piece in which power-driven
machine tools, such as saws, lathes, milling machines and drill presses, are used with a sharp cutting tool to
remove material physically to achieve a desired geometry. In this process cutting tool is harder than work piece
at room temperature as well as under machining conditions and material removal takes place due to application
of cutting forces. Three principal machining processes are classified as turning, drilling and milling.
Nonconventional machining processes can be defined as the use of chemical, mechanical, thermal, electrical or
combinations of these energies processes to machine a work piece and remove material without contact between
work piece and tool materials.. Nonconventional machining processes, also called advanced manufacturing
processes, are employed where conventional machining processes are not feasible, satisfactory or economical.
While making a part from raw material, one may require bulk removal of material, forming cavities/holes and
finally finishing as per the parts requirements.

Proceedings of the National Conference on
Trends and Advances in Mechanical Engineering
(TAME-2017) March 16-17, 2017 ISBN 978-93-5268-269-0
YMCA University of Science & Technology, Faridabad, Haryana
232
Manufacturing Process classification[2]
Many advanced finishing processes have been employed to make circular and/or noncircular cavities and holes
in difficult-to-machine materials. Some of the processes employed for hole making are electro-discharge
machining, laser beam machining, electron beam machining, shaped tube electro-chemical machining and
electrochemical spark machining. With the demand for stringent technological and functional requirements of
the parts from the micro-to nano metre range, ultra precision finishing processes have evolved to meet the needs
of the manufacturing scientists and engineers [3]. Nowadays, hybrid manufacturing technology has drawn
significant interest from both academia and industry due to the capability to make products in a more efficient
and productive way [4]. Although there is no specific consensus on the definition of the term “Hybrid Process
“researchers have explored a no. of approaches to combine different manufacturing process to achieve better
surface integrity, higher material removal rate, lower tool wear [5].Yadava et al [6] reported that miniaturization
and manufacturing light weight products are becoming more valuable since they can provide more powerful
functions in limited space. Also increasing the need for development of MEMS/NEMS. To machine these
advanced difficult to machine material, newer machining process have come forwarded. Recently a new trend
has been introduced to combine the features of different machining process such machining process are called as
Hybrid Machining Process (HMPs). There are so many hybrid machining process like:-
Abrasive Electrical Discharge Grinding – AEDG
Abrasive Electrical Discharge Machining (Sinking) – AEDM
Magnetic Abrasive Finishing – MAF
Ultrasonic Machining with Electrochemical assistance – USMEC
Laser assistance Electrochemical Machining LECM
Laser Assistance Etching – LAE
Electro Chemical Discharge Machining - ECDM
Mechano-Chemical Polishing – MCP
Elastic Emision Machining – EEM
Other processes like ultrasonic machining, abrasive jet machining, laser beam machining and electron beam
machining are some of the advanced machining processes that can be used for machining these materials, but
dimensional accuracy and good surface quality of the machined surfaces are the major concern. ECM and EDM
are also being used for electrically conductive materials and failed to machine non-conductive materials. A best
possible option for getting high surface quality by Electro Chemical Discharge Machining (ECDM) for these
advance materials. In this process material removal is as high as five to fifty times of EDM & ECM process.

Proceedings of the National Conference on
Trends and Advances in Mechanical Engineering
(TAME-2017) March 16-17, 2017 ISBN 978-93-5268-269-0
YMCA University of Science & Technology, Faridabad, Haryana
233
ECDM process first time used by Kurafugi in 1968 [7] for machining of non composite materials called
Electrical Discharge Drilling (EDD), this hybrid machining process have potential to machine hard and brittle
material non conductive material with good surface quality desired by industry.
Basak et al in 1997[8] found in their research that the critical voltage and current require to initiate the
discharge. In this work they developed a theoretical modal and compared it with experimental data.
Ghosh in 1997 [9] found that in his research switching phenomenon plays a crucial role in spark generation
and not the straight forward breakdown of non conductive material. The mechanism of spark generation has
been understood well and inductance in the circuit has emerged as an important process parameter from the
investigation.
Bhattacharyyaet al. [10] discussed the basic material removal mechanism in the ECDM process for the effective
machining of non-conducting ceramic materials and carried out investigation on the effects of various process
parameters such as the applied voltage; concentration and type of electrolyte; the shape, size and material of the
electrodes also stated that the material removal took place due to the combined effects of electrochemical (EC)
reaction and electrical spark discharge (ESD) action and it was found that two types of reactions usually
occurred in the system electrochemical reactions at the electrode, e.g. gas evolution, plating, electrode
dissolution and oxidation, etc.; and chemical reactions in the bulk of the electrolyte, e.g. chemical combinations,
the complex formation or precipitation reactions for precipitates and sludges, etc.
Liu et al. [11] developed a grinding-aided electrochemical discharge machining (GECDM) process to improve
the performance in machining particulate reinforced metal matrix composites (MMCs). The material removal
mechanism of this hybrid process has been analyzed to show the effect of additional grinding action on material
removal rate of ECDM. An experimental setup was designed, with controlled factors of electrolyte
concentration, applied voltage, pulse duration, duty cycle and spindle speed, to examine the additional grinding
effect on machined surface roughness.
Cao et al. [12] investigated a hybrid process of ECDM and Micro-Grinding using polycrystalline diamond
(PCD) tools to reduce the machining time and improve the surface quality that obtained by ECDM process. The
authors showed that 3D micro structures with high surface quality in glass could be machined efficiently by
combining ECDM and PCD grinding. A comparison of machining time was between the conventional grinding
and the hybrid process it revealed that the machining time in the hybrid process was considerably lower
compare to that under the grinding action. The hybrid micromachining process could be applicable in the
fabrication of complicated structures with high quality in glass material. The machining feed rate was also
studied to increase the material removal rate (MRR).
Jiang et al. [13] presented an experiment-based stochastic model for spark energy estimation in electrochemical
discharge machining process. For experimentation tungsten tool electrode was chosen with 250 μm diameter
and the electrolyte was 30 wt% NaOH. Tapered tool electrodes were used to improve the consistency of spark
generation. The authors showed that using tapered tool the consistency of spark generation was improved and
suppressed the generation of minor discharges. The authors also presented a finite element based model to
correlate spark energy and the geometry of removed material and stated that material removal was due to
thermal melting and chemical etching. In this study, gas film formation was explained with the help of current
output of DC power supply and In the experiments, the minimum pulse width of power supply was set higher
than 30 ms. It was suggested that material removal can be simulated by solving heat transfer problems as
electrical energy transferred converted into heat source acting on the work piece in machining process.
Huang et al. [14] applied the ECDM process in metal for drilling micro-holes and used a work piece material of
304 stainless steel that was drilled by ECDM process. Tungsten carbide with from diameters 250 μm to 400 μm
was used as micro-tool electrodes with High- Speed Rotating. Tool wear of the tool was observed before and
after marching operation The authors observed the shape and surface status of the drilled micro-holes by
scanning electron microscopy (SEM and showed that in holes edge there was hardly burrs and stray current
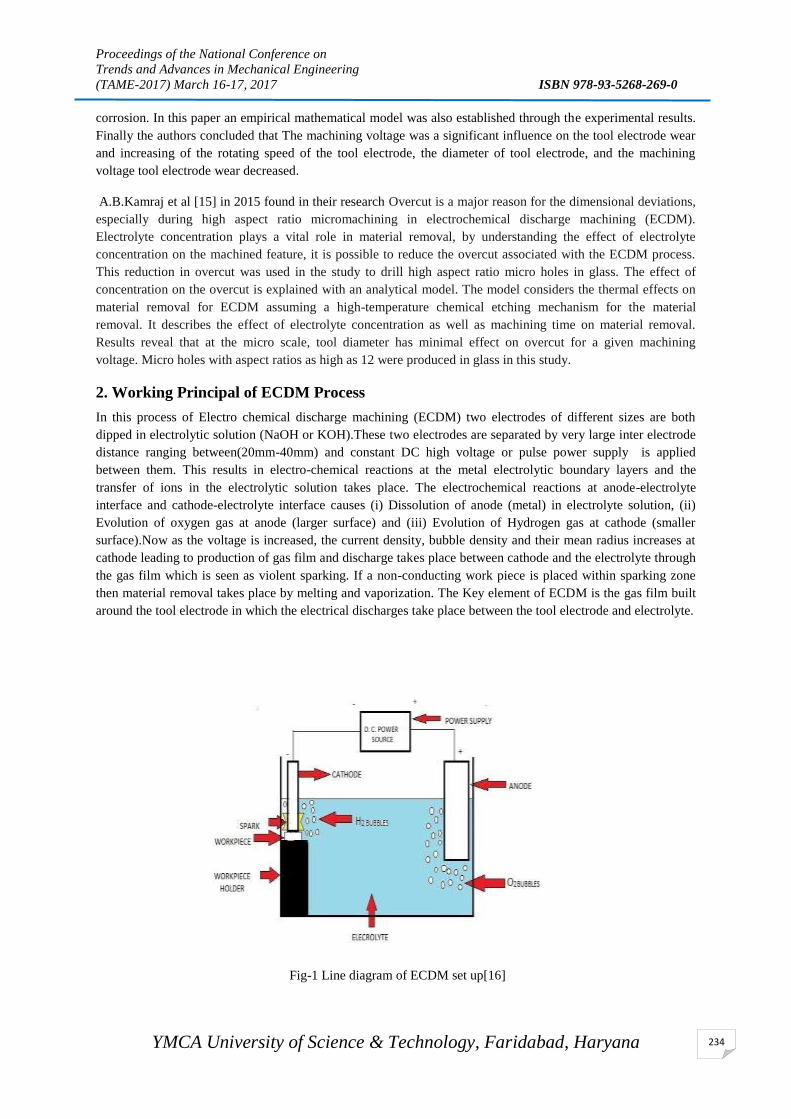
Proceedings of the National Conference on
Trends and Advances in Mechanical Engineering
(TAME-2017) March 16-17, 2017 ISBN 978-93-5268-269-0
YMCA University of Science & Technology, Faridabad, Haryana
234
corrosion. In this paper an empirical mathematical model was also established through the experimental results.
Finally the authors concluded that The machining voltage was a significant influence on the tool electrode wear
and increasing of the rotating speed of the tool electrode, the diameter of tool electrode, and the machining
voltage tool electrode wear decreased.
A.B.Kamraj et al [15] in 2015 found in their research Overcut is a major reason for the dimensional deviations,
especially during high aspect ratio micromachining in electrochemical discharge machining (ECDM).
Electrolyte concentration plays a vital role in material removal, by understanding the effect of electrolyte
concentration on the machined feature, it is possible to reduce the overcut associated with the ECDM process.
This reduction in overcut was used in the study to drill high aspect ratio micro holes in glass. The effect of
concentration on the overcut is explained with an analytical model. The model considers the thermal effects on
material removal for ECDM assuming a high-temperature chemical etching mechanism for the material
removal. It describes the effect of electrolyte concentration as well as machining time on material removal.
Results reveal that at the micro scale, tool diameter has minimal effect on overcut for a given machining
voltage. Micro holes with aspect ratios as high as 12 were produced in glass in this study.
2. Working Principal of ECDM Process
In this process of Electro chemical discharge machining (ECDM) two electrodes of different sizes are both
dipped in electrolytic solution (NaOH or KOH).These two electrodes are separated by very large inter electrode
distance ranging between(20mm-40mm) and constant DC high voltage or pulse power supply is applied
between them. This results in electro-chemical reactions at the metal electrolytic boundary layers and the
transfer of ions in the electrolytic solution takes place. The electrochemical reactions at anode-electrolyte
interface and cathode-electrolyte interface causes (i) Dissolution of anode (metal) in electrolyte solution, (ii)
Evolution of oxygen gas at anode (larger surface) and (iii) Evolution of Hydrogen gas at cathode (smaller
surface).Now as the voltage is increased, the current density, bubble density and their mean radius increases at
cathode leading to production of gas film and discharge takes place between cathode and the electrolyte through
the gas film which is seen as violent sparking. If a non-conducting work piece is placed within sparking zone
then material removal takes place by melting and vaporization. The Key element of ECDM is the gas film built
around the tool electrode in which the electrical discharges take place between the tool electrode and electrolyte.
Fig-1 Line diagram of ECDM set up[16]
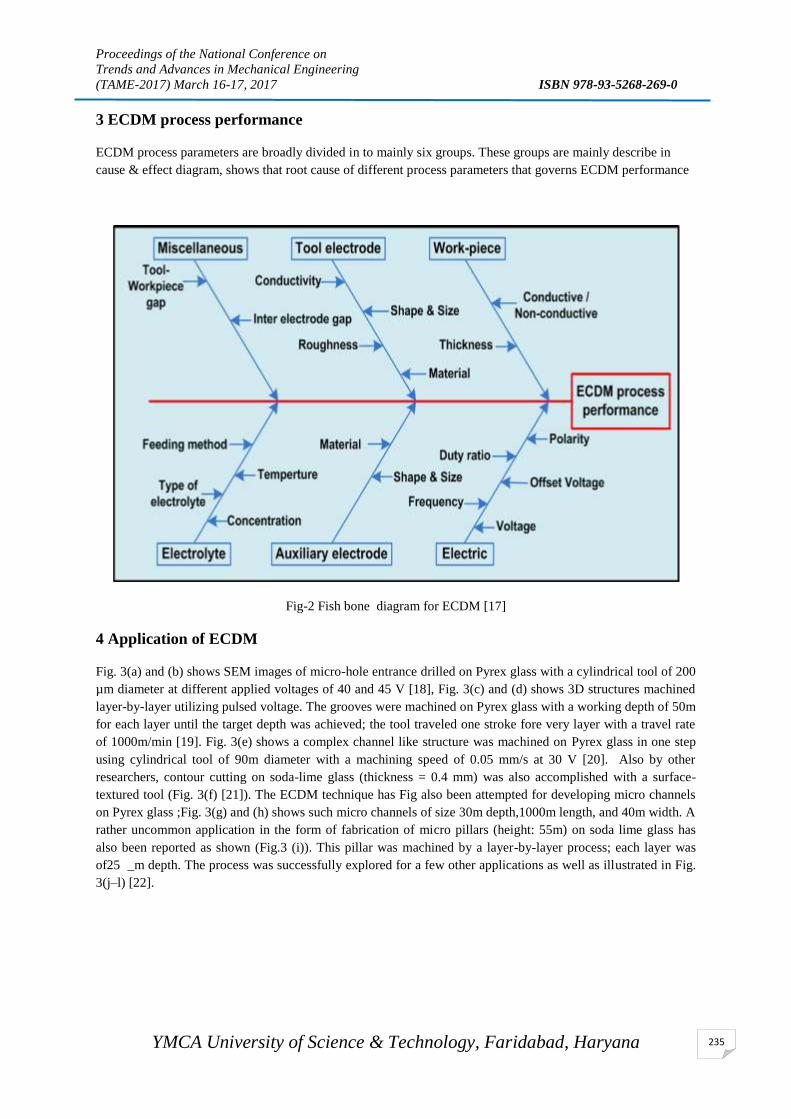
Proceedings of the National Conference on
Trends and Advances in Mechanical Engineering
(TAME-2017) March 16-17, 2017 ISBN 978-93-5268-269-0
YMCA University of Science & Technology, Faridabad, Haryana
235
3 ECDM process performance
ECDM process parameters are broadly divided in to mainly six groups. These groups are mainly describe in
cause & effect diagram, shows that root cause of different process parameters that governs ECDM performance
Fig-2 Fish bone diagram for ECDM [17]
4 Application of ECDM
Fig. 3(a) and (b) shows SEM images of micro-hole entrance drilled on Pyrex glass with a cylindrical tool of 200
µm diameter at different applied voltages of 40 and 45 V [18], Fig. 3(c) and (d) shows 3D structures machined
layer-by-layer utilizing pulsed voltage. The grooves were machined on Pyrex glass with a working depth of 50m
for each layer until the target depth was achieved; the tool traveled one stroke fore very layer with a travel rate
of 1000m/min [19]. Fig. 3(e) shows a complex channel like structure was machined on Pyrex glass in one step
using cylindrical tool of 90m diameter with a machining speed of 0.05 mm/s at 30 V [20]. Also by other
researchers, contour cutting on soda-lime glass (thickness = 0.4 mm) was also accomplished with a surface-
textured tool (Fig. 3(f) [21]). The ECDM technique has Fig also been attempted for developing micro channels
on Pyrex glass ;Fig. 3(g) and (h) shows such micro channels of size 30m depth,1000m length, and 40m width. A
rather uncommon application in the form of fabrication of micro pillars (height: 55m) on soda lime glass has
also been reported as shown (Fig.3 (i)). This pillar was machined by a layer-by-layer process; each layer was
of25 _m depth. The process was successfully explored for a few other applications as well as illustrated in Fig.
3(j–l) [22].
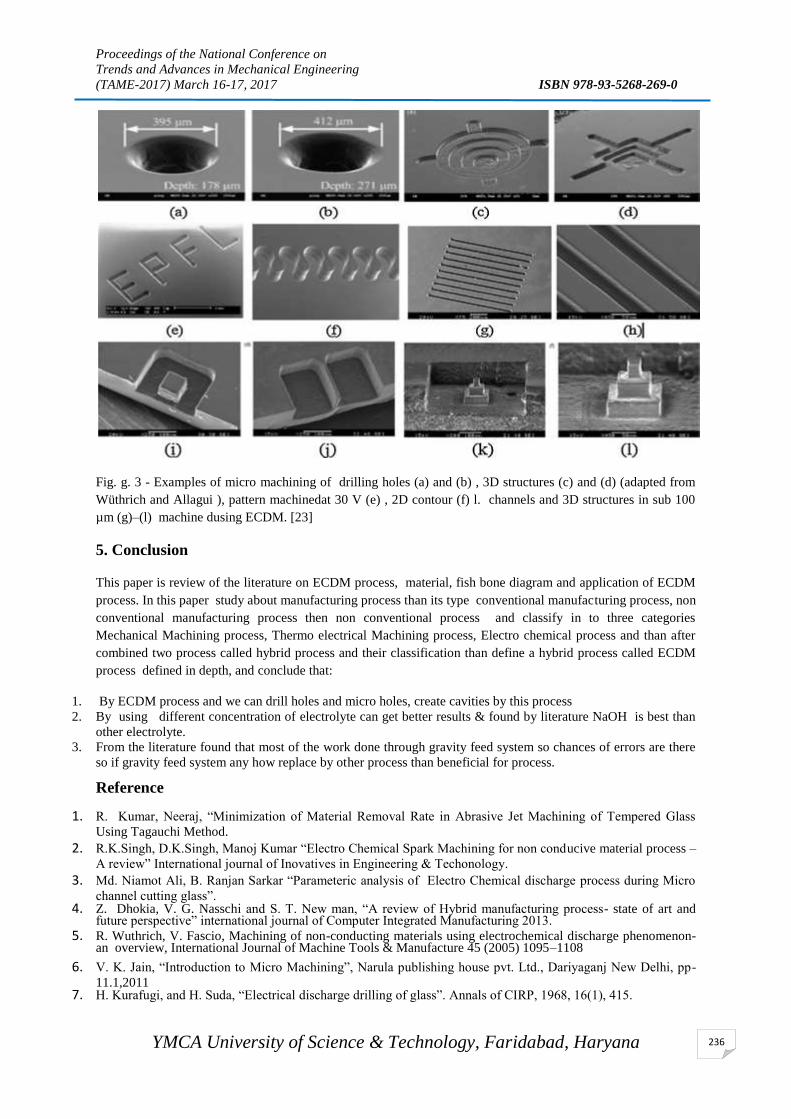
Proceedings of the National Conference on
Trends and Advances in Mechanical Engineering
(TAME-2017) March 16-17, 2017 ISBN 978-93-5268-269-0
YMCA University of Science & Technology, Faridabad, Haryana
236
Fig. g. 3 - Examples of micro machining of drilling holes (a) and (b) , 3D structures (c) and (d) (adapted from
Wüthrich and Allagui ), pattern machinedat 30 V (e) , 2D contour (f) l. channels and 3D structures in sub 100
µm (g)–(l) machine dusing ECDM. [23]
5. Conclusion
This paper is review of the literature on ECDM process, material, fish bone diagram and application of ECDM
process. In this paper study about manufacturing process than its type conventional manufacturing process, non
conventional manufacturing process then non conventional process and classify in to three categories
Mechanical Machining process, Thermo electrical Machining process, Electro chemical process and than after
combined two process called hybrid process and their classification than define a hybrid process called ECDM
process defined in depth, and conclude that:
1. By ECDM process and we can drill holes and micro holes, create cavities by this process
2. By using different concentration of electrolyte can get better results & found by literature NaOH is best than
other electrolyte.
3. From the literature found that most of the work done through gravity feed system so chances of errors are there
so if gravity feed system any how replace by other process than beneficial for process.
Reference
1. R. Kumar, Neeraj, “Minimization of Material Removal Rate in Abrasive Jet Machining of Tempered Glass
Using Tagauchi Method.
2. R.K.Singh, D.K.Singh, Manoj Kumar “Electro Chemical Spark Machining for non conducive material process –
A review” International journal of Inovatives in Engineering & Techonology.
3. Md. Niamot Ali, B. Ranjan Sarkar “Parameteric analysis of Electro Chemical discharge process during Micro
channel cutting glass”. 4. Z. Dhokia, V. G. Nasschi and S. T. New man, “A review of Hybrid manufacturing process- state of art and
future perspective” international journal of Computer Integrated Manufacturing 2013.
5. R. Wuthrich, V. Fascio, Machining of non-conducting materials using electrochemical discharge phenomenon-an overview, International Journal of Machine Tools & Manufacture 45 (2005) 1095–1108
6. V. K. Jain, “Introduction to Micro Machining”, Narula publishing house pvt. Ltd., Dariyaganj New Delhi, pp-
11.1,2011 7. H. Kurafugi, and H. Suda, “Electrical discharge drilling of glass”. Annals of CIRP, 1968, 16(1), 415.

Proceedings of the National Conference on
Trends and Advances in Mechanical Engineering
(TAME-2017) March 16-17, 2017 ISBN 978-93-5268-269-0
YMCA University of Science & Technology, Faridabad, Haryana
237
8. I. Basak, A. Ghosh, “Mechanism of material removal in electro chemical discharge machining A theoretical modal and experimental investigation”, Journal of materials processing & technology 357 1997, pp 350-359.
9. A. Ghosh, “Electro Chemical Discharge Machining and possibilities” sadhand volume 22, part 3, june 1997, pp 435-447.
10. Bhattacharyya, B., Doloi, B., Sorkhel, S.K., Experimental investigations into electrochemical discharge
machining (ECDM) of non-conductive ceramic materials Journal of Materials Processing Technology, 95, 145-
154, 1999.
11. Liu, J. W., Yue, T. M. and Guo, Z. N., Grinding-aided electrochemical discharge machining of particulate
reinforced metal matrix composites, International Journal of Advanced Manufacturing Technology, 8, 4846,
2013.
12. Cao, X. D., Kim, B. Y. and Chu, C. N., Hybrid Micromachining of Glass using ECDM and Micro Grinding,
International Journal of Precision Engineering and Manufacturing, 14 (1), 5-10, 2013.
13. Jiang, B., Lan, S., Ni, J., Zhang, Z., Experimental investigation of spark generation in electrochemical discharge
machining of non-conducting materials, Journal of Materials Processing Technology, 214, 892– 898, 2014.
14. Huang, S. F., Liu, Y., Li, J., Hu, H. X., Sun, L. Y., Electrochemical DischargeMachining Micro-Hole in
Stainless Steel with Tool Electrode High-Speed Rotating, Materials and Manufacturing Processes, 29, 634–637,
2014.
15. Kamraj B. Abhishek, Jui K. Sumit, Cai Zicheng, Sundaram M Murli “A mathematical moal to predict over cut
during electro chemical discharge machining process” International journal of Advance Manf. Technology.
16. R.Saxena, B.K.Bhuyan, “Design and experimental investigation of Electro chemical discharge machining of
Tinny glass” ELK Asia pascific Journal.
17. T. Singh, A. Dvivedi, “Developments in electrochemical discharge machining: A review on electrochemical
discharge machining, process variants and their hybrid methods” International Journal of MachineTools &
Manufacture 105(2016)1–13
18. CP Cheng, KL Wu, CC Mai , CK Yang, YS Hsu, BH Yan. Study of gas film qual-ity in electrochemical
discharge machining. Int J Mach Tool Manuf 2010;50:689–97.
19. ZP Zheng, WH Cheng, FY Huang, BH Yan, “ 3D micro structuring of Pyrex glass using the electrochemical
discharge machining process”. J Micro mech Microeng2007;17:960–6.
20. V Fascio, R Wüthrich, H Bleuler , “. Spark assisted chemical engraving in the light of electrochemistr”.
Electrochim Acta 2004;49:3997–4003.
21. MS Han, BK Min, SJ Lee. “ Micro-electrochemical discharge cutting of glass using a surface-textured tool.
CIRP J Manuf Sci Technol 2011;4:362–9.
22. XD Cao, BH Kim, CN Chu. “ Micro structuring of glass with features less than100 _m by electrochemical
discharge machining”. Precis Eng 2009;33:459–65.
23. M Goud, A. K. Sharma,, C Jawallakar, “A review on material removal mechanism in electrochemical discharge
machining (ECDM) and possibilities to enhance the material removal rate.
Proceedings of the National Conference on
Trends and Advances in Mechanical Engineering
(TAME-2017) March 16-17, 2017 ISBN 978-93-5268-269-0
YMCA University of Science & Technology, Faridabad, Haryana
238
METHODOLOGIES OF COMPOSITE FABRICATION BY RAPID
PROTOTYPING TECHNIQUES: A REVIEW
Ashish Kumar Dey1, Arsh Oberoi
1, Hemant Chouhan
2
1,2
Department of Mechanical Engineering, ASET, Amity University Uttar Pradesh, 201313, India
Phone: +91-120-4392638, Fax: +91-120-2433234, e-mail: [email protected]
Abstract
The usage of rapid prototyping (RP) technology for rapid tooling and rapid manufacturing has given rise to the
development of application-oriented composites. The presentedreview provides concise notes of the composites
designed using rapid prototyping techniques of Selective Laser Sintering, Stereolithography and Fused
Deposition Modelling. The subject matter is of importancedue to the fact that in present date scenario the
methodologies of composite processing and formation are gaining importance. Incorporation of reinforcing
material in to rapid prototyping techniques can help develop new class of composites in a fast and efficient
manner.
Keywords: Rapid Prototyping, Composites, Selective Laser Sintering, Stereolithography, Fused Deposition
Modelling
1.Introduction The present date requirements of materials to be used for different engineering applications are significantly
capricious. Every now and then there is a requirement of a new class of material to serve the specific
application. Rapid prototyping (RP) emerged as thenew class of prototyping technique, capable of delivering
thefinal product to the dimension in minimal time. However, the strength characteristics of components
developed by rapid prototyping techniques may not serve the purpose onfront of load carrying capabilities.
Though initially RP techniques focussed on polymers only, but in present date scenario, even metals can be
processed successfully. Yet at times the final products are unable to fulfill the necessity [1-4].
Parallely, composites which refer to a judicious combination of two or more materials at amacroscopic level
resulting into the properties which cannot be attained by any of the constituent materials individually has
emerged. Though composites serve well for applications where others techniques fail, but processing steps
involved in thefabrication of composites demand significant development time, and associated with that is a
processing cost. Therefore, need arose to create composites out of fast and efficient manufacturing techniques,
like RP techniques [5-9].
In general in a RP technique a mix of different polymers might be utilized, in which distinctive polymers
assume the part of tackifier(Enables tackiness and provides flexibility), plasticizer(Provides plasticity to
thefilament for spooling), surfactant, and so on. There are various RP systems in fashion,however, some of them
have been employed for the formation of composites. The processes which have mainly been engaged in
fabricating of composites are Selective Laser Sintering (SLS), Laminated Object Manufacturing (LOM),
Stereolithography (SL), Fused Deposition Modelling (FDM) [10-15].
2.Fused Deposition Method In an FDM process, a spool of thermoplastic filament feeds into a heated FDM extrusion head. The movement
of the FDM head is controlled by acomputer program. Inside extrusion head, the filament is melted into liquid
by a resistance heater. The head traces an exact outline of each cross-section layer of the part. As the head
moves horizontally in x and y-axes the thermoplastic material is extruded out a nozzle by a precision pump. The
material solidifies in l/10 s as it is directed onto the workplace (Fig. 1). After one layer is finished, the extrusion
head moves up a programmed distance in thez-direction for building the next layer. The thickness of each layer
is given when the nozzle moves in z direction. Each layer is bonded to the previous layer due to heat induced
melting and diffusion.
Fused Deposition Modelling (FDM) is capable of yielding strong composite parts as bond forms between
successive layers due to partial or complete melting of the feedstock composite filaments. In the case an
overhanging section is to be produced, a removable support has to be created using same nozzle/another nozzle.
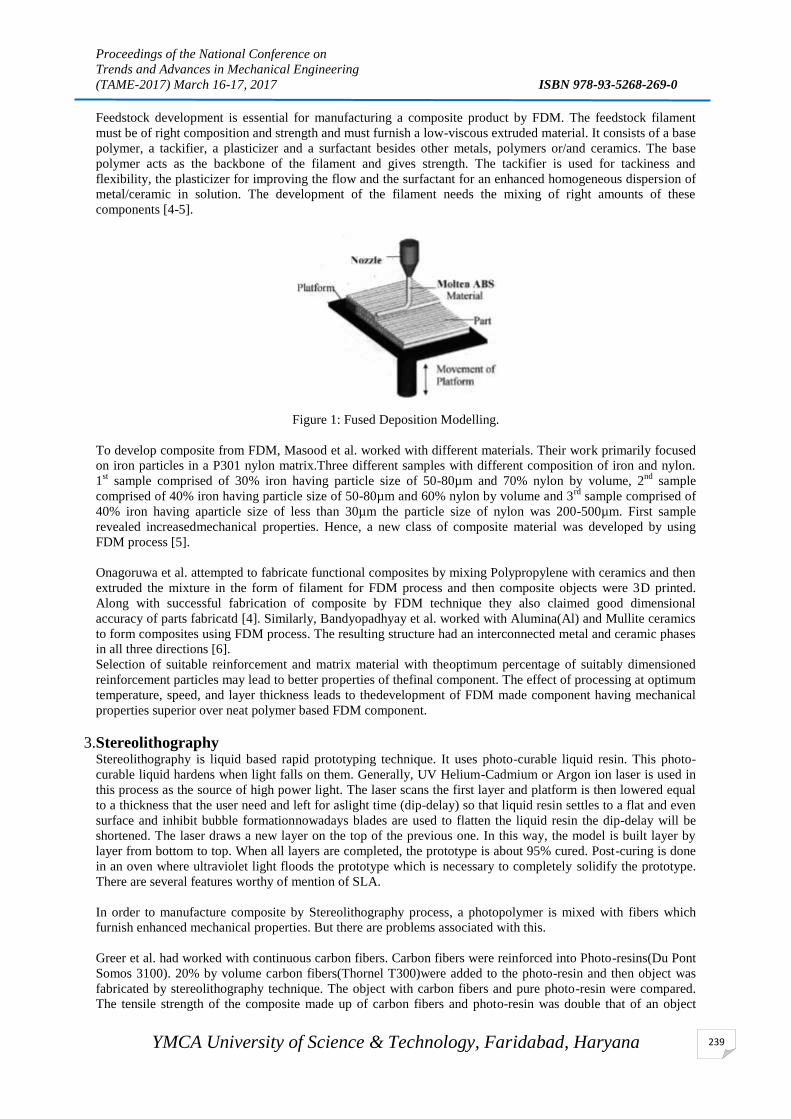
Proceedings of the National Conference on
Trends and Advances in Mechanical Engineering
(TAME-2017) March 16-17, 2017 ISBN 978-93-5268-269-0
YMCA University of Science & Technology, Faridabad, Haryana
239
Feedstock development is essential for manufacturing a composite product by FDM. The feedstock filament
must be of right composition and strength and must furnish a low-viscous extruded material. It consists of a base
polymer, a tackifier, a plasticizer and a surfactant besides other metals, polymers or/and ceramics. The base
polymer acts as the backbone of the filament and gives strength. The tackifier is used for tackiness and
flexibility, the plasticizer for improving the flow and the surfactant for an enhanced homogeneous dispersion of
metal/ceramic in solution. The development of the filament needs the mixing of right amounts of these
components [4-5].
Figure 1: Fused Deposition Modelling.
To develop composite from FDM, Masood et al. worked with different materials. Their work primarily focused
on iron particles in a P301 nylon matrix.Three different samples with different composition of iron and nylon.
1st sample comprised of 30% iron having particle size of 50-80µm and 70% nylon by volume, 2
nd sample
comprised of 40% iron having particle size of 50-80µm and 60% nylon by volume and 3rd
sample comprised of
40% iron having aparticle size of less than 30µm the particle size of nylon was 200-500µm. First sample
revealed increasedmechanical properties. Hence, a new class of composite material was developed by using
FDM process [5].
Onagoruwa et al. attempted to fabricate functional composites by mixing Polypropylene with ceramics and then
extruded the mixture in the form of filament for FDM process and then composite objects were 3D printed.
Along with successful fabrication of composite by FDM technique they also claimed good dimensional
accuracy of parts fabricatd [4]. Similarly, Bandyopadhyay et al. worked with Alumina(Al) and Mullite ceramics
to form composites using FDM process. The resulting structure had an interconnected metal and ceramic phases
in all three directions [6].
Selection of suitable reinforcement and matrix material with theoptimum percentage of suitably dimensioned
reinforcement particles may lead to better properties of thefinal component. The effect of processing at optimum
temperature, speed, and layer thickness leads to thedevelopment of FDM made component having mechanical
properties superior over neat polymer based FDM component.
3.Stereolithography Stereolithography is liquid based rapid prototyping technique. It uses photo-curable liquid resin. This photo-
curable liquid hardens when light falls on them. Generally, UV Helium-Cadmium or Argon ion laser is used in
this process as the source of high power light. The laser scans the first layer and platform is then lowered equal
to a thickness that the user need and left for aslight time (dip-delay) so that liquid resin settles to a flat and even
surface and inhibit bubble formationnowadays blades are used to flatten the liquid resin the dip-delay will be
shortened. The laser draws a new layer on the top of the previous one. In this way, the model is built layer by
layer from bottom to top. When all layers are completed, the prototype is about 95% cured. Post-curing is done
in an oven where ultraviolet light floods the prototype which is necessary to completely solidify the prototype.
There are several features worthy of mention of SLA.
In order to manufacture composite by Stereolithography process, a photopolymer is mixed with fibers which
furnish enhanced mechanical properties. But there are problems associated with this.
Greer et al. had worked with continuous carbon fibers. Carbon fibers were reinforced into Photo-resins(Du Pont
Somos 3100). 20% by volume carbon fibers(Thornel T300)were added to the photo-resin and then object was
fabricated by stereolithography technique. The object with carbon fibers and pure photo-resin were compared.
The tensile strength of the composite made up of carbon fibers and photo-resin was double that of an object
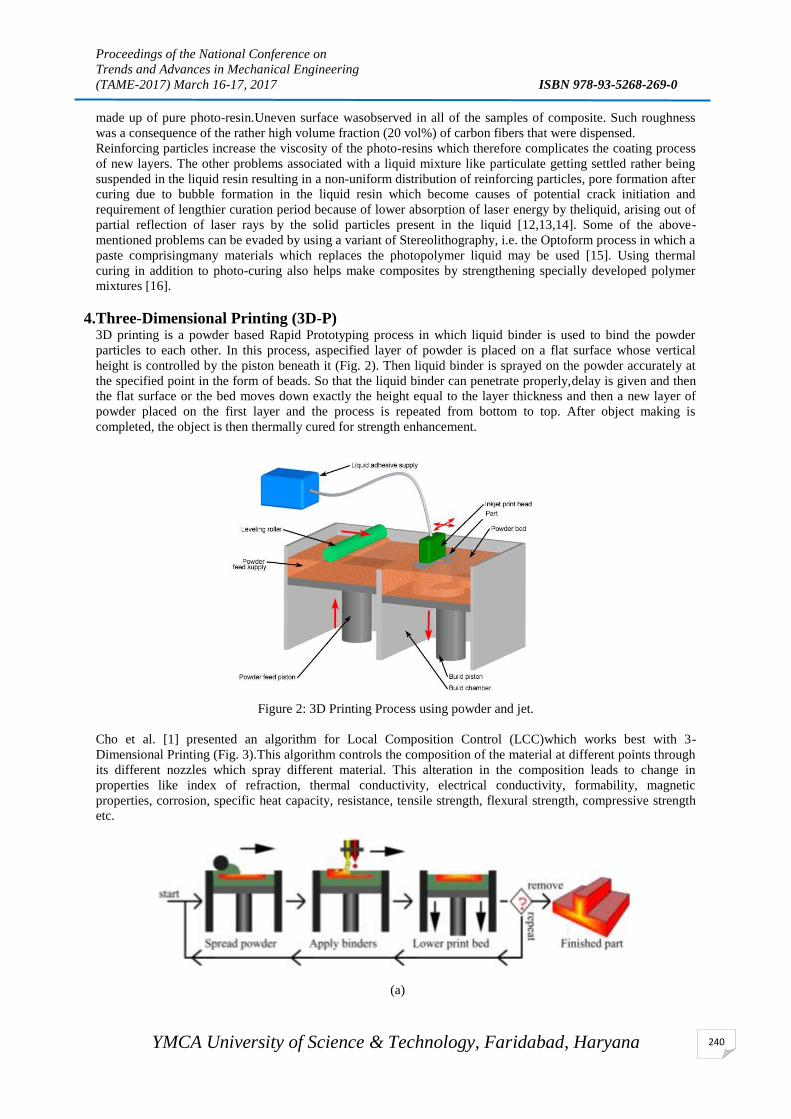
Proceedings of the National Conference on
Trends and Advances in Mechanical Engineering
(TAME-2017) March 16-17, 2017 ISBN 978-93-5268-269-0
YMCA University of Science & Technology, Faridabad, Haryana
240
made up of pure photo-resin.Uneven surface wasobserved in all of the samples of composite. Such roughness
was a consequence of the rather high volume fraction (20 vol%) of carbon fibers that were dispensed.
Reinforcing particles increase the viscosity of the photo-resins which therefore complicates the coating process
of new layers. The other problems associated with a liquid mixture like particulate getting settled rather being
suspended in the liquid resin resulting in a non-uniform distribution of reinforcing particles, pore formation after
curing due to bubble formation in the liquid resin which become causes of potential crack initiation and
requirement of lengthier curation period because of lower absorption of laser energy by theliquid, arising out of
partial reflection of laser rays by the solid particles present in the liquid [12,13,14]. Some of the above-
mentioned problems can be evaded by using a variant of Stereolithography, i.e. the Optoform process in which a
paste comprisingmany materials which replaces the photopolymer liquid may be used [15]. Using thermal
curing in addition to photo-curing also helps make composites by strengthening specially developed polymer
mixtures [16].
4.Three-Dimensional Printing (3D-P) 3D printing is a powder based Rapid Prototyping process in which liquid binder is used to bind the powder
particles to each other. In this process, aspecified layer of powder is placed on a flat surface whose vertical
height is controlled by the piston beneath it (Fig. 2). Then liquid binder is sprayed on the powder accurately at
the specified point in the form of beads. So that the liquid binder can penetrate properly,delay is given and then
the flat surface or the bed moves down exactly the height equal to the layer thickness and then a new layer of
powder placed on the first layer and the process is repeated from bottom to top. After object making is
completed, the object is then thermally cured for strength enhancement.
Figure 2: 3D Printing Process using powder and jet.
Cho et al. [1] presented an algorithm for Local Composition Control (LCC)which works best with 3-
Dimensional Printing (Fig. 3).This algorithm controls the composition of the material at different points through
its different nozzles which spray different material. This alteration in the composition leads to change in
properties like index of refraction, thermal conductivity, electrical conductivity, formability, magnetic
properties, corrosion, specific heat capacity, resistance, tensile strength, flexural strength, compressive strength
etc.
(a)

Proceedings of the National Conference on
Trends and Advances in Mechanical Engineering
(TAME-2017) March 16-17, 2017 ISBN 978-93-5268-269-0
YMCA University of Science & Technology, Faridabad, Haryana
241
(b)
Figure 3: (a) 3D printing with LCC, (b) Block Diagram of 3D printing with LCC [1]
Kernan et al. [2] successfully made a composite, using Tungsten Carbide with 10% Cobalt. As Tungsten
Carbide has acidic nature so, a new binder system is also described i.e. polyethyleneimine, this binder has high
pH in aqueous systems. Four samples having alayer thickness of 25µm were made.
Czyzewski et al. [11] successfully made an electrically conductive composite. The model was being
impregnated by adispersion of Carbon Nano Fibers(CNF). The object was impregnated by a mixture containing
less than 4wt.%carbon nanofibers. When impregnation was done the surface resistance of the object was below
800Ω/sq. and at 3wt% CNF content the volume resistance of the object was less than 200Ωcm.
5. Selective Laser Sintering Selective Laser Sintering/melting is a powder based RP technique. In this process, high power laser is used for
sintering/melting the powder which raises the temperature just below the glass transition temperature which
facilitates the fusion of nearby powder particles and next layer of powder material. Once laser scanning cures a
slice, thebed is lowered and powder feed chamber is raised so that a covering of powder can be spread evenly
over the build area by counter-rotating roller. In this process, support structures are not required as the un-
sintered powder remains at the places of thesupport structure. It is cleaned away and can be recycled once the
model is complete. In this way the object is printed from bottom to top. Post curation is done for increasing
strength of the object.
Figure 4: Selective Laser sintering.
Lua et al. [17] worked with Cu-Ti-C and Cu-Ni-Ti-C. A 100W CO2 laser with a wavelength of 10.6µm was
used for sintering process. Parts were analyzed by Shimadzu Lab 6000 X-ray diffractometer operated at 30 kV
and 20 mA. Microstructures were characterized by optical and scanning electron microscopes.With the addition
of Ni, the macrostructure, microstructure and distribution of TiC was improved because of the enhancement of
wettability of Ni with Cu.
Simchi et at. worked with Iron and Graphite powder. Four samples were made containing Iron and 0.4, 0.8, 1.2,
and 1.6wt.% graphite. These elements were previously blended with each other and then sintered layer by layer
using CO2 laser beam under Nitrogen atmosphere. The CO2 laser beam had power of 70–225W, scan rate of 50–
600mm/s, layer thickness of 0.1mm, and scan line spacing of 0.1–0.3 mm was used.The addition of graphite
enhances the densification of the iron powder and improves the surface quality of the laser sintered parts.
6. Conclusion Ever growing demand of efficient prototyping techniques having sufficient strength characteristics can be well
met by incorporation of reinforcements used in composite material systems. The standard RP raw materials
having low strength, when coupled with advantage of property enhancement due to reinforcement materials
used in composite systems has been reported to enhance the overall mechanical response of the components
fabricated by prototyping techniques. Depending on type of type material being used for RP, which may range
from continuous polymer filament to metal powder and type of reinforcement used, a significant enhancement
in the mechanical response of components has been reported. Though, the results are encouraging but

Proceedings of the National Conference on
Trends and Advances in Mechanical Engineering
(TAME-2017) March 16-17, 2017 ISBN 978-93-5268-269-0
YMCA University of Science & Technology, Faridabad, Haryana
242
optimization studies along with the development of new techniques for further enhancement of properties of RP
based composites needs to be investigated.
References [1] Wonjoon Cho Emanuel M. Sachs Nicholas M. Patrikalakis Donald E. Troxel, A Dithering Algorithm for
Local Composition Control with Three-Dimensional Printing, May 14, 2002.
[2]Kernan BD, Sachs EM. Three dimensional printing of tungsten carbide–cobalt using a cobalt oxide precursor.
In: Proc. SFF, Texas; 2003. p. 616–31.
[3]Greer C, McLaurin J, Ogale AA. Processing of carbon fiber reinforced composites by three dimensional
photolithography. In: Proc. SFF, Texas; 1996. p. 307–11.
[4]Onagoruwa S, Bose S, Bandyopadhyay A. Fused deposition of ceramics (FDC) and composites. In: Proc.
SFF, Texas; 2001. p. 224–31.
[5]Masood SH, Song WQ. Development of new metal/polymer materials for rapid tooling using fused
l65deposition modeling. Mater Design 2004;25:587–94.
[6]Bandyopadhyay A, Atisivan R, Kuhn G, Yeruva S. Mechanical properties of interconnected phase alumina–
Al composites. In: Proc. SFF, Texas; 2000. p. 24–31.
[7]SeyiOnagoruwa, Susmita Bose and Amit Bandyopadhyay. Fused Deposition of Ceramics (FDC) and
Composites.
[8]S. Kumar, J.P. Kruth, Composites by rapid prototyping technology.
[9]Xue Yan and P Gu, A review of rapid prototyping technologies and systems.
[10]Pulak M. Pandey. Rapid Prototyping Technologies, Applications and part deposition planning.
[11]J. Czyzewskia, P. Burzynskia,K.Gawel, J. MeisnercRapid prototyping of electrically conductive
components using 3D printing technology.
[12]Karalekas DE. Study of the mechanical properties of nonwoven fibre mat reinforced photopolymers used in
rapid prototyping. Mater Design 2003;24:665–70.
[13]Karalekas D, Antoniou K. Composite rapid prototyping: overcoming the drawback of poor mechanical
properties. J Mater Process Technol 2004;153– 154:526–30.
[14]Cheah CM, Fuh JYH, Nee AYC, Lu L. Mechanical characteristics of fibre-filled photo-polymer used in
stereolithography. Rapid Proto J 1999;5(3):112–9.
[15]Vaneetveld G, Clarinval AM, Dormal T, Noben JC, Lecomte-Beckers J. Optimization of the formulation
and post-treatment.
[16]Zak G, Haberer M, Park CB, Benhabib B. Mechanical properties of short-fibre layered composites:
prediction and experiment. Rapid Proto J 2000;6(2):107–18.
[17]L. Lua, J.Y.H. Fuha, Z.D. Chenb, C.C. Leonga , Y.S. WongaIn situ formation of TiC composite using
selective laser melting.

Proceedings of the National Conference on
Trends and Advances in Mechanical Engineering
(TAME-2017) March 16-17, 2017 ISBN 978-93-5268-269-0
YMCA University of Science & Technology, Faridabad, Haryana
243
MAGNETO RHEOLOGICAL FLUID ASSISTED ELECTRICAL
DISCHARGE MACHINING
Lokesh Upadhyaya, Dr. M L Agrawal
b,, Dr P.M Pandey
c
a,Department of Mechanical Engineering, YMCAUST, Fridabad, India
bDepartment of Mechanical Engineering, YMCAUST Faridabad, India
cDepartment of Mechanical Engineering, I.I.T Delhi, India
Abstract
The aim of this paper to reveal the process parameter that affects the material removal rate of EDM process by
using magneto rheological fluid as dielectric fluid. In this study, proposed a noble method of EDM that used MR
fluid instead of conventional oil like kerosene. This hybrid machining showed the dual advantage at single
platform. The viscoelastic nature of MR fluid gives the polishing effect as well as the high material removal by
combining this to EDM. As result of which process became more stable and machinability of EDM was
improved. Investigation have been performed to study the process factors effect namely discharge current, pulse
on time, duty cycle, percentage concentration of alumina particles. It was reported that material removal rate
improved significantly. The range of constituents of magneto rheological fluid was selected on the basis of pilot
experiments for synchronizing this fluid with electrical discharge machining. The effect of this new magneto
rheology combining with EDM was investigated. The experimental result demonstrates EDM process still can
perform with MR fluid and machinability can surely improve after fixing the CIPs percentage.
Keywords: Electrical discharge machining, Material removal rate, Magneto rheological fluid, Carbonyl iron
particles.
1. Introduction
A lot of research has been done on EDM in various aspects. The mechanization and automation of EDM is
demand of future for high quality and productivity of parts produced. The noble machining process has not only
simple but also simply adaptable to geometrically complex and hard materials. Electrical discharge machining is
used to machine materials which are difficult to machine but MRR and surface finish are always being a vital
issue to process the hard materials. The researchers are focussing on hybrid machining in current trends to
improve the material removal and surface finish with higher accuracy. A key frame technology is based on
hybrid machining of materials at the macro and micro scale. Y.Y.Tasi et al. [1] firstly used electro rheological
fluid as dielectric fluid in electrical discharge machining. The result demonstrates EDM process still can be
performed in electro rheological fluid. The waveform of single discharge pulse is almost the same whenever
starch concentration was. The study was revealed that electro rheological fluid of starch particles without
abrasive as working fluid, the surface was improved little. By adding the abrasive in electro rheological fluid
surely has the polishing effect to improve the surface roughness. V. K. Jain et al. [2] study the chemo
mechanical magneto rheological finishing of silicon. The study revealed that the finishing with very fine
abrasive result in superior surface finish and invent the process parameter were magnet rotation speed, working
time and finishing time.
The combined effect of chemical activation as well as mechanical erosion improved the finish of silicon work
piece by CMMRF. Ajay Sidpara et al. [3] investigate the theoretical analysis of forces in magneto rheological
fluid and the result showed that as the normal and tangential force increased by increasing the CIPs
concentration. But as abrasive particles concentration increased up to 3.5 % the surface roughness decreased due
to levitation forces. The tangential and squeeze force were responsible for changing the surface roughness
considerably. The study also reported that these forces became reduced by increasing the working gap. Teimouri
and Baseri et al. [4] reported the influence of magnetic field around the work piece and tool to evaluate the
performance of EDM. The result precipitate that machinability of EDM was improved. The material removal
rate was increased by expelled the debris from the machining gap due magnetic force. The study enlighten that a
centrifugal force creating by rotation of tool was also helpful for expel the debris from the gap. They further
found that the increased the machining performance due to combination of rotational magnetic fluid and rotary

Proceedings of the National Conference on
Trends and Advances in Mechanical Engineering
(TAME-2017) March 16-17, 2017 ISBN 978-93-5268-269-0
YMCA University of Science & Technology, Faridabad, Haryana
244
electrode. Baseri and Aliakbari [5] used the taguchi method for designing to find out the optimal value of
process parameter for rotating tool used for EDM process and find out the effect on responses like over cut,
EWR, SR, and MRR. The studied revealed that electrode rotation, pulse on time, discharge current and
geometry of the electrode were the parameter that affects the responses. Furthermore the study suggested as
increase the no of holes in tool were increased the MRR, SR, and EWR. That was because of decrease in area of
electrode so discharge energy density was increased.
From the literature survey, it can be concluded that a limited study was reported dealing with magneto
rheological fluid based EDM. In the present study the MR fluid was used in place of conventional dielectric to
study the machinability of EDM. In particular to study the behaviour of MRR and surface roughness, the
influence of several process parameter like discharge current, pulse on time, duty cycle and percentage
concentration of alumina particles have been looked into.
2. Experimental Detail Die sinking EDM experiments have been carried out on EDM machine (model sparkonix, India). In
all experiment, magneto rheological fluid has been used as dielectric fluid. Total 31 experiments have
been performed using CCRD with independent variables at 5 different levels. Machining time for
each experiment has been kept 60 minutes. After EDM, M2 grade high speed steel workpiece is
cleaned with acetone. A high precision electronic weighing balance with least count 0.01mg has been
used to measure the weight loss of workpiece after each experiment. Each sample was measured three
times and the average was taken as the response. MRR has been defined as the ratio of wear weight of
workpiece to the machining time.
2.1 Selection of tool and workpiece
M2 grade high speed steel workpieces have been spark eroded using copper as tool material. The
workpiece used for this study was high speed steel having dimensions 30*30*10 mm3. The hardness
of the workpiece was 35 HRC. The copper tool of 9 mm diameter was used in this study.
2.1.1 Constituent of MR fluid
The magneto rheological fluids are the viscoelastic fluid that changes their viscosity under the
application of magnetic field. The main constituents of magneto rheological fluid were selected from
conducting the pilot experiments.
(a) Base fluid – Silicon oil 80 to 85 % by volume of 10 cst.
(b) Carbonyl iron powder particles (CIPs) – 6% fixed by volume. The value of CIPs more than 6%
given the adverse effect of machining and spark was interrupted after some time.
(c) Alumina particles (Al2O3) – 4 to 12% by volume of 20 to 25 micron particle size.
(d) Greece – 1 to 2% by volume.
2.2 Process Parameters
There were four process parameters with the five levels to investigate the response variables. Table
1shows the process parameters along with the level of process parameters.
Table of process parameter
Factors Units Levels
-2 -1 0 1 2
Discharge
current A 3 4 5 6 7
Pulse-on time (µs) 100 200 300 400 500
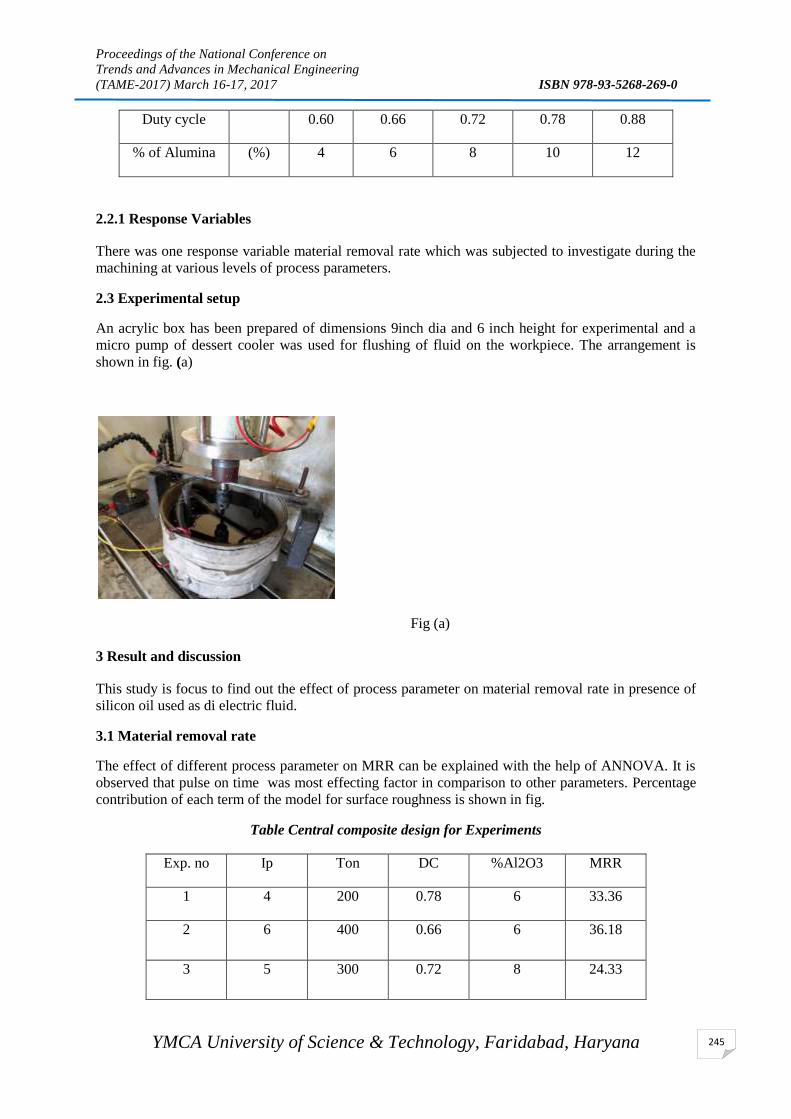
Proceedings of the National Conference on
Trends and Advances in Mechanical Engineering
(TAME-2017) March 16-17, 2017 ISBN 978-93-5268-269-0
YMCA University of Science & Technology, Faridabad, Haryana
245
Duty cycle 0.60 0.66 0.72 0.78 0.88
% of Alumina (%) 4 6 8 10 12
2.2.1 Response Variables
There was one response variable material removal rate which was subjected to investigate during the
machining at various levels of process parameters.
2.3 Experimental setup
An acrylic box has been prepared of dimensions 9inch dia and 6 inch height for experimental and a
micro pump of dessert cooler was used for flushing of fluid on the workpiece. The arrangement is
shown in fig. (a)
Fig (a)
3 Result and discussion
This study is focus to find out the effect of process parameter on material removal rate in presence of
silicon oil used as di electric fluid.
3.1 Material removal rate
The effect of different process parameter on MRR can be explained with the help of ANNOVA. It is
observed that pulse on time was most effecting factor in comparison to other parameters. Percentage
contribution of each term of the model for surface roughness is shown in fig.
Table Central composite design for Experiments
Exp. no Ip Ton DC %Al2O3 MRR
1 4 200 0.78 6 33.36
2 6 400 0.66 6 36.18
3 5 300 0.72 8 24.33
Proceedings of the National Conference on
Trends and Advances in Mechanical Engineering
(TAME-2017) March 16-17, 2017 ISBN 978-93-5268-269-0
YMCA University of Science & Technology, Faridabad, Haryana
246
4 5 100 0.72 8 34.24
5 5 300 0.72 8 24.13
6 7 300 0.72 8 35.02
7 6 200 0.66 6 38.04
8 5 300 0.72 8 25.36
9 3 300 0.72 8 21.24
10 6 200 0.66 10 37.05
11 6 400 0.66 10 35.87
12 5 300 0.72 4 35.21
13 5 300 0.72 8 21.33
14 4 400 0.78 6 22.34
15 6 400 0.78 6 14.21
16 5 300 0.84 8 19.56
17 6 200 0.78 10 32.89
18 6 200 0.78 6 30.29
19 6 400 0.78 10 15.76
20 4 200 0.78 10 34.98
21 4 400 0.66 6 21.34
22 5 500 0.72 8 17.95
23 4 200 0.66 6 25.08
24 5 300 0.72 12 32.45
25 4 200 0.66 10 15.23
26 4 400 0.66 10 16.54

Proceedings of the National Conference on
Trends and Advances in Mechanical Engineering
(TAME-2017) March 16-17, 2017 ISBN 978-93-5268-269-0
YMCA University of Science & Technology, Faridabad, Haryana
247
27 5 300 0.6 8 28.24
28 4 400 0.78 10 15.89
29 5 300 0.72 8 25.34
30 5 300 0.72 8 26.12
31 5 300 0.72 8 28.89
In fig. (b) Shown that, MRR increased with the increase in discharge current. This was due to the
fact that released of high discharge energy in machining zone. So melting and vaporization of material
increased.
The MRR decreased with increase in pulse on time (Ton) this is due to fact that, with an increase in
pulse on time, the high discharge energy released for a long duration so the density of the energy for
particular area was reduced. The plasma channel got enlarged so the material removal rate was
reduced.
It can be seen that an increase in the duty cycle leads to decrease the MRR due to small pulse off
time was available to flushing the debris from the surface that reduce the MRR.
Initially MRR reduced by increasing the % of Al2O3 particles and there after increased with large %
concentration of alumina particles. There was low tangential and normal force applied by low
concentration alumina particles so less material removed but as % increases, the MRR was increased.
4. Conclusions
Experimental study was done for material removal rate with magneto rheological fluid used as di
electric fluid. Based on following study some conclusions were observed
The result demonstrates EDM process still can be performed in magneto rheological fluid.
Material removal rate was increased by using magneto rheological fluid in comparison with other
conventional di electric fluid in same process physics.
It has been seen that the pulse on time was the most effecting factor that affect the MRR by
ANNOVA analysis.
References:
1. Y.Y.Tsai, C.H.Tseng, C.K. Chang, Development of a combined machining method using
electrorheological fluids for EDM, Journal of material processing technology 201(2008) 565-569.

Proceedings of the National Conference on
Trends and Advances in Mechanical Engineering
(TAME-2017) March 16-17, 2017 ISBN 978-93-5268-269-0
YMCA University of Science & Technology, Faridabad, Haryana
248
2. V.K.Jain, P. Ranjan, V. K. Suri, R. Komanduri, Chemo-mechanical magneto-rheological finishing
(CMMRF) of silicon for microelectronics applications in CIRP Annals Manufacturing Technology.
3. Ajay Sidpara, V. K. Jain, Analysis of forces on the freeform surface in magnetorheological fluid based
finishing process in International journal of machine tool & manufacture 69(2013) 1-10
4. Teimouri, R, Baseri, H. Effect of magnetic field and rotary tool on EDM performance. Journal of
Manufacturing Process 2012, 14(3), 393-402.
5. Aliakabari. E. Baseri, H. Optimization of machining parameter in rotary EDM process by using the
Taguchi method. International Journal of Advanced Manufacturing Technology 2012, 62(9), 1041-
1053.
6. G. Boothroyd, W.A. Knight, Fundamentals of Machining and Machine Tools, Taylor & Francis,
Florida, 2006.
7. K.H. Ho, S.T. Newman, State of the art electrical discharge machining (EDM), International Journal of
Machine Tools and Manufacture, 43 (2003) 1287–1300.
8. N.M. Abbas, D.G. Solomon, M.F. Bahari, A review on current research trends in electrical discharge
machining (EDM), International Journal of Machine Tools and Manufacture, 47 (2007) 1214–1228.
9. A.B. Puri, B. Bhattacharyya, An analysis and optimisation of the geometrical inaccuracy due to wire lag
phenomenon in WEDM, International Journal of Machine Tools and Manufacture, 43(2) (2003) 151-
159.
10. K.H. Ho, S.T. Newman, S. Rahimifard, R.D. Allen, State of the art wire electrical discharge
machining (EDM), International Journal of Machine Tools and Manufacture, 44 (2004) 1247–1259.
11. J.R. Crookall, C.J. Heuvelman, Electrodischage machining-the state of the art, Annals of the CIRP,
20(2) (1971) 113-120.
12. R. Snoeys, F. Van Dyck, Investigation of EDM operation by means of Thermomathematical models,
Annals of the CIRP, 21(1) (1971) 35-36.
13. D.D. Dibitonto, P.T. Eubank, M.R. Patel, M.A. Barrufet, Theoretical models of the electrical discharge
machining process.I. A simple cathode erosion model. Journal of the Application Physics 1989, 66
(9), 4095–4103.
14. M.R. Patel, M.A. Barrufet, P.T. Eubank, D.D. Dibitonto, Theoretical models of the electrical discharge
machining process. II. The anode erosion model. Journal of the Application Physics 1989, 66 (9),
4104–4111.
15. S.M. Pandit, K.P. Rajurkar, A stochastic approach to thermal modeling applied to electrodischarge
machining, Journal of Heat Transfer, 105 (1993) 555-561.
16. K.P. Rajurkar, S.M. Pandit, Quantitative Expressions for some aspects of surface integrity of electro
discharge machined components, Journal of Engineering for Industry, 106 (1994) 171-177.
18. S.T. Jilani, P.C. Pandey, Analysis and modeling of EDM parameters, Precision Engineering, 4(4)
(1982) 215-221.

Proceedings of the National Conference on
Trends and Advances in Mechanical Engineering
(TAME-2017) March 16-17, 2017 ISBN 978-93-5268-269-0
YMCA University of Science & Technology, Faridabad, Haryana
249
19. J.A. McGeough, Advanced Methods of Machining, Chapman & Hall, London, 1988.
20. P.K. Mishra, Nonconventional Machining, Narosa Publishing House, London, 1997.
21. A. Singh, A. Ghosh, A thermo-electric model of material removal during electric discharge
machining, International Journal of Machine Tools and Manufacture, 39 (1999) 669-682.
Proceedings of the National Conference on
Trends and Advances in Mechanical Engineering
(TAME-2017) March 16-17, 2017 ISBN 978-93-5268-269-0
YMCA University of Science & Technology, Faridabad, Haryana
250
A LITERATURE REVIEW ON PLASMA ARC CUTTING PROCESS
Sahil Sharma1*
, Mukesh Gupta2, Raj Kumar
3, N.S Bindra
4
1*M.Tech Student, Mechanical Engineerring, YMCA University of Science & Technology, Faridabad-121006
[email protected] 2Assistant professor, Mechanical Engineering, YMCA University of Science & Technology, Faidabad-121006
[email protected] 3Professor, Mechanical Engineering, YMCA University of Science & Technology, Faridabad-121006
[email protected] 4M.D, G.B Industries, Prithla-121102, [email protected]
Abstract This paper deals with a variety of fundamental research on the parameters of plasma arc cutting (PAC) process
which the authors haveperformedrecently. Now-a- days a variety of non-traditional thermal processes are being
used for the cutting operation. Plasma arc cutting process is one of the important and excellent non-
conventional thermal processes which are applicable to perform variousoperations of cutting. Plasma arc
cutting is a machining process where the material is cut by the intense heat of plasma arc. Inthis review, the
research and advancement in plasma arc cutting process parameters of different materials are reviewed
critically. Some important plasma arc cutting process parameters and their effects on heat affected zone,
surface roughness and kerf width are discussed.
Keywords: Plasma arc cutting, heat affected zone, kerf width, surface roughness
1. Introduction Advanced materials (such as stainless steel and alloys like titanium and nickel-base) exhibit very excellent
technical properties[1], but they cannot be satisfactorily cut by the conventional cutting methods. So now-a-
days a variety of non-conventional thermal processes are being used for the cutting of these advanced materials
(having a high strength and high melting point). Plasma arc cutting is one of the important and excellent non-
conventional processes for the most cutting operations. Because of the intense heat of plasma (around 25,000 C)
this process can be used for cutting a variety of materials such as Stainless steel, manganese steel, copper,
titanium alloys, magnesium, aluminum and its alloys[2]. Plasma cut ferrous and non-ferrous metals with narrow
HAZ and at a faster rate than Oxy fuel gas cutting[1]. The initial cost of plasma machine is also less as
compared to other advanced processes such as Laser and Abrasive process. Also very less preparation work is
required for plasma cutting. Plasma Cutting is used, where difficult shapes are being cut or handled, such as
ventilation ductwork (HVAC), vessels or tanks[3], plasma cutting offers considerable advantage since no
clamping device is required.
2. Principle of Plasma Arc Cutting
The basic principle is that the arc formed between the work piece and the electrode and is restricted by a fine
bore, in copper nozzle. This increases the velocity and the temperature of the plasma excreting from the nozzle.
The temperature of the plasma is in the range of 20,000°-30,000 C and the velocity can also approach the
speed of sound[4]. When it is used for cutting, the plasma gas flow is increased so that the extremely penetrating
plasma jet cuts through the material and then the molten material is removed in the efflux plasma.
Oxy-fuel cuts by burning or oxidizing the metal and hence it is therefore limited to only those materials which
support the oxidizing process like steel and other ferrous metals[5]. Metals like stainless steel and aluminum
form an oxide that inhibits further oxidization, making traditional Oxy-fuel cutting infeasible. Whereas Plasma
cutting does not rely on oxidation process to work, and thus it can cut stainless steel, aluminum and any other
conductive material. Laser cutting is a highly meticulous thermal cutting process, utilizing a focused beam of
light whereas Plasma cutting uses a mixture of gases like argon, nitrogen and air etc. in order to form a cut[6].
Plasma cutting can be executed on any type of conductive metal, such as aluminum, mild steel and stainless
steel etc. With mild steel or low carbon steel, operators will experience faster, thicker cuts than with alloys[5].
For parts that have simple shapes, without intricate notching or many cutouts we typically utilize plasma cutting.
When a part needs a precise cut and has tight tolerance specifications (Table 1), and/or calls for a small orifice
diameter in relation to the thickness of the material then, instead of plasma cutting, laser cutting is utilized[6].
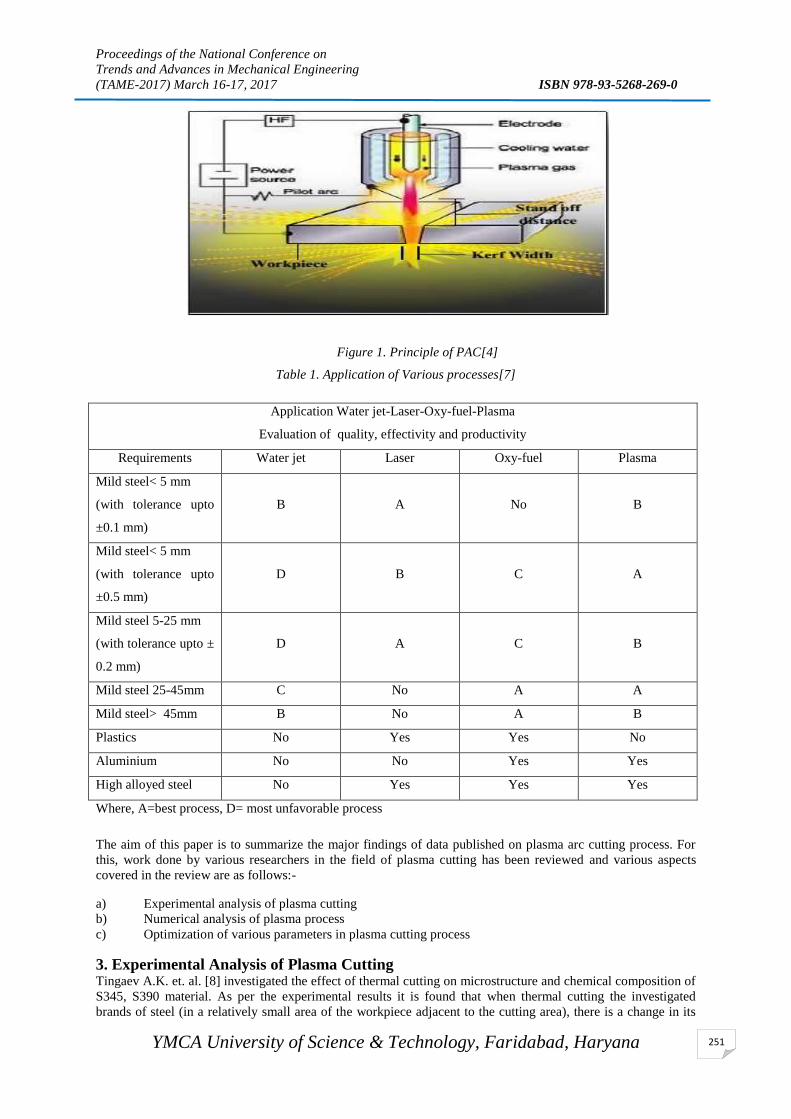
Proceedings of the National Conference on
Trends and Advances in Mechanical Engineering
(TAME-2017) March 16-17, 2017 ISBN 978-93-5268-269-0
YMCA University of Science & Technology, Faridabad, Haryana
251
Table 1. Application of Various processes[7]
Application Water jet-Laser-Oxy-fuel-Plasma
Evaluation of quality, effectivity and productivity
Requirements Water jet Laser Oxy-fuel Plasma
Mild steel< 5 mm
(with tolerance upto
±0.1 mm)
B
A
No
B
Mild steel< 5 mm
(with tolerance upto
±0.5 mm)
D
B
C
A
Mild steel 5-25 mm
(with tolerance upto ±
0.2 mm)
D
A
C
B
Mild steel 25-45mm C No A A
Mild steel> 45mm B No A B
Plastics No Yes Yes No
Aluminium No No Yes Yes
High alloyed steel No Yes Yes Yes
Where, A=best process, D= most unfavorable process
The aim of this paper is to summarize the major findings of data published on plasma arc cutting process. For
this, work done by various researchers in the field of plasma cutting has been reviewed and various aspects
covered in the review are as follows:-
a) Experimental analysis of plasma cutting
b) Numerical analysis of plasma process
c) Optimization of various parameters in plasma cutting process
3. Experimental Analysis of Plasma Cutting
Tingaev A.K. et. al. [8] investigated the effect of thermal cutting on microstructure and chemical composition of
S345, S390 material. As per the experimental results it is found that when thermal cutting the investigated
brands of steel (in a relatively small area of the workpiece adjacent to the cutting area), there is a change in its
Figure 1. Principle of PAC[4]
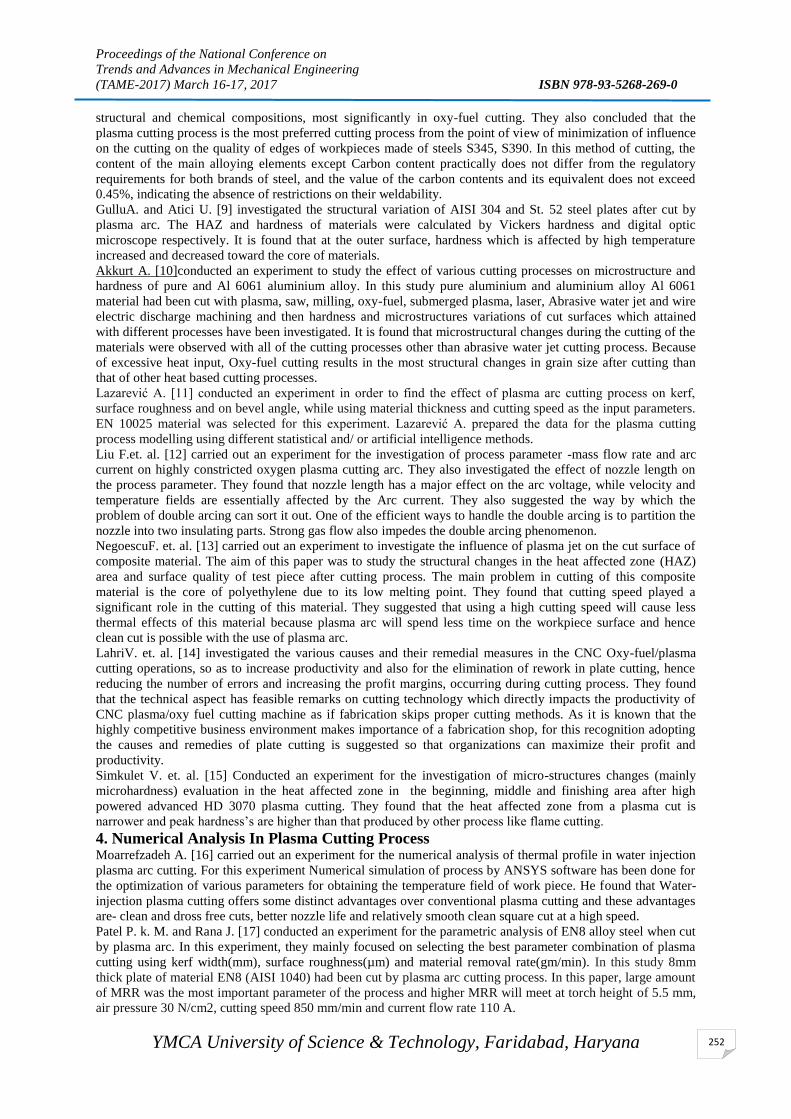
Proceedings of the National Conference on
Trends and Advances in Mechanical Engineering
(TAME-2017) March 16-17, 2017 ISBN 978-93-5268-269-0
YMCA University of Science & Technology, Faridabad, Haryana
252
structural and chemical compositions, most significantly in oxy-fuel cutting. They also concluded that the
plasma cutting process is the most preferred cutting process from the point of view of minimization of influence
on the cutting on the quality of edges of workpieces made of steels S345, S390. In this method of cutting, the
content of the main alloying elements except Carbon content practically does not differ from the regulatory
requirements for both brands of steel, and the value of the carbon contents and its equivalent does not exceed
0.45%, indicating the absence of restrictions on their weldability.
GulluA. and Atici U. [9] investigated the structural variation of AISI 304 and St. 52 steel plates after cut by
plasma arc. The HAZ and hardness of materials were calculated by Vickers hardness and digital optic
microscope respectively. It is found that at the outer surface, hardness which is affected by high temperature
increased and decreased toward the core of materials.
Akkurt A. [10]conducted an experiment to study the effect of various cutting processes on microstructure and
hardness of pure and Al 6061 aluminium alloy. In this study pure aluminium and aluminium alloy Al 6061
material had been cut with plasma, saw, milling, oxy-fuel, submerged plasma, laser, Abrasive water jet and wire
electric discharge machining and then hardness and microstructures variations of cut surfaces which attained
with different processes have been investigated. It is found that microstructural changes during the cutting of the
materials were observed with all of the cutting processes other than abrasive water jet cutting process. Because
of excessive heat input, Oxy-fuel cutting results in the most structural changes in grain size after cutting than
that of other heat based cutting processes.
Lazarević A. [11] conducted an experiment in order to find the effect of plasma arc cutting process on kerf,
surface roughness and on bevel angle, while using material thickness and cutting speed as the input parameters.
EN 10025 material was selected for this experiment. Lazarević A. prepared the data for the plasma cutting
process modelling using different statistical and/ or artificial intelligence methods.
Liu F.et. al. [12] carried out an experiment for the investigation of process parameter -mass flow rate and arc
current on highly constricted oxygen plasma cutting arc. They also investigated the effect of nozzle length on
the process parameter. They found that nozzle length has a major effect on the arc voltage, while velocity and
temperature fields are essentially affected by the Arc current. They also suggested the way by which the
problem of double arcing can sort it out. One of the efficient ways to handle the double arcing is to partition the
nozzle into two insulating parts. Strong gas flow also impedes the double arcing phenomenon.
NegoescuF. et. al. [13] carried out an experiment to investigate the influence of plasma jet on the cut surface of
composite material. The aim of this paper was to study the structural changes in the heat affected zone (HAZ)
area and surface quality of test piece after cutting process. The main problem in cutting of this composite
material is the core of polyethylene due to its low melting point. They found that cutting speed played a
significant role in the cutting of this material. They suggested that using a high cutting speed will cause less
thermal effects of this material because plasma arc will spend less time on the workpiece surface and hence
clean cut is possible with the use of plasma arc.
LahriV. et. al. [14] investigated the various causes and their remedial measures in the CNC Oxy-fuel/plasma
cutting operations, so as to increase productivity and also for the elimination of rework in plate cutting, hence
reducing the number of errors and increasing the profit margins, occurring during cutting process. They found
that the technical aspect has feasible remarks on cutting technology which directly impacts the productivity of
CNC plasma/oxy fuel cutting machine as if fabrication skips proper cutting methods. As it is known that the
highly competitive business environment makes importance of a fabrication shop, for this recognition adopting
the causes and remedies of plate cutting is suggested so that organizations can maximize their profit and
productivity.
Simkulet V. et. al. [15] Conducted an experiment for the investigation of micro-structures changes (mainly
microhardness) evaluation in the heat affected zone in the beginning, middle and finishing area after high
powered advanced HD 3070 plasma cutting. They found that the heat affected zone from a plasma cut is
narrower and peak hardness’s are higher than that produced by other process like flame cutting.
4. Numerical Analysis In Plasma Cutting Process Moarrefzadeh A. [16] carried out an experiment for the numerical analysis of thermal profile in water injection
plasma arc cutting. For this experiment Numerical simulation of process by ANSYS software has been done for
the optimization of various parameters for obtaining the temperature field of work piece. He found that Water-
injection plasma cutting offers some distinct advantages over conventional plasma cutting and these advantages
are- clean and dross free cuts, better nozzle life and relatively smooth clean square cut at a high speed.
Patel P. k. M. and Rana J. [17] conducted an experiment for the parametric analysis of EN8 alloy steel when cut
by plasma arc. In this experiment, they mainly focused on selecting the best parameter combination of plasma
cutting using kerf width(mm), surface roughness(µm) and material removal rate(gm/min). In this study 8mm
thick plate of material EN8 (AISI 1040) had been cut by plasma arc cutting process. In this paper, large amount
of MRR was the most important parameter of the process and higher MRR will meet at torch height of 5.5 mm,
air pressure 30 N/cm2, cutting speed 850 mm/min and current flow rate 110 A.

Proceedings of the National Conference on
Trends and Advances in Mechanical Engineering
(TAME-2017) March 16-17, 2017 ISBN 978-93-5268-269-0
YMCA University of Science & Technology, Faridabad, Haryana
253
Chamarthi S.et. al. [18] conducted the experiment for the Investigation Analysis of Plasma arc cutting
Parameters of Hardox-400 material surface.In this study 12mm thick plate of material Hardox-400 has been cut
by plasma machine. Plasma gas flow rate, cutting speed and high tolerance voltage included as main parameters
in the analysis and the effect of these parameters on the unevenness of the cut surface is examined. The design
of experiments (DoE) techniques is used in order to describe the main parameters which define the cut profile
geometry, as well as its consistency for Hardox-400 material plate. The Results of this screening step are
investigated by the Analysis of Variance (ANOVA) technique. It is found out that the arc voltage is the main
parameter and it influences all the aspects related to the cut quality rather than the effect on the arc power,
beyond the arc voltage the cutting speed showed a recognizable effect.
Maity K. P. and Bagal D. K. [19] carried out an experiment to investigate the effect of process parameter of
plasma arc cutting using hybrid approach on AISI 316 stainless steel material. A new composition of grey
relational analysis and response surface methodology coupled with principal component analysis has been
proposed to estimate and evaluate the effect of machining parameters on the responses. For this experiment
current, voltage, feed rate and torch height selected as input parameters with chamfer, dross, MRR, kerf and
surface roughness as major output parameters. They found that Torch height and interaction of feed rate with
torch height is the most influencing parameter in plasma machining and the best possible combination for
optimization is- feed rate of 970mm/min, 140 V of voltage, 47.5 A of current and stand off distance i.e. 1.5 mm.
5. Optimization in Plasma Arc Process
Thilak. M.et. al. [20] carried out an experiment for the optimization of process parameter using Stainless Steel
316L (SS316 L) material in plasma arc machining. In this experiment various parameters like gas pressure,
current, speed and arc gap were used as input parameters for obtaining the various responses- hardness, kerf
width and machining time. Optimal results have been determined with the help of ANOVA table and main
effect plot and obtained by Grey relational analysis (GRA) method. They found that the parameters like current
and Pressure plays a vital role in machining.
I Y. L.et. al. [21] conducted an experiment to optimize the roundness of holes cut by plasma cutting process
based on taguchi method. They conducted 36 experiments with 81 parameter combinations (four factors with
three each i.e. 3^4) with the use of L9 array. They conducted the experiment for two response variables—one is
the bevel magnitude and the other one is the smallest diameter deviation of the hole. With the help of Taguchi
method they suggested the different combination of parameters for optimization which is verified with a
confirmation run of 30 work pieces.
Teja S. S. et. al. [22] conducted an experiment to study the impact as well as to optimize the machining
parameters on mild steel material cut by plasma machine. Taguchi, GRA and ANOVA method have been
utilized for determining the best combination of cutting speed, voltage, current and plate thickness to evaluate
the kerf width and surface roughness. They found that plate thickness followed by cutting current is the main
parameters which affect the plasma arc cutting process.
Thomas D. J. [23] conducted an experiment for improving the durability of bridge structures cut by plasma
machine. In this paper, the qualities of plasma cut-edges induced on S355 structural steel were investigated to
understand their effect on durability. The cuts were generated using ESAB 20 kV AC Suprarex plasma arc
cutter at a range of commercial traverse cutting speeds that are used to fabricate structural components. They
found that the surface formations and the HAZ microstructure can be effectively controlled by manipulating the
traverse cutting speed. They also confirmed that the changes in the internal and cut edge surface properties were
extremely altered by the plasma gas type.
RahmanM. M. et. al. [24] worked on air plasma cutting machine in order to optimize the heat affected zone on
the material Aluminum alloys (AA6061 -T6). Design of experiment technique was implemented while using
current, gas pressure and stand off distance as the parameters. They found that output current isthe most
significant variable compare with stand-off distance andpressure.
6. Summary of Research Work
Key finding done by different researchers are summarized below:-
Table 2. Key Findings by various researchers
DIFFERENT ASPECTS
AUTHOR
KEY FINDINGS
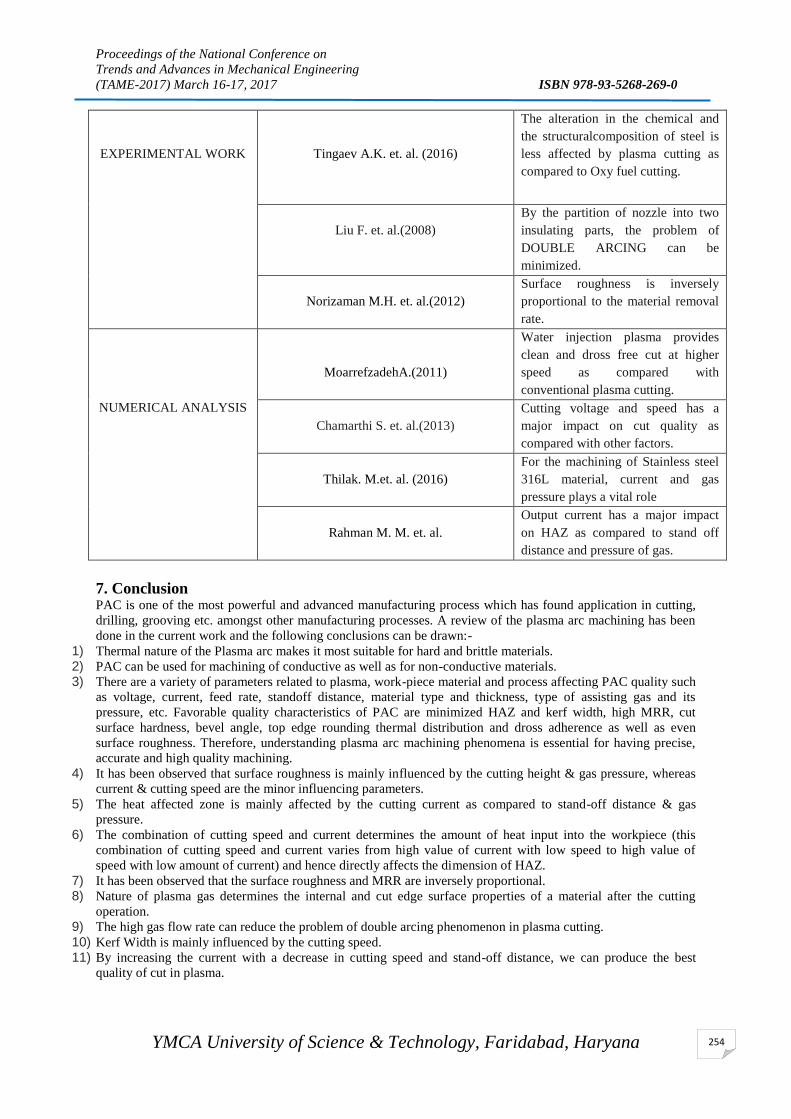
Proceedings of the National Conference on
Trends and Advances in Mechanical Engineering
(TAME-2017) March 16-17, 2017 ISBN 978-93-5268-269-0
YMCA University of Science & Technology, Faridabad, Haryana
254
EXPERIMENTAL WORK
Tingaev A.K. et. al. (2016)
The alteration in the chemical and
the structuralcomposition of steel is
less affected by plasma cutting as
compared to Oxy fuel cutting.
Liu F. et. al.(2008)
By the partition of nozzle into two
insulating parts, the problem of
DOUBLE ARCING can be
minimized.
Norizaman M.H. et. al.(2012)
Surface roughness is inversely
proportional to the material removal
rate.
NUMERICAL ANALYSIS
MoarrefzadehA.(2011)
Water injection plasma provides
clean and dross free cut at higher
speed as compared with
conventional plasma cutting.
Chamarthi S. et. al.(2013)
Cutting voltage and speed has a
major impact on cut quality as
compared with other factors.
Thilak. M.et. al. (2016)
For the machining of Stainless steel
316L material, current and gas
pressure plays a vital role
Rahman M. M. et. al.
Output current has a major impact
on HAZ as compared to stand off
distance and pressure of gas.
7. Conclusion PAC is one of the most powerful and advanced manufacturing process which has found application in cutting,
drilling, grooving etc. amongst other manufacturing processes. A review of the plasma arc machining has been
done in the current work and the following conclusions can be drawn:-
1) Thermal nature of the Plasma arc makes it most suitable for hard and brittle materials.
2) PAC can be used for machining of conductive as well as for non-conductive materials.
3) There are a variety of parameters related to plasma, work-piece material and process affecting PAC quality such
as voltage, current, feed rate, standoff distance, material type and thickness, type of assisting gas and its
pressure, etc. Favorable quality characteristics of PAC are minimized HAZ and kerf width, high MRR, cut
surface hardness, bevel angle, top edge rounding thermal distribution and dross adherence as well as even
surface roughness. Therefore, understanding plasma arc machining phenomena is essential for having precise,
accurate and high quality machining.
4) It has been observed that surface roughness is mainly influenced by the cutting height & gas pressure, whereas
current & cutting speed are the minor influencing parameters.
5) The heat affected zone is mainly affected by the cutting current as compared to stand-off distance & gas
pressure.
6) The combination of cutting speed and current determines the amount of heat input into the workpiece (this
combination of cutting speed and current varies from high value of current with low speed to high value of
speed with low amount of current) and hence directly affects the dimension of HAZ.
7) It has been observed that the surface roughness and MRR are inversely proportional.
8) Nature of plasma gas determines the internal and cut edge surface properties of a material after the cutting
operation.
9) The high gas flow rate can reduce the problem of double arcing phenomenon in plasma cutting.
10) Kerf Width is mainly influenced by the cutting speed.
11) By increasing the current with a decrease in cutting speed and stand-off distance, we can produce the best
quality of cut in plasma.

Proceedings of the National Conference on
Trends and Advances in Mechanical Engineering
(TAME-2017) March 16-17, 2017 ISBN 978-93-5268-269-0
YMCA University of Science & Technology, Faridabad, Haryana
255
Refrences Bidajwala R. C., Trivedi M. A., Rao T. S., Gajera H. M., 2015,Parametric optimization on Plasma arc cutting
machinefor AISI 1018, International Journal of Advance Engineering and ResearchDevelopment, 2348-4470.
PrajapatiK. N., Sathavara H.R., Soni D.K., 2015, A review on plasma arc cutting,International Journal of
Advance Research in Engineering, Science & Technology (IJAREST),Volume 2, Issue 6.
https://www.hypertherm.com/en-US/learn/cutting-education/plasma-technology, 02/09/2016.
http://www.twi-global.com/technical-knowledge/job-knowledge/cutting-processes-plasma-arc-cutting-process-
and-equipment-considerations-051/, 15/07/2016
http://www.lincolnelectric.com/en-us/equipment/plasma-cutters/process-and-theory/Pages/plasma-cutting-
basics-detail.aspx, 02/09/2016.
http://www.gemathis.com/laser-cutting-vs-plasma-cutting, 15/07/2016
Hatala M.: The Principle of Plasma cutting technology and six fold plasma cutting. 5th International
Multidisciplinary Conference.
Tingaev A.K., Gubaydulin R.G., Ilin I.A.,2016, Study of the Effect of Thermal Cutting on the Microstructure
and Chemical Composition of the Edges of Workpieces Made of Steel Brands S345, S390, International
Conference on Industrial Engineering, 1783 – 1790.
Gullu A., Atici U., 2006, Investigation of the effects of plasma arc parameters on the structure variation of AISI
304 and St 52 steels.Materials and Design, volume 27, pp. 1157–1162.
Akkurt A., 2015, The effect of cutting processes on surface microstructure and hardness of pure and Al 6061
aluminium alloy, International journal of engineering science and technology, 303-308.
Lazarević A., 2014, Experimental Research of the Plasma ArcCutting Process.
Liu F., Zhou Q., Li H., Guo S., Guo W., XuP., 2008, Effects of Nozzle Length and Process Parameters on
Highly Constricted Oxygen Plasma Cutting Arc. Plasma Chem. Plasma Process, 729-747.
Ismail M. I. S., Taha Z., 2014,Surface Hardening of Tool Steel by Plasma Arc with MultiplePasses,
International Journal of Technology, 79-87, ISSN 2086‐9614.
Negoescu F., Iosub A., Nugget Gh., 2008, Plasma Cutting of Composite Materials, International journal of
Material Form, 1347-1350.
Norizaman M.H., Bhuvenesh R., Manan M.S. A., 2012, Surface Roughness and MRR Effect on Manual Plasma
Arc Cutting Machining, International Journal of Mechanical, Aerospace, Industrial, Mechatronic and
Manufacturing Engineering, Volume 6, No:2.
Simkulet V., Hatala M., Orlovsky I., Zajac J., Monka P., Michalik P., 2011,Microhardness Evaluation of Steel
EN S233J2G3 in Heat affectedzone after Plasma arc cutting, Annals of DAAAM for 2011 & Proceedings of the
22nd
International DAAAM Symposium, Volume 22, No. 1, ISSN: 1726-9679.
Patel P. k. M., RanaJ., 2015,Parametric Analysis of EN8 (AISI 1040) Alloy steel onPlasma Arc Cutting,
International Journal of Science and Engineering Applications, Volume3, Issue 3,ISSN-2319-7560.
ChamarthiS., Reddy N. S., Elipey M. K., Reddy D.V. R., 2013, Investigation Analysis of Plasma arc cutting
Parameters on the Unevenness surface of Hardox-400 material, International Conference on design and
manufacturing, 854 – 861.
Maity K. P., Bagal D. K.., 2014, Effect of process parameters on cut quality of stainless steel of plasma arc
cutting using hybrid approach, International Journal of Advance Manufacturing Technology, 161-175.
Patel S., Patel C., Patel H., Patel B.: Analysis and Parametric Optimization of Plasma Arc Cutting (PAC) with
Mathematical Modelling.
Thilak. M, Cyril G., Boopalan N., Gogul. N, Ganesh B. A.R., 2016, Optimization of Machining
ProcessParameters in Plasma Arc Machining, International Journal of Innovative Research in
Science,Engineering and Technology, Volume 5, Special Issue 8, ISSN(Online) : 2319-875.
Teja S. S., Karthik G., Sampath S., Shaj M., 2015, Experimental Investigations to Study the Impact of
MachiningParameters on Mild Steel Using Plasma Arc Cutting, International Journal of Engineering Research
and Applications, Volume 5, Issue, ISSN: 2248-9622.
Thomas D. J., 2011, Optimizing Plasma Cut-edge Properties for Improving the Durability of Bridge Structures,
International Journal of Steel Structures, Volume 11, No 4,481-493.
Rahman M. M., Kadirgama K., Ghazali Z., 2013, Optimization of Heat Affected Zone for Air PlasmaCutting
Process: A Support Vector Machine Approach, International Journal of Artificial Intelligence and
Mechatronics,Volume 2, Issue 1, ISSN 2320 – 51

Proceedings of the National Conference on
Trends and Advances in Mechanical Engineering
(TAME-2017) March 16-17, 2017 ISBN 978-93-5268-269-0
YMCA University of Science & Technology, Faridabad, Haryana
256
RECENT TRENDS AND ADVANCES IN GEAR MANUFACTURING
TECHNOLOGY
Pawan Kumar Taneja1, Prof. M.L.Aggarwal
2
1Assistant Prof., Department of Mechanical Engineering, Amity University Haryana,
Email:[email protected] 2Professor, Department of Mechanical Engineering, YMCA University of Science and Technology, Faridabad-
121006
Abstract
A lot of innovations have been introduced during last three decades in gear manufacturing industry. It has
always been the vision and never ending theme for designers and manufacturers to deliver quality and accuracy
in gears with precision cutting tools, recent advancement in process technology required for high volumes of
production with low cost. The high customer demands and tough competition requires rigorous, thorough
testing equipments and proven methods. Automation greatly reduces the errors and makes the process fast and
efficient. This paper reports the recent trends and advances in gear production in manufacturing industry with
different process technologies adopted with advances in machine tool, design and material.
Keywords: Gear manufacturing, Accuracy, Precision, Automation.
1. Introduction
A gear is a part of rotating machine which performs the function of transmitting torque by meshing of one
toothed part with another toothed part. The speed, torque, and direction of a power source can be changed by
geared devices. Gears can be considered as a simple machine because through gear ratio they produce a change
in torque. The shape of the teeth on two meshing gears is same. Instead of rotation, translation is produced when
meshing occurs between a gear and rack. The wheels in a belt pulley system are similar to that of gears in a
transmission. A big mechanical advantage (98-99% efficiency) of gears is that a tooth of the gear avoids
slippage. A mechanical advantage is produced when a bigger gear meshes with the smaller gear and gear
rotational speeds and torques vary in proportion to their diameters. In case of bicycles, motorcycles and cars
gear is designed in terms of gear pair with gear ratio rather than an actual physical gear.
Moriwaki et al. [1] suggested that in order to simulate a gear shaving process, a computer program has been
developed.In this investigation a new cutting model of a shaving process has been described in order to examine
the effect of a cutting performance of a shaving cutter on the simulation program. The construction of cutting
model is done on the supposition that an excess depth of cut over a certain range results in material removal
from tooth flank of work gear. The criterion does not have any definite value and it follows the normal
distribution. The characteristic of cutting performance of the shaving cutter is used to define the mean value of
the distribution.Depth of cut varies directly with the material removal. As the performance of cutter decreases,
an error occurs in the pressure angle of shaved tooth profile.
Bouzakis et al. [2] suggested that efficient method of gear manufacturing is gear hobbing. In order to solve the
problem of non-uniform tool wear on any particular hob tooth generated during cutting process the hob is
shifted tangentially after a suitable number of cuts. Uniform tool wear and increment in the amount of hobbed
gears per tool regrinding will be obtained by ideal selection of shift displacement and number of gears after
which the hob has to be shifted. In the present study, an experimentally verified computational methodology is
used to enable the examination of optimum values for shift displacement and for corresponding shift amount, by
taking into consideration the wear behaviour of the hob teeth in the individual generating positions.
Proceedings of the National Conference on
Trends and Advances in Mechanical Engineering
(TAME-2017) March 16-17, 2017 ISBN 978-93-5268-269-0
YMCA University of Science & Technology, Faridabad, Haryana
257
Kruszyński et al. [3] explained the outcomes of experiments carried out on the generating gear grinding process,
using Niles method. From the detailed study of tooth profile generation, it was concluded that grinding
conditions vary during the cycle of gear tooth formation because of the complex kinematics. Grinding forces are
mostly affected by workspeed and dimensions of the layer being detached in a generating stroke. For the
calculation of the normal and tangential grinding forces in a generating stroke of grinding wheel, appropriate
equations were proposed. The study reveals that maximum grinding forces are function of process parameters.
Kim et al. [4]explained that the main objective of the study was to focus on various sensing techniques used for
the evaluation of machining processes.In this investigation, the advancement of online tool life observing
system for gear shaping that uses acoustic emission (AE) was carried out. Cutting condition, material and
geometry of the tool are the various factors on which the characteristics of the AE signals depends.Experimental
investigation of the relationship between AE signal and tool wear was carried out.Investigations related to gear
shaping of SCM 420 material with a pinion cutter having 44 teeth were carried out.For monitoring the tool life
the most effective factor is the maximum value of RMS AE voltage. In order to understand the in-process
monitoring system for gear shaping, bothacquisition method of AE signals for rotating objects and signal-
processing technique were developed.
Tobias et al. [5] suggested that gear shaving process is a process widely used for soft finishing of gears because
of its high economical efficiency. Quality of workpiece helps in determining the wear of the gear shaving tools.
The tool is considered to be totally damaged as the tolerance limits of the gear quality are surpassed. The tool
wear of the gear shaving process will be different with respect to conventional machining processes having
geometrically defined cutting edges. In order to increase the efficiency and process reliability of gear shaving, it
is necessary to keep in mind the phenomena of tool wear. In this study, the uniqueness of the gear shaving
process is explained by using a numerical process simulation and describes the effect of tool wear on the quality
of shaved gears.
Rech[6] explained that tool performance of hobs is improved by using coating technology. The characteristics of
bifunctional coatings is far better than simple coating. Several defect arises in dry and high speed cutting due to
the use of bilayer coatings. For the investigation of the nature of bifunctional coatings, physical vapour
deposition (PVD) methods will be used for the coating of hobs. The outcomes of various tool life tests on the
mechanism of tool wear for different coating of hobs are discussed.
Hengleiet al. [7] revealed that in order to investigate the model of cutting power in gear milling based on
tentative measurements in a physical prototype and neural network toolbox of MATLAB, the theory and
arithmetic of BP neural network were applied. In order to train and test network model of cutting power in gear
milling, the training sample acquired by cutting experimentation was used. From the results, it was concluded
that BP neural network can estimate cutting power in gear milling well,resolve the problem of errors of
traditional empirical formula which are large in magnitude and provide a basis for transmission design of the
machine tools for gear milling.
Fratila [8] explained that a large amount of cutting fluids is one of the important source of environment
pollution related to machine building industry. In order to prevent the problems caused by use of cutting fluids,
improvements have been made in the field of near-dry machining (NDM). There is a surety of process safety
and product quality by converting conventional processes to minimal quantity lubrication (MQL) methods. This
investigation provides appropriate requirements for successful MQL application and it is focused on estimation
of NDM effects on gear milling process efficiency.
Huang, Chin-Lung et al. [9] suggested that the most appropriate method of generating the tooth profile of a gear
shaping cutter is the Isoformlengthwise-reciprocating grinding process. The Isoformground helical shaping
cutter with a small tooth number instead of enhancing the accuracy of the profile of the grinding shaper, it
produces errors in pressure angle, curvature and profile. Therefore, a mathematical model is suggested to avoid
such errors and then the model is validated numerically using the tooth profile of a cutter enveloping gear.
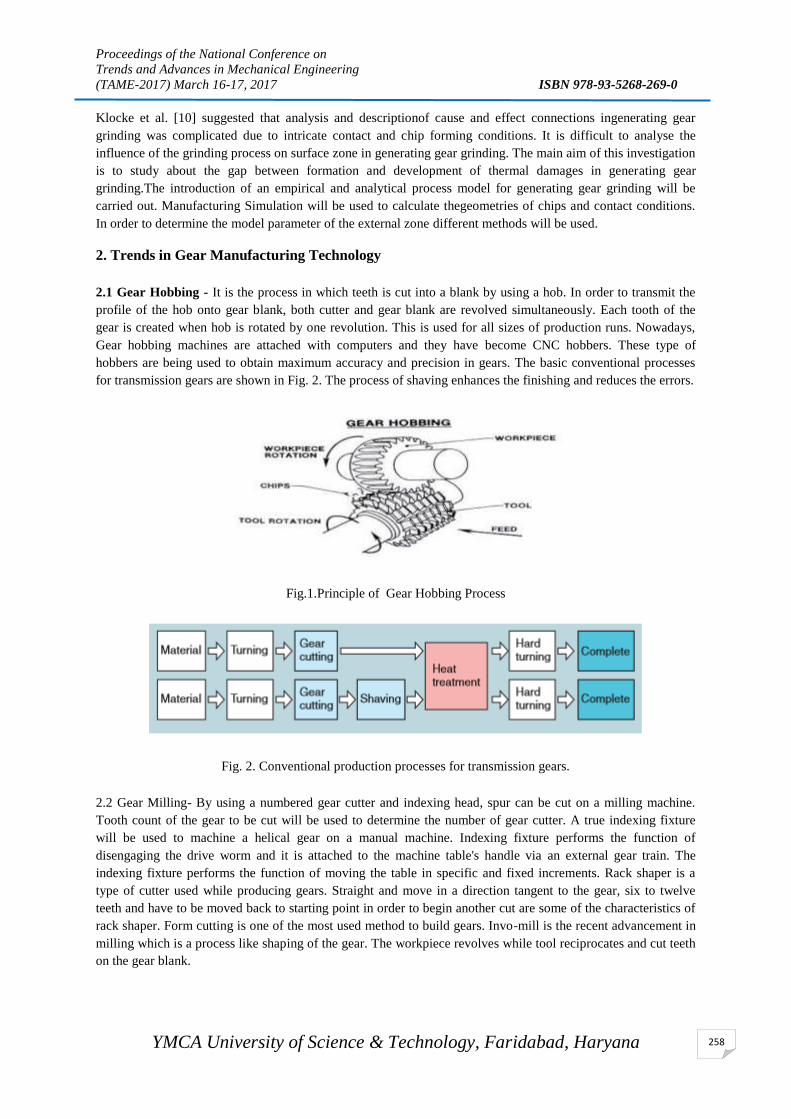
Proceedings of the National Conference on
Trends and Advances in Mechanical Engineering
(TAME-2017) March 16-17, 2017 ISBN 978-93-5268-269-0
YMCA University of Science & Technology, Faridabad, Haryana
258
Klocke et al. [10] suggested that analysis and descriptionof cause and effect connections ingenerating gear
grinding was complicated due to intricate contact and chip forming conditions. It is difficult to analyse the
influence of the grinding process on surface zone in generating gear grinding. The main aim of this investigation
is to study about the gap between formation and development of thermal damages in generating gear
grinding.The introduction of an empirical and analytical process model for generating gear grinding will be
carried out. Manufacturing Simulation will be used to calculate thegeometries of chips and contact conditions.
In order to determine the model parameter of the external zone different methods will be used.
2. Trends in Gear Manufacturing Technology
2.1 Gear Hobbing - It is the process in which teeth is cut into a blank by using a hob. In order to transmit the
profile of the hob onto gear blank, both cutter and gear blank are revolved simultaneously. Each tooth of the
gear is created when hob is rotated by one revolution. This is used for all sizes of production runs. Nowadays,
Gear hobbing machines are attached with computers and they have become CNC hobbers. These type of
hobbers are being used to obtain maximum accuracy and precision in gears. The basic conventional processes
for transmission gears are shown in Fig. 2. The process of shaving enhances the finishing and reduces the errors.
Fig.1.Principle of Gear Hobbing Process
Fig. 2. Conventional production processes for transmission gears.
2.2 Gear Milling- By using a numbered gear cutter and indexing head, spur can be cut on a milling machine.
Tooth count of the gear to be cut will be used to determine the number of gear cutter. A true indexing fixture
will be used to machine a helical gear on a manual machine. Indexing fixture performs the function of
disengaging the drive worm and it is attached to the machine table's handle via an external gear train. The
indexing fixture performs the function of moving the table in specific and fixed increments. Rack shaper is a
type of cutter used while producing gears. Straight and move in a direction tangent to the gear, six to twelve
teeth and have to be moved back to starting point in order to begin another cut are some of the characteristics of
rack shaper. Form cutting is one of the most used method to build gears. Invo-mill is the recent advancement in
milling which is a process like shaping of the gear. The workpiece revolves while tool reciprocates and cut teeth
on the gear blank.
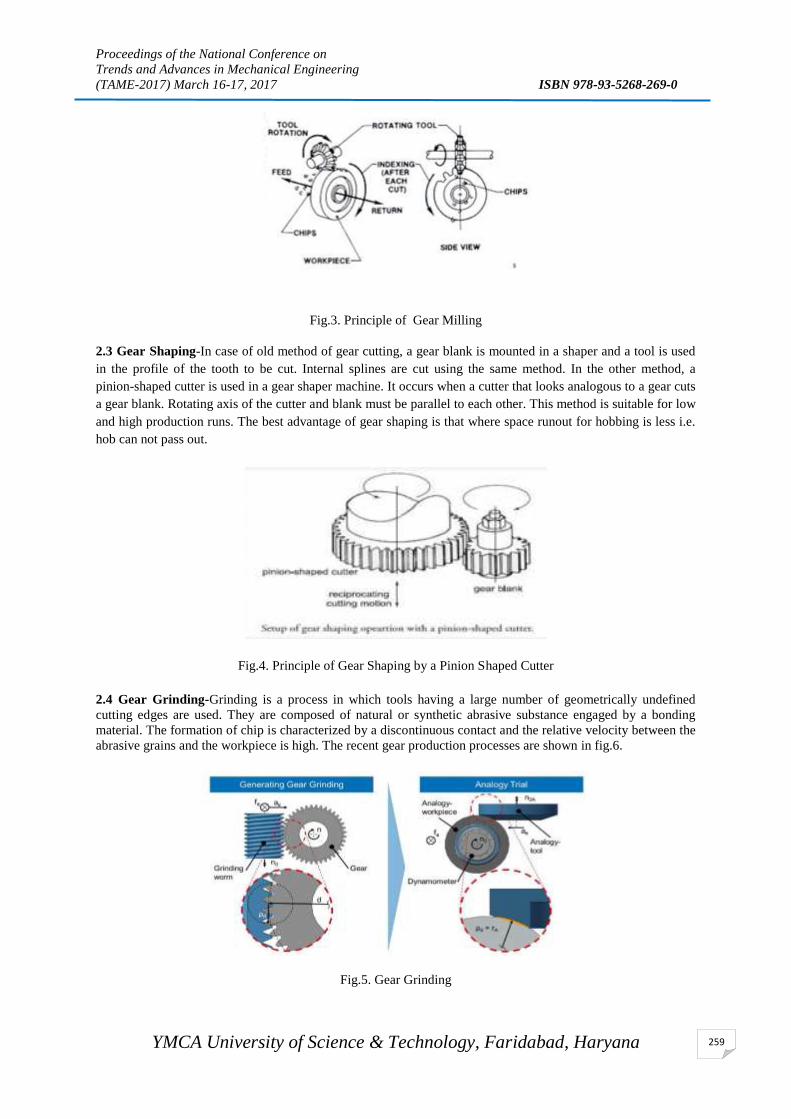
Proceedings of the National Conference on
Trends and Advances in Mechanical Engineering
(TAME-2017) March 16-17, 2017 ISBN 978-93-5268-269-0
YMCA University of Science & Technology, Faridabad, Haryana
259
Fig.3. Principle of Gear Milling
2.3 Gear Shaping-In case of old method of gear cutting, a gear blank is mounted in a shaper and a tool is used
in the profile of the tooth to be cut. Internal splines are cut using the same method. In the other method, a
pinion-shaped cutter is used in a gear shaper machine. It occurs when a cutter that looks analogous to a gear cuts
a gear blank. Rotating axis of the cutter and blank must be parallel to each other. This method is suitable for low
and high production runs. The best advantage of gear shaping is that where space runout for hobbing is less i.e.
hob can not pass out.
Fig.4. Principle of Gear Shaping by a Pinion Shaped Cutter
2.4 Gear Grinding-Grinding is a process in which tools having a large number of geometrically undefined
cutting edges are used. They are composed of natural or synthetic abrasive substance engaged by a bonding
material. The formation of chip is characterized by a discontinuous contact and the relative velocity between the
abrasive grains and the workpiece is high. The recent gear production processes are shown in fig.6.
Fig.5. Gear Grinding

Proceedings of the National Conference on
Trends and Advances in Mechanical Engineering
(TAME-2017) March 16-17, 2017 ISBN 978-93-5268-269-0
YMCA University of Science & Technology, Faridabad, Haryana
260
Fig.6. Recent production processes for transmission gears
2.5 Gear Shaving-It is a process of producing enhanced toothshape in gears of involutedesign. In this
process theinitialstandardcontour of thepiniongeneratingtool is movedradially in such a
mannerthatthepitchline of thetooldoesnotcome in contact withthepitchcircle of thegear. In this case
basically normalpinioncuttingtools or a gearcutterwill be used. Using the generatingmethod, processing is
done on a gear cutter in whichthegearcuttingtakesplacewiththeappropriatedisplacement of
theinitialcontour.
Fig.7.Principle of Gear Shaving (a) shaving cutter angle (b) shaving process
3. LATEST ADVANCES IN GEAR MANUFACTURING TECHNOLOGY
3.1 GENERATING GEAR GRINDING AND POLISHING
The base technology for polish grinding process is continuous generating method. Continuous generating
grinding is a suitable process for the hard finishing of gears. On the basis of dressable grinding worm, this
process has proved itself both in terms of flexibility and high productivity. Polish grinding comprises of a polish
grinding pass with the resin-bonded section assimilated into the end section of the vitrified-bonded threaded
grinding wheel, which accomplishes the grinding operation. In this process the roughness peaks are removed
and the roughness profile height is reduced. Therefore, the contact bearing area of the gear flanks is increased
but the geometrical accuracy of the gear flanks is unaffected. Conventional grinding consists of a roughing and a
finishing grinding pass and just after conventional grinding polish grinding is performed. For the above purpose,
the threaded wheel is classified into two zones i.e. grinding and polishing zone. The grit sizes should be finer in
case of polish grinding. The objective of grinding is to provide perfect geometry, good surface finish, and fast
material removal rates. For engineering purposes, polish grinding should only eliminate the surface roughness
peaks which will lead to increment in the contact area of the gear flanks. Increase in the contact area of gear
flanks will increase the power density of transmissions. In case of gear grinding, workpieces enter and come out
of the machine properly oriented and stackable, whereas in vibratory superfinishing, the workpieces are in
random orientation. On the other hand, continuous generating process consists of one machine tool and grinds
and polish grinds the element in one clamping operation, due to which it becomes economically feasible for
high-volume production.The main objective of polish grinding is to reduce the surface roughness without
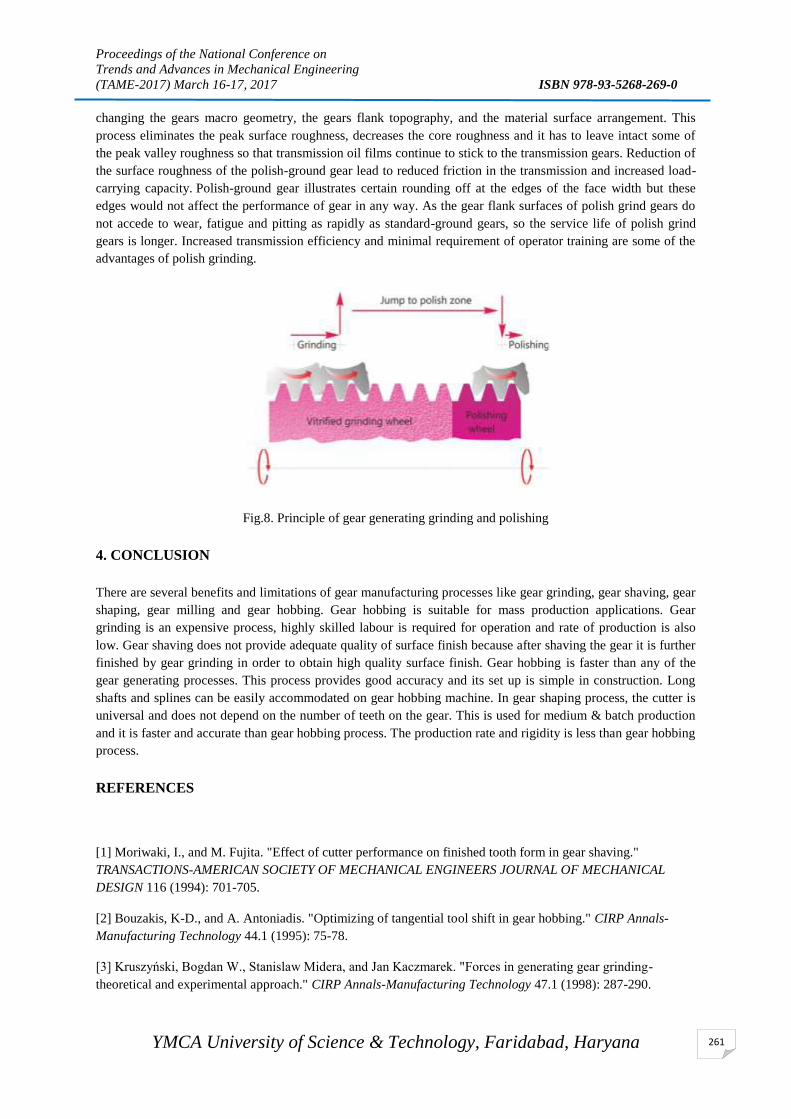
Proceedings of the National Conference on
Trends and Advances in Mechanical Engineering
(TAME-2017) March 16-17, 2017 ISBN 978-93-5268-269-0
YMCA University of Science & Technology, Faridabad, Haryana
261
changing the gears macro geometry, the gears flank topography, and the material surface arrangement. This
process eliminates the peak surface roughness, decreases the core roughness and it has to leave intact some of
the peak valley roughness so that transmission oil films continue to stick to the transmission gears. Reduction of
the surface roughness of the polish-ground gear lead to reduced friction in the transmission and increased load-
carrying capacity. Polish-ground gear illustrates certain rounding off at the edges of the face width but these
edges would not affect the performance of gear in any way. As the gear flank surfaces of polish grind gears do
not accede to wear, fatigue and pitting as rapidly as standard-ground gears, so the service life of polish grind
gears is longer. Increased transmission efficiency and minimal requirement of operator training are some of the
advantages of polish grinding.
Fig.8. Principle of gear generating grinding and polishing
4. CONCLUSION
There are several benefits and limitations of gear manufacturing processes like gear grinding, gear shaving, gear
shaping, gear milling and gear hobbing. Gear hobbing is suitable for mass production applications. Gear
grinding is an expensive process, highly skilled labour is required for operation and rate of production is also
low. Gear shaving does not provide adequate quality of surface finish because after shaving the gear it is further
finished by gear grinding in order to obtain high quality surface finish. Gear hobbing is faster than any of the
gear generating processes. This process provides good accuracy and its set up is simple in construction. Long
shafts and splines can be easily accommodated on gear hobbing machine. In gear shaping process, the cutter is
universal and does not depend on the number of teeth on the gear. This is used for medium & batch production
and it is faster and accurate than gear hobbing process. The production rate and rigidity is less than gear hobbing
process.
REFERENCES
[1] Moriwaki, I., and M. Fujita. "Effect of cutter performance on finished tooth form in gear shaving."
TRANSACTIONS-AMERICAN SOCIETY OF MECHANICAL ENGINEERS JOURNAL OF MECHANICAL
DESIGN 116 (1994): 701-705.
[2] Bouzakis, K-D., and A. Antoniadis. "Optimizing of tangential tool shift in gear hobbing." CIRP Annals-
Manufacturing Technology 44.1 (1995): 75-78.
[3] Kruszyński, Bogdan W., Stanislaw Midera, and Jan Kaczmarek. "Forces in generating gear grinding-
theoretical and experimental approach." CIRP Annals-Manufacturing Technology 47.1 (1998): 287-290.

Proceedings of the National Conference on
Trends and Advances in Mechanical Engineering
(TAME-2017) March 16-17, 2017 ISBN 978-93-5268-269-0
YMCA University of Science & Technology, Faridabad, Haryana
262
[4] Kim, Jeong-Suk, et al. "Development of an on-line tool-life monitoring system using acoustic emission
signals in gear shaping." International Journal of Machine Tools and Manufacture 39.11 (1999): 1761-1777.
[5] Klocke, Fritz, and Tobias Schroder. "Gear shaving: Simulation and technological studies." ASME 2003
International Design Engineering Technical Conferences and Computers and Information in Engineering
Conference. American Society of Mechanical Engineers, 2003.
[6] Rech, Joël. "Influence of cutting edge preparation on the wear resistance in high speed dry gear hobbing."
Wear 261.5 (2006): 505-512.
[7] Henglei, Yu Chunjian Huang Xiaodiao Wang. "Investigation on Calculation Method of Cutting Power in
Gear Milling Based on BP Neural Network [J]." Tool Engineering 4 (2008): 023.
[8] Fratila, Domnita. "Evaluation of near-dry machining effects on gear milling process efficiency." Journal of
Cleaner Production 17.9 (2009): 839-845.
[9] Huang, Chin-Lung, et al. "Profile correction of a helical gear shaping cutter using the lengthwise-
reciprocating grinding method." Mechanism and Machine Theory 44.2 (2009): 401-411.
[10] Klocke, Fritz, Markus Brumm, and Jan Reimann. "Modeling of surface zone influences in generating gear
grinding." Procedia CIRP 8 (2013): 21-26.
Proceedings of the National Conference on
Trends and Advances in Mechanical Engineering
(TAME-2017) March 16-17, 2017 ISBN 978-93-5268-269-0
YMCA University of Science & Technology, Faridabad, Haryana
263
SOLAR OPERATED SAND MOLDING COMPACTION PROCESS
Sarika Gupta1
and M.L.Agarwal 2
1 M.Tech. Student, 2 Professor
Mechanical Department, YMCA University of Science & Technology, Faridabad, Haryana- 121006
Email:[email protected], [email protected]
Abstract
Sand casting, also known as sand molded casting, is a metal casting process characterized by using sand as
the mold material. The term "sand casting" can also refer to an object produced via the sand casting
process.Over 70% of all metal castings are produced via sand casting process. Sand casting is relatively cheap
and sufficiently refractory even for steel foundry useThe basic steps involved in making sand castings are
patternmaking, molding, melting and pouring, cleaning, inspection and testing.The basic steps involved in
making sand castings are patternmaking, molding, melting and pouring, cleaning, inspection and testing.
Molding is a process in which mold boxes are prepared to perform casting. In molding process after putting the
sand over the pattern in the mold box, ramming is performed. This ramming operation is performed through
either from manual ramming or with the help of conventional molding machine The aim of ramming is used to
increase the strength of mold box to create sound casting. To make the ramming process more energy efficient
solar operated sand compaction process is proposed in this paper.
Keywords: Sand casting, foundry, Moulding process, solar operation
1. Introduction
Energy is one of the issues that is causing the most concern as fossil fuels are the greatest pollutants and
contributors to the greenhouse effect. The increasing importance of environmental concern, fuel saving and
unavailability of power has led to interest in renewable energies. It therefore, stands to reason that developing
countries whose energy consumption rate is increasing at a very fast rate should be investigating new energy
systems based on renewable energies that do not pollute and which are inexhaustible such as the solar energy. In
past years, increasing efforts are being spent towards the application of solar energy to electric and hybrid cars,
also there are significant advances in photovoltaic technology and to their growing diffusion for stationary
plants So there is requirement to develop a solar energy operated sand compaction process to such an extent that
there is no compromise with its work performance. In this report a simple, reliable and effective solar panel
charging system has been introduced consisting of solar panel, a storage battery and a DC motor. This solar
energy is used to power sand compaction process. The basic steps involved in making sand castings are
patternmaking, molding, melting and pouring, cleaning, inspection and testing.
The basic steps involved in making sand castings are patternmaking, molding, melting and pouring, cleaning,
inspection and testing. Molding is a process in which mold boxes are prepared to perform casting. In molding
process after putting the sand over the pattern in the mold box, ramming is performed. This ramming operation
is performed through either from manual ramming or with the help of conventional molding machine The aim of
ramming is used to increase the strength of mold box to create sound casting. To make the ramming process
more energy efficient solar operated sand compaction process is proposed. In the present work, the focus is on
the interfacing various components with solar charged battery for achieving higher energy efficiency.
Compactor is operated with the help of motor which is powered by solar battery.To make the ramming process
more energy efficient solar operated sand compaction process is proposed in this paper.
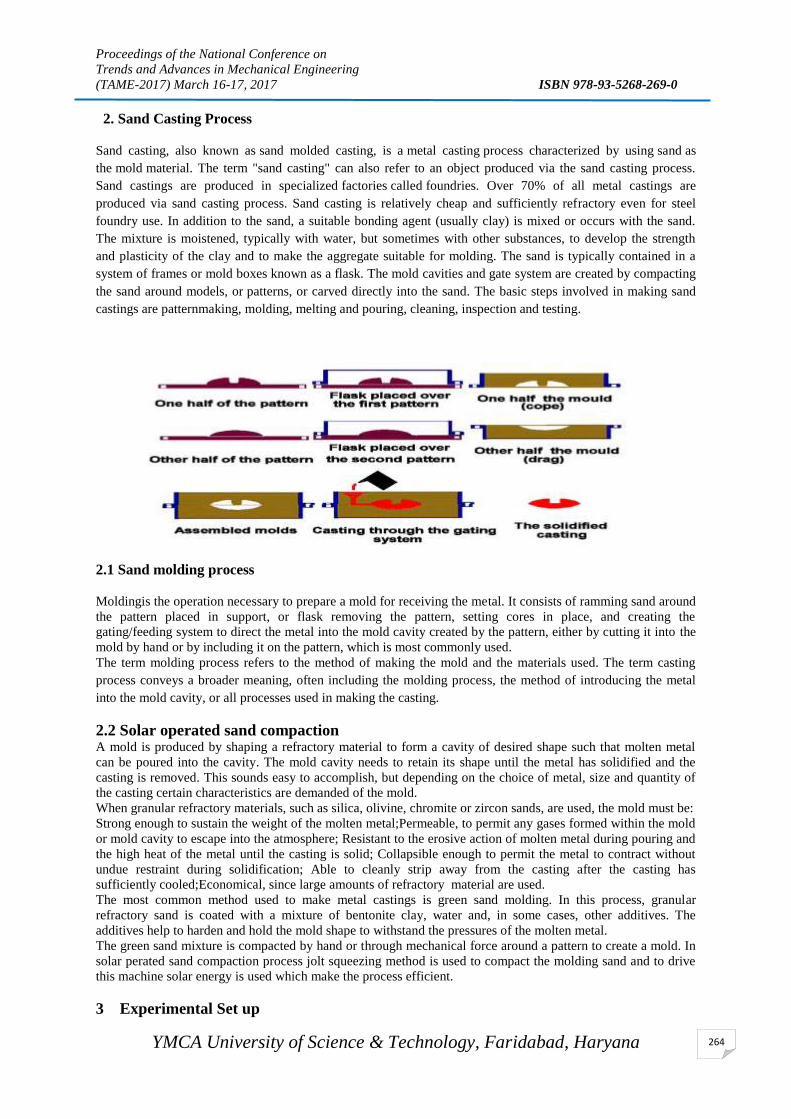
Proceedings of the National Conference on
Trends and Advances in Mechanical Engineering
(TAME-2017) March 16-17, 2017 ISBN 978-93-5268-269-0
YMCA University of Science & Technology, Faridabad, Haryana
264
2. Sand Casting Process
Sand casting, also known as sand molded casting, is a metal casting process characterized by using sand as
the mold material. The term "sand casting" can also refer to an object produced via the sand casting process.
Sand castings are produced in specialized factories called foundries. Over 70% of all metal castings are
produced via sand casting process. Sand casting is relatively cheap and sufficiently refractory even for steel
foundry use. In addition to the sand, a suitable bonding agent (usually clay) is mixed or occurs with the sand.
The mixture is moistened, typically with water, but sometimes with other substances, to develop the strength
and plasticity of the clay and to make the aggregate suitable for molding. The sand is typically contained in a
system of frames or mold boxes known as a flask. The mold cavities and gate system are created by compacting
the sand around models, or patterns, or carved directly into the sand. The basic steps involved in making sand
castings are patternmaking, molding, melting and pouring, cleaning, inspection and testing.
2.1 Sand molding process
Moldingis the operation necessary to prepare a mold for receiving the metal. It consists of ramming sand around
the pattern placed in support, or flask removing the pattern, setting cores in place, and creating the
gating/feeding system to direct the metal into the mold cavity created by the pattern, either by cutting it into the
mold by hand or by including it on the pattern, which is most commonly used.
The term molding process refers to the method of making the mold and the materials used. The term casting
process conveys a broader meaning, often including the molding process, the method of introducing the metal
into the mold cavity, or all processes used in making the casting.
2.2 Solar operated sand compaction A mold is produced by shaping a refractory material to form a cavity of desired shape such that molten metal
can be poured into the cavity. The mold cavity needs to retain its shape until the metal has solidified and the
casting is removed. This sounds easy to accomplish, but depending on the choice of metal, size and quantity of
the casting certain characteristics are demanded of the mold. When granular refractory materials, such as silica, olivine, chromite or zircon sands, are used, the mold must be:
Strong enough to sustain the weight of the molten metal;Permeable, to permit any gases formed within the mold
or mold cavity to escape into the atmosphere; Resistant to the erosive action of molten metal during pouring and
the high heat of the metal until the casting is solid; Collapsible enough to permit the metal to contract without
undue restraint during solidification; Able to cleanly strip away from the casting after the casting has
sufficiently cooled;Economical, since large amounts of refractory material are used.
The most common method used to make metal castings is green sand molding. In this process, granular
refractory sand is coated with a mixture of bentonite clay, water and, in some cases, other additives. The
additives help to harden and hold the mold shape to withstand the pressures of the molten metal.
The green sand mixture is compacted by hand or through mechanical force around a pattern to create a mold. In
solar perated sand compaction process jolt squeezing method is used to compact the molding sand and to drive
this machine solar energy is used which make the process efficient.
3 Experimental Set up

Proceedings of the National Conference on
Trends and Advances in Mechanical Engineering
(TAME-2017) March 16-17, 2017 ISBN 978-93-5268-269-0
YMCA University of Science & Technology, Faridabad, Haryana
265
3.1 Solar panel
Solar panels, also called photovoltaic or PV modules as it directly converts sunlight into electricity. It reduces
the amount of electricity coming from fossil fuels by supplying your operations with clean, renewable energy
from the sun. Solar panel charging system of 15W capacity was used with supplies voltage from 13-16 V for
charging the battery.
3.2Battery
Energy is one of the issues that is causing the most concern as fossil fuels are the greatest pollutants and
contributors to the greenhouse effect .The increasing importance of environmental concern, fuel savings and
unavailability of power has led to interest in renewable energies. It therefore, stands to reason that developing
countries whose energy consumption rate is increasing at a very fast rate should be investigating new energy
systems based on renewable energies that do not pollute and which are inexhaustible such as the solar energy. In
this paper a simple, reliable and effective solar panel charging system has been introduced consisting of a solar
panel (15W),a storage battery of 12V DC, 7A capacity. The charging rate of battery is 0.7 A/hour. The solar
energy is used to power robotic gripper for light load application
3.3 Solar operated Sand compactor It consist of following parts:
The object in molding is to produce accurate parts able to withstand lifting and handling and to contain the
liquid metal pressures in casting. Machine molding enables moulds to be produced in quantity at high rates.
Excluding the simplest types of hand operated pattern draw machine, the principal feature of machine molding
is the use of power operated mechanisms for mould compaction; this mechanization can extend in varying
degrees to pattern withdrawal and mould part manipulation.
Molding machine may be classified as follow on the basis of method of compaction:
1. Squeeze moulding
2. Jolt moulding
3. Jolt-squeeze moulding
4. Slingers
Jolt squeeze molding method makes sound casting but to make conventional molding machine more energy
efficient solar energy is used to drive mechanism.
3.4 DC Motor

Proceedings of the National Conference on
Trends and Advances in Mechanical Engineering
(TAME-2017) March 16-17, 2017 ISBN 978-93-5268-269-0
YMCA University of Science & Technology, Faridabad, Haryana
266
Step angle: - 1.8°
Speed:-100 rpm
Voltage:- 9 V
Supply current: - 0.5 A DC
Solder type: terminal
3.4 Lifting arrangement
3.5 Effect of squeezing pressure on sand mold casting
Squeezing pressure affects the various mechanical properties, metallographic, porosity, microstructure, grain
size of the casting produced by sand casting method. And this can tested through various testing methods like
tensile test, yield strength test, hardness test, impact strength test, scanning electron microscope analysis,
porosity measurement, metallographic examination, microstructure analysis etc. Besides this destructive
methods there some non-destructive methods can be used to measure the effect of varying compaction pressure
on casting produced, one method is industrial computer tomography (ICT) which is used to measure variation in
density of the casting produced without destructing the casting.
The solar energy system is operated by 12V battery which is charged from solar panel supplying energy 15V
and 0.7 A current.Compression of sand is expected to 0.1 mm to3 cm while the lift of platform is up to 15 cm.
The solar energy supplied to the system is 12Vx 1.5 A= 18 W.
4. CONCLUSION
Sand casting process uses various molding methods for compacting the molding sand out of which jolt
squeezing method is one which is used widely. By increasing pressure on sand by solar operated system, the
porosity of sand changes. Conventional jolt squeezing compacting method is proposed to operate through solar
energy to make the process more energy efficient. The quality of casting is affected by squeezing the sand using
solar operated compaction system.

Proceedings of the National Conference on
Trends and Advances in Mechanical Engineering
(TAME-2017) March 16-17, 2017 ISBN 978-93-5268-269-0
YMCA University of Science & Technology, Faridabad, Haryana
267
REFERENCES
1.Jitisha Aggarwal et al., Harnessing solar energy for every home: Energy saving applications,Open access
Journal: Conference paper in Sc,Vol.2014, ArticleID 628294,3pages,d.o.i.10.1155 /2014/628294,2014(Hindawi
Publishing Corporation).
2.Khan, B.H., (2006), Renewable energy resources, TataMcGraw-Hill Publishing Company Limited,New
Delhi, India
3.Ross F. Housholder, Arlington, Tex, MOLDING PROCESS
4.Serope Kalpakjian and Steven R. Schmid , " Manufacturing Engineering and Technology ", 4th edition ,
Pearson,New Delhi,2013
5. Richard W heine,carl R loper,Pilip C Rosenthal,”Principle of metal casting,tata McGrahill,New Delhi,
6. Rao T.V.“Metal casting principle and practice”, New age publication, New Delhi 2010.
7. B.Ravi ,”Metal Casting computer aided design and and analysis” PHI,Learning New Delhi 2011

Proceedings of the National Conference on
Trends and Advances in Mechanical Engineering
(TAME-2017) March 16-17, 2017 ISBN 978-93-5268-269-0
YMCA University of Science & Technology, Faridabad, Haryana
268
ANALYSIS OF FACTORS AFFECTING TOXICITY IN A
NANOMATERIAL USING ISM
Rajeev Saha
Department of Mechanical Engineering
YMCA University of Science and Technology
Faridabad - 121006, India.
E-mail: [email protected]
Abstract
The discovery of unique properties of ubiquitous nanomaterials has revolutionized the world by widening the
scope of its utility in engineering, medical or any other area of relevance. The uses of engineered nanomaterial
has found acceptance in a much wider field ensuring prosperous future developments. Nanomaterials
production rate is increasing exponentially with the increasing acceptance of related products in the market.
With increased use, the exposure of nanomaterials to human and environment has increased manifold. The
toxicological properties of a nanomaterial are more enhanced as compared to its bulk form and exposure to
nanomaterials beyond certain limit may be toxic in nature. Each factor affecting toxicity of a nanomaterial has
own impact towards its toxicity; hence interactions among factors are critical towards determining the
dependent and driving factors. This paper tries to analyse the interactions among factors affecting toxicity of a
nanomaterial through interactive structural modeling (ISM).
Keywords: Engineered Nanomaterial, Toxicity of Nanomaterial, Interactive Structural Modeling (ISM).
1. Introduction
The Nanomaterials consists of matter at dimensions of roughly 1 to 100 nanometers in at least one dimension.
At nanoscale (10-9 meter) unique phenomena occur which is exploited in novel applications. Nanomaterials are
currently used in a wide array of applications including in healthcare, electronics, cosmetics, aeronautics,
agriculture and food systems, metal-cutting tools, inks, and automotive catalytic converters etc. In the future it is
anticipated that nanomaterials will allow major advances in high energy density rechargeable batteries,
improved low cost solar cells, commercially viable fuel cells, more energy efficient catalysts, high strength
structural materials for aerospace applications, faster and more efficient semiconductor electronics, and
improved methods for treating diseases by targeting diseased tissue [National Nanotechnology Initiative, 2009].
A product made using engineered nanomaterials (ENM) may trigger the release of constituent ENM into the
environment during any stage of the products life cycle till final disposal thus exposing all living beings. The
toxic impact of ENM on living beings mainly depends upon the type of ENM, the intake amount and duration of
exposure [Institute for Applied Ecology, 2015].
The epidemiological studies on ENM exposure which may help analyse the pattern of its health impact on
human is yet to take place due to lack of any verified exposure area. The only problem is that the adverse effect
of nanomaterials on human and environment is yet to be known fully and further studies are going on. Another
problem is establishment of a scale to measure the toxicity of a nanomaterial. The established scale may be
different for each nanomaterial as the factors governing toxicity might be different for different nanomaterials.
Potential TiO2 exposure had adverse health effects in workers as reported in few cases. [Dankovic and Kuempel,
2011]. Table 1 showcase some of the common nanoscale materials and their applications.
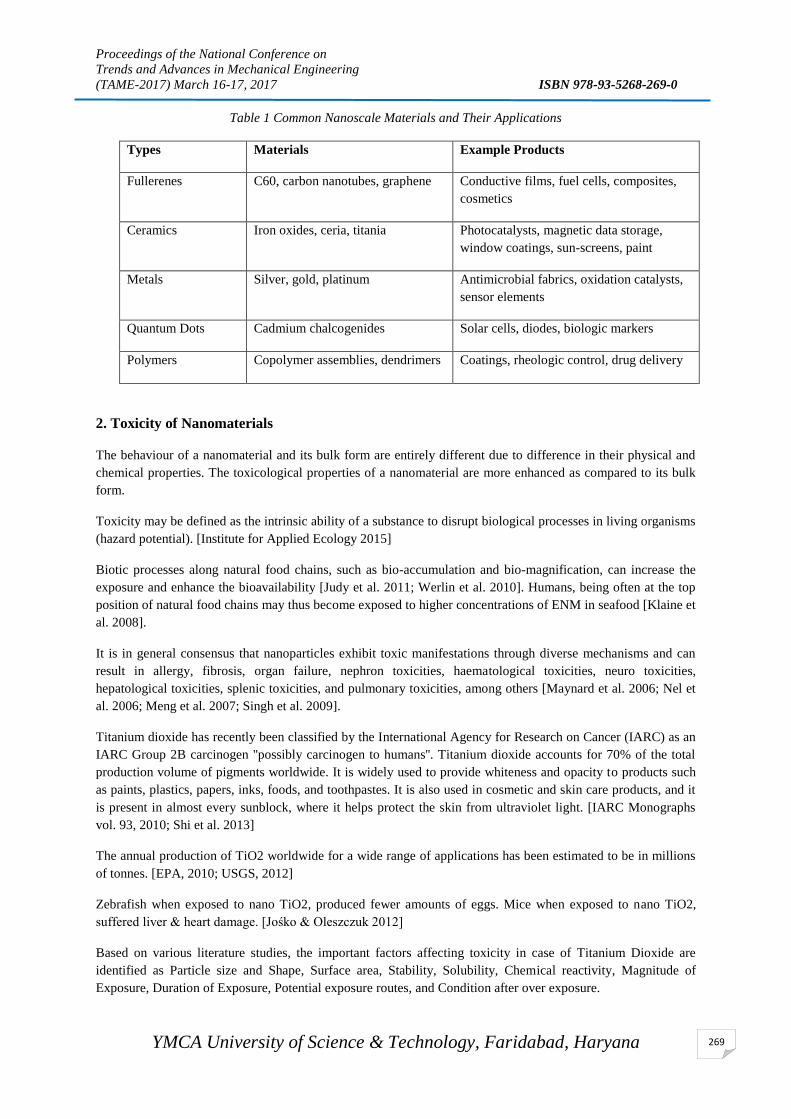
Proceedings of the National Conference on
Trends and Advances in Mechanical Engineering
(TAME-2017) March 16-17, 2017 ISBN 978-93-5268-269-0
YMCA University of Science & Technology, Faridabad, Haryana
269
Table 1 Common Nanoscale Materials and Their Applications
Types Materials Example Products
Fullerenes C60, carbon nanotubes, graphene Conductive films, fuel cells, composites,
cosmetics
Ceramics Iron oxides, ceria, titania Photocatalysts, magnetic data storage,
window coatings, sun-screens, paint
Metals Silver, gold, platinum Antimicrobial fabrics, oxidation catalysts,
sensor elements
Quantum Dots Cadmium chalcogenides Solar cells, diodes, biologic markers
Polymers Copolymer assemblies, dendrimers Coatings, rheologic control, drug delivery
2. Toxicity of Nanomaterials
The behaviour of a nanomaterial and its bulk form are entirely different due to difference in their physical and
chemical properties. The toxicological properties of a nanomaterial are more enhanced as compared to its bulk
form.
Toxicity may be defined as the intrinsic ability of a substance to disrupt biological processes in living organisms
(hazard potential). [Institute for Applied Ecology 2015]
Biotic processes along natural food chains, such as bio-accumulation and bio-magnification, can increase the
exposure and enhance the bioavailability [Judy et al. 2011; Werlin et al. 2010]. Humans, being often at the top
position of natural food chains may thus become exposed to higher concentrations of ENM in seafood [Klaine et
al. 2008].
It is in general consensus that nanoparticles exhibit toxic manifestations through diverse mechanisms and can
result in allergy, fibrosis, organ failure, nephron toxicities, haematological toxicities, neuro toxicities,
hepatological toxicities, splenic toxicities, and pulmonary toxicities, among others [Maynard et al. 2006; Nel et
al. 2006; Meng et al. 2007; Singh et al. 2009].
Titanium dioxide has recently been classified by the International Agency for Research on Cancer (IARC) as an
IARC Group 2B carcinogen ''possibly carcinogen to humans''. Titanium dioxide accounts for 70% of the total
production volume of pigments worldwide. It is widely used to provide whiteness and opacity to products such
as paints, plastics, papers, inks, foods, and toothpastes. It is also used in cosmetic and skin care products, and it
is present in almost every sunblock, where it helps protect the skin from ultraviolet light. [IARC Monographs
vol. 93, 2010; Shi et al. 2013]
The annual production of TiO2 worldwide for a wide range of applications has been estimated to be in millions
of tonnes. [EPA, 2010; USGS, 2012]
Zebrafish when exposed to nano TiO2, produced fewer amounts of eggs. Mice when exposed to nano TiO2,
suffered liver & heart damage. [Jośko & Oleszczuk 2012]
Based on various literature studies, the important factors affecting toxicity in case of Titanium Dioxide are
identified as Particle size and Shape, Surface area, Stability, Solubility, Chemical reactivity, Magnitude of
Exposure, Duration of Exposure, Potential exposure routes, and Condition after over exposure.
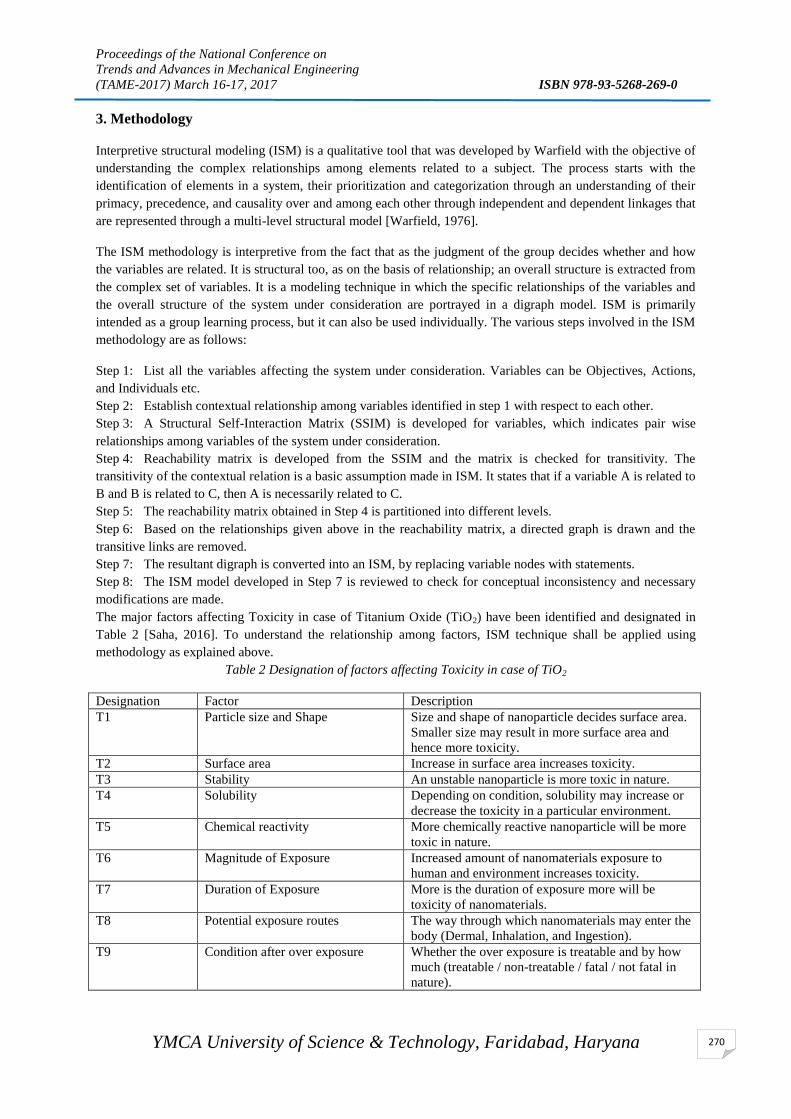
Proceedings of the National Conference on
Trends and Advances in Mechanical Engineering
(TAME-2017) March 16-17, 2017 ISBN 978-93-5268-269-0
YMCA University of Science & Technology, Faridabad, Haryana
270
3. Methodology
Interpretive structural modeling (ISM) is a qualitative tool that was developed by Warfield with the objective of
understanding the complex relationships among elements related to a subject. The process starts with the
identification of elements in a system, their prioritization and categorization through an understanding of their
primacy, precedence, and causality over and among each other through independent and dependent linkages that
are represented through a multi-level structural model [Warfield, 1976].
The ISM methodology is interpretive from the fact that as the judgment of the group decides whether and how
the variables are related. It is structural too, as on the basis of relationship; an overall structure is extracted from
the complex set of variables. It is a modeling technique in which the specific relationships of the variables and
the overall structure of the system under consideration are portrayed in a digraph model. ISM is primarily
intended as a group learning process, but it can also be used individually. The various steps involved in the ISM
methodology are as follows:
Step 1: List all the variables affecting the system under consideration. Variables can be Objectives, Actions,
and Individuals etc.
Step 2: Establish contextual relationship among variables identified in step 1 with respect to each other.
Step 3: A Structural Self-Interaction Matrix (SSIM) is developed for variables, which indicates pair wise
relationships among variables of the system under consideration.
Step 4: Reachability matrix is developed from the SSIM and the matrix is checked for transitivity. The
transitivity of the contextual relation is a basic assumption made in ISM. It states that if a variable A is related to
B and B is related to C, then A is necessarily related to C.
Step 5: The reachability matrix obtained in Step 4 is partitioned into different levels.
Step 6: Based on the relationships given above in the reachability matrix, a directed graph is drawn and the
transitive links are removed.
Step 7: The resultant digraph is converted into an ISM, by replacing variable nodes with statements.
Step 8: The ISM model developed in Step 7 is reviewed to check for conceptual inconsistency and necessary
modifications are made.
The major factors affecting Toxicity in case of Titanium Oxide (TiO2) have been identified and designated in
Table 2 [Saha, 2016]. To understand the relationship among factors, ISM technique shall be applied using
methodology as explained above.
Table 2 Designation of factors affecting Toxicity in case of TiO2
Designation Factor Description
T1 Particle size and Shape Size and shape of nanoparticle decides surface area.
Smaller size may result in more surface area and
hence more toxicity.
T2 Surface area Increase in surface area increases toxicity.
T3 Stability An unstable nanoparticle is more toxic in nature.
T4 Solubility Depending on condition, solubility may increase or
decrease the toxicity in a particular environment.
T5 Chemical reactivity More chemically reactive nanoparticle will be more
toxic in nature.
T6 Magnitude of Exposure Increased amount of nanomaterials exposure to
human and environment increases toxicity.
T7 Duration of Exposure More is the duration of exposure more will be
toxicity of nanomaterials.
T8 Potential exposure routes The way through which nanomaterials may enter the
body (Dermal, Inhalation, and Ingestion).
T9 Condition after over exposure Whether the over exposure is treatable and by how
much (treatable / non-treatable / fatal / not fatal in
nature).

Proceedings of the National Conference on
Trends and Advances in Mechanical Engineering
(TAME-2017) March 16-17, 2017 ISBN 978-93-5268-269-0
YMCA University of Science & Technology, Faridabad, Haryana
271
A digraph is formed to showcase the interactions among factors as shown in figure 1.
Figure 1 Digraph of nanomaterials toxicity factors
ISM methodology suggests the use of the expert opinions based on various management techniques such as
brain storming, nominal technique, etc., in developing the contextual relationship among the variables. Thus, in
this research for identifying the contextual relationship among the toxicity factors of TiO2, four experts from the
academia were consulted. Keeping in mind the contextual relationship for each variable, the existence of a
relation between any two factors (i and j) and the associated direction of the relation is questioned. Four symbols
are used to denote the direction of relationship between the factors (i and j):
V: Factor i will affect Factor j;
A: Factor j will affect Factor i;
X: Factor i and j will affect each other; and
O: Factor i and j are unrelated.

Proceedings of the National Conference on
Trends and Advances in Mechanical Engineering
(TAME-2017) March 16-17, 2017 ISBN 978-93-5268-269-0
YMCA University of Science & Technology, Faridabad, Haryana
272
Structured self-interaction matrix (SSIM) is shown in table 3. Table 4 shows initial reachability matrix while
table 5 shows final reachability matrix after checking for transitivity.
Table 3 SSIM as per Expert’s Opinion.
T2 T3 T4 T5 T6 T7 T8 T9
T1 V V O X V V O A
T2 X X A V A V A
T3 O X V V V V
T4 A O O O O
T5 V V V V
T6 O O V
T7 V V
T8 V
Table 4 Initial Reachability Matrix
T1 T2 T3 T4 T5 T6 T7 T8 T9
T1 1 1 1 0 1 1 1 0 0
T2 0 1 1 1 0 1 0 1 0
T3 0 1 1 0 1 1 1 1 1
T4 0 1 0 1 0 0 0 0 0
T5 1 1 1 1 1 1 1 1 1
T6 0 0 0 0 0 1 0 0 1
T7 0 1 0 0 0 0 1 1 1
T8 0 0 0 0 0 0 0 1 1
T9 1 1 0 0 0 0 0 0 1
Table 5 Final Reachability Matrix
T1 T2 T3 T4 T5 T6 T7 T8 T9 Driver
Power
T1 1 1 1 0 0 1 1 1 1 7
T2 0 1 1 1 0 1 0 1 1 6

Proceedings of the National Conference on
Trends and Advances in Mechanical Engineering
(TAME-2017) March 16-17, 2017 ISBN 978-93-5268-269-0
YMCA University of Science & Technology, Faridabad, Haryana
273
T3 0 1 1 1 1 1 1 1 1 8
T4 0 1 1 1 1 1 0 0 0 5
T5 1 1 1 1 1 1 1 1 1 9
T6 0 0 0 0 0 1 0 0 1 2
T7 0 1 1 1 1 1 1 1 1 8
T8 0 0 0 0 0 0 0 1 1 2
T9 1 1 1 1 1 1 0 0 1 7
Dependence 3 7 7 6 5 8 4 6 8
4. Results
The objective of ‘Matrice d'Impacts Croises Multiplication Appliquee a un Classement’ (MICMAC) analysis is
to analyze the driver power and the dependence power of the variables [Gorvett, 2006].The variables are
classified into four clusters (Figure 2).
Driver
Power
9 IV T5 III
8 T7 T3
7 T1 T9
6 T2
5 T4
4
3 I II
2 T8 T6
1
1 2 3 4 5 6 7 8 9
Dependence
Figure 2 Driving Power and Dependence Diagram
Cluster I: Excluded Variables-These variables are close to the origin of the matrix having low driving power &
low dependency. Also called Independent variables or autonomous variables, they have a weaker link to the
system and do not influence future of the system.
Cluster II: Dependent Variables-Also known as resultant variables, these variables have low driving power &
high dependency and are influenced by both influential variables and relay variables.
Cluster III: Cluster Relay Variables-These variables have high influence and high dependency and are unstable.
Also known as linkage variables, any actions towards these variables may relay back through other variables.
Cluster IV: Influential Variables-These variables have high driving power & low dependency.
Subsequently, the driver power-dependence diagram is constructed which is shown in Figure 2. As an
illustration, it is observed from Table 5 that factor T1 is having a driver power of 7 and a dependence of 3.
Therefore, in this figure, it is positioned at a place corresponding to a driver power of 7 and a dependency of 3.

Proceedings of the National Conference on
Trends and Advances in Mechanical Engineering
(TAME-2017) March 16-17, 2017 ISBN 978-93-5268-269-0
YMCA University of Science & Technology, Faridabad, Haryana
274
5. Conclusion
From the driver-dependence diagram (figure 2) factor E2 (Chemical reactivity) is having highest driving power
while factors T6 (Magnitude of Exposure) and T9 (Condition after over exposure) is having highest dependence.
This is true as chemical reactivity is the main driving power behind toxicity of a nanomaterial. On the other
hand magnitude of exposure and condition after over exposure is dependent. The factors surface area, stability
and condition after over exposure are unstable as per MICMAC analysis.
References
Dankovic, D. and Kuempel, E., Current intelligence bulletin 63: Occupational Exposure to Titanium Dioxide,
Department of Health and Human Services, Centers for Disease Control and Prevention, National Institute for
Occupational Safety and Health, DHHS (NIOSH) Publication 2011–160. April 2011.
EPA, U., 2010. Nanomaterial Case Studies: Nanoscale Titanium Dioxide in Water Treatment and in Topical
Sunscreen, p. 22.
Gorvett, R., Interpretive Structural Modeling of interactive risks, Call Paper Program, Enterprise Risk
Management Symposium, Chicago, IL, 2006.
IARC Monographs on the Evaluation of Carcinogenic Risks to Humans, Carbon Black, Titanium Dioxide, and
Talc, VOLUME 93, 2010.
Institute for Applied Ecology. January 2015. Toxicity of Engineered Nanomaterials Retrieved February, 12,
2016.
Jośko, I. & Oleszczuk, P. (2012). Manufactured Nanomaterials: The Connection Between Environmental Fate
and Toxicity. Critical Reviews in Environmental Science and Technology, 43(23), 2581–2616.
Judy, J. D.; Unrine, J. M. & Bertsch, P. M. (2011). Evidence for Biomagnification of Gold Nanoparticles within
a Terrestrial Food Chain. Environmental Science & Technology, 45(2), 776–781.
Klaine, S.J.; Alvarez, P.J.; Batley, G.E. et al (2008). Nanomaterials in the environment: behavior, fate,
bioavailability, and effects. Environmental Toxicology and Chemistry, 27(9), 1825.
Maynard, A.D., Aitken, R.J., Butz, T., Colvin, V., Donaldson, K., Oberdörster, G., Philbert, M.A., Ryan, J.,
Seaton, A., Stone, V. and Tinkle, S.S., 2006. Safe handling of nanotechnology. Nature, 444(7117), pp.267-269.
Meng, H., Chen, Z., Xing, G., Yuan, H., Chen, C., Zhao, F., Zhang, C. and Zhao, Y., 2007. Ultrahigh reactivity
provokes nanotoxicity: explanation of oral toxicity of nano-copper particles. Toxicology letters, 175(1), pp.102-
110.
National Nanotechnology Initiative, 2009. Nanotechnology: Big things from a tiny world. Retrieved February,
12, 2016.
Nel, A., Xia, T., Mädler, L. and Li, N., 2006. Toxic potential of materials at the nano level. Science, 311(5761),
pp.622-627.
Saha, Rajeev, “Analysis of a Nanomaterial to Determine its Toxicity Index”, Journal of Mechanical Robotics,
Volume 1, Issue 1, 2016, pp. 1-9
Shi, H., Magaye, R., Castranova, V., & Zhao, J. (2013). Titanium dioxide nanoparticles: a review of current
toxicological data. Part Fibre Toxicol, 10(1), 15.

Proceedings of the National Conference on
Trends and Advances in Mechanical Engineering
(TAME-2017) March 16-17, 2017 ISBN 978-93-5268-269-0
YMCA University of Science & Technology, Faridabad, Haryana
275
Singh, N., Manshian, B., Jenkins, G.J., Griffiths, S.M., Williams, P.M., Maffeis, T.G., Wright, C.J. and Doak,
S.H., 2009. NanoGenotoxicology: the DNA damaging potential of engineered nanomaterials. Biomaterials,
30(23), pp.3891-3914.
USGS, 2012. Mineral Commodity Summaries 2012. U.S. Geological Survey, Washington. Retrieved on
February, 15, 2016.
Warfield, J.N. , Societal Systems, New York: Wiley & Sons, 1976.
Werlin, R.; Priester, J.H.; Mielke, R.E.; et al. (2010). Biomagnification of cadmium selenide quantum dots in a
simple experimental microbial food chain. Nature Nanotechnology, 6(1), 65–71.

Proceedings of the National Conference on
Trends and Advances in Mechanical Engineering
(TAME-2017) March 16-17, 2017 ISBN 978-93-5268-269-0
YMCA University of Science & Technology, Faridabad, Haryana
276
REVIEW ON PERFORMANCE MEASUREMENT FOR AUTOMOBILE
SERVICE SECTOR
Anil Kumar
1, Bhupender Singh
2 and Rajesh Attri
3
M.Tech Student1, Asst. Professor
2,3
YMCAUST, Faridabad
ABSTRACT
For the progress and establishment of an industry is completely depends on customers and its satisfaction. As
we all know that a lot of competitors in the market who manufacture the same product but of varying cost. Not
only carrying the cost they also add some features to improve the quality of the product. For example if we
consider two cars of different brand in the same segment then we see that there is some differences in many of
the areas in terms of comfort, mileage, look, and many more additional features. But there are some differences
between expected service and the perceived service. This Research deals with the importance of customer
satisfaction automobile service industries and also presents a review on customer satisfaction, service quality
and factors which affect customer satisfaction in Automobile service industries.
Keywords- customer satisfaction, Automobile service industries.
1. Introduction
Service quality is an essential aspect for any service provider, and automobile service industry is no exclusion.
The service sector is going through revolutionary change, which affects the way of living and work. New
services are continually being launched to satisfy our existing and potential needs. Service organizations are
motley wide in size. The service sector produces intangible goods and more exact services instead of goods.
According to the U.S. Census Bureau, it is comprised of various service industries including warehousing and
truck transportation services; information sector services; commodities, securities and other investment services
like professional, technical and scientific services; waste management services; health care and social assistance
services; and arts, entertainment and recreation services. At present most of the person uses vehicle either two
wheeler or four wheeler and they expect better service and better quality of their vehicle in different terms such
as mileage, comfort, performance etc. The increment and decrement in the number of customer is totally
depending on customer satisfaction. In the present time there is a lot of competition in the market so there is a
need to be conscious about customer satisfaction. Customers are much concerned about after sales service. For
marketing of the product the term customer satisfaction is used. It is the key parameter to know the customer
expectation for a particular product of brand. Customer satisfaction is defined as the percentage of total
customers who are using the product and experience the quality of service of their service centre and they feel
happy or satisfy. There are several reasons why customers must be given quality service. Most important of
them are: Industry has become so competitive that customers now have variety of alternatives, if the customer
is lost, it can be extremely difficult to win back the individual and Most customers do not complain when they
experience problems. These customers simply have a fear of failing and taketheir business elsewhere. . With the
aim of sustaining long term relationships with their customers, many businesses have changed their strategic
focus to stress on customer retention. Economic growth, the need for better conveyance, gradually improving
road infrastructure coupled with better credit and financing options, have acted as a major catalyst in
encouraging the growth and development of the two wheeler segment in India (ACMA 2006). Further, the new
and improved features on the two wheelers, their stylish and trendy looks are a rage with the country’s youth,
who, form a substantial influence in determining the consumer behavior have ensured that the two wheelers
remain on top of the automobile.
The lack of adequate knowledge on satisfaction / dissatisfaction is definitely a major hindrance to public staff, to
legislators, marketing managers, consumerists and consumer behaviour theorists. Hence, the development of

Proceedings of the National Conference on
Trends and Advances in Mechanical Engineering
(TAME-2017) March 16-17, 2017 ISBN 978-93-5268-269-0
YMCA University of Science & Technology, Faridabad, Haryana
277
both the conceptual and measurement aspects of consumer satisfaction and dissatisfaction is needed. Therefore,
the Corporate blue prints for growth are becoming synonymous with strategies for customer satisfaction.
Customer satisfaction is important not only for small and growing organizations but even major corporations
cannot escape from the customer scrutiny.The main objective of this study is to identify factors affecting the
purchase decisions of a motorcycle in an era of deregulation and suggest a model to capture the constraining
factors in a better way.
2. Literature review
The term review means to organize the knowledge of the special area of research to evolve an edifice of
knowledge to show that this study would be an addition to this field. Review of literature is an indisputable
aspect of a scientific activity. It implies organization a synthesis of knowledge of a particular area of
investigation after going into the works. The task of literature is highly creative and tendons because research
has to synthesis the available knowledge of the field in a unique way to provide the rationale of the study.
Literature is worthwhile for an effective piece of research. Foundation on which one’s future work will be built.
If we fail to build this foundation of knowledge provided by the review of the literature, our work is likely to be
shallow and native, and will often prove to be duplicate. This has done better by someone in the past.
Rathore et all., (2015) Studied that the assessed after-sales services performance of automobile service centres.
QFD was used to transform voice of customer’s into technical characteristics. A questionnaire containing ten
questions had been used for the collection of voice of customer’s for the service centre. Overall service quality
level of the service centre A under study found very poor. The most dissatisfaction was found to be for Pre
reminding call for upcoming servicing (VoC3) and Service advisor attitude to deliver vehicle on time (VoC5).
The two important weights had been calculated for assessing the quality index of the service center. The
methodology proposed in this study is help-full to evaluate theperformance of any service centre with certain
modification in the questionnaires design with respect to the service centre under consideration.
Shendeet all.,(2014) discussed consumer buying behaviour towards passenger car segment in India. The
objective of this study was the identification of factors influencing customer’s preference for particular segment
of cars such as small & hatch back segment, Sedan class segment, SUV & MUV Segment and Luxury Car
segment. Proper understanding of consumer buying behaviour will help the marketer to succeed in the market.
Study also attempts to consolidate findings & suggestions to overcome present scenario of stagnancy in sales
and cultivate future demand for automobile car market.
Verma et al., (2014) worked to get Quality function deployment model to improve service quality using
customer needs priorities in a 5-star hotel of Indore. In the research customer satisfaction and importance degree
of each need was investigated using survey method.
Ranawat et al., (2013) traced the evolution of the automotive industry from its beginning to the present day and
identifies the important policies made by the Indian government. They also studied the influence of important
policies on the development of the industry.
Dhole et al., (2013) performed fundamental analytical study of four Automobile sector companies in Price
movement of shares. The study concluded that investors are interested in predicting the future behaviour of
stock market. The study concluded that the investor should look at the price movements of the particular
company over the years and then should go for better portfolio. The future plans of the organization are also
vital information for analysis. The study shows that speculative or sentimental factors do play a role in price
movement of shares. But, it is only a short-term effect, in long term annual performance is sole factor which is
responsible for price movement.
3. Factors
The information has been sourced from various authentic and reliable sources like books, newspapers, trade
journals and white papers, industry portals, government agencies, trade associations, monitoring industry news
Proceedings of the National Conference on
Trends and Advances in Mechanical Engineering
(TAME-2017) March 16-17, 2017 ISBN 978-93-5268-269-0
YMCA University of Science & Technology, Faridabad, Haryana
278
and developments, and through access to paid databases. Here, many factors affecting in automobile industries
are identified according to their features and characteristics.
Intangibility
Services are intangible in that they do not have a physical shape. So aconsumer cannot touch or see it but can
derive the benefits after buyingit. This intangibility makes the task of decision makers more complex.While
motivating the prospects they cannot display the positive or negativeaspects of services. The consumer also
finds it difficult to measure servicevalue and quality. To overcome this, consumers tend to look for evidenceof
quality and other attributes. They also consider physical evidence andqualifications or professional standing of
the consultant. Services by nature are abstract.
Inseparability
Services often cannot be separated from the person of the service provider.Moreover, some services must be
created and dispensed simultaneously.For example, dentists create and dispense almost all their services at
thesame time. From the marketing point of view,direct sale is the only channel of distribution of services. This
feature ofservices also limits the scale of operation of a service firm. The goods areproduced at one point and
then distributed by others at other points. Inservices, we find the selling processes contributing to its creation.
Perishability
Services are highly perishable and they cannot be stored. In the contextof services, if we fail to sell the services,
it is lost forever. For example, avacant seat in an aircraft or an unbooked room in a hotel etc. areopportunities
lost forever. This makes it essential that decision-makers.
Ownership
Lack of ownership is a basic feature of the service industry. A customermay only have access to or use of a
facility. Payment is for the use, accessor hire of the service. Thus the ownership is not affected in the process
ofselling the services.
Customer contact:
The customer is very much a part of the service process. A service canbe classified as high or low contact
depending on the percentage of timethe customer spends in the delivery system relative to the total servicetime.
In high contact services the customer influences the timing of demandand the nature of service by direct
participation in the process.
Service tangibility
The degree of tangibility of a service can be used to classify services:
Highly tangible services - car rentals, vending machines, and telecommunications.Serviceslinked to tangible
goods - car service, repair of domesticappliancesHighly intangible services - consultancy, legal service.
4. Conclusion
The Key Success factors in the Motor Vehicle Manufacturing industry are:
1. Efficiency factor - Improve labour productivity, labour flexibility, and capital efficiency.
2. Resource Availability - Quality manpower availability, infrastructure improvements, andraw material
availability.
3. Effective cost controls - Close relationship with supplies and goods distributionchannels.
4. Establishment of export markets - Growth of export markets
5. Having an extensive distribution/collection network - Goods distribution channels
6. Successful industrial relations policy - Ethical and tactical industrial relations
Proceedings of the National Conference on
Trends and Advances in Mechanical Engineering
(TAME-2017) March 16-17, 2017 ISBN 978-93-5268-269-0
YMCA University of Science & Technology, Faridabad, Haryana
279
7. Access to the latest available and most efficient technology and techniques – Thedegree of investment in
technological improvements and product development
8. Optimum capacity utilisation- The level of plant utilization
9. Management of high quality assets portfolio Understanding implications from Government policies.
10. To evaluate and analyze the growth and trends of the automobile sector.
References
Al-Shammari, M. and SamerKanina(2015), A. Perceived Customer Service Quality in a Saudi Automotive
Company. International Journal of Managerial Studies and Research (IJMSR). 2(10): 173-182,.
Bhasker, Velury Vijay (2013). Indian Auto Component Industry: A Decade of Growth and Way
Forward.Research Journal of Management Sciences. Vol. 2(3), 19-27. ISSN 2319–1171.
Gupta,Pankaj,(2015),”present indian automobile industry”, MIT International Journal of
MechanicalEngineering, Vol. 5, No. 1, January 2015, pp. 30-36 30 ISSN 2230-7680 © MIT Publications.
Javed, Mohd& Gupta Parul (2015). Customer Satisfaction And Service Quality In Four Wheeler Automobile
Service Industry: A Review. SSRG International Journal of Mechanical Engineering (SSRG-IJME).Vol. 2 Issue
9 ISSN: 2348 – 8360.
M. and SamerKanina,(2014). A. Perceived Customer Service Quality in a Saudi Automotive Company.
International Journal of Managerial Studies and Research (IJMSR). 2(10): 173-182,.
Nataraj, S. and Dr. N.Nagaraja (2012).Customer Satisfaction in Automobile Industry – An Indian Online
Buyers’ Perspective of Car Manufacturers’ Websites.International Journal of Multidisciplinary.Vol.2. Issue
6.ISSN 2231 5780.
Negi, jayanat (2010) .Measurement of Service Quality of an Automobile ServiceCenter.,Proceedings of the
2010 International Conference on Industrial Engineering and Operations Management Dhaka, Bangladesh,
January 9 – 10, 2010.
Pandya ,Hemal and Hetal (2013). Fundamental Analysis Of Indian Automobile Industry.International Journal
of Current Research.Vol. 5, Issue, 5, pp.1273-1286 ISSN: 0975-833X.

Proceedings of the National Conference on
Trends and Advances in Mechanical Engineering
(TAME-2017) March 16-17, 2017 ISBN 978-93-5268-269-0
YMCA University of Science & Technology, Faridabad, Haryana
280
THE CHANGING MANUFACTURING ENVIRONMENT FROM THE
MASS MANUFACTURING TO THE FLEXIBLE MANUFACTURING
Sandhya Dixit
Department of Mechanical Engineering, YMCA University of Science and Technology, Faridabad, Haryana
India. e-mail: [email protected]
Abstract
In recent years the manufacturing environment has changed drastically. Today’s market is very volatile because
of continuous developments in processes, materials and technologies. As an effect the industries are shifting
from the mass production to low volume high variety production. The manufacturing organisations adopt
Flexible Automation Systems to meet the challenges imposed by today’s market standards. To achieve
competitive advantage in the market and improve an organisation’s capability to respond to customer demands
without incurring excessive time and cost penalties manufacturing flexibility is widely accepted as an important
component. In this context, a Flexible Manufacturing System is an emerging technology which is designed to
combine the efficiency of a mass production line and the flexibility of a job shop to produce a variety of
products on a group of machines. In this research paper the transition from the mass production to the flexible
production is highlighted and also the basics of FMSs are explained along with the major research areas in the
field.
Keywords: production, flexible automation, manufacturing systems, productivity.
1. Introduction
The manufacturing environment has changed more in the previous one decade like never before. The
pace of change continues to accelerate and the organisations around the world are trying to catch up with it.
Changing markets, consumer preferences, customer demands, new materials, processes and equipments have all
influenced the working of industries. How companies have organised their manufacturing facilities to cope with
this volatile environment has varied enormously. Successful companies today recognize that the ability to
respond to new customer needs and seize market opportunities as they arise is crucial to their continued success
(Ali and Wadhwa, 2005). Enterprises are continuously striving to improve in the area of product variety, quality,
time to market, customer satisfaction, performance, profitability, employee morale etc. Timely and effective
response to changing needs has become critical.
Traditional factories derived their competitive advantage from a combination of size, volume and
standardisation (Koren, 2010). But today’s industries relay more on flexibility than on standardisation.
Advanced technology has fundamentally changed the nature of manufacturing and opened up opportunities for
new styles of competition in many industries. The application of information technology, computers and
telecommunications to all aspects of manufacturing is the key reason for the fundamental change towards
achieving the goal of both variety and low cost. In the factory of future, variety and innovation will no longer
have to be traded off against productivity.
The drive towards world class industries has led to the development of flexible automation systems. An
attempt has been made in this paper to describe the concept of flexible automation through flexible
manufacturing systems in the world class industries.
2. Different Stages of Development of Manufacturing Technology
Looking back over the history and evolution of manufacturing technology, one can observe following
three general stages of development in the utilisation of the basic factors of production:
In the first stage, manufacturing was dependent on human labour and human intelligence.
The second stage saw the replacement of human labour by machines, while still relying on human
intelligence.
Today in the third stage, human intelligence is being replaced by artificial intelligence and integrated
with machine labour.

Proceedings of the National Conference on
Trends and Advances in Mechanical Engineering
(TAME-2017) March 16-17, 2017 ISBN 978-93-5268-269-0
YMCA University of Science & Technology, Faridabad, Haryana
281
The evolution to the third stage is made possible and/ or accelerated by the availability of low cost
electronic computing and control, telecommunications and sophisticated measurement and sensor technologies.
These changes have been accompanied by an evolution in manufacturing policy as indicated in Fig. 1.
Fig. 1. Different Stages of Development of Manufacturing Policy
3. Changing Aims for Production
Highly industrialised nations as well as developing countries like India are today facing the problems for
their business like:
Compressed product lifecycles and shorter market lifetimes
Intensified competition
An accelerated rate of technical development
Declining profit margins
Increased demands on the variety with quality products
Shorter market lifetimes and shorter innovation times lead to increasing demands on a company’s
preparedness, adaptability and versatility. The world class companies must, therefore accept new business
environment and pursue new strategies like,
Develop new products with increased frequency.
Offer a great number of variants.
Attempt to shorten the delivery times.
Reduce costs by all means.
Ensure high quality during all phases of the product’s lifetime. Embed the uniqueness of the
product more and more deeply into the manufacturing process.
Incorporate increasing level of product customisation.
4. Flexible Automation – A Key Concept
Companies which possess the ability to adapt themselves and to react rapidly to changes in their environment
are in a better position than companies with fixed aims and means. The essential attributes like enhanced
flexibility, greater versatility and higher quality can be attained primarily through the creation of new production
Mechanisation
Specialisation
Automation
Integration
Ma
nu
fact
uri
ng
po
licy
2010 2000 1970 1950
Year
1990 1980 1960

Proceedings of the National Conference on
Trends and Advances in Mechanical Engineering
(TAME-2017) March 16-17, 2017 ISBN 978-93-5268-269-0
YMCA University of Science & Technology, Faridabad, Haryana
282
conditions by means of computers, industrial robots and automation through the creation of direct information
routes between design and production by means of data- processing techniques, and by chosing equipment and
structuring production system in the right way.
In the present environment, it becomes essential to optimise flexibility and productivity. Short term flexibility
has ability to adopt changes in existing product profile and long term flexibility requires additional ability to
adopt new products. These objectives can be best achieved through ‘Flexible Automation’ which offers rapid
response to product innovation, process innovation and shifts in demand. Flexible automation is much more cost
effective than fixed automation for high variety production requirements.
There are two primary forces viz: Technology Push and Competitive Pull, driving a change in the way the
manufacturers approach product innovation and product development. Whereas technology push is result of
successful task automation by virtue of increase in availability and decrease in the cost of flexible automation
technology, competitive pull is the outcome of change of external conditions.
The combination of technology push and competitive pull results in a new approach to effective manufacturing
through flexible automation, Fig. 2.
Fig. 2. Drivers to new approach to flexible automation
5. Flexible Manufacturing Systems
5.1 Definitions of FMS
Flexible manufacturing System is an emergent technology which is appropriate for mid-variety, mid-
volume type of production and comprises of multipurpose NC machines (Dixit and Raj, 2016).
A flexible manufacturing system is an integrated computer controlled complex of automated material
handling devices and computer controlled machine tools that can simultaneously process medium sized
volumes of a variety of part types (Stecke, 1983).
A technology which will help achieve leaner factories with better response times, lower unit costs and
higher quality under an improved level of management and capital control (Mortimer, 1984).
Flexible Manufacturing is a system which combines micro electronics and mechanical engineering to
bring economics of sale to batch work (Department of trade and industry, UK)
A central on line computer controls the machine tools and other work stations and the transfer of components
and tooling. The computer also provides monitoring and information control. This combination of flexibility and
overall control makes possible the production of a wide range of products in small numbers. Fig. 3, shows the
suitability and application of FMS vis a vis other manufacturing systems like transfer lines, dedicated systems,
etc.
Network Technology
Information Management
Automation Tools
Faster Computers
Hi-Tech Facilities
Intense Competition
Compressed Product Life
Cycles
Quality Demands
Market Segmentation
Declining Profit Margin
Industry
Technology Push
Enabling Technology Market Requirements
New Approach to Flexible Automation
Competitive Pull

Proceedings of the National Conference on
Trends and Advances in Mechanical Engineering
(TAME-2017) March 16-17, 2017 ISBN 978-93-5268-269-0
YMCA University of Science & Technology, Faridabad, Haryana
283
Fig. 3. Spectrum of Manufacturing Systems
5.2. Benefits of FMS
An FMS plant is able to accept random components and to work them up. The system’s computer keeps track of
tools, fixtures, handling and control systems, and also controls the manufacturing sequence to be followed. By
working with the layout and control of the flow of materials, which enable components to be finished in a singe
sequence, and by delivering the required components at the right moment, the detailed study of a plant based on
FMS brings following encouraging results (Groover, 2008):
Quicker response to the market changes
Shorter delivery times
Saving in material cost
Reduction in work-in—process
Reduction in lead time
Increase in machine utilisation
Reduction in floor space
Reduction in unit cost
Increase in machine utilisation
Unmanned operations in third shift
Reduced setting up time
Standardisation of technology
Starting of Computer Integrated Manufacturing
5.3. Components of FMS
The building blocks of an FMS system, are Machining System Block (MSB), Workpiece Handling Block
(WHB), Tool Handling Block (THB) and Computer Control Block (CCB), fig. 4. There has to be compatibility
between the four blocks for building an FMS. This implies that it should be possible to interface all the blocks
for an integrated computer control of all the automated functions (Kundra, 1998).
Transfer Lines
Dedicated
Systems
Flexible
Manufacturing
Systems
Manufacturing
Cell
Volume
HIGH
MEDIUM
LOW
Stand Alone
CNCs
Variety
LOW MEDIUM HIGH
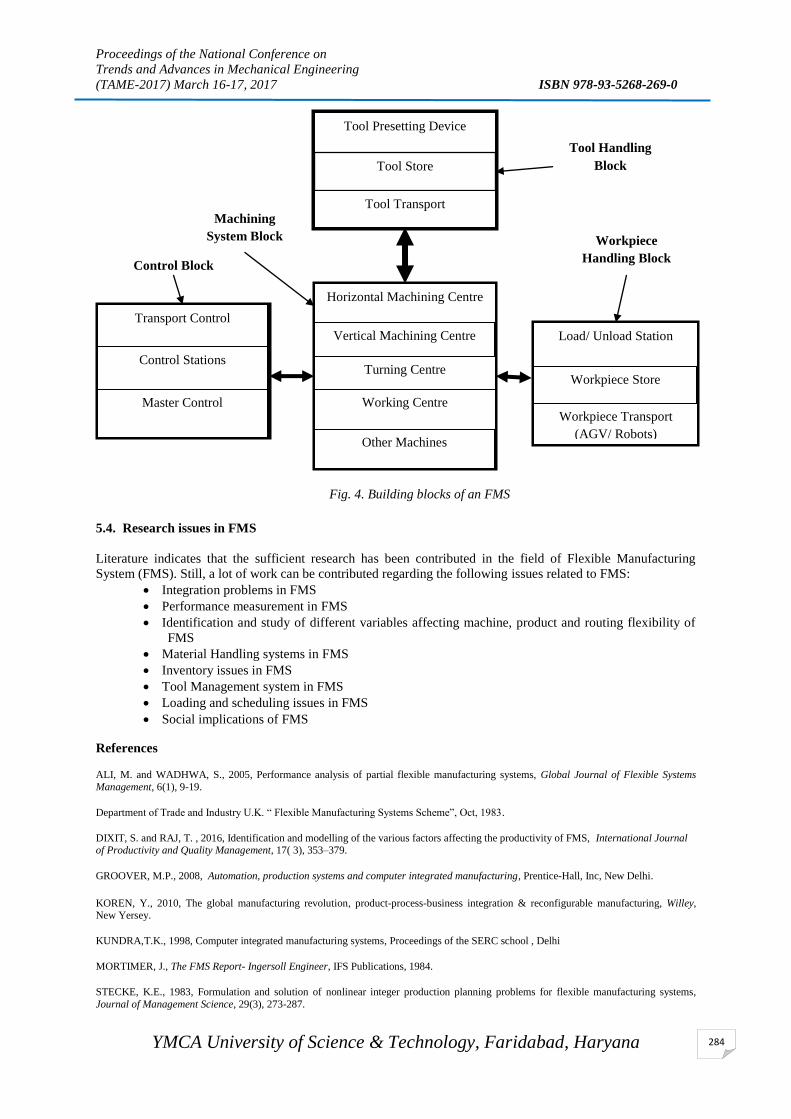
Proceedings of the National Conference on
Trends and Advances in Mechanical Engineering
(TAME-2017) March 16-17, 2017 ISBN 978-93-5268-269-0
YMCA University of Science & Technology, Faridabad, Haryana
284
Fig. 4. Building blocks of an FMS
5.4. Research issues in FMS
Literature indicates that the sufficient research has been contributed in the field of Flexible Manufacturing
System (FMS). Still, a lot of work can be contributed regarding the following issues related to FMS:
Integration problems in FMS
Performance measurement in FMS
Identification and study of different variables affecting machine, product and routing flexibility of
FMS
Material Handling systems in FMS
Inventory issues in FMS
Tool Management system in FMS
Loading and scheduling issues in FMS
Social implications of FMS
References
ALI, M. and WADHWA, S., 2005, Performance analysis of partial flexible manufacturing systems, Global Journal of Flexible Systems
Management, 6(1), 9-19.
Department of Trade and Industry U.K. “ Flexible Manufacturing Systems Scheme”, Oct, 1983.
DIXIT, S. and RAJ, T. , 2016, Identification and modelling of the various factors affecting the productivity of FMS, International Journal of Productivity and Quality Management, 17( 3), 353–379.
GROOVER, M.P., 2008, Automation, production systems and computer integrated manufacturing, Prentice-Hall, Inc, New Delhi.
KOREN, Y., 2010, The global manufacturing revolution, product-process-business integration & reconfigurable manufacturing, Willey, New Yersey.
KUNDRA,T.K., 1998, Computer integrated manufacturing systems, Proceedings of the SERC school , Delhi
MORTIMER, J., The FMS Report- Ingersoll Engineer, IFS Publications, 1984.
STECKE, K.E., 1983, Formulation and solution of nonlinear integer production planning problems for flexible manufacturing systems,
Journal of Management Science, 29(3), 273-287.
Tool Presetting Device
Tool Store
Tool Transport
Horizontal Machining Centre
Turning Centre
Working Centre Workpiece Transport
(AGV/ Robots)
Load/ Unload Station
Master Control
Control Stations
Transport Control
Tool Handling
Block
Workpiece
Handling Block
Machining
System Block
Control Block
Vertical Machining Centre
Other Machines
Workpiece Store

Proceedings of the National Conference on
Trends and Advances in Mechanical Engineering
(TAME-2017) March 16-17, 2017 ISBN 978-93-5268-269-0
YMCA University of Science & Technology, Faridabad, Haryana
285
Study of Various Flexibilities in a Flexible Manufacturing system
Mohit Yadav1 and Sandhya Dixit
2
M.Tech. Research Scholar1, Asst. Prof.
2, Department of Mechanical Engineering, YMCA University of Science
& Technology, Faridabad, 121006, India. e-mail: [email protected]
Abstract
Global, flicking market requirements and modern life trends have put up tremendous challenges in
manufacturing industries. FMS helps different organizations to compete with global industries by adapting such
system over conventional system. Industries are trying to adapt different methodologies for risk management &
protection. Through this paper an attempt has been made to study the Various Flexibilities in a Flexible
Manufacturing system. Better knowledge of these flexibilities and their modeling is the most significant for
applying FMS in different sectors. Usually industries do not want to adapt this high tech manufacturing system
due to its high implementation cost. So before opting for such technology different flexibilities must be examined
and this will help them to differentiate the flexibilities which affect a FMS the most and must be adapted by the
industry. Those effects which have higher power must need special attention than others. In the present work,
various flexibilities affecting a FMS have been recognized through literature study.
Keywords: Manufacturing system, Flexible Manufacturing System and Flexibilities.
1. INTRODUCTION
In today's competitive global market, manufacturers have to modify their operations to ensure a better and faster
response to needs of customers.[9] The primary goal of any manufacturing industry is to achieve a high level of
productivity and flexibility which can only be done in a computer integrated manufacturing environment. A
flexible manufacturing system (FMS) is an integrated computer-controlled configuration in which there is some
amount of flexibility that allows the system to react in the case of changes, whether predicted or unpredicted.
FMS consists of three main systems. The work machines which are often automated CNC machines are
connected by a material handling system(MHS) to optimize parts flow and the central control computer which
controls material movements and machine flow. An FMS is modeled as a collection of workstations and
automated guided vehicles (AGV). It is designed to increase system utilization and throughput of system and for
reducing average work in process inventories and many factors affects both system utilization and throughput of
system.
2. LITERATURE SURVEY
Today the dynamic production needs and Operation are addressed by a FMS system Comprises of automated
machines and MHS with a single control system. This FMS system enables manufacturers to deal with different
parts and product designs. The term flexible manufacturing system, or FMS, refers to a highly automated GT
machine cell, consisting of a group of computer numerical control (CNC) machine tools and supporting
workstations, interconnected by an automated material handling and storage system and all controlled by a
distributed computer system.[9]
FMS differs from the conventional systems in terms of flexibility in the flow of materials from one tool to
another and performing the operations as per the required sequence. Each part can follow a variable route
through the system.
FMS system is a good combination of variety and productivity because for any product customer demand and
features changes time to time. This system is considered to be much flexible to work in small batches and
customer demand. This FMS system is so complex that it is difficult to calculate the performance variable
accurately. To save time, cost, resources different modeling technique are used for complex FMS system.
Proceedings of the National Conference on
Trends and Advances in Mechanical Engineering
(TAME-2017) March 16-17, 2017 ISBN 978-93-5268-269-0
YMCA University of Science & Technology, Faridabad, Haryana
286
In this FMS system the flexibility for different products has given more importance than the system
efficiency.[9] This FMS system has been developed to maintain a proper balance between standardization and
flexibility of manufacturing. In an industry development of new production line is a very big investment. So, the
exiting production line must be much flexible to keep up with numbers of new designs.
2.1 LIST OF RESEARCH PAPERS
Here is the literature review of some of the research papers
Agarwal, A et al.(2006) mainly discussed about the literature related to interpretive Structural modeling (ISM)
and its deployment for modeling variables of supply management (SCM).This paper provides some
comprehensive base for improving the performance of the supply chain.
A.K. Digalwar et al. (2015) use an ISM approach in an automobile industry. The present paper discusses most
critical factors for the promotion and development of EV market in India with the help of an Interpretive
Structural Model (ISM).
Kumar, S et. al. (2014) provides a list of social implications of FMS implementation and modeled them using
ISM approach, ISM technique has been used in finding the mutual relations of these social implications by
developing a frame work model. This ISM model may be utilized to identify the key social implications which
will be helpful in the area of FMS.
Rajesh, P et al. (2015) developed a framework for the implementation of World-class Maintenance Systems
(WMS) with the help of Interpretive Structural Modeling (ISM) methodology.
Nagar, B et al. (2012) presents research focuses to identify various risks that could influence the implementation
of (advanced manufacturing technologies) AMTs, and develop a framework to mitigate them. In this paper
interpretive structural modeling (ISM) has been used to depict the relationship and priority among the various
risks.
Attri, R et al (2013) discussed the key concept of ISM approach in detail.
Kumar N et al. (2013) developed structural model of the variables, important to Lean Manufacturing System in
Indian automobile industry. The structured model in this paper will help to understand interdependence of the
variables of lean manufacturing.
Sohani, N. et al. (2012) developed a model for quality framework in Higher Education in India using ISM
methodology. This ISM technique helps prioritize the strategic issues in quality assessment qualitatively, so as
to propose a hierarchical structure through prioritizing, sequencing and categorizing of ideas.
Panday, R et al. (2016) evaluate the performance of a flexible manufacturing system (FMS) in a manufacturing
industry. In this paper, authors have made an attempt to overcome the impact of uncertainties such as machine
breakdowns, deadlocks, system implementation.
Kahtani, M et al. (2014) evaluate the effect of different input factors, including layout, MHS configuration on
FMS performance measured by total production cost , total flow time and throughput . It analyse the cost benefit
between various layouts with a hypothetical case.
Kumar, B et al. (2015) measures & analyse the performance measure of FMS using Flexsim Software. Also
Bottleneck technique is also applied for verification & comparison of the simulation result..
An FMS consist of a no of
• Machine tools

Proceedings of the National Conference on
Trends and Advances in Mechanical Engineering
(TAME-2017) March 16-17, 2017 ISBN 978-93-5268-269-0
YMCA University of Science & Technology, Faridabad, Haryana
287
• Robot, AGVs, MHS
• Storage system and computers
A complete FMS system should be flexible enough to accept the changing market conditions without human
involvement and without any investment. The word 'Flexible' explains the flexibility of process, product,
machines and production.
There are many barriers which not only affect the implementation process but also affect each other.
International competition is making the manufacturing organizations to implement the flexible manufacturing
process which are not affected by uncertain market change and these uncertain market changes are-
High quality & low cost
Life cycle of the product
Competitors
Advancement in technology
Along with the above market changes there are some non-price factors such as [19]-
• Environment friendly
• Service (after)
• Innovation (new ideas)
• Better design
Previously used manufacturing processes cannot stand with present market situation because those processes
were very costly and time consuming in changing the whole production line. FMS is the best answer for these
types of factors.
This FMS system is also a solution for problems in discrete
• High inventory level
• Long lead time
• Low efficiency
So FMS can easily adjust with the part (Variety & Volume) which comes into light during change in market
demand.
FMS is capable of processing a variety of parts types simultaneously in different part volume and random order.
This feature of this FMS system make it especially applicable for batch Production activities. When we are
talking about FMS it is useful to also talk about the new generation manufacturing system. This new system is
called “Intelligent manufacturing system” [8] IMS which includes use of
Seniors and controllers
Designing software (CAD,CAM,CAPP)
CNC,NC,DNC system
CMM system
In any FMS system there are generally five steps that needs to be integrated-
1. Storage (finished, Semi finished, Raw material)
2. Transport (In between machines)
Proceedings of the National Conference on
Trends and Advances in Mechanical Engineering
(TAME-2017) March 16-17, 2017 ISBN 978-93-5268-269-0
YMCA University of Science & Technology, Faridabad, Haryana
288
3. Manufacturing (Semi finished product to finished product)
4. Assembly (one final product)
5. Shipping (Dispatching)
3. PROBLEM STATEMENT
Several authors (Sethi and Sethi 1990; Groover 2006; Stecke et al. 1983) carried out an extensive survey of the
literature on flexibility in manufacturing and identified varying types of flexibility and at least 50 different terms
describing these varying types. These definitions are essentially in agreement with (Browne et al. 1984).
According to the group of experts 15 flexibilities were taken and these are defined as given below:[1][11]
1. Machine flexibility is the ability to create different product types or change the order in how processes are
operated. It is defined as the capability to adapt a given machine (Workstation) in the system to a wide range of
production operations and part styles. The greater the range of operations and part styles, the greater the
machine flexibility.
2. Volume flexibility the ease to profitably increase or decrease the output of an existing system. At firm level, it
is the ability of a firm to operate profitably at different output levels. The ability to economically produce parts
in high and low total quantities of production, given the fixed investment in the system. A higher level of
automation increases this flexibility, partly as a result of both lower machine setup costs and lower variable
costs.
3. Operation flexibility the ability of a part to be produced in different ways, i.e. a number of alternative
processes or ways in which a part can be produced within the system.
4. Product flexibility the ability to change over to produce a new product very economically and quickly.
Product flexibility relates to the east of new-product introduction and product modification. It is the ability to
add new products in the system.
5. Routing flexibility the different routes (through machines and workshops) that can be used to produce a
product in the system. It the capacity to produce parts through alternative work station sequences in response to
equipment breakdowns, tool failures, and other interruptions at individual stations. The ability to produce a part
using different process routes.
6. Material handling flexibility the ability of the material handling system to move different parts efficiently
throughout the manufacturing system.
7. Process flexibility a measure of the volume of the set of part types that a system can produce without
incurring any setup. The ability to produce a given set of part types, each possibly using different material, in
several ways. Process flexibility as the machine setup costs decrease.
8. Expansion flexibility the ability to build a system and expand it incrementally. The ease with which the
system can be expanded to increase total production quantities and capability to expand volumes as needed.
9. Market flexibility the ability of a system to efficiently adapt to changing market conditions. The ease, in
terms of time or cost with which changes can be made within the capability envelope, i.e. long-term flexibility.
10. Program flexibility the ability of a system to run for reasonably long periods without external intervention.
The ability of a system to operate unattended for additional shifts or the length of time the system can operate
unattended.

Proceedings of the National Conference on
Trends and Advances in Mechanical Engineering
(TAME-2017) March 16-17, 2017 ISBN 978-93-5268-269-0
YMCA University of Science & Technology, Faridabad, Haryana
289
11. Production flexibility the volume of the set of part types that a system can produce without major investment
in capital equipment. The range or universe of part types that can be produced without the need to purchase new
equipment. The range of part types that the FMS can produce. This flexibility is measured by the level of
existing technology.
12. Size flexibility the component sizes that can be manufactured without requiring setups that take longer than a
specific time period.
13. Product mix flexibility mix flexibility is the ability to change the relative proportions of different products
within an aggregate output level. The total envelope of capability or range of states which the manufacturing
system is capable of achieving, i.e. short-term flexibility.
14. Response flexibility the ease, in terms of time and/or cost, with which changes can be made within the
capability envelope, i.e. long-term flexibility.
15. Range flexibility the total envelope of capability or range of states which the manufacturing system is
capable of achieving, i.e. short-term flexibility.
Based on the literature review and discussions with the group of experts 10 factors were identified (Raj et al.
2012; Sujono and Lashkari 2007; Bayazit 2005; Groover 2006; Primrose 1996; Kaighobadi and Venkatesh
1994). These factors are considered as attributes in MADM. Descriptions of these factors are given
below:[1][11]
1. A variety of products can be manufactured flexibility of any production system is directly linked with the
variety of products to be manufactured in that production system. More is the variety of products to be handled
by a particular production system; more will be its flexibility.
2. Flexibility of fixtures FMS is meant for handling a variety of work part configurations. For prismatic parts,
this is usually accomplished by using modular pallet fixtures in the handling system (Groover 2006).
3. Better machine utilization it is one of the main sources of inspiration for achieving more flexibility because
with a variety of parts being machined flexibility will be enhanced. FMSs achieve a higher average utilization
than a machine in a conventional batch production machine shop.
4. New product handling capacity flexibility of a particular manufacturing system would be more if it is capable
of handling the more number of new and unexpected products.
5. Response speed a FMS improves response capability to part design changes, introduction of new parts, and
changes in the production schedule; machine breakdowns and cutting tool failures.
6. Automation it reduces the human efforts and introduces some flexibility in the manufacturing system. For
example, the use of CNC machines with the help of which human efforts can be reduced, and flexibility of the
production system is enhanced.
7. Minimization of scrap it involves the use of special-purpose equipment designed to perform one operation
with the greatest possible efficiency to reduce scrap. Use of CNC machines and computer control systems has
resulted in reduction of scrap.
8. Design flexibility of the production system Bayazit (2005) had discussed that maximum utilization of
equipment for job shop and medium-volume situations can be achieved by using the same equipment for a
variety of parts or products.

Proceedings of the National Conference on
Trends and Advances in Mechanical Engineering
(TAME-2017) March 16-17, 2017 ISBN 978-93-5268-269-0
YMCA University of Science & Technology, Faridabad, Haryana
290
9. Reduction in material flow Bayazit (2005) had found that FMS reduced non-productive time with the use of
automated material handling and storage system. Reduction in material flow also aids in the improvement of
routing flexibility of the system.
10. Combined multi operation Groover (2006) has discussed that production occurs as a sequence of operations.
Complex parts may require dozens, or even hundreds, of processing steps. The strategy of combined operation
involves performing two or more machining operations with one cutting tool.
4. Conclusion
In this paper an attempt has been made to identify and define the various types of flexibilities in a flexible
manufacturing system. These flexibilities are further studied and their governing factors are identified. A total of
10 factors are identified which affects the various flexibilities in FMS. All these factors are discussed briefly in
this paper.
This work can be extended by analysing these factors qualitatively as well as quantitatively using MADM
technique like ISM & GT.
References
1. Jain, V., Raj, T. (2013) ‘Ranking of flexibility in flexible manufacturing system by using a combined multiple
attribute decision making method’ Global journal of flexible system management, Vol. 14, No. 3, pp. 125-141.
2. Raj, T., Shankar, R., Suhaib, M. and Khan, R. (2007) ‘Some dimensions of flexibilities in FMS’, Proceedings
of GLOGIFT, Vol. 7, pp.328-334.
3. Attri, R., Grover, S., Dev, N. and Kumar, D. (2013) ‘Analysis of barriers of total productive maintenance
(TPM), International Journal of Systems Assurance Engineering and Management, Vol. 4, pp. 365-377.
4. Raj, T., Shankar, R., Suhaib, M.(2007) ‘A review of some issues and identification of some barriers in the
implementation of FMS’ International Journal of Flexible Manufacturing System, Vol. 19,No. 1, pp. 1-40.
5. Raj, T., Attri, R., Jain, V.(2012) ‘Modelling the factors affecting flexibility in FMS’ International Journal of
Industrial and Systems Engineering, Vol. 11, No. 4, pp. 350-374.
6. Panday, R., Sharma, N. and Singh, A. Tomar (2016), ‘Performance Evaluation of Flexible Manufacturing
System (FMS)in Manufacturing Industries’, Imperial Journal of Interdisciplinary Research (IJIR), Vol. 2, No.
3.
7. Nirmal, N., Dahiya, N., ‘Material Handling in Flexible Manufacturing System’, International Journal of
Computer Science and Management Studies, Vol. 11, pp 40-44.
8. Singh, M.D., Shankar, R., Narain, R. and Agarwal, A. (2003) ‘An interpretive structural modelling of
knowledge management in engineering industries’, Journal of Advance Management Resources, Vol. 1, No. 1,
pp. 28-40.
9. Liorens, J.F, Molinaa, L.M. and Verdu, A.J. (2005) ‘Flexibility of Manufacturing System, Strategic Changes
and Performance’, International Journal Production Economics, Vol. 98, No. 3, pp. 273-289.
10. P. Groover book named ‘Automation, Production System and Computer Integrated Manufacturing’,
published in 1980-2007, ISBN.01323932112.
11. https://www.uky.edu/~dsianita/611/fms.html
12. http://www.ignou.ac.in/upload/UNIT6-55.pdf
Proceedings of the National Conference on
Trends and Advances in Mechanical Engineering
(TAME-2017) March 16-17, 2017 ISBN 978-93-5268-269-0
YMCA University of Science & Technology, Faridabad, Haryana
291
SELECTION OF APPROPRIATE LEAN MANUFACTURING
STRATEGIES FOR DIFFERENT LEAN WASTES: A LITERATURE
STUDY
Virender Chahal1 and Dr. M.S. Narwal
2
([email protected] and [email protected])
1.Research Scholar Department of Mechanical Engineering, Deenbandhu Chhotu Ram University of Science
and Technology, Sonipat, Haryana, India
2. Associate professor, Department of Mechanical Engineering , Deenbandhu Chhotu Ram University of
Science and Technology, Sonipat, Haryana, India
Abstract
The objective of this paper is to provide appropriate lean strategies for selected lean waste. In present scenario,
lean is very vast area. When going to implement; there is major questions i.e. which lean strategy is good for
identified waste? Lean is used is a primary tool to eliminate different types of lean wastes. So this paper will
focus on how can made a relation between lean strategies and lean waste. This paper will also helps for
industries to selected appropriate lean manufacturing strategy for respective lean waste. This is not an old
theory for industries but every developing industry want profit in this competitive environment. So this paper
helps to find appropriate lean manufacturing strategy. Method: Some lean manufacturing papers and lean
waste will selected from literature and a correlation matrix will be generated between lean manufacturing
strategies and different lean waste for industry. This is a theoretical concept and can be used as practically.
Keywords: Lean manufacturing strategies, Lean waste, Lean correlation sheet
1. Introduction
The Lean Manufacturing moves toward eliminate lean waste i.e. in form of value added waste and non-value
waste. Lean Manufacturing is not only for industry but can be used anywhere in any area. Lean Manufacturing
strategies are comprehensive for every worker and for any management to change in the working environment
in industry. At present scenario, competition is very high around the world and every industry is trying to give
better product to customers in reasonable price, so lean is only option here. Implementation of lean
manufacturing provides very good improve in productivity and customer satisfaction (Seth & Gupta, 2005).
When World War 2 finished, it was a development of lean manufacturing in auto industry. There were fewer
resources for development so it was needed to develop better approach to solve it. In Toyota motor company,
Eiji toyoda and Taiichi ohno develop a concept of “Toyota Production System”, and today known as “Lean
Manufacturing.
2. Literature Review
Roos (1991) explained that lean manufacturing is the best way to minimize the different lean wastes. It showed
the different benefits and parameter for lean manufacturing. Lean manufacturing is a wide thinking to provide
better efficiency. Lean manufacturing is a new concept to provide high production rate and customer satisfaction
in available resources (Singh et al., 2010). Hayes and Pisano (1994) also provided the new innovative term i.e.
lean means less of everything to develop a new product and new service environment. Lean manufacturing is an
efficient tool to improve product quality and high production flow. It also control inventory and process (Seth &
Gupta, 2005). Womack and Jones (1994) said the lean manufacturing system is a tool to understand the
relationships between manufacturers and their way to work to provide good customer satisfaction. Shah and
Ward (2003) showed lean manufacturing as a main management integrated approach to implement good
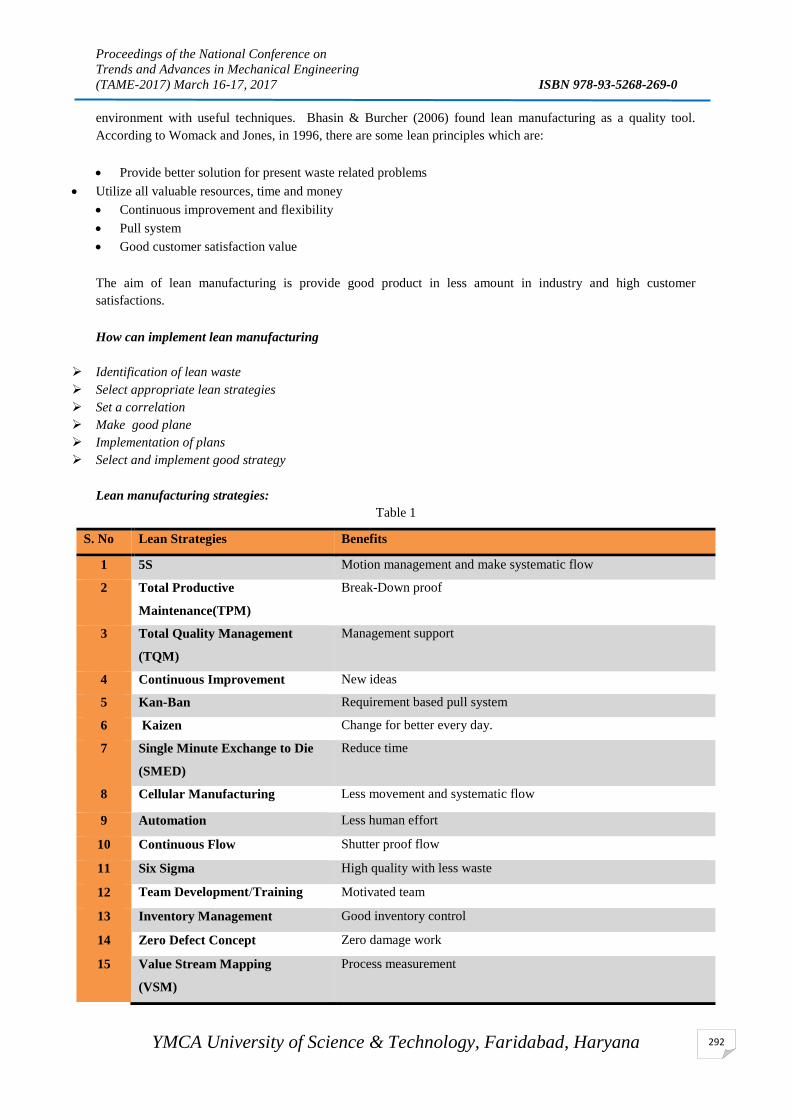
Proceedings of the National Conference on
Trends and Advances in Mechanical Engineering
(TAME-2017) March 16-17, 2017 ISBN 978-93-5268-269-0
YMCA University of Science & Technology, Faridabad, Haryana
292
environment with useful techniques. Bhasin & Burcher (2006) found lean manufacturing as a quality tool.
According to Womack and Jones, in 1996, there are some lean principles which are:
Provide better solution for present waste related problems
Utilize all valuable resources, time and money
Continuous improvement and flexibility
Pull system
Good customer satisfaction value
The aim of lean manufacturing is provide good product in less amount in industry and high customer
satisfactions.
How can implement lean manufacturing
Identification of lean waste
Select appropriate lean strategies
Set a correlation
Make good plane
Implementation of plans
Select and implement good strategy
Lean manufacturing strategies:
Table 1
S. No Lean Strategies Benefits
1 5S Motion management and make systematic flow
2 Total Productive
Maintenance(TPM)
Break-Down proof
3 Total Quality Management
(TQM)
Management support
4 Continuous Improvement New ideas
5 Kan-Ban Requirement based pull system
6 Kaizen Change for better every day.
7 Single Minute Exchange to Die
(SMED)
Reduce time
8 Cellular Manufacturing Less movement and systematic flow
9 Automation Less human effort
10 Continuous Flow Shutter proof flow
11 Six Sigma High quality with less waste
12 Team Development/Training Motivated team
13 Inventory Management Good inventory control
14 Zero Defect Concept Zero damage work
15 Value Stream Mapping
(VSM)
Process measurement

Proceedings of the National Conference on
Trends and Advances in Mechanical Engineering
(TAME-2017) March 16-17, 2017 ISBN 978-93-5268-269-0
YMCA University of Science & Technology, Faridabad, Haryana
293
16 Visual Management Visual measurement
17 Work Standardization All thing in standard
18 Flexible manufacturing System
(FMS)
Flexible system
19 Production leveling Reduce roughness
20 WIP (Work in Process) Less work in process
21 Lean Thinking New innovations
Lean wastes:
Table 2
Lean waste Introduction of waste
Overproduction Extra production without demand
Inappropriate processing Extra processing due to incorrect action
Excessive inventory Unrequited stock
Unnecessary motion Worker extra motion
Defects Damage in work
Waiting Waiting for action command or material etc.
Transportation Extra motion on shop floor
Workforce Extra work load
Worker Fatigue Worker uncomfortable during work
Work In Progress Extra work demanded in final process
Process Fail Flaws in process
3. Problem Identification
After study the literature of lean manufacturing strategies and lean waste, it found that there is a lack of model to
select appropriate lean manufacturing strategy for respective waste. According to Roslin et al. (2014), it is easy
to say that lean can be easily implemented anywhere but in practical, it is not easy.So this paper focuses on this
problem solution. It is clear that every lean strategy is used to eliminate different types of waste/wastes but
which one is more appropriate, it’s not clear. So this relationship model will provide help to solve it.
4. Methodology
This research paper work is based on study and analysis of literature review of lean manufacturing, lean
manufacturing strategies and different lean waste. In this paper, there is a collection of different papers related to
lean manufacturing strategies and lean waste. After collection of these papers, they shorted according to the lean
manufacturing strategies used and lean waste discussed. This data will be in tabular form according to the year
of publication. Then study will be held and a correlation model will be generated. This correlation will help to
select appropriate lean manufacturing strategies.

Proceedings of the National Conference on
Trends and Advances in Mechanical Engineering
(TAME-2017) March 16-17, 2017 ISBN 978-93-5268-269-0
YMCA University of Science & Technology, Faridabad, Haryana
294
Figure 1 Research Methodology
5. Result
This paper finds the some relationship between lean manufacturing strategies and lean waste. All the results are
given in table no.3. As shown in table no.3, there are four option filled.
Table 3
They are: Highly used (H), Medium used (M), Less used (L) and Not Used (N). All these columns are filled as
per literature study of lean manufacturing strategies and lean waste. After that, we consider the highly used lean
manufacturing strategies noted by “1” in table no.4. Now it can be verified by practically survey of different
industries for better understanding. All strategies are in a strong relationship with given lean waste. During the
study, some lean strategies might be left due to related impact by other lean manufacturing strategies.
Table 4
Study the literature about lean manufacturing strategies
Study the literature about lean waste
Select lean manufacturing strategies with respective waste
Make criteria to generate lean manufacturing strategies correlation with lean waste
Make a correlation matrix sheet
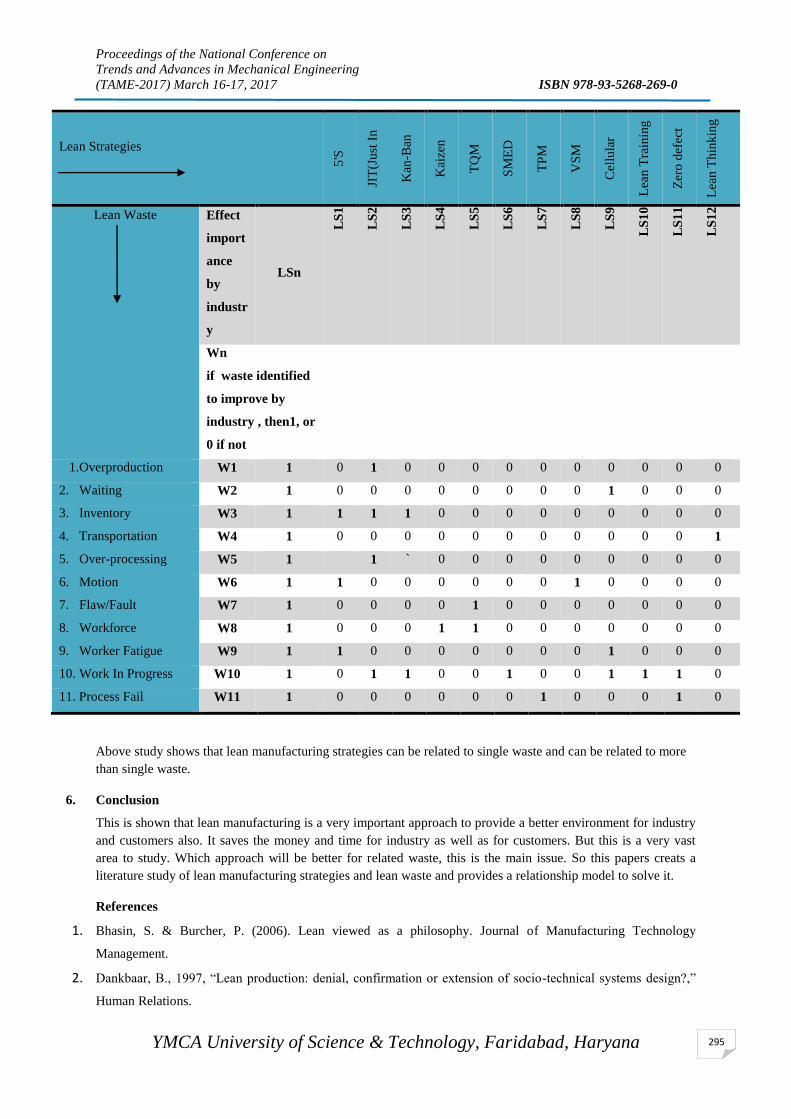
Proceedings of the National Conference on
Trends and Advances in Mechanical Engineering
(TAME-2017) March 16-17, 2017 ISBN 978-93-5268-269-0
YMCA University of Science & Technology, Faridabad, Haryana
295
Lean Strategies
5'S
JIT
(Ju
st I
n
Tim
e)
Kan
-Ban
Kai
zen
TQ
M
SM
ED
TP
M
VS
M
Cel
lula
r
Man
ufa
ctu
ring
L
ean
Tra
inin
g
Zer
o d
efec
t
con
cep
t L
ean
Th
ink
ing
Lean Waste
Effect
import
ance
by
industr
y
LSn
LS
1
LS
2
LS
3
LS
4
LS
5
LS
6
LS
7
LS
8
LS
9
LS
10
LS
11
LS
12
Wn
if waste identified
to improve by
industry , then1, or
0 if not
1.Overproduction W1 1 0 1 0 0 0 0 0 0 0 0 0 0
2. Waiting W2 1 0 0 0 0 0 0 0 0 1 0 0 0
3. Inventory W3 1 1 1 1 0 0 0 0 0 0 0 0 0
4. Transportation W4 1 0 0 0 0 0 0 0 0 0 0 0 1
5. Over-processing W5 1 1 ` 0 0 0 0 0 0 0 0 0
6. Motion W6 1 1 0 0 0 0 0 0 1 0 0 0 0
7. Flaw/Fault W7 1 0 0 0 0 1 0 0 0 0 0 0 0
8. Workforce W8 1 0 0 0 1 1 0 0 0 0 0 0 0
9. Worker Fatigue W9 1 1 0 0 0 0 0 0 0 1 0 0 0
10. Work In Progress W10 1 0 1 1 0 0 1 0 0 1 1 1 0
11. Process Fail W11 1 0 0 0 0 0 0 1 0 0 0 1 0
Above study shows that lean manufacturing strategies can be related to single waste and can be related to more
than single waste.
6. Conclusion
This is shown that lean manufacturing is a very important approach to provide a better environment for industry
and customers also. It saves the money and time for industry as well as for customers. But this is a very vast
area to study. Which approach will be better for related waste, this is the main issue. So this papers creats a
literature study of lean manufacturing strategies and lean waste and provides a relationship model to solve it.
References
1. Bhasin, S. & Burcher, P. (2006). Lean viewed as a philosophy. Journal of Manufacturing Technology
Management.
2. Dankbaar, B., 1997, “Lean production: denial, confirmation or extension of socio-technical systems design?,”
Human Relations.
Proceedings of the National Conference on
Trends and Advances in Mechanical Engineering
(TAME-2017) March 16-17, 2017 ISBN 978-93-5268-269-0
YMCA University of Science & Technology, Faridabad, Haryana
296
3. Hayes, R.H. and Pisano, G.P., 1994. “Beyond world class: the new manufacturing strategy”, Harvard Business
Review.
4. Roslin, E. N., Shamsuddin, A., & Dawal, S. Z. M. (2014). Discovering Barriers of Lean Manufacturing System
Implementation in Malaysian Automotive Industry. In Advanced Materials Research (Vol. 845, pp. 687-691).
Trans Tech Publications.
5. Singh, B., Garg, S. K., & Sharma, S. K. (2010). Development of index for measuring leanness: study of an
Indian auto component industry. Measuring Business Excellence, 14(2), 46–53.
http://doi.org/10.1108/13683041011047858
6. Shah, R. and Ward, P.T., 2003. “Lean manufacturing: context, practice bundles, and performance”, Journal of
Operations Management, 21(2), 129–149
7. Wilson, L. (2010) How To Implement Lean Manufacturing. New York: McGraw-Hill
8. Womack, J., Jones, D.T. and Roos, D., 1990,“The machine that changed the world,” Rawson Associates, NY.
9. Wan, H.-D., & Chen, F. F. (2008). A leanness measure of manufacturing systems for quantifying impacts of
lean initiatives. International Journal of Production Research, 4623(23), 6567–6584.
http://doi.org/10.1080/00207540802230058
10. Wong, W. P., Ignatius, J., & Soh, K. L. (2012). What is the leanness level of your organisation in lean
transformation implementation? An integrated lean index using ANP approach. Production Planning & Control,
25(4), 273–287. http://doi.org/10.1080/09537287.2012.674308

Proceedings of the National Conference on
Trends and Advances in Mechanical Engineering
(TAME-2017) March 16-17, 2017 ISBN 978-93-5268-269-0
YMCA University of Science & Technology, Faridabad, Haryana
297
SELECTION OF VENDOR IN A MANUFACTURING ORGANIZATION
USING GRAPH THEORETIC APPROACH AND ANALYTIC
HIERARCHY PROCESS
Mohit Singh, Soumil Arora
[email protected], [email protected]
Faculty, Northern India Engineering College, Delhi
ABSTRACT The aim of this paper to assess quality of vendors in a manufacturing organization by determining a single
numerical index with the help of Graph Theoretic Approach (GTA) and compare among them with the help of
Analytic Hierarchy Process (AHP). An intense literature survey is done by the authors and reviewed a good
number of papers. The factors and methodologies used by different authors are represented in the form of table.
To apply the Graph theoretic approach and Analytic Hierarchy Process the authors identified the factors and co
– factors through literature survey and determined interdependence between them. The factors are grouped
into five main factors namely Quality, Cost, Service, Financial capability, Technical & Production capability.
The GTA methodology reveals a numerical index showing the best industry and AHP determines the rating for
each vendor and compares them.
Keywords: Analytic Hierarchy Process (AHP), Graph Theoretic Approach (GTA), Vendor
1.0 INTRODUCTION
Vendor selection in a manufacturing organization is a very important activity because any wrong selection of
vendor for a manufacturing organization may lead to major loss to the organization. To choose the right vendor,
is an important evaluation, and selection problems in the purchasing function of a business. A good supplier
selection makes a significant difference to an organization’s future to reduce operational costs and improve the
quality of its end products (Chou and Chang, 2008). So to select the suitable vendor precisely, the methodology
used in this paper is very useful. In this paper AHP (Analytic Hierarchy Process) and GTA (Graph Theoretic
Approach) both are applied. Vendor selection is one of the critical factors affecting the final success. Therefore,
the vendor selection issues has been widely studied and determined as a multiple criteria decision making
(MCDM) issue (Ya-Ti Lin et. al, 2010). Researchers suggests that managing well supplier involvement can lead
to better supplier performance, improved manufacturing, and product and process advancements that in turn
enhance customer satisfaction and firm performance (Tracey and Chong Leng Tan, 2001).
There are several factors which affect the selection of vendor and on the basis of these factors best vendor can
be chosen. (Dickson, 1966) based on a survey responded by 170 purchasing manager/personnel, identified 23
vendor selection criteria used to make supplier selection decisions. This survey paper revealed that among the
23 identified vendor selection criteria quality, delivery and performance history, a parameter which also
includes quality and delivery assessment, are the leading factors of supplier evaluation and selection.
1.1 Analytical Hierarchy Process (AHP) is an approach to decision making that involves structuring multiple
choice criteria into a hierarchy, assessing the relative importance of these criteria, comparing alternatives for
each criterion, and determining an overall ranking of the alternative. The concept of AHP was developed,
amongst other theories, by Thomas Saaty, an American mathematician working at the University of Pittsburgh.
The AHP process involves four phases namely:
(1) Structuring the problem and developing the AHP model;
(2) Collecting data from survey;
(3) Determining the normalized priority weights of individual factors and co-factors;
(4) Derive solution.
1.2 The graph theoretic approach consists of three steps:
i. Digraph representation
ii. Matrix representation
iii. Permanent function representation
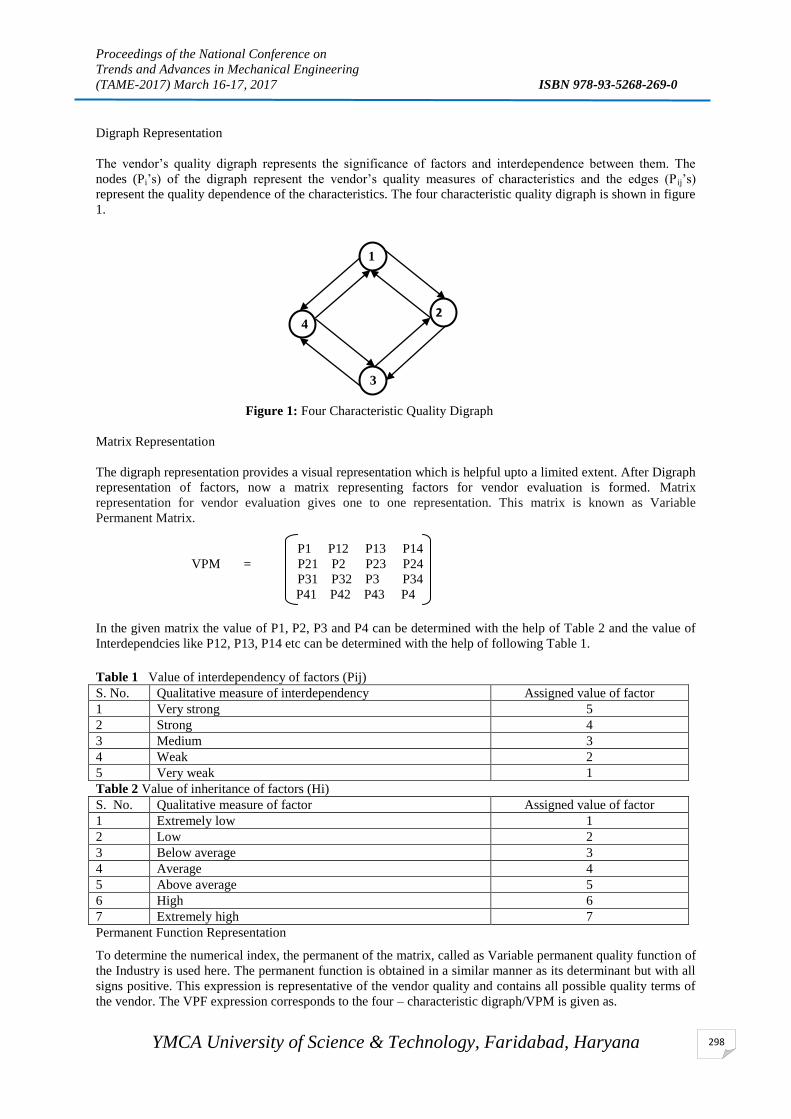
Proceedings of the National Conference on
Trends and Advances in Mechanical Engineering
(TAME-2017) March 16-17, 2017 ISBN 978-93-5268-269-0
YMCA University of Science & Technology, Faridabad, Haryana
298
Digraph Representation
The vendor’s quality digraph represents the significance of factors and interdependence between them. The
nodes (Pi’s) of the digraph represent the vendor’s quality measures of characteristics and the edges (P ij’s)
represent the quality dependence of the characteristics. The four characteristic quality digraph is shown in figure
1.
Figure 1: Four Characteristic Quality Digraph
Matrix Representation
The digraph representation provides a visual representation which is helpful upto a limited extent. After Digraph
representation of factors, now a matrix representing factors for vendor evaluation is formed. Matrix
representation for vendor evaluation gives one to one representation. This matrix is known as Variable
Permanent Matrix.
P1 P12 P13 P14
VPM = P21 P2 P23 P24
P31 P32 P3 P34
P41 P42 P43 P4
In the given matrix the value of P1, P2, P3 and P4 can be determined with the help of Table 2 and the value of
Interdependcies like P12, P13, P14 etc can be determined with the help of following Table 1.
Table 1 Value of interdependency of factors (Pij)
S. No. Qualitative measure of interdependency Assigned value of factor
1 Very strong 5
2 Strong 4
3 Medium 3
4 Weak 2
5 Very weak 1
Table 2 Value of inheritance of factors (Hi)
S. No. Qualitative measure of factor Assigned value of factor
1 Extremely low 1
2 Low 2
3 Below average 3
4 Average 4
5 Above average 5
6 High 6
7 Extremely high 7
Permanent Function Representation
To determine the numerical index, the permanent of the matrix, called as Variable permanent quality function of
the Industry is used here. The permanent function is obtained in a similar manner as its determinant but with all
signs positive. This expression is representative of the vendor quality and contains all possible quality terms of
the vendor. The VPF expression corresponds to the four – characteristic digraph/VPM is given as.
1
2
2 4
3

Proceedings of the National Conference on
Trends and Advances in Mechanical Engineering
(TAME-2017) March 16-17, 2017 ISBN 978-93-5268-269-0
YMCA University of Science & Technology, Faridabad, Haryana
299
VPF = PER – P
i j k l m
jikjlkmlimmilmkljkij
i j k l m
lkmlkmmklmkljiij
mjikjlkil
i j k l m
likljkijm
i j k l m
lkkljkij
ml
i j k l m
jikjikkljkij
mlk
i j k l m
jiiji
pppppppppppppppppp
PppppppppPpppp
PPpppppp
PPPppP5
1
2.0 Literature Review
Due to intense global competition, firms must focus on quickly and precisely responding to customer demand
and must be concerned with the customer satisfaction. These pressures prompt business enterprises to actively
invest in vendor development, and to establish a sounder strategic alliance against competitors (Chou and
Chang, 2008). Multi-criteria decision-making (MCDM) is one of the most widely used decision methodologies
in the sciences, business, government and engineering worlds. MCDM methods can help to improve the quality
of decisions by making the decision-making process more explicit, rational, and efficient (Leenders, 2001;
Wang & Triantaphyllou, 2008). The decision for choosing a vendor is highly complex and purchaser’s most
demanding responsibility. Firstly, such a decision involves more than one selection criterion to evaluate the
vendors based upon. Secondly, the involving criteria in the vendor evaluation process may frequently contradict
with each other (lowest price against poor quality). Thirdly, the complication surrounding the vendor evaluation
and selection decision usually arises from internal and external constraints imposed on the buying process,
influencing the evaluation and selection process of vendors (G.A. Montazer et al., 2009)
Based on the literature, various decision-making methods such as AHP, TOPSIS, PROMETHEE,
ELECTRE etc can be utilized during this phase (Carlsson & Fuller, 1996). Some of the major researchers who
contributed in terms of vendor selection using different techniques are mentioned below:
S.No Authors Technique Factors for vendor selection
1 Xiaojun Wang et. al,
(2012)
Fuzzy-AHP Delivery, Quality, Assurance of supply, Flexibility, Cost,
Manufacturing, Purchasing, Logistics, Marketing
2 Betty Chang et. al,
(2011)
Fuzzy DEMATEL
method
Product quality, product price, technology ability, service,
delivery performance, stable delivery of goods, lead-time,
reaction to demand change in time, production capability,
financial situation.
3 Ozcan Kilincci, Suzan
Aslı Onal, (2011)
Fuzzy - AHP Financial status, Mgmt. approach, Tech. ability, Quality
systems and process, Geographical location, Prodn.
facility and capacity, Working with Kanban approach.
4 Chin-Nung Liao and
Hsing-Pei Kao, (2011)
Fuzzy TOPSIS
and MCGP
Relationship closeness, Quality of product, Delivery
capabilities, Warranty level, Experience time.
5 Orlando Durán, (2011). Fuzzy - AHP Functionality, Flexibility, Friendliness, Implementation
Difficulties, Reputation and Stability, Good Technical
capability, Service.
6 Saman Hassanzadeh
Amin, et. al, (2011)
SWOT and
FUZZY - LP
Unit cost, Quality, Percent of on-time delivery,
Management stability, Mutual trust, Strength of
geographical location, International communication
7 D.D. Wu et. al, (2010) Fuzzy - MOLP Unit cost, accept rate, On – time rate, Economic
Environment, Vendor rating, maximum business,
minimum business.
8 I. Chamodrakas et. al,
(2010)
Fuzzy AHP Cost, quality, Delivery

Proceedings of the National Conference on
Trends and Advances in Mechanical Engineering
(TAME-2017) March 16-17, 2017 ISBN 978-93-5268-269-0
YMCA University of Science & Technology, Faridabad, Haryana
300
9 Arijit Bhattacharya,
(2010) QFD Delivery, Quality, Responsiveness, Mgmt., Discipline,
Financial position, Facility, Technical capabilities.
10 A. Amid et. al, (2009) Fuzzy – MOLP Price, Rejected items, Late deliveries,
Capacity
11 J.W. Wang et. al, (2009) Fuzzy Topsis Size, Transportation, Condition, Finance.
12 F.E. Boran et. al, (2009) Fuzzy Topsis Product quality, Relationship closeness, Delivery, Price.
13 A.F. Guneri et. al, (2009) Fuzzy Topsis Relationship closeness, Reputation and position in
industry, Performance history, Conflict resolution,
Delivery capability.
14 A.H.I. Lee, (2009) Fuzzy AHP Benefits, Opportunities, Cost, Risk
15 S. Önüt et. al, (2009) Fuzzy ANP Cost, References, Quality of the product, Delivery time,
Institutionality, Execution time (years).
16 R.H. Lin, (2009) Fuzzy ANP Quality, technique, Price, Delivery
17 F. Faez et. al, (2009) Fuzzy – Case based
reasoning
Cost, Delivery, Quality
18 Metin Dağdeviren et. al,
(2009)
AHP and TOPSIS Price, Weight, Barrel, Modularity, Usability in different
climatic conditions and maintenance, recoil.
19 Georgios N. Angelou,
(2009)
AHP strategic intangible, tactical and operation intangible , risk
mitigation intangible, financial tangible, ROs intangible,
technical.
20 S.-Y. Chou, Y.-H.
Chang, (2008)
Fuzzy - SMART Cost, Quality, Delivery, Organizational culture and
strategy, Technical capacity.
21 Jiann Liang Yang et. al,
(2008)
Fuzzy - MCDM Quality, Price and terms, Supply chain support,
Technology
22 Dog¨an Özgen et. al,
(2008)
AHP and MOPLP Delivery, Flexibility and responsiveness, Cost, Assets,
Environmental responsiveness.
23 Sung Ho Ha a, Ramayya
Krishnan, (2008) AHP, DEA and
Neural Network
Quality, Delivery, Management and Organization.
24 Victor B. Krenga,
Chao-Yi Wu, (2007)
Fuzzy - AHP Knowledge content, User interface, Site management,
Support of Vendor.
25 Huan-Jyh Shyur, Hsu-
Shih Shih, (2006)
Hybrid MCDM
On time delivery, product quality, Cost, facility and tech.,
responsiveness to customer needs, professionalism of
sales person, quality of relationship with vendor.
26 Younghwa Lee, Kenneth
A. Kozar, (2006)
AHP Information quality, Service quality, System quality,
Vendor-specific
27 E.W.T. Ngai,
E.W.C. Chan (2005) AHP Cost, Functionality, Vendor.
28 I. Erol, W.G. Ferrell,
(2003)
Fuzzy QFD Capability, Reliability, Credibility, Service.
29 Maggie C.Y. Tama,
V.M. Rao Tummala,
(2001)
AHP Quality of support services, Supplier's problem solving
capability, Supplier's expertise, Cost of support services,
Delivery lead time, Vendor's experience in related
products, Vendor's reputation.
30 S.H. Ghodsypour, C.
O’Brien, (1998)
AHP and LP Cost, Quality, Service
2.0 APPLICATION OF AHP IN VENDOR SELECTION
Identification of factors and co - factors
On the basis of intense Literature survey the factors employed for the implementation of AHP in vendor
selection are: Financial (F), Performance (P), Technology (T), Organizational culture (OC), Other factors (OF)
(Ellram,1990).
Table: 3 Factors & Co-factors affecting quality of manufacturing Industry
Factors Financial Performance Technology Organizational
culture Other factors
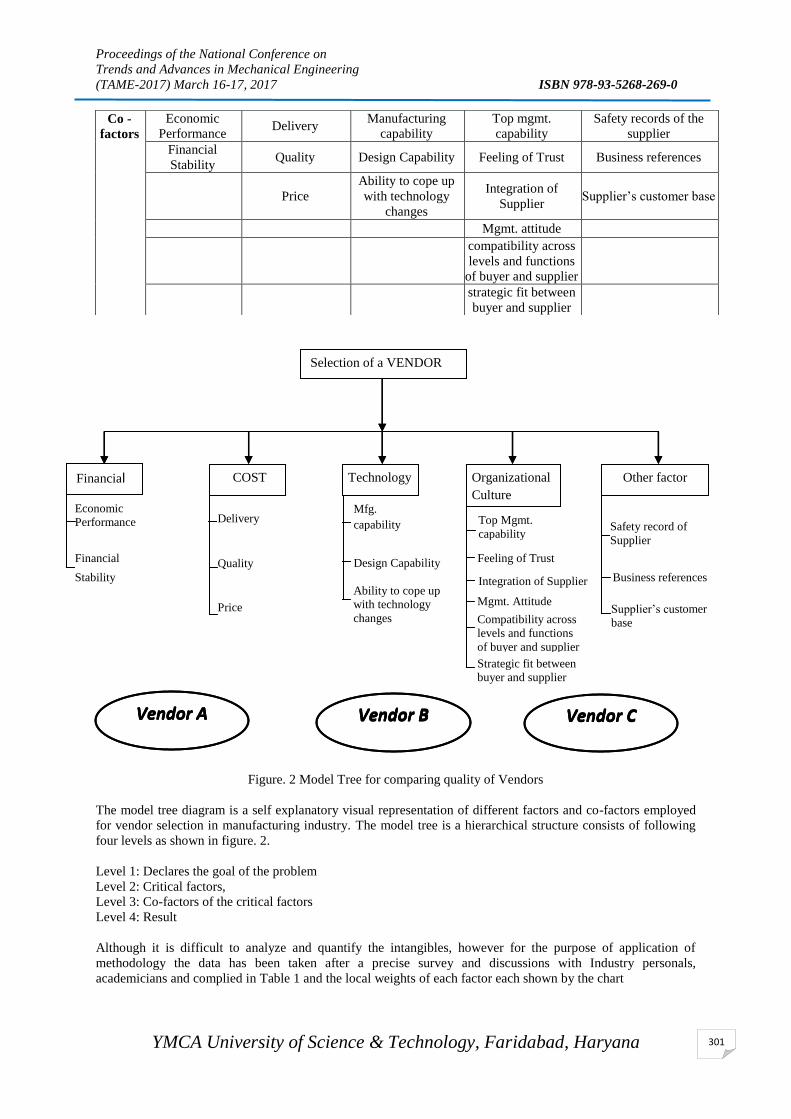
Proceedings of the National Conference on
Trends and Advances in Mechanical Engineering
(TAME-2017) March 16-17, 2017 ISBN 978-93-5268-269-0
YMCA University of Science & Technology, Faridabad, Haryana
301
e
Figure. 2 Model Tree for comparing quality of Vendors
The model tree diagram is a self explanatory visual representation of different factors and co-factors employed
for vendor selection in manufacturing industry. The model tree is a hierarchical structure consists of following
four levels as shown in figure. 2.
Level 1: Declares the goal of the problem
Level 2: Critical factors,
Level 3: Co-factors of the critical factors
Level 4: Result
Although it is difficult to analyze and quantify the intangibles, however for the purpose of application of
methodology the data has been taken after a precise survey and discussions with Industry personals,
academicians and complied in Table 1 and the local weights of each factor each shown by the chart
Co -
factors
Economic
Performance Delivery
Manufacturing
capability
Top mgmt.
capability
Safety records of the
supplier
Financial
Stability Quality Design Capability Feeling of Trust Business references
Price
Ability to cope up
with technology
changes
Integration of
Supplier Supplier’s customer base
Mgmt. attitude
compatibility across
levels and functions
of buyer and supplier
strategic fit between
buyer and supplier
Quality
Price
Price
Top Mgmt.
capability
Feeling of Trust
Integration of Supplier
Mgmt. Attitude
compatibility across
levels and functions
of buyer and supplier
strategic fit between
buyer and supplier
Delivery
Quality
Price
Mfg.
capability
Design Capability
Ability to cope up
with technology
changes
Financial
Vendor A
Selection of a VENDOR
COST Technology Organizational
Culture
Other factor
Vendor B Vendor C
Safety record of
Supplier
Business references
Supplier’s customer
base
Economic
Performance
Financial
Stability
Top Mgmt.
capability
Feeling of Trust
Integration of Supplier
Mgmt. Attitude
Compatibility across
levels and functions
of buyer and supplier
Strategic fit between
buyer and supplier
Delivery
Quality
Price
Mfg.
capability
Design Capability
Ability to cope up
with technology
changes
Financial
Vendor A
Selection of a VENDOR
COST Technology Organizational
Culture
Other factor
Vendor B Vendor C

Proceedings of the National Conference on
Trends and Advances in Mechanical Engineering
(TAME-2017) March 16-17, 2017 ISBN 978-93-5268-269-0
YMCA University of Science & Technology, Faridabad, Haryana
302
(Liberatore , 1989) suggested a five point rating scale of Outstanding (O), Good (G), and Average (A), Fair (F),
Poor (P).This scale is adopted and priority weights of these scales can be determined using pairwise
comparisons. Using pairwise comparison judgment matrix is generated. Liberatore found priority weights of
outstanding, good, fair, average, and poor as 0.513, 0.261, 0.129, 0.063, and 0.034, respectively.
Table: 4 Composite priority weights for performance evaluation
The rating and weights of all criteria are shown in Table 4. Multiplying the global priority weights and rating
and subsequently adding the resulting values we can find the score of different vendors. Based on global priority
weights of the three Vendors shown in Table 4, Vendors B scored the highest weight. Therefore Vendor B
stands high on basis of evaluation.
Factors Local
Weights Criteria
Local
Weights
Global
Weights
Financial 0.423 Economic Performance (EP) 0.606 0.256
Financial Stability (FS) 0.322 0.136
Cost 0.219
Delivery (D) 0.507 0.111
Quality (Q) 0.201 0.044
Price (P) 0.292 0.064
Technology 0.210
Manufacturing Capability (MC) 0.355 0.075
Design Capability (DC) 0.324 0.068
Ability to cope up with Technology changes (ATC) 0.321 0.067
Organizational
Culture 0.064
Top management capability (TMC) 0.256 0.0164
Feeling of trust (FT) 0.335 0.0214
Integration of Supplier (IS) 0.242 0.0155
Management Attitude (MA) 0.303 0.0193
compatibility across levels and functions of buyer
and supplier (CLFBS)
0.215 0.0137
Strategic fit between buyer and Supplier (SBS) 0.141 0.0090
Other factor 0.084
Safety record of Supplier (SRS) 0.511 0.0429
Business references (BR) 0.235 0.0197
Supplier’s customer base (SCB) 0.252 0.0212
Total 1.000 1.000
Factors Global
Weight
INDUSTRY A INDUSTRY B INDUSTRY C
Rating/
Score Score * GW
Rating/
Score Score * GW
Rating/
Score Score * GW
EP 0.256 G / 0.261 0.066816 G / 0.261 0.066816 G / 0.261 0.066816
FS 0.136 F / 0.063 0.008568 F / 0.063 0.008568 G / 0.261 0.035496
D 0.111 P / 0.034 0.003774 O / 0.513 0.056943 G / 0.261 0.028971
Q 0.044 F / 0.063 0.002772 F / 0.063 0.002772 F / 0.063 0.002772
P 0.064 A / 0.129 0.008256 F / 0.063 0.004032 G / 0.261 0.016704
MC 0.075 A / 0.129 0.009675 G / 0.261 0.019575 A / 0.129 0.009675
DC 0.068 A / 0.129 0.008772 A / 0.129 0.008772 A / 0.129 0.008772
ATC 0.067 A / 0.129 0.008643 A / 0.129 0.008643 F / 0.063 0.004221
TMC 0.0164 A / 0.129 0.002115 F / 0.063 0.001033 A / 0.129 0.002115
FT 0.0214 P / 0.034 0.000727 A / 0.129 0.002760 P / 0.034 0.000727
IS 0.0155 P / 0.034 0.000527 G / 0.261 0.004045 G / 0.261 0.004045
MA 0.0193 P / 0.034 0.000656 O / 0.513 0.009900 F / 0.063 0.001215
CLFBS 0.0137 P / 0.034 0.000465 A / 0.129 0.001767 G / 0.261 0.003575
SBS 0.0090 A / 0.129 0.001161 P / 0.034 0.000306 F / 0.063 0.000567
SRS 0.0429 A / 0.129 0.005534 O / 0.513 0.022007 F / 0.063 0.002702
BR 0.0197 G / 0.261 0.005141 G / 0.261 0.005141 A / 0.129 0.002541
SCB 0.0212 P / 0.034 0.000720 G / 0.261 0.005533 A / 0.129 0.002734
TOTAL 0.134322 0.228613 0.193648

Proceedings of the National Conference on
Trends and Advances in Mechanical Engineering
(TAME-2017) March 16-17, 2017 ISBN 978-93-5268-269-0
YMCA University of Science & Technology, Faridabad, Haryana
303
The Vendor A, B, and C scored 0.134322, 0.228613 and 0.193648 points respectively. The results illustrate that
Vendor B has been capable in maintaining the quality better than other Vendors.
4.0 APPLICATION OF GRAPH THEORETIC APPROACH IN VENDOR
SELECTION VENDOR’S QUALITY DIGRAPH
In particular, the 5 quality characteristics of the vendor form the vendor quality digraph. As already
mentioned, these quality characteristics are: Financial (F), Performance (P), Technology (T), Organizational
culture (OC), other factors (OF). Each node of the digraph shows the value of the corresponding quality
characteristic and the edge between the two nodes represents the relationship between them. The vendor’s
quality digraph gives the visual representation of the relationship between the quality characteristic and shows
the complexity of the relationships of the characteristics of the vendor.
Figure 3: Vendor Quality Digraph
VENDOR’S QUALITY MATRIX
The vendor quality matrix according to the vendor quality digraph (also known as variable permanent matrix;
VPM) is as follows:
P1 P12 P13 P14 P15 VPM = P21 P2 P23 P24 P25
P31 P32 P3 P34 P35
P41 P42 P43 P4 P45
P51 P52 P53 P54 P5
Where, P1 = F, P2 = P, P3 = T, P4 = OC, P5 = OF
The value of off-diagonal elements can be determined by table 1 and the value of diagonal elements can be
determined through table 2.
So,
VPM =
VENDOR PERMANENT FUNCTION REPRESENTATION
To determine the numerical index for vendor assessment, the permanent of a matrix can be determined as
following:
P
O
C
T F
OF
5 3 3 5 2 3 6 2 3 0 5 3 4 2 1 0 2 0 4 3 0 0 0 2 3
Proceedings of the National Conference on
Trends and Advances in Mechanical Engineering
(TAME-2017) March 16-17, 2017 ISBN 978-93-5268-269-0
YMCA University of Science & Technology, Faridabad, Haryana
304
VPF = PER – P
i j k l m
jikjlkmlimmilmkljkij
i j k l m
lkmlkmmklmkljiij
mjikjlkil
i j k l m
likljkijm
i j k l m
lkkljkij
ml
i j k l m
jikjikkljkij
mlk
i j k l m
jiiji
pppppppppppppppppp
PppppppppPpppp
PPpppppp
PPPppP5
1
Now,
VPF = 7764
5.0 CONCLUSIONS
Methodologies based on Graph Theoretic Approach and Analytic Hierarchy Process is applied to compare
and rate the vendors of manufacturing industry. These methodologies build a flexible and comprehensive
model, which has the capability to consider the interdependencies between various factors and sub-factors
affecting the vendors’ performance.
These methodologies help in quantifying the influence of various factors and their sub-factors in quality of
vendors. Accordingly, weak and strong factors can be easily quantified which helps in efficient process
planning while selecting a vendor.
The technique AHP is divided in four steps: (1) Structuring the problem and developing the AHP model; (2)
Collecting data from survey; (3) Determining the normalized priority weights of individual factors and co-
factors;
(4) Derive solution
The technique GTA is divided in three steps: (1)Digraph representation; (2)Matrix representation;
(3)Permanent function representation
In present illustration, factors affecting the quality of vendors are grouped into five main factors namely
Financial (F), Performance (P), Technology (T), Organizational culture (OC), other factors (OF).
In the paper, GTA methodology reveals the highest index value for the best vendor whereas AHP provides
rating for each vendor and compares them.
The Literature survey of the paper represents the criteria and methodologies used by different researchers for
vendor selection which can be used in further research.
REFERENCES: 1. A.F. Guneri, A. Yucel, G. Ayyildiz (2009). An integrated fuzzy-lp approach for a supplier selection
problem in supply chain management, Expert Systems with Applications. Vol. 36, No. 5, 9223–9228.
2. A.H.I. Lee (2009). A fuzzy supplier selection model with the consideration of benefits, opportunities,
costs and risks, Expert Systems with Applications. Vol. 36, No. 2, 2879–2893.
3. A. Amid, S.H. Ghodsypour, C. O’Brien (2009). A weighted additive fuzzy multi-objective model for the
supplier selection problem under price breaks in a supply chain, International Journal of Production
Economics. Vol. 121, No. 2, 323–332.
4. Arijit Bhattacharya, John Geraghty, Paul Young (2010). Supplier selection paradigm: An integrated
hierarchical QFD methodology under multiple-criteria environment, Applied Soft Computing. Vol. 10,
No. 4, 1013-1027.
5. B. Vahdani, M. Zandieh and A. Alem-Tabriz (2008). Supplier Selection by Balancing and Ranking
Method, Journal of Applied Sciences. Vol. 8, 3467-3472.
6. Betty Chang, Chih-Wei Chang, Chih-Hung Wu (2011). Fuzzy Dematel Method for developing supplier
selection criteria, Expert Systems with Applications. Vol. 38, No. 3, 1850–1858.
7. C.T. Chen, C.T. Lin, S.F. Huang (2006). A fuzzy approach for supplier evaluation and selection in
supply chain management, International Journal of Production Economics. Vol. 102, 289–301
Proceedings of the National Conference on
Trends and Advances in Mechanical Engineering
(TAME-2017) March 16-17, 2017 ISBN 978-93-5268-269-0
YMCA University of Science & Technology, Faridabad, Haryana
305
8. Carlsson, C., & Fuller, R. (1996). Fuzzy multiple criteria decision-making: Recent developments, Fuzzy
Sets and Systems. Vol. 78, 139–153.
9. Chin-Nung Liao, Hsing-Pei Kao (2011). An integrated fuzzy TOPSIS and MCGP approach to supplier
selection in supply chain management, Expert systems with application. Vol. 38, 10803–10811.
10. D.D. Wu, Y. Zhang, D. Wu, D.L. Olson (2010). Fuzzy multi-objective programming for supplier
selection and risk modeling: A possibility approach, European Jr. of Operational Research. Vol. 200,
No. 3, 774–787.
11. Dog¨an Özgen, Semih Önüt, Bahadır Gülsün, Umut Rıfat Tuzkaya, Gülfem Tuzkaya (2008). A two-
phase possibilistic linear programming methodology for multi-objective supplier evaluation and order
allocation problems, Information Sciences. Vol. 178, No. 2, 485-500.
12. Dickson, G. W. (1966). An analysis of vendor selection systems and decision, Journal of Purchasing.
Vol. 2, No. 1, 5–17.
13. E.W.T. Ngai, E.W.C. Chan (2005). Evaluation of knowledge management tools using AHP, Expert
Systems with Applications. Vol. 29, No. 4, Pages 889-899.
14. Ellram, L. M. (1990). The supplier selection decision in strategic partnerships, Journal of Purchasing
and Material Management. Vol. 26, No. 4, 8–12.
15. F.E. Boran, S. Genç, M. Kurt, D. Akay (2009). A multi-criteria intuitionistic fuzzy group decision
making for supplier selection with TOPSIS method, Expert Systems with Applications. Vol. 36, No. 8,
11363–11368.
16. F. Faez, S.H. Ghodsypour, C. O’Brien (2009). Vendor selection and order allocation using an integrated
fuzzy case-based reasoning and mathematical programming model, International Journal of Production
Economics. Vol. 121, No. 2, 395–408.
17. Fatih Emre Boran, Serkan Genç, Mustafa Kurt, Diyar Akay (2009). A multi-criteria intuitionistic fuzzy
group decision making for supplier selection with TOPSIS method, Expert Systems with Applications.
Vol. 36, No. 8, 11363–11368.
18. Georgios N. Angelou, Anastasios A (2009). Economides, A compound real option and AHP
methodology for evaluating ICT business alternatives, Telematics and Informatics. Vol. 26, No. 4, Pages
353-374.
19. Gholam Ali Montazer, Hamed Qahri Saremi, Maryam Ramezani (2009). Design a new mixed expert
decision aiding system using fuzzy ELECTRE III method for vendor selection, Expert Systems with
Applications. Vol. 36, No. 8, 10837–10847.
20. Huan-Jyh Shyur, Hsu-Shih Shih (2006). A hybrid MCDM model for strategic vendor selection,
Mathematical and Computer Modelling. Vol. 44, No. 7–8, 749-761.
21. I. Chamodrakas, D. Batis, D. Martakos (2010). Supplier selection in electronic marketplaces using
satisficing and fuzzy AHP, Expert Systems with Applications. Vol. 37, No. 1, 490–498.
22. I. Erol, W.G. Ferrell (2003). A methodology for selection problems with multiple, conflicting objectives
and both qualitative and quantitative criteria, International Journal of Production Economics. Vol. 86,
187–199.
23. J.W. Wang, C.H. Cheng, H.K. Cheng (2009). Fuzzy hierarchical TOPSIS for supplier selection, Applied
Soft Computing. Vol. 9, No. 1, 377–386.
24. Jiann Liang Yang, Huan Neng Chiu, Gwo-Hshiung Tzeng, Ruey Huei Yeh (2008). Vendor selection by
integrated fuzzy MCDM techniques with independent and interdependent relationships, Information
Sciences. Vol. 178, No. 21, 4166-4183.
25. Leenders, M. et al. (2001) (12th ed.). Purchasing and supply management, Vol. 1. McGraw-Hill.
26. Liberatore MJ. (1989), “An extension of the analytic hierarchy for industrial R&D project selection and
resource allocation”, IEEE Transactions on engineering management, 1989; 34 (1):8-12.
27. M. Kumar, P. Vrat, R. Shankar (2006). A fuzzy programming approach for vendor selection problem in
a supply chain, International Journal of Production Economics. Vol. 101, 273–285.
28. Maggie C.Y. Tama, V.M. Rao Tummala (2001). An application of the AHP in vendor selection of a
telecommunications system, Omega. Vol. 29, 171-182
29. Michael Tracey and Chong Leng Tan (2001). Empirical analysis of supplier selection and involvement,
customer satisfaction, and firm performance, Supply Chain Management: An International Journal.
Vol.6, No. 174-188.
30. Metin Dağdeviren, Serkan Yavuz, Nevzat Kılınç (2009). Weapon selection using the AHP and TOPSIS
methods under fuzzy environment, Expert Systems with Applications. Vol. 36, No. 4, 8143-8151.
31. Orlando Durán (2011). Computer-aided maintenance management systems selection based on a fuzzy
AHP approach, Advances in Engineering Software. Vol. 42, No. 10, 821-829.
32. Ozcan Kilincci, Suzan Aslı Onal (2011). Fuzzy AHP approach for supplier selection in a washing
machine company, Expert Systems with Applications. Vol. 38, No. 8, 9656-9664.
Proceedings of the National Conference on
Trends and Advances in Mechanical Engineering
(TAME-2017) March 16-17, 2017 ISBN 978-93-5268-269-0
YMCA University of Science & Technology, Faridabad, Haryana
306
33. R.H. Lin (2009). An integrated FANP–MOLP for supplier evaluation and order allocation, Applied
Mathematical Modelling. Vol. 33, No. 6, 2730–2736.
34. S.H. Ghodsypour, C. O. Brien (1998). A decision support system for supplier selection using an
integrated analytic hierarchy process and linear programming, Int. Jr. Production Economics. Vol. 56-
57, 199-212.
35. S.Önüt, S.S. Kara, E. Işık (2009). Long term supplier selection using a combined fuzzy MCDM
approach: A case study for a telecommunication company, Expert Systems with Applications. Vol. 36,
No. 2, 3887–3895.
36. S.-Y. Chou, Y.-H. Chang (2008). A decision support system for supplier selection based on a strategy-
aligned fuzzy SMART approach, Expert Systems with Applications. Vol. 34, No. 4, 2241–2253.
37. Saman Hassanzadeh Amin, Jafar Razmi, Guoqing Zhang (2011). Supplier selection and order allocation
based on fuzzy SWOT analysis and fuzzy linear programming, Expert Systems with Applications. Vol.
38, No. 1, 334–342.
38. Shuo-Yan Chou, Yao-Hui Chang (2008). A decision support system for supplier selection based on a
strategy-aligned fuzzy SMART approach, Expert Systems with Applications Vol. 34, No. 4, 2241–2253.
39. Sung Ho Ha a, Ramayya Krishnan (2008). A hybrid approach to supplier selection for the maintenance
of a competitive supply chain, Expert Systems with Applications. Vol. 34, 1303–1311.
40. Victor B. Kreng, Chao-Yi Wu (2007). Evaluation of knowledge portal development tools using a fuzzy
AHP approach: The case of Taiwanese stone industry, European Journal of Operational Research. Vol.
176, No. 3, Pages 1795-1810.
41. Wang, X., & Triantaphyllou, E. (2008). Ranking irregularities when evaluating alternatives by using
some ELECTRE methods, Omega. Vol. 36, 45–63.
42. Xiaojun Wang, Hing Kai Chan, Rachel W.Y. Yee, Ivan Diaz-Rainey (2012). A two-stage fuzzy-AHP
model for risk assessment of implementing green initiatives in the fashion supply chain, International
Journal of Production Economics. Vol. 135, No. 2, 595-606.
43. Ya-Ti Lin, Chia-Li Lin, Hsiao-Cheng Yu, Gwo-Hshiung Tzeng (2010). A novel hybrid MCDM
approach for outsourcing vendor selection: A case study for a semiconductor company in Taiwan,
Expert Systems with Applications. Vol. 37, No. 7, 4796–4804.
44. Younghwa Lee, Kenneth A. Kozar (2006). Investigating the effect of website quality on e-business
success: An analytic hierarchy process (AHP) approach, Decision Support Systems. Vol. 42, No. 3,
1383-1401.

Proceedings of the National Conference on
Trends and Advances in Mechanical Engineering
(TAME-2017) March 16-17, 2017 ISBN 978-93-5268-269-0
YMCA University of Science & Technology, Faridabad, Haryana
307
ENVIRONMENTAL NOISE POLLUTION IN INDIA:
STATUS AND CONTROL STRATEGIES
N. Garg1, M. K. Sharma
2, A. K. Sinha
3 and R. K. Singh
2
1CSIR-National Physical Laboratory, New Delhi – 110 012, India.
2Delhi Technological University, Delhi - 110 042, India.
3Central Pollution Control Board, Parivesh Bhawan, East Arjun Nagar, Delhi – 110 032, India.
E-mail: [email protected]
Abstract
The paper describes the noise monitoring data acquired from the diversified project on the establishment of
National Ambient Noise Monitoring Network (NANMN) across the seven major cities in India for continuous
noise monitoring throughout the year. The annual average Lday (06-22h) and Lnight (22-06 h) values observed in
past years for the 70 locations under study in which 25 locations are in commercial zone, 12 in industrial, 15 in
residential and 18 in silence zones is analyzed. The diversified noise monitoring network established in India
covering 70 locations is a unique and one of the largest noise monitoring networks of its kind across the globe
serving the purpose of evaluation, analysis and control of ambient noise in seven major cities of India.
Keywords: National Ambient Noise Monitoring Network (NANMN); Day equivalent level, Lday;Night equivalent
level, Lnight.
1. Introduction
Noise pollution has become a serious concern since past several years in Indian scenario. With growing
vehicular population and urbanization, it is imperative to monitor the ambient noise levels and devise suitable
measures for control so as to avoid health hazards and annoyance faced by the community. There have been
many such studies conducted so far on the noise exposure and correlation with human blood pressure [1-4]. In
Indian scenario, there have been limited studies carried out on correlating the effect of noise on human health. It
is thus imperative to continuously monitor the ambient noise levels especially at the noisy sites in the cities not
only to ascertain the magnitude of noise levels, but also to take preventive actions to control them. The Central
Pollution Control Board (CPCB), India has taken this issue seriously and therefore established a pilot project on
National Ambient Noise Monitoring network (NANMN) covering 7 major cities of India. The NANMN
programme was established initially in year 2011 with 35 noise monitoring stations covering seven major
metropolitan cities: Delhi, Lucknow, Kolkata, Mumbai, Hyderabad, Bengaluru and Chennai [5]. However, the
strengthening of this network to 35 more stations in same seven metropolitan cities since November, 2014 has
been indispensable in analyzing a wider noise scenario situation in the country and adoption of noise abatement
measures for controlling the noise pollution in India. The ambient noise levels observed at the ten sites can
however be correlated with the other sites lying in same zone (commercial/residential/industrial/silence) as well
having similar vehicular density moving on the roads. The data acquired under the establishment of diversified
network so established with special budgetary grant from the government of India is indispensable for
accomplishing the following objectives of the present study:-
ascertain the annual average ambient noise levels of 70 sites and compare them with ambient noise
standards of India,
inculcate the awareness of general public towards the status of noise pollution and dissemination of
information publicly through website, http://www.cpcbnoise.com
ascertaining the noisy spots amongst these 70 sites and suggesting the need of abatement measures
required if any,
It may be noted here that the day equivalent level, Lday and night equivalent level, Lnight is calculated from the 24
hours noise data for each day of the year. The day-time is from 6.00 a.m. to 10.00 p.m., while the night time is
Proceedings of the National Conference on
Trends and Advances in Mechanical Engineering
(TAME-2017) March 16-17, 2017 ISBN 978-93-5268-269-0
YMCA University of Science & Technology, Faridabad, Haryana
308
considered from 10.00 p.m. to 6.00 a.m. The silence zone is an area comprising not less than 100 m around
hospitals, educational institutions, courts, religious places or any other area which is declared as such by the
competent authority. Mixed categories of areas may be declared as one of the four mentioned categories in table
1 by the competent authority [6].
2. Ambient Noise MonitoringProject
The diversified NANMN project has been established since year 2014 covering 70 stations in seven major
cities of the country namely, Bengaluru, Chennai, Delhi, Hyderabad, Kolkata, Lucknow and Mumbai. The 70
locations under study are established in 7 cities of India with each state having ten noise monitoring stations.
The 70 locations cover 25 commercial sites, 15 residential sites, 18 sites in silence zone and 12 sites in industrial
zone. The Noise Monitoring Terminal manufactured and installed by Geónica Earth Sciences, Spain [7,8] is an
automated system consisting of a sound level meter traceable to the national standards for continuously
measuring the ambient noise through the year at 70 locations under study. The sound level data so acquired is
transmitted to National Noise Monitoring Centre, NNMC located at CPCB Headquarters, Parivesh Bhawan,
New Delhi whereby the data is received, processed and displayed. The details the project establishment and
instrumentation used is discussed in details in reference [5]. In addition, a website application,
http://www.cpcbnoise.com is developed to disseminate the data in real time to the public for generating
awareness towards reducing the noise pollution in different parts of the country [9].
3. Noise Pollution Scenario
The Lday and Lnight levels observed for 70 sites for the year 2015 reveals that only 10 industrial sites (14.3 %) met
the ambient noise standards. The sites are: Talkatora, Jeedimetla, Peeniya, Chinhat, Tartala, M&M Kandivali,
L&T Powai, Andheri, Gaddapothram and Whitefield. The situation is similar to that observed in year 2014 noise
monitoring data for 35 sites under consideration, wherein it was observed that 4 industrial sites met the ambient
noise standards. Thus, no site lying in residential zone, or commercial zone or in silence zone qualifies the
ambient noise standards. It can be observed that 9 sites (13 %) met the target of 55 dB Lnight. The World health
Organization (WHO) considers the average nocturnal noise levels of LAeq,outside 55 dB as an interim goal when
the recommended guidelines value of 40 dB is not feasible in the short term [10]. It is observed that for Chennai
city, all the sites are having higher ambient day levels ≥ 65 dB(A) and ambient night noise levels ≥ 60 dB(A).
For the Mumbai city also, seven sites registered ambient day noise levels ≥ 65 dB(A) and night noise levels ≥ 60
dB(A). It is also observed that the Delhi city has the least number of sites violating the criteria of day ambient
noise levels higher than 65 dB(A) and night ambient noise levels higher than 60 dB(A). The day ambient levels
were observed to be higher than 65 dB(A) for the four sites and night ambient levels higher than 60 dB(A) were
observed for the three sites in Delhi city. The comparison of ambient noise levels observed in year 2015 with
those observed in year 2011 for the 35 stations reveals that for some sites like Indira nagar, PGI hospital of
Lucknow city; Kasba Gole park and New market site of Kolkata city; ASHP and MPCB headquarters of
Mumbai city; Abids and Jeedimetla site of Hyderabad city; Peeniya in Bengaluru city; Eye hospital, Perambur
and Triplicane sites in Chennai city registered very high increment in ambient noise levels.
Figures 1 and 2 show the day equivalent levels and night equivalent levels, Lday and Lnight levels for all the 70
sites under consideration. It can be observed that day ambient noise levels varied from 60 dB(A) to 75 dB(A) for
55 sites (79.7 %), while the night noise levels varied from 55 dB(A) to 70 dB(A) for 50 sites (72.5 %). 22 sites
(31.9 %) experienced day levels higher than 70 dB(A), while 10 sites (14.5 %) experienced night levels higher
than 70 dB(A). These observations also suggest a retrospective view of ambient standards limits particularly for
the residential and areas under silence zone in Indian scenario. The recent study on proposed amendments in
ambient noise standards of India based on single-noise descriptor proposes LAeq,24h of 70 dB(A) for industrial
zone; 65 dB (A) LAeq,24h for commercial area and mixed residential and commercial zones; 60 dB(A) for
residential zone and 55 dB(A) for silence zone [11]. In accordance with these criteria; 22 sites that includes 5
commercial, 10 industrial, 6 residential and 1 in silence zone met the proposed standards.

Proceedings of the National Conference on
Trends and Advances in Mechanical Engineering
(TAME-2017) March 16-17, 2017 ISBN 978-93-5268-269-0
YMCA University of Science & Technology, Faridabad, Haryana
309
Fig. 1. Lday and Lnight levels at 30 locations spread across three major cities: Bengaluru, Chennai and Delhi
in year 2015.
Fig. 2. Lday and Lnight levels at 40 locations spread across four major cities: Hyderabad, Kolkata, Lucknow
and Mumbai in year 2015.
The analysis of noise monitoring data for all these sites reveals that some sites immediately require a
comprehensive noise abatement package for bringing the noise levels below the ambient standards. Thus,
various control measures such as: appropriate land use planning and creating buffer zones for sensitive
receptors; installation of noise barriers for hospitals, schools, colleges, old age homes; enforcement of maximum
speed limit for heavy vehicles in residential areas; development of poroelastic road surfaces for traffic noise
control; establishment of no honking zones especially for residential and silence zones and traffic management
can be instrumental in ambient noise control. However, the Best Practicable and Economical option (BPEO)
may be executed considering all these possible noise abatement alternatives [11-20] for each of these sites under
consideration individually. Reference [13] clearly describes the flow chart of a recommended noise pollution
control strategy for reducing the ambient noise levels in Indian cities. Thus, the control measures are essentially
50
55
60
65
70
75
80
85
Be
ng
alu
ru, P
ari
sa
r
Be
ng
alu
ru, P
ee
niy
a (
I)
Be
ng
alu
ru,N
isa
rga
Be
ng
alu
ru, M
ara
tha
ha
lli
Be
ng
alu
ru, B
TM
(R
)
Be
ng
alu
ru,Y
es
hw
an
tpu
r
Be
ng
alu
ru,R
.V.C
.E. (S
)
Be
ng
alu
ru,W
hit
efi
eld
(I)
Be
ng
alu
ru, D
olm
ur
(R)
Be
ng
alu
ru, N
ihm
an
s (
S)
Ey
e H
os
pit
al (S
)
Ch
en
na
i, T
.Na
ga
r(C
)
Pe
ram
bu
r (C
)
Ch
en
na
i, G
uin
dy
(I)
Tri
plic
an
e (
R)
Pa
llik
arn
ai (C
)
Ve
lac
he
ry (
R)
Wa
sh
erm
an
pe
t (C
)
An
na
Na
ga
r (S
)
So
wc
arp
et
(R)
De
lhi, D
ils
ha
d G
ard
en
De
lhi, C
PC
B H
Q.(
C)
De
lhi, D
CE
(S)
De
lhi, IT
O (
C)
De
lhi, N
SIT
(S
)
De
lhi, C
ivil L
ine
s (
C)
De
lhi, R
K P
ura
m(R
)
De
lhi, A
na
nd
Vih
ar
(C)
De
lhi, M
an
dir
Ma
rg (
S)
De
lhi, P
un
jab
i B
ag
h (
R)
Eq
uiv
ale
nt
So
un
d L
evels
in
dB
(A)
Lday
Lnight
50
55
60
65
70
75
80
85
Ab
ids
(C
)
Pu
nja
gu
tta
(C)
Je
ed
ime
tla
(I)
Zo
o (
S)
Ju
ble
e H
ills
(R
)
Ta
rna
ka
Ga
dd
ap
oth
ram
(I)
Ga
ch
ibo
wli(
S)
Pa
rad
ise
(C
)
Ku
ka
tpa
lli (
C)
SS
KM
Ho
sp
ita
l
Go
le P
ark
(I)
He
ad
Qu
art
er
(C)
Pa
tau
li (R
)
Ne
w M
ark
et
(C)
Ko
lka
ta, B
ira
ti N
.
RG
Ka
r (S
)
To
llyg
un
ge
(C
)
Ba
g B
aza
r (R
)
Ko
lka
ta, T
art
ala
Ta
lka
tora
(I)
Lu
ck
no
w, H
azr
at
Lu
ck
no
w, P
.G.I.
Ind
ira
Na
ga
r (R
)
Ch
inh
at
(I)
IT C
olle
ge
(S
)
CS
S A
irp
ort
(C
)
RS
C A
liga
bj (
C)
Vib
hu
ti K
ha
nd
Mu
mb
ai,
Th
an
e
Na
vi M
um
ba
i,
Mu
mb
ai,
AS
HP
Mu
mb
ai,
Ba
nd
ra
MP
CB
, He
ad
M&
M K
an
div
ali
Am
ba
ss
ad
or
L&
T P
ow
ai (
I)
Pe
ps
ico
Mu
mb
ai,
An
dh
eri
Eq
uiv
alen
t S
ou
nd
Lev
els
in d
B(A
)
Lday
Lnight
Proceedings of the National Conference on
Trends and Advances in Mechanical Engineering
(TAME-2017) March 16-17, 2017 ISBN 978-93-5268-269-0
YMCA University of Science & Technology, Faridabad, Haryana
310
required to be implemented so as to protect the community from health hazards arisen due to noise pollution
especially in metro cities, wherein the vehicular populations is growing at a alarming stage.
4. CONCLUSION
The paper describes the establishment of a diversified National Ambient Noise Monitoring Network
(NANMN) across seven major cities in India for continuous noise monitoring throughout the year. The annual
average Lday (06-22h) and Lnight (22-06 h) values observed in the year 2015 for the 70 locations under study in
which 25 locations are in commercial zone, 12 in Industrial, 15 in residential and 18 in silence zones are
described. The Lday and Lnight levels observed for 70 sites for the year 2015 reveals that only 10 industrial sites
(14.3 %) met the ambient noise standards. It can be observed that no site lying in commercial or residential or in
silence zone met the ambient noise standards. The long-term noise monitoring shows that ambient noise levels
are very high as compared to recommended standards for some sites and thus noise abatement measures are
essentially required for controlling these levels. It can be observed that only 9 sites (13 %) met the target of 55
dB Lnight. These observations also suggest a retrospective view of ambient noise standards particularly for
residential and areas under the silence zones. The noise database presented for 70 locations under consideration
shall be helpful for the town administrator and planners for the effective traffic management and noise control in
that site. It is recommended that further expansion of the diversified network so established should be
undertaken in these cities so as to develop noise maps of these cities; evaluate the number of population exposed
to higher noise levels; assessing the environmental noise impact over the sensitive receptors and shall also serve
as support tool for decision-making process concerning local action plans.
ACKNOWLEDGEMENTS
The authors are very thankful to the CPCB authorities for their permission to publish the present work. Authors
also express their gratitude towards Director, CSIR-National Physical Laboratory, India and Head, Physico-
Mechanical Standards for their constant encouragement and support for the research work and allowing the
authors to publish the study. The study was funded by CPCB, India and Ministry of Environment and Forests
(MoEF), India.
REFERENCES
[1] Green MS, Schwartz K, Harari G, Najenson T. Industrial noise exposure and ambulatory blood pressure and
heart rate. Journal of Occupational Medicine1991;33: 879–83.
[2] Lang T, Fouriaud C, Jacquinet-Salord MC. Length of occupational noise exposure and blood pressure, Int Arch
Occup Environ Health1992: 63:369–72.
[3] Fogari R, Zoppi A, Vanasia A, Marasi G, Villa G (1994). Occupational noise exposure and blood pressure.
Journal of Hypertension 1994;12: 475–79.
[4] WHO-JRC. Burden of disease from environmental noise-Quantification of healthy life years last in Europe.
European Center for Environment and Health, JRC EU, 2011.
[5] Garg N, Sinha A K, Gandhi V, Bhardwaj R M, Akolkar A B. A pilot study on establishment of ambient noise
monitoring network across the major cities of India. Applied Acoustics 2016; 103:20-29.
[6] The Noise Pollution (Regulation and Control) rules, 2000, Ministry of Environment & Forests, India,
http://envfor.nic.in/downloads/public-information/noise-pollution-rules-en.pdf
[7] Geónica Earth sciences, Spain, www.geonica.com
[8] SGS Weather and Environmental Systems Pvt. Ltd., New Delhi, India, http://www.sgsweather.com
[9] CPCB, Ambient Noise monitoring data display site, http://www.cpcbnoise.com

Proceedings of the National Conference on
Trends and Advances in Mechanical Engineering
(TAME-2017) March 16-17, 2017 ISBN 978-93-5268-269-0
YMCA University of Science & Technology, Faridabad, Haryana
311
[10] World Health Organization, Night Noise guidelines for Europe. Copenhagen, WHO Regional Office for Europe,
2009.
[11] U.S Department of Housing and Urban Development, Environmental Criteria and Standards, 24 CFR Part 51, V
12 July, 1979, amended by 49FR 880, 6 January, 1984.
[12] Garg N, Kumar A, Saini P K, Maji S. A retrospective view of ambient noise standards in India: Status and
proposed revision. Noise Control Engg. Journal 2015; 63:266-78.
[13] Garg N, Maji S, A retrospective view of noise pollution control policy in India: Status, Proposed Revisions and
Control Measures, Current Science, 111 (1), 2016, 29-38.
[14] Olayinka O S. Effective noise control measures and sustainable development in Nigeria. World Journal of
Environmental Engineering 2013; 1:5-15.
[15] Garg N, Sharma O, Maji S. Experimental investigations on sound insulation through single,double and triple
window glazing for traffic noise abatement. Journal of Scientific and Industrial Research 2011; 78:471-78.
[16] Garg N, Vishesh, Maji S. Fuzzy TOPSIS approach in selection of optimal noise barrier for traffic
noiseabatement. Achieves of Acoustics, 2015; 40:453-67.
[17] Rasmussen B. Sound insulation between dwellings-Requirements in building regulations in Europe. Applied
Acoustics 2010; 71:373-85.
[18] Garg N, Kumar A, Maji S. Parametric sensitivity analysis of factors affecting sound insulation of double glazing
using Taguchi method. Applied Acoustics 2013; 74: 1406-13.
[19] Dintrans A, M. Préndez M. A method of assessing measures to reduce road traffic noise: A case study in
Santiago, Chile. Applied Acoustics 2013; 74:1486-91.
[20] Naish D. A method of developing regional road traffic noise management strategies. Applied Acoustics, 2010;
71: 640-52.

Proceedings of the National Conference on
Trends and Advances in Mechanical Engineering
(TAME-2017) March 16-17, 2017 ISBN 978-93-5268-269-0
YMCA University of Science & Technology, Faridabad, Haryana
312
ENHANCING FACTORS AND IMPLEMENTATION STRATEGY USED
TO DEVELOPBENCHMARKING MODELOF INTERNAL SUPPLY
CHAIN MANAGEMENTFORANALYSING INDIAN
MANUFACTURING INDUSTRIES
Kailash1, Rajeev Kumar Saha
2, Sanjeev Goyal
3
Assistant Professor1 Department of Mechanical Engineering, SDIET, Faridabad- 121001, Haryana, India
E-mail: [email protected]
Assistant Professor2,3
Department of Mechanical Engineering, YMCAUST, Faridabad-121006, Haryana, India
E-mail: [email protected], [email protected]
3
Abstract
The objective of paper is to facilitate the enhancing factors, which have an importance to develop benchmark of
internal supply chain management for analysingIndian manufacturing industries. In this paper authors have
come across different implementation strategies to develop benchmark of internal supply chain management.
Keywords: Internal supply chain management, Enhancing factors, Implementation strategies
Introduction
Internal supply chain management refers to the use of the planning, organization, command, control and
coordination functions of the enterprise products in all aspects of circulation involved in logistics, capital flow,
information flow and business processes to achieve the greatest efficiency, lowest cost, and to provide
maximum customer value.Through information technology and management tools fororganization internal
supply, manufacture, sales in pursuit of common objectives and implementation strategies in line. In this paper
authors have come across various enhancing factors and implementation strategies, which are helpful to develop
benchmark of internal supply chain management for analysing Indian manufacturing industries.
Literature review
Early definition of the supply chain limited to the operation of theenterprise, mainly referring to manufacturing
enterprises from externalprocurement of raw materials and parts after the production, processing, sales
tocustomers at the internal process (KOTZAB H., et al., 2006). That is, internal supply chain. The theory
ofsupply chain research and entrepreneurial development in depth changes in thesupply chain concept of the
internal shift from the original external, by the linear shift network type. Therefore, there have been external
supply chain and internalsupply chain classification.Internal supply chain concept confined to a single
enterprise, emphasize internalmarketing, sales, planning, manufacturing and procurement co-ordination
betweendepartments, can be seen as a reduction of external supply chain, and in theenterprises such as the
procurement department can look for an external supplychain suppliers (DANESE P., 2013). In this study, the
concept of internal supply chain is in the production and productflow, the process of raw material suppliers,
manufacturers, storage, transportation,retailers and ultimately consumers, composed of networks of supply and
demand (JUTTNER U., et al., 2007).Internal supply chain can be divided into two parts, the dynamic supply
chain and internalsupply chain. Internal supply chain organisations are only considering their own
businesswithout considering its extension. Dynamic supply chain is composed of a groupof independent entities,
one of the lead entity looking for those with superiorresources of partners, each partner contribute to the supply
chain corecompetitiveness.
1 Internal Supply Chain Integration enhancing factors
There are following factors which are responsible for enhancing internal supply chain integration within
organization.
1.1 Job rotation:There is evidence that job rotation enhances internal supply chain integration. It had a strong
effect on coordination aspects of internal supply chain integration.

Proceedings of the National Conference on
Trends and Advances in Mechanical Engineering
(TAME-2017) March 16-17, 2017 ISBN 978-93-5268-269-0
YMCA University of Science & Technology, Faridabad, Haryana
313
1.2 Performance incentives for managers:We did not find any evidence for paying departmental managers
incentives based on organization wide performance in order to foster integration. But by providing performance
incentives schemes involvement of managers should be increases in internal supply chain management
integration.
1.3 Top management emphasis on integration:There was some support for the hypothesis that the importance
placed by top management on integration will be reflected by the extent of integration in a manufacturing
industry. There is extensive support for this antecedent in the literature.
1.4 Line manager’s encouragement of positive attitudes between departments:Our results suggest that line
managers fostering of positive attitudes between departments play a strong role in internal supply chain
integration. By far, this was the best predictor of integration levels. The significance of this variable was strong
across all components of internal supply chain integration.
1.5 Co-location:Co-location was also found to be a strong predictor of internal supply chain integration,
particularly in large and make - to - stock company environments.
1.6 Joint accountability:Our statistical analysis showed that holding disparate functional managers jointly
accountable for manufacturing organization goals had a strong effect on internal supply chain integration levels.
This effect was strong for larger manufacturing organization and for manufacturing organization with make - to
- stock policies.
1.7 Top management emphasis on culture of collaboration:Emphasis by top management on culture of
collaboration appears to have only an effect on internal supply chain integration. The small effect was seen for
smaller manufacturing unit and for manufacturing unit with make - to - order policies (AISHAH T.N., et al.,
2013).
1.8 Employee training regarding other departments:Training employees regarding other departments appears to
be effective in increasing integration, particularly in larger manufacturing organization.
2 Implementation strategies
Benchmarking for internal supply chain for analysing Indian manufacturing industries is a management
philosophy which cannot be implemented instantly within the manufacturing organization (ANAND G. and
KODALI R, 2008). It may be starting with smaller projects of internal supply chain management, taking
guidelines of an expert, making and following the strategy with due course correction in strategy while
implementing internal supply chain management throughout the manufacturing organization (BARKI H., et al.,
2005). Some of the steps are as follows:
2.1 Senior Management Involvement:For any major change, support and commitment from top management is
vital. It is very much possible that problems will arise when benchmarking for internal supply chain
management implementation will progress and these issues must be understood and solved by top management
without effecting benchmarking for internal supply chain management implementation process.
2.2 Initiate with smaller projects: The initial project must be small so that more resources are utilized and more
chances are for better results with lesser risk moreover people working on project and around will learn while
doing project. The results will motivate other to follow the same and people will start having faith in
benchmarking for internal supply chain management techniques for analysing Indian manufacturing industries.
So recommendation is to start with smaller project.
2.3 Start with limited execution: The benchmarking for internal supply chain management implementation
should be within limited area during start so that it can be monitored, corrected and directed for further
Proceedings of the National Conference on
Trends and Advances in Mechanical Engineering
(TAME-2017) March 16-17, 2017 ISBN 978-93-5268-269-0
YMCA University of Science & Technology, Faridabad, Haryana
314
implementation starting benchmarking for internal supply chain management all-around the manufacturing
organization will reduce control and mentoring of people involved in benchmarking for internal supply chain
management implementation. Once movement is gained it should be spread in other areas.
2.4 Professional mentor:The services of a professional mentor should be taken at least at the start. During
conversion of a conventional existing manufacturing system,manufacturing organization's lots of issue will arise
and should be handled professionally they can be taken care with the use of expert.
3 Development Steps of Benchmarking Model for Internal Supply Chain Management The development of a benchmarking model for internal supply chain management should be done only after
study of functional elements and activities related to internal supply chain of Indian manufacturing industries.
Employee’s functional activities of manufacturing industries are so busy in purchase, make, sale and distribution
planning of products. For best internal supply chain management customer satisfaction (quantity and quality of
product) is must with competitive cost. For achieving better response from market side a benchmarking
effective team should be necessary, which should have the capability to analyse the functional activities
(BHUTTA K.S. and HUQ F., 1999).Every organization wants better existence in the competitive
environment.The main goal is to increase effectiveness and efficiency of the whole organization. Today we
have variety of products around us. In the word every person wants best product and better service in minimum
cost within possible time. So for growing in such type of competitive environment every manufacturing
organisation required review and update system again and again inside the organisation (KRISTIANTO Y., et
al., 2012). That’s why benchmarking model for internal supply chain management, constructive methodology
should be helpful in reviewing of existing system of manufacturing organisation as well as finding the gap
between manufacturing organisation and their existing between its competitors. The following steps are
generally used for the process to develop a model of benchmarking for internal supply chain management for
analysing Indian manufacturing industries.
Proposed Data Collection Procedure:Data collection is to be done with the help of - questionnaires,
literature survey, discussions, interviews, databases, seminars and conferences etc.
Data Analysis: The above collected data will be analysed using various statistical and quantitative techniques
like – Multivariate analysis, Hypothesis testing, Multiple regression analysis, etc as necessary.
Proposed Software Packages: Computer software packages like - SPSS, Minitab, etc shall be used
extensively in the research work.
Proposed Model: Developing a unique model integrating various quality improvement techniques. The study
shall be exploratory in nature and shall be corroborated through case studies.
Conclusion
The recent literature provides a meaningful insight regarding the state-of-art of the internal supply chain
management activities undertaken by the various types of Indian manufacturing industries (DE BOER L., et al.,
2006). In this paper, authors have explain the essential factors which are helpful for creating internal supply
chain integration and its benchmark, further used as a basis for improving the operational effectiveness of an
Indian manufacturing industries. In this paper, authors have been discussed implementation strategies to develop
benchmarking model for internal supply chain management and its integration.
References
ANAND G. and KODALI R, 2008, Benchmarking the benchmarking models’, Benchmarking: An International
Journal, Vol.15, No. 3, pp.257–291.

Proceedings of the National Conference on
Trends and Advances in Mechanical Engineering
(TAME-2017) March 16-17, 2017 ISBN 978-93-5268-269-0
YMCA University of Science & Technology, Faridabad, Haryana
315
AISHAH T.N., et al., 2013, Integration of the internal supplychain management (SCM) towards long run
competitiveness, Management, Vol. 3, No. 1,pp.12–15.
BARKI H., et al., 2005, A model of organizational integration, implementation effort, and performance,
Organization Science 16(2): 165-179.
BHUTTA K.S. and HUQ F., 1999, Benchmarking – best practices: an integrated approach,Benchmarking: An
International Journal, Vol. 6, No. 3, pp.254–268.
DE BOER L., et al., 2006, A satisficing model of outsourcing, Supply Chain Management: An International
Journal, Vol. 11, No. 5, pp. 444-55.
DANESE P., 2013, Supplier integration and company performance: a configurational view. Omega 43:1029-
1041.
JUTTNER U., et al., 2007, Demand chain management-integrating marketing and supply
chainmanagement,Industrial Marketing Management, 36: 377-392.
KOTZAB H., et al., 2006, Supply chain management implementation and priority strategies in Danish
organizations, Journal of Business Logistics 27(2): 273-300.
KRISTIANTO Y., et al., 2012, A decision support system for integrating manufacturing and product design into
the reconfiguration of the supply chainnetworks, Decision Support Systems, Vol. 52, No. 4, pp.790–801.

Proceedings of the National Conference on
Trends and Advances in Mechanical Engineering
(TAME-2017) March 16-17, 2017 ISBN 978-93-5268-269-0
YMCA University of Science & Technology, Faridabad, Haryana
316
TO COMPARE THE FACTORS AFFECTING THE SERVICE
QUALITY OF CUSTOMERS USING FUZZY GRAPH THEORETIC
APPROACH
Tarun Kumar Gupta*1, Vikram Singh
2
1Research Scholar,
2Professor
Department of Mechanical Engineering, YMCA University of Science & Technology, Faridabad, Haryana,
India – 121006, E-mail – [email protected], E-mail - [email protected]
Abstract Fuzzy Graph Theoretic approach, a hybrid technique, used to compare the various factors affecting the service
quality of customer i.e. end user. All the identified factors grouped into three sub groups which converted into
crisp score of fuzzy. Finally digraphs were made and permanent functions were calculated to compare the
relative importance of all the groups.
Keywords: Fuzzy graph theoretic (FGT) approach, customer service quality
1. Introduction
Supply chain management (SCM) has been the area of interest for both academician and practitioners since past
three decades. The main elements of SCM consists a chain starting from supplier to organization, distributor,
retailer and end user i.e. customer. Customer plays an important role in the performance of supply chain
(Lummus et al 2001). Customer is the king of market and he decides good or bad and the future of any
organization. Robinson & Malhotra (2005) found that integration with customer is an important practice of
SCM.
Customer is the main driving force of the market. He decides the future of the organization. The customer
service management process is the firm’s face to the customer. It provides the single source of customer
information, such as product availability, shipping dates and order status. Real-time information is provided to
the customer through interfaces with the firm’s functions, such as manufacturing and logistics. Whetherit isthe
age of the “new consumer”, the experience economy or the era of post-modernism, it is clear that there has been
a significant shift in most market-places. Fuelled by increasing market fragmentation, the desire to consume
“experiences” and increased market literacy, consumers are becoming increasingly discerning. It would be
convenient to dismiss this as a “marketing problem” and to ignore the logistics implications; but such
fundamental shifts in consumer behavior and the demand creation patterns they cause must be addressed by
equally fundamental shifts in the way that demand is fulfilled. This has significant implications for SCM. It is
time to understand the needs of the end-customer and to align supply chain strategy behind end-customer needs
in the market-place.
Also, Authors have not come across any research work in which fuzzy Graph theoretic approach is used to find
the service quality except Gupta and Singh (2015a). With the use of this technique, the intangible attributes
converted into crisp score then convert into single numerical index by the use of Graph theoretic approach and
then relative importance of factors is identified.
2. Research Methodology Adopted
1.1 Conversion of fuzzy numbers into crisp score
Initially, convert all the fuzzy data in to fuzzy number and then these fuzzy number convert into crisp score. The
conversion of fuzzy number into crisp score is as follows (Tzeng and Huang 2011):
,0 1
0, max
y y
otherwiseµ y
(Eq.1)
min
1 ,0 1
0
,
y y
otherwiseµ y
(Eq.2)

Proceedings of the National Conference on
Trends and Advances in Mechanical Engineering
(TAME-2017) March 16-17, 2017 ISBN 978-93-5268-269-0
YMCA University of Science & Technology, Faridabad, Haryana
317
( )
min wiµ
yi
y
Lµ Sup µ yW (Eq. 3)
( )
max wiµ
yi
y
Rµ Sup µ yW (Eq.4)
The total score is given as follows
1 / 2i iT R iLµ µW µW W (Eq. 5)
By using eq. 1-5 the crisp score can be computed as shown in table-1.
1.2 Graph theoretic Approach
Graph theoretic approach (GTA) consists of digraph, matrix and permanent function representation and used to
convert the intangible factors into tangible and calculate the single numerical index for any issue. This technique
was developed by Euler in 1736 when he solved the famous Konigsberg bridge problem. After that, this
technique was used by many researchers and practitioners in various fields (Gupta & Singh, 2015b).
Initially all the identified factors are grouped by any method then digraphs for all the groups are made. After
that with the help of matrices these digraph will convert into mathematical form. Then a single numerical index
is calculated by using permanent function which indicates the relative importance of factors.
Table 1: Conversion of fuzzy number into crisp score
Intangible
factor
Meaning of intangible factor Fuzzy Number Crisp Score
Poor One factor is very less important than the other W1 0.115
Fair One factor is less important than the other W2 0.295
Good Both factors are equally important W3 0.495
Very Good One factor is much important than the other W4 0.695
Excellent One factor is very much important than the other W5 0.895
3. Case study
To demonstrate the above discussed methodology for comparing the relative importance of factors authors study
a two wheeler manufacturing company of North India. Following steps are taken for this case study
1. After referring a large numbers of papers and discussion with industry experts, 14 factors were identified which
should be taken in consideration for calculating the service quality of customer in a supply chain. These factors
are given in table -2.
2. A questionnaire was designed based on the factors of table-2.
3. The questionnaire was filled by the customers.
4. Based on the response, SPSSv20 was used to divide the factors into various sub groups. Total three sub groups
were formed and shown in table-3.
Table -2
Customer
Customer
Focus
(CF)
Customer
Satisfaction
(CS)
Customer
Responsiveness
(CR)
Customer
Relationship
Management
(CRM)
Faster Response
Time (FRT)
Buy Back Contract
(BB) Cost (CO)
Delivery
(DL)
Traceability
(TR)
Order Fulfillment
(OF)
Quality of
Product (QP)
Technology and
Organization
(TO)
Environmental
Friendly Product
(EFP)
Society
Perceptions
(SP)
Table – 3
Normalized value of service quality factors (inheritance value)
G1 Customer Focus Customer Satisfaction
Customer
Responsiveness
Customer Relationship
Management
Quality of
Product
1 1 0.894 0.815 0.974
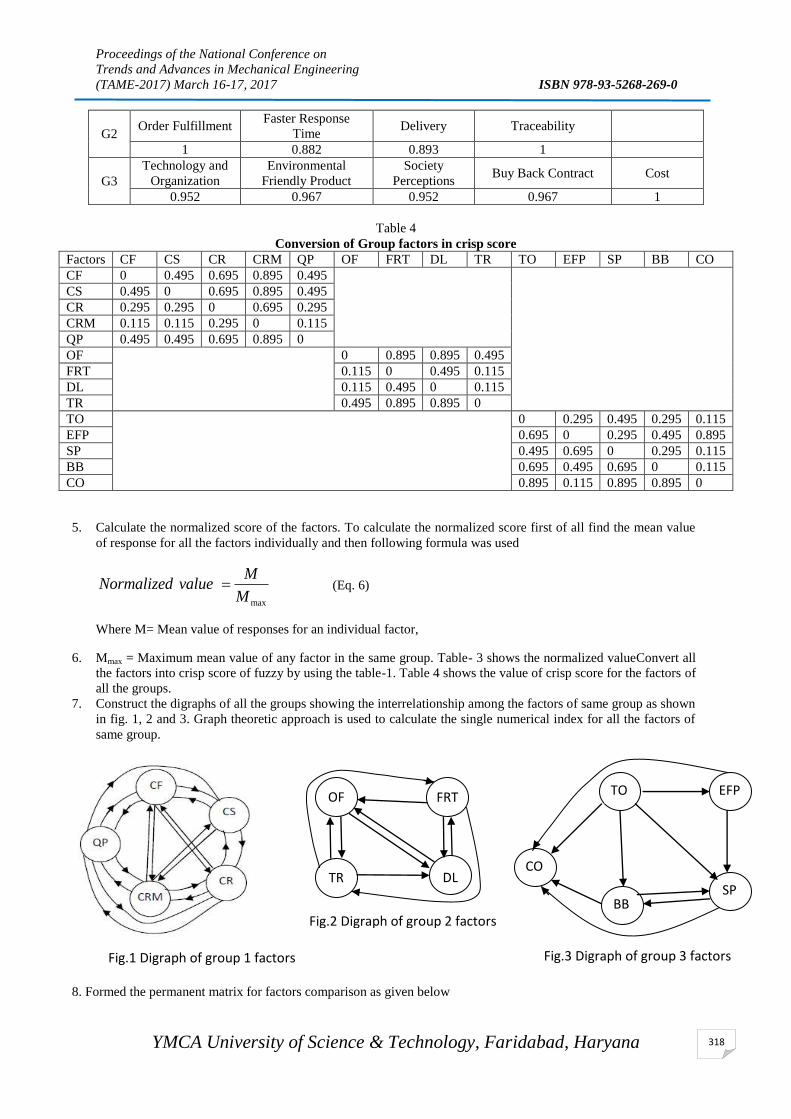
Proceedings of the National Conference on
Trends and Advances in Mechanical Engineering
(TAME-2017) March 16-17, 2017 ISBN 978-93-5268-269-0
YMCA University of Science & Technology, Faridabad, Haryana
318
G2 Order Fulfillment
Faster Response
Time Delivery Traceability
1 0.882 0.893 1
G3
Technology and
Organization
Environmental
Friendly Product
Society
Perceptions Buy Back Contract Cost
0.952 0.967 0.952 0.967 1
Table 4
Conversion of Group factors in crisp score
Factors CF CS CR CRM QP OF FRT DL TR TO EFP SP BB CO
CF 0 0.495 0.695 0.895 0.495
CS 0.495 0 0.695 0.895 0.495
CR 0.295 0.295 0 0.695 0.295
CRM 0.115 0.115 0.295 0 0.115
QP 0.495 0.495 0.695 0.895 0
OF 0 0.895 0.895 0.495
FRT 0.115 0 0.495 0.115
DL 0.115 0.495 0 0.115
TR 0.495 0.895 0.895 0
TO 0 0.295 0.495 0.295 0.115
EFP 0.695 0 0.295 0.495 0.895
SP 0.495 0.695 0 0.295 0.115
BB 0.695 0.495 0.695 0 0.115
CO 0.895 0.115 0.895 0.895 0
5. Calculate the normalized score of the factors. To calculate the normalized score first of all find the mean value
of response for all the factors individually and then following formula was used
max
Normalized va eM
Mlu (Eq. 6)
Where M= Mean value of responses for an individual factor,
6. Mmax = Maximum mean value of any factor in the same group. Table- 3 shows the normalized valueConvert all
the factors into crisp score of fuzzy by using the table-1. Table 4 shows the value of crisp score for the factors of
all the groups.
7. Construct the digraphs of all the groups showing the interrelationship among the factors of same group as shown
in fig. 1, 2 and 3. Graph theoretic approach is used to calculate the single numerical index for all the factors of
same group.
8. Formed the permanent matrix for factors comparison as given below
TO
CO
BB SP
EFP
Fig.3 Digraph of group 3 factors
OF
TR DL
FRT
Fig.2 Digraph of group 2 factors
Fig.1 Digraph of group 1 factors
Proceedings of the National Conference on
Trends and Advances in Mechanical Engineering
(TAME-2017) March 16-17, 2017 ISBN 978-93-5268-269-0
YMCA University of Science & Technology, Faridabad, Haryana
319
13
23
1 12 1
21 2 2
31 32 3 3
1 2 3
....
....
....
.... .... .... .... ....
....
m
m
m
m m m m
S S S
S S S S
VPM S S S
S S S S
S
S
(M- 1)
By using the matrix (M-1) the permanent function for all the four groups can be calculated. In this table the
diagonal elements are called inheritance elements whose value can be taken from table-3 while the off diagonal
elements are called interaction elements whose value can be taken from table 4.
The calculated permanent function for all the groups are given below
Permanent function for factors of G1 = 4.63
Permanent function for factors of G2 = 1.67
Permanent function for factors of G3 = 1.04
Results shows that factors of group 1 are more influential followed by factors of group-2. Factors of group 3 are
least influential.
4. Conclusion
By using fuzzy graph theoretic approach the importance of different factors is compared. This technique can be
further extended to compare the service quality of different supply chain partners.
References
Gupta T.K. & Singh, V. (2015) “A systemic approach to evaluate supply chain management environment index
using graph theoretic approach, IJLSM, Vol.21, N0.1, pp 1-45 .
Gupta T.K. & Singh, V. (2015) “Fuzzy graph theoretic approach to compare the factors affecting the service
quality of distributors, IJAER, Vol.10, No.78, pp 182-186.
Lummus, R. R., Krumwiede, D. W., & Vokurka, R. J. (2001), “The relationship of logistics to supply chain
management: developing a common industry definition”, Industrial Management & Data Systems, Vol. 101,
No.8, pp 426-432.
Robinson, C. J., & Malhotra, M. K. (2005), “Defining the concept of supply chain quality management and its
relevance to academic and industrial practice”, International Journal of Production Economics, Vol.96, No. 3,
pp 315-337.
Tzeng, G.H. & Huang J.J.,(2011) “Multiple Attribute Decision Making - Methods and applications” CRC Press,
New York.
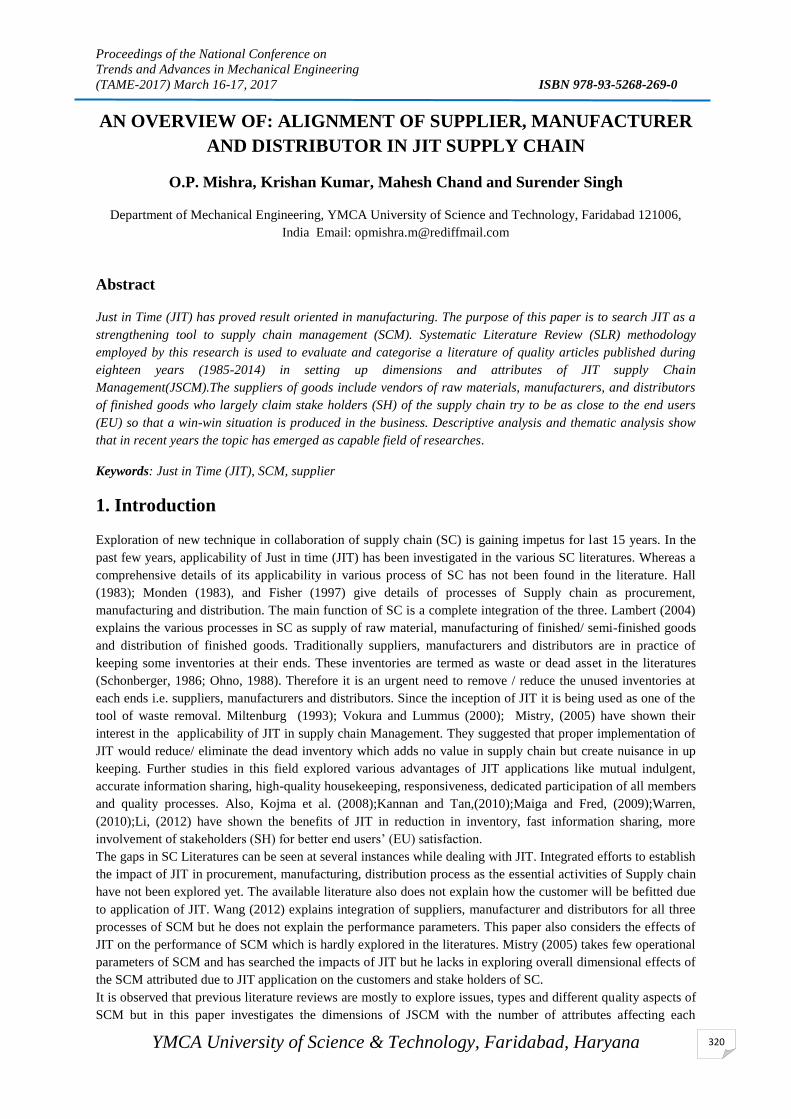
Proceedings of the National Conference on
Trends and Advances in Mechanical Engineering
(TAME-2017) March 16-17, 2017 ISBN 978-93-5268-269-0
YMCA University of Science & Technology, Faridabad, Haryana
320
AN OVERVIEW OF: ALIGNMENT OF SUPPLIER, MANUFACTURER
AND DISTRIBUTOR IN JIT SUPPLY CHAIN
O.P. Mishra, Krishan Kumar, Mahesh Chand and Surender Singh
Department of Mechanical Engineering, YMCA University of Science and Technology, Faridabad 121006,
India Email: [email protected]
Abstract
Just in Time (JIT) has proved result oriented in manufacturing. The purpose of this paper is to search JIT as a
strengthening tool to supply chain management (SCM). Systematic Literature Review (SLR) methodology
employed by this research is used to evaluate and categorise a literature of quality articles published during
eighteen years (1985-2014) in setting up dimensions and attributes of JIT supply Chain
Management(JSCM).The suppliers of goods include vendors of raw materials, manufacturers, and distributors
of finished goods who largely claim stake holders (SH) of the supply chain try to be as close to the end users
(EU) so that a win-win situation is produced in the business. Descriptive analysis and thematic analysis show
that in recent years the topic has emerged as capable field of researches.
Keywords: Just in Time (JIT), SCM, supplier
1. Introduction
Exploration of new technique in collaboration of supply chain (SC) is gaining impetus for last 15 years. In the
past few years, applicability of Just in time (JIT) has been investigated in the various SC literatures. Whereas a
comprehensive details of its applicability in various process of SC has not been found in the literature. Hall
(1983); Monden (1983), and Fisher (1997) give details of processes of Supply chain as procurement,
manufacturing and distribution. The main function of SC is a complete integration of the three. Lambert (2004)
explains the various processes in SC as supply of raw material, manufacturing of finished/ semi-finished goods
and distribution of finished goods. Traditionally suppliers, manufacturers and distributors are in practice of
keeping some inventories at their ends. These inventories are termed as waste or dead asset in the literatures
(Schonberger, 1986; Ohno, 1988). Therefore it is an urgent need to remove / reduce the unused inventories at
each ends i.e. suppliers, manufacturers and distributors. Since the inception of JIT it is being used as one of the
tool of waste removal. Miltenburg (1993); Vokura and Lummus (2000); Mistry, (2005) have shown their
interest in the applicability of JIT in supply chain Management. They suggested that proper implementation of
JIT would reduce/ eliminate the dead inventory which adds no value in supply chain but create nuisance in up
keeping. Further studies in this field explored various advantages of JIT applications like mutual indulgent,
accurate information sharing, high-quality housekeeping, responsiveness, dedicated participation of all members
and quality processes. Also, Kojma et al. (2008);Kannan and Tan,(2010);Maiga and Fred, (2009);Warren,
(2010);Li, (2012) have shown the benefits of JIT in reduction in inventory, fast information sharing, more
involvement of stakeholders (SH) for better end users’ (EU) satisfaction.
The gaps in SC Literatures can be seen at several instances while dealing with JIT. Integrated efforts to establish
the impact of JIT in procurement, manufacturing, distribution process as the essential activities of Supply chain
have not been explored yet. The available literature also does not explain how the customer will be befitted due
to application of JIT. Wang (2012) explains integration of suppliers, manufacturer and distributors for all three
processes of SCM but he does not explain the performance parameters. This paper also considers the effects of
JIT on the performance of SCM which is hardly explored in the literatures. Mistry (2005) takes few operational
parameters of SCM and has searched the impacts of JIT but he lacks in exploring overall dimensional effects of
the SCM attributed due to JIT application on the customers and stake holders of SC.
It is observed that previous literature reviews are mostly to explore issues, types and different quality aspects of
SCM but in this paper investigates the dimensions of JSCM with the number of attributes affecting each

Proceedings of the National Conference on
Trends and Advances in Mechanical Engineering
(TAME-2017) March 16-17, 2017 ISBN 978-93-5268-269-0
YMCA University of Science & Technology, Faridabad, Haryana
321
dimension. It is also tried to establish the positive relationship among each dimension, SH and EU through
setting up hypothesis by exploring the advantages of JIT applicability in SCM. This study will provide a wider
platform to understand various benefits, barriers and prospects of SCM as the topic is getting high concentration
in recent business. Jain et.al. al. (2011); Winter and Knemeyer, (2013) claims that today’s those firms will stand
out who have a brawny SCM. The gaps in SC Literatures can be seen at several instances while dealing with
JIT. Integrated efforts to establish the impact of JIT in procurement, manufacturing, distribution process as the
essential activities of Supply chain have not been explored yet. The available literature also does not explain
how the customer will be befitted due to application of JIT. Wang (2012) explains integration of suppliers,
manufacturer and distributors for all three processes of SCM but he does not explain the performance
parameters. This paper also considers the effects of JIT on the performance of SCM which is hardly explored in
the literatures. Mistry (2005) takes few operational parameters of SCM and has searched the impacts of JIT but
he lacks in exploring overall dimensional effects of the SCM attributed due to JIT application on the customers
and stake holders of SC.
2. Methodology
To carry out the reviews of the above topic structural Literature review (SLR) methodology has been adopted in
paper. It is also tried to establish the positive relationship among each dimension.
Systematic literature review (SLR) was first used in medical science and has expanded into the management and
other disciplines too. Five-step approach outlined by Denyer and Tranfield (2009) and adopted by Wong et.al.
(2012) shown in fig 1 has been used to inline the literatures on the subjects of supply chain and the literature
pertaining to applicability of Just in Time in various fields. In this method the concern topic is studied step by
step. Here the topic has been studied into five steps, which are; question formulation, locating studies, study
selection and evaluation, analysis and synthesis, and finally reporting results. The brief of each steps are being
given in subsequent paragraphs.
Figure 1
2.1 Formulation of the questions
The first step of a researcher is to set up a question before he proceeds for systematic studies. This can be done
with the consultation of experts from academia, industry and consultancy of SCM.. Two experts from
1. Question Formulation
3. Study Selection and Evaluation
4. Analysis and Synthesis
5. Reporting Results
2. Locating Studies

Proceedings of the National Conference on
Trends and Advances in Mechanical Engineering
(TAME-2017) March 16-17, 2017 ISBN 978-93-5268-269-0
YMCA University of Science & Technology, Faridabad, Haryana
322
academic, two from industry and one expert from the consultancy of SCM, who used to provide Supply chain
solutions to the multinational companies (MNC) were contacted for expert opinions. Firstly, the five experts
were consulted with the vision to find out relevance of this study. On the opinion of experts to go ahead, authors
framed three primary questions to be answered.
The key concerns of the supply chain in today’s business scenario.
The relevance of Just in time (JIT) in SCM
Performance improvement due to JIT application in SC
2.2 Finding the suitable stuff
Keywords searches such as JIT, Supply chain, supply chain performance, supply chain measure, JIT
environment, attributes of JIT and SCM were used to identify articles published between 1985 to 2014 in
specific management databases such as ISI Web of Knowledge and Scopus. Further, in order to justify the
analysis adopted for this extraction, the above primary questions were kept into consideration.
The literature search was restricted to peer –reviewed publications. About 3800 publications, from world
reputed publishers like science direct, emerald, Taylor and Francis and InderScience direct were found showing
the search results on key words used. It might have created the duplicate data so a cross check of the search
result was carried out and we found 405 articles suitable.
2.3. Selection of study and evaluation
Initially 405 abstract of various papers were reviewed. Then selection of the abstract and rejection was checked
as per the Question of this Study and which is as per (Miles and Huberman, 1994). Further to narrow the search
and to focus on the objectivity of the subject by taking the following five points in consideration reduced the
number of RA to a tune of 106.
1. Concept of supply chain and challenges in implications.
2. JIT concept applicable in the field of Supply chain management (SCM)
3. Dimensions and attributes of SCM practiced in JIT environments.
4. Language should be English
5. Journal should be of high quality, double blind peer reviewed.
Further refined search was carried out with the help of five experts. The experts taken from academics (in field
of SCM and JIT), industry (supply chain manager at senior level) and consultancy of SCM were enough
competent to reply our queries. These experts were given each paper to review independently and experts were
asked to write the score of the article based on criteria given in table 1. The experts reviewed with the content,
quality, language of the articles. The quality criteria applied were based on the standard criteria developed for
SLR at Cranfield University. The criteria set are as Contribution, theory, methodology and data analysis. After
application of more stringent quality of 106 RAs the total number of shortened RA with potential linking with
the objectivity were taken to 86. These RA were investigated by researchers thoroughly and useful information
was documented in the coming sections.
2.4. Analysis and synthesis
All 86 RAs were peer reviewed and were classified into five categories based on methodology used by the
authors such as; conceptual, empirical, case studies, survey and literature surveys. These RA were looked for
conceptual discussion, empirical evidences, case studies of the firms, survey based studies and then literature
reviews on the topic year wise. As the evolution of JIT can be seen in 1985 onwards, all research articles (RA)
are taken year starting from 1985 to 2014. Some papers were falling in more than one category i.e. a conceptual
paper may include a case study. This again alerted the researcher to take the expert opinion. The specific RA
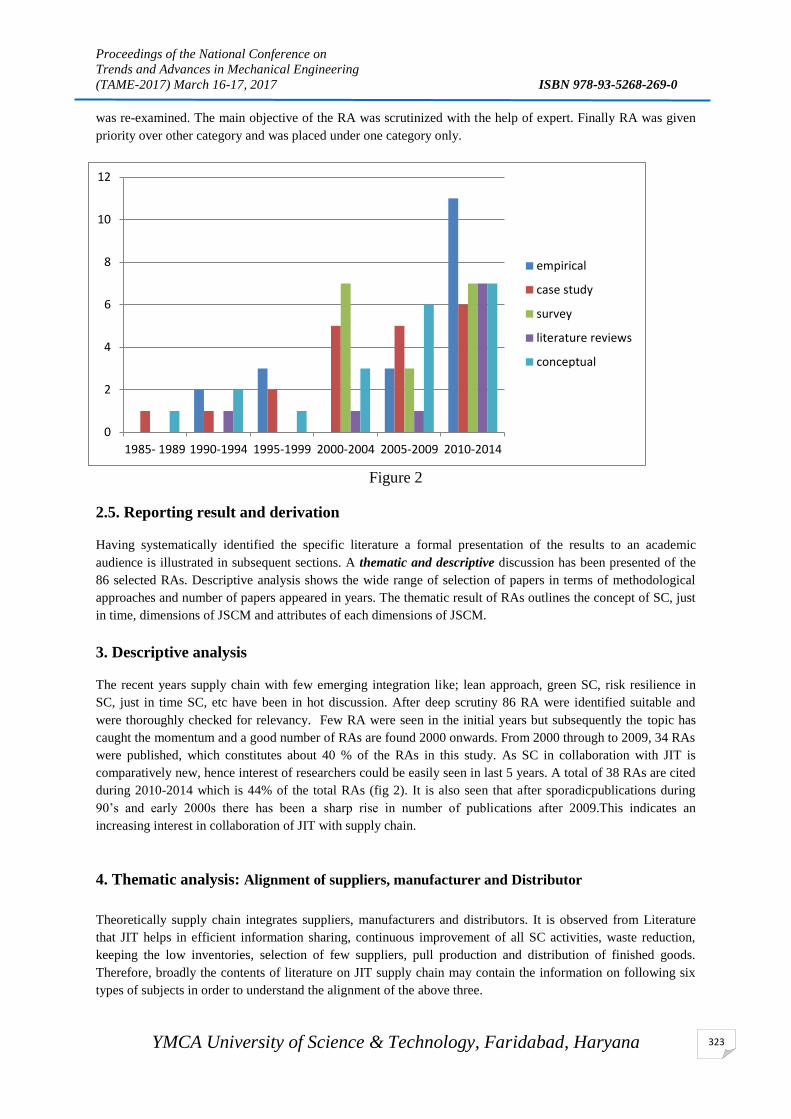
Proceedings of the National Conference on
Trends and Advances in Mechanical Engineering
(TAME-2017) March 16-17, 2017 ISBN 978-93-5268-269-0
YMCA University of Science & Technology, Faridabad, Haryana
323
was re-examined. The main objective of the RA was scrutinized with the help of expert. Finally RA was given
priority over other category and was placed under one category only.
Figure 2
2.5. Reporting result and derivation
Having systematically identified the specific literature a formal presentation of the results to an academic
audience is illustrated in subsequent sections. A thematic and descriptive discussion has been presented of the
86 selected RAs. Descriptive analysis shows the wide range of selection of papers in terms of methodological
approaches and number of papers appeared in years. The thematic result of RAs outlines the concept of SC, just
in time, dimensions of JSCM and attributes of each dimensions of JSCM.
3. Descriptive analysis
The recent years supply chain with few emerging integration like; lean approach, green SC, risk resilience in
SC, just in time SC, etc have been in hot discussion. After deep scrutiny 86 RA were identified suitable and
were thoroughly checked for relevancy. Few RA were seen in the initial years but subsequently the topic has
caught the momentum and a good number of RAs are found 2000 onwards. From 2000 through to 2009, 34 RAs
were published, which constitutes about 40 % of the RAs in this study. As SC in collaboration with JIT is
comparatively new, hence interest of researchers could be easily seen in last 5 years. A total of 38 RAs are cited
during 2010-2014 which is 44% of the total RAs (fig 2). It is also seen that after sporadicpublications during
90’s and early 2000s there has been a sharp rise in number of publications after 2009.This indicates an
increasing interest in collaboration of JIT with supply chain.
4. Thematic analysis: Alignment of suppliers, manufacturer and Distributor
Theoretically supply chain integrates suppliers, manufacturers and distributors. It is observed from Literature
that JIT helps in efficient information sharing, continuous improvement of all SC activities, waste reduction,
keeping the low inventories, selection of few suppliers, pull production and distribution of finished goods.
Therefore, broadly the contents of literature on JIT supply chain may contain the information on following six
types of subjects in order to understand the alignment of the above three.
0
2
4
6
8
10
12
1985- 1989 1990-1994 1995-1999 2000-2004 2005-2009 2010-2014
empirical
case study
survey
literature reviews
conceptual
Proceedings of the National Conference on
Trends and Advances in Mechanical Engineering
(TAME-2017) March 16-17, 2017 ISBN 978-93-5268-269-0
YMCA University of Science & Technology, Faridabad, Haryana
324
a. Topic on information sharing
b. Content related to JIT Procurement process
c. content related to JIT manufacturing process
d. content related to JIT Distribution process
e. content related to performance evaluation of JIT in SC
f. Literature related to human involvement
5. Conclusions
JIT Supply chain management integrates Suppliers, manufacturers and distributors for close coordination with
the attitudes of time compression and minimum inventory management. Hence their alignment with End users
i.e. customer is extremely urgent. The manufacturer’s products are fully dependent on the supply of raw
materials and efficiently distribution of finished goods into the hands of users. User’s satisfaction tends to
increase the the scope of business. The satisfaction will depends upon cost, speed, timeliness, aesthetic look,
after sale look after, real time information of products etc.
References
[1]. Hall, R.W., (1983), “Zero Inventories. Homewood, I.L”, Dow Jones-Irwin Press.
[2]. Jain, D., Bhimaraya, A., Metri, Aggarwal, V. (2011), “Analytical modelling of multi stage convergent supply
chain system under just-in-time”, International Journal of Applied Management science, Vol. 3 No.2, pp. 210-
215.
[3]. Kannan, V.R. and Tan, K.C. (2010), “Supply chain integration: cluster analysis of the impact of span of
integration”, Supply Chain Management: An International Journal, Vol. 15 No. 3, pp. 207-15.
[4]. Kaynak, H., (1997), “Total Quality Management and Just-in-Time Purchasing: Their Effects on Performance of
Firms Operating in the U.S”, Taylor & Francis
[5]. Kojima, M., Kenichi, N., Ohino, K., (2008), “Performance evaluation of SCM in JIT environment”,
International journal Production Economics Vol.115, pp. 439– 443.
[6]. Lambert, D.M. (2004), “The eight essential supply chain management processes”, Supply Chain Management
Review, Vol.8, No.6, pp.18 - 26.
[7]. Maiga A.S. & Fred A. J., (2009), “JIT performance effects: A research note”, Advances in Accounting,
incorporating Advances in International Accounting, Vol.2, pp. 183–189.
[8]. Mandal, A. and Deshmukh, S.G. (1994), “Vendor selection using interpretive structural modelling (ISM)”, Int.
J. Operation and Production Management, Vol. 14, No. 6, pp.52–59.
[9]. Miltenburg. (1993), ‘A theoretical framework for understanding why JIT reduces cost and cycle time and
improves quality’. International Journal of Production Economics, Vol.30-31,pp. 195-204.
[10]. Mistry, J. J. (2005),"Origins of profitability through JIT processes in the supply chain", Industrial
Management and Data Systems, Vol. 105, No. 6, pp. 752 – 768.
[11]. Ohino T. (1988), “Toyota Production System: Beyond Large Scale Production”, Cambridge Mass:
Productivity Press.
[12]. Schonberger, R.J. and Ansari, A. (1984), “Just-in-time purchasing can improve quality’, Journal of
Purchasing and Materials Management, Vol. 20, No. 1, pp. 2–7.
[13]. Schonberger, R.J., (1986), “Japanese Manufacturing Techniques: Nine Hidden Lessons in
Simplicity”, the Free Press, New York.

Proceedings of the National Conference on
Trends and Advances in Mechanical Engineering
(TAME-2017) March 16-17, 2017 ISBN 978-93-5268-269-0
YMCA University of Science & Technology, Faridabad, Haryana
325
[14]. Wang, W., Fung R.Y.K., Chai, Y., (2004), “Approach of just-in-time distribution requirements
planning for supply chain management”, International Journal Production Economics, Vol.91, pp. 101–107.
[15]. Wong, C., Heather, S., Godsell, J., Achimugu, N. (2012),"Towards a theory of Supply chain
alignment enablers: a systematic literature review", Supply Chain Management: An International Journal, Vol.
17,No. 4, pp. 419 -437.
[16]. Vokura, R.J. and Lummus, R.R., (2000),"The Role of Just-In-Time in Supply Chain Management".
The International Journal of Logistics Management, Vol. 11, No. 1, pp. 89 – 98.
[17]. Winter, M.& Knemeyer, M., (2013),"Exploring the Integration of Sustainability and Supply Chain
Management - Current State and Opportunities for Future Inquiry", International Journal of Physical
Distribution & Logistics Management, Vol. 43,No. 1, pp 18-38
[18]. Fisher, M.L., (1997), “What is the right supply chain for your product”, Harvard Business Review,
Vol.75, No.2, pp.105–116.

Proceedings of the National Conference on
Trends and Advances in Mechanical Engineering
(TAME-2017) March 16-17, 2017 ISBN 978-93-5268-269-0
YMCA University of Science & Technology, Faridabad, Haryana
326
IDENTIFICATION OF TOOLS OF LEAGILE MANUFACTURING
SYSTEM : A CASE STUDY
Naveen Virmani1
, Rajeev Saha2, Rajeshwar Sahai
3
1 Research Scholar, YMCAUST, Faridabad
2 Assistant Professor, Department of Mechanical Engineering, YMCAUST, Faridabad
3 Director, Rattan College, Faridabad
Abstract
Leagility has become one of the powerful tool which can help the industries to grow at a very fast rate. Today,
almost all the industries are using this tool to compete in market and earn profits. Leagility is concerned with
both lean and agile systems simultaneously. Upstream of supply chain system needs to be lean while
downstream agile system need to be adopted to respond to customer demand as quickly as possible. So hybrid
approach is adopted instead of using single strategy alone.
Keywords: Lean Manufacturing, Agile Manufacturing, Leagile Manufacturing.
1. Introduction and Literature review
Taichi Ohno, who was given the task of developing a system that would enhance productivity at Toyota, is
generally considered to be a primary force behind the system(Towill,2001).According to Mason Jones et.
al.(2000), the definition of value stream in lean depends on a customer and cost perspective, rather than
organization’s viewpoint, and a lean manufacturing typically has predictable demand, low product variety,
longer product life cycles, and cost driven customers.
Leanness is a parameter that is focused on reutilizing lesser input to better achieve the goals of organization so
as to achieve better inputs (Houshmand and Jamshidnezhad, 2006). Leanness means developing a value stream
to eliminate all waste, including time and to ensure a lever schedule(Naylor, 1999).Womack(1999) have
explained lean as
Systematic Process involving best practice and continuous improvement involving everyone.
Eliminates everything which is non-value added.
No single entity can make the organization lean
Lean Manufacturing is mixed socio technical system whose main objective are to eliminate waste and reduce
the variability of suppliers, customers, and internal resources and processes (shah and ward, 2003). Kaizen have
also shown significant results in improving the quality of product as it is seen in case study of automotive
industry (Mohd. Anees Siddiqui, 2013). Nitin Upadhye et al, (2010) described major actions taken by the
company to implement lean thinking to improve its efficiency and effectiveness.
Dankbaar (1997), Leanis concerned with producing parts at lower cost and higher quality using less input i.e.
less time, less material, less space, less money
Agility refers to the capability of the organization to reconfigure itself rapidly to meet the fluctuating needs of
customers. Agility is defined as business wide practice that comprises organizational structure, information
systems, and logistics processes and employees mindsets. (Christopher, 2000). According to Gupta and Mittal
(1996) , AM is a business concept that integrates organizations , people and technology into a meaningful unit
by deploying advanced information technologies and flexible and nimble organization structures to support
highly skilled, knowledgeable and motivated people.
The key enablers of agile manufacturing include: (i) virtual enterprise formation tools/metrics; (ii) physically
distributed manufacturing architecture and teams; (iii) rapid partnership formation tools/metrics; (iv) concurrent
engineering; (v) integrated product/production/business information system; (vi) rapid prototyping; and (vii)
electronic commerce (Gunasekaran 1998).

Proceedings of the National Conference on
Trends and Advances in Mechanical Engineering
(TAME-2017) March 16-17, 2017 ISBN 978-93-5268-269-0
YMCA University of Science & Technology, Faridabad, Haryana
327
Leagile is a combination of both lean as well as agile manufacturing. Both the systems are separated by a de-
coupling point. Upstream there is a level schedule, so lean manufacturing is applied so that the products can be
manufactured at reduced cost while downstream the agile system is adopted so that the system can be
reconfigured efficiently and quickly in order to meet fluctuating demand patterns of the customer. Naylor (1999)
have suggested a model for different positions of de-coupling point
Figure 1:Supply chain strategies and positioning de-coupling point(Naylor et. al,1999)
Another Leagile strategy is given by van hoek(2000), he suggested to delay the manufacturing assembly
activities till customer demands. Once the customer order is achieved, the products are assembled and shipped.
So the operational activity (mainly assembly) is delayed rather than producing the product in advance and
stocked. This can be explained as let a particular bolt is required in component A as well as in component B.
Suppose product A is manufactured and ready for use without using postponement strategy and suddenly
customer demand arises for component B and the industry get stock out of bolts. In that case, the industry will
have to wait first for bolts, demanding upon the lead time. So by postponement strategy, the assembly activity
can be intentionally delayed so as to reduce the inventory cost and at the same time, the fluctuating demand can
be met.
2. Questionnaire based survey The questionnaire was designed on a 5-point Likart scale. It contained many issues regarding the
implementation and tools for transition to Leagile manufacturing . 14 tools , selected through literature and
discussions with experts, were mentioned in this survey format. The respondents were asked to indicate the level
of difficulty in handling these barriers. On the Likert scale, 1 stands for very low and 5 for very high difficulty
in handling these tools
a. Survey administration
The self-contact, e-mail and postal survey methods were used for the administration of survey. The chief-
executives/managing directors/general managers/works managers/senior executives were contacted in person for
getting their response. Some questionnaires were e-mailed to some industries and some questionnaires, along
with a covering letter, self-addressed and a stamped envelope, were mailed to these top executives. In total,
questionnaires were sent to 25 Indian companies.
b. Survey responses and the respondents’ profile
Of the 25 questionnaires, 15 filled up questionnaires were received. Seven questionnaires were incompletely
filled and were discarded. This gives a response rate of 60%, which is not very low for such surveys. In most of
the cases, the addressee filled the questionnaire on their own but in some cases; some senior executives of the
companies also filled the questionnaires on behalf of addressee. Of the 15 respondents, 4 had less than 100
employees, 6 had 101–500 employees, 5 had 501–1000 employees. In terms of turnover, 5 of the respondents
had annual turnover up to $10 million, 3 had turnover in the range of $10–20 million, 7 in the range of $20–100
million.

Proceedings of the National Conference on
Trends and Advances in Mechanical Engineering
(TAME-2017) March 16-17, 2017 ISBN 978-93-5268-269-0
YMCA University of Science & Technology, Faridabad, Haryana
328
c. Results of survey
The main purpose of this questionnaire-based survey was to find the weight of some barriers, which inhibit the
transition to leagile manufacturing . Major finding of this survey is that only 60 % companies are interested in
transition to leagile manufacturing system because of many practical problems like training of employees, lack
of research and development activities
3. Tools of leagile manufacturing system
a. 5S
b. Kaizen
c. TQM
d. TPM
e. Quality Circle
f. Benchmarking
g. Poke –yoke
h. Six Sigma
i. Brain Storming
j. SMED (Single minute exchange of dies)
k. JIT
l. VSM
m. Modern Manufacturing Processes
n. Group Technology
4. Conclusion It has been seen through survey and discussion with experts that leagile manufacturing plays a important role in
improving the performance of industries. If employees get training on how to successfully use these tools and all
these tools are used then automatically the production and profitability of the industries will increase drastically.
The quality of the product will increase and this will help in achieving maximum customer satisfaction and
ultimately sales will increase.
References
Gunasekaran(1998), “ Agile Manufacturing enablers and an implementation framework, International Journal of
production research”36(5),1223-1247
Gupta,D,Buzacott,J.A(1993), “Models for first pass FMS investment analysis,” Internatoional journal of flexible
manufacturing systems,5,263-286
Houshmand, M and Jamshidnezhad, B(2006), “ An extended model of design process of lean production
systems by means of process variables”, Robotics and computer integrated manufacturing, 22(1), 1-16.
Mohd Anees Siddiqui (2013), ― “Kaizen Improvement Event (K-188) in an Automotive Industry – A Case
Study” International Journal of Engineering Research & Technology (IJERT) 2(10), October – 2013
Naylor, J.B, Naim, M.M and Berry, D(1999),”Leagility: Integrating the lean and agile manufacturing paradigms
in total supply chain” International Journal of Production Economics, Vol.62,pp.107-18.
Nitin Upadhye S.G Desmukh and Suresh Garg (2010) ―Lean manufacturing system for medium size
manufacturing enterprises: an Indian case‖ International Journal of Management science 2010, 5(5): 362-375
Shah, R., Ward, P.T., (2003), Lean manufacturing: context, practice bundles, and performance. Journal of
Operations Management 21(2), 129–149
Towill, D. (2001), “Supply chain migration from lean and functional to agile and customized”, Supply chain
Management,5 (4),pp. 206-13.

Proceedings of the National Conference on
Trends and Advances in Mechanical Engineering
(TAME-2017) March 16-17, 2017 ISBN 978-93-5268-269-0
YMCA University of Science & Technology, Faridabad, Haryana
329
Van,Hoek, R.I. (2000), “The thesis of leagility revisited” International Journal of Agile Manufacturing Systems,
2(3),pp. 196-201
Womack J, Jones D (1999). Lean thinking: Banish waste and create wealth in your corporation. Simon and
Schuster, New York, NY.
Proceedings of the National Conference on
Trends and Advances in Mechanical Engineering
(TAME-2017) March 16-17, 2017 ISBN 978-93-5268-269-0
YMCA University of Science & Technology, Faridabad, Haryana
330
ANALYSIS OF BARRIERS OF LEAN MANUFACTURING SYSTEM: A
FUZZY-ISM APPROACH
Vivek Kalsariya1, Faizan Iqbal
2, Varinder Kr. Mittal
3, Punj Lata Singh
4
1,2 PG Student, Industrial and Production Engineering, Amity University, Noida
3Associate Professor , Mechanical Engg. Department, Amity University, Uttar Pradesh, Noida
4Assistant Professor, Civil Engineering Department, Amity University, Uttar Pradesh, Noida
ABSTRACT
Lean manufacturing is a production technique which is employed in order to reduce or eliminate various kinds
of wastes which creep into our system and cater to huge losses as well as prove to be very hazardous towards
the preservation of environmental balance. So, it is a technique of reducing the wastes by redefining the whole
production system right from the equipment up to the strategic level. In this paper, we have identified 9 barriers
of Lean Manufacturing which prove as a roadblock in the adoption of this system. After this, the Fuzzy-ISM
approach was applied in order to find out the level of barriers and their effect and dependency.
Keywords: Lean Manufacturing; Barriers; FUZZY method; ISM method
Introduction
The concept of Lean Manufacturing (LM) being a very effective one with prolonged usage and results was first
of all established in Japan under Toyota Production system. The concept of LM had gone under vigorous testing
before it was implemented. LM means such a kind of system which enables us to manufacture things without
producing unwanted wastes. Wastes may be in the form of processes applied, procedures undertaken and also
there might be certain breaches in finalizing the policies and regulatory operations. We are aware of the fact that
wastes undoubtedly consume a lot of resources without adding any kind of value to our product (Singh et al.,
2009). So, as a result huge investments are incurred in such futile exercises of undesired inventory which thus
lead to unfavorable conditions. If we can reduce such wastes, then there gets an opportunity created that we
might invest these resources elsewhere for larger benefits of the unit. So, the larger picture is that the LM
eliminates the root cause of waste formation and then helps in extracting high valued outputs at the cost of
minimal inputs (Comm and Mathaisel, 2000). The espoused goals of lean manufacturing systems differ between
various authors. While some maintain an internal focus, e.g. to increase profit for the organization, others claim
that improvements should be done for the sake of the customer.
Literature review
Lean manufacturing is a thought of utilization of less resources in terms of input to create some output. Lean
production system is developing to sustain in market where resource is limited and decreasing day by day.
Bhasin and Burcher (2006) have found that there is problem in the adaption or implementing the lean production
system smoothly.for that reason (Mallick, D.Z., et. al 2012) identified lean manufacturing barriers for Indian
manufacturing sector and with use of surveyor’s data they optimize it. To implement lean manufacturing system
in indian manufacturing sector we have to focus on some key barriers. If we focus on that key barriers and try to
overcome them than lean implementation is very much is to implement.
Some commonly mentioned goals are:Improve quality: By analyzing the system and eliminating the unwanted
things, ultimately the product gets enriched with quality processes. Eliminate waste: Waste is any activity that
consumes time, resources, or space but does not add any value to the product or service.Reduce time: Reducing
the time it takes to finish an activity from start to finish is one of the most effective ways to eliminate waste and
lower costs.Reduce total costs: To minimize cost, a company must produce only to customer demand.
Overproduction increases a company’s inventory costs because of storage needs.
Lean Manufacturing Barriers
Table 1: Lean Manufacturing Barriers data
Sr. Name Description References
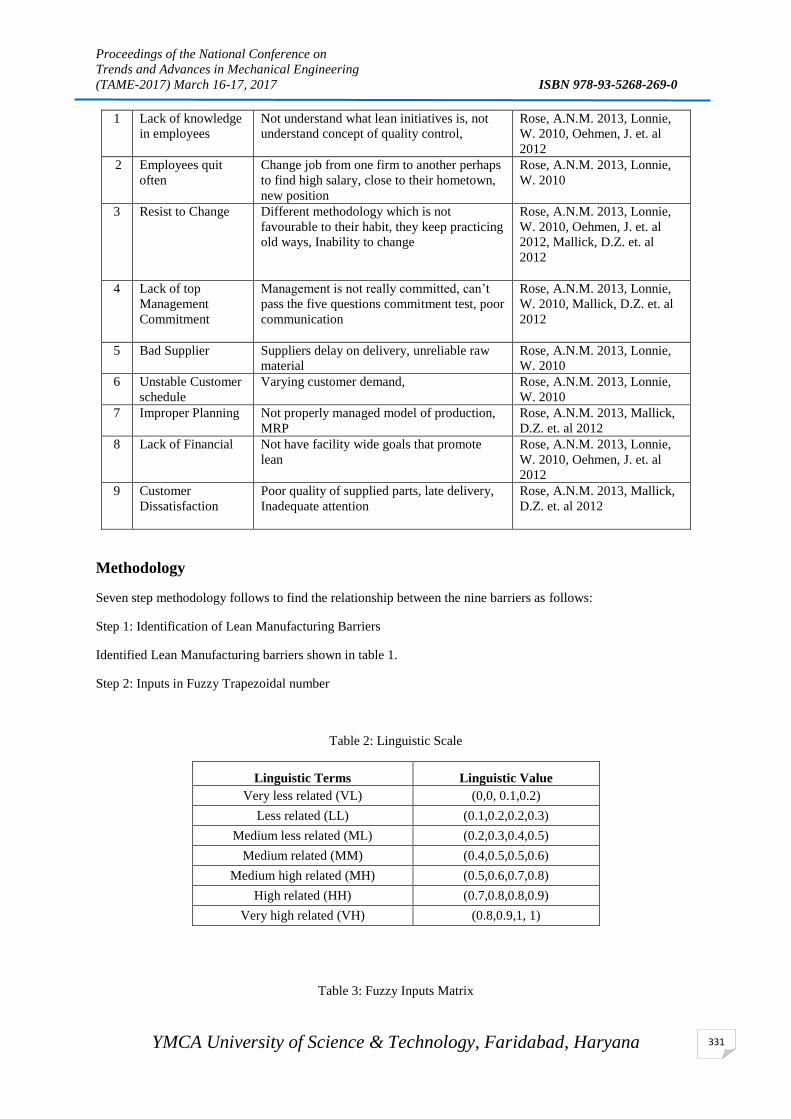
Proceedings of the National Conference on
Trends and Advances in Mechanical Engineering
(TAME-2017) March 16-17, 2017 ISBN 978-93-5268-269-0
YMCA University of Science & Technology, Faridabad, Haryana
331
1 Lack of knowledge
in employees
Not understand what lean initiatives is, not
understand concept of quality control,
Rose, A.N.M. 2013, Lonnie,
W. 2010, Oehmen, J. et. al
2012
2 Employees quit
often
Change job from one firm to another perhaps
to find high salary, close to their hometown,
new position
Rose, A.N.M. 2013, Lonnie,
W. 2010
3 Resist to Change Different methodology which is not
favourable to their habit, they keep practicing
old ways, Inability to change
Rose, A.N.M. 2013, Lonnie,
W. 2010, Oehmen, J. et. al
2012, Mallick, D.Z. et. al
2012
4 Lack of top
Management
Commitment
Management is not really committed, can’t
pass the five questions commitment test, poor
communication
Rose, A.N.M. 2013, Lonnie,
W. 2010, Mallick, D.Z. et. al
2012
5 Bad Supplier Suppliers delay on delivery, unreliable raw
material
Rose, A.N.M. 2013, Lonnie,
W. 2010
6 Unstable Customer
schedule
Varying customer demand, Rose, A.N.M. 2013, Lonnie,
W. 2010
7 Improper Planning Not properly managed model of production,
MRP
Rose, A.N.M. 2013, Mallick,
D.Z. et. al 2012
8 Lack of Financial Not have facility wide goals that promote
lean
Rose, A.N.M. 2013, Lonnie,
W. 2010, Oehmen, J. et. al
2012
9 Customer
Dissatisfaction
Poor quality of supplied parts, late delivery,
Inadequate attention
Rose, A.N.M. 2013, Mallick,
D.Z. et. al 2012
Methodology
Seven step methodology follows to find the relationship between the nine barriers as follows:
Step 1: Identification of Lean Manufacturing Barriers
Identified Lean Manufacturing barriers shown in table 1.
Step 2: Inputs in Fuzzy Trapezoidal number
Table 2: Linguistic Scale
Linguistic Terms Linguistic Value
Very less related (VL) (0,0, 0.1,0.2)
Less related (LL) (0.1,0.2,0.2,0.3)
Medium less related (ML) (0.2,0.3,0.4,0.5)
Medium related (MM) (0.4,0.5,0.5,0.6)
Medium high related (MH) (0.5,0.6,0.7,0.8)
High related (HH) (0.7,0.8,0.8,0.9)
Very high related (VH) (0.8,0.9,1, 1)
Table 3: Fuzzy Inputs Matrix
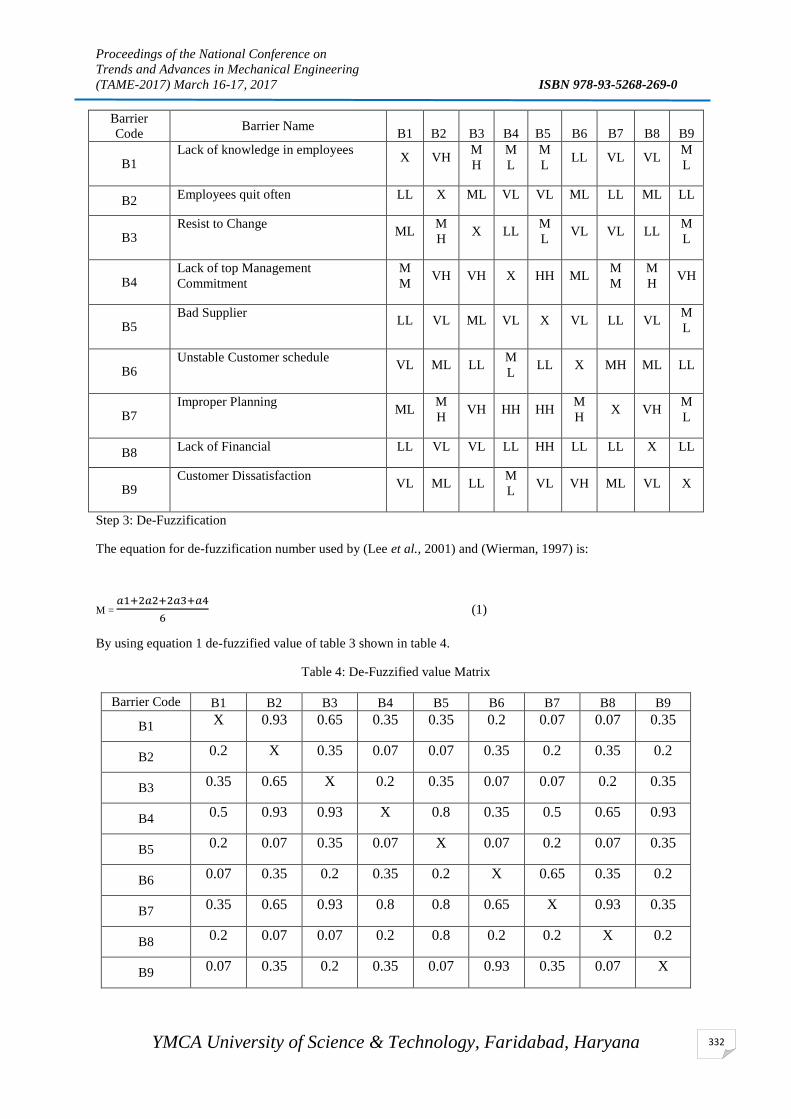
Proceedings of the National Conference on
Trends and Advances in Mechanical Engineering
(TAME-2017) March 16-17, 2017 ISBN 978-93-5268-269-0
YMCA University of Science & Technology, Faridabad, Haryana
332
Barrier
Code Barrier Name
B1 B2 B3 B4 B5 B6 B7 B8 B9
B1 Lack of knowledge in employees
X VH M
H
M
L
M
L LL VL VL
M
L
B2 Employees quit often LL X ML VL VL ML LL ML LL
B3 Resist to Change
ML M
H X LL
M
L VL VL LL
M
L
B4 Lack of top Management
Commitment
M
M VH VH X HH ML
M
M
M
H VH
B5 Bad Supplier
LL VL ML VL X VL LL VL M
L
B6 Unstable Customer schedule
VL ML LL M
L LL X MH ML LL
B7 Improper Planning
ML M
H VH HH HH
M
H X VH
M
L
B8 Lack of Financial LL VL VL LL HH LL LL X LL
B9 Customer Dissatisfaction
VL ML LL M
L VL VH ML VL X
Step 3: De-Fuzzification
The equation for de-fuzzification number used by (Lee et al., 2001) and (Wierman, 1997) is:
M = 𝑎1+2𝑎2+2𝑎3+𝑎4
6 (1)
By using equation 1 de-fuzzified value of table 3 shown in table 4.
Table 4: De-Fuzzified value Matrix
Barrier Code B1 B2 B3 B4 B5 B6 B7 B8 B9
B1 X 0.93 0.65 0.35 0.35 0.2 0.07 0.07 0.35
B2 0.2 X 0.35 0.07 0.07 0.35 0.2 0.35 0.2
B3 0.35 0.65 X 0.2 0.35 0.07 0.07 0.2 0.35
B4 0.5 0.93 0.93 X 0.8 0.35 0.5 0.65 0.93
B5 0.2 0.07 0.35 0.07 X 0.07 0.2 0.07 0.35
B6 0.07 0.35 0.2 0.35 0.2 X 0.65 0.35 0.2
B7 0.35 0.65 0.93 0.8 0.8 0.65 X 0.93 0.35
B8 0.2 0.07 0.07 0.2 0.8 0.2 0.2 X 0.2
B9 0.07 0.35 0.2 0.35 0.07 0.93 0.35 0.07 X

Proceedings of the National Conference on
Trends and Advances in Mechanical Engineering
(TAME-2017) March 16-17, 2017 ISBN 978-93-5268-269-0
YMCA University of Science & Technology, Faridabad, Haryana
333
Step 4: Initial Reachability Matrix
Formatting of Initial Reachability Matrix is done from table 4 using following equation:
M = 0, 𝑀 ≤ 0.451, 𝑀 > 0.45
(2)
Table 5: Initial Reachability Matrix
Barrier Code B1 B2 B3 B4 B5 B6 B7 B8 B9
B1 1 1 1 0 0 0 0 0 0
B2 0 1 0 0 0 0 0 0 0
B3 0 1 1 0 0 0 0 0 0
B4 1 1 1 1 1 0 1 1 1
B5 0 0 0 0 1 0 0 0 0
B6 0 0 0 0 0 1 1 0 0
B7 0 1 1 1 1 1 1 1 0
B8 0 0 0 0 1 0 0 1 0
B9 0 0 0 0 0 1 0 0 1
Step 5: Final Reachability Matrix (Transitivity checked)
After checking transitivity of table 5 converted matrices show in table 6.
Table 6: Final Reachability Matrix
Barrier Code B1 B2 B3 B4 B5 B6 B7 B8 B9
B1 1 1 1 0 0 0 0 0 0
B2 0 1 0 0 0 0 0 0 0
B3 0 1 1 0 0 0 0 0 0
B4 1 1 1 1 1 1* 1 1 1
B5 0 0 0 0 1 0 0 0 0
B6 0 0 0 0 0 1 1 0 0
B7 1* 1 1 1 1 1 1 1 1*
B8 0 0 0 0 1 0 0 1 0
B9 0 0 0 0 0 1 0 0 1
Step 6: Level Partitioning
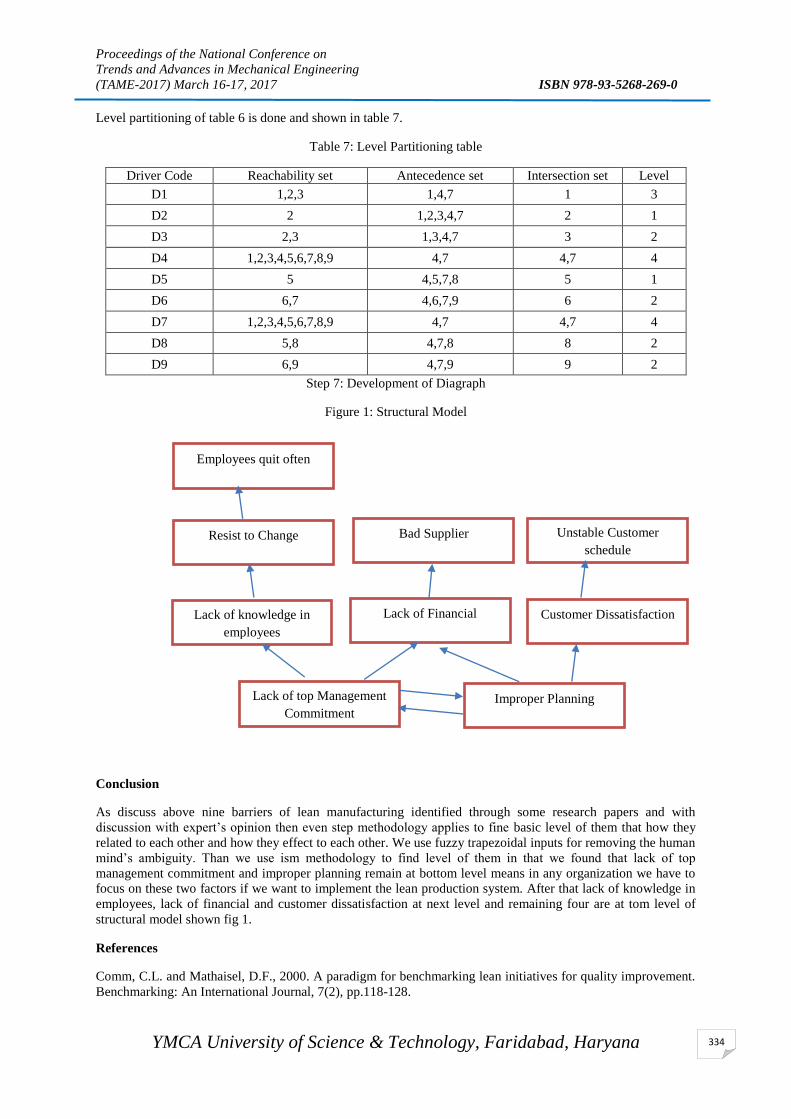
Proceedings of the National Conference on
Trends and Advances in Mechanical Engineering
(TAME-2017) March 16-17, 2017 ISBN 978-93-5268-269-0
YMCA University of Science & Technology, Faridabad, Haryana
334
Level partitioning of table 6 is done and shown in table 7.
Table 7: Level Partitioning table
Driver Code Reachability set Antecedence set Intersection set Level
D1 1,2,3 1,4,7 1 3
D2 2 1,2,3,4,7 2 1
D3 2,3 1,3,4,7 3 2
D4 1,2,3,4,5,6,7,8,9 4,7 4,7 4
D5 5 4,5,7,8 5 1
D6 6,7 4,6,7,9 6 2
D7 1,2,3,4,5,6,7,8,9 4,7 4,7 4
D8 5,8 4,7,8 8 2
D9 6,9 4,7,9 9 2
Step 7: Development of Diagraph
Figure 1: Structural Model
Conclusion
As discuss above nine barriers of lean manufacturing identified through some research papers and with
discussion with expert’s opinion then even step methodology applies to fine basic level of them that how they
related to each other and how they effect to each other. We use fuzzy trapezoidal inputs for removing the human
mind’s ambiguity. Than we use ism methodology to find level of them in that we found that lack of top
management commitment and improper planning remain at bottom level means in any organization we have to
focus on these two factors if we want to implement the lean production system. After that lack of knowledge in
employees, lack of financial and customer dissatisfaction at next level and remaining four are at tom level of
structural model shown fig 1.
References
Comm, C.L. and Mathaisel, D.F., 2000. A paradigm for benchmarking lean initiatives for quality improvement.
Benchmarking: An International Journal, 7(2), pp.118-128.
Lack of top Management
Commitment
Lack of Financial
Employees quit often
Resist to Change
Lack of knowledge in
employees
Improper Planning
Bad Supplier Unstable Customer
schedule
Customer Dissatisfaction

Proceedings of the National Conference on
Trends and Advances in Mechanical Engineering
(TAME-2017) March 16-17, 2017 ISBN 978-93-5268-269-0
YMCA University of Science & Technology, Faridabad, Haryana
335
Lee, T.Y., Lee, S.Y. and Lee, H.M., A note on Evaluating the rate of aggregative risk in software development
using fuzzy sets theory. In Sixth Asia-Pacific Decision Sciences (APDSI) Conference (Singapore, 2001).
Lonnie, W., 2010. How to implement lean manufacturing
Mallick, D.Z., Ahmad, M.S. and Bisht, L.S., 2012. Barriers and enablers in implementation of lean six sigma in
Indian manufacturing industries. International Journal of Advanced Research in Management (IJARM), 3(1),
pp.11-19.
Oehmen, J., Oppenheim, B.W., Secor, D., Norman, E., Rebentisch, E., Sopko, J.A., Steuber, M., Dove, R.,
Moghaddam, K., McNeal, S. and Bowie, M., 2012.The guide to lean enablers for managing engineering
programs.Joint MIT‐PMI‐INCOSE Community of Practice on Lean in Program Management.
Rose, A.N.M., Deros, B.M. and Rahman, M.N.A., 2013. Lean manufacturing practices implementation in
Malaysian's SME automotive component industry. In Applied Mechanics and Materials (Vol. 315, pp. 686-
690).Trans Tech Publications.
Singh, B., Garg, S.K. and Sharma, S.K., 2009. Lean can be a survival strategy during recessionary times.
International journal of productivity and performance management, 58(8), pp.803-808.
Wierman, M.J., 1997. Central values of fuzzy numbers—defuzzification.Information Sciences, 100(1-4),
pp.207-215.
Proceedings of the National Conference on
Trends and Advances in Mechanical Engineering
(TAME-2017) March 16-17, 2017 ISBN 978-93-5268-269-0
YMCA University of Science & Technology, Faridabad, Haryana
336
AUTOMATIC MOVEMENT CONTROL SYSTEM OF CAPSULES
USING RADIO-FREQUENCY IDENTIFICATION (RFID)
Punj Lata Singh
Assistant Professor
CE Department
Amity University, Uttar Pradesh, Noida
Abstract
This present work reviews and explains how the modern Pneumatic Capsule Pipeline (PCP) technology can be
used to transport capsules through pipeline.Inside the pipeline at each branching point where the approaching
capsule must be identified and its destination must be determined so that the computer can decide whether to
activate a switch and send the capsule to the branch. It has been determined that different types of
identification/sorting (I/S) systems may be needed for inlet/outlet than for use inside the pipeline, and the
identification/sorting (I/S) systems used for different types of PCP systems may also be different, depending on
factors such as the pipe size and capsule speed. Radio-frequency identification (RFID) system isone of the
technologies heavily used in industry today forthe problem of identification and location.So, Radio-Frequency
Identification (RFID) is used to identify the capsule in the pipeline so to get proper bifurcation. However a
complete study is done on the switch blades and the frog which are used in the bifurcation process furthermore
which is based on the velocity and super-elevation angle (α) during bifurcation, a variation of radius of
curvature (Rc).The calculation of super-elevation angle and radius of curvature helps in deciding the frog.
Keywords: Radio-Frequency Identification (RFID), Tag, Bifurcation angle (β), Frog, Switch blades.
1. Introduction
A capsule pipeline system is similar to many other land based transport systems. It involves a link (the pipeline)
between terminals (where the item being transported enters and exits the system). A vehicle (the capsule,
containing the item to be transported) moves along the link. Capsules can be hollow as well as solid. Pipelines
can be used as horizontal, inclined and vertical for capsule transportation.
Capsule transport is designed because of the following reasons:
1) To overcome the limitations with the slurry pipeline.
2) To reduce the wear of pipeline, when solids are particularly abrasive, and
3) When the solids may react with or become contaminated by conveying liquid
4) To overcome the traffic problems and to provide security to deliver the material safely.
5) They are environmentally friendly.
Radio- Frequency Identification is technique used for tracking and the identification of materials. RFID is a
revolutionary information exchange system that can create an environment in which every object can be
automatically recognized, tracked, and traced from factory to shelf only using a single tag on each product item
or capsule. An RFID system typically comprises a transceiver, its associated antenna and the transponders (tags)
that carry the data. With passive tags the reader transmits a low-power radio signal through the antenna that the
tag receives via its own antenna to power an integrated chip.To move the capsules in a linear motion and for
bifurcating/sorting it to the sub-branches of main stream track a linear induction motor (LIM) will be needed.
Linear induction motor is used in many different applications, from slow moving sliding doors to high-speed
trains around the world. A Linear Induction Motor is basically a rotating squirrel cage induction motor opened
flat. Instead of producing rotary torque from acylindrical machine it produces linear force from a flat one.
Depending on the size and ratings of the LIM, they can produce thrust up to several thousand Newton. The speed
of the LIM is determined by the winding design and supply frequency.At bifurcating point, capsule needs
switching and tuning mechanism. The switching and tuning mechanism includes switchblades, magnetic switch
and frog to switch the capsules to another flange way and to turn out from the previous track.
2. Literature review

Proceedings of the National Conference on
Trends and Advances in Mechanical Engineering
(TAME-2017) March 16-17, 2017 ISBN 978-93-5268-269-0
YMCA University of Science & Technology, Faridabad, Haryana
337
In 2000 Hongliu Du and Henry Liu, abstracted about “Dielectric sensor for detecting capsules moving through
pipelines” in which they forwarded the recent advancement in the technology of hydraulic capsule pipeline
(HCP) for transporting freight in capsules has made it imperative to use a practical sensor to detect capsule
movement in pipelines. The detection of capsules is especially needed in the pump bypass of HCPs for the
control of valves that must be opened and closed periodically and frequently without touching and damaging the
capsules. A new sensing technique is described in this paper for the detection of capsules and coal logs moving
in pipelines. An equivalent electric circuit of the sensor is proposed and verified experimentally. Test data show
the effectiveness and reliability of this sensor. This new sensor may also have application to detecting “pigs”
used in ordinary liquid and gas pipelines, and detecting the interface of multiphase or multiproduct flow in
pipelines.
Bradford Smith (2004) Massachusetts Institute of Technologydetailed about the capsule pipeline transport using
an electromagnetic drive in which magnetic switch is used for swinging permanent magnets.
Bill Glover and Himanshu Bhatt(2006) detailed about the RFID technique in the Book “RFID Essentials”.
Dr. Henry Liu(2006) performed an experiment on “Transporting freight containers by pneumatic capsules
pipelines: security and other issues”. This paper reviews and explains how modern pneumatic capsule pipelines
(PCP) technology can be used to transport 40-ft containers to and from seaports via underground conduits and
tunnels. Key technical issues relating to this technology includes construction of underwater and underground
conduits for PCP, vertical-to-horizontal transport of capsules at port terminals, controlling capsule speed and
spacing in the pipe, and use of radio-frequency identification (RFID) for keeping tracks of capsules and
containers, and controlling capsule motion is discussed
Steve Statham(2006) overviewed on radio-frequency identification along with its application. In his work
“radio-frequency identification” he described about the evolution of RFID, operational aspects of RFID system
and compared Bar-Code and Infra Red with RFID system.
Alexander Peter, Towson University(2008) studied on “Radio Frequency Identification” and abstracted about
the major parts of Radio Frequency Identification (RFID) are detailed alongwith the uses and guided to wireless
communication.
Stephen Dolph, Dan Roggerdorf, Kirsten Swanson And Adam Watkins(2009) experimented and tested outdoor
to develop an antenna profile in his paper “Radio Frequency Identification”. This experiment was also beneficial
as it provided an opportunity to experiment with the true range of the tags.
Henry liu and Charles W. Lenau (2009) performed a presentation on “Underground Transportation of containers
to and from seaports: Dream or Reality?”. This paper is abstracted about LIM (Linear induction motor) which is
used instead of blowers (fans) to propel capsules through pipe pneumatically. LIM pump consists of two parts:
the stator (red) attached to the railroad track, and the rotor or traction plate (blue) attached to the bottom of the
capsule. When two capsules are too close to each other, a LIM brake is used in main line before inlet station to
slow down capsule.LIM pumps can be used as booster pumps spaced at larger distance apart, and allow
Pneumatic Capsule Pipelines to have branches.
A literature search was conducted in order to determine existing identification technologies and
investigate their applicability for the bifurcation of capsules within the pneumatic pipeline for this project.
Automated identification technology is used in the form of Radio Frequency Identification technique. This
review evaluated an objective
1) To make the capsules transport system automatic by identification and sorting through radio-frequency
identification (RFID).
2) Bifurcation of capsules to sub- branches at different stations using linear induction motor (LIM).
3. Description of pipeline system
PIPE: Depending on individual cases, the pneumatic capsule pipeline (conduit) for transporting minerals or
cargoes may be either aboveground or underground. In some cases, it may also have part of the tube
underground and part of it aboveground. For best results, the aboveground tube should use a steel structure,
whereas the underground tube should use a concrete structure. A 3-D view of the aboveground tube module is
shown in Fig 3.1.

Proceedings of the National Conference on
Trends and Advances in Mechanical Engineering
(TAME-2017) March 16-17, 2017 ISBN 978-93-5268-269-0
YMCA University of Science & Technology, Faridabad, Haryana
338
Fig.3.1 Orthogonal (3-D) view of PCP tube module
A rectangular cross-section piping system is normally setup for the capsule transportation whose cross-sectional
area depends on the dimension of the capsule; the maximum thickness of pipe conduit is usually kept around 10
mm. A rectangular (including square) cross section has the following advantages:
1. It is more compatible with cargoes in boxes, crates, pallets or standard containers.
2. Capsules of such PCPs can use bottom wheels, which result in less wear.
3. Capsules can run at much higher speeds without wheel damage or overheating of tires as compared to the
“gimballed” wheel assembly, used for circular cross-section PCPs,having rubber tires which cannot operate at
speeds above 10m/s due to excessive heat buildup, the capsules of the rectangular (including square) PCPs using
vertical wheel can run at much higher speeds, exceeding 20m/s (45mph), without significant overheating and
wear of the tires.
4. Large rectangular and square PCPs can be constructed at relatively-low cost when the buried conduits are near
ground level, using the same technology as for constructing large reinforced concrete underground culverts.
However, due to the open-cut method used, this type of construction is only suitable in rural or remote areas
when ground-based infrastructures can be easily avoided
4. CONCLUSION
Based on discussion and analysis, the following can be concluded it is observed that using RFID technique
capsules running at any speed that is in-between 0.3m/s to 20m/s can be easily bifurcated in a complex pipeline
system. A capsule moving with any velocity of any mass can be lowered to the velocity under control and is
bifurcated by using radio-frequency identification. the earlier stated results, an increment of around 900% in the
(Rc)at α = 0o for velocity at 20 m/s as compared to 5 m/s is observed.
References
Experimental Thermal and Fluid Science, vol. 30, issue 3, January 2006.
“RFID Essentials” is a detailed book by Bill Glover and Himanshu Bhatt about the RFID technique,2006.
The 12th International Conference on Fluidization- New Horizons in Fluidization Engineering, May 13-17,
2007 - Vancouver, Canada.
The Canadian Journal of Chemical Engineering, vol. 59, issue 3, March 2009.
Underground Transportation of containers to and from seaports: Dream or Reality, Henry Liu and Charles W.
Lenau, October 2009.
Stephen Dolph, Dan Roggerdorf, Kirsten Swanson And Adam Watkins, 2009 “Radio Frequency Identification”.
Proceedings of the National Conference on
Trends and Advances in Mechanical Engineering
(TAME-2017) March 16-17, 2017 ISBN 978-93-5268-269-0
YMCA University of Science & Technology, Faridabad, Haryana
339
SUSTAINABLE INDUSTRIAL MANUFACTURING
Subrata Kumar Patra1, Tilak Raj
2, B.B. Arora
3
1Department of Production Engineering, G.B. Pant Institute of Technology, New Delhi, India
2Department of Mechanical Engineering, YMCAUST, Faridabad, India
3Department of Mechanical Engineering, Delhi Technological University, Delhi, India
Abstract
World’s population is growing at a rapid pace which needs enhanced industrial manufacturing in order
to meet the rising demands. Enhancement in industrial manufacturing is associated with the danger
of depletion of available resources because of their over-exploitation. To overcome this problem there
is a strong need to shift in the consumption pattern and to modify the existing industrial manufacturing
with sustainable practices. Present work is an insight in this direction.
Keywords: Manufacturing, Sustainable, industries
1. INTRODUCTION
Lately, people on this globe have started to appreciate that adoption of sustainable lifestyle that is aimed towards
reducing consumption, reducing waste and enhancing the sustainability in various stages of sustainable
development. The persistent and relentless effort of the ancient mankind helped the present generation to
acquire the comforts and luxuries in toay’s modern-day world. The world is changing fast and will continue to
bring together better ways of life. Industrialization helped to manufacture various goods to meet societal
demands. However, Industrialization is the main offender for environment degradation. Therefore there must be
a proper balance between development and environment. With the growth of world’s population which is
estimated at 7.4 billion in August 2016 and will further increase to 11.2 billion in the year 2100 as per
the estimate of the United Nations, our resources will be exhausted unless there is a shift in consumption pattern and manufacturing practices.
Technology and innovation can promote the efficiency in manufacturing. This might be helpful in promoting the
rapid growth of business and to easily adapt with the changing demands of the society. By means of Sustainable
manufacturing practices it is possible to formulate a balance between the progress of economy, environment and
the society concurrently.A holistic approach towards developing more advanced and innovative technologies
and finding technological solutions to various manufacturing issues are the need of the hour. The present work
is intended at finding various issues with regard to industrialization, development, technology, sustainability,
challenges in conventional manufacturing and need for sustainable manufacturing.
2. INDUSTRIALIZATION AND DEVELOPMENT
Industrialization refers to the integrated societal development using available technologies to manufacture
various goods and services for human use. Development can never be static. Industrialization is one of the ways
to promote development. As per Adam Szirmai [2012]there is a strong correlation between industrialization and
economic development. He also highlighted that the advanced economies are the countries that first embarked
on industrialization. All types of industries namely heavy industry, medium industry or small scale industry are
responsible for the promotion of growth and development to the society in various ways.
3. SUSTAINABILITY AND ENHANCEMENT IN SUSTAINABILITY
Sustainability is the technique of developing and maintaining an environment in which the human being, all
plants and animals can co-exist and fulfill their various needs for generations. In order to achieve the
sustainability there is an urgent need to focus on the three pillars of sustainability. These are:
Environmental sustainability
Proceedings of the National Conference on
Trends and Advances in Mechanical Engineering
(TAME-2017) March 16-17, 2017 ISBN 978-93-5268-269-0
YMCA University of Science & Technology, Faridabad, Haryana
340
Economical sustainability
Social sustainability
3.1. Environmental sustainability
It refers to focusing on various issues that pose threat towards sustainable development. Various steps towards
improving environmental sustainability might be the followings:
Conservation of resources including water, land, minerals, energy sources as well as biotic components of the
eco-system
Compliance to environment regulations through regular preventive steps and environmental auditing
Re-use and recycling practices including minimization of waste generation
Control of noise pollution
Reduction and control of Pollutants like wastewater discharges, solid wastes and control of emission
3.2. Economical sustainability
Economical sustainability aims at optimizing the resource consumption in order to improve resource
efficiency and productivity. This may give rise to economical growth and increased revenues for the
manufacturers by way of reducing cost of manufacture. Economic sustainability of a manufacturer can be
expressed by one or more of the following ways:
Type of products manufactured
Capital and labor productivity
Company policy
Investment towards improving social and environmental aspects of manufacturing process
Community development
Employee participation and training etc.
3.3. Social sustainability
Most of the manufacturers focus towards ‘short term’ economic gain and lays little attention towards
the negative environmental impacts during various manufacturing activities. The environmental impacts
ultimately affect the customers, employees and the society as a whole. Social sustainability is aimed at
community development through fiscal growth and mitigation of poverty. This will also be helpful in
complying with regulatory and legal obligations.
4. TECHNOLOGY AND MANUFACTURING
Technology is the application of scientific knowledge to develop machinery and devices. These
machines are used to carry out various kinds of manufacturing activities. Technology is tailor-made to suit the
particular need of various sectors like:
Manufacturing sector
Energy sector
Transportation sector
Aerospace and Space research
Electronics and Telecommunication
Construction
Fabrication etc.
The present paper is focused towards the field of manufacturing. As per Subrata Kumar Patra et al.
[2015] the term “manufacturing” implies that it involves transformation of raw materials into finished goods in
a large scale and is normally related to industrial production.

Proceedings of the National Conference on
Trends and Advances in Mechanical Engineering
(TAME-2017) March 16-17, 2017 ISBN 978-93-5268-269-0
YMCA University of Science & Technology, Faridabad, Haryana
341
Through the use of manufacturing technology raw materials are converted into various quality goods to meet up
the societal requirement. Technology is changing very fast. Dan Brown very rightly quoted that “Every
generation's breakthroughs are proven false by the next generation's technology”.
4.1 Manufacturing Technology and their applications
Any manufacturing system uses some kind of machines and accessories along with suitable tooling to
carry out various manufacturing operations. Manufacturing processes can be of various types namely Job Shop
type, Discreet type, Continuous type or Batch type depending on the suitability of the particular manufacturing
operation and market demand. Some commonly used technologies for manufacturing applications are:
a. Material Removal application – Turning, Boring, Milling, Grinding, Drilling, Tapping, Broaching, Sawing,
Electrical discharge machining (EDM), Laser beam machining (LBM)
b. Material Forming– Joining, Stamping, Bending, Hydro-Forming, Presses, Shearing
c. Additive Processes –3D Printing, Laser Sintering, Rapid Prototyping
d. Work holding – Different Jigs and fixtures like Chucks, Clamps, Milling fixtures
e. Tooling –Single point cutting tools, Dies, Punches, Drills, Taps, Reamers, Grinding wheels
f. Material Handling – Conveyors, Automated guided vehicles (AGV), Robots, Pallet changers, Electric Overhead
Travel Crane (E.O.T crane)
g. Automated Systems – Flexible Manufacturing Systems (FMS), Transfer machines
Various Industrial Software that are predominantly used to carry out manufacturing processes are Computer
Aided Design (CAD), Computer Aided Manufacturing (CAM), Computer Numerical Control (CNC), Direct
Numerical Control (DNC), Programmable Logic Control (PLC), Numerical Control (NC), Program
optimization software, Systems Integration software etc.
4.1.1 Merits and demerits of Technology in manufacturing
Technology and manufacturing have undergone radical changes in the past decade. Rapid and unprecedented
growth has been observed in various segments of manufacturing. In spite of several merits and advantages
several demerits also exist in the current technologies. As per Alvin Toffler “Our technological powers
increases, but the side effects and potential hazards also escalate”. Technology in that way is very similar to the
use of prescribed drugs to get cured, but is associated with some “side effects” that is unwanted
symptoms in the course of medical treatment. Similar to the side effects of medicines, there are
unwanted environmental effects of technology that can never be made “ZERO” - but can be reduced
to a great extent using improved technology and process.
As per Bill Gates “The first rule of any technology used in a business is that automation applied to an efficient
operation will magnify the efficiency. The second is that automation applied to an inefficient operation will
magnify the inefficiency”. In this context it can be said that manufacturers should focus on research and
development for automation operations by improving mechanizations and computerizations. They should try to
explore for alternate materials that can be manufactured using lesser energy, causes less pollution and waste
during manufacture phase, use phase and end-of-use phase. Moreover, these materials should be easily
recyclable after end-of-life process.
4.2 Sustainable Manufacturing
To cope up and mitigate with the challenges of technological and manufacturing implications in our eco-system
and for long-term sustainable development engineers and manufacturers should take-up proactive measures.
Sustainable manufacturing may perhaps be the right option in this direction. Sustainable manufacturing not
only make every effort towards environment-friendly and resource efficient manufacturing practices
but also strive towards economical and societal growth and development. From the manufacturing point
of view, the manufacturers are expected to adhere with sustainable practices by integrating the concept of
sustainable consumption and manufacturing throughout the product lifecycle. To achieve this manufacturers are
expected to adopt improved technologies and practices. Some of these are:
i) Adoption of Renewable energy sources like solar energy, wind energy, bio energy etc instead
of conventional fossil fuel
ii) Water and power management devices
iii) Adoption of recycling technologies
iv) Innovation in technology and control systems
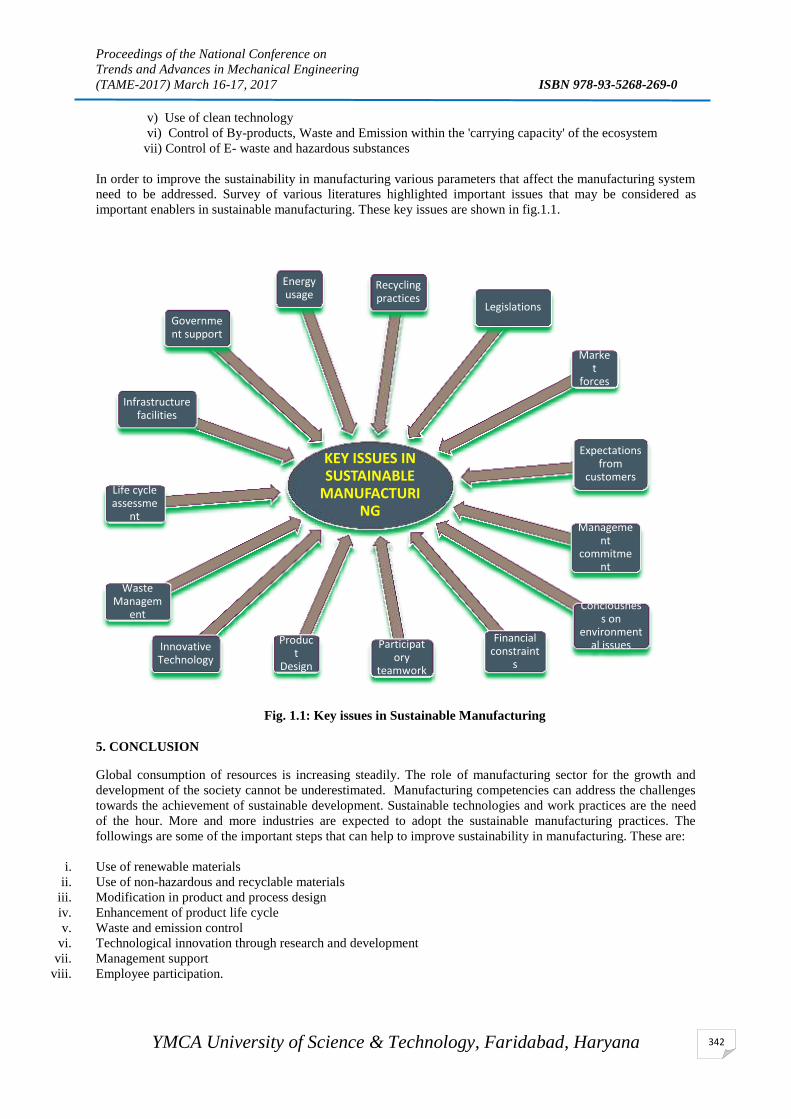
Proceedings of the National Conference on
Trends and Advances in Mechanical Engineering
(TAME-2017) March 16-17, 2017 ISBN 978-93-5268-269-0
YMCA University of Science & Technology, Faridabad, Haryana
342
v) Use of clean technology
vi) Control of By-products, Waste and Emission within the 'carrying capacity' of the ecosystem
vii) Control of E- waste and hazardous substances
In order to improve the sustainability in manufacturing various parameters that affect the manufacturing system
need to be addressed. Survey of various literatures highlighted important issues that may be considered as
important enablers in sustainable manufacturing. These key issues are shown in fig.1.1.
Fig. 1.1: Key issues in Sustainable Manufacturing
5. CONCLUSION
Global consumption of resources is increasing steadily. The role of manufacturing sector for the growth and
development of the society cannot be underestimated. Manufacturing competencies can address the challenges
towards the achievement of sustainable development. Sustainable technologies and work practices are the need
of the hour. More and more industries are expected to adopt the sustainable manufacturing practices. The
followings are some of the important steps that can help to improve sustainability in manufacturing. These are:
i. Use of renewable materials
ii. Use of non-hazardous and recyclable materials
iii. Modification in product and process design
iv. Enhancement of product life cycle
v. Waste and emission control
vi. Technological innovation through research and development
vii. Management support
viii. Employee participation.
KEY ISSUES IN SUSTAINABLE
MANUFACTURING
Product
Design
Innovative Technology
Waste Managem
ent
Life cycle assessme
nt
Infrastructure facilities
Government support
Energy usage
Recycling practices
Legislations
Market
forces
Expectations from
customers
Management
commitment
Conciousness on
environmental issues
Financial constraint
s
Participatory
teamwork

Proceedings of the National Conference on
Trends and Advances in Mechanical Engineering
(TAME-2017) March 16-17, 2017 ISBN 978-93-5268-269-0
YMCA University of Science & Technology, Faridabad, Haryana
343
REFERENCES
1. Adam Szirmai, “Industrialization as an engine of growth in developing countries,1950–2005”, Structural
Change and Economic Dynamics, Vol. 23, 2012, pp. 406- 420
2. Deborah Donane, Alex MacGillivray, “Economic Sustainability- the business of staying in business”, R &
D report, The Sigma Project, pp. 1-52, 2001
3. Joseph Fiksel, “ A Framework for Sustainable Materials Management”, JOM, 2006, pp.15-22
4. Jurgis Staniskis, Valdas Arbaciauskas,Visvaldas Varzinskas, “Sustainable consumption and production as a
system: experience in Lithuania”, Clean Techn Environ Policy, DOI 10.1007/s10098-012-0509-y
5. Sebastian Koos, “Varieties of Environmental Labelling, Market Structures, and Sustainable Consumption
across Europe: A Comparative Analysis of Organizational and Market”, Supply Determinants of
Environmental-Labelled Goods, J Consum Policy, Vol. 34, pp.127-151, 2011, DOI 10.1007/s10603-010-
9153-2
6. Subrata Kumar Patra, Tilak Raj, B.B. Arora, “Sustainability Issues in Energy Efficient Manufacturing
Systems - A Review”, International Journal of Engineering and Manufacturing Science, ISSN 2249-3115,
Vol. 5, Number 1, 2015, pp. 1-8
7. Vijay Srinivasan, “An Engineer grapples with sustainable manufacturing”, Clean Techn Environ Policy,
Vol.13, pp.217- 219, 2011, DOI 10.1007/s10098-011-0350-8
8. Zhongde Shan, Shaoyan Qin, Qian Liu, Feng Liu, “Key Manufacturing Technology & Equipment for
Energy Saving and Emissions Reduction in Mechanical Equipment Industry”, International Journal of
Precision Engineering and Manufacturing, Vol. 13, No. 7, 2012, pp. 1095-1100, DOI 10.1007/s12541-012-
0143-y.

Proceedings of the National Conference on
Trends and Advances in Mechanical Engineering
(TAME-2017) March 16-17, 2017 ISBN 978-93-5268-269-0
YMCA University of Science & Technology, Faridabad, Haryana
344
OPTIMIZATION OF TRACK LENGTH IN A CENTREBOARD
HOPPER
Girraj kaushik
M.Tech. Student, Department of Mechanical Engineering,
YMCA University of Science and Technology, Faridabad-121006 Email:[email protected]
Abstract
Automation is a step beyond mechanization. It greatly reduces the need for human sensory and mental
requirements aswell. The importance of assembly in an industry cannot be undermined since assembling cost
may account for up to 50 % of the total manufacturing cost incurred. Automation in assembly plays a significant
role to maximize productivity. Part feeders form an integral part of a mechanized assembly as not only are they
responsible for part feeding from a bulk supply but also convert the randomness of parts into a flow in a
geometrical pattern. This paper aims to describe the mathematical analysis of a “Centreboard Hopper Parts
Feeder” which is an automated system for feeding cylindrical parts.
Keywords: Mechanization, mathematical analysis, design and productivity.
1. Introduction
Part feeders are machines that deliver and orient parts so that automated assembly equipment can pick and place
them. Applications range from packaging pills in the pharmaceutical industry to sparkplug production in the
automotive industry. The main difference among parts feeders is their method of directing the feed. In the
design and testing of parts feeders it is often convenient to observe the feed rate when the feeder is not
connected to a machine, i.e., when no restriction is applied to the output of the feeder. The feed rate under these
circumstances will be referred to as the unrestricted feed rate. With part feeders suitable for automatic machines
it is necessary that all the parts be presented to the machine in the same attitude, i.e., they must be fed correctly
oriented. Part feeders should be designed so that the possibility of parts jamming in the feeder, or in its orienting
devices, is minimized or eliminated. Parts feeders can generally be classified into: reciprocating feeders; rotary
feeders; belt feeders; and finally vibratory feeders.
The present feeder is reciprocating feeder. Here, a centreboard having a slot reciprocates up and down in a
hopper filled of cylindrical parts. Compressed air is used as the working fluid for actuating a pneumatic cylinder
to carry out this reciprocating action.
Need for mathematical analysis: In order to estimate the magnitude of the factor effects i.e. how does a response
variable (maximum blade frequency) change when other factor (here track length, coefficient of friction) is
changed, along with their mutual interaction which means changing the factors together produce different results
than are obtained from individual factor adjustments? The information from these attributes will be used to
identify the critical process factors and to determine the magnitude of adjustment for these factors to improve
the performance of the feeder.
2) DESIGN AND WORKING
Figure shows a typical centreboard hopper feeder. Basically, this consists of a hopper in which the parts are
placed at random and a blade with a shaped track along its upper edge which is periodically pushed upward
through the mass of parts. The blade will thus catch a few parts on its track during each cycle and when the
blade is in its highest position (as shown in figure) it is aligned with a chute and the parts will slide down the
track and into the chute. The centreboard hopper illustrated is suitable for feeding cylindrical part.
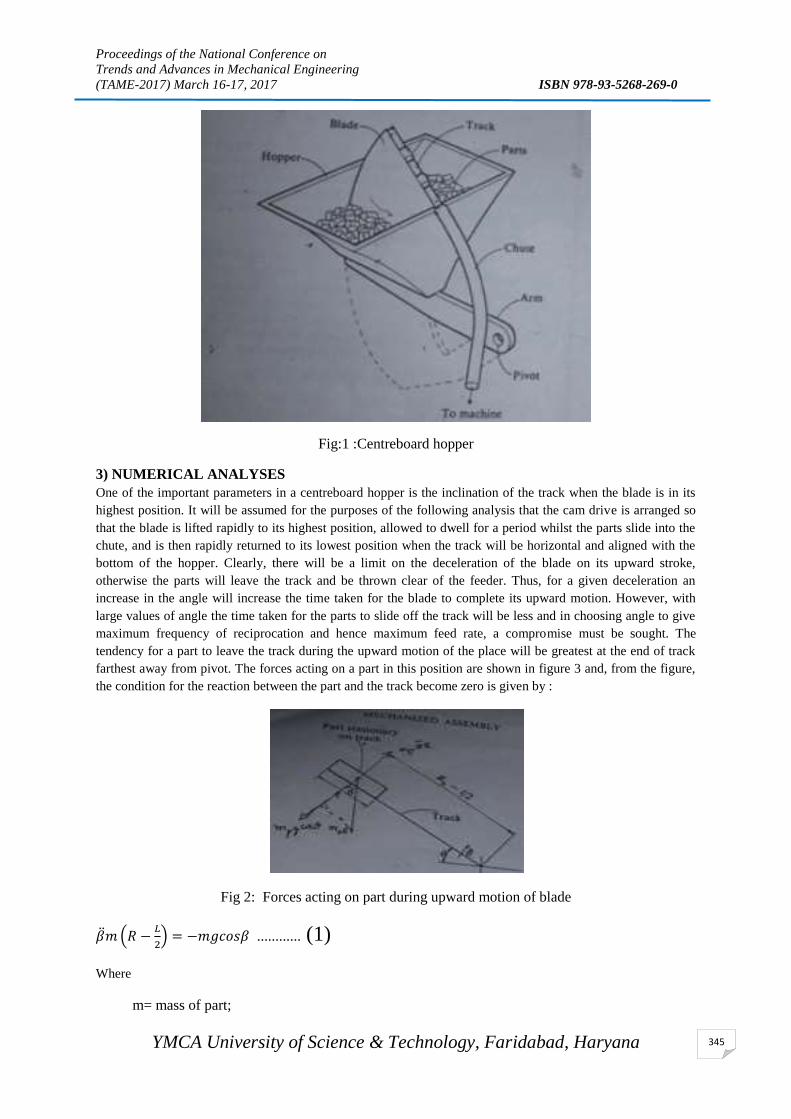
Proceedings of the National Conference on
Trends and Advances in Mechanical Engineering
(TAME-2017) March 16-17, 2017 ISBN 978-93-5268-269-0
YMCA University of Science & Technology, Faridabad, Haryana
345
Fig:1 :Centreboard hopper
3) NUMERICAL ANALYSES
One of the important parameters in a centreboard hopper is the inclination of the track when the blade is in its
highest position. It will be assumed for the purposes of the following analysis that the cam drive is arranged so
that the blade is lifted rapidly to its highest position, allowed to dwell for a period whilst the parts slide into the
chute, and is then rapidly returned to its lowest position when the track will be horizontal and aligned with the
bottom of the hopper. Clearly, there will be a limit on the deceleration of the blade on its upward stroke,
otherwise the parts will leave the track and be thrown clear of the feeder. Thus, for a given deceleration an
increase in the angle will increase the time taken for the blade to complete its upward motion. However, with
large values of angle the time taken for the parts to slide off the track will be less and in choosing angle to give
maximum frequency of reciprocation and hence maximum feed rate, a compromise must be sought. The
tendency for a part to leave the track during the upward motion of the place will be greatest at the end of track
farthest away from pivot. The forces acting on a part in this position are shown in figure 3 and, from the figure,
the condition for the reaction between the part and the track become zero is given by :
Fig 2: Forces acting on part during upward motion of blade
𝑚 (𝑅 −𝐿
2) = −𝑚𝑔𝑐𝑜𝑠𝛽 ............ (1)
Where
m= mass of part;

Proceedings of the National Conference on
Trends and Advances in Mechanical Engineering
(TAME-2017) March 16-17, 2017 ISBN 978-93-5268-269-0
YMCA University of Science & Technology, Faridabad, Haryana
346
R= radius from pivot to upper end of track;
β=maximum angle between track and horizontal;
β = angular acceleration of track.
Thus, the maximum angular deceleration of blade is given by:
= −(𝑔𝑐𝑜𝑠𝛽)/𝑅 approximately .............. (2)
(L is small with R)
For simplicity, it will now be assumed that the drive of blade designed to give, during the period of the upward
motion of the blade, (a) a constant acceleration (gcosβ)/R followed by (b) constant deceleration of (gcosβ)/R.
Under these conditions, total time taken T1 taken to lift the blade so that the track is inclined an angle β to the
horizontal is given by :
T12= 4Rβ/gcosβ ........................ (3)
Now assumed that when the blade in its highest position, it will pull for a period T2 just sufficient to allow the
parts to slide down the rack. This will be given, in the worst case, by the time taken for one part to slide the
whole length of track. The force acting on a part under these circumstances is shown in figure 4 and the force is
resolving in a direction parallel to the tracks gives:
ma=mgsinβ - µmgcosβ ............................(4)
Fig 3: Forces acting on part on down track
Where a is the linear acceleration of the part down the track and µd is the coefficient of dynamic friction
between the part and the track.
The minimum dwell period T2 is now given by:
T2
2 = 2L/g(sinβ - µdcosβ) ..........................(5)
Where L is the total length of the track.

Proceedings of the National Conference on
Trends and Advances in Mechanical Engineering
(TAME-2017) March 16-17, 2017 ISBN 978-93-5268-269-0
YMCA University of Science & Technology, Faridabad, Haryana
347
If the time taken to return the blade to its lowest position is now neglected (since no basic restrictions
apply to the accelerations of the blade during this period) then the total period, T f of the feeder cycle will be
given by:
Tf = T1+T2 = (4Rβ/gcosβ) + (2L/g(sinβ - µdcosβ)) .......................(6)
Equation (6) consists of two terms; one which will increase β is increased and one which will decrease as β is
increased. An optimum value of β always exists which will give minimum period Tf and hence maximum
theoretical feed rate. It can be shown mathematically that this optimum value of β is a function only of µ and
the ratio R/L. For R/L=2 , the resulting expressions is written as :
βopt = 27 + 0.7 tan−1 µ degrees ................................ (7)
4) CONCLUSION
The analysis presented the procedure of finding optimum angle between track and horizontal. It should be noted
that for a given size of part ,a longer track will on average pick up a greater number of parts per cycle and hence
the mean feed rate may increase. It can be seen that for large values of the coefficient of friction in the range 0.4
to 0.8 the maximum blade frequency only varies slightly. The maximum blade frequency is more sensitive to
change in length, L, of the track and for longer tracks, the frequency is lower.
5) REFERENCES
[1] Pradeep Khanna, Akshat Gupta , Gunjan Agarwal ,Natrajan Sankar”Design, Fabrication and analysis of areciprocating funnel feeder”International conference of on advances in mechanical engineering (AME-2006)
[2] G Boothroyd, mechanized assembly, PHI.
[3] Douglas C.Montgomery, Design and analysis of Experiments, WILEY publishing house

Proceedings of the National Conference on
Trends and Advances in Mechanical Engineering
(TAME-2017) March 16-17, 2017 ISBN 978-93-5268-269-0
YMCA University of Science & Technology, Faridabad, Haryana
348
SUPPLIER SELECTION AND EVALUATION FOR SUSTAINABLE
SUPPLY CHAIN MANAGEMENT
Jitender Kumar*1
, Ajay Dabas2
1Research Scholar, Department of Mechanical Engineering, DCRUST, Murthal:131039(Haryana), E-mail-
[email protected] 2Assistant Professor, Department of Mechanical Engineering, DCRUST, Murthal:131039(Haryana) E-mail-
Abstract
Supplier Selection and evaluation is an important aspect for any Supply Chain Management (SCM), that’s why
organizations spending their lot of time and efforts for the same. In this paper, an attempt has been made to
collect and discuss the available literature for supplier selection and evaluation.
Keywords: Supply chain management, Sustainable supply chain management, Green supply chain management
and Supplier Selection.
1. INTRODUCTION
In the last couple of centuries, exploitation of natural resources and global environment is increasing day by day
with absolute ignorance of its hazardous effects on eco-system like depletion of natural resources, biological
imbalance, soil erosion, depletion of ozone layer and global warming etc. All these hazardous environmental
issues have become a serious matter of concern for public, scientists, governments and business organisations.
As the world population is increasing day by day, so the demand off the necessary consumable items is also
increasing day by day. In order to maintain or lower down the gap between demand and supply, industries are
using more and more raw material from the natural resources in order to sustain into the market. In order to
solve these environmental issues and to achieve sustainable production, industries need to implement
environmental friendly raw material and resources. Hsu et al (2009) RoHS (Restrictions of the use of Hazardous
Substances) directive has forced industries to adopt Environmental Management Systems as a part of their
regular practices to stretch their environmental practices to their suppliers and customers.The process industry is
defined as an industry in which raw materials are treated or prepared to final or intermediate products through
various stages of physical and chemical transformation such as extraction, purification, fraternization,
formation, etc., under continuous or batch processing (Hübner 2007). Various types of process industries such as
chemical industry, pharmaceutical industry, food and beverage industry, pulp and paper industry, mining
industry, cement industry, plastic & compound industry, rubber industry, wood processing industry, petroleum
industry, base metals industry, water treatment industry and associated industry are providing basic and
necessary products to support our day to day life (Hübner 2007). Recently, the process industries are
restructuring and altering their business activities through the supply chain to face the challenges in the future,
such as ( Papageorgiou 2009).
(i) Fluctuation in market conditions and raised competition with shorter product life cycles
(ii) Increased environmental pressure from government and related organizations
(iii) Implementation of policies and agreements connected with recycle, reuse, remanufacture of end-used
products.
1.1 Supply Chain Management
Management of critical links that connect an organization’s inputs to its outputs in a supply chain is known as
supply chain management. Over the past decades the supply chain functions have become the key strategic
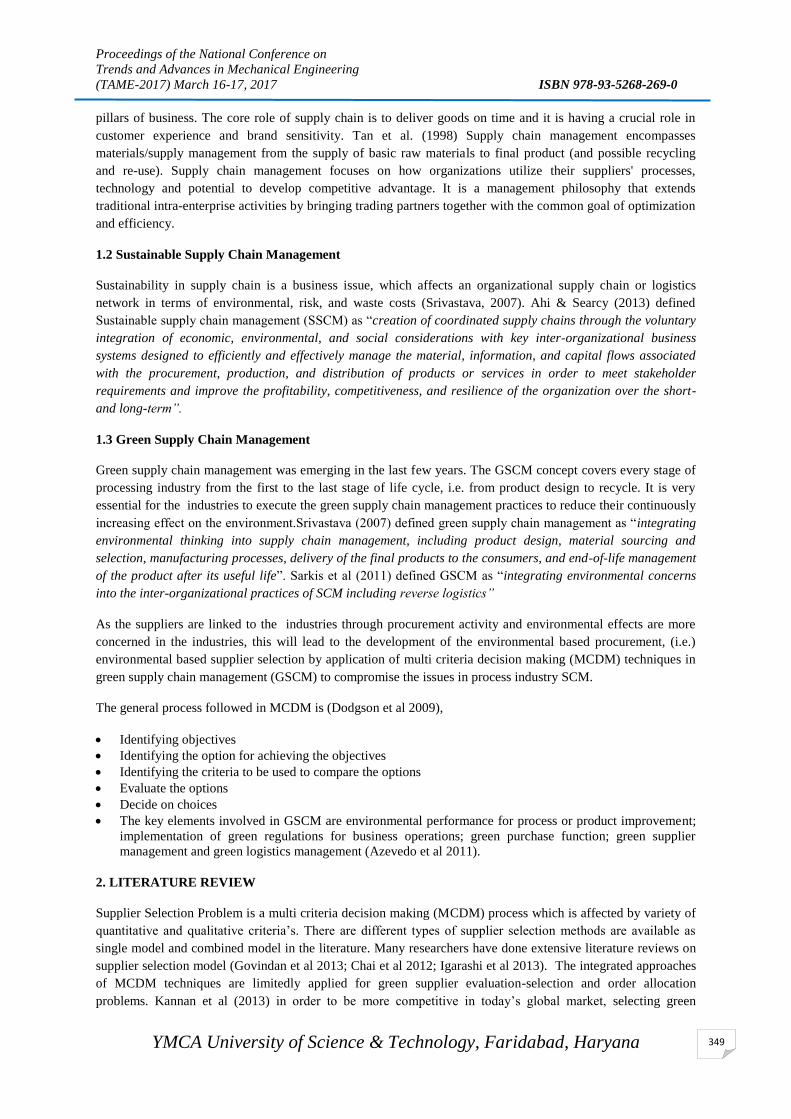
Proceedings of the National Conference on
Trends and Advances in Mechanical Engineering
(TAME-2017) March 16-17, 2017 ISBN 978-93-5268-269-0
YMCA University of Science & Technology, Faridabad, Haryana
349
pillars of business. The core role of supply chain is to deliver goods on time and it is having a crucial role in
customer experience and brand sensitivity. Tan et al. (1998) Supply chain management encompasses
materials/supply management from the supply of basic raw materials to final product (and possible recycling
and re-use). Supply chain management focuses on how organizations utilize their suppliers' processes,
technology and potential to develop competitive advantage. It is a management philosophy that extends
traditional intra-enterprise activities by bringing trading partners together with the common goal of optimization
and efficiency.
1.2 Sustainable Supply Chain Management
Sustainability in supply chain is a business issue, which affects an organizational supply chain or logistics
network in terms of environmental, risk, and waste costs (Srivastava, 2007). Ahi & Searcy (2013) defined
Sustainable supply chain management (SSCM) as “creation of coordinated supply chains through the voluntary
integration of economic, environmental, and social considerations with key inter-organizational business
systems designed to efficiently and effectively manage the material, information, and capital flows associated
with the procurement, production, and distribution of products or services in order to meet stakeholder
requirements and improve the profitability, competitiveness, and resilience of the organization over the short-
and long-term”.
1.3 Green Supply Chain Management
Green supply chain management was emerging in the last few years. The GSCM concept covers every stage of
processing industry from the first to the last stage of life cycle, i.e. from product design to recycle. It is very
essential for the industries to execute the green supply chain management practices to reduce their continuously
increasing effect on the environment.Srivastava (2007) defined green supply chain management as “integrating
environmental thinking into supply chain management, including product design, material sourcing and
selection, manufacturing processes, delivery of the final products to the consumers, and end-of-life management
of the product after its useful life”. Sarkis et al (2011) defined GSCM as “integrating environmental concerns
into the inter-organizational practices of SCM including reverse logistics”
As the suppliers are linked to the industries through procurement activity and environmental effects are more
concerned in the industries, this will lead to the development of the environmental based procurement, (i.e.)
environmental based supplier selection by application of multi criteria decision making (MCDM) techniques in
green supply chain management (GSCM) to compromise the issues in process industry SCM.
The general process followed in MCDM is (Dodgson et al 2009),
Identifying objectives
Identifying the option for achieving the objectives
Identifying the criteria to be used to compare the options
Evaluate the options
Decide on choices
The key elements involved in GSCM are environmental performance for process or product improvement;
implementation of green regulations for business operations; green purchase function; green supplier
management and green logistics management (Azevedo et al 2011).
2. LITERATURE REVIEW
Supplier Selection Problem is a multi criteria decision making (MCDM) process which is affected by variety of
quantitative and qualitative criteria’s. There are different types of supplier selection methods are available as
single model and combined model in the literature. Many researchers have done extensive literature reviews on
supplier selection model (Govindan et al 2013; Chai et al 2012; Igarashi et al 2013). The integrated approaches
of MCDM techniques are limitedly applied for green supplier evaluation-selection and order allocation
problems. Kannan et al (2013) in order to be more competitive in today’s global market, selecting green

Proceedings of the National Conference on
Trends and Advances in Mechanical Engineering
(TAME-2017) March 16-17, 2017 ISBN 978-93-5268-269-0
YMCA University of Science & Technology, Faridabad, Haryana
350
suppliers affects an organization’s environmental performance. In the supplier selection process, it is necessary
to determine the best supplier and order quantity of each supplier. Numerous quantitative and qualitative criteria
are associated with Supplier selection process. Govindan et al (2013) discussed supplier selection role in
management of a supply chain explores sustainable supply chain initiatives and examines the problem of
identifying an effective model based on the Triple Bottom Line (TBL) approach (economic, environmental, and
social aspects) for supplier selection operations in supply chains by presenting a fuzzy multi criteria approach
and uses triangular fuzzy numbers to express linguistic values of experts. Tseng (2011) says that for the
sustainable development of manufacturing firms, GSCM criteria are essential for selection of a suitable green
supplier. He proposed framework for green supplier selection which includes green technology capabilities;
environmental design; green procurement capabilities; green certifications; internal green production strategies;
green manufacturing; decrease of hazardous materials in the manufacturing; and green management systems as
green criteria among total sixteen criteria. Sarkis et al (2011) explained Green supply chain management
(GSCM) importance within both academia and industry, critically evaluate the concept of GSCM and then
categorized GSCM under nine broad organizational theories, with a special emphasis on investigation of
adoption, diffusion and outcomes of GSCM practices. Azevedo et al (2011) examined the relationships between
green practices of supply chain management and supply chain performance in automotive industry, generate a
model to influence green practices on supply chain performance and identifies the practices which have
negativeeffects on supply chain performance. Brandenburg et al (2014) discussed mathematical models that
focus on environmental or social factors in forward supply chains (SC) and found seems less investigation in it.
In this paper, he provides a content analysis of 134 carefully identified papers on quantitative, formal models
that address sustainability aspects in the forward Supply chain. Kumar et al (2014) discussed Green DEA
(GDEA) a common integrated approach for supplier selection considering both the objectives, cost cutting, and
environmental efficiency, in a flexible manner. Dou et al (2014) focused on green supplier development
programs and supplier involvement tendency. In addition, also focused on formal tools, models for focal
companies and to evaluate these inter-relationships, especially considering propensity of suppliers’ involvement
and used a grey analytical network process-based (grey ANP based) model to identify green supplier
development programs that will effectively improve suppliers’ performance.Sharma et al (2014) discussed the
importance of sustainable food supply chain management in food manufacturing industries and identified ten
success factors and and analyzed them the help of Decision Making Trial and Evaluation Laboratory
(DEMATEL) approach and found Food Quality and Safety was attributed the highest importance among other
success factors for the successful adoption of sustainable food supply chain management initiatives. Mitra ana
Datta (2014) found that the state of adoption of GSCM practices by Indian firms was still in its infancy, the
awareness of environmental sustainability was quite low among consumers, and the regulatory framework was
also lacking in terms of promoting environmental sustainability. Su et al (2015) analyzedaspects and criteria
structure for supplier prioritization to improvesustainable supply chain management (SSCM); their results
suggestedthat the recycle/reuse/reduce option has been identified asthe top criterion for supplier selection. Azadi
et al (2015) used data development analysis (DEA) for sustainable supplier performance evaluation and
selection in resin Production Company. This paper developed an integrated DEA enhanced Russell measure
(ERM) model in fuzzy context to select the best sustainable suppliers. Anisul Huq et al (2015) make a study on
socially sustainable practices adopted by developing countries. He did exploratory study in the Ready Made
Garments Industry of Bangladesh and uses exploratory face-to-face interviews with 14 senior representatives
and interprets the finds using Transaction Cost Economics (TCE) theory lens. Sarkis & Dhavale (2015) used
triple bottom line approach to evaluate and selecting sustainable suppliers and consider business operations as
well as environmental impacts and social responsibilities of the suppliers. He developed Monte Carlo Markov
Chain (MCMC) simulation to rank and select suppliers using specific selection. A wealth of information about
supplier performance can be obtained from the results of MCMC simulation, which can be used further.
Gandhi et al (2016) proposed a structural model by using the Analytical Hierarchy Process (AHP) and the
Decision-Making Trial and Evaluation Laboratory (DEMATEL) approach to evaluate 24 SFs for GSCM
adoption in Indian manufacturing industry. Luthra et al (2017) from an organizational supply chain perspective
focused on systematic and sustainable evaluation system for supplier selection and proposed a framework in an
automobile company to evaluate sustainable supplier selection by using an integrated Analytical Hierarchy

Proceedings of the National Conference on
Trends and Advances in Mechanical Engineering
(TAME-2017) March 16-17, 2017 ISBN 978-93-5268-269-0
YMCA University of Science & Technology, Faridabad, Haryana
351
Process (AHP), Vise Kriterijumska Optimizacija Kompromisno Resenje (VIKOR), a multi-criteria optimization
and compromise solution approach. Mangla et al (2016) focused on evaluatation of critical success factors
(CSFs) linked to the implementation of Reverse logistics (RL) in manufacturing industries in India. This paper
evaluate the CSFs in RL adoption threw a structural model by using Analytical Hierarchy Process (AHP) and
Decision Making Trial and Evaluation Laboratory(DEMATEL) methods. The AHP methodology helps in
establishing the priorities of the CSFs, while the DEMATEL approach categorizes the causal relationships
among them. Luthra et al (2016) identified the six critical success factors to implement Green Supply Chain
Management (GSCM) towards sustainability taking into account the automobile industry of India and examined
impacts of CSF’s on current green practices and find expected organisational performance using multiple
regression analysis and found Internal Management and competitiveness CSFs playing a important role to
achieve expected performance outcomes.
According to the Environmental Performance Index 2012, 2014 and 2016 report, India had ranked at the125th
,
155th
and 141th
position out of 132,178 and 180 countries
3. Conclusions
After going through the available literature it was found that very little research has been done in area of GSCM
execution in Process Industries in India in context with supplier selection.Supplier selection is a significant
practice affecting the successive stages towards achieving sustainability in supply chains. In the literature it is
clear that most of the work published considering green supplier selection. There is lack of social aspect
consideration in supplier selection for decision making. Process industries need to develop the green supply
chain solution to improve the sustainability and resource efficiency through multi-level association with suitable
partners. Sustainable supply chain can be a source of competitive advantage for organizations. According to the
Environmental Performance Index 2016 report, India ranked at the 141th position out of 180 countries, which
uncovers the fact that the initiatives being devised for the environment improvement are significantly lacking in
India. There is small increase in India’s rank as compared to EPI 2014 report. So there are significant chances of
improvement possible in the environment sector for sustainable growth in process industry.
REFERENCES
1. Anisul Huq, F., Stevenson, M., & Zorzini, M. (2014). Social sustainability in developing country suppliers: An
exploratory study in the ready made garments industry of Bangladesh. International Journal of Operations &
Production Management, 34(5), 610-638.
2. Azadi, M., Jafarian, M., Saen, R. F., & Mirhedayatian, S. M. (2015). A new fuzzy DEA model for evaluation of
efficiency and effectiveness of suppliers in sustainable supply chain management context. Computers &
Operations Research, 54, 274-285.
3. Azevedo, S. G., Carvalho, H., & Machado, V. C. (2011). The influence of green practices on supply chain
performance: a case study approach. Transportation research part E: logistics and transportation review, 47(6),
850-871.
4. Brandenburg, M., Govindan, K., Sarkis, J., & Seuring, S. (2014). Quantitative models for sustainable supply
chain management: Developments and directions. European Journal of Operational Research, 233(2), 299-312.
5. Chai, J., Liu, J. N., & Ngai, E. W. (2013). Application of decision-making techniques in supplier selection: A
systematic review of literature. Expert Systems with Applications, 40(10), 3872-3885.
6. Dodgson, J. S., Spackman, M., Pearman, A., & Phillips, L. D. (2009). Multi-criteria analysis: a manual.
7. Dou, Y., Zhu, Q., & Sarkis, J. (2014). Evaluating green supplier development programs with a grey-analytical
network process-based methodology. European Journal of Operational Research, 233(2), 420-431.
8. Gandhi, S., Mangla, S. K., Kumar, P., & Kumar, D. (2016). A combined approach using AHP and DEMATEL
for evaluating success factors in implementation of green supply chain management in Indian manufacturing
industries. International Journal of Logistics Research and Applications, 1-25.
9. Govindan, K., Khodaverdi, R., & Jafarian, A. (2013). A fuzzy multi criteria approach for measuring
sustainability performance of a supplier based on triple bottom line approach. Journal of Cleaner Production,
47, 345-354.
10. Hsu, C. W., & Hu, A. H. (2009). Applying hazardous substance management to supplier selection using analytic
network process. Journal of Cleaner Production, 17(2), 255-264.

Proceedings of the National Conference on
Trends and Advances in Mechanical Engineering
(TAME-2017) March 16-17, 2017 ISBN 978-93-5268-269-0
YMCA University of Science & Technology, Faridabad, Haryana
352
11. Hübner, R. (2007). Strategic supply chain management in process industries: An application to specialty
chemicals production network design (Vol. 594). Springer Science & Business Media.
12. Igarashi, M., de Boer, L., & Fet, A. M. (2013). What is required for greener supplier selection? A literature
review and conceptual model development. Journal of Purchasing and Supply Management, 19(4), 247-263.
13. Kannan, D., Khodaverdi, R., Olfat, L., Jafarian, A., & Diabat, A. (2013). Integrated fuzzy multi criteria decision
making method and multi-objective programming approach for supplier selection and order allocation in a green
supply chain. Journal of Cleaner Production, 47, 355-367
14. Kumar, A., Jain, V., & Kumar, S. (2014). A comprehensive environment friendly approach for supplier
selection. Omega, 42(1), 109-123.
15. Luthra, S., Garg, D., & Haleem, A. (2016). The impacts of critical success factors for implementing green
supply chain management towards sustainability: an empirical investigation of Indian automobile industry.
Journal of Cleaner Production, 121, 142-158.
16. Luthra, S., Govindan, K., Kannan, D., Mangla, S. K., & Garg, C. P. (2017). An integrated framework for
sustainable supplier selection and evaluation in supply chains. Journal of Cleaner Production, 140, 1686-1698.
17. Mangla, S. K., Govindan, K., & Luthra, S. (2016). Critical success factors for reverse logistics in Indian
industries: a structural model. Journal of Cleaner Production, 129, 608-621.
18. Mitra, S., & Datta, P. P. (2014). Adoption of green supply chain management practices and their impact on
performance: an exploratory study of Indian manufacturing firms. International Journal of Production
Research, 52(7), 2085-2107.
19. Papageorgiou, L. G. (2009). Supply chain optimisation for the process industries: Advances and opportunities.
Computers & Chemical Engineering, 33(12), 1931-1938.
20. Sarkis, J., & Dhavale, D. G. (2015). Supplier selection for sustainable operations: A triple-bottom-line approach
using a Bayesian framework. International Journal of Production Economics, 166, 177-191.
21. Sarkis, J., Zhu, Q., & Lai, K. H. (2011). An organizational theoretic review of green supply chain management
literature. International Journal of Production Economics, 130(1), 1-15.
22. Sharma, Y. K., Mangla, S. K., Patil, P. P., & Uniyal, S. (2014). Sustainable Food Supply Chain Management
Implementation using DEMATEL approach. Assessment, 5.
23. Srivastava, S. K. (2007). Green supply‐chain management: a state‐of‐the‐art literature review. International
journal of management reviews, 9(1), 53-80.
24. Tseng, M. L. (2011). Green supply chain management with linguistic preferences and incomplete information.
Applied Soft Computing, 11(8), 4894-4903.
25. Su, C. M., Horng, D. J., Tseng, M. L., Chiu, A. S., Wu, K. J., & Chen, H. P. (2015). Improving sustainable
supply chain management using a novel hierarchical grey-DEMATEL approach. Journal of Cleaner Production.
26. Srivastava, S. K. (2007). Green supply‐chain management: a state‐of‐the‐art literature review. International
journal of management reviews, 9(1), 53-80.
27. Ahi, P., & Searcy, C. (2013). A comparative literature analysis of definitions for green and sustainable supply
chain management. Journal of Cleaner Production, 52, 329-341.
28. Tan, K. C., Kannan, V. R., & Handfield, R. B. (1998). Supply chain management: supplier performance and
firm performance. Journal of Supply Chain Management, 34(3), 2.
Proceedings of the National Conference on
Trends and Advances in Mechanical Engineering
(TAME-2017) March 16-17, 2017 ISBN 978-93-5268-269-0
YMCA University of Science & Technology, Faridabad, Haryana
353
THE VALUE OF COLLABORATION IN SUPPLY CHAIN
Harjit Singh, R K Garg and Anish Sachdeva
Department of Industrial and Production Engineering,
Dr. B. R. Ambedkar National Institute of Technology, Jalandhar, Punjab-144 011, India.
[email protected], [email protected], [email protected]
Abstract As firms seek to remain competitive in today’s marketplace, they often look externally for assistance in meeting
customer expectations. One way this can be achieved is through supply chain collaboration. Supply chain
collaboration means the firms within the supply chain work together towards mutual objective through the
sharing of ideas, information, knowledge, risks and rewards. Facing uncertainty, firms have strived to achieve
greater supply chain collaboration to leverage the resources and knowledge of their supply chain partners.
Several management practices have discussed in this study, like vender managed inventory, efficient consumer
response, continuous replenishment, collaborative planning, forecasting and replenishment etc the recent
practices have been discussed in more detail and concludes that collaborative planning, forecasting and
replenishment , are firmly establishing themselves as the way forward for successful and sustainable supply
chain.
Keywords: Supply chain collaboration, vendor managed inventory, efficient consumer response, collaborative
planning forecasting and replenishment.
Introduction
Supply chain management (SCM) seems to be a growing area of interest between researchers and practioners
from various disciplines. SCM has been evolving for the past sixty-five years; beginning with the traffic then
order management, and warehousing departments. They were ultimately brought together under the area of
physical distribution. Subsequently inventory management and customer service were emerged, enabling
integrated logistics, followed by production planning and procurement. Today we have supply chain
management, which is rapidly emerging into value chain management, which recognizes that demand is also
important as supply.
Supply chain (SC) has evolved very rapidly starts in 1990, and showing an exponential interest in study in
different journals of academics and practitioners (Burgess & Steenkamp, 2006). The SC consists of different
functions, like logistics, inventory, purchasing and procurement, production planning, intra and inter-
organizational relationships and performance measures. The interest in research on SC as well as the case
studies in different areas of SC in different industries motivates to further study in SC issues. SCs are generally
complex with numerous activities usually spread over multiple functions. Therefore, it is necessary to overlay a
coordination system, which may include: an explicit definition of processes, responsibilities and structures
aligned with overall objective of whole SC to bring together multiple functions and organizations (Arshinder,
2008). The continuous evolving dynamic structure of the SC poses many interesting challenges for effective
system coordination. SC members cannot compete as independent members. To improve the overall
performance of SC, the members of SC may behave as a part of a unified system and collaborate with each
other.
There seems to be a general lack of managerial ability to collaborate the intricate network of business
relationships among SC members (Lambert & Cooper, 2000). collaboration acts as a central lever of SCM (R.
Ballou, Gilbert, & Mukherjee, 2000). According to (Stank, Goldsby, & Vickery, 1999) inter firm coordination
processes characterized by effective communication, information exchange, partnering and performance
monitoring. (Lee, So, & Tang, 2000) proposes SC collaboration as a vehicle to redesign decision rights,
workflow, and resources between chain members to gain values such as greater profit margins, more customer
satisfaction and less response time.
By literature review on collaboration in SC, It shows that study of Supply Chain Collaboration (SCC) is still in
its infancy. Therefore the proper understanding of collaboration is realized. Supply chain collaboration is
defined as a long term relationship where members of chain generally cooperate, sharing information, and work
together to plan and even modify their business practices to improve joint performance (Nyaga, Whipple, &
Lynch, 2010). Supply chain collaboration looks to capitalize on the expertise and skill of individual firms to

Proceedings of the National Conference on
Trends and Advances in Mechanical Engineering
(TAME-2017) March 16-17, 2017 ISBN 978-93-5268-269-0
YMCA University of Science & Technology, Faridabad, Haryana
354
collectively provide benefits to all chain members. (Fawcett & McCarter, 2008) stated that collaboration’s goal
is to have parties work cooperatively to devise and implement better approaches to solving problems and
delivering the value according to customer’s expectation. Further the authors assert collaboration goes beyond
managing transactions for efficiency to managing relationships for creativity and continuous improvement
throughout the chain. These collaborative relationships are long-term endeavors where partners know the
capabilities and needs of each other and actively seek to develop new practices.
This paper deals with presenting an overview of collaboration and its various elements in SC. The terms like
integration, collaboration, cooperation and coordination are complementary to each other and when used in the
context of SC can easily be considered as a part of SCC. This assumption can be followed without loss of
generality as the elements like integration is combining to an integral whole, collaboration means working
jointly and cooperation as a joint operation, are the elements of coordination.
Supply Chain: Supply chain is a series of organizations that may be involved in different processes and activities to produce
products and services for ultimate customers. Therefore, it is made up of a number of companies including
supplies, distributions and the end customers. Some definitions of SC are summarized as fallow, according to
(Christopher & Holweg, 2011) supply chain is ‘The network of connected and interdependent organizations
mutually and co operative by working together to control, manage and improve the flow of materials and
information from supplier to end users’. ‘It consists of vertically linked organizations from raw material sources
to end customers’ (Bask & Juga, 2001). ‘Network of facilities and activities that performs the functions of
product development, procurement of material from vendors, movement of material between facilities, the
manufacturing of products, distribution finished goods to customers and provide service support for
sustainment’ (Mabert & Venkataramanan, 1998). ‘The networks of manufacturing and distribution sites that
procure raw materials transform them into intermediate and finished products and distribute finished products to
customers’(Lee & Billington, 1992). ‘The network of entities that starts with the suppliers’ supplier and ends
with the customers’ custom, the production and delivery of goods and services’ (Lee & Ng, 1997). ‘System
whose constituent parts include suppliers of materials, production facilities, distribution services and customers,
all linked together via the feed forward flow of materials and the feedback flow of information’(Towill, Naim,
& Wikner, 1992).
Supply Chain Management
Since the 1980s, SCM has gained much interest from both academic and practitioners in business management
and economics (Stock, Boyer, & Harmon, 2010); (Wisner, 2003). As SCM is a new discipline, one of the issues
is the lack of consensus on the definition of the term (Wilding, Wagner, & Fayezi, 2012); Burgess et al., 2006;
Storey et al., 2006; (Wilding, Wagner, & Chicksand, 2012); (Wilding, Wagner, & Pilbeam, 2012); (Wilding &
Wagner, 2012a). Hence the definition of SCM is reviewed in this section.
SCM is a new discipline compared to other fields of business and management studies (Larson & Halldorsson,
2004). The term logistics originates from military operations, and then its concept, tools, and techniques were
applied to business management. Logistics management has played a critical role in business management
(Gudehus & Kotzab, 2012). Since the emergence of supply chain management, there has been some discussion
on its associations to logistics management (Mentzer & Williams, 2001); (Cooper, Lambert, & Pagh, 1997)
strategy and organization (Seuring & Müller, 2003) or an expanded marketing concept (Alvarado & Kotzab,
2001). Some definitions of SCM are summarized as fallow; according to (Christopher & Holweg, 2011) SCM is
‘The management of upstream and downstream relationships with suppliers and customers in order to deliver
superior customer value at less cost to the supply chain as a whole’. ‘SCM endorses a supply chain orientation
and involve proactively managing the two way movement and coordination of goods, services, information and
funds from raw material through end user’(Monczka & Handfield, 2009). ‘SCM involves all activities
associated with the transformation and flow of goods and services, including their information flows, from
sources of raw material to end users’(R. H. Ballou, Gilbert, & Mukherjee, 2000). The integration of business
processes from end user through original supplier, which adds values to customers’(Cooper et al., 1997). ‘SCM
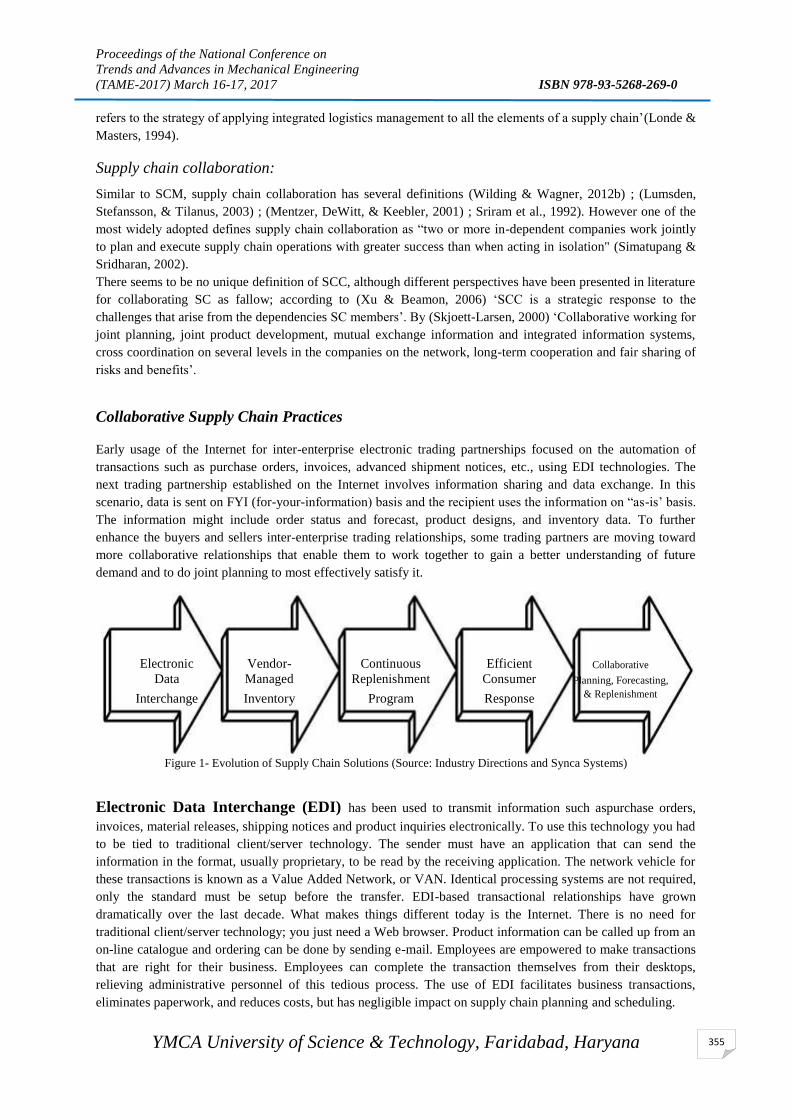
Proceedings of the National Conference on
Trends and Advances in Mechanical Engineering
(TAME-2017) March 16-17, 2017 ISBN 978-93-5268-269-0
YMCA University of Science & Technology, Faridabad, Haryana
355
refers to the strategy of applying integrated logistics management to all the elements of a supply chain’(Londe &
Masters, 1994).
Supply chain collaboration:
Similar to SCM, supply chain collaboration has several definitions (Wilding & Wagner, 2012b) ; (Lumsden,
Stefansson, & Tilanus, 2003) ; (Mentzer, DeWitt, & Keebler, 2001) ; Sriram et al., 1992). However one of the
most widely adopted defines supply chain collaboration as “two or more in-dependent companies work jointly
to plan and execute supply chain operations with greater success than when acting in isolation" (Simatupang &
Sridharan, 2002).
There seems to be no unique definition of SCC, although different perspectives have been presented in literature
for collaborating SC as fallow; according to (Xu & Beamon, 2006) ‘SCC is a strategic response to the
challenges that arise from the dependencies SC members’. By (Skjoett-Larsen, 2000) ‘Collaborative working for
joint planning, joint product development, mutual exchange information and integrated information systems,
cross coordination on several levels in the companies on the network, long-term cooperation and fair sharing of
risks and benefits’.
Collaborative Supply Chain Practices
Early usage of the Internet for inter-enterprise electronic trading partnerships focused on the automation of
transactions such as purchase orders, invoices, advanced shipment notices, etc., using EDI technologies. The
next trading partnership established on the Internet involves information sharing and data exchange. In this
scenario, data is sent on FYI (for-your-information) basis and the recipient uses the information on “as-is’ basis.
The information might include order status and forecast, product designs, and inventory data. To further
enhance the buyers and sellers inter-enterprise trading relationships, some trading partners are moving toward
more collaborative relationships that enable them to work together to gain a better understanding of future
demand and to do joint planning to most effectively satisfy it.
Electronic Vendor- Continuous Efficient Collaborative
Data Managed Replenishment Consumer Planning, Forecasting,
Interchange Inventory Program Response & Replenishment
Figure 1- Evolution of Supply Chain Solutions (Source: Industry Directions and Synca Systems)
Electronic Data Interchange (EDI) has been used to transmit information such aspurchase orders,
invoices, material releases, shipping notices and product inquiries electronically. To use this technology you had
to be tied to traditional client/server technology. The sender must have an application that can send the
information in the format, usually proprietary, to be read by the receiving application. The network vehicle for
these transactions is known as a Value Added Network, or VAN. Identical processing systems are not required,
only the standard must be setup before the transfer. EDI-based transactional relationships have grown
dramatically over the last decade. What makes things different today is the Internet. There is no need for
traditional client/server technology; you just need a Web browser. Product information can be called up from an
on-line catalogue and ordering can be done by sending e-mail. Employees are empowered to make transactions
that are right for their business. Employees can complete the transaction themselves from their desktops,
relieving administrative personnel of this tedious process. The use of EDI facilitates business transactions,
eliminates paperwork, and reduces costs, but has negligible impact on supply chain planning and scheduling.

Proceedings of the National Conference on
Trends and Advances in Mechanical Engineering
(TAME-2017) March 16-17, 2017 ISBN 978-93-5268-269-0
YMCA University of Science & Technology, Faridabad, Haryana
356
Quick Response (QR) began as a soft goods initiative and starts ‘continuous replenishment planning’
business as a goals to synchronize buyer and sellers, and reduce the cost in the soft goods by using more
consumer centric replenishment. Point of sale (POS) was part of the share information flow and EDI was the
technology base. QR preceded the formation of the voluntary interindustry commerce standards (VICS)
association in 1986. (Angulo, Nachtmann, & Waller, 2004).
Vendor-Managed Inventory (VMI) was introduced by Kurt Solomon Associates in1992. VMI existed
in retailing before the growth of enabling technologies and is perhaps the most widely known system for
managing supply chains. In this practice, the replenishment decision for all retailers is centralized at the
upstream distributor or manufacturer. The manufacturer or distributor manages and monitors inventories of the
wholesaler or retailer. Companies like K-Mart, Frito-Lay, and Fred Meyer have implemented VMI with
significant success. Fred Meyer has seen inventories reduce by 30-40 percent and fill rates increase to 98
percent. K-Mart has experienced inventory turns on seasonal items increase from 3 percent to 9-11 percent.
Continuous Replenishment Programs (CRP) is driven by actual withdrawals ofinventory from a
retailer warehouse rather than Point-of-Sale (POS) data at the retailer level. In CRP, the manufacturer or
wholesaler replenishes a retailer regularly based on POS data.
Efficient Consumer Response (ECR) is driven by the establishment of “EffectiveChannel
Relationships,” whereby partners in the supply chain cooperate to achieve the more than $30 billion savings
promised by the ECR initial analysis conducted by industry-wide working groups in 1992. The analysis
determined that the industry could save $30 billion annually and reduces system-wide inventories by more than
40 percent. ECR included: efficient store assortment, efficient replenishment, efficient promotion and efficient
product distribution.
Collaborative Planning, Forecasting, and, Replenishment (CPFR) extents VendorManaged
Inventory principles and is considered to be the latest stage in the evolution of supply chain collaboration. Older
supply chain initiatives had gaps in their practices. In many of these operations financial plans took precedence
over forecast, resulting in high inventory levels, lower order fill rates, and increased expedited activities. CPFR
is a set of business processes that help eliminate supply/demand uncertainty through improved communications
and collaborations between supply chain partners.
CPFR: The Most promising Practice
A major difference during starting period between CPFR and other solutions models, such as Efficient
Consumer Response (ECR), is that the other models require critical mass (participations of many buyers and
sellers) before any benefits are realized. CPFR, however, enables a buyer to improve performance by just having
a collaborative relationship with only one vendor, but later n-tier CPFR models are developed.
The CPFR Model
CPFR is an initiative that facilitates the reengineering of the replenishment between trading partners. An
important promise of CPFR is that accuracy of the forecast (demand, order, sales) can improve by having the
customer and supplier participates in the forecast. A buyer and a seller, as collaborators, work together to satisfy
the demands of an end customer, who is at the center of the model (VICS, 2004). CPFR model is applicable to
many industries. If a discrepancy occurs, the trading partners can get together and decide on the replenishment
quantity to rectify the problem. This type of collaboration offers great potential to drastically improve supply
chain performance through collaborative demand planning, synchronized production scheduling, logistics
planning, and new product development.
Stages of Collaboration
According to VICS Association, CPFR provides templates for supply chain collaboration in four stages (VICS,
2004).
1. Planning – At this stage, the relationship between buyers and sellers is plannedand updated. It leads to front-end
agreement and joint business plan. Variances, whether plan-to-plan or plan-to-actual, are also addressed.
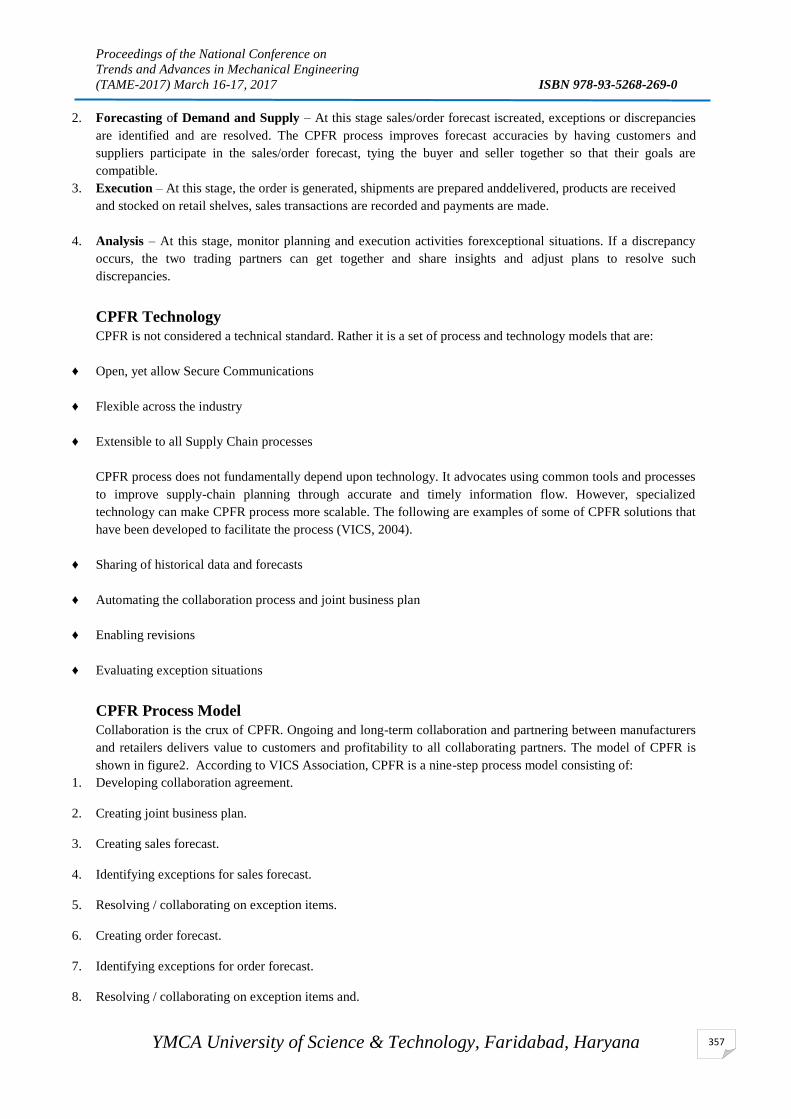
Proceedings of the National Conference on
Trends and Advances in Mechanical Engineering
(TAME-2017) March 16-17, 2017 ISBN 978-93-5268-269-0
YMCA University of Science & Technology, Faridabad, Haryana
357
2. Forecasting of Demand and Supply – At this stage sales/order forecast iscreated, exceptions or discrepancies
are identified and are resolved. The CPFR process improves forecast accuracies by having customers and
suppliers participate in the sales/order forecast, tying the buyer and seller together so that their goals are
compatible.
3. Execution – At this stage, the order is generated, shipments are prepared anddelivered, products are received
and stocked on retail shelves, sales transactions are recorded and payments are made.
4. Analysis – At this stage, monitor planning and execution activities forexceptional situations. If a discrepancy
occurs, the two trading partners can get together and share insights and adjust plans to resolve such
discrepancies.
CPFR Technology
CPFR is not considered a technical standard. Rather it is a set of process and technology models that are:
♦ Open, yet allow Secure Communications
♦ Flexible across the industry
♦ Extensible to all Supply Chain processes
CPFR process does not fundamentally depend upon technology. It advocates using common tools and processes
to improve supply-chain planning through accurate and timely information flow. However, specialized
technology can make CPFR process more scalable. The following are examples of some of CPFR solutions that
have been developed to facilitate the process (VICS, 2004).
♦ Sharing of historical data and forecasts
♦ Automating the collaboration process and joint business plan
♦ Enabling revisions
♦ Evaluating exception situations
CPFR Process Model
Collaboration is the crux of CPFR. Ongoing and long-term collaboration and partnering between manufacturers
and retailers delivers value to customers and profitability to all collaborating partners. The model of CPFR is
shown in figure2. According to VICS Association, CPFR is a nine-step process model consisting of:
1. Developing collaboration agreement.
2. Creating joint business plan.
3. Creating sales forecast.
4. Identifying exceptions for sales forecast.
5. Resolving / collaborating on exception items.
6. Creating order forecast.
7. Identifying exceptions for order forecast.
8. Resolving / collaborating on exception items and.
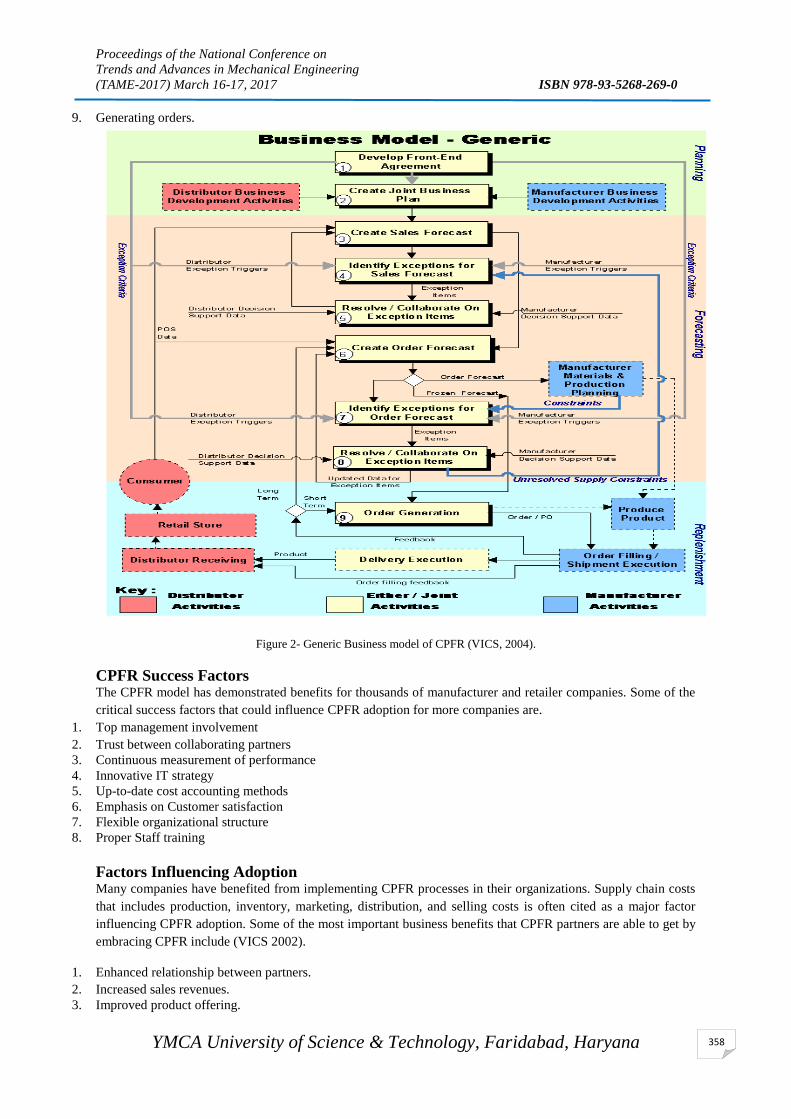
Proceedings of the National Conference on
Trends and Advances in Mechanical Engineering
(TAME-2017) March 16-17, 2017 ISBN 978-93-5268-269-0
YMCA University of Science & Technology, Faridabad, Haryana
358
9. Generating orders.
Figure 2- Generic Business model of CPFR (VICS, 2004).
CPFR Success Factors The CPFR model has demonstrated benefits for thousands of manufacturer and retailer companies. Some of the
critical success factors that could influence CPFR adoption for more companies are.
1. Top management involvement 2. Trust between collaborating partners 3. Continuous measurement of performance 4. Innovative IT strategy 5. Up-to-date cost accounting methods 6. Emphasis on Customer satisfaction 7. Flexible organizational structure 8. Proper Staff training
Factors Influencing Adoption Many companies have benefited from implementing CPFR processes in their organizations. Supply chain costs
that includes production, inventory, marketing, distribution, and selling costs is often cited as a major factor
influencing CPFR adoption. Some of the most important business benefits that CPFR partners are able to get by
embracing CPFR include (VICS 2002).
1. Enhanced relationship between partners. 2. Increased sales revenues. 3. Improved product offering.

Proceedings of the National Conference on
Trends and Advances in Mechanical Engineering
(TAME-2017) March 16-17, 2017 ISBN 978-93-5268-269-0
YMCA University of Science & Technology, Faridabad, Haryana
359
4. Reliable and accurate order forecasts. 5. Reduction in inventories 6. Improved technology return on investment
Successful Examples of CPFR Numerous case studies provide ample evidence of early success that companies in North America and Europe
have had in implementing CPFR strategies. CPFR is gaining broad appeal. According to the recent survey of
2,100 executives mentioned earlier, CPFR practice is catching on: 25 percent of respondents indicated that
CPFR has been implemented in their firms. Most CPFR implementations have been in North America and
Europe. In the United States alone, more than $ 15 billion in the supply chain is managed by CPFR processes
and more than thirty CPFR programs are currently underway in Europe.
CPFR practice is spreading beyond company-to-company initiatives to include industry consortia as well. In
July 2001, Transora, a global B2B e-marketplace, introduced the CPFR compliant Data Catalogue for the
consumer packaged goods industry. The catalogue is a first step for global standard of data exchange within this
industry.
The elimination of uncertainty between trading partners who have an effect on the value of the end product
creates a win-win situation for all involved parties. By sharing information over the Internet, the buyer and seller
develop a single dynamic forecast. The result is more accurate forecasting with lower inventory levels. These
benefits save time and money. CPFR enables trading partners to collaborate more effectively, plan more
accurately, and respond more rapidly up and down the value chain. Early adaptors of CPFR have reported lower
procurement costs, smaller inventories, shorter cycle times, faster response to the market, and reduction in
forecasting errors. Nabisco and Wagmans, for example, noted over a 50 percent increase in category sales. Wal-
Mart and Sara Lee reported an 18 percent reduction in inventory levels, up to a 20 percent reduction in
replenishment cycle, and a 40 percent more accurate forecast with a 32 percent increase in sales. The following
are examples of some companies that capitalized on the CPFR advantages.
Wal-Mart: The CPFR initiative has proven very valuable to Wal-Mart. The retailer hasexperimented with
CPFR since 1995 and has had significant success in this regard. Wal-Mart shares POS data with its suppliers to
improve coordination in the supply chain. The company has a joint initiative with P&G where managers from
both companies jointly forecast sales of P&G products at Wal-Mart stores and then jointly plan replenishment
strategies. This collaboration ensures that there is no gap between what Wal-Mart plans to sell and what P&G
plans to produce (Meindl & Chopra, 2001).
Heineken USA: Traditionally, it took Heineken 10 to 12 weeks to deliver beer to itsdistributor. In late 1995, the
company decided to implement a supply chain management system to reduce the delivery time to between four
and six weeks. Using Logility’s CPFR-compliant Voyager XPS software and the Internet, Heineken has
implemented a private network connecting the company to customers and/or suppliers. The system can also
connect salespeople to the central database. Heineken is using the system to do real-time forecasting, ordering,
and replenishment with its distributors. The company can also deliver customized forecasting data to its
distributors through individual web pages. Through CPFR, distributors can login and view their sales forecast,
and modify and submit their order online. The system has helped the company to reduce order cycle times from
three months to four weeks. Other benefits include lower procurement costs, smaller inventory, and fresher
products to consumers (Lothair, 2001).
Dell Computer: Del sells PCs directly to customers and starts assembly after receiving acustomer order. The
company leverages the Internet in dealing with both customers and suppliers. Dell is praised for its ability to
manage its large worldwide supply chain and avoid unnecessary fluctuations by sharing demand data as well as
current inventory positions of components with many of its suppliers on the Internet. Del is using Agile
Anywhere, an Internet based technology, to fulfill individually customized products with a delivery target of 5
days or less. Aggregating all product information in a single system on the Internet enables Del to disseminate
all product changes instantly and track them across the supply chain. The system helps Del to extend its
leadership position in a competitive computer market (Lothair, 2001).
Herlitz AG: In the fierce competition in the office supply industry, Herlitz Ag, Europe’sleading manufacturers
of office supplies, decided to make collaboration with its supply chain the key to its future success. Using J.D.

Proceedings of the National Conference on
Trends and Advances in Mechanical Engineering
(TAME-2017) March 16-17, 2017 ISBN 978-93-5268-269-0
YMCA University of Science & Technology, Faridabad, Haryana
360
Edwards’ advanced Planning Solution, Herlitz has allowed the interactive, real-time sharing of supply and
demand information among customers and suppliers. This process allowed Herlitz to analyze historical
customer data and use it to generate valuable sales forecasts. This also gave Herlitz the ability to analyze the
impact of a customer’s seasonal fluctuations or promotions on sales. The system has helped the company to
achieve significant improvement in customer service. The company’s customers have reduced shelf stock-outs
by 50 percent, increased inventory turns by 15 percent, and significantly lowered stock holding costs (Lothair,
2001).
Coca-Cola FEMSA (KOF): KOF is headquartered in Mexico City and is the secondlargest bottler and
distributor of Coca-Cola products in Latin America. With eight production plants and 63 distribution centers, the
company decided to implement a supply chain management system to decrease stock-outs, minimize variability
in operations, reduce inventory, forecast accuracy, improve asset utilization, and enhance customer service.
Using J.D. Edwards’ advanced Planning Solution, KOF has increased demand-planning accuracy up to 93
percent and reduced stock-outs to less than 1 percent. The system has helped the company to achieve greater
overall efficiency and most importantly, better customer service (Norbridge, 2001).
Colgate-Palmolive: In 1995, Colgate began rolling out its core enterprise solution toimprove its operations.
This contributed to large gains in efficiency. However, the company aimed to upgrade supply chain performance
worldwide by replacing a regional sourcing model with a fully globalized supply chain built around VMI with
collaborative planning with downstream subsidiaries. Using mySAP Supply Chain Management platform, the
company has provided instant, real time access to information about vendors, forecasts, production plans, and
key indicators such as inventory levels and fulfillment rates. The platform enhanced Colgate’s global supply
chain performance. It enables Colgate to gain visibility into global logistic data. The company improved on-time
and complete orders by 18 percent, lowered inventory by 10 percent and improved customer order fulfillment
rates by 95 percent (Norbridge, 2001).
Palm, Inc.: Palm, Inc. is a leading provider of handheld computers. Faced with ever-changing customer
demands and increasing competitive environment, the company decided to shorten planning cycles, increase
visibility, and improve logistics and control. The company decided to use mySAP Supply Chain Management
(mySAP SCM) solution. The results were impressive-Palm reduced planning cycle time by 50%, inventory
turnovers were improved from 6 to 10, and overall inventory level decreased by 32 percent. The company also
achieved stronger sales growth and reduced stock-outs (Lothair and Norbridge 2002).
There are numerous examples of organizations, having successfully implimentiong CPFR. The use of CPFR
makes it possible to take even greater advantages of the efficiency potential sought through other collaborative
practices. The typical benefits of CPFR are.
-Drastically improved reaction times to consumer demand.
-Higher precision of sales forecasts.
-Direct and lasting communication.
-Improved sales.
-Inventory reduction.
-Reduced costs.
Conclusions
Because of global competition and the rapid adoption of outsourcing, today’s organizations are operating in a
‘networked business environment’. The past decade has witnessed a significant increase in globalization across
all industry segments, as a result, supply chain have become highly complex, and include multiple touch points
that range from the handling of new material to the delivery of finished goods to the customer. In this new
environment, supply chain must exhibit a high degree of collaboration. Factors such as increased outsourcing,
supplier collaboration, and the pursuit of perfect demand information have spurred the need for applications and
platforms such as CPFR that provide better management visibility across the enterprise. By following CPFR
companies can dramatically improve supply chain effectiveness with demand planning, synchronized
production scheduling, logistic planning, and new product design. What is really valuable is the ability to look
forward and use planning systems in real-time to determine order profitability and to create harmony. Harmony

Proceedings of the National Conference on
Trends and Advances in Mechanical Engineering
(TAME-2017) March 16-17, 2017 ISBN 978-93-5268-269-0
YMCA University of Science & Technology, Faridabad, Haryana
361
offers a “guidance system” for cost cutting, improved profitability and operational excellence.
References: Alvarado, U. Y., & Kotzab, H. (2001). Supply Chain Management: The Integration of Logistics in Marketing.
Industrial Marketing Management, 30(2), 183–198. https://doi.org/10.1016/S0019-8501(00)00142-5
Angulo, A., Nachtmann, H., & Waller, M. A. (2004). Supply Chain Information Sharing in a Vendor Managed
Inventory Partnership. Journal of Business Logistics, 25(1), 101–120. https://doi.org/10.1002/j.2158-
1592.2004.tb00171.x
Arshinder. (2008). Development of a decision support tool for supply chain coordination using contracts. Journal of
Advances in …. Retrieved from http://www.emeraldinsight.com/doi/pdf/10.1108/09727980810949115
Ballou, R., Gilbert, S., & Mukherjee, A. (2000). New managerial challenges from supply chain opportunities.
Industrial Marketing Management. Retrieved from
http://www.sciencedirect.com/science/article/pii/S0019850199001078
Ballou, R. H., Gilbert, S. M., & Mukherjee, A. (2000). New Managerial Challenges from Supply Chain Opportunities.
Industrial Marketing Management, 29(1), 7–18. https://doi.org/10.1016/S0019-8501(99)00107-8
Bask, A., & Juga, J. (2001). Semi-integrated supply chains: towards the new era of supply chain management.
International Journal of Logistics. Retrieved from
http://www.tandfonline.com/doi/abs/10.1080/13675560110059434
Burgess, S. M., & Steenkamp, J.-B. E. M. (2006). Marketing Renaicanse: How research in emerging market advances
marketing science and practice. International Journal of Research in Marketing, (23), 337–356. Retrieved from
http://www.sciencedirect.com/science/article/pii/S0167811606000607
Christopher, M., & Holweg, M. (2011). “Supply Chain 2.0”: managing supply chains in the era of turbulence.
International Journal of Physical Distribution & Logistics Management, 41(1), 63–82.
https://doi.org/10.1108/09600031111101439
Cooper, M. C., Lambert, D. M., & Pagh, J. D. (1997). Supply Chain Management: More Than a New Name for
Logistics. The International Journal of Logistics Management, 8(1), 1–14.
https://doi.org/10.1108/09574099710805556
Fawcett, S. E., & McCarter, M. W. (2008). Behavioural issues in supply chain collaboration: communicating the
literature via interactive learning. International Journal of Integrated Supply Management, 4(2), 159.
https://doi.org/10.1504/IJISM.2008.016616
Gudehus, T., & Kotzab, H. (2012). Optimal Networks and Supply Chains. Comprehensive Logistics. Retrieved from
http://www.springerlink.com/index/R0G6321418U12205.pdf
Lambert, D., & Cooper, M. (2000). Issues in supply chain management. Industrial Marketing Management. Retrieved
from http://www.sciencedirect.com/science/article/pii/S0019850199001133
Larson, P., & Halldorsson, A. (2004). Logistics versus supply chain management: an international survey.
International Journal of Logistics: Retrieved from
http://www.tandfonline.com/doi/abs/10.1080/13675560310001619240
Lee, H., & Billington, C. (1992). Managing supply chain inventory: pitfalls and opportunities. Sloan Management
Review. Retrieved from http://sloanreview.mit.edu/article/managing-supply-chain-inventory-pitfalls-and-
opportunities/
Lee, H., & Ng, S. (1997). Introduction to the special issue on global supply chain management. Production and
Operations Management. Retrieved from http://onlinelibrary.wiley.com/doi/10.1111/j.1937-
5956.1997.tb00425.x/full
Lee, H., So, K., & Tang, C. (2000). The value of information sharing in a two-level supply chain. Management
Science. Retrieved from http://pubsonline.informs.org/doi/abs/10.1287/mnsc.46.5.626.12047
Londe, B. La, & Masters, J. (1994). Emerging logistics strategies: blueprints for the next century. Distribution &
Logistics Management. Retrieved from http://www.emeraldinsight.com/doi/abs/10.1108/09600039410070975
Lumsden, K., Stefansson, G., & Tilanus, B. (2003). Collaboration in Logistics. European Journal of Operational
Research. https://doi.org/10.1016/S0377-2217(02)00389-2
Mabert, V., & Venkataramanan, M. (1998). Special research focus on supply chain linkages: challenges for design
and management in the 21st century. Decision Sciences. Retrieved from
http://search.proquest.com/openview/a1a9db8db5020871ee3c495f8dfcd73a/1?pq-origsite=gscholar
Meindl, P., & Chopra, S. (2001). Supply Chain Management: Strategy, Planning, And Operation, 5/e. Retrieved from
https://books.google.co.in/books?hl=en&lr=&id=GcXODAAAQBAJ&oi=fnd&pg=PP2&dq=Chopra,+Sunil,+
Meindel,+Peter,+2001.+Supply+chain+management:+Strategy+Planning+and+Operation,+Prentice+Hall,+Inc.,
+pp+360-370.&ots=nwKNfMqvzV&sig=_aEx0mo_NXOPtbcU2Idg2Os8Wy4
Mentzer, J., DeWitt, W., & Keebler, J. (2001). Defining supply chain management. … of Business Logistics.
Retrieved from http://onlinelibrary.wiley.com/doi/10.1002/j.2158-1592.2001.tb00001.x/abstract
Mentzer, J., & Williams, L. (2001). The role of logistics leverage in marketing strategy. Journal of Marketing

Proceedings of the National Conference on
Trends and Advances in Mechanical Engineering
(TAME-2017) March 16-17, 2017 ISBN 978-93-5268-269-0
YMCA University of Science & Technology, Faridabad, Haryana
362
Channels. Retrieved from http://www.tandfonline.com/doi/abs/10.1300/J049v08n03_03
Monczka, R., & Handfield, R. (2009). Sourcing and Supply Chain Management. Retrieved from
https://scholar.google.co.in/scholar?q=Monczka%252C+2009&btnG=&hl=en&as_sdt=0%252C5#6
Nyaga, G., Whipple, J., & Lynch, D. (2010). Examining supply chain relationships: do buyer and supplier
perspectives on collaborative relationships differ? Journal of Operations Management. Retrieved from
http://www.sciencedirect.com/science/article/pii/S0272696309000473
Seuring, S., & Müller, M. (2003). Strategy and organization in supply chains–new frontiers for research. Strategy and
Organisation in Supply Chains. …. Retrieved from
http://www.researchgate.net/profile/Stefan_Seuring/publication/267421354_Strategy_and_Organization_in_Sup
ply_Chains__New_Frontiers_for_Research/links/54b91a160cf2c27adc49147a.pdf
Simatupang, T., & Sridharan, R. (2002). The collaborative supply chain. The International Journal of …. Retrieved
from http://www.emeraldinsight.com/doi/pdf/10.1108/09574090210806333
Skjoett-Larsen, T. (2000). European logistics beyond 2000. International Journal of Physical Distribution. Retrieved
from http://www.emeraldinsight.com/doi/abs/10.1108/09600030010336144
Stank, T., Goldsby, T., & Vickery, S. (1999). Effect of service supplier performance on satisfaction and loyalty of
store managers in the fast food industry. Journal of Operations Management. Retrieved from
http://www.sciencedirect.com/science/article/pii/S0272696398000527
Stock, J., Boyer, S., & Harmon, T. (2010). Research opportunities in supply chain management. Journal of the
Academy of Marketing …. Retrieved from http://link.springer.com/article/10.1007/s11747-009-0136-2
Towill, D., Naim, M., & Wikner, J. (1992). Industrial dynamics simulation models in the design of supply chains.
Journal of Physical Distribution …. Retrieved from
http://www.emeraldinsight.com/doi/pdf/10.1108/09600039210016995
Wilding, R., & Wagner, B. (2012a). Sustainable purchasing and supply management: a structured literature review of
definitions and measures at the dyad, chain and network levels. Supply Chain …. Retrieved from
http://www.emeraldinsight.com/doi/abs/10.1108/13598541211258564
Wilding, R., & Wagner, B. (2012b). Understanding the role of logistics capabilities in achieving supply chain agility:
a systematic literature review. … Chain Management: …. Retrieved from
http://www.emeraldinsight.com/doi/abs/10.1108/13598541211246594
Wilding, R., Wagner, B., & Chicksand, D. (2012). Theoretical perspectives in purchasing and supply chain
management: an analysis of the literature. Supply Chain. Retrieved from
http://www.emeraldinsight.com/doi/abs/10.1108/13598541211246611
Wilding, R., Wagner, B., & Fayezi, S. (2012). Agency theory and supply chain management: a structured literature
review. Supply Chain. Retrieved from http://www.emeraldinsight.com/doi/abs/10.1108/13598541211258618
Wilding, R., Wagner, B., & Pilbeam, C. (2012). The governance of supply networks: a systematic literature review.
Supply Chain. Retrieved from http://www.emeraldinsight.com/doi/pdf/10.1108/13598541211246512
Wisner, J. (2003). A structural equation model of supply chain management strategies and firm performance. Journal
of Business Logistics. Retrieved from http://onlinelibrary.wiley.com/doi/10.1002/j.2158-
1592.2003.tb00030.x/abstract
Xu, L., & Beamon, B. (2006). Supply chain coordination and cooperation mechanisms: an attribute‐based approach.
Journal of Supply Chain Management. Retrieved from http://onlinelibrary.wiley.com/doi/10.1111/j.1745-
493X.2006.04201002.x/full
Lothair, Norbridge, 2002. Supply chain Teamwork: Nothing but Net Profit. Business Week, May 6.

Proceedings of the National Conference on
Trends and Advances in Mechanical Engineering
(TAME-2017) March 16-17, 2017 ISBN 978-93-5268-269-0
YMCA University of Science & Technology, Faridabad, Haryana
363
DEVELOPMENT OF A LINEAR PROGRAMMING (L.P) MODEL FOR
MAXIMIZATION OF PROFIT WITH PROPER TOOL MANAGEMENT
IN FLEXIBLE MANUFACTURING SYSTEM
Surinder Kumar*1 and Tilak Raj
2
1Research Scholar,
2Professor, Department of Mechanical Engineering, YMCA University of
Science and Technology, Faridabad, Haryana, India
Email: [email protected]
Abstract
This paper presents the use of linear programming methods as applicable in the manufacturing industry and a
case study has been done for different types of 2 wheeler pistons and the tool materials used for piston
manufacturing. Data were collected for four types of pistons from a sub vendor company during case study
engaged in piston manufacturing.Information on costing regarding per piston for job work has been collected
from the company as per market rates. Based on the job work rates the maximum profit that would ensue to the
company was determined. The results confirmed that the company would attain optimal profit level. The
selection of the optimum number and right type of machine tools in flexible manufacturing systems (FMS) is
very important because the success and failure of any organization depends on the level on the ability of making
appropriate decision. Linear programming as a tool of operations research and it may be employed where there
is a need to formulate a mathematical model to represent the problem to several competing activity for
optimality. However, this study recommends to the management of the company that full utilization of resources
and proper tool management in FMS environment should be done for maximum production of Pistons to
maximize the profit.
Keywords: Flexible manufacturing system, Linear programming, Simplex Method, Objective function, Zweig
media.com and Lingo 6.1.
1. Introduction
Throughout the world manufacturing industries are under pressure due to rapid changes in technology, creative
product configurations and quality demand of product by the customer at lowest price. Industries are also facing
financial crisis because of high cost automation needed for completion of market orders for their survival.
Automation technology like Flexible manufacturing system (FMS) has a huge investment in their
implementation. BasicallyFMS is an integrating computer controlled system of automated material handling
devices and numerically controlled (NC) machine tools which can simultaneously process medium sized
volumes of a variety of parts with quick tooling and performing the operations as per the required sequence. In
recent years, the flexible manufacturing system (FMS) has been widely considered as an effective instrument
toward this end because its combination with multipurpose tools, makes it possible for a flexible manufacturing
system to process a great diversity of parts (Pandey et al.2016). Decision-making regarding the implementation
of an FMS is not only strategic but also involves issues at the tactical and operational levels. Decision-making
in social and business environment has become a complex task. The success and failure totally depends on the
ability of decision maker (Lee, 1972). The managers are always seeking right decisions to meet the objectives
and enhancing the profit. This leads to pressure on management in finding the optimal planning, organizing,
leading and controlling levels of production in the various productive industries.Managerial theories of the firm
are introduced to analyze business environments and to solve practical business problems such as operational
and environmental problems in which the industry runs. To solve these problems quantitative techniques are
developed to model and analyze these decision making problems. Among this quantitative technique is the
linear programming model, which uses mathematical method in seeking the optimum course of action in any
decision making for limited resources and uncertainties. The term ‘linear’ implies proportionality, which means
that the elements in a situation are so connected that they appear as straight line when graphed (Akingbade,1996
According to Jenness, (1972) Linear programming (LP) is a mathematical modelling technique useful for
allocation of limited resources, such as labour, materials, machine, tools, time, warehouse space, capital, energy,
etc. on a basis of given optimality. The resources that is not available in infinite quantity during the planning
period. The criterion for optimality is either performance, return on investment, profit cost, utility, time and

Proceedings of the National Conference on
Trends and Advances in Mechanical Engineering
(TAME-2017) March 16-17, 2017 ISBN 978-93-5268-269-0
YMCA University of Science & Technology, Faridabad, Haryana
364
distance etc. Generally, the objective function may be of maximization of profit or minimization of costs, labour
hours, processing or operation cost of machining and minimization of time involve in manufacturing a product.
The model consists of certain constraints which are set of conditions that the optimal solution should justify to
meet the objective. The main objective of this paper is to maximize the profit with proper tool management and
to develop a mathematical model for piston manufacturing using Linear Programming Approach.
2. Literature review
It has been reported in the literature that decision regarding proper tool management in FMS must be made by
accounting number of the machines used for tool manufacturing including cost and flexibility (Kturk and Seluk,
1996). According to Charles, Cooper and Henderson (1963) linear programming as a uni-objective constrained
optimization technique. This is because, according to them, it seeks a single objective of either minimizing or
maximizing unknown variables in a model. Gupta and Hira (2009) advised that linear programming deals with
linear optimization of a function of variables known as objective function subject to set of linear equations and
inequalities known as constraints and non-negativity requirement. The objective function may be profit, cost,
production capacity or any other measure of effectiveness which is to be obtained in the best possible or optimal
manner. Linear programming is of great use in making business decision because it helps in measuring complex
economic relations and thereby, provides an optimum solution to the problem of resource allocation (Dwivedi,
2008). Linear programming technique thus, bridges the gap between abstract economic theories and managerial
decision-making. Several authors (Dowling, 1992, Dwivedi, 2008, Koutsoyiannis, 1987, Henderson and Quandt,
2003, etc) have given the general specification of the linear programming model. Turban and Meredith (1991)
agreeing with Dwivedi (2008), states that linear programming is one of the best known tools to take decision for
management. It has of three components; the decision (uncontrolled) variables, the environment (uncontrolled)
parameters and results (dependent) variables. Most of the researchers (Wagner, 2007, Lucey, 2002, etc) assume
that linear programming is an operations research technique and they utilize it in most commercially successful
applications of operations research and found that it ranks highest in economic impact. Therefore, operations
research technique is a highly scientific approach tool to problem-solving for executive management (Maurya et
al.1015). Other areas of this approach are: education, research and development, airlines, agriculture, oil
refining, energy planning, pollution control, transportation planning and schedule production planning,
manufacturing, health care system, problem of risks and uncertainties regarding the behaviour of customers,
resources and commodity prices and so on. It is also supportive tool when the management finds it difficult to
choose the best decision among the alternative decision possibilities (Turban, 1993). Managers should also be
more sophisticated about decision making; they must learn how to use new tools and techniques that are being
developed in their field. Because tool issues include number and types of tools, tool speed rates, tool feed rates
and technology to monitor and control machining. Tool life depends machining environment, speed ,feed rate,
material composition of part and tool along with depth of cut for a given set of machine tool. Tool management
plays an impotent role in any manufacturing process improves the poor performance of whole system. Tool
management effect the productivity of many automated and flexible manufacturing systems (Kiran and Krason
1988). Current research incorporating tooling economics and production benefits of decision level.
Classification of tools management may be on different levels like tool level, machine level and system level.
To ensure performance of an automated system high level of integration is required between the proper tooling
and basic production requirements. Many integer linear programming (ILP) models have been proposed to solve
the FMS loading problems and tooling is quite unrealistic, especially when setup times are important with
respect to processing times.
3. Methodology
The main aim of this research is to maximize the profit with proper tool management by using linear
programming technique for piston manufacturing in FMS environment. Linear Programming is a mathematical
tool that can be employed to provide solution to a wide variety of large and complex professional problems.
For this purpose, a case study has been conducted in a sub vendor company engaged in manufacturing
automobile and mechanical components. The data for the research study also collected from the same company.
The name of the company cannot be disclosed due to some security reason of the company. These four types of

Proceedings of the National Conference on
Trends and Advances in Mechanical Engineering
(TAME-2017) March 16-17, 2017 ISBN 978-93-5268-269-0
YMCA University of Science & Technology, Faridabad, Haryana
365
pistons models are manufactured by the company and supplied to the vendor and then it is supplied to the
company for its different bike models. The data collected in the form of time and cost operation wise on
machines according to the rates availability for machining per hour. In this study we have considered three
different cases for H.S.S tools, carbide coated tools and carbide tip tools used for piston manufacturing by the
machines. Finally, we have considered total time and operation cost machine wise for each case. The main focus
of this work is to determine the quantity of the pistons for each case that will maximize the profit of the
company by the utilization of proper tool management. The analysis was carried out using linear programming
technique. Basically Linear Programming is a mathematical technique for generating and selecting the optimal
or the best solution for a given objective function. It may also be defined as a method of optimizing (i.e.
maximizing or minimizing) a linear function for a number of constraints stated in the form of linear equations.
Simplex method proposed by B.Dantzig in 1947 as published in (1963) and was adopted to solve the linear
programming problem. Fagoyinbo (2011) and Martin (1989) advocated that the problem of Linear Programming
is an optimization of linear objective function of the following form:
P = C1X2 + C2X2 + C3X3 + ..................... + CnXn
(Objective function)
Subject to the linear constraints of the form:
a11x1 + a12x2 + a13x3 + .........+ a1nxn (≤ or≥) b1
a21x1 + a22x2 + a23x3 + .........+ a2nxn (≤ or≥) b2
am1x1 + am2x2 + am3x3 + .........+ amnxn (≤ or≥) bm
x1, x2,x3 ......... xn (≤ or≥) 0
These are called the non-negative constraints. From the above, it is linear that a LP problem has:
(i) Linear objective function which is to be maximized or minimized.
(ii) Various linear constraints, which are simply the algebraic statement of the limits of the resources or inputs at
the disposal.
(iii) Non-negatively constraints.
The variables of the study are as follows:
1. Decision Variables: These are pistons models of 4 types having different sizes and made on similar machines
engaged in piston manufacturing having same operation sequences with different type of tool material. It is
represented by X1, X2, X3 and X4 respectively.
X1= piston A, X2= Piston B, X3=Piston C and X4= Piston D
2. Objective Function: In any business set up the main motive is to maximize profit. Here in this case; it is a
profit maximization problem because the profit of pistons manufactured has to be maximized with proper tool
management. Therefore, the objective function is given by:
Maximize: P = C1X1 + C2X2+C3X3+C4X4, Where C1, C2, C3 and C4 are time and cost associated to piston
manufacturing in the company for this study.
3. Constraints: The constraint for this study is the time availability for machines and operation wise time used by
the machine for piston manufacturing.
Model Basic Assumptions
The following assumptions have been made for the development of models in this research work.
(a) The unit cost of piston manufacturing is taken as per machining rate per hour in market.
(b) The decision variables are linearly related with the data of each piston manufactured on a machine.
(c) The objective function is also having a linear relationship with the decision variables.
4. Model Development
Data Analysis
The data used for this study is collected from a machine shop of a vendor company engaged in piston
manufacturing and analysed to determine the maximum profit in each case. The whole analysis was performed
by using L.P analysis package (Zweigmedia.com/Real world/Simplex.html) and Lindo 6.1 software for
verification and implementation.
Table1 in Appendix presents the machines, operations, tool used and tools material for three differentcases (i.e.
H.S.S, Carbide coated and Carbide tip tools) used in piston manufacturing. Table 2 in Appendix shows
Operation wise timings for different machines used in piston manufacturing with different tool material used for
machining the pistons A, B, C and D for case 1, II and III along with availability of machine time.Similarly
Table 3 indicates cost operation wise for machines used in piston manufacturing with different tool material
used for case 1, II and III per sec as per market rate. Table 4 shows the comparative results of time, cost and

Proceedings of the National Conference on
Trends and Advances in Mechanical Engineering
(TAME-2017) March 16-17, 2017 ISBN 978-93-5268-269-0
YMCA University of Science & Technology, Faridabad, Haryana
366
profit for this study. On the basis of data collected during this case study a linear programming model has been
form to determine the profit by using different tool material for each case as stated below:
Piston - A Piston - B Piston - C Piston – D
Case 1 – High speed Steel (H.S.S) Tools
Model:
Maximize P= 4.47X1 + 4.9X2 + 4.76X3 +4.68X4
Subject to
102X1 + 114X2 + 127X3 + 60X4 <= 86400
56X1 + 62X2 + 56X3 + 68X4 <= 81000
44X1 + 56X2 + 50X3 + 56X4 <= 75600
38X1 + 32X2 + 32X3 + 38X4 <= 70200
5.10X1 + 5.70X2 + 6.35X3 + 3.00X4 <=4320
7.00X1 + 7.75X2 + 7.00X3 + 8.50X4 <=10125
6.07X1 + 7.72X2 + 6.9X3 + 7.72X4 <=10500
4.21X1 + 3.55X2 + 3.55X3 + 4.21X4 <=7800
Optimal Solution: P = 5749.55; x1 = 283.893, x2 = 0, x3 = 0, x4 = 957.383
Case II - Carbide Coated Tools
Model:
Maximize objective function (Profit):
Maximum P= 3.87X1+4.25X2+4.08X3+4.03X4
Subject to
87X1+96X2+106X3+51X4≤86400 (Time Constraints)
48X1+53X2+48X3+58X4≤81000 (Time Constraints)
39X1+48X2+43X3+48X4≤75600 (Time Constraints)
34X1+29X2+29X3+34X4≤70200 (Time Constraints)
4.35X1+4.80X2+5.30X3+2.55X≤4320 (Cost Constraints)
6.00X1+6.63X2+6.00X3+7.25X4≤10125 (Cost Constraints)
5.24X1+6.63X2+5.93X3+6.62X4≤10500 (Cost Constraints)
3.77X1+3.21X2+3.21X3+3.77X4≤7800 (Cost Constraints)
Optimal Solution: P = 5809.3; x1 = 338.799, x2 = 0, x3 = 0, x4 = 1116.17
Case III - Carbide Tip Tools
Model:
Maximize objective function (Profit):
Maximize P= 2.42X1 + 2.65X2 + 2.55X3 +2.52X4
Subject to
54X1 + 60X2 + 66X3 + 33X4 ≤ 86400
30X1 + 33X2 + 30X3 + 36X4 ≤ 81000
24X1 + 30X2 + 27X3 + 30X4 ≤ 75600
21X1 + 18X2 + 18X3 + 21X4 ≤ 70200
2.70X1 + 3.00X2 + 3.33X3 + 1.65X4 <=4320
3.75X1 + 4.13X2 + 3.75X3 + 4.50X4 <=10125
Proceedings of the National Conference on
Trends and Advances in Mechanical Engineering
(TAME-2017) March 16-17, 2017 ISBN 978-93-5268-269-0
YMCA University of Science & Technology, Faridabad, Haryana
367
3.33X1 + 4.17X2 + 3.75X3 + 4.17X4 <=10500
2.33X1 + 1.99X2 + 1.99X3 + 2.33X4 <=7800
Optimal Solution: P = 5816.72; x1 = 458.491, x2 = 0, x3 = 0, x4 = 1867.92
Machining Cost/ Hr:
Cost of CNC Machining operation / Hrs =Rs 180
Cost of CNC Drilling operation / Hrs =Rs 450
Cost of VMC Machining operation / Hrs=Rs 500
Cost of CNC Grinding operation / Hrs =Rs 400
Availability of Machine Time
CNC Machine = 24.00 Hrs
CNC Drilling Machine = 22.30 Hrs
VMC Machining = 21.00 Hrs
CNC Grinding machine = 19.30 Hrs
5. Result
The results were carried out by the analysis of the L.P model for three different tool materials i.e. H.S.S tools,
carbide coated tools and carbide tip tools by using Simplex method and estimated the vales of objective function
for these as 5750, 5809 and 5816 for four decision variables X1,X2,X3 and X4. The solution shows that only
variables X1 and X4 contribute to improve the value of objective function of L.P models. Other results based on
time, cost and quantity can be seen in result’s comparison table 4 of appendix for further analysis.
6. Conclusion
This paper has focused on the maximization of profit by using proper tool management through linear
programming technique. The technique has been developed and implemented for selecting the most suitable
quantity of different type of pistons to be manufactured for maximizing the profit of a manufacturing
organisation. Based on machine tools it will be helpful to the management and its managers in taking decision
about the quantity of pistons to be produced for maximizing the profit in FMS environment. The analysis was
carried out using Simplex method solving online computer software Zweigmedia.com/Real world/Simplex.html
and Lindo 6.1. It provides optimal solutions for maximizing the profit and the quantity required for maximizing
the profit. Here researchers strongly recommend to the management of the industry that only Piston X1 and X4
should be produced in order to earn optimal profit. However, Piston X2 and X3 should be produced only for
meeting the demands of their customers but in a limited amount. Moreover, the management can use this
analysis for maximizing their profit in other product variants also. The main requirement for this approach is
that it requires good knowledge in mathematics and computer.
References .
Akingbade, F., 1996., Basic Operational Research Techniques, Panaf Inc. Lagos, Nigeria.
Charles, Cooper and Henderson, 1963., An Introduction to Linear Programming, John Willy, New York.
Dantzig, G. B., 1963., Linear Programming and Extensions, Princeton University Press, New York.
Dowing, E.T., 1992., Theory and Problems of Introduction to Mathematical Economics, Schaum’s Outline
Series, McGraw-Hall Inc., New York.
Dwivedi, D., 2008., Managerial Economics, VIKAS Publishing House PVT Limited, New Delhi.
Fagoyinbo, I. S., Akinbo, R. Y., Ajibode, I. A., & Olaniran, Y.O.A., 2011., Maximization of profit in
manufacturing industries using linear programming techniques: Geepee Nigeria Limited. In the Proceedings of
the 1st International Technology, Education and Environment Conference, 159-167.
Gupta, P.K and Hira, D.S., 2009. , Operations Research, S. Chand Company Limited, New Delhi.
Henderson, J. and Quandt, R., 2003., Microeconomic Theory: A Mathematical Approach, McGraw-Hill Book
Co., Tata, New Delhi.
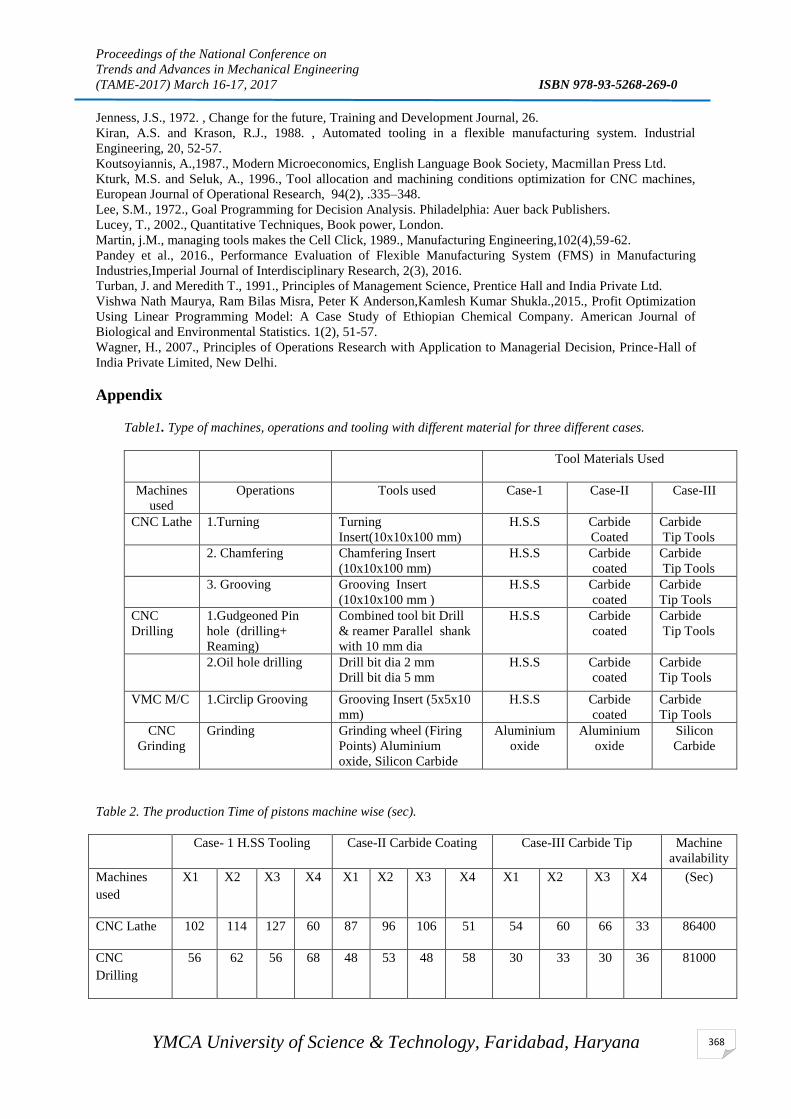
Proceedings of the National Conference on
Trends and Advances in Mechanical Engineering
(TAME-2017) March 16-17, 2017 ISBN 978-93-5268-269-0
YMCA University of Science & Technology, Faridabad, Haryana
368
Jenness, J.S., 1972. , Change for the future, Training and Development Journal, 26.
Kiran, A.S. and Krason, R.J., 1988. , Automated tooling in a flexible manufacturing system. Industrial
Engineering, 20, 52-57.
Koutsoyiannis, A.,1987., Modern Microeconomics, English Language Book Society, Macmillan Press Ltd.
Kturk, M.S. and Seluk, A., 1996., Tool allocation and machining conditions optimization for CNC machines,
European Journal of Operational Research, 94(2), .335–348.
Lee, S.M., 1972., Goal Programming for Decision Analysis. Philadelphia: Auer back Publishers.
Lucey, T., 2002., Quantitative Techniques, Book power, London.
Martin, j.M., managing tools makes the Cell Click, 1989., Manufacturing Engineering,102(4),59-62.
Pandey et al., 2016., Performance Evaluation of Flexible Manufacturing System (FMS) in Manufacturing
Industries,Imperial Journal of Interdisciplinary Research, 2(3), 2016.
Turban, J. and Meredith T., 1991., Principles of Management Science, Prentice Hall and India Private Ltd.
Vishwa Nath Maurya, Ram Bilas Misra, Peter K Anderson,Kamlesh Kumar Shukla.,2015., Profit Optimization
Using Linear Programming Model: A Case Study of Ethiopian Chemical Company. American Journal of
Biological and Environmental Statistics. 1(2), 51-57.
Wagner, H., 2007., Principles of Operations Research with Application to Managerial Decision, Prince-Hall of
India Private Limited, New Delhi.
Appendix
Table1. Type of machines, operations and tooling with different material for three different cases.
Tool Materials Used
Machines
used
Operations Tools used Case-1 Case-II Case-III
CNC Lathe 1.Turning Turning
Insert(10x10x100 mm)
H.S.S Carbide
Coated
Carbide
Tip Tools
2. Chamfering Chamfering Insert
(10x10x100 mm)
H.S.S Carbide
coated
Carbide
Tip Tools
3. Grooving Grooving Insert
(10x10x100 mm )
H.S.S Carbide
coated
Carbide
Tip Tools
CNC
Drilling
1.Gudgeoned Pin
hole (drilling+
Reaming)
Combined tool bit Drill
& reamer Parallel shank
with 10 mm dia
H.S.S Carbide
coated
Carbide
Tip Tools
2.Oil hole drilling Drill bit dia 2 mm
Drill bit dia 5 mm
H.S.S Carbide
coated
Carbide
Tip Tools
VMC M/C 1.Circlip Grooving Grooving Insert (5x5x10
mm)
H.S.S Carbide
coated
Carbide
Tip Tools
CNC
Grinding
Grinding Grinding wheel (Firing
Points) Aluminium
oxide, Silicon Carbide
Aluminium
oxide
Aluminium
oxide
Silicon
Carbide
Table 2. The production Time of pistons machine wise (sec).
Case- 1 H.SS Tooling Case-II Carbide Coating Case-III Carbide Tip
Machine
availability
Machines
used
X1 X2 X3 X4 X1 X2 X3 X4 X1 X2 X3 X4 (Sec)
CNC Lathe 102 114 127 60 87 96 106 51 54 60 66 33 86400
CNC
Drilling
56 62 56 68 48 53 48 58 30 33 30 36 81000

Proceedings of the National Conference on
Trends and Advances in Mechanical Engineering
(TAME-2017) March 16-17, 2017 ISBN 978-93-5268-269-0
YMCA University of Science & Technology, Faridabad, Haryana
369
VMC M/C 44 56 50 56 39 48 43 48 24 30 27 30 75600
CNC
Grinding
38 32 32 38 34 29 29 34 21 18 18 21 70200
Machining
Time/Piston 240 264 265 222 208 226 226 191 129 141 141 120
Table.3. The production Cost of Pistons machine wise
Table 4. Result Comparison Table
Case- 1 H.SS Tools Case-II Carbide Coating Tools Case-III Carbide Tip Tools
Pistons X1 X2 X3 X4 X1 X2 X3 X4 X1 X2 X3 X4
Machining
Time/Piston
(Sec) 240 264 265 222 208 226 226 191 129 141 141 120
Machining
Cost/Piston 22.38 24.72 23.80 23.43 19.36 21.26 20.44 20.19 12.09 13.26 12.79 12.62
Qty produced
/piston
284 --- --- 957 339 -- -- 1116 458 --- --- 1868
Optimal value
case wise 5750 5809 5816
Case-1 H.SS Tools Case-II Carbide Coating Tools Case-III Carbide Tip Tools Maxi Cost
Available
Machine
used
Cost
X1
Cost
X2
Cost
X3
Cost
X4
Cost
X1
Cost
X2
Cost
X3
Cost
X4
Cost
X1
Cost
X2
Cost
X3
Cost
X4
CNC Lathe 5.10 5.70 6.35 3.00 4.35 4.80 5.30 2.55 2.70 3.0 3.33 1.65 4320
CNC
Drilling
7.00 7.75 7.00 8.50 6.00 6.63 6.00 7.25 3.75 4.13 3.75 4.50 10125
VMC M/C 6.07 7.72 6.9 7.72 5.24 6.62 5.93 6.62 3.31 4.14 3.72 4.14 10500
CNC
Grinding
4.21 3.55 3.55 4.21 3.77 3.21 3.21 3.77 2..33 1.99 1.99 2.33 7800
Cost/Piston 22.38 24.72 23.80 23.43 19.36 21.26 20.44 20.19 12.09 13.26 12.79 12.62

Proceedings of the National Conference on
Trends and Advances in Mechanical Engineering
(TAME-2017) March 16-17, 2017 ISBN 978-93-5268-269-0
YMCA University of Science & Technology, Faridabad, Haryana
370
A LITERATURE REVIEW ON REVERSE SUPPLY CHAIN
Swapnil Chauhan1, Bhupender Singh
2
1M.Tech. Student,
2Asst. Prof., Mechanical Engineering Department,
YMCAUST, Faridabad-121006, Haryana
Email:[email protected]
Abstract
In recent years, environmental factors result in increasing attention towards the proper disposition of end of life
products. Reverse supply chain (RSC) requires a sequence of activities starting from collection of used product
form customers to its conversion into useful form either by recycle or reuse or remanufacturing or repair or
dispose of it than to deliver it to the customers. Selection of efficient reconditioning method depends upon
various factors. This paper discusses about the reverse supply chain, the barriers in the implementation of RSC,
different strategies adopted by various researchers, models used for effective RSC system, critical success
factors of RSC system and then finding out the gaps in the field of this study.
Keywords: Reverse supply chain, factors, barriers
Introduction
The world is facing a progressive scarcity of energy, and mineral resources, for which demand
continues to climb. The products and processes environmental performance is important for
sustainable manufacturing. Social and environmental sustainability increasingly influence economic
policy decisions and can have an impact on economic performance. In such context, consumers and
legislations forces companies to consider their responsibility towards environment therefore to
consider environmental aspects at different level within the organization and supply chain activities
are not an exception. Companies must design system to reduce their ecological footprint(Barbosa-
Povoa et al., 2007).Meade et al., 2007 classifies the factors that led to increase interest in reverse
supply chain into two groups: environmental factors and business factors. Environmental factors
include impact of products on environment, environmental legislations and environmental concern
among customers. Business factors include economic benefits of using returned products and gaining
customer satisfaction. Most developed countries have policy of properly disposition of waste. Many
countries have regulatory dictating the waste prevention, recovery of waste for reuse, remanufacturing
or recycling of materials. This makes the producer responsibility to plan for product returns and their
disposition (Sameer 1998). US have a remanufacturing industry of $50 billion per year (Corbett CJ,
2001).In earliest days Reverse supply chain (RSC) can be defined as reverse flow of goods (Murphy
andPoist 1989). (Rogers and Tibben-lembke 1999) defined RSC as ”the combination of processes like
planning, implementing, and controlling the efficient cost effective flow of raw materials in process
industry, finished goods and related information from the point of consumption to the point of origin
for the purpose of recapturing the value or proper disposal”.RSC is an extension of supply chain
where used products are returning to organizations for reprocessing or to be discarded.Scope of RSC
is widening with time and various research works is done in this field but on a small area. Distribution
planning, inventory control and production planning is studied from RSC point by(Fleischmann et al.
1997). Transportation and packaging, purchasing and environmental aspects are discussed in(Carter
and Ellram 1998).Uncertainty in supply, quality and cost benefit relation with RSC is studied by
(Kishore K. Pochampally and Surendra M. Gupta, 2003). The flow of product returns is turninginto a
major concern for several makers (Joseph D. Blackburn et al., 2004).RSC has considerable potential
of value recovery from used products. It is field of importance due to legislations and directives,
consumer awareness, environmental concerns, corporate social responsibility and sustainable
competitiveness. (Melnyk et al., 1999; Ferrer and Ayres, 2000; Bloemhof and van Nunen, 2005; Ravi
and Shankar, 2005; Cooper, 1994; Yang, 1995; Boks etal., 1998; Castell et al., 2004). Many
organizations are benefited by RSC like Dell, Xerox, Canon, General Motors(Ashley, 1993;

Proceedings of the National Conference on
Trends and Advances in Mechanical Engineering
(TAME-2017) March 16-17, 2017 ISBN 978-93-5268-269-0
YMCA University of Science & Technology, Faridabad, Haryana
371
Bergstrom, 1993; Maxie, 1994).This helps in tackling environmental issues like used product
recycling, waste disposal, and industry induced pollution. Inthis paper we will review about the
factors affecting RSC in automobile sector in India, problems facing by automobile sector, what
processes can be applied to overcome the difficulties, identification of the success factors and how
these strategies can be implemented.
RSC system
In RSC process set of steps are to be followed in order to collect the used products.This starts with
acquisition of products from customers after the acquisition of used products they have to be
transported to facilities for inspecting sorting and disposition. After assessing the condition of
returned products most profitable decision (reuse, repair, remanufacturing, recycling,
cannibalizationand disposition) is made for its use. After that product is supplied for distribution and
sales.
Product Acquisition
Product acquisition is defined as the process of obtaining used products from the customers. As per
the experts it is the key for a profitable supply chain. Quality, quantity and timing of product returns
need to be cautiously managed. Companies must have a good relationship with retailers and
distributors(T. Domgała, R. Wolniak, 2013).Organizations can get used products from three different
sources: from forward supply chain (defective or damaged products), from RSC called market driven
system or from waste (discarded products) (Guide jr and V. Wassenhove, 2001; Rogers and Tibben-
lembke, 2001).
Product return and product recall are the examples of acquisition from forward supply chain. Products
are generally recalled by the organizations. It is a request to return a product after the discovery of
safety issues or product defects that might endanger the consumer or put the maker at risk. Collection
methods depend up on cost structure and collection quantity decisions (Atasu et al., 2013).
Reverse Logistics
Reverse logistics provide alternate use of resources that is cost effective and environmental friendly
by increasing product life cycle(Melbin 1995). Both environmental and economic goals can be
achieved by reverse logistics. But there is no best method available for transportation of used products
from their owners to organizations.Factors affecting reverse logistics are: strategic factors like
strategic costs, overall quality, customer service, environmental concern and legislative concerns and
Product acquisition
Inspection and
Disposition
Reverse logistics
Reconditioning
Distribution and
sales

Proceedings of the National Conference on
Trends and Advances in Mechanical Engineering
(TAME-2017) March 16-17, 2017 ISBN 978-93-5268-269-0
YMCA University of Science & Technology, Faridabad, Haryana
372
the operational factors like cost benefit analysis, transportation, warehousing, supply management,
remanufacturing, recycling and packaging (Shad Dowlatshahi, 2000).So the companies have to
quickly transport the product in order its value will not decay with time.
Inspection and Disposition
In this process testing, sorting, classification of used products is done in order to check whether they
are good for any reconditioning process or they are to be disposed. Return products can be
commercial returns, service returns, distribution returns or end of life returns. Transportation, disposal
and disassembly cost, and quality of returned product decides sorting of products before disassembly
and remanufacturing (Zikopoulos and Tagaras, 2008). This can be a time consuming task so it can be
automated with the use of technologies like sensors, bar codes.
Reconditioning
It’s the value addition process to the used product so that it can be used again in the forward supply
chain. Companies can do so by opting for options that are broadly classified into three categoriesthat
are reuse, recycling, remanufacturing. In reuse, returned product can be used more than once after
cleaning or reprocessing like container, pallet and bottle. In recycling material is recovered without
conserving any product structure(K. Kim et al., 2006)example metal, glass, paper and plastic.
Remanufacturing brings the product back into an “as good as new” condition by carrying out the
necessary disassembly, overhaul and replacement operations (Guide Jr VDR, Van Wassenhove L,
2002(a))for example electronic machine, toner cartridge and automobile part. Different industries
have different type of manufacturing system. There are different processes available for different type
of products, but five common alternatives discussed are reuse, repair, remanufacturing, recycling and
disposal (Thierry et al., 1995; Fleischmann et al., 1997;De Brito and Dekker, 2002; Mutha and
Pokharel, 2009).
Distribution and sales
The reconditioned products are sent back to the forward supply chain. Companies have to search out
for the potential customers of remanufactured products for example, companies should search out for
the chances of selling remanufactured products at low cost who cannot afford new product.
Companies should search out for the opportunities of fitting refurbished products into their market
policy for example smartphone manufacturers used to sell refurbished phones on lesser cost.
Barriers in implementing reverse logistics
There are various reasons that RSC still remains a critical issue. (Fleischmann et al., 1997) states that
there is lack of general framework and mathematical model for reverse logistics environment.Design
strategies for reverse supply chain are relatively unexplored and underdeveloped (Blackburn et al.,
2004).Methodology for decision making process on capacity planning of recovery activities for
remanufacturing reverse chains is underdeveloped. Factors affecting capacity planning aredemand,
costs of constructing and operating new facilities, new technologies and competitor’s strategies
(Dimitrios Vlachos et al., 2007).Companies have to make huge investments in consumer education
and other marketing inspirations. With respect to Indian context there is no such government
regulation that bound companies for the proper disposition of their end of life products, this result in
limited number of products returned which is lower than the breakeven point for companies.
Strategies
For effective reverse supply chain network determination of the numbers, locations and capacities for
collection, recovery and disposal centers, buffer inventories in each site and quantity of flow between
pair of facilities is required (M.S Pishvaee et al., 2011). There are various uncertain parameters
(quantity and quality of returned products), so many researchers use stochastic parameters for the
designing of reverse supply chain network (example O. Listes and R. Dekker, 2005; Salema et al.,
2007). But stochastic approach has some major drawbacks: (a) There is no historical data for
uncertain parameters, so it is rare to obtain actual probability distribution of uncertain parameters; (b)
Solution obtained by stochastic optimization could not be feasible for some real situations; (c) In
recent reverse supply chain design under uncertainty the uncertainty is modeled through scenario
Proceedings of the National Conference on
Trends and Advances in Mechanical Engineering
(TAME-2017) March 16-17, 2017 ISBN 978-93-5268-269-0
YMCA University of Science & Technology, Faridabad, Haryana
373
based programming (A. Alonso-Ayuso et al., 2003;O. Listes and R. Dekker, 2005;T. Santoso et al.,
2005;Salema et al., 2007;N. Xu and L. Nozick,2009;P. Schutz, 2009)
As a result some researchers opt for robust optimization technique to handle uncertain parameters (A.
Ben-Tal and A. Nemirovski, 2008). Robust optimization theory was first used by (Soyster, 1973). Now
a day’s robust optimization approach is used in areas like inventory management(E. Adida and G.
Perakis, 2006) and portfolio selection(L. El-Ghaouiet al., 2003).K. Kim et al., 2006 focuses on
developing a general framework of remanufacturing system from the standpoint of supply planning in
reverse logistics environment and its optimization model.
Models
Different authors try to use different models for robust reverse supply chain management. A
comprehensive review on the application of mathematical modeling in reverse logistics management
is presented by (Fleischmann et al., 1997). A mixed integer programming (MIP) model for reverse
distribution problem was proposed byJayaraman et al., 2003.Z. Lu and NBostel., 2005 propose 0-1
mixed integer programming model in which they consider mutual interaction between forward and
reverse supply chain. Mixed integer linear programming (MILP) model is offered by (M.S Pishvaee et
al., 2011, Gomes et al., 2011;Cardoso S.R, 2013)that could support both disposal and recovery
activities. The model is defined to maximize the expected net present value and to provide details
about sizing and locations of plant, warehouses and retailers, definition of processes to install,
establishment of forward and reverse flows and inventory levels to attain. MINLP model is developed
to determine the location of collection centers in a reverse supply chain network (Aras et al.,
2008).Nikolaidis 2009developed a single-period mathematical model for optimizing the planning
decisions of a reverse supply chain regarding procurement and returns’ remanufacturing. A simulation
model on reverse logistics is presented by S. Kara et al.,2007. To achieve this transfer stations, drop
off points and a disassembly plants were established first.
Critical success factors for disposition
For an organization to have successful disposition, supply chain and reverse supply chain network
must have a close loop relation, otherwise it will result in huge investments for setting up new
infrastructure resulting in reduced profit from the return products treatment. For that improved
network design and planning is necessary. Optimal number of facilities should be open in reverse
supply chain (Jayaraman et al., 1999).Best locations for collection and sorting centers are chosen
simultaneously with the definition of a tactical network planning Also greater flexibility in terms of
flow tends to create a more profitable network (Cardoso S. R. et al., 2013). Reverse logistics is
dependent on various inputs and any minute change in these inputs affects the disposition decisions
and profit.Quality of used products, market demand, Global competitiveness, customer relationship,
associated cost are some of the factors which affect the disposition decisions.
Research gaps
Most of the models only address the reverse supply chains with no link to forward business that can
be possible source of non-profitability to the companies. Blackburn et al. 2004stated that reverse
supply chains optimization is relatively unexplored and more attention should be given to such
structures justified by the importance of product returns treatment that, if well managed can create
value for money. Most of the research work is focused around remanufacturing network (Z. Lu and
NBostel., 2005). Very few papers discuss about other disposition techniques. T. R. P Ramos et al.,
2014 discuss about recyclable waste system for which they applied MILP model.RSC system depends
upon various factors but the different models are designed considering only few factors like location
of facility, distance between facility and pickup points.
Conclusion
Reverse supply chain is still unexplored area with respect to Indian context. There are various loop
holes in designing reverse logistics system that consider every area with respect to it. Lack of
knowledge, unawareness of customers, lack of top management commitment, underdeveloped
technologies, high capital investment leads to ineffective reverse supply chain management. This

Proceedings of the National Conference on
Trends and Advances in Mechanical Engineering
(TAME-2017) March 16-17, 2017 ISBN 978-93-5268-269-0
YMCA University of Science & Technology, Faridabad, Haryana
374
review is focused on the various issues that are presented earlier. This article through systematic
topics gives a brief knowledge about barriers in effective reverse logistics system, strategies adopted
in different literatures, various models presented by different authors and the critical factors affecting
disposition decisions.
References A.Alonso-Ayuso, L. Escudero, A. Garı´n, M. Ortuno, G. Perez. An approach for strategic supply chain planning
under uncertainty based on stochastic 0–1 programming, J. Global Optim. 2003(26) p97–124.
A. Ben-Tal, A. Nemirovski. Selected topics in robust convex optimization, Math. Program. 2008(112)p125–
158.
A. Soyster. Convex programming with set-inclusive constraints and applications to inexact linear programming,
Oper. Res. 1973(21)p1154–1157.
Aras, N., Aksen, D., Tanugur, A. Locating collection centers for incentive dependent returns under a pick-up
policy with capacitated vehicles. European Journal of Operational Research 2008(191), p1223–1240.
Ashley S. 1993. Designing for the environment. Mechanical Engineering 115 (3)p52–55.
Atasu A, Toktay LB, Van Wassenhove LN. How collection cost structure drives a manufacturers reverse
channel choice. Prod Oper Manag 2013; 22(5) p1089-1102.
Barbosa-Povoa, A., Salema, M., Novais. A. Design and planning of closed-loop supply chains. In:
Papageorgiou, L., Georgiadis, M.C. (Eds.), Supply Chain Optimization in Supply Chain Optimization, 2007 vol.
7. Wiley-VCH, Germany, p187–218.
Bergstrom, R.Y. An annotated essay: environmental affairs. Production;1993 105 (4)p36–41.
Blackburn Joseph D., Souza Givan C., Van Wassenhove Luk N., Guide Jr. V. Daniel R.: Reverse Supply Chains
for Commercial Returns. California Management Review. No. 2, 2004
Bloemhof J, van Nunen J. Integration of environmental management and SCM. ERIMReport Series Research in
Management 2005; ERS-2005-030-LIS.
Boks C, Nilsson J, Masui K, Suzuki K, Rose C, Lee B. An international comparison of product end-of-life
scenarios and legislation for consumer electronics. In: Proceedings from the IEEE symposium on electronics
and the environment; 1998. p19–24.
Carter CR, Ellram LM. Reverse logistics: A reviewof the literature and framework for future investigation.
Journal of Business Logistics 1998;19(1) p85–102
Castell A, Clift R, France C. Extended producer responsibility policy in the European Union—a horse or a
camel? Journal of Industrial Ecology 2004;8(1–2)p4–7.
Cooper M. Logistics in the decade of the 1990s. In: Robeson J, Capacino W, Howe E, Editors. The Logistics
Handbook. New York, USA: The Free Press; 1994.
Corbett CJ, Kleindorfer PR. Environmental management and operations management:
Introduction to part 1 (manufacturing and eco-logistics). Production and Operations
Management 2001;10(2) p107–111.
De Brito MP, Dekker R. Reverse logistics: a framework. Econometric Institute Report EI; 2002. p. 2002-38.
Dimitrios Vlachos, PatroklosGeorgiadis, EleftheriosIakovou. A system dynamics model for dynamic capacity
planning of remanufacturing in closed loop supply chains: Computers & Operations Research 34 (2007) p367–
394.
E. Adida, G. Perakis. A robust optimization approach to dynamic pricing and inventory control with no
backorders. Math. Program. 2006(107)p97–129.
Ferrer G, Ayres R. The impact of remanufacturing in the economy. Ecological Economics 2000; 32(3) p413–29.
Fleischmann M, Bloemhof-Ruwaard JM, Dekker R, van der Laan E, van Nunen JAEE, van Wassenhove LN.
Quantitative models for reverse logistics: a review. European Journal of Operational Research 1997; 103(1) p1–
17.
Ginter PM, Starling JM. Reverse distribution channels for recycling. California Management Review 1978;
20(3) p73–82.
Gomes I., Barbosa-Povoa A., Novais, A.Modeling a recovery network for WEEE: a case study in Portugal.
Waste Management 2011(31), p1645–1660.
Guide Jr. VDR, Van Wassenhove LN. Managing product returns for remanufacturing. Production and
Operations Management 2001; 10(2) p142–155.
Guide Jr. VDR, Van Wassenhove LN. The reverse supply chain. Harvard Business Review 2002;80(2) p25–36.
Guide Jr VDR, Van Wassenhove LN. Closed-loop supply chains. Quantitative approaches to distribution
logistics and supply chain management. Berlin: Springer; 2002(a). p. 47–60.
Proceedings of the National Conference on
Trends and Advances in Mechanical Engineering
(TAME-2017) March 16-17, 2017 ISBN 978-93-5268-269-0
YMCA University of Science & Technology, Faridabad, Haryana
375
Horvath P, Autry C,WilcoxW. Liquidity implications of reverse logistics for retailers:A Markov chain approach.
Journal of Retailing 2005;81(2) p191–203.
Jayaraman, V., Guide V., Srivastava R. A closed-loop logistics model for remanufacturing. Journal of the
Operational Research Society 1999(50), p497–508.
Jayaraman V., Patterson R. A., Rolland, E. The design of reverse distribution networks: models and solution
procedures. European Journal of Operational Research, 2003(150)p128–149.
Joseph D. Blackburn, V. Daniel R. Guide, Jr., Gilvan C. Souza, Luk N. Van WassenhoveReverse supply chains
for commercial results: California management review Vol46 No2.
Kannan G, Palaniappan M, Zhu Q, Kannan D.Analysis of third party reverse logistics provider using
interpretive structural modeling. Int J. Production Research 2012; 140(1) p204-211.
Kibum Kim, Iksoo Song, Juyong Kim, BongjuJeong. Supply planning model for remanufacturing system in
reverse logistics environment. Computers &Industrial Engineering 2006(51)p279–287.
Kishore K. Pochampally,Surendra M. Gupta. A Multi-Phase MathematicalProgramming Approach to Strategic
Planning of an Efficient Reverse Supply Chain Network. Proceedingsof the 2003 IEEE International
Symposium on Electronics and the Environment 2003, p72-78.
L. El-Ghaoui, M. Oks, F. Oustry. Worst-case value-at-risk and robust portfolio optimization: A conic
programming approach, Oper. Res. 2003(51)p543–556.
L. Meade, J. Sarkis, A. Presley. The theory and practice of Reverse Logistics, Int. J. Log. Syst. Manage.
2007(3)p56–84.
M.I.G. Salema, A.P. Barbosa-Povoa, A.Q. Novais. An optimization model for the design of a capacitated multi-
product reverse logistics network with uncertainty. Eur. J. Oper. Res. 2007(179)p1063–1077.
Maxie E. Supplier performance and the environment. In: Proceedings of the IEEE International Symposium on
Electronics and the Environment, San Francisco, CA, 1994.
Melbin, J. E. “The never-ending cycle, “Distribution, 1995; 94(11) p36–38.
Melnyk S, Stroufe R,Montabon F, Calantone R, Tummala R, Hinds T. Integrating environmental issues
intomaterial planning: ‘green’ MRP. Production and Inventory
Management Journal 1999;40(3) p36–45.
Mir SamanPishvaee, MasoudRabbani ,Seyed Ali Torabi. A robust optimization approach to closed loop supply
chain network design under uncertainty. Applied mathematical modeling 2011(35) p637-649.
Murphy PR, Poist RP. Managing of logistics retro movements:an empirical analysis of literature suggestions.
Transp Res Forum 1989;29(1) p177-184.
Mutha A, Pokharel S. Strategic network design for reverse logistics and remanufacturing using new and old
product modules. Comp and Ind Engg 2009; 56(1) p334-346.
N. Xu, L. Nozick. Modeling supplier selection and the use of option contracts for global supply chain design,
Comp. Oper. Res. 2009(36)p2786–2800.
Nikolaidis. Y. A modeling framework for the acquisition and remanufacturing of used products. International
Journal of Sustainable Engineering 2009 2 (3), p154–170.
O. Listes, R. Dekker. A stochastic approach to a case study for product recovery network design. Eur. J. Oper.
Res. 2005(160)p268–287.
P. Schutz, A. Tomasgard, S. Ahmed. Supply chain design under uncertainty using sample average
approximation and dual decomposition, Eur. J. Oper. Res. 2009(199)p409–419.
Ravi V, Shankar R. Analysis of interactons among the barriers of reverse logistics. Technological Forecasting
and Social Change 2005;72(8) p1011–1029.
Rogers DS, Tibben-Lembke RS. Going backwards: Reverse logistics trends and practices. Reno, NV: Reverse
logistics Executive Council; 1999.
Rogers DS, Tibben-Lembke R. An examination of reverse logistics practices. Journal of Business
Logistics2001;22(2) p129–148.
S. Kara, F. Rugrungruang, H. Kaebernick. Simulation modeling of reverse logistics networks. Int. J. Production
Economics 106 (2007) p61–69.
Sameer Kumar, Valora Putnam. Cradle to cradle: Reverse logistics strategies and opportunities across three
industry sectors: Int. J. Production Economics115 2008 p (305-
Shad Dowlatshahi. Developing a theory of reverse logistics: Transportation Freight/Materials Handling
Environment; 2000 p143-155.
Sonia R. Cardoso, Ana Paula F.D. Barbosa-Povoa, Susana Relvas. Design and planning of supply chains with
integration of reverse logistics activities under demand uncertainty. European Journal of Operational Research
2013(226) p436-451.
T. Santoso, S. Ahmed, M. Goetschalckx, A. Shapiro. A stochastic programming approach for supply chain
network design under uncertainty, Eur. J. Oper. Res. 2005(167)p96–115.

Proceedings of the National Conference on
Trends and Advances in Mechanical Engineering
(TAME-2017) March 16-17, 2017 ISBN 978-93-5268-269-0
YMCA University of Science & Technology, Faridabad, Haryana
376
Thierry MC, Salomon M, Van Nunen JAEE,Van Wassenhove LN. Strategic issues in product recovery
management. Calif Manag Rev 1995; 37(2)p114-35.
Tomasz DOMGAŁA, Radosław WOLNIAK. Reverse supply chain: Management systems in production
engineering 2013, No 4 (12), p3‐7.
Yang G. Urban waste recycling in Taiwan, resources. Conservation and Recycling 1995(13) p15–26.
Zhiqiang Lu, Nathalie Bostel. A facility location model for logistics systems including reverse flows:The case of
remanufacturing activities. Comp and Oper. Research 2005 p1-25.
Zikopoulos C, Tagaras G. On the attractiveness of sorting before disassembly in remanufacturing. IIE Trans
2008; 40(3) p313-323.
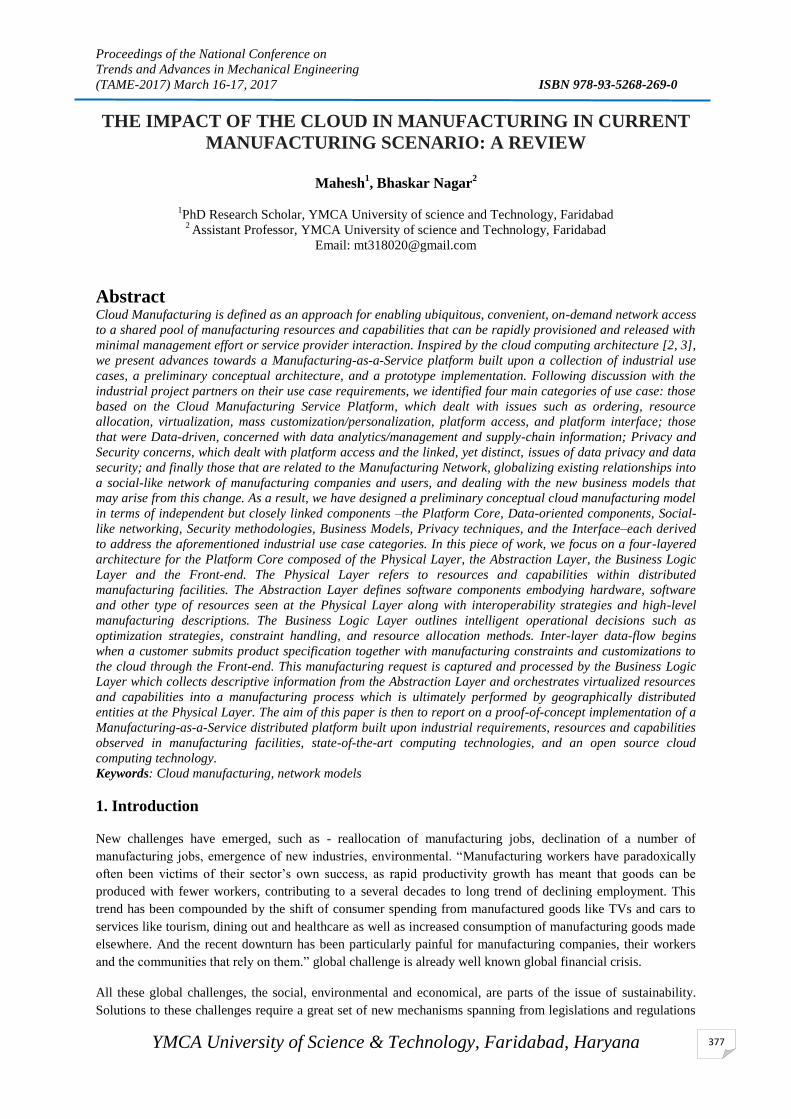
Proceedings of the National Conference on
Trends and Advances in Mechanical Engineering
(TAME-2017) March 16-17, 2017 ISBN 978-93-5268-269-0
YMCA University of Science & Technology, Faridabad, Haryana
377
THE IMPACT OF THE CLOUD IN MANUFACTURING IN CURRENT
MANUFACTURING SCENARIO: A REVIEW
Mahesh
1, Bhaskar Nagar
2
1PhD Research Scholar, YMCA University of science and Technology, Faridabad 2 Assistant Professor, YMCA University of science and Technology, Faridabad
Email: [email protected]
Abstract Cloud Manufacturing is defined as an approach for enabling ubiquitous, convenient, on-demand network access
to a shared pool of manufacturing resources and capabilities that can be rapidly provisioned and released with
minimal management effort or service provider interaction. Inspired by the cloud computing architecture [2, 3],
we present advances towards a Manufacturing-as-a-Service platform built upon a collection of industrial use
cases, a preliminary conceptual architecture, and a prototype implementation. Following discussion with the
industrial project partners on their use case requirements, we identified four main categories of use case: those
based on the Cloud Manufacturing Service Platform, which dealt with issues such as ordering, resource
allocation, virtualization, mass customization/personalization, platform access, and platform interface; those
that were Data-driven, concerned with data analytics/management and supply-chain information; Privacy and
Security concerns, which dealt with platform access and the linked, yet distinct, issues of data privacy and data
security; and finally those that are related to the Manufacturing Network, globalizing existing relationships into
a social-like network of manufacturing companies and users, and dealing with the new business models that
may arise from this change. As a result, we have designed a preliminary conceptual cloud manufacturing model
in terms of independent but closely linked components –the Platform Core, Data-oriented components, Social-
like networking, Security methodologies, Business Models, Privacy techniques, and the Interface–each derived
to address the aforementioned industrial use case categories. In this piece of work, we focus on a four-layered
architecture for the Platform Core composed of the Physical Layer, the Abstraction Layer, the Business Logic
Layer and the Front-end. The Physical Layer refers to resources and capabilities within distributed
manufacturing facilities. The Abstraction Layer defines software components embodying hardware, software
and other type of resources seen at the Physical Layer along with interoperability strategies and high-level
manufacturing descriptions. The Business Logic Layer outlines intelligent operational decisions such as
optimization strategies, constraint handling, and resource allocation methods. Inter-layer data-flow begins
when a customer submits product specification together with manufacturing constraints and customizations to
the cloud through the Front-end. This manufacturing request is captured and processed by the Business Logic
Layer which collects descriptive information from the Abstraction Layer and orchestrates virtualized resources
and capabilities into a manufacturing process which is ultimately performed by geographically distributed
entities at the Physical Layer. The aim of this paper is then to report on a proof-of-concept implementation of a
Manufacturing-as-a-Service distributed platform built upon industrial requirements, resources and capabilities
observed in manufacturing facilities, state-of-the-art computing technologies, and an open source cloud
computing technology.
Keywords: Cloud manufacturing, network models
1. Introduction
New challenges have emerged, such as - reallocation of manufacturing jobs, declination of a number of
manufacturing jobs, emergence of new industries, environmental. “Manufacturing workers have paradoxically
often been victims of their sector’s own success, as rapid productivity growth has meant that goods can be
produced with fewer workers, contributing to a several decades to long trend of declining employment. This
trend has been compounded by the shift of consumer spending from manufactured goods like TVs and cars to
services like tourism, dining out and healthcare as well as increased consumption of manufacturing goods made
elsewhere. And the recent downturn has been particularly painful for manufacturing companies, their workers
and the communities that rely on them.” global challenge is already well known global financial crisis.
All these global challenges, the social, environmental and economical, are parts of the issue of sustainability.
Solutions to these challenges require a great set of new mechanisms spanning from legislations and regulations

Proceedings of the National Conference on
Trends and Advances in Mechanical Engineering
(TAME-2017) March 16-17, 2017 ISBN 978-93-5268-269-0
YMCA University of Science & Technology, Faridabad, Haryana
378
(national, regional, international, global), social, cultural, organizational, to technology advances. Some of the
instruments that are expected to contribute to answering the above mentioned challenges are new manufacturing
paradigms, in which context we are presenting research intensification on recently proposed manufacturing
paradigms. In parallel, we are witnessing an intensive search for new manufacturing paradigms too. Both
parameters grow in numbers. In literature, a number of designations could be found, such as:
Ubiquitous Manufacturing
Enterprise Interoperability
Networked Enterprise
Lean Production/Manufacturing
Global Manufacturing
Mass Customization
Reconfigurable Manufacturing Systems
Collaborative Engineering
Manufacturing Supply Chain
Virtual Enterprise
Enterprise Integration
Agile Manufacturing
Real-time Enterprises
Concurrent Engineering
Sustainable Manufacturing
Life Cycle Management
Remanufacturing
Digital Manufacturing
Cloud Manufacturing
Just In Time manufacturing
Flexible Manufacturing
Open Manufacturing
Craft Manufacturing
All-embracing manufacturing
Learning Factory
Extended Enterprise
Production Network
Grid Manufacturing
Micro Factory
Social Network Manufacturing
Desktop Factory
Pocket Factory
Fit Manufacturing
Virtual Organization
2. Clouds Manufacturing
Definition of ‘cloud’ is reinforced by (Group, E., 2010) - as the reference source created within the EC initiative
– and, therefore, it is the most relevant for an Advanced Manufacturing Systems and/or Enterprise. [1]. “A
‘cloud’ is a platform or infrastructure that enables execution of code (services, applications etc.), in a managed
and elastic fashion, whereas ‘managed’ means that reliability according to pre-defined quality parameters is
automatically ensured and ‘elastic’ implies that the resources are put to use according to actual current
requirements observing overarching requirement definitions – implicitly, elasticity includes both up- and
downward scalability of resources and data, but also load-balancing of data throughput.”

Proceedings of the National Conference on
Trends and Advances in Mechanical Engineering
(TAME-2017) March 16-17, 2017 ISBN 978-93-5268-269-0
YMCA University of Science & Technology, Faridabad, Haryana
379
‘Cloud’ has a number of “particular characteristics that distinguish it from classical resource and service
provisioning environments: it is (virtually) infinitely scalable; it provides one or more of an infrastructure for
platforms, a platform for applications or applications (via services) themselves; thus clouds can be used for
every purpose from disaster recovery/business continuity through to a fully outsourced ICT service for an
organization; clouds shift the costs for a business opportunity from CAPEX to OPEX which allows finer control
of expenditure maintenance reducing the entry threshold barrier; currently the major cloud providers have
already invested in large scale infrastructure and now offer a cloud service to exploit it; as a consequence the
cloud offerings are heterogeneous and without agreed interfaces; cloud providers essentially provide data
centre’s for outsourcing; there are concerns over security if a business places its valuable knowledge,
information and data on an external service; there are concerns over availability and business continuity – with
some recent examples of failures; there are concerns over data shipping over anticipated broadband speeds.”
3.Concerning the types of clouds, for an Advanced Manufacturing Systems and/or
Enterprise, the most important are the concepts of ‘cloud’ :
The following terms are defined in this regard:
1. IaaS - Infrastructure as a Service,
2. PaaS - Platform as a Service,
3. SaaS - Software as a Service, and
4. “collectively *aaS (Everything as a Service) all of which imply a service-oriented architecture”, which
includes, e.g., MaaS – Manufacturing as a Service.
Manufacturing as service systems
Definition of the manufacturing as a service system was conceived primarily by the requirements for new
business models in manufacturing and not in relation to ‘clouds’. However, ‘cloud’ has provided a new view
and capacity on/for manufacturing as service systems. Manufacturing as the service system is related to the
concept of Industrial and Product-Service Systems.
There are three types of Product-Service Systems:
1. Service Products – service engineering considers product and service as an independent goods;
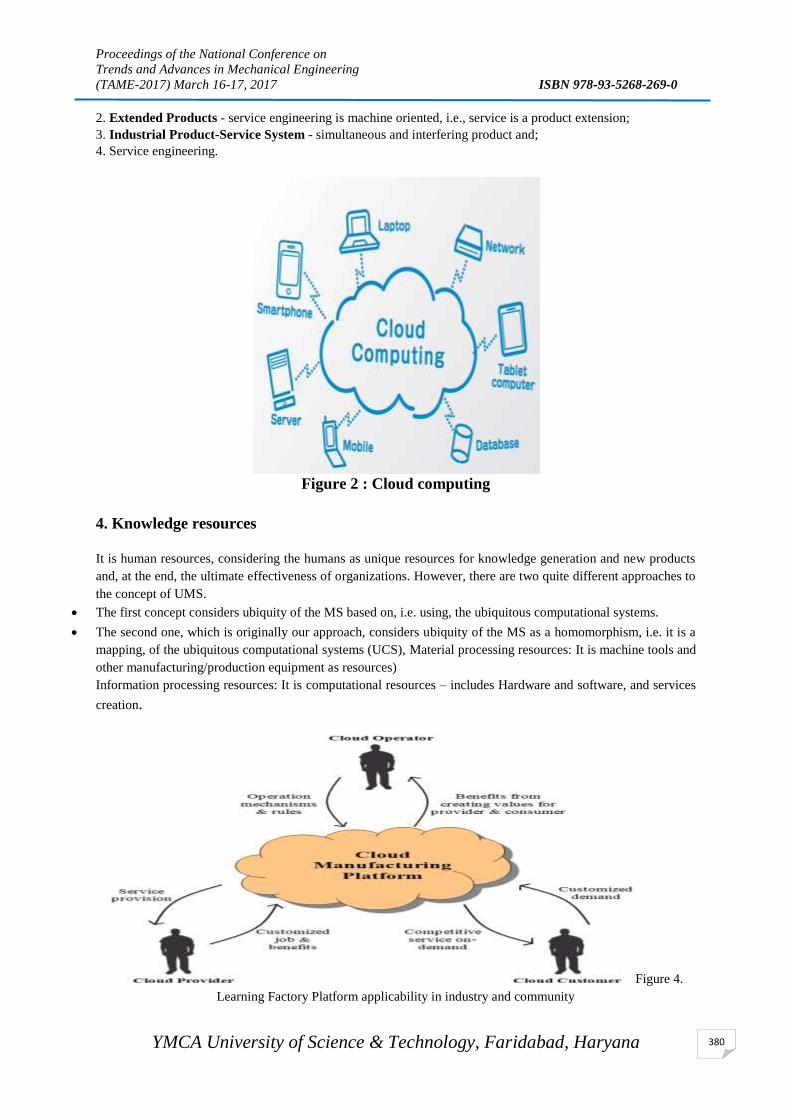
Proceedings of the National Conference on
Trends and Advances in Mechanical Engineering
(TAME-2017) March 16-17, 2017 ISBN 978-93-5268-269-0
YMCA University of Science & Technology, Faridabad, Haryana
380
2. Extended Products - service engineering is machine oriented, i.e., service is a product extension;
3. Industrial Product-Service System - simultaneous and interfering product and;
4. Service engineering.
Figure 2 : Cloud computing
4. Knowledge resources
It is human resources, considering the humans as unique resources for knowledge generation and new products
and, at the end, the ultimate effectiveness of organizations. However, there are two quite different approaches to
the concept of UMS.
The first concept considers ubiquity of the MS based on, i.e. using, the ubiquitous computational systems.
The second one, which is originally our approach, considers ubiquity of the MS as a homomorphism, i.e. it is a
mapping, of the ubiquitous computational systems (UCS), Material processing resources: It is machine tools and
other manufacturing/production equipment as resources)
Information processing resources: It is computational resources – includes Hardware and software, and services
creation.
Figure 4.
Learning Factory Platform applicability in industry and community

Proceedings of the National Conference on
Trends and Advances in Mechanical Engineering
(TAME-2017) March 16-17, 2017 ISBN 978-93-5268-269-0
YMCA University of Science & Technology, Faridabad, Haryana
381
Figure 5 : Enterprise and Comunity
5. Discussions and Concluding Remarks
Today's global enterprises have faced with a growing increase in the competitiveness that forces them to adopt
and develop new strategies and methods with relevant challenges in integrating product, process, and enterprise
dimensions and lifecycles. Considering the Cloud manufacturing paradigm as a solution for today's global
manufacturing enterprises, this chapter discussed the first requirement of the Cloud manufacturing paradigm
known as global manufacturing integration. The integration of enterprise-level business systems with
manufacturing systems is found to be one of the inevitable drivers for productivity and making businesses more
responsive to supply chain demands. However, integrating heterogeneous and autonomous data sources through
enterprises' structures which are numerous in number and also in approaches for data management is a
significant challenge. In this chapter, the concepts of global manufacturing data integration have been studied
comprehensively. Discussing the dominant researches for solutions offered as enabler approaches in global
manufacturing data integration, the authors proposed the axiomatic design theory capability to propose an
efficient solution for global manufacturing ontology model. Two main characteristics of the solution are
described as:
I. Providing a consistent manufacturing lifecycle data integration model.
2. The required structure and procedures to fulfill improvements and developments in manufacturing discourses.
References:
1. Bughin J, Chui M, Clouds Manyika J. Big data, and smart assets: ten tech- enabled business trends to watch.
McKinsey Quarterly. McKinsey Global Institute; August 2010
2. T. G. P. M. Mell;, vol. The NIST Definition of Cloud Computing. NISTSP - 800-145, September 28, 2011.
3. Rimal BP, Jukan A, Katsaros D, Goeleven Y. Architectural requirements for cloud computing systems: an
enterprise cloud approach. Journal of Grid Computing 2011;9(1):3–26
4. Louth W. Metering the cloud: applying activity based costing (ABC) from code profiling up to performance and
cost management of cloud computing. In: Proceedings of the International conference on JAVA technology;
2009
Proceedings of the National Conference on
Trends and Advances in Mechanical Engineering
(TAME-2017) March 16-17, 2017 ISBN 978-93-5268-269-0
YMCA University of Science & Technology, Faridabad, Haryana
382
5. Schaefer, D.; J.L. Thames; R. Wellman; D. Wu; S. Yim; D. Rosen (2012). "Distributed Collaborative Design
and Manufacture in the Cloud--Motivation, Infrastructure, and Education". Proceedings of the ASEE 2012
Annual Conference and Exposition, San Antonio, Texas, June 10–13, 2012, Paper No. AC2012-3017
6. Hardwick M, Loffredo D. Lessons learned implementing STEP-NC AP-238. Inter- national Journal of
Computer Integrated Manufacturing 2006;19(6):523–32
7. Brecher C, Lohse W, Vitr M. Module-based platform for seamless interoper- able CAD-CAM-CNC planning.
In: XU XW, NEE AYC, editors. Advanced design and manufacturing based on STEP. London: Springer; 2009
8. Lee BE, Suh S-H. An architecture for ubiquitous product life cycle support system and its extension to machine
tools with product data model. Interna- tional Journal of Advanced Manufacturing Technology 2009; 42:606–
20.
9. Wang XV, Xu X, Haemmerle E. Distributed interoperable manufacturing platform based on STEP-NC. In:
Proceedings of the 20th International flexible automation and intelligent manufacturing conference, FAIM;
2010.
10. Subashini S, Kavitha V. A survey on security issues in service delivery models of cloud computing. Journal of
Network and Computer Applications 2011; 34(1): 1–11.
11. Mulholland, A., Daniels, R., & Hall, T. (2008). The cloud and SOA: Creating Architecture for today and for the
future.
12. Putnik, G. D. (2010). Ubiquitous Manufacturing Systems vs. Ubiquitous Manufacturing Systems: Two
Paradigms. In Proceedings of Proceedings of the CIRP ICME ’10 - 7th CIRP International Conference on
Intelligent Computation in Manufacturing Engineering - Innovative and CognitiveProduction Technology and
Systems.
13. Putnik, G. D., Ferreira, L., Cunha, M., Putnik, Z., Castro, H., &Shah, V. (2012). User Pragmatics for Effective
Ontologies Interoperability for Cloud-based Applications: The case of Ubiquitous Manufacturing System UI.
Electronic Markets – The International Journal on Networked Business, (submitted for publication).
14. Putnik, G. D., & Putnik, Z. (2010). A semiotic framework for manufacturing systems integration -Part I:
Generative integration model. International Journal of Computer Integrated Manufacturing, 23: 8, 691 - 709.
15. Singh, P. (2003). Examining the Society of Mind. Computing and Informatics, 22, 521-543.
16. Usmani, S., Azeem, N., & Samreen, A. (2011). Dynamic Service Composition in SOA and QoS Related Issues
International Journal of Computer Technology and Applications, 2, 1315-1321.
17. W3C. (2011). Widget Packaging and XML Configuration, W3CRecommendation 27 September 2011.
18. W@tch, e.-B. (2006). ICT and e-Business in the ICT Manufacturing Industry, ICT adoption and e-business
activity in 2006: European Commission.
19. Xu, X. (2012). From cloud computing to cloud manufacturing. Robotics and Computer-Integrated
Manufacturing (28), 75-86.
20. Yigitbasioglu, O. M., & Velcu, O. (2010). A review of dashboards in performance management: Implications
for design and research. International Journal of Accounting Information Systems, 13(1), 4

DAIKIN IS THE GLOBAL NO.1 AIR CONDITIONING COMPANY
FROM JAPAN TOUCHING LIVES WITH CONVICTION, INNOVATION AND
FUTURISTIC APPROACH Daikin is world’s no. 1 air conditioning company and provider of advanced, high-
quality air conditioning solutions for residential, commercial and industrial
applications.
Founded in 1924
Sales amounting to $20 Billion
Over 60 worldwide production bases
Available over 130 countries
Air Specialists
3 core technologies
Investment in advanced R&D amounting to $300 million
Refrigeration
Compressors
Danfoss focuses on providing energy efficient, sustainable and smart refrigeration
compressors for a varied range of commercial applications such as cold rooms,
display windows, ice making machines, glass door merchandisers, process cooling etc.