Embed Size (px)
Citation preview

FORECASTING ST. LOUIS HOMICIDES2013
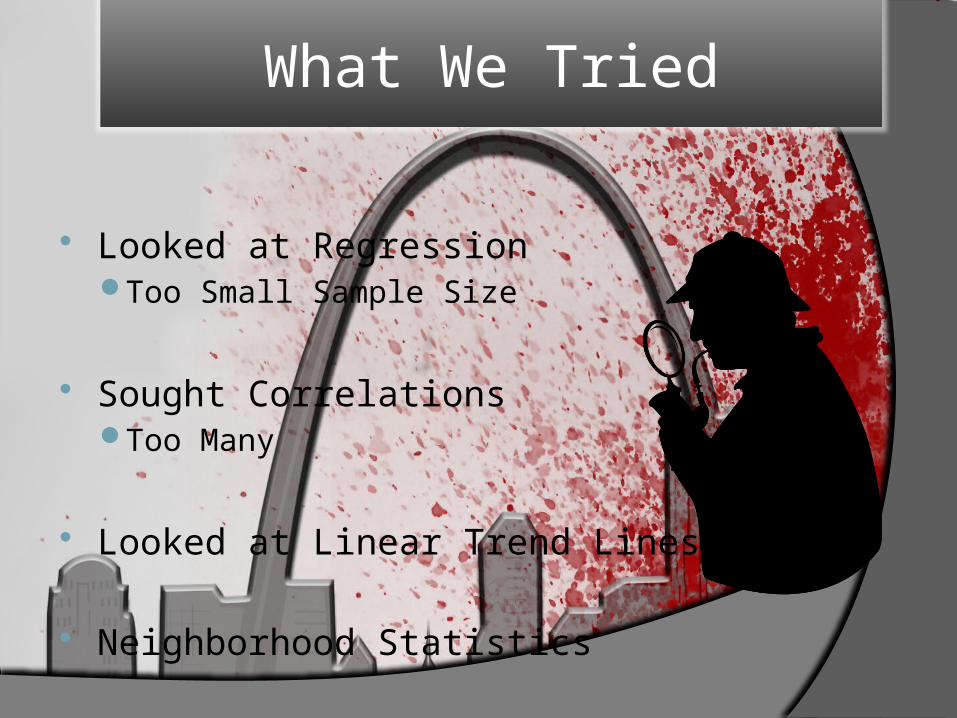
Looked at RegressionToo Small Sample Size
Sought CorrelationsToo Many
Looked at Linear Trend Lines
Neighborhood Statistics
What We Tried
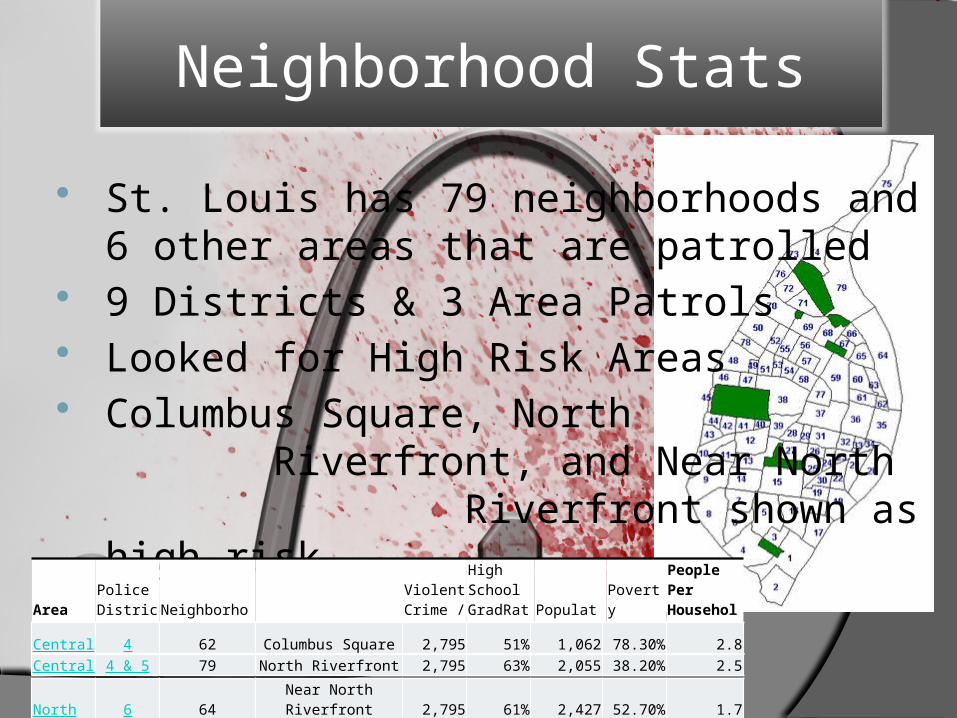
St. Louis has 79 neighborhoods and 6 other areas that are patrolled
9 Districts & 3 Area Patrols Looked for High Risk Areas Columbus Square, North
Riverfront, and Near North Riverfront shown as high risk
Neighborhood Stats
Area Patrol
Police District
Neighborhood Number Neighborhood
Violent Crime /100k
High School GradRate Population
Poverty Level
People Per Household
Central 4 62 Columbus Square 2,795 51% 1,062 78.30% 2.8Central 4 & 5 79 North Riverfront 2,795 63% 2,055 38.20% 2.5
North 6 64 Near North Riverfront 2,795 61% 2,427 52.70% 1.7
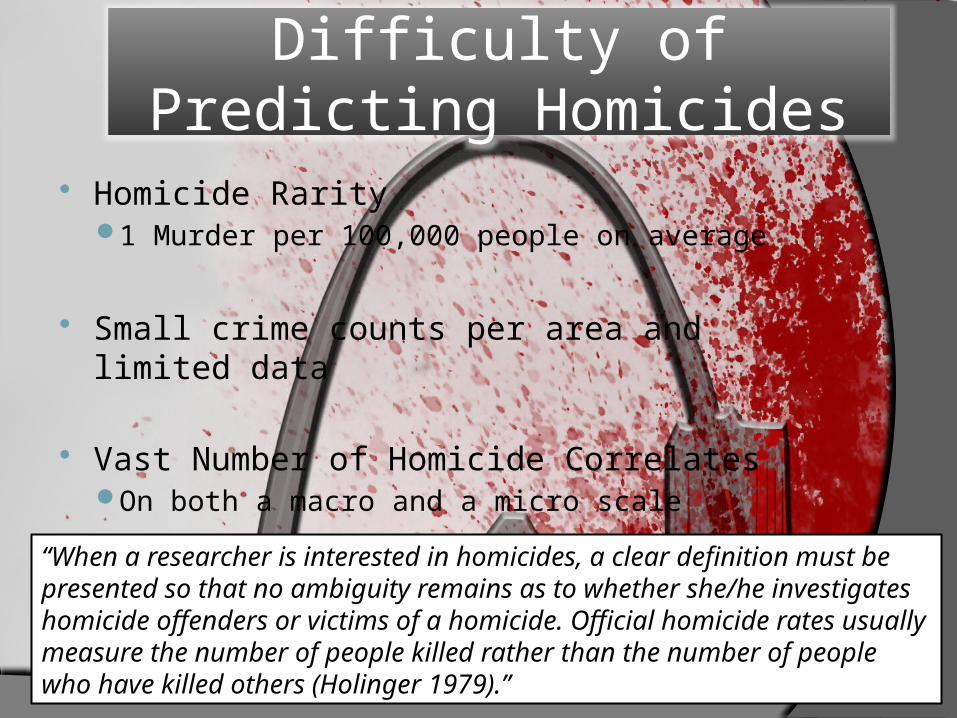
Homicide Rarity1 Murder per 100,000 people on average
Small crime counts per area and limited data
Vast Number of Homicide CorrelatesOn both a macro and a micro scale
“When a researcher is interested in homicides, a clear definition must be presented so that no ambiguity remains as to whether she/he investigates homicide offenders or victims of a homicide. Official homicide rates usually measure the number of people killed rather than the number of people who have killed others (Holinger 1979).”
Difficulty of Predicting Homicides
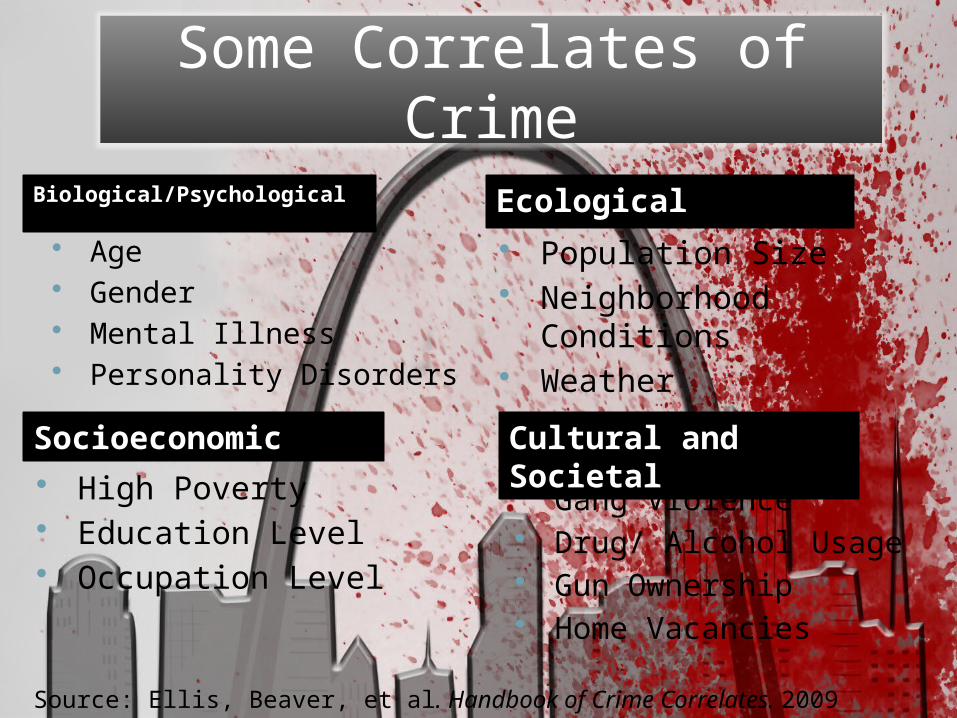
Biological/Psychological Ecological
Age Gender Mental Illness Personality Disorders
Population Size Neighborhood Conditions Weather
Socioeconomic High Poverty Education Level Occupation Level
Gang Violence Drug/ Alcohol Usage Gun Ownership Home Vacancies
Source: Ellis, Beaver, et al. Handbook of Crime Correlates. 2009 Academic Press.
Cultural and Societal
Some Correlates of Crime
Based on previous studies, and our early attempts to produce a good model for prediction, we chose to use a simple linear model and apply exponential smoothing to forecast.
Due to the number of correlates, it is too difficult to come with a model that shows a meaningful connection and provides an accurate method of forecasting. We strictly followed the murder data to develop our predictions.
Our Approach
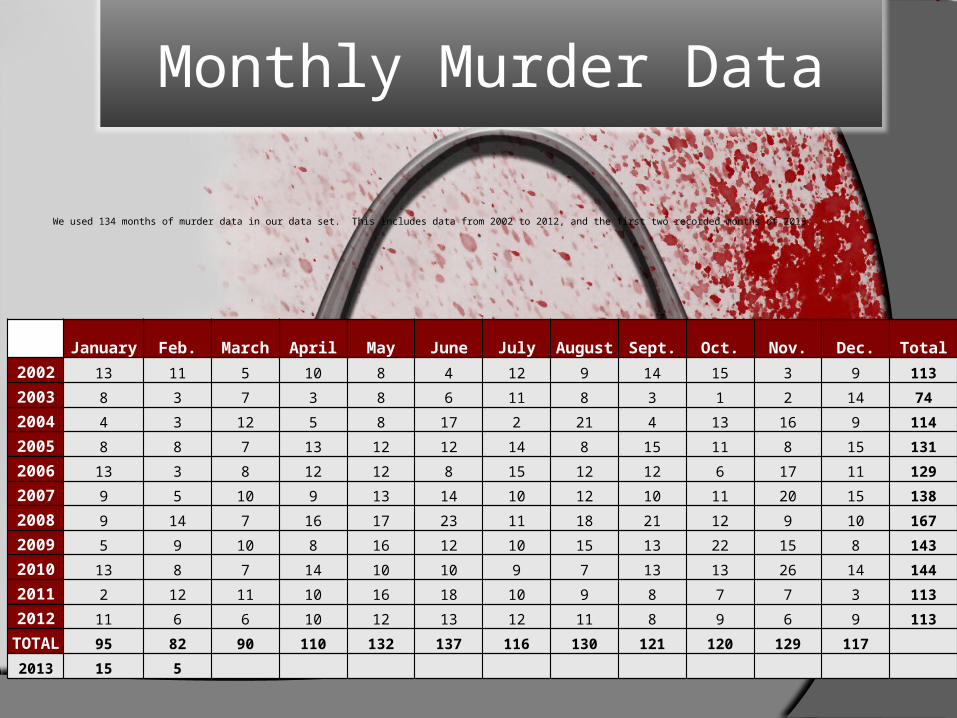
We used 134 months of murder data in our data set. This includes data from 2002 to 2012, and the first two recorded months of 2013.
January Feb. March April May June July August Sept. Oct. Nov. Dec. Total
2002 13 11 5 10 8 4 12 9 14 15 3 9 113
2003 8 3 7 3 8 6 11 8 3 1 2 14 74
2004 4 3 12 5 8 17 2 21 4 13 16 9 114
2005 8 8 7 13 12 12 14 8 15 11 8 15 131
2006 13 3 8 12 12 8 15 12 12 6 17 11 129
2007 9 5 10 9 13 14 10 12 10 11 20 15 138
2008 9 14 7 16 17 23 11 18 21 12 9 10 167
2009 5 9 10 8 16 12 10 15 13 22 15 8 143
2010 13 8 7 14 10 10 9 7 13 13 26 14 144
2011 2 12 11 10 16 18 10 9 8 7 7 3 113
2012 11 6 6 10 12 13 12 11 8 9 6 9 113
TOTAL 95 82 90 110 132 137 116 130 121 120 129 117
2013 15 5
Monthly Murder Data
"Is crime seasonal?” Seasonality refers to regular periodic fluctuations which
recur every year with about the same timing and with the same intensity and which, most importantly, can be measured and removed from the time series under review.
Any discussion of seasonal fluctuation in crime must be carefully qualified by several considerations: 1) the place 2) the conceptual and operational definitions of the crime 3) circumstances relating to public or private crime (weapon,
place of occurrence, injury, victim-offender relationship, property loss)
4) numerical aspects of the series that would increase the likelihood of significant results
Homicide and Seasonality
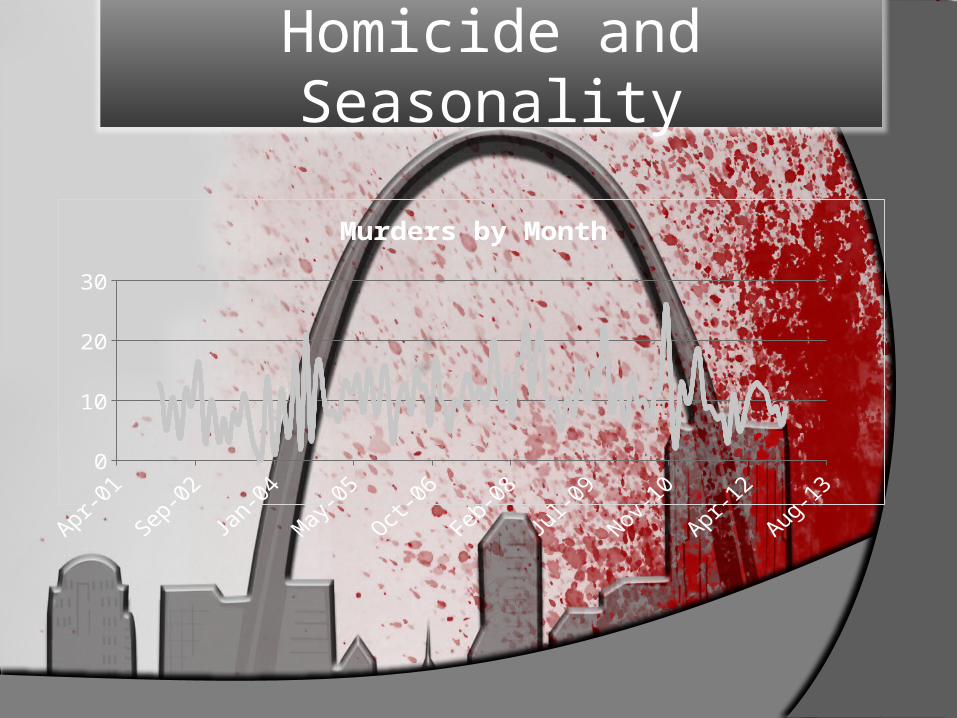
Apr-01 Sep-02 Jan-04 May-05 Oct-06 Feb-08 Jul-09 Nov-10 Apr-12 Aug-130
5
10
15
20
25
30
Murders by Month
Homicide and Seasonality
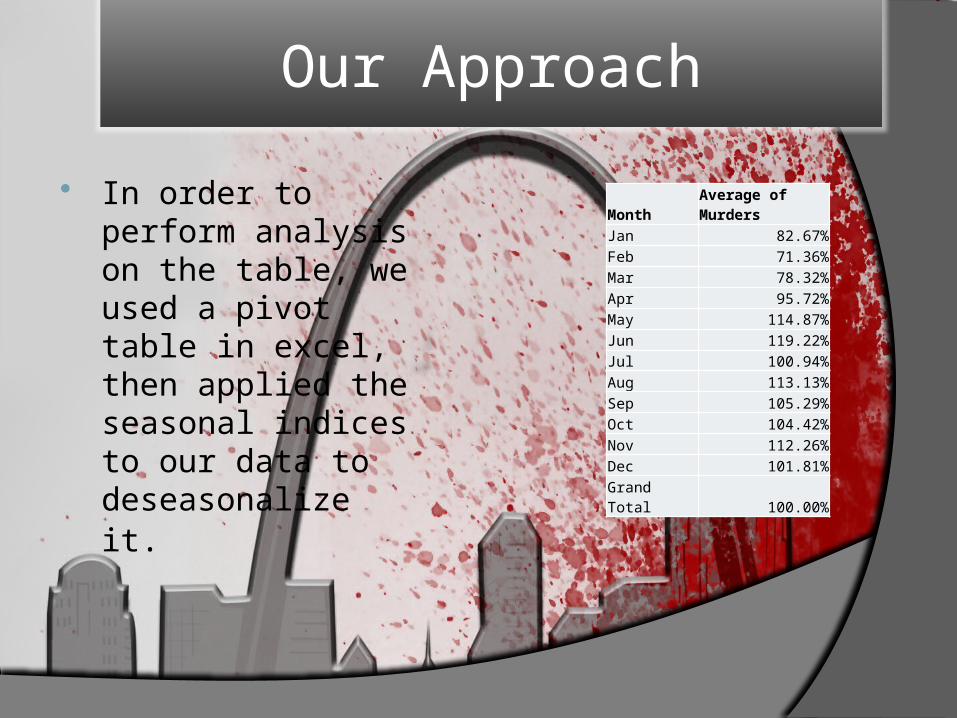
In order to perform analysis on the table, we used a pivot table in excel, then applied the seasonal indices to our data to deseasonalize it.
MonthAverage of Murders
Jan 82.67%Feb 71.36%Mar 78.32%Apr 95.72%May 114.87%Jun 119.22%Jul 100.94%Aug 113.13%Sep 105.29%Oct 104.42%Nov 112.26%Dec 101.81%Grand Total 100.00%
Our Approach
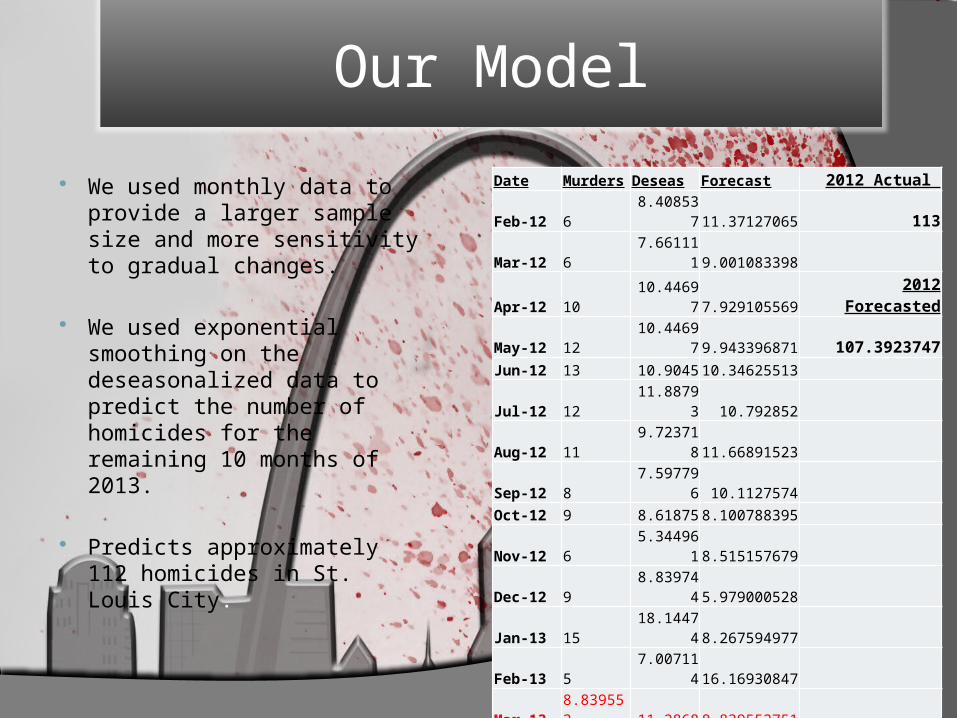
We used monthly data to provide a larger sample size and more sensitivity to gradual changes.
We used exponential smoothing on the deseasonalized data to predict the number of homicides for the remaining 10 months of 2013.
Predicts approximately 112 homicides in St. Louis City.
Date Murders Deseas Forecast 2012 Actual
Feb-12 6 8.408537 11.37127065 113
Mar-12 6 7.661111 9.001083398
Apr-12 10 10.44697 7.929105569 2012 Forecasted
May-12 12 10.44697 9.943396871 107.3923747
Jun-12 13 10.9045 10.34625513
Jul-12 12 11.88793 10.792852
Aug-12 11 9.723718 11.66891523
Sep-12 8 7.597796 10.1127574
Oct-12 9 8.61875 8.100788395
Nov-12 6 5.344961 8.515157679
Dec-12 9 8.839744 5.979000528
Jan-13 15 18.14474 8.267594977
Feb-13 5 7.007114 16.16930847
Mar-13 8.839553 11.2868 8.839552751
Apr-13 10.79735 11.27996 10.79734999
May-13 11.18344 9.736086 11.18343705
Jun-13 10.02556 8.409514 10.02555594
Jul-13 8.732723 8.651167 8.732722693
Aug-13 8.667478 7.661828 8.667478213
Sep-13 7.862958 7.467644 7.862958441
Oct-13 7.546707 7.22702 7.54670722
Nov-13 7.290958 6.494981 7.290957697 2013 Forecasted
Dec-13 6.654176 6.53569 6.654176379 112.0377998
Our Model
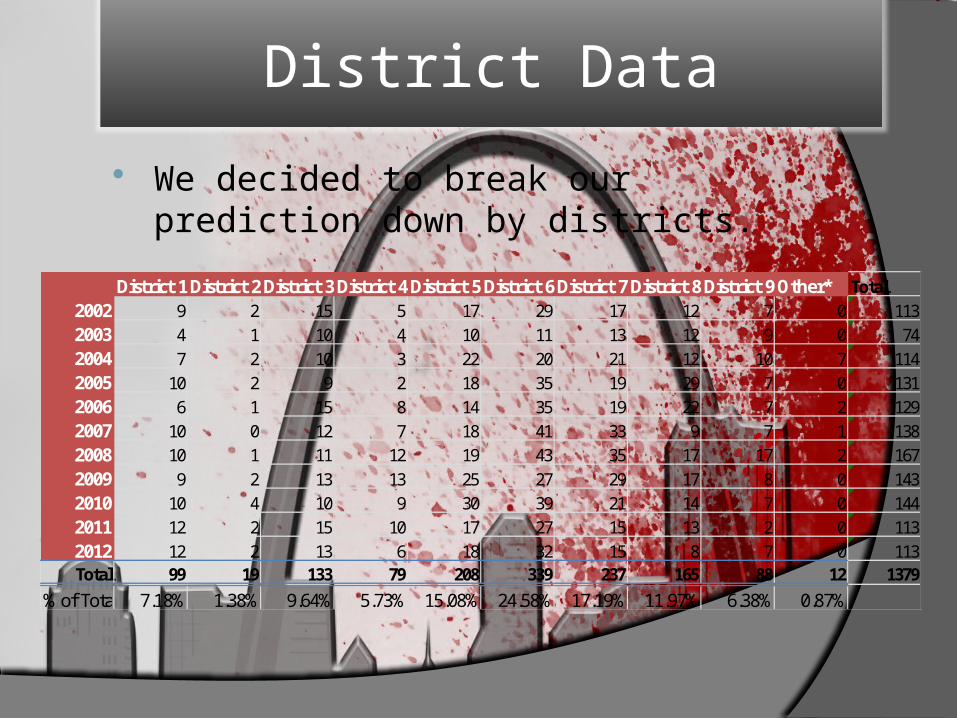
District 1 District 2 District 3 District 4 District 5 District 6 District 7 District 8 District 9 Other* Total2002 9 2 15 5 17 29 17 12 7 0 1132003 4 1 10 4 10 11 13 12 9 0 742004 7 2 10 3 22 20 21 12 10 7 1142005 10 2 9 2 18 35 19 29 7 0 1312006 6 1 15 8 14 35 19 22 7 2 1292007 10 0 12 7 18 41 33 9 7 1 1382008 10 1 11 12 19 43 35 17 17 2 1672009 9 2 13 13 25 27 29 17 8 0 1432010 10 4 10 9 30 39 21 14 7 0 1442011 12 2 15 10 17 27 15 13 2 0 1132012 12 2 13 6 18 32 15 8 7 0 113Total 99 19 133 79 208 339 237 165 88 12 1379
% of Total 7.18% 1.38% 9.64% 5.73% 15.08% 24.58% 17.19% 11.97% 6.38% 0.87%
We decided to break our prediction down by districts.
District Data
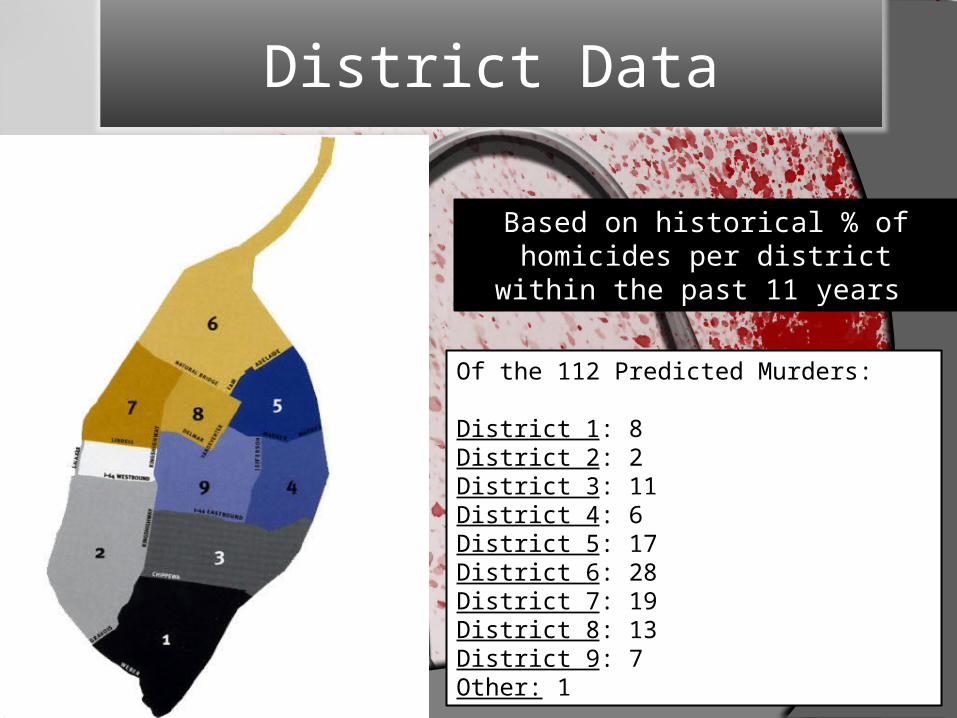
Based on historical % of homicides per district within the past 11 years.
Of the 112 Predicted Murders:
District 1: 8District 2: 2District 3: 11District 4: 6District 5: 17District 6: 28District 7: 19District 8: 13District 9: 7Other: 1
District Data
The model assumes “business as usual conditions”Does not account for changes in police
policy or trends in possible correlated factors Greater amounts of data can allow for a
more complicated model and can account for more variables.
Ways to Improve Model
St. Louis has initiated a new “Hot-Spot Initiative.”Will focus on Downtown, Shaw, and Baden
neighborhoods.
Domestic Abuse Response Team(DART)
PredPol (Predictive Policing)
Other Considerations
Conclusion
We predict 112 murders in 2013Highest Predicted Crime Area: District 6 (28)Lowest Predicted Crime Area: District 2 (2)
With small scale data sets and lack of abundant data, forecasting accurately is a challenge.
“It’s tough to make predictions, especially about the future.”
-Yogi Berra
https://www.ncjrs.gov/pdffiles1/nij/grants/211973.pdf http://www.kmov.com/news/editors-pick/St-Louis-poli
ce--195189401.html
http://forprin.dev.zoe.co.nz/files/pdf/Gorr_Olligschalger_and_Thompson,_Short-term.pdf
http://www.predpol.com/ http://research.stlouisfed.org/fred2/series/MOSSURN http://
cad.sagepub.com/content/49/3/339.full.pdf+html http://
ajp.psychiatryonline.org/article.aspx?articleID=172630
Sources

http://www.slmpd.org/press_room.html# http://www.slmpd.org/crime_stats.html http://stlouis-mo.gov/government/department
s/public-safety/neighborhood-stabilization-office/neighborhoods/neighborhood-maps.cfm
http://www.areavibes.com/st.+louis-mo/neighborhoods/
http://bjs.ojp.usdoj.gov/content/pub/pdf/ics.pdf http://www.nytimes.com/2009/06/19/nyregion/
19murder.html?pagewanted=all&_r=0
http://blogs.riverfronttimes.com/dailyrft/2013/03/joseph_hawthorne_homicide_st_louis.php#more
Sources