Embed Size (px)
Citation preview
© Keith Vander Linden, 1999
from The Visual Display of Quantitative Information, Edward Tufte, 1983

© Keith Vander Linden, 1999
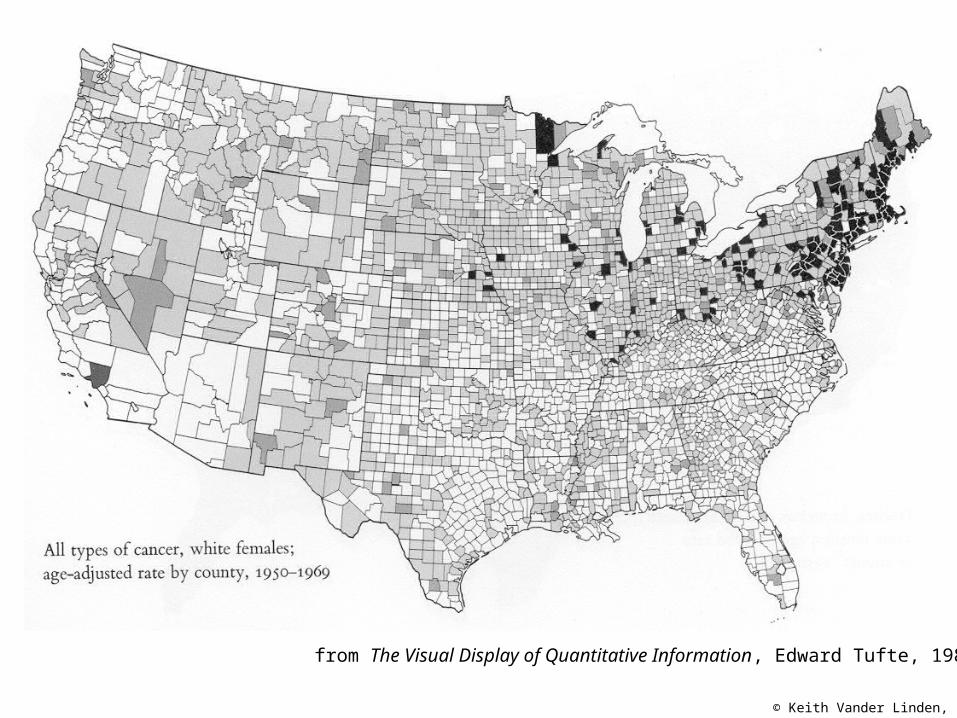
from The Visual Display of Quantitative Information, Edward Tufte, 1983
© Keith Vander Linden, 1999
from The Visual Display of Quantitative Information, Edward Tufte, 1983

© Keith Vander Linden, 1999
from The Visual Display of Quantitative Information, Edward Tufte, 1983
© Keith Vander Linden, 1999
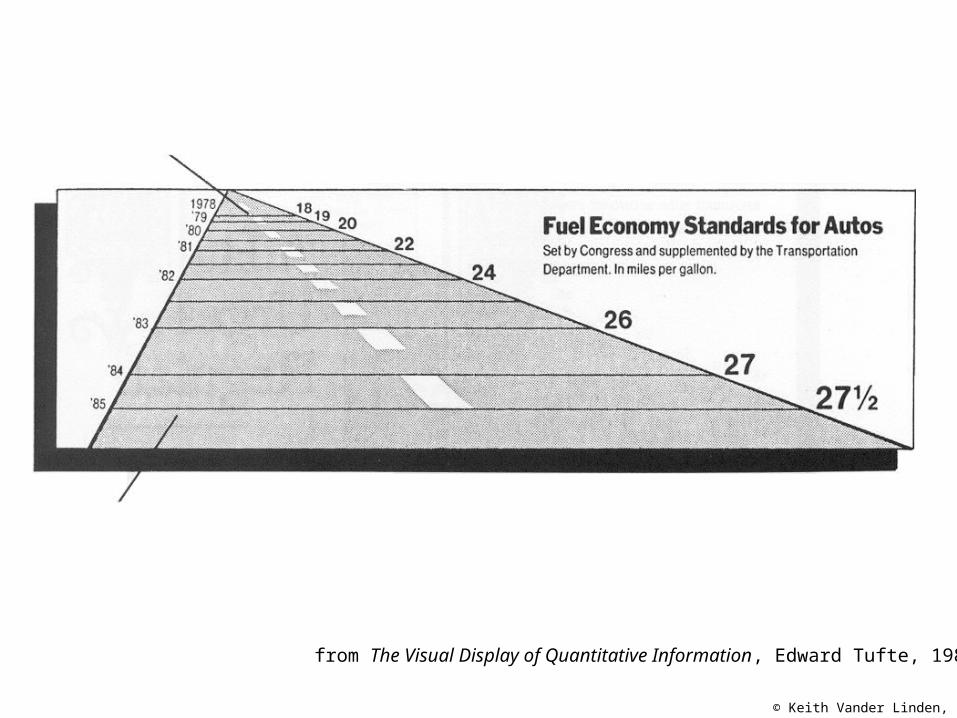
from Exploring Microsoft Excel 97, Grauer & Barber, 1998

© Keith Vander Linden, 1999
from Exploring Microsoft Excel 97, Grauer & Barber, 1998

© Keith Vander Linden, 1999
Lying graphics cheapen the graphical art everywhere … When a chart on television lies, it lies millions of times over; when a New York Times chart lies, it lies 900,000 times over to a great many important and influential readers.
- Edward Tufte

© Keith Vander Linden, 1999
Using Graphics Properly
• Let the graphic values/change accurately depict the data values/change.
• Clearly label all relevant details.
• Don’t graphically mix dissimilar elements.
• Use the right type of graph.

© Keith Vander Linden, 1999
Chart Types
• Pie charts
• Column/bar charts
• Data tables
• Maps