Embed Size (px)
Citation preview

© K. Karlsen 2013
Why is Education so Important?
Infant Mortality in U.S.
- An Overview
© K. Karlsen 2014
Why is Education so Important?
Infant Mortality in U.S.
© K. Karlsen 2014
Infant Mortality in U.S.
4 millions births per year in U.S. 480,800 (12%) born preterm, < 37 weeks 80,435 (2%) very preterm, < 32 weeks, <
1500 grams
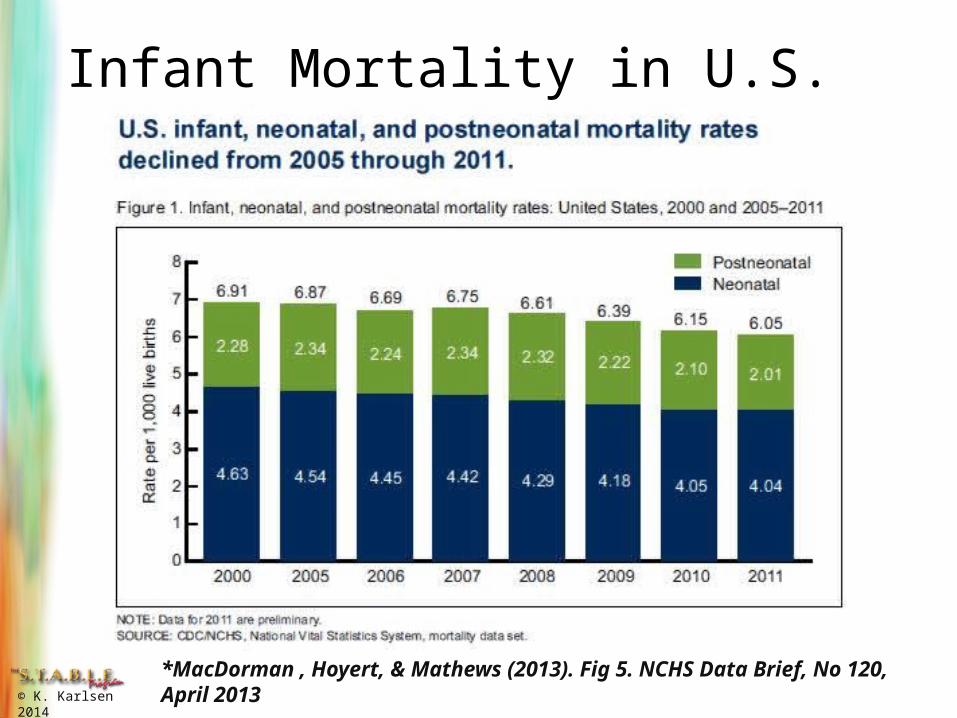
Two-thirds of deaths in first year of life occur in first month of life Most occur within 1st week of life
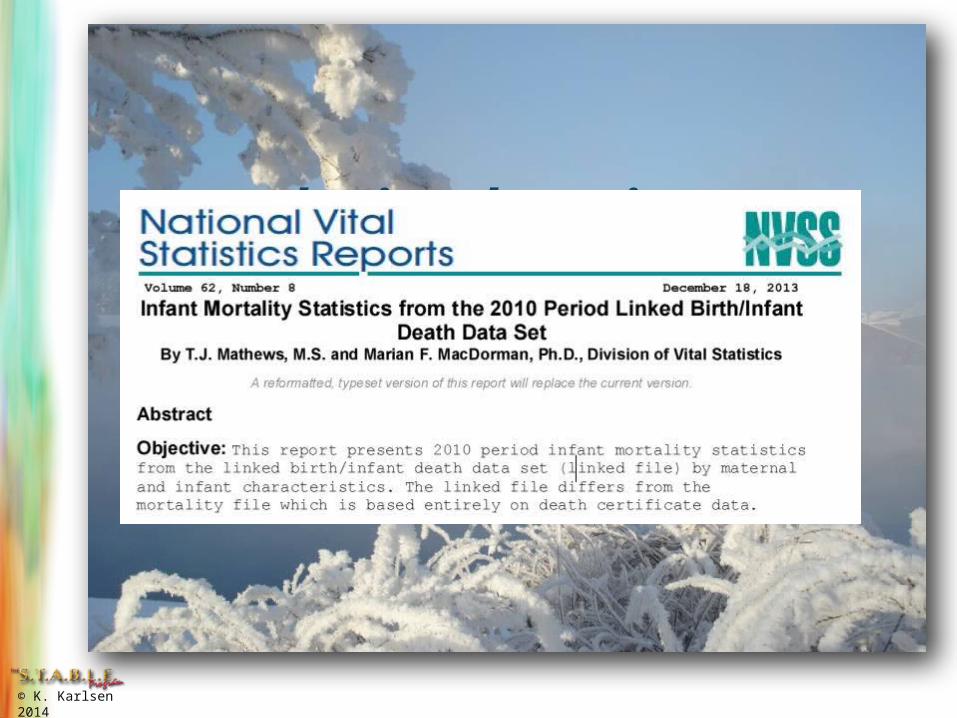
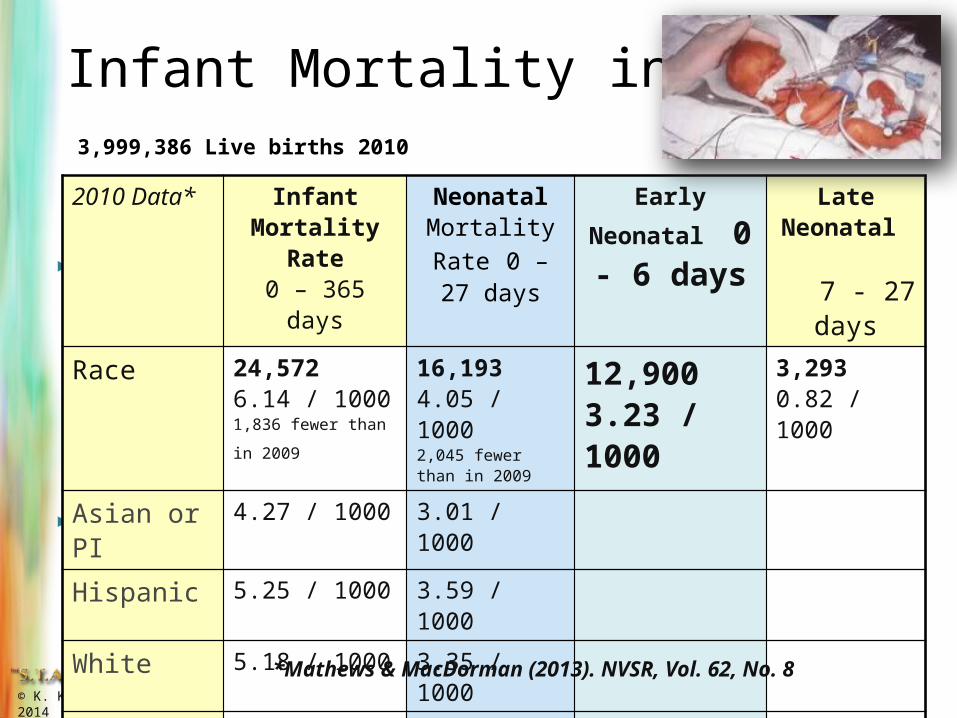
2010 Data* Infant Mortality Rate0 – 365 days
Neonatal Mortality Rate 0 – 27 days
Early Neonatal 0 - 6 days
Late Neonatal 7 - 27
days
Race 24,572 6.14 / 1000 1,836 fewer than in
2009
16,1934.05 / 10002,045 fewer than in 2009
12,9003.23 / 1000
3,2930.82 / 1000
Asian or PI 4.27 / 1000 3.01 / 1000
Hispanic 5.25 / 1000 3.59 / 1000
White 5.18 / 1000 3.35 / 1000
Am Ind/AN 8.28 / 1000 4.28 / 1000
Black 11.46 / 1000 7.45 / 1000
*Mathews & MacDorman (2013). NVSR, Vol. 62, No. 8
3,999,386 Live births 2010
© K. Karlsen 2014
*MacDorman , Hoyert, & Mathews (2013). Fig 5. NCHS Data Brief, No 120, April 2013
Infant Mortality in U.S.
© K. Karlsen 2014
3.99 million births in U.S. (2010 matched data)*
478,790 (12%) born preterm, < 37 weeks Account for 67% of all infant deaths in US in
2010 78,442 (2%) born very preterm, < 32 weeks
Account for 53% of all infant deaths in US in 2010
< 1000 gms 0.72% of births, but 47% of all infant deaths
Infant Mortality in U.S.
*Mathews & MacDorman (2013). NVSR, Table 4. Vol. 62, No. 8
© K. Karlsen 2014
For all race and ethnic groups, infant mortality rate in 2010 for:
> 2500 grams………….. 2.13 / 1,000 live births
< 2500 grams ……..........50.98 /1,000 live births
1500 to 2499 grams.....13.42 /1,000 live births
< 1500 grams …………. 222.15 / 1,000 live births
Infant Mortality in U.S.
*Mathews & MacDorman (2013). NVSR, Table 1. Vol. 62, No. 8
© K. Karlsen 2014
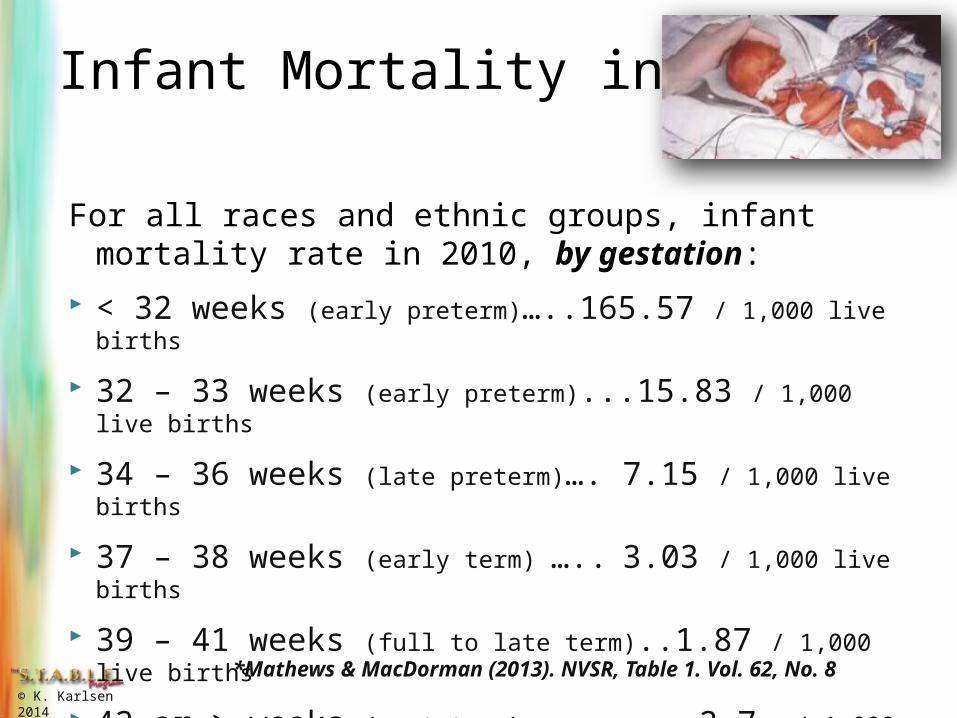
For all races and ethnic groups, infant mortality rate in 2010, by gestation:
< 32 weeks (early preterm)…..165.57 / 1,000 live births
32 – 33 weeks (early preterm)...15.83 / 1,000 live births
34 – 36 weeks (late preterm)…. 7.15 / 1,000 live births
37 – 38 weeks (early term) ….. 3.03 / 1,000 live births
39 – 41 weeks (full to late term)..1.87 / 1,000 live births
42 or > weeks (post-term)….. ... 2.7 / 1,000 live births
Infant Mortality in U.S.
*Mathews & MacDorman (2013). NVSR, Table 1. Vol. 62, No. 8
© K. Karlsen 2014
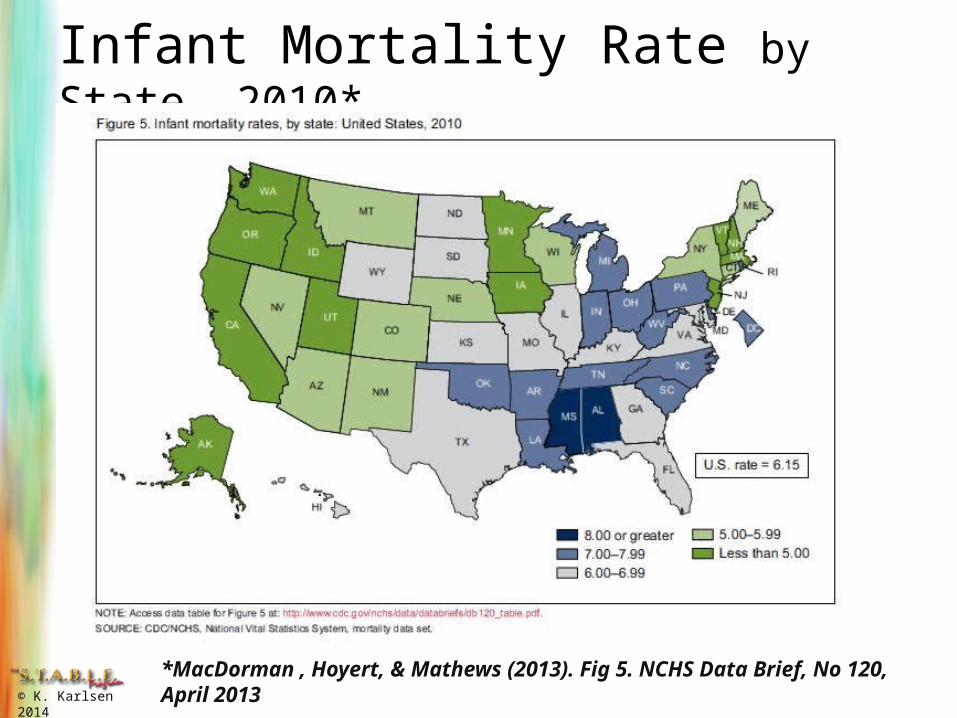
Infant Mortality Rate by State, 2010*
*MacDorman , Hoyert, & Mathews (2013). Fig 5. NCHS Data Brief, No 120, April 2013
© K. Karlsen 2014
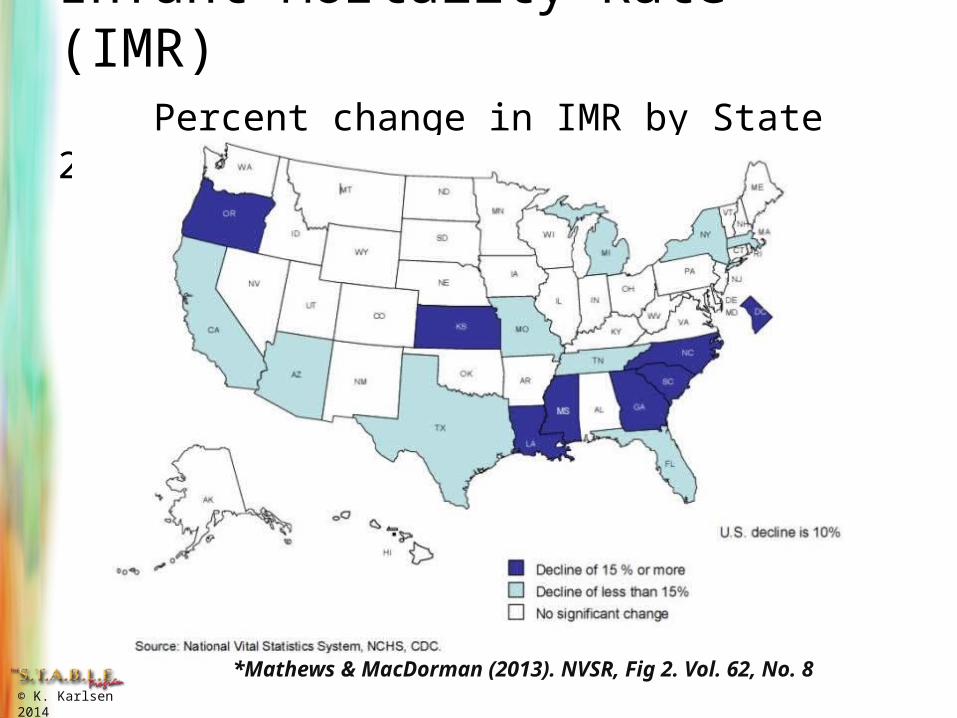
Infant Mortality Rate (IMR) Percent change in IMR by State 2005 to 2010
*Mathews & MacDorman (2013). NVSR, Fig 2. Vol. 62, No. 8
© K. Karlsen 2014
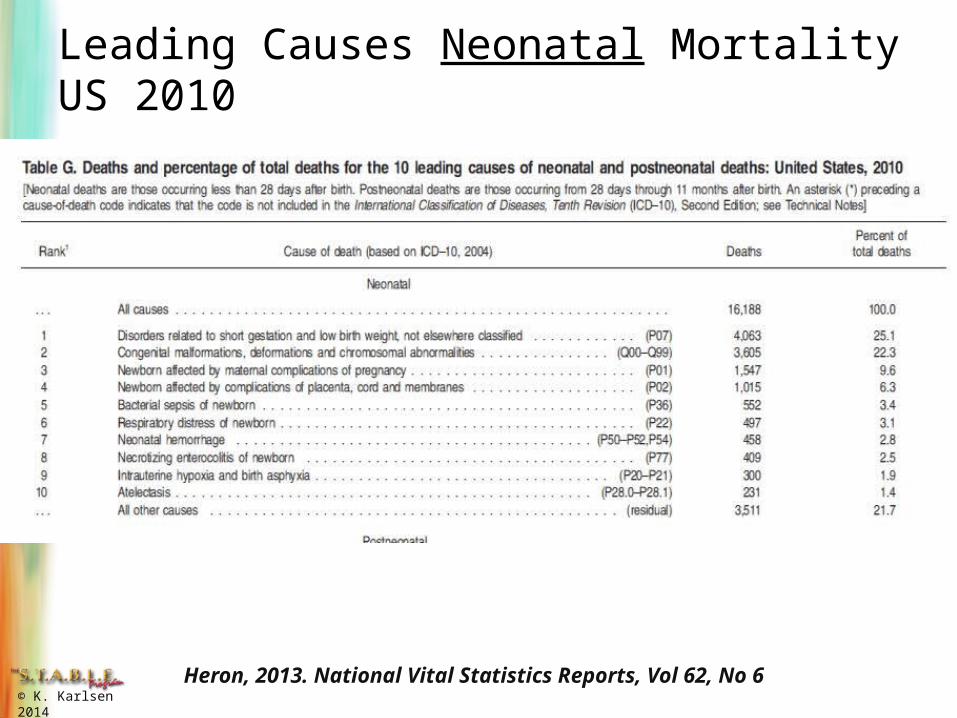
Heron, 2013. National Vital Statistics Reports, Vol 62, No 6
Leading Causes Neonatal Mortality US 2010
© K. Karlsen 2014
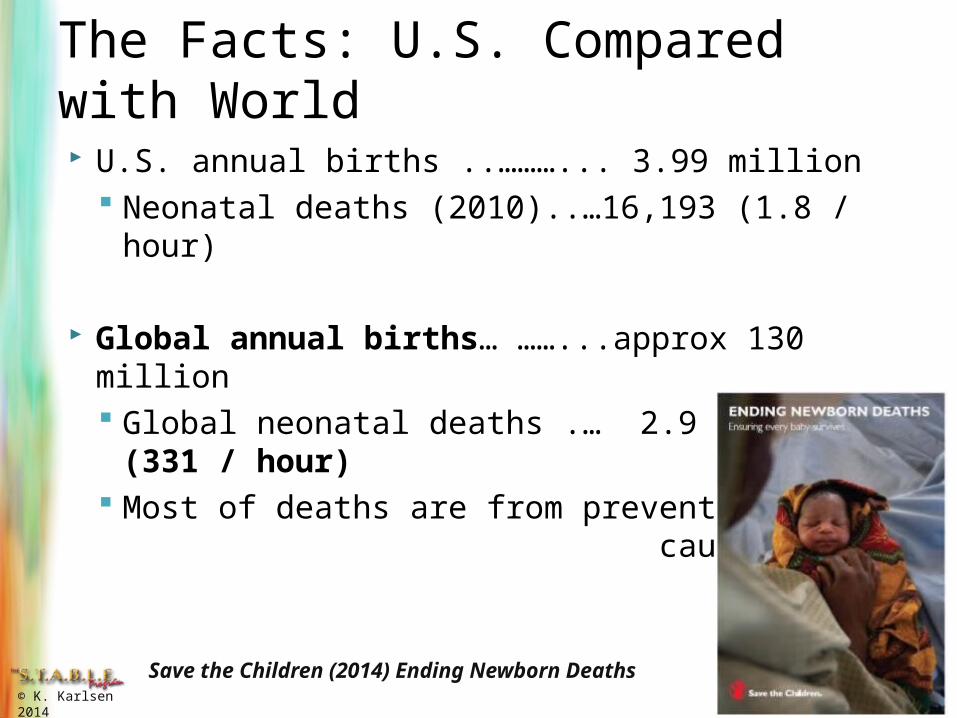
U.S. annual births ..………... 3.99 million Neonatal deaths (2010)..…16,193 (1.8 / hour)
Global annual births… ……...approx 130 million Global neonatal deaths .… 2.9 million (331 /
hour) Most of deaths are from preventable
causes
The Facts: U.S. Compared with World
Save the Children (2014) Ending Newborn Deaths
© K. Karlsen 2014
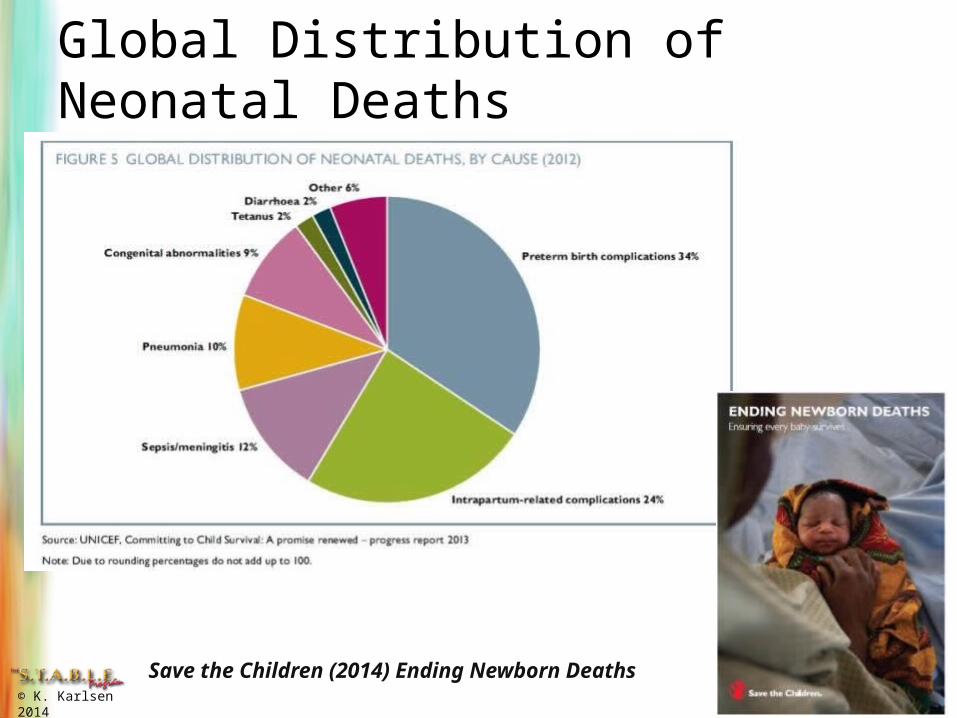
Global Distribution of Neonatal Deaths
Save the Children (2014) Ending Newborn Deaths
© K. Karlsen 2014
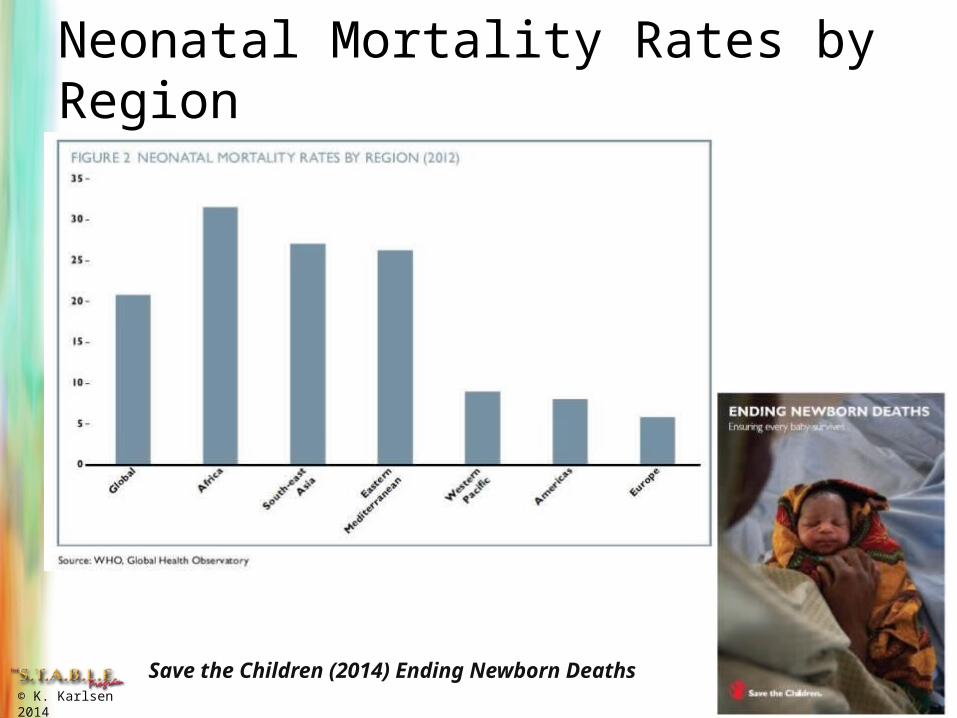
Save the Children (2014) Ending Newborn Deaths
Neonatal Mortality Rates by Region


![illion Preterm Births - WHO · quality of care dependent [f] ... “Outcome at 5 years of age of children 23 to 27 weeks’ gestation: ... weeks Moderate or Late preterm 32 -](https://img.pdfslide.us/doc/110x75/5b15db307f8b9a472e8b9737/illion-preterm-births-quality-of-care-dependent-f-outcome-at-5-years.jpg)