Embed Size (px)
Citation preview
Workgroup Emotional Climate: Individual Inputs and Group Cohesion
A Plan B Research Project
SUBMITTED TO THE FACULTY OF
THE UNIVERSITY OF MINNESOTA
BY
Jessa L Youso
IN PARTIAL FULFILLMENT OF THE REQUIREMENTS
FOR THE DEGREE OF
MASTER OF ARTS
Alexandra Luong, Ph.D., Advisor Eric Hessler, Ph.D., Committee Member
Elizabeth Hill, Ph.D., Committee Member Christopher Lake, Ph.D., Committee Member
July 2019

© Jessa L Youso, 2019
i Acknowledgements
I would like to thank the Department of Psychology at The University of Minnesota
Duluth for the opportunity to expand my education and future career opportunities. Every
member of the faculty offered to spend precious time and energy on making sure I had a
rewarding experience in the program, and I will always be grateful.
To my committee members, Eric Hessler, Chris Lake, and Elizabeth Hill, I would like to
thank you for your patience, advice, and feedback throughout the Plan B process. This
project would never have taken flight without your wealth of knowledge and willingness
to share.
Finally, a very special thank you to Alexandra Luong, for guiding this project, believing
in me, and supporting my educational journey through the years. I will always appreciate
your endless optimism, perseverance, and the excellent advice that made completing my
graduate degree possible. I couldn’t have done it without you.
ii Abstract
This study examined the relationships between individual differences (i.e., personality
traits and trait affect), workgroup emotional climate (WEC), and social cohesion of work
teams. Participants were students at a mid-sized university. Specifically, correlations
between extraversion, agreeableness, conscientiousness, emotional stability, openness,
positive and negative trait affect, and positive and negative WEC were examined using
correlational analyses and hierarchical linear modeling. Group cohesion was assessed as
an outcome variable of WEC. Some individual-level variables significantly related to
WEC and high positive WEC was positively related to cohesion. Implications and future
research are discussed.
iii Table of Contents
List of Tables…………………………………………………………………….………iv
Introduction………………………………………………………………………………..1
Method…..……………………………………………………………………………….18
Analytical Strategy……………………………………………………………………….22
Results……………………………………………………………………………………25
Discussion………………………………………………………………………………..32
References………………………………………………………………………………..40
iv List of Tables
Table 1 Descriptive Statistics…………………………………………………………….26
Table 2 Observational Data……………………………………………………………...27
Table 3 Correlations between Personality/Affect Variables and WEC………………….29
Table 4 Random Coefficients Regression Results……………………………………….31
Table 5 Slopes-as-Outcomes Model Results…………………………………………….32
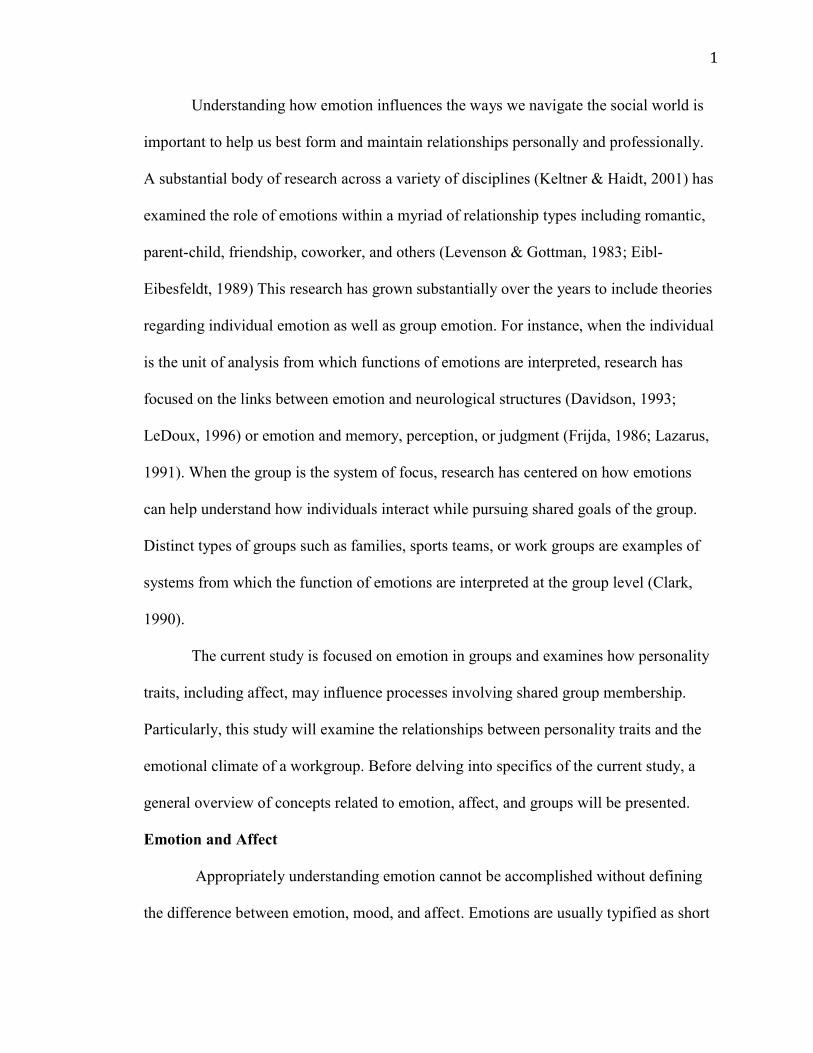
1 Understanding how emotion influences the ways we navigate the social world is
important to help us best form and maintain relationships personally and professionally.
A substantial body of research across a variety of disciplines (Keltner & Haidt, 2001) has
examined the role of emotions within a myriad of relationship types including romantic,
parent-child, friendship, coworker, and others (Levenson & Gottman, 1983; Eibl-
Eibesfeldt, 1989) This research has grown substantially over the years to include theories
regarding individual emotion as well as group emotion. For instance, when the individual
is the unit of analysis from which functions of emotions are interpreted, research has
focused on the links between emotion and neurological structures (Davidson, 1993;
LeDoux, 1996) or emotion and memory, perception, or judgment (Frijda, 1986; Lazarus,
1991). When the group is the system of focus, research has centered on how emotions
can help understand how individuals interact while pursuing shared goals of the group.
Distinct types of groups such as families, sports teams, or work groups are examples of
systems from which the function of emotions are interpreted at the group level (Clark,
1990).
The current study is focused on emotion in groups and examines how personality
traits, including affect, may influence processes involving shared group membership.
Particularly, this study will examine the relationships between personality traits and the
emotional climate of a workgroup. Before delving into specifics of the current study, a
general overview of concepts related to emotion, affect, and groups will be presented.
Emotion and Affect
Appropriately understanding emotion cannot be accomplished without defining
the difference between emotion, mood, and affect. Emotions are usually typified as short
2 in duration, object-oriented, and intense in their experience (Frijda, 1986). In contrast,
moods are generally experienced over a longer period of time with a lower, more
sustainable intensity (Tellegen, Watson, & Clark, 1999). Affect is defined as expressed
mood (Forgas, 1995), and, like moods, can be either positive or negative in orientation.
Importantly, positive or negative affect is different from mood in that affectivity can be
understood as a personality trait that influences the way individuals react to their
environments (Jordan, Lawrence, & Troth, 2006).
Teams Research
An increasing number of organizations are relying on teams (or groups) in the
workplace as the primary resource for accomplishing goals and improving productivity
(Lawler, Mohrman, & Ledford, 1992, Kozlowski & Bell, 2003). This is because factors
such as increasing global competition, merger, and need for innovation put pressure on
organizations to quickly become more adaptive and productive (Kozlowski & Klein,
2000). Teams are useful in addressing these factors, and as a result, organizations have a
vested interest in understanding how groups operate and what can be done to make teams
more productive (Barrick, Stewart, & Mount, 1998).
Throughout this paper, the terms “workgroup”, “group”, and “team” are used
interchangeably because all three terms encompass the same underlying characteristics.
In general, group members identify with one another and are defined by others as being
part of a group (Barrick et al., 1998). Although teams and groups exist in a variety of
sizes and types that range across varying contexts, functions, and processes within
organizations, several key features apply to all groups (Alderfer, 1977; Hackman, 1987;
Hollenbeck, Ilgen, Sego, Hedlund, Major, & Phillips, 1995; Kozlowski, Gully, McHugh,
3 Salas, & Cannon-Bowers, 1996; Kozlowski, Gully, Nason, & Smith, 1999; Salas,
Dickinson, Converse, & Tannenbaum, 1992). Kozlowski and Bell (2003) state that work
teams and groups:
1. Are composed of two or more individuals,
2. Exist to perform relevant organizational tasks,
3. Share common goals,
4. Interact socially,
5. Exhibit task interdependencies,
6. Manage and maintain boundaries, and
7. Are embedded in an organizational context that sets boundaries, constrains the
team, and influences exchanges with other units in or out of the organization.
It is well understood that teams are embedded in an organizational context and the
team itself creates a context for team members (Barrick et al., 1998). More specifically,
the context of an organization influenced by factors such as technology use,
organizational structure, leadership roles, culture, and climate often influences group
behaviors. However, organizational context is not the only influencing factor for a
particular team. Kozlowski and Bell (2003) assert that “team members operate in a
bounded interactive context that they in part create by virtue of their individual attributes,
interactions, and responses” (p. 7). As such, group level expectations, shared perceptions,
and knowledge emerge from those interactions between group members.
As it is the case that events within teams often reflect the type of people who are
its members (George, 1990), considerable research has focused on team composition and
the nature of team members (Barrick et al., 1998). Understanding team composition is of
4 practical and research interest because the combination of member attributes can have a
significant impact on team processes and outcomes. A better understanding of these
effects can help organizations select and build the most effective teams.
The IPO Model
It is important to understand that this research involves the interpretation of a
group as a process. As such, the Input-Process-Output (IPO) model can be utilized to
facilitate understanding of the context of group development. “Many, if not most, models
of team effectiveness are at least loosely formulated around an IPO framework posited by
McGrath (1964)” (Kozlowski & Bell, 2003). Inputs are “the primary cause of processes
that in turn mediate the effect of inputs on outcomes” (McGrath, 1964, p. 537). These
inputs can represent various resources available to the team both internally, such as
composition of knowledge, skills, and abilities of members, personalities, or
demographics, or externally, such as rewards, training, or organizational climate. These
inputs can also contribute to team functioning at multiple levels including the individual,
group, or organizational level.
Further, processes represent mechanisms that either inhibit or enable team
members to be able to combine capabilities and influence behavior (Kozlowski & Bell,
2003). For example, Steiner (1972) focused on dysfunctional processes that yielded
process losses. Conversely, focus on team effectiveness should be able to reveal process
gains. These process gains include, but are not limited to, coordination, cooperation, and
communication. Further, outcomes of these processes represent the criteria used to assess
the effectiveness of teams. By viewing group research through the lens of the IPO model
in this study, we can more clearly understand how individual differences (inputs) may
5 contribute to the formation of the workgroup emotional climate (process), which, in turn,
impacts group cohesion or satisfaction (outputs). While the IPO model lends structure to
many models of team effectiveness that helps to create a significant degree of similarity
across models, important differences do exist, particularly surrounding the view that
processes are caused by input factors (i.e. mediators) or whether the processes are better
understood as moderators that affect the input-to-output link (Kowlowski & Bell, 2003).
The impacts of these differences on this study will be revisited later in the discussion
section of this paper.
Workgroup Emotional Climate (WEC)
In the decades that followed George’s publication of Personality, Affect, and
Behavior in Groups (1990), a growing body of research has focused on group dynamics
and group affective tone in the workplace. Work team members’ affective experiences
and states are implicit in numerous organizational and psychological theories, and
researchers have described a variety of different kinds of affective experiences and have
shown their important roles in work teams’ processes and outcomes (Ashkanasy, Hartel,
& Zerbe, 2000; Brief & Weiss, 2002; Fisher & Ashkanasy, 2000; Muchinsky, 2000). For
instance, George and colleagues showed that not only do group emotions exist, but also
these emotions, which they refer to as “group affective tone,” can influence work
outcomes (George, 1989, 1990; George and Brief, 1992). Barsade, Ward, Turner, &
Sonnenfeld (2000) found that a group's affective diversity also had an effect on team
dynamics. Thus, research on group affect has shown that shared emotions occur in
organizational work teams and that these emotions can be recognized and measured
(Barsade, 2002).
6 Research on team climate has also proved beneficial for understanding complex
group dynamics. Team climate represents group-level shared perceptions of important
contextual factors that affect group functioning. For example, Hofmann and Stetzer
(1996) demonstrated that team safety climate affects team safety behaviors and outcomes.
Further, Anderson and West (1996) developed the Team Climate Inventory as a tool to
improve team innovation. Overall, variations in the extent to which climate is shared at
the team level has been shown to affect its linkage with team outcomes (Gamero,
González-Romá, & Peiró, 2008).
In this study, climate is understood as WEC, or workgroup emotional climate.
Defined as “the shared perceptions of emotions and emotional exchanges that typify a
workgroup” (Liu, Hartel, & Sun, 2014, p. 626), WEC is similar to George’s group
affective tone, but conceptualized and measured differently. Whereas group affective
tone is measured as an aggregate of individual affective responses, WEC measures the
shared perceptions of the emotional climate of a particular group. However, like affective
tone, WEC can be either positive or negative. Liu et al. (2014) developed the Workgroup
Emotional Climate Scale (WECS) using both qualitative and quantitative methodological
approaches to operationalize a multidimensional model of WEC into a valid survey
measure to assess WEC. This WECS utilizes a valence dimension (positive-negative) and
an interpersonal dimension (ego-focused and other-focused) in order to best represent the
social and universal concepts involved in creating the emotional climate in workgroups.
WEC is measured using shared perceptions of employees about their own
workgroup because evidence suggests these perceptions are important predictors of both
the variability in role behavior of group members and in performance within an
7 organization (Zohar & Luria, 2005). Instead of focusing on organizational climate as the
level of analysis, focus is placed on the group level because individuals are more likely to
identify with their proximal workgroup than with an entire organization (Liu et al., 2014).
Additionally, Campion, Medsker, & Higgs (1993) found that shared patterns of
understanding and behavior norms are most likely to develop at the group level, as well.
Over time, workgroups develop a history of shared experiences (Härtel, Härtel, &
Barney, 1998). According to affective events theory (AET), these experiences can shape
behaviors of members of a group by eliciting responses to emotional reactions (Weiss &
Cropanzano, 1996). These responses are then shared among members to form affective
group effects (Barsade & Gibson, 1998). In summary, members transfer their emotional
experiences during group interaction through a number of processes to form affective
group effects. In turn, these affective group effects are combined with other emotional
contexts (i.e., the emotional history of a group, local group norms, or organizational
emotion norms) to form group emotion (Kelly & Barsade, 2001).
Together, the concepts of group affective tone, group affect, and WEC capture the
idea of group emotion. Barsade and Gibson (1998) argue that two approaches (i.e., top
down and bottom-up) can be used to understand group emotion. The top-down approach
views the group as a whole and leads researchers to examine how the feelings and
behaviors of individuals arise from group dynamics. In contrast, the bottom-up approach
examines the ways in which individual level emotions combine at the team level to
influence outcomes, and can be represented by mean level affect, variability in the
composition of affect, and the effects of minimum-maximum team member affect on the
8 group. This study employs the bottom-up strategy as a framework to understand how
particular individual differences may impact group processes.
It is important to note that this research is based on the premise that individual
behaviors influence group behaviors that, in turn, shape the emotional climate of a group.
A significant difference exists between perceptions of group affect and the actual
experience of change within group affect, and the current study is based on the
assumption that behavior change is a reality and influences WEC. Since behavior change
can be observed during important social exchanges, as indicated by Liu et al. (2014), a
behavioral checklist may be an appropriate way to record behaviors during those
important interactions. Bartel and Saavedra (2000) state that a reliable and easily
accessible source of information regarding others’ feelings and attitudes involves
nonverbal behavior, and previous research on facial, vocal, and postural cues support this
claim (Eckman & Davidson, 1994; Kappas, Hess, & Scherer, 1991). Not only will the use
of this checklist help to verify the WEC, it will also help to alleviate concerns of self-
report bias that usually accompany a study that would otherwise rely solely on self-report
measures.
In summary, individual behaviors and exchanges between group members are
important to WEC. However, understanding the traits linked to those behaviors is also
necessary. It is not enough to understand that exchanges influence WEC, but why
individuals are prone to behave in certain ways. Examining the relationships between
specific traits and behaviors is important in order to gather information on how individual
traits can affect WEC.
9 Individual Differences and Teams
Personality. Meta-analyses have consistently demonstrated relationships between
the five factor model (FFM) personality constructs (openness, conscientiousness,
agreeableness, extraversion, and emotional stability) and various individual behaviors
related to performance criteria (Barrick & Mount, 1991; Hough, 1992; Hough, Eaton,
Dunnette, Kamp, & McCloy, 1990; Tett, Jackson, & Rothstein, 1991). Studies like these
are important in order to establish that individual traits influence individual behavior.
However, a main concern for the current study is establishing that individual behaviors
can also influence group behaviors. Barrick et al. (1998) pioneered a study that examined
how individual differences in personality affect group dynamics. One of the focuses of
their study was to determine which personality traits were associated with positive social
interactions, cooperation, and trust within teams. They hypothesized that personality
traits such as agreeableness, extraversion, and emotional stability, which are intrinsically
interpersonal in nature, are associated with team viability, or a team’s capability to
continue working together. Although team viability is not the same as WEC, building
functional interpersonal relationships between team members is crucial among all
concepts.
In addition, research suggests that a single individual can significantly affect a
group (Kenrick & Funder, 1988). In some cases the highest (i.e., maximum method) or
lowest (minimum method) individual team-member score may provide valuable
information beyond what can be understood from calculating the aggregate of the
individual scores. This makes sense because the inputs of the highest ability member are
critical for generating solutions to problems, and the inputs of the lowest ability member
10 may significantly affect the quality of the group work (Steiner, 1972). Therefore,
focusing on the highest or lowest individual-trait score of team members is appropriate in
situations where one person has an inordinate effect on the team. This study explores the
relationships between aggregate levels of individual differences in relation to groups as
well as the impact that only one individual may have on WEC.
Not only is it important to understand the connection between individual
behaviors and team processes, it is also essential to recognize the relationships between
the personality traits and affective traits that influence those individual behaviors. In a
recent study by Letzring and Adamcik (2015), the FFM personality traits were examined
in relation to affective traits. Those researchers found that extraverts are more likely to
experience positive affect (PA) and less likely to experience negative affect (NA).
Individuals low in emotional stability are more likely to experience NA and less likely to
experience PA, while highly agreeable people are less likely to experience NA. If
individual personality traits are related to individual affective traits, it follows that there
could also be a relationship between individual personality traits and group affect.
Additionally, research by Gray (1971) provides a biological explanation for the
relationships between extraversion and positive affectivity, and emotional stability and
negative affectivity. Gray contended that there are two neurologically based motivational
systems responsible for many of the observed behavioral and emotional differences
between extraverted individuals and emotionally unstable individuals. First, the
behavioral activation system (BAS) is a neuronal system thought to regulate behavior in
the presence of signals of reward. Second, the behavioral inhibition system (BIS), is
thought to regulate behavior in the presence of signals of punishment. Gray (1971)
11 suggested that individuals rely on one system more than the other depending on trait
levels of extraversion or emotional stability. Extraversion relates to the rewards system,
while low emotional stability relates to the punishment system. Larsen and Ketelaar
(1991) contend that is it consistent with Gray’s theory to hypothesize that positive and
negative affect are the manifestations of sensitivity to reward and punishment,
respectively. In other words, an individual will experience positive affect when exposed
to signals of reward, and negative affect when exposed to signals of punishment. If
extraverted, that individual is more prone to experience positive affect. In contrast, the
emotionally unstable individual is more susceptible to negative affect.
According to Barrick et al. (1998), agreeable team members are “helpful, friendly,
warm, trusting, and tolerant.” Behaviors related to agreeableness are concerned with the
quality of interpersonal relationships, such as expressing warmth or empathy (DeNeve &
Cooper, 1998). These behaviors are instrumental for developing cooperation in a group.
The more agreeable each member of a team is, the more likely the team is to work
together cooperatively. For example, Graziano, Jensen-Campbell, and Hair (1996) found
that even in tasks designed to elicit conflict, agreeableness was related to less perceived
conflict and more positive perceptions from the "opposing" participants. Additionally, it
should be the case that members with similar levels of agreeableness should have similar
styles of conflict management. This is important because effectively mediating
differences should improve coordination (Jackson, Stone, & Alvarez, 1992) and, in turn,
foster a positive affective climate.
A single disagreeable member also may be enough to undermine the team's
capability to work together, regardless of the level of agreeableness of other team
12 members. A very disagreeable person may make team membership costly in terms of
social rewards (Thibaut & Kelley, 1959) and weaken interpersonal relationships within
the team. This destruction of positive interpersonal relationships would likely undermine
a positive WEC, so it follows that teams with higher scores for the least agreeable
member will more highly positively correlate with a positive WEC.
Hypothesis 1: Teams with higher mean levels of individual agreeableness will
report a more positive WEC.
Hypothesis 2: Teams with higher scores for the least agreeable member will
report a more positive WEC.
As stated above, extraversion is another personality trait that should be related to
WEC. Extraverts are high energy, social, and optimistic. As stated by DeNeve and
Cooper (1998), extraversion includes behaviors focused on the quantity and intensity of
relationships as well as behaviors requiring high energy and those behaviors associated
with seeking excitement. McCrae and Costa (1987) argue that extraversion incorporates a
measure of positive affectivity, and individuals high on positive affectivity are prone to
have an overall sense of well-being and experience more positive emotional states. These
positive emotional states influence our connections with others by enhancing
relationships. Enhanced relationships help to increase communication and cooperation,
which contribute to a more positive WEC. Therefore, it should be the case that teams that
consist of higher extraversion scores should experience a more positive workgroup
emotional climate.
13
Hypothesis 3: Teams with higher mean levels of individual extraversion will
report a more positive WEC.
Finally, research suggests that emotional stability may also affect the team's
capability to continue working together (Letzring & Adamcik, 2015). In the workplace,
emotional stability refers to “an individual’s level of self-confidence and balance with
respect to work, and to the individual’s response to new and ambiguous tasks” (Barrick &
Mount, 1991). In addition, Barrick et al. (1998) state that unstable people tend to
demonstrate more anxiety and negative affect. These people are uncomfortable in
ambiguous work environments and become insecure when placed in such situations. This
leads to decreased self-confidence and increased fear of failure. In fact, Heslin (1964)
concluded that emotional stability is one of the best predictors of team performance
outcomes, particularly of measures associated with cooperation and emotional
consistency. Therefore, higher aggregate levels of emotional stability should lead to a
more relaxed atmosphere that should promote a highly positive WEC.
Hypothesis 4: Teams with higher mean levels of individual emotional stability
will report a more positive WEC.
In contrast, low emotional stability, what Watson and Tellegen (1985) referred to
as negative affectivity, is likely to suppress or inhibit cooperation and undermine a
positive workgroup emotional climate. As evidence of this, George (1990) reported that
14 teams with negative affective tones engaged in less prosocial behavior (r = -.57). Thus,
teams with a greater tendency toward anxiety or negative affectivity are likely to be less
capable of continued positive interactions. However, inclusion of a single team member
who is emotionally unstable may also create a negative affective tone that makes it
difficult for the team to work together.
Hypothesis 5: Teams with higher scores for the least emotionally stable member
will report a more positive WEC.
Trait Affect. As stated earlier, individual differences involving affect can also
influence behavior. Affect can be understood in two ways. Trait affect refers to an
individual’s stable underlying affective disposition (Staw, Bell & Clausen, 1986) whereas
state affect is a shorter-term reaction, which is provoked in a specific context, subject to a
greater degree of fluctuation (Tellegen, 1985). Generally, trait affect is categorized into
positive affect (PA) and negative affect (NA). PA is the degree to which a person exhibits
a high level of enthusiasm, energy, mental alertness, and determination (Watson &
Tellegen, 1985), whereas NA pertains to the extent to which an individual experiences
subjective distress, including irritability, anxiety, or nervousness (Watson & Clark,
1984). PA has been found to be significantly associated with job satisfaction, team
commitment, turnover intentions, absenteeism, and work performance (Cropanzano et al.,
1993; Staw et al., 1986).
Further, research findings have demonstrated a relationship between happiness
and workplace success (Judge, Thoresen, Bono, & Patton, 2001; Wright & Cropanzano,
15 2000). Happy people earn more money, perform better, and commit to more helpful acts
that typically exemplify success at work (DeNeve & Cooper, 1998). As such, it follows
that positive affect leads to improved workplace outcomes. Compared with other
members of a work team, those team members with positive affect should experience
greater well-being, and perceive themselves as “active, self-efficacious, decisive, social,
and positive” (Barsade et al., 2000; McIntyre, Watson, Clark, & Cross, 1991; Watson et
al., 1988). Therefore, a group consisting of members with high PA and diminishing NA
should experience a highly positive WEC.
Hypothesis 6: Teams with higher mean levels of member PA will report a more
positive WEC.
It might also be the case that a group with an individual with high NA will
experience a less positive WEC. Because Watson and Tellegen (1985) likened low
emotional stability to negative affectivity, the same rationale as provided for hypothesis
four is relevant here. An individual high in negative affect is likely to inhibit cooperation
and undermine a positive WEC.
Hypothesis 7: Teams including the member with the lowest NA score will report
a more positive WEC.
Cohesion
In addition to understanding inputs, an important concern for some researchers is
the significance of outcomes related to group processes. Shaw (1981) suggested that there
16 is consistent evidence that group effectiveness, cohesiveness, morale, group motivation,
and communication efficiency are positively related to the composition of such
individual-level attributes as adjustment, emotional control, and emotional stability, and
negatively related to such attributes as depressive tendencies, neuroticism, paranoid
tendencies, and pathology. It has been argued that teams with members who are more
similar affectively will be more comfortable with each other’s interpersonal interactions,
thereby generating more cooperation, trust, social integration, and cohesion (Stokes,
1983). It might be the case that these individual attributes affect WEC, which, in turn,
affects these significant outcomes. For example, Barsade et al. (1998) examined the
dispositional positive affective similarity among members of senior management teams
and found that affective similarity has a positive effect on group outcomes.
One important outcome to be explored in this research is team cohesion. Team
researchers have offered multiple definitions of cohesion. Festinger (1950) defined
cohesiveness as “the resultant of all the forces acting on the members to remain in the
group.” Goodman, Ravlin, and Schminke (1987) defined cohesion as the commitment of
members to the group’s task. However, Evans and Jarvis (1980) concluded that “member
attraction to the group” is the most common definition of cohesion. Mixed results for the
effects of cohesion on performance, however, have led researchers to suggest that it may
be more complicated.
Gross and Martin (1952) described cohesion in terms of two underlying
dimensions, task cohesion and interpersonal cohesion. Task cohesion is defined as a
group’s shared commitment or attraction to the group task or goal, and is thought to
increase commitment to the task and to increase individual effort by group members on
17 the task. Interpersonal cohesion is defined as “the group members’ attraction to or liking
of the group” (Evans & Jarvis, 1980). Interpersonal cohesion is important because it
allows groups to have less inhibited communication and to become more effective in
coordinating group efforts. Interpersonal cohesion seems to be most related to WEC, and,
therefore, is the dimension of cohesion of interest here.
Cohesiveness is important because it can be used to measure the success of a
group. This is the case because a group with higher levels of cohesion is more likely to
keep its members than a group with lower levels of cohesion. A highly cohesive group
develops a greater sense of team spirit and camaraderie. This leads to increased
cooperation between group members. In fact, Barrick et al. (1998) found that teams high
in extraversion and emotional stability had higher levels of social cohesion. As such,
mean individual scores on the WECS will be correlated with mean individual scores from
the cohesiveness scale in order to examine the relationship between WEC and cohesion at
the individual level.
Hypothesis 8: Positive WEC will positively correlate with team cohesion.
Although the ideas regarding the effects of group emotion on team effectiveness
are intriguing, research is necessary to determine the most effective ways of influencing
group outcomes through affect. Kozlowski & Bell (2003) ask the following question: “Is
it best to control group affect by establishing norms, or will it be more effective to select
team members based on affective individual differences?
18 Method
Participants
The sample consisted of 105 undergraduates working in 31 groups of 3-7
members (24 groups of three, 4 groups of four, 2 groups of five, and 1 group of seven)
for a variety of class projects in either the Engineering (59%) or the Psychology (41%)
departments at a mid-sized university in the Midwest. Participants were recruited after
researchers contacted professors utilizing group work in classes. Tasks which students
were required to work on in their groups included lab-based experiments, organizing and
conducting research experiments and creating and presenting methods proposals. Task
length ranged from four weeks to semester-long projects. Data collectors directly
explained the project to the students during class and confidentiality was guaranteed.
Group members who agreed to participate completed the surveys on paper (25.7%) or
electronically through Qualtrics, a survey distributing website (74.3%). The gender split
was 44.8% male and 49.5% female; 81% identified as Caucasian; the ages ranged from
18-50 years old with the majority of responses from ages 18-22 (82.9%); 33% were
freshman, 11.4% were sophomores, 15.2% were juniors, and 34.3% were seniors; and the
majority of the sample declared either Chemical Engineering (50.5%) or Psychology
(40.2%) as an undergraduate major. All participants who completed the five surveys were
compensated with a ten-dollar Amazon gift card for participation in the study.
Thirty-eight groups were initially included in the study; however, seven groups
were dropped because only one individual from each of these groups responded to all five
surveys. The minimum criterion for inclusion in the study was for 50% of group
members to have provided complete responses (V. Rousseau & Aubé, 2010), and is
19 imperative to allow for analysis at a group-level, not solely an individual-level. Further
detail on multi-level analysis is provided in the Analytical Strategy section of this paper.
Measures
Five measures were used in this study: the Goldberg Mini Marker, the Workgroup
Emotional Climate Scale (WECS), the Positive and Negative Affect Schedule (PANAS),
the Observer’s Instrument for Work Group Mood, and the Social Cohesiveness Scale.
Goldberg Mini-Marker. The Goldberg Mini-Marker is a briefer version of
Goldberg’s Unipolar Big Five Markers. The Mini-Marker includes 40 items, and has
been demonstrated to be both valid and reliable, alpha = 0.84, Saucier (1994). In this
study this scale measured moderate internal consistency, alpha = 0.71. This measure
provides a list of adjectives that the participant can identify with which relate to the Big
Five personality traits. Example adjectives include: “kind,” “daring,” and “jealous.”
WECS. The Workgroup Emotional Climate Scale was developed in order to
assess WEC. Liu, Hartel, and Sun (2014) created this this 58-item scale as well as
provided evidence supporting high reliability and validity (alpha levels ranged from .70
to .83, in this study alpha level ranged from .66 to .80. Example items include: “The
dynamics among the members of the team are harmonious,” and “The atmosphere of the
team is boring.” Responses were asked to indicate the extent to which each statement was
true of their workgroup on a 5-point scale ranging from 1 (Not at all) to 5 (Completely).
Note that this scale is dimensional and separated as positive WEC and negative WEC in
analyses.
PANAS. The PANAS is comprised of two mood scales, one that measures PA,
and one that measures NA. This instrument can indicate relationships between positive
20 and negative affect with other variables such as personality traits. Ten descriptors are
used for each scale to define their meanings. Participants are required to respond to this
20-item test using a 5-point scale that ranges from very slightly (1) to extremely (5).
Reliability and validity reported by Watson (1988) was moderately good. The Cronbach
alpha coefficient for the PA Scale was 0.86 (alpha = 0.81 in this study); for the NA scale
was 0.87 (alpha was the same for this study). Example scale items include: “nervous,”
“active,” and “proud.”
Observer’s Instrument for Work Group Mood. This instrument permits
behavioral assessments of different mood states (Bartel & Saavedra, 2000). It consists of
94 behaviors including facial, vocal, and postural indicators in order to adequately assess
the affective state of the observed individual. Two researchers used a portion of the
original behavioral checklist (27 items) while observing interactions among group
members. Sample behaviors on this checklist include: talking a lot, little facial
movement, and body poised to include group members.
Social Cohesiveness Scale. Cohesiveness was assessed using a scale developed
by Stokes (1983). This scale consists of seven items, and participants respond using a 5-
point scale with options ranging from 1 (Strongly Disagree) to 5 (Strongly Agree).
Examples of items include “Team members consistently help each other on the job” and
“The members of this team got along well with each other.” Alpha coefficient was 0.87.
Alpha was .87 in this study, as well.
Procedure
Data collection began in fall of 2015. All participants were informed that
participation in this study was voluntary. It was made clear to students that one or more
21 researchers involved in this study would observe their behaviors in person over the
course of the semester. Distribution of measures was spaced (see timeline below) in order
to alleviate percept-percept inflation.
At Time 1 (within the first week of initial contact), the information sheet was
distributed. An electronic link to the first Qualtrics survey was provided during this time.
Paper copies were distributed when requested. The survey consisted of The Goldberg
Mini-Marker, the PANAS, and demographic questions.
At Time 2 (week two), the second survey consisting of the Workgroup Emotional
Climate Scale was either distributed or made available online.
At Time 3 (week three), the third survey consisting of the Social Cohesiveness
Scale was either distributed or made available online. Also, during this time, in person
observations of all groups occurred. Observation times for each group ranged from four
to six minutes and two independent researchers rated each group. All groups were
observed consecutively during the class period, and no groups were omitted.
At Time 4 (week four), the WECS was distributed for the second and last time.
At Time 5 (week five), the Social Cohesiveness Scale was distributed for the
second and final time. Also, during this week, second observations of the groups
occurred. Observation times for each group ranged from four to six minutes and two
independent researchers rated each group. All groups were observed consecutively during
the class period, and no groups were omitted.
22 Analytical Strategy
Correlational Analysis
A common way to analyze the relationships between individual level variables
and group level variables is to aggregate the scores at the individual level and compare
those mean scores to the group score (Williams & Sternberg, 1988). The underlying
assumption behind this analysis is that a certain amount of a characteristic of an
individual group member increases the level of that characteristic within the group.
According to Barrick et.al (1998), This is particularly important when focusing on
additive group tasks. If groups are performing an additive task, that is a task that requires
the contribution of each team member to produce a successful outcome, mean level (or
aggregate) analysis is applicable. Since all participants in this study were engaged in
group work that culminated in either a series of small group projects or one large
collaboration, an aggregated analysis is relevant. Barrick et. al (1998) utilized this type of
analysis, and since the research hypotheses in this study are heavily influenced by that
work, a similar approach is initially presented here. Personality traits and affective
variables were aggregated and compared to overall WEC score. WEC was also
correlated with cohesion as an outcome variable.
In addition to an aggregated analysis of individual level traits, a second
correlational technique focused on the potential impact of a single individual in the group
(Kenrick & Funder, 1988). Depending on the hypothesis, either the highest or lowest
scores of each group were extracted and correlated with WEC.
Although these correlational analyses are supported by past research, current
research has indicated that this type of analysis addresses between-group variance but
23 does not address within-group variance. Nested data, such as individuals nested within
groups, requires a more sophisticated analytical technique, described in further detail
below, in order to take into account this within-group variance (Robson & Pevalin, 2016).
Multi-Level Modeling
Multi-level modeling, also referred to as hierarchical linear modeling (HLM),
separates between- and within-group variance so that data can be examined from multiple
levels. When the basic assumptions of linearity, normality, and homogeneity of variance
are met, we can examine the behavior of a level one (e.g., the individual-level) outcome
as a function of both level one and level two (e.g., the group-level) predictors (Robson &
Pevalin, 2016). Two types of hierarchical linear models will be tested. The first is the
random-coefficients regression model (Robson & Pevalin, 2016). This model supposes
that each of the individuals in the sample has a different regression model, each with its
own intercept and slope and that these intercepts and slopes are a random sample from a
population of individual parameters. Using this model, we are able to examine the
influence of level-one personality traits on level-one WEC without including a level two
predictor (i.e., WEC or demographic variables). The dependent variable of positive WEC
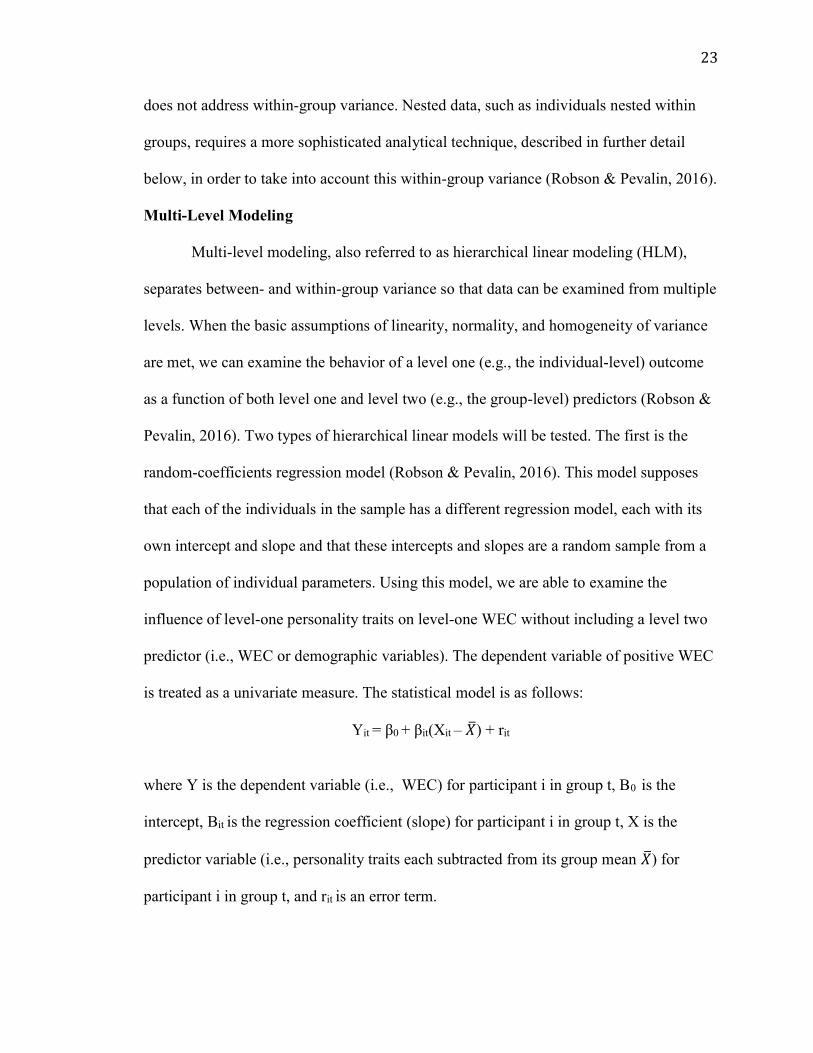
is treated as a univariate measure. The statistical model is as follows:
Yit = β0 + βit(Xit – 𝑋) + rit
where Y is the dependent variable (i.e., WEC) for participant i in group t, B0 is the
intercept, Bit is the regression coefficient (slope) for participant i in group t, X is the
predictor variable (i.e., personality traits each subtracted from its group mean 𝑋) for
participant i in group t, and rit is an error term.
24 The second model to test the relationships between level one and level two
variables in this study is the Slopes-as-Outcomes model. This is different from the
random coefficients model because it includes WEC as a moderator of the relationship
between individual personality traits and group cohesion. When including a group level
outcome (i.e., cohesion) we can assess if the group-level variables (i.e., WEC,
demographic variables) moderate the relationships between the individual-level
personality variables found in the random-coefficients model. Ultimately, this model will
help us to understand if the previously mentioned IPO model is an accurate
representation of the relationships between individual personality characteristics,
workgroup emotional climate, and cohesion. In order to see these relationships more
clearly, the gammas (ϒ) are used like regression weights for the group level variables on
the slopes of the relationships between the individual-level variables and compared. The
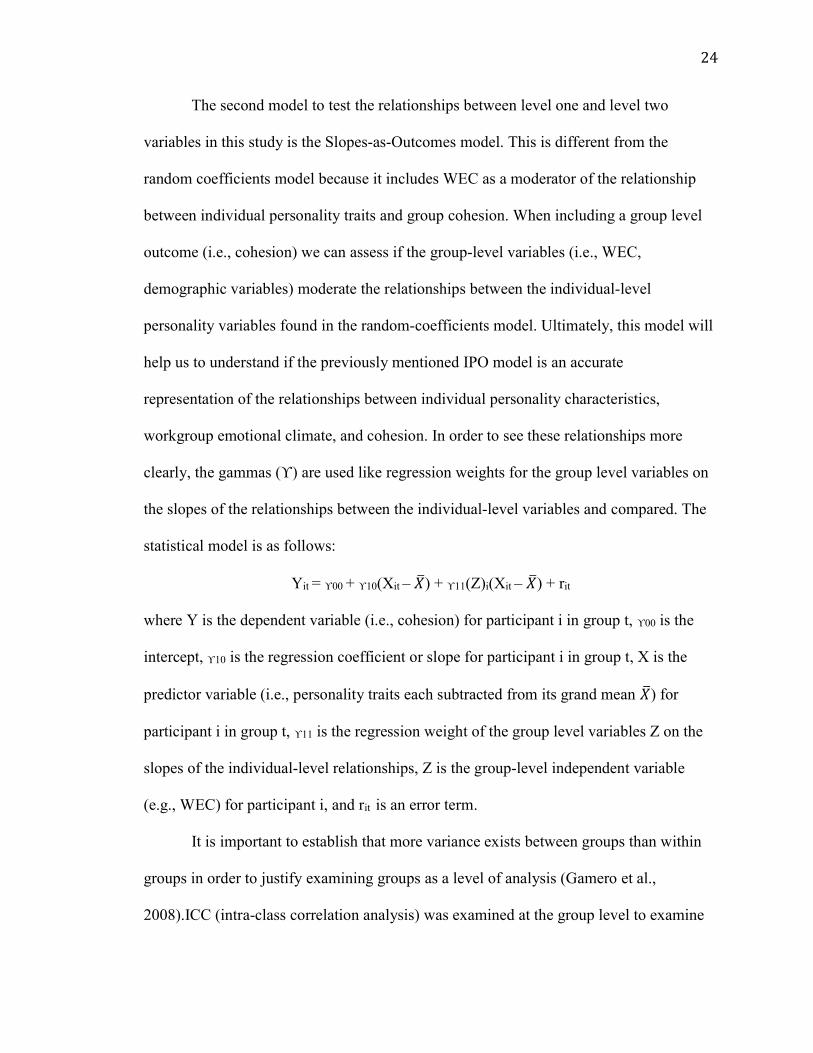
statistical model is as follows:
Yit = ϒ00 + ϒ10(Xit – 𝑋) + ϒ11(Z)i(Xit – 𝑋) + rit
where Y is the dependent variable (i.e., cohesion) for participant i in group t, ϒ00 is the
intercept, ϒ10 is the regression coefficient or slope for participant i in group t, X is the
predictor variable (i.e., personality traits each subtracted from its grand mean 𝑋) for
participant i in group t, ϒ11 is the regression weight of the group level variables Z on the
slopes of the individual-level relationships, Z is the group-level independent variable
(e.g., WEC) for participant i, and rit is an error term.
It is important to establish that more variance exists between groups than within
groups in order to justify examining groups as a level of analysis (Gamero et al.,
2008).ICC (intra-class correlation analysis) was examined at the group level to examine
25 any difference in variance between the group level and the individual level. In addition to
correlational analyses and multilevel modeling, reliability analyses were performed on
the all scales. Cohen’s Kappa was also used to examine inter-rater reliability when using
the Observer’s Instrument for Workgroup mood.
Results
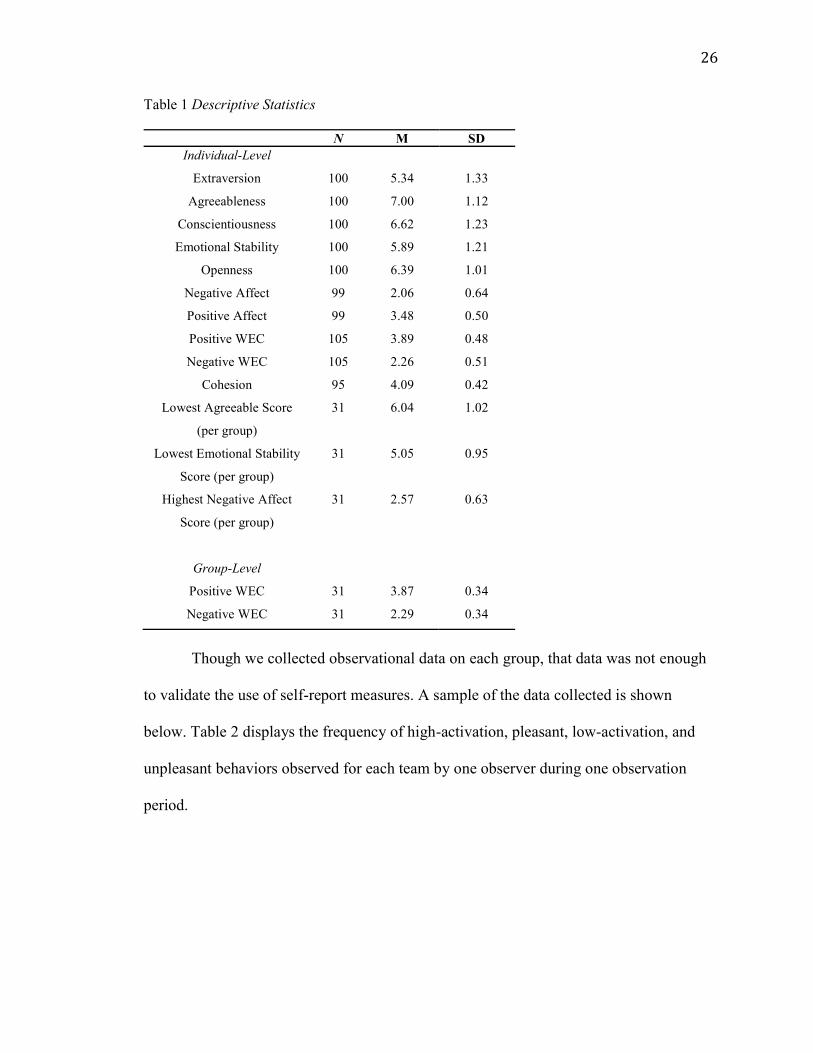
Descriptive Statistics
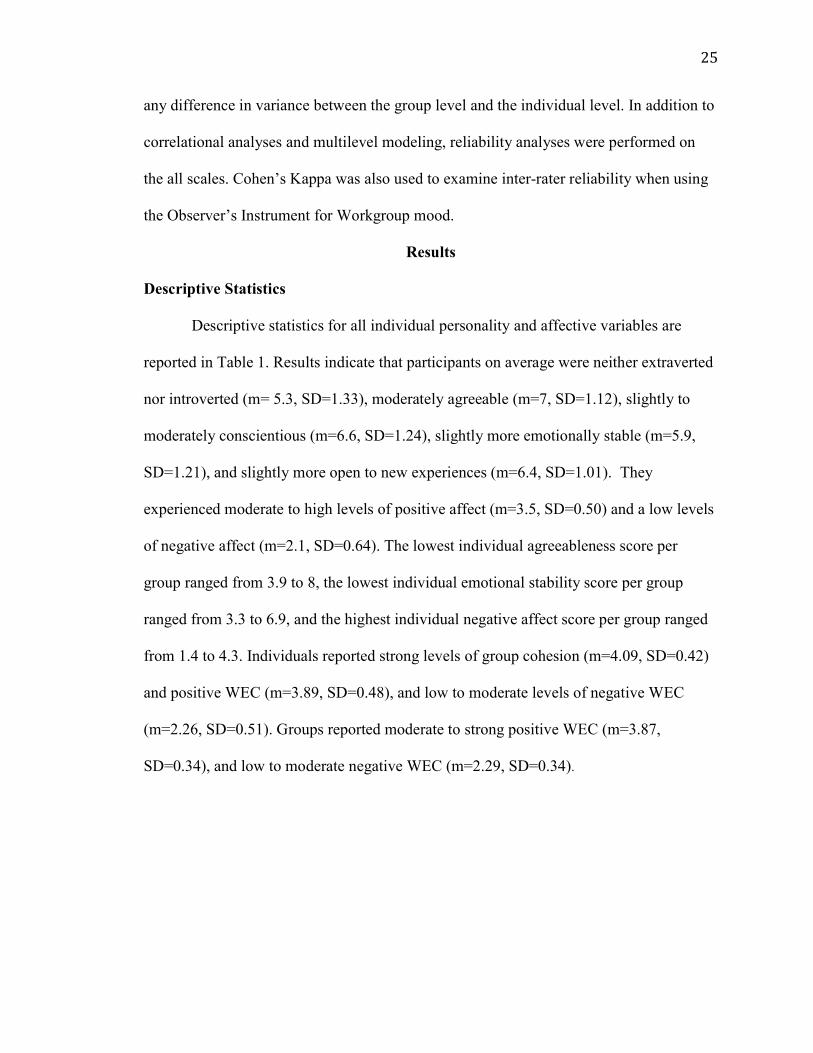
Descriptive statistics for all individual personality and affective variables are
reported in Table 1. Results indicate that participants on average were neither extraverted
nor introverted (m= 5.3, SD=1.33), moderately agreeable (m=7, SD=1.12), slightly to
moderately conscientious (m=6.6, SD=1.24), slightly more emotionally stable (m=5.9,
SD=1.21), and slightly more open to new experiences (m=6.4, SD=1.01). They
experienced moderate to high levels of positive affect (m=3.5, SD=0.50) and a low levels
of negative affect (m=2.1, SD=0.64). The lowest individual agreeableness score per
group ranged from 3.9 to 8, the lowest individual emotional stability score per group
ranged from 3.3 to 6.9, and the highest individual negative affect score per group ranged
from 1.4 to 4.3. Individuals reported strong levels of group cohesion (m=4.09, SD=0.42)
and positive WEC (m=3.89, SD=0.48), and low to moderate levels of negative WEC
(m=2.26, SD=0.51). Groups reported moderate to strong positive WEC (m=3.87,
SD=0.34), and low to moderate negative WEC (m=2.29, SD=0.34).
26 Table 1 Descriptive Statistics
N M SD Individual-Level
Extraversion
Agreeableness
Conscientiousness
Emotional Stability
Openness
Negative Affect
Positive Affect
Positive WEC
Negative WEC
Cohesion
Lowest Agreeable Score
(per group)
Lowest Emotional Stability
Score (per group)
Highest Negative Affect
Score (per group)
Group-Level
Positive WEC
Negative WEC
100
100
100
100
100
99
99
105
105
95
31
31
31
31
31
5.34
7.00
6.62
5.89
6.39
2.06
3.48
3.89
2.26
4.09
6.04
5.05
2.57
3.87
2.29
1.33
1.12
1.23
1.21
1.01
0.64
0.50
0.48
0.51
0.42
1.02
0.95
0.63
0.34
0.34
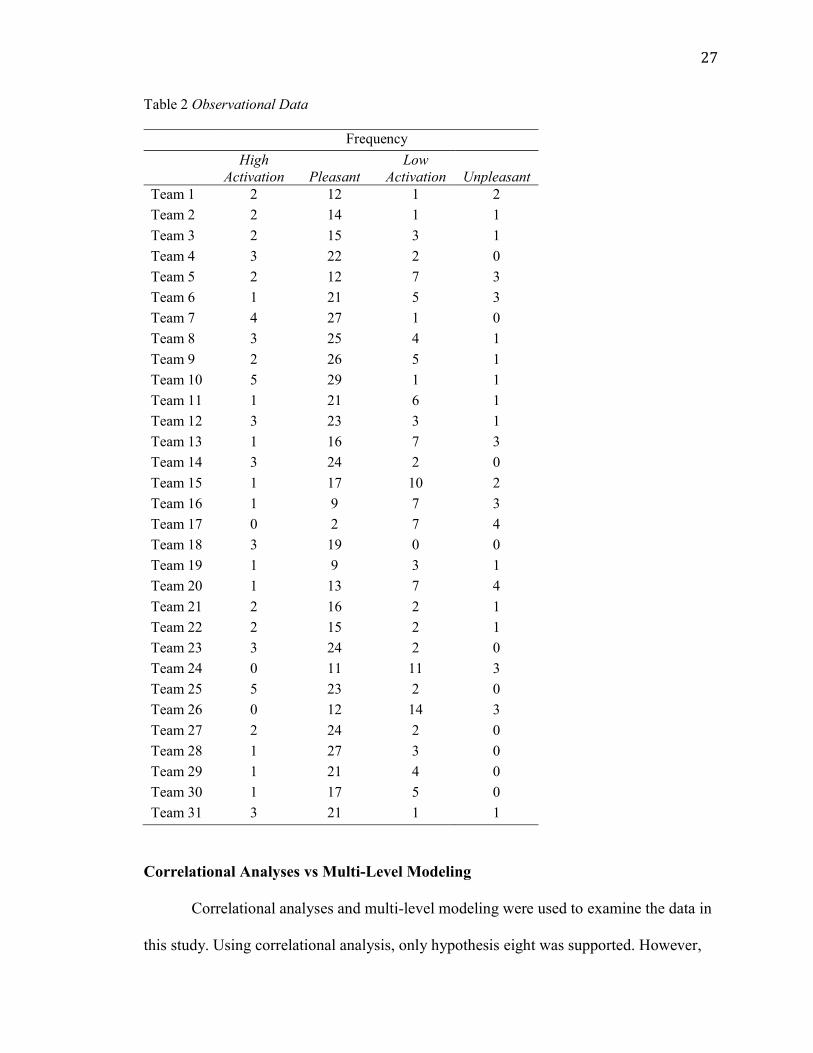
Though we collected observational data on each group, that data was not enough
to validate the use of self-report measures. A sample of the data collected is shown
below. Table 2 displays the frequency of high-activation, pleasant, low-activation, and
unpleasant behaviors observed for each team by one observer during one observation
period.
27 Table 2 Observational Data Frequency High
Activation
Pleasant Low
Activation
Unpleasant Team 1 2 12 1 2 Team 2 2 14 1 1 Team 3 2 15 3 1 Team 4 3 22 2 0 Team 5 2 12 7 3 Team 6 1 21 5 3 Team 7 4 27 1 0 Team 8 3 25 4 1 Team 9 2 26 5 1 Team 10 5 29 1 1 Team 11 1 21 6 1 Team 12 3 23 3 1 Team 13 1 16 7 3 Team 14 3 24 2 0 Team 15 1 17 10 2 Team 16 1 9 7 3 Team 17 0 2 7 4 Team 18 3 19 0 0 Team 19 1 9 3 1 Team 20 1 13 7 4 Team 21 2 16 2 1 Team 22 2 15 2 1 Team 23 3 24 2 0 Team 24 0 11 11 3 Team 25 5 23 2 0 Team 26 0 12 14 3 Team 27 2 24 2 0 Team 28 1 27 3 0 Team 29 1 21 4 0 Team 30 1 17 5 0 Team 31 3 21 1 1
Correlational Analyses vs Multi-Level Modeling
Correlational analyses and multi-level modeling were used to examine the data in
this study. Using correlational analysis, only hypothesis eight was supported. However,
28 results involving personality traits, WEC, and cohesion were also significant. Multi-level
modeling was the second type of analyses conducted and involved two different types of
models: the random-coefficients model and the slopes as outcomes model. Multi-level
modeling yielded significant results for hypothesis six as well as significant results
related to negative WEC and positive and negative affect that were not originally
hypothesized. All mentioned results are outlined below, and implications of these
findings are discussed later in this paper.
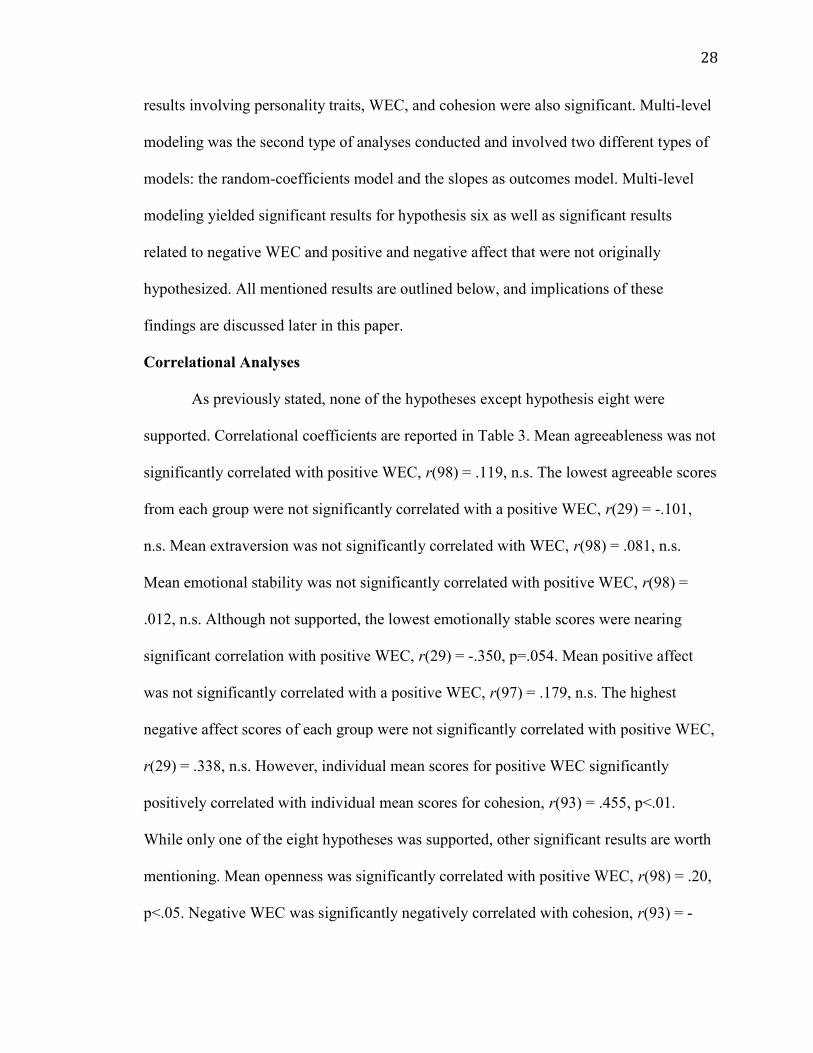
Correlational Analyses
As previously stated, none of the hypotheses except hypothesis eight were
supported. Correlational coefficients are reported in Table 3. Mean agreeableness was not
significantly correlated with positive WEC, r(98) = .119, n.s. The lowest agreeable scores
from each group were not significantly correlated with a positive WEC, r(29) = -.101,
n.s. Mean extraversion was not significantly correlated with WEC, r(98) = .081, n.s.
Mean emotional stability was not significantly correlated with positive WEC, r(98) =
.012, n.s. Although not supported, the lowest emotionally stable scores were nearing
significant correlation with positive WEC, r(29) = -.350, p=.054. Mean positive affect
was not significantly correlated with a positive WEC, r(97) = .179, n.s. The highest
negative affect scores of each group were not significantly correlated with positive WEC,
r(29) = .338, n.s. However, individual mean scores for positive WEC significantly
positively correlated with individual mean scores for cohesion, r(93) = .455, p<.01.
While only one of the eight hypotheses was supported, other significant results are worth
mentioning. Mean openness was significantly correlated with positive WEC, r(98) = .20,
p<.05. Negative WEC was significantly negatively correlated with cohesion, r(93) = -
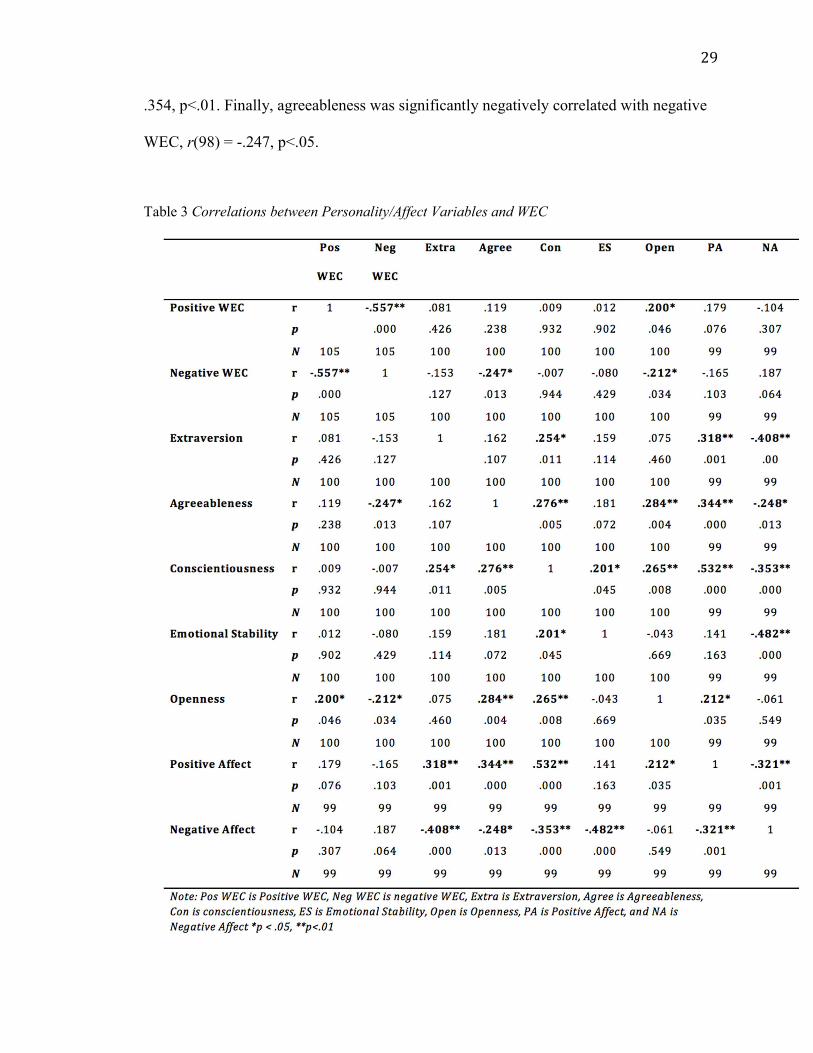
29 .354, p<.01. Finally, agreeableness was significantly negatively correlated with negative
WEC, r(98) = -.247, p<.05.
Table 3 Correlations between Personality/Affect Variables and WEC
30 Multi-Level Modeling
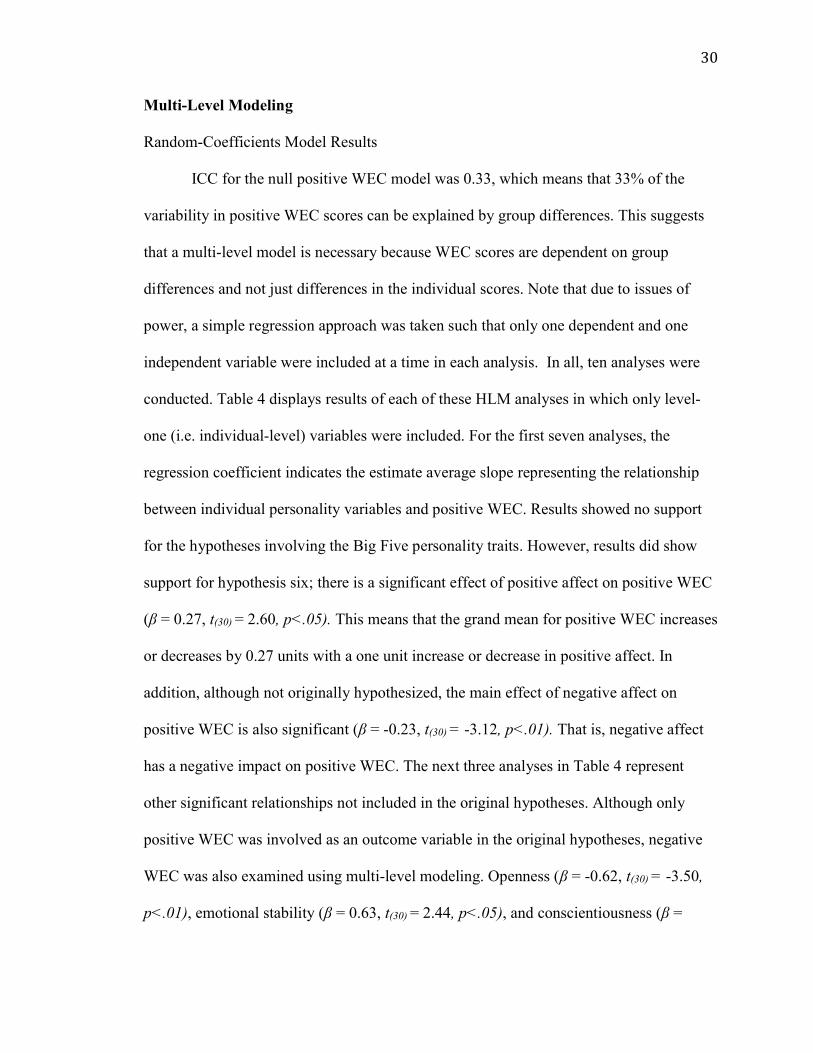
Random-Coefficients Model Results
ICC for the null positive WEC model was 0.33, which means that 33% of the
variability in positive WEC scores can be explained by group differences. This suggests
that a multi-level model is necessary because WEC scores are dependent on group
differences and not just differences in the individual scores. Note that due to issues of
power, a simple regression approach was taken such that only one dependent and one
independent variable were included at a time in each analysis. In all, ten analyses were
conducted. Table 4 displays results of each of these HLM analyses in which only level-
one (i.e. individual-level) variables were included. For the first seven analyses, the
regression coefficient indicates the estimate average slope representing the relationship
between individual personality variables and positive WEC. Results showed no support
for the hypotheses involving the Big Five personality traits. However, results did show
support for hypothesis six; there is a significant effect of positive affect on positive WEC
(β = 0.27, t(30) = 2.60, p<.05). This means that the grand mean for positive WEC increases
or decreases by 0.27 units with a one unit increase or decrease in positive affect. In
addition, although not originally hypothesized, the main effect of negative affect on
positive WEC is also significant (β = -0.23, t(30) = -3.12, p<.01). That is, negative affect
has a negative impact on positive WEC. The next three analyses in Table 4 represent
other significant relationships not included in the original hypotheses. Although only
positive WEC was involved as an outcome variable in the original hypotheses, negative
WEC was also examined using multi-level modeling. Openness (β = -0.62, t(30) = -3.50,
p<.01), emotional stability (β = 0.63, t(30) = 2.44, p<.05), and conscientiousness (β =
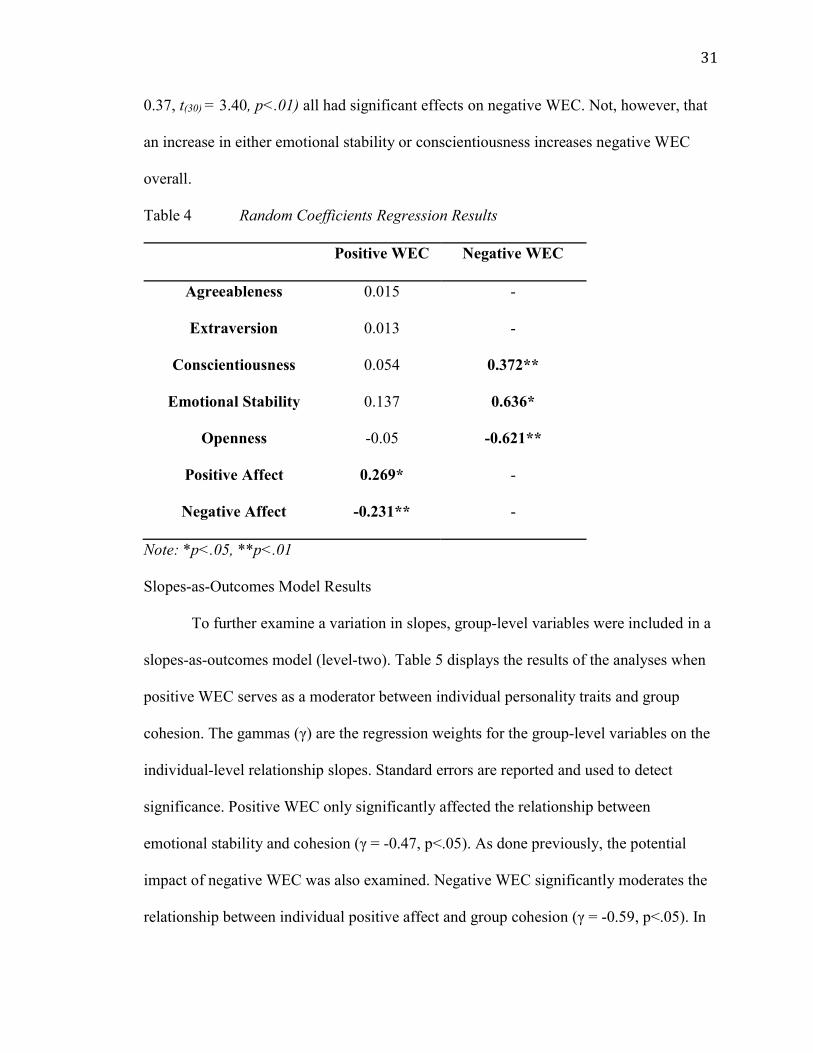
31 0.37, t(30) = 3.40, p<.01) all had significant effects on negative WEC. Not, however, that
an increase in either emotional stability or conscientiousness increases negative WEC
overall.
Table 4 Random Coefficients Regression Results
Positive WEC Negative WEC
Agreeableness 0.015 -
Extraversion 0.013 -
Conscientiousness 0.054 0.372**
Emotional Stability 0.137 0.636*
Openness -0.05 -0.621**
Positive Affect 0.269* -
Negative Affect -0.231** -
Note: *p<.05, **p<.01
Slopes-as-Outcomes Model Results
To further examine a variation in slopes, group-level variables were included in a
slopes-as-outcomes model (level-two). Table 5 displays the results of the analyses when
positive WEC serves as a moderator between individual personality traits and group
cohesion. The gammas (γ) are the regression weights for the group-level variables on the
individual-level relationship slopes. Standard errors are reported and used to detect
significance. Positive WEC only significantly affected the relationship between
emotional stability and cohesion (γ = -0.47, p<.05). As done previously, the potential
impact of negative WEC was also examined. Negative WEC significantly moderates the
relationship between individual positive affect and group cohesion (γ = -0.59, p<.05). In
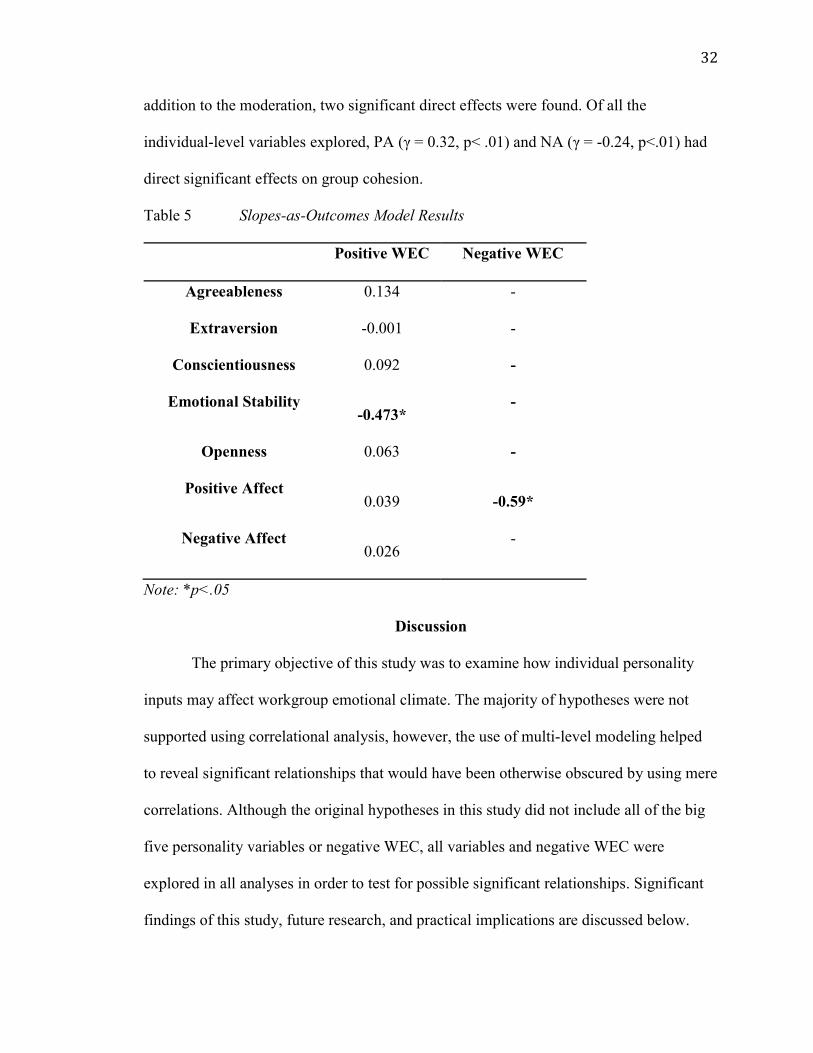
32 addition to the moderation, two significant direct effects were found. Of all the
individual-level variables explored, PA (γ = 0.32, p< .01) and NA (γ = -0.24, p<.01) had
direct significant effects on group cohesion.
Table 5 Slopes-as-Outcomes Model Results
Positive WEC Negative WEC
Agreeableness 0.134 -
Extraversion -0.001 -
Conscientiousness 0.092 -
Emotional Stability -0.473*
-
Openness 0.063 -
Positive Affect 0.039 -0.59*
Negative Affect 0.026
-
Note: *p<.05
Discussion
The primary objective of this study was to examine how individual personality
inputs may affect workgroup emotional climate. The majority of hypotheses were not
supported using correlational analysis, however, the use of multi-level modeling helped
to reveal significant relationships that would have been otherwise obscured by using mere
correlations. Although the original hypotheses in this study did not include all of the big
five personality variables or negative WEC, all variables and negative WEC were
explored in all analyses in order to test for possible significant relationships. Significant
findings of this study, future research, and practical implications are discussed below.
33 As mentioned earlier, organizations, teams, and individuals are bound together in
a multilevel system. Individuals are nested within teams, and teams in turn are linked to
and nested in a larger multilevel system. According to Kozlowski and Klein (2000), this
hierarchical nesting and coupling necessitates the use of multiple levels in efforts to
understand and investigate team phenomena. These issues are especially important for
this study when attributing individual characteristics to a team. Multi-level modeling (the
use of HLM) provided a more precise view of the relationships at play than a simple
correlational analysis.
The first significant finding using multi-level analysis was the relationship
between openness and WEC. It is reasonable to expect that an open individual might be
more likely to help foster a positive group climate by accepting or pursuing new ideas or
opinions that may result in positive group experiences. Since they are open to new
experiences, individuals high in openness might also be more likely to view working with
new members as a positive experience. Although this variable was not included in the
original hypotheses, future studies should examine all possible relationships between the
big five and WEC.
Other significant findings involved individual-level variables and negative WEC.
Examining negative WEC was especially important in this study in order to get a more
complete picture of the relationships between all variables. In addition to openness, both
emotional stability and conscientiousness resulted in significant relationships with
negative WEC. However, those relationships are positive. In other words, the more
emotional stability or conscientiousness in a group, the more likely that group is to report
a more negative WEC overall. These results are directly contrary to the expectation that
34 high levels of emotional stability should lead to positive perceptions of the group, not
negative ones. Perhaps highly conscientious individuals experience a more negative
WEC because they feel that other group members are less willing to put in the necessary
work on group projects. At this point, however, that is speculation and both of those
relationships should be further explored in future studies. It is possible that the modest
sample size common in group research and the variability in team size contributed to
these counter-intuitive findings. Additional research including larger sample sizes of a
diverse population should be conducted in the future.
While significant correlations were not reported between positive affect and
positive WEC or negative affect and negative WEC at the individual-level using a
correlational analysis, the random coefficients model did reveal significant relationships
between both of these individual-level variables and WEC. Positive affect had a
significantly positive relationship with positive WEC, and negative affect had a
significantly negative relationship on positive WEC. This is understandable since positive
affect should lead to more positive feeling about the group in general, and vice versa.
Again, these results are particularly important because they demonstrate the necessity of
using hierarchical linear modeling when examining nested data. The random coefficients
model compared the between-group variance and the within-group variance to assess
significance as opposed to the correlational model that did not take into account any
group relationship. In other words, HLM allows us to view the whole picture at all levels
while correlation can only provide a slice at one level.
Another significant finding was that positive WEC was significantly positively
correlated with cohesion. Increased support for this significant relationship is also
35 demonstrated by the significant negative correlation between negative WEC and
cohesion. Both WEC and cohesion scores were aggregated at the individual-level and
compared. These results support the understanding that positive group climate is
significantly related to positive group outcomes such as cohesion. It is important to
understand the relationships between group climate and outcome variables like cohesion
in order to understand any potential moderating or direct effects involved.
Additional insights on a moderating effect included a significant moderating
effect of positive WEC on the relationship between emotional stability and cohesion in
this study. Again, however, this relationship is negative. That is, positive WEC decreases
the relationship between emotional stability and cohesion. As for the moderating effect of
negative WEC, there was a significant negative moderating effect of negative WEC on
the relationship between positive affect and cohesion. This is understandable as a high
level of negative WEC might override the positive influence of positive affect. It is also
possible that the length of time the groups were together impacted WEC. Changes in
WEC may vary significantly over a longer period of time or individual characteristics
may influence WEC more heavily at particular points in the group development. It may
also be the case that groups who have been together for years will experience WEC
differently than those groups who were only together for months or weeks. Future studies
should examine the relationship between time and WEC more in depth.
The slopes-as-outcomes model revealed that both positive and negative affect had
direct effects on the outcome of cohesion. That is, even without WEC as a moderator,
positive affect has a significantly positive impact on group cohesion while negative affect
has a significantly negative impact on cohesion. Again, both of these relationships are
36 understandable, and expected. Positive affect should help foster a cooperative
environment with less conflict and more cohesion. Negative affect should have the
opposite effect.
While the results indicate that agreeableness was significantly negatively
correlated with negative WEC, the same relationship was not significant using multi-level
modeling. Further, none of the hypotheses involving individual group member impact on
WEC were significant. This does not necessarily mean that one individual does not have
more influence on the development of workgroup emotional climate than others in the
group, but it does indicate that the mechanisms by which one could influence the group
remain unclear.
While the results of this study do contribute to the understanding of individual
inputs, WEC, and group cohesion, further research needs to be done in order to
understand each of these relationships more completely. One way to accomplish this will
be to strive to eliminate self-report bias. Crampton & Wagner (1994) suggest utilizing
other methods of collecting data in order to avoid inflated correlation and self-report bias.
Though we collected observational data on each group, that data was not enough to
validate the use of self-report measures. Additional insights on future studies and
implications are discussed below.
Future Research and Implications
Since the concept of WEC is relatively new, future studies should aim to
understand how WEC forms over time as well as how best to assess the construct across a
diverse population or across groups with varying tasks across time. Future research could
also expand on the mechanisms at work involved with the formation and disbanding of
37 groups and the personal and organizational effects involved with groups with a more
positive or more negative WEC. For instance, research should focus on other possible
output variables including, but not limited to, occupational citizenship behaviors, conflict,
turnover, retention, and collective group intelligence. Cultural differences would also be a
ripe area of study. The current study examined a largely white population of college
students in North America. More research should be done on the impact of culture on the
expression of individual personality variables and the impact of WEC. Similarly, gender
should also be examined. It is possible that groups of only one gender experience WEC
differently than groups of mixed gender. In fact, additional inputs such as gender or
cognitive ability should be examined in order to better understand the development of
WEC and the inputs that might influence it. Hierarchy might also affect WEC in a
substantial way. All groups in the current study consisted of students in the same class.
Status was consistent across the board, but it might be the case that hierarchy has a
significant impact on the development of WEC or other outcome variables associated
with group work.
Future research should also revisit the IPO model. Mentioned earlier in this paper
was the possibility of some important differences in the IPO model regarding the role of
the process as a moderator or mediator. Processes can be caused by input factors (i.e.
mediators) as opposed to conceptualized as contingencies (i.e., moderators) that affect the
input-to-output link (Kozlowski & Bell, 2003). The former point of view is often
represented in small group research and is a large reason that research has focused on
processes that stem from natural patterns of group interaction (Steiner, 1972).
Conversely, the latter approach is more normative and views processes as mechanisms
38 that enable the group to fit patterns of interaction to team task work flows. Essentially, it
allows for these patterns of interaction to affect outcomes through training, leadership, or
other techniques to improve the fit of team processes with task-driven requirements
which, in turn, enhances the outcome of team effectiveness (Kozlowski, Gully, Salas, et
al., 1996). While both avenues provide much opportunity for future research, the
relationships within this study tend to align with the former approach. However, future
research should be done on exactly how WEC affects the IPO process and if the
relationship between WEC and group cohesion would be better conceptualized as a
mediating or moderating relationship.
The statistical analyses conducted in future studies is also important. It is
imperative that researchers consider within-group variability by using multi-level
modeling for nested data. Most significant results in this study were only revealed
through HLM, and future studies should utilize HLM or other multi-level modeling tools
to effectively explore the relationships between all variables while controlling for group
membership.
Finally, with advances in technology, virtual groups are continuing to expand. It
would be appropriate to examine individual inputs as well as group outcomes involved
with teams that do not meet in person regularly, or ever. This type of research could also
include transient groups and explore how individual differences express themselves in
ever changing group situations.
While much opportunity exists for researchers to build on this study in the future,
the results also provide practical implications for organizations. Managers should have a
better understanding of what individual-level variables should be considered when
39 creating and maintaining groups of people. Openness, positive affect, and negative affect
should be examined before creating groups in order to facilitate a positive workgroup
emotional climate. Groups with member scores high in openness and positive affect and
low in negative affect will likely experience a more positive climate and higher levels of
cohesion among members. This is important for managers to recognize so they can re-
arrange work groups that have negative WEC in order to facilitate positive WEC and
higher levels of cohesion among team members.
40 References
Alderfer, C. P. (1977). Group and intergroup relations. In J. R. Hackman & J. L. Suttle
(Eds.), Improving the quality of work life (pp. 227-296). Palisades, CA: Goodyear.
Anderson, N., & West, M. A. (1996). The Team Climate Inventory: Development of the
TCI and its applications in teambuilding for innovativeness. European Journal of
work and organizational psychology, 5(1), 53-66.
Ashkanasy, N. M., Härtel, C. E., & Zerbe, W. J. (Eds.). (2000). Emotions in the
workplace: Research, theory, and practice. Greenwood Publishing Group.
Barrick, M. R., & Mount, M. K. (1991). The big five personality dimensions and job
performance: a meta‐analysis. Personnel psychology, 44(1), 1-26.
Barrick, M. R., Stewart, G. L., Neubert, M. J., & Mount, M. K. (1998). Relating member
ability and personality to work-team processes and team effectiveness. Journal of
Applied Psychology, 83(3), 377-391. doi:http://dx.doi.org/10.1037/0021-
9010.83.3.377
Barsade, S. G. (2002). The ripple effect: Emotional contagion and its influence on group
behavior. Administrative Science Quarterly, 47, 644-675.
Barsade, S. G., & Gibson, D. E. (1998). Group emotion: A view from top and bottom. In
M. A. Neale & E. A. Mannix (Eds.), Research on managing groups and teams
(pp. 81-102). Stanford, CA: JAI Press.
Barsade, S. G., Ward, A. J., Turner, J. D., & Sonnenfeld, J. A. (2000). To your heart's
content: A model of affective diversity in top management teams. Administrative
Science Quarterly, 45(4), 802-836.
41 Bartel, C. A., & Saavedra, R. (2000). The collective construction of work group moods.
Administrative Science Quarterly, 45(2), 197-231. Retrieved from
http://search.proquest.com.libpdb.d.umn.edu:2048/docview/203984003?accountid
=8111
Brief, A. P., & Weiss, H. M. (2002). Organizational behavior: Affect in the
workplace. Annual review of psychology, 53(1), 279-307.
Campion, M. A., Medsker, G. J., & Higgs, A. C. (1993). Relations between work-group
characteristics and effectiveness: Implications for workgroups. Personnel
Psychology, 46, 823-850.
Clark, C. (1990). Emotions and micropolitics in everyday life: Some patterns and
paradoxes of “place.”. Research agendas in the sociology of emotions, 305-333.
Crampton, S. M., & Wagner, J.A. (1994) Percept-percept inflation in microorganizational
research: An investigation of prevalence and effect. Journal of Applied
Psychology, 79(1), 67-76. http://dx.doi.org/10.1037/0021-9010.79.1.67
Cropanzano, R., James, K., & Konovsky, M. A. (1993). Dispositional affectivity as a
predictor of work attitudes and job performance. Journal of Organizational
Behavior, 14(6), 595-606.
Davidson, R. J. (1993). Parsing affective space: Perspectives from neuropsychology and
psychophysiology. Neuropsychology,7(4), 464-475.
doi:http://dx.doi.org/10.1037/0894-4105.7.4.464
DeNeve, K. M., & Cooper, H. (1998). The happy personality: A meta-analysis of 137
personality traits and subjective well-being. Psychological Bulletin, 124(2), 197-
229. doi:http://dx.doi.org/10.1037/0033-2909.124.2.197
42 Dreachslin, J. L., Hunt, P. L., & Sprainer, E. (2000). Workforce diversity: implications
for the effectiveness of health care delivery teams. Social science &
medicine, 50(10), 1403-1414.
Ekman, P, & Davidson, R.J. (1994) The Nature of Emotion: Fundamental
Questions. New York: Oxford University Press.
Eibl-Eibesfeldt, I. (1989). Human ethology Aldine de Gruyter, Hawthorne, NY. Retrieved
from http://search.proquest.com.libpdb.d.umn.edu:2048/docview/617681757?
accountid=8111
Evans, N. J., & Jarvis, P. A. (1980). Group cohesion: A review and reevaluation. Small
group behavior, 11(4), 359-70.
Festinger, L. (1950). Informal social communication. Psychological review,57(5), 271.
Fisher, C. D., & Ashkanasy, N. M. (2000). The emerging role of emotions in work life:
An introduction. Journal of Organizational Behaviour, 21(1), 123-129.
Forgas, J. P. (2008). Affect and cognition. Perspectives on Psychological Science, 3(2),
94-101. doi:http://dx.doi.org/10.1111/j.1745-6916.2008.00067.x
Frijda, N. H. (1986). The emotions. Cambridge University Press.
Gamero, N., González-Romá, V., & Peiró, J. M. (2008). The influence of intra-team
conflict on work teams' affective climate: A longitudinal study. Journal of
Occupational and Organizational Psychology, 81(1), 47-69.
doi:http://dx.doi.org/10.1348/096317907X180441
George, J. M. (1989). Mood and absence. Journal of Applied Psychology, 7 4. Ill-124.
43 George, J. M. (1990). Personality, affect, and behavior in groups. Journal of Applied
Psychology, 75(2), 107-116. doi:http://dx.doi.org/10.1037/0021-9010.75.2.107
George, J. M., & Brief, A. P. (1992). Feeling good-doing good: a conceptual analysis of
the mood at work-organizational spontaneity relationship. Psychological
bulletin, 112(2), 310.
Golembiewski, R. T. (1995). Managing diversity in organizations (Vol. 45879).
University of Alabama Press.
Goodman, P. S., Ravlin, E. C., & Schminke, M. (1987). Understanding groups in
organizations.
Gray, J. A. (1970). The psychophysiological basis of introversion–extraversion.
Behaviour Research and Therapy, 8, 249–266
Graziano, W. G., Jensen-Campbell, L. A., & Hair, E. C. (1996). Perceiving interpersonal
conflict and reacting to it: the case for agreeableness. Journal of personality and
social psychology, 70(4), 820.
Gross, N., & Martin, W. E. (1952). On group cohesiveness. American Journal of
Sociology, 546-564.
Hackman, J. R. (1987). The design of work teams. In J. Lorsch (Ed.), Handbook of
organizational behavior (pp. 315-342). New York: Prentice Hall.
Harrison, D. A., Price, K. H., & Bell, M. P. (1998). Beyond relational demography: Time
and the effects of surface-and deep-level diversity on work group
cohesion. Academy of management journal, 41(1), 96-107.
44 Härtel, C. E. J., Härtel, G. F., & Barney, M. F. (1998). Improving decision-making by
aligning organizational characteristics with decision-making requirements and
training employees in a metacognitive framework for decision-making and
problem-solving. Training Research Journal: The Science and Practice of
Training, 4, 79-101.
Heslin, R. (1964). Predicting group task effectiveness from member
characteristics. Psychological Bulletin, 62(4), 248.
Hinds, P. J., Carley, K. M., Krackhardt, D., & Wholey, D. (2000). Choosing work group
members: Balancing similarity, competence, and familiarity. Organizational
behavior and human decision processes, 81(2), 226-251.
Hofmann, D. A., & Stetzer, A. (1996). A cross-level investigation of factors influencing
unsafe behaviors and accidents. Personnel Psychology, 49(2), 307. Retrieved
from
http://search.proquest.com.libpdb.d.umn.edu:2048/docview/220137942?accountid
=8111
Hollenbeck, J. R., Ilgen, D. R., Sego, D. J., Hedlund, J., Major, D. A., & Phillips, J.
(1995). Multilevel theory of team decision making: Decision performance in
teams incorporating distributed expertise. Journal of Applied Psychology, 80,
292-316.
Hough, L. M. (1992). The 'Big Five' personality variables--construct confusion:
Description versus prediction. Human performance, 5(1-2), 139-155.
45 Hough, L. M., Eaton, N. K., Dunnette, M. D., Kamp, J. D., & McCloy, R. A. (1990).
Criterion-related validities of personality constructs and the effect of response
distortion on those validities. Journal of applied psychology, 75(5), 581.
Jackson, S. E., Stone, V. K., & Alvarez, E. B. (1992). Socialization amidst diversity: the
impact of demographics on work team oldtimers and newcomers. Research in
organizational behavior, 15, 45-109.
Jordan, P. J., Lawrence, S. A., & Troth, A. C. (2006). The impact of negative mood on
team performance. Journal of Management and Organization, 12(2), 131-145
Judge, T. A., Thoresen, C. J., Bono, J. E., & Patton, G. K. (2001). The job satisfaction–
job performance relationship: A qualitative and quantitative review.
Psychological bulletin, 127(3), 376.
Kappas, A., Hess, U., & Scherer, K. R. (1991). 6. Voice and emotion. Fundamentals of
nonverbal behavior, 200.
Kelly, J. R., & Barsade, S. G. (2001). Mood and emotions in small groups and work
teams. Organizational Behavior and Human Decision Processes, 86, 99-130.
Keltner, D., & Haidt, J. (1999). Social functions of emotions at four levels of analysis.
Cognition and Emotion, 13, 505-521.
Kenrick, D. T., & Funder, D. C. (1988). Profiting from controversy: Lessons from the
person-situation debate. American Psychologist, 43(1), 23.
Kochan, T., Bezrukova, K., Ely, R., Jackson, S., Joshi, A., Jehn, K., ... & Thomas, D.
(2003). The effects of diversity on business performance: Report of the diversity
research network. Human resource management, 42(1), 3-21.
46 Kozlowski, S. W. J. & Bell, B. S. (2003). Work groups and teams in organizations. In W.
C. Borman, D. R. Ilgen & R. J. Klimoski (Eds.), Handbook of psychology (Vol.
12): Industrial and Organizational Psychology (333-375). New York: Wiley-
Blackwell.
Kozlowski, S. W. J., Gully, S. M., McHugh, P. P., Salas, E., & Cannon-Bowers, J. A.
(1996a). A dynamic theory of leadership and team effectiveness: Developmental
and task contingent leader roles. In G. R. Ferris (Ed.), Research in personnel and
human resource management (Vol. 14, pp. 253-305). Greenwich, CT: JAI Press.
Kozlowski, S. W. J., Gully, S. M., Nason, E. R., & Smith, E. M. (1999). Developing
adaptive teams: A theory of compilation and performance across levels and time.
In D. R. Ilgen & E. D. Pulakos (Eds.), The changing nature of work performance:
Implications for staffing, personnel actions, and development (pp. 240-292). San
Francisco: Jossey-Bass
Kozlowski, S. W. J., & Klein, K. J. (2000). A multilevel approach to theory and research
in organizations: Contextual, temporal, and emergent processes. In K. J. Klein &
S. W. J. Kozlowski (Eds.), Multilevel theory, research, and methods in
organizations: Foundations, extensions, and new directions (pp. 3-90). San
Francisco, CA: Jossey-Bass.
Larsen, R. J., & Ketelaar, T. (1991). Personality and susceptibility to positive and
negative emotional states. Journal of Personality and Social Psychology, 61(1),
132-140. doi:http://dx.doi.org/10.1037/0022-3514.61.1.132
47 Lawler, E. E., Mohrman, S. A., & Ledford, G. E. (1992). Employee involvement and
total quality management: Practices and results in Fortune 1000 companies. San
Francisco: Jossey-Bass.
Lazarus, R. S. (1991). Progress on a cognitive-motivational-relational theory of
emotion. American psychologist, 46(8), 819.
LeDoux, J. (1996). Emotional networks and motor control: a fearful view. Progress in
brain research, 107, 437-446.
Letzring, T. D., & Adamcik, L. A. (2015). Personality traits and affective states:
Relationships with and without affect induction. Personality and Individual
Differences, 75, 114-120. doi:http://dx.doi.org/10.1016/j.paid.2014.11.011
Levenson, R. W., & Gottman, J. M. (1983). Marital interaction: Physiological linkage
and affective exchange. Journal of Personality and Social Psychology, 45(3),
587-597. doi:http://dx.doi.org/10.1037/0022-3514.45.3.587
Liu, X., Härtel, C.,E.J., & Sun, J. J. (2014). The workgroup emotional climate scale:
Theoretical development, empirical validation, and relationship with workgroup
effectiveness. Group & Organization Management, 39(6), 626. Retrieved from
http://search.proquest.com.libpdb.d.umn.edu:2048/docview/1625907644?accounti
d=8111
McCrae, R. R., & Costa, P. T. (1987). Validation of the five-factor model of personality
across instruments and observers. Journal of personality and social
psychology, 52(1), 81.
McGrath, J. E. (1964). Toward a “theory of method” for research on organizations. New
perspectives in organization research, 533, 533-547.
48 McIntyre, C. W., Watson, D., Clark, L. A., & Cross, S. A. (1991). The effect of induced
social interaction on positive and negative affect. Bulletin of the Psychonomic
Society, 29(1), 67-70.
Muchinsky, P. M. (2000). Emotions in the workplace: The neglect of organizational
behavior. Journal of Organizational Behavior.
Robson, K., & Pevalin, D. (2016). Multilevel modeling in plain language. Los Angeles,
CA: Sage.
Rousseau, V., & Aubé, C. (2010). Team self-managing behaviors and team effectiveness:
The moderating effect of task routineness. Group & Organization Management,
35, 751-781.
Salas, E., Dickinson, T. L., Converse, S. A., & Tannenbaum, S. I. (1992). Toward an
understanding of team performance and training. In R. W. Swezey & E. Salas
(Eds.), Teams: Their training and performance (pp. 3-29). Norwood, NJ: Ablex
Saucier, G. (1994) Mini-markers: A brief version of Goldberg’s unipolar big-five
markers. Journal of Personality Assessment, 63(3), 506-516.
Shaw, M. E. (1981). Group dynamics: The social psychology of small group behavior.
Staw, B. M., Bell, N. E., & Clausen, J. A. (1986). The dispositional approach to job
attitudes: A lifetime longitudinal test. Administrative Science Quarterly, 56-77.
Steiner, I. D. (1972). Group process and productivity. New York: Academic Press.
Stokes, J. P. (1983). Components of group cohesion intermember attraction, instrumental
value, and risk taking. Small Group Research, 14(2), 163-173.
Tellegen, A. (1985). Structures of mood and personality and their relevance to assessing
anxiety, with an emphasis on self-report.
49 Tellegen, A., Watson, D., & Clark, L. A. (1999). On the dimensional and hierarchical
structure of affect. Psychological Science, 10(4), 297-303.
Tett, R. P., Jackson, D. N., & Rothstein, M. (1991). Personality measures as predictors of
job performance: a meta‐analytic review. Personnel psychology,44(4), 703-742.
Thibaut, J. W., & Kelley, H. H. (1959). The social psychology of groups.
Weiss, H. M., & Cropanzano, R. (1996). Affective events theory: A theoretical
discussion of the structure, causes and consequences of work. Research in
Organizational Behavior, 18, 1-74.
Watson, D., & Clark, L. A. (1984). Negative affectivity: the disposition to experience
aversive emotional states. Psychological bulletin, 96(3), 465.
Watson, D., Clark, L. A., & Tellegen, A. (1988). Development and validation of brief
measures of positive and negative affect: the PANAS scales. Journal of
personality and social psychology, 54(6), 1063.
Williams, K. Y., & O'Reilly, C. A. (1998). Demography and diversity in organizations: A
review of 40 years of research. Research in organizational behavior, 20, 77-140.
Williams, W. M., & Sternberg, R. (1988). Group intelligence: Why some groups are
better than others. Intelligence, 12, 351-377.
Wright, T. A., & Cropanzano, R. (2000). Psychological well-being and job satisfaction as
predictors of job performance. Journal of occupational health psychology, 5(1),
84.
Zohar, D., & Luria, G. (2005). A multilevel model of safety climate: Cross-level
relationships between organization and group-level climates. Journal of Applied
Psychology, 70, 423-433.