Embed Size (px)
Citation preview
Metabolism of Nicotine and the Tobacco Carcinogen 4-(methylnitrosamino)-1-(3-pyridyl)-1-butanone (NNK): Genetic and Phenotypic Variation
A DISSERTATION SUBMITTED TO THE FACULTY OF THE GRADUATE SCHOOL
OF THE UNIVERSITY OF MINNESOTA BY
Jeannette Zinggeler Berg
IN PARTIAL FULFILLMENT OF THE REQUIREMENTS FOR THE DEGREE OF
DOCTOR OF PHILOSOPHY
Sharon E. Murphy, PhD; Advisor
October 2009

© Jeannette Zinggeler Berg 2009
i
ACKNOWLEDGEMENTS
First and foremost, I thank Dr. Sharon Murphy -- I am thankful and honored that you indulged me with your wisdom and guidance. You’ve shared your bountiful knowledge of enzymes, metabolism, and analytical approaches with me and have challenged me to think and communicate as a biochemist. From deciding on which scientific questions to pursue to the design and execution of specific experiments you’ve allowed me to make mistakes and have patiently helped me to learn from them, thus substantially developing my independence as a research scientist. Also, I have learned from how you lead your laboratory: you ask probing questions about the experiments being conducted, have reasonable expectations, and care about each person as an individual.
In addition, I thank my PhD thesis committee members Dr. John Lipscomb (chair), Dr. Alex Lange, and Dr. Tim Tracy for their academic guidance, insightful scientific feedback, as well as time contributed to meeting with me, attending seminars, and reading this thesis.
I thank present and former members of the Murphy lab for their unwavering camaraderie. The many hours I’ve spent in the lab have been particularly enjoyable because it is a fun and interesting group. To Linda, Kari, and Gwen: thank you also for answering my questions, offering the occasional unsolicited but needed advice, and sharing protocols, reagents, and lab duties. Linda you have been a steadfast supporter and a wonderful friend throughout; thanks for everything, from guiding me through LC/MS experiments to unexpectedly landing me a beautiful horse! Val, we were thrilled that you joined our group, and I hope you may have another counterpart soon ☺ I’ve had help from a truly amazing group of undergraduates and pre-meds -- I thank Katie Lee, Jodi Blustin, Jessica van Lengerich, and Natalie Weisensel (what a powerhouse of energy and intellect!) I owe a huge debt of gratitude to Elizabeth Thompson, Katie Wickham, and Nicole Thomson for their leading roles in analyzing and organizing several hundred samples for the nicotine metabolism studies. I thank Cassie Retzlaff for spending a good part of her summer in the lab, and quickly becoming a knowledgeable and productive member of the TTURC group. Also, I thank Greg Blaufuss and Aleks Knezevich for assisting with analyzing samples. I thank Angela Boettcher for expertly managing the nicotine patch data before moving on to sunny California. The in vivo metabolism studies are definitely the ‘team sport’ of the Murphy lab and we’ve got a strong pass, shoot, score, game.
I am grateful for the friendship and generous support of many cancer center neighbors! I especially acknowledge and thank Drs. Chris Pennell, Stephen Hecht, and Tucker LeBien for being fantastic scientific role-models and also for kindly allowing me frequent use of their space, instrumentation, and occasional reagents. I thank Peter Villalta and Brock Matter, Steve Carmella, Brad Hochalter, Michelle Jund, and Sonja Nodland for their expert advice in mass spectrometry, HPLC, chemistry, molecular biology, and cell biology respectively. I thank Bob Carlson for helping me at a
ii
moment’s notice, whether it’s to solve a computer problem, to edit a document, or to clarify an order issue. I thank Sabine Fritz for being quick and resourceful about addressing any facility issue. The Cancer Center is a remarkable place, and it seems to me that under the leadership of Dr. John Kersey, a culture of scientific altruism developed and it is flourishing.
I thank Dr. Hatsukami for her interest in and support of the nicotine metabolism biomarker studies. I thank Joni Jensen for promptly answering my questions about study participants, protocols, and for helping me to find data.
I thank Drs. Tim Tracy and Rory Remmel and their lab members for welcoming Val and I to friday journal club; I always learn from discussions with your group! I also thank Dr. Tracy for kindly allowing me to come to the lab to perform reduced CO difference spectra and for the gift of chaperone plasmids.
I thank the University of Minnesota MD/PhD program for encouragement throughout the PhD phase: Dr. Tucker LeBien, Dr. Peter Bitterman, Susan Shurson, Nick Berg, and Sandi Sherman. MSTP (T32-GM08244)
There are several labs beyond the University of Minnesota that have generously provided me with biologic reagents. I thank Dr. Emily Scott and Natasha DeVore, Univ. of Kansas, for collaborating with us on assessing CYP2A7 activity and for our discussions relating to this effort. I thank Dr. Philip Lazarus, Penn State Univ., for UGT2B7-expressing HEK cells; Dr. Robert Tukey, Univ. of California San Diego, for UGT1A9 plasmid; and Dr. Moshe Finel, Univ. of Helsinki, for UGT2B17 plasmid.
I acknowledge funding support from: (1) Ruth L. Kirschtein National Research Service Award Individual Fellowship, Title: P450-mediated Nicotine Metabolism (F30DA020968), National Institute on Drug Abuse; (2) Biochemistry, Molecular Biology, and Biophysics; (3) Dr. Jasjit Ahluwalia, Office of Clinical Research.
I acknowledge the encouragement of my husband and family to pursue my dreams.
I am deeply grateful to my parents, Margrit and Robert, for nurturing my interest in all things biological, and for emphasizing education as a critical means to understanding the living world better. Bringing home toads and turtles turned into trips to the herpetological society meetings and other opportunities, such as looking at whatever would fit (and stay) on the slide of our microscope. Therefore, I especially acknowledge your long-standing support of my science education. My brother Yves is always an inspiration to me, in no small part for being unequivocally more focused, organized, disciplined, and ambitious. To my husband, I thank you for believing in me, for valuing my goals, and for being selflessly accommodating. I couldn’t imagine being more in love or feeling more loved and this is a deep source of happiness for me – you are a miracle in my life.
iii
DEDICATION
To my loving husband Michael Berg, in memory of Russell Berg, for sharing with me the hope and expectation that research will yield insights to better
prevent and treat lung cancer
iv
ABSTRACT
Nicotine is the addictive agent in tobacco and differences in nicotine metabolism
may affect tobacco use, and consequently exposure to tobacco carcinogens. A lung
procarcinogen in tobacco is 4-(methylnitrosamino)-1-(3-pyridyl)-1-butanone (NNK)
and its carcinogenic effect is dependent on metabolic activation and is counter-balanced
by metabolic detoxification. Nicotine and NNK are structurally related and both are
metabolized by cytochrome P450 (P450), UDP-glucuronosyltransferase (UGT), and
flavin-monoxygenase (FMO) enzymes. The goal of this thesis research was to explore
variation in nicotine metabolism in vivo and to probe specific enzyme-catalyzed
reactions of NNK in vitro.
The role of glucuronidation on variation in nicotine metabolism and smoking
behavior is not well characterized. In a controlled dose study of ethnic differences in
nicotine metabolism (n= 93 smokers), African Americans excreted 30-40 % less
nicotine and cotinine as their glucuronide conjugates than European Americans. This
difference in glucuronidation explained the higher free cotinine concentrations observed
in African Americans compared to European Americans in the controlled dose setting.
The most efficient in vitro catalyst of nicotine and cotinine glucuronidation is
UGT2B10. In human liver microsomes (n=28), UGT2B10 genotype for the Asp67Tyr
polymorphism was a better predictor of glucuronidation than ethnicity. Subsequently,
we demonstrated that UGT2B10 contributes to in vivo nicotine metabolism in a
genotype-phenotype analysis of 325 smokers. Individuals who were heterozygous for
the UGT2B10 Asp67Tyr allele excreted less nicotine or cotinine as their glucuronide
v
conjugates than wild-type; the ratio of cotinine glucuronide:cotinine was decreased by
60 %, while increases in urinary and plasma cotinine and trans-3'-hydroxycotinine were
observed. Strikingly, a robust biomarker of nicotine intake, nicotine equivalents, were
lower among Asp67Tyr heterozygotes compared to individuals without this allele; 58.2
nmol/ml (95 % CI, 48.9 – 68.2) versus 69.2 nmol/ml (95 % CI, 64.3 – 74.5).
Individuals with low activity UGT2B10 may smoke less intensely, as reported for
individuals with CYP2A6 polymorphisms that cause decreased nicotine C-oxidation.
In contrast to nicotine, NNK is a carcinogen. It is metabolized to reactive
intermediates that can form DNA and protein adducts, or it is detoxified by
glucuronidation. P450 2A13 is the most efficient catalyst of NNK oxidation. We
explored the effect of an active site mutant, Asn297Ala, on enzyme function and found
that loss of hydrogen bonding to substrate in the active site affected substrate
orientation and product formation. The orphan P450 2A7 was considered as a potential
catalyst for NNK oxidation, but expression of wild-type or two naturally-occurring
variants failed to yield protein with a P450 spectra and no appreciable activity towards
P450 2A substrates was observed. Preliminary experiments were conducted to search
for the glucuronide conjugate formed from the unstable oxidation product α-
hydroxymethyl NNK, which has not been identified in any human system.
The extent to which variation in metabolism mediates smoking behavior and cancer
risk warrants consideration. The enzymes involved are potential drug targets for
smoking cessation pharmacotherapy and cancer chemoprevention.
vi
TABLE OF CONTENTS
List of Figures.................................................................................................... xiii
List of Tables ...................................................................................................... xv
Chapter 1: Introduction...................................................................................... 1
1.1 Tobacco use and health consequences ..................................................... 1
1.2 Tobacco use and cancer .......................................................................... 3
1.3 Nicotine and tobacco use ........................................................................ 4
1.4 4-(methylnitrosamino)-1-(3-pyridyl)-1-butanone .................................... 6
1.5 Other tobacco constituents ...................................................................... 7
1.6 Cytochrome P450 enzymes (P450s) ........................................................ 8
1.7 UDP glucuronsyl transferase enzymes (UGTs) ..................................... 12
1.8 Flavin monooxygenase enzymes (FMOs).............................................. 16
1.9 Regulation of P450s, UGTs, and FMOs ................................................ 19
1.10 Goals of thesis research........................................................................ 21
Chapter 2: Ethnic differences in nicotine metabolism..................................... 22
2.1 Introduction ......................................................................................... 22
2.2 Methods................................................................................................ 30
2.2.1 Patch Study ................................................................................... 30
2.2.2 Chemicals and reagents ................................................................. 32
vii
2.2.3 Nicotine metabolite analysis.......................................................... 32
2.2.4 Statistics........................................................................................ 33
2.3 Results .................................................................................................. 34
2.3.1 Patch study population .................................................................. 34
2.3.2 Nicotine metabolism on the patch.................................................. 35
2.3.3 Baseline nicotine metabolism ........................................................ 44
2.4 Discussion ............................................................................................ 45
2.5 Conclusions .......................................................................................... 49
2.6 Acknowledgements............................................................................... 50
2.7 Publication of thesis work .................................................................... 50
Chapter 3: UGT2B10 genotype and nicotine metabolism .............................. 51
3.1 Introduction .......................................................................................... 51
3.2 Methods ............................................................................................... 59
3.2.1 Tobacco Reduction Intervention Project (TRIP).............................. 59
3.2.2 Human liver tissue source ............................................................... 59
3.2.3 Chemicals and reagents ................................................................... 59
3.2.4 Nicotine and metabolite analysis ..................................................... 60
3.2.5 UGT2B10 Haplotyping ................................................................... 60
3.2.6 Nicotine glucuronidation by human liver microsomes (HLMs)........ 61
3.2.7 Statistics.......................................................................................... 62
3.3 Results.................................................................................................. 63
3.3.1 In vitro nicotine glucuronidation by human livermicrosomes .......... 63
viii
3.3.2 In vivo glucuronidation and UGT2B10 haplotype – ethnic .............. 64
3.3.3 In vivo glucuronidation and UGT2B10 haplotype – TRIP study...... 65
3.4 Discussion ............................................................................................ 68
3.5 Conclusions .......................................................................................... 71
3.6 Acknowledgments ................................................................................ 71
3.7 Publication of thesis work..................................................................... 71
Chapter 4: Nicotine metabolite profiling including nicotine-N-oxide and
UGT2B10 genotype ........................................................................................... 72
4.1 Introduction .......................................................................................... 72
4.2 Methods................................................................................................ 74
4.2.1 Study population and protocol......................................................... 74
4.2.2 Nicotine and metabolite analysis ..................................................... 76
4.2.3 UGT2B10 Genotyping .................................................................... 77
4.2.4 Statistics.......................................................................................... 77
4.3 Results.................................................................................................. 78
4.3.1 Study population ............................................................................ 78
4.3.2 Urinary nicotine and its metabolites ................................................ 79
4.3.3 Urinary excretion of nicotine-N-oxide ............................................. 82
4.3.4 Plasma nicotine and metabolites...................................................... 84
4.3.5 Cluster analysis of urinary nicotine and metabolites ........................ 84
4.3.6 Nicotine equivalents as a pathway independent biomarker .............. 85
4.3.7 Effect of nicotine equivalents on metabolite ratios ........................... 89
ix
4.3.8 Metabolite ratios by UGT2B10 genotype ........................................ 91
4.3.9 Nicotine equivalents by UGT2B10 genotype................................... 91
4.4 Discussion ............................................................................................ 95
4.5 Conclusions .........................................................................................100
4.6 Acknowledgements..............................................................................100
4.7 Publication of thesis work....................................................................101
Chapter 5: Cytochrome P450 2A7...................................................................102
5.1 Introduction .........................................................................................102
5.2 Methods...............................................................................................110
5.2.1 Source of liver tissue and preparation of cDNA..............................110
5.2.2 PCR to detect CYP2A7 – partial sequence amplification................111
5.2.3 PCR amplification of full-length 2A7 and blunt-end cloning ..........111
5.2.4 Cloning into expression vectors......................................................112
5.2.5 Expression in E. Coli......................................................................113
5.2.6 Truncated CYP2A7 mutant ............................................................114
5.2.7 Expression in human embryonic kidney fibroblasts (293T cells) ....114
5.2.8 Protein expression evaluation .........................................................114
5.2.9 Activity assessment........................................................................115
5.3 Results.................................................................................................115
5.3.1 CYP2A7 cloning and isolation .......................................................115
5.3.2 CYP2A7 expression.......................................................................119
5.3.3 Reduced CO-difference spectra ......................................................122
x
5.3.4 Activity assays ...............................................................................122
5.4 Discussion ...........................................................................................123
5.5 Conclusions .........................................................................................124
5.6 Acknowledgements..............................................................................124
Chapter 6: Effect of P450 2A13 Asn297Ala active site mutation ..................125
6.1 Forward ...............................................................................................125
6.2 Introduction .........................................................................................126
6.3 Methods...............................................................................................132
6.3.1 Chemicals and Reagents.................................................................132
6.3.2 Site-Directed Mutagenesis..............................................................132
6.3.3 Protein Expression and Purification................................................133
6.3.4 Protein Characterization and Enzyme Reconstitution......................133
6.3.5 Coumarin Metabolism....................................................................134
6.3.6 LC/MS/MS analysis of coumarin metabolites.................................135
6.3.7 Statistics.........................................................................................136
6.3.8 Computer Modeling and Docking ..................................................137
6.4 Results.................................................................................................137
6.4.1 CYP2A13 Asn297Ala expression...................................................137
6.4.2 14C-coumarin metabolism...............................................................138
6.4.3 Trapping coumarin 3,4-epoxide as its GSH conjugate ....................139
6.4.4 Coumarin metabolism by UV-HPLC and LC/MS ..........................141
6.4.5 Kinetic parameters for Asn297A and wild-type P450 2A13............144
xi
6.4.6 Modeling coumarin orientation in the active site ............................144
6.5 Discussion ...........................................................................................146
6.6 Conclusions .........................................................................................149
6.7 Acknowledgements..............................................................................149
6.8 Publication of thesis work....................................................................150
Chapter 7: Glucuronide conjugation of NNK metabolites ............................151
7.1 Introduction .........................................................................................151
7.2 Methods...............................................................................................154
7.2.1 Metabolism by primary human hepatocytes....................................154
7.2.2 Enzyme sources .............................................................................154
7.2.3 Co-expression of CYP2A13 and UGT2B7 .....................................155
7.2.4 Incubations with 3H-NNK, 3H-NNAL, and 3H-HPB.......................155
7.2.5 LC/MS analysis of glucuronide metabolites ...................................156
7.3 Results.................................................................................................156
7.3.1 Coumarin metabolism by primary human hepatocytes....................156
7.3.2 3H-NNK metabolism by hepatocyte cultures ..................................158
7.3.3 Coumarin metabolism by co-incubated P450 enzyme and UGTs....158
7.3.4 Nitrosamine metabolism by co-incubated P450 enzyme and UGTs 161
7.4 Discussion ...........................................................................................164
7.5 Conclusions .........................................................................................165
7.6 Acknowledgements..............................................................................166

xii
Chapter 8: Concluding remarks and future directions .................................167
References......................................................................................................... 171
xiii
LIST OF FIGURES
1-1. Structure of nicotine and NNK 7
1-2. Cytochrome P450 catalytic cycle 11
1-3 UGT-catalyzed conjugation reaction: an example of N-glucuronidation 15
1-4 Flavin monoxygenase catalytic cycle 18
2-1. Pathways of nicotine metabolism in humans… 24
2-2 Nicotine 5'-oxidation to cotinine 26
2-3 Ethnic nicotine patch study design 31
2-4 Percent cotinine excreted as its glucuronide in 24-hour urine by ethnicity 39
3-1 Major glucuronide metabolites of nicotine 53
3-2 In vitro nicotine glucuronide conjugation by UGT2B10 haplotype 64
3-3 % cotinine excreted as its glucuronide in 24hr urine by UGT2B10 genotype 67
4-1 Excretion of nicotine N-oxide in urine by phenotype 83
4-2 Cluster analysis of urinary nicotine and its metabolites 87
5-1 NNK α-hydroxylation 104
5-2 Examples of polymorphic alleles affecting CYP2A6 or CYP2A7 110
5-3 CYP2A7 amplification products 117
xiv
5-4 CYP2A7 and its variants in comparison to CYP2A6 and CYP2A13 118
5-5 Western blot of CYP2A7-HEK transfected cells 120
5-6 Western blot of CYP2A7-HEK….truncated CYP2A7 121
6-1 NNN and NNK α-hydroxylation 127
6-2 A model of NNK docked in the active site… 129
6-3 Coumarin 7-hydroxylation and 3,4-epoxidation pathways 131
6-4 Radioflow HPLC analysis of 14C-coumarin metabolites 140
6-5 UV HPLC analysis of coumarin metabolism 142
6-6 ESI-MS-MS positive ion product spectra 143
6-7. A model of coumarin docked in the active site… 146
7-1. NNK metabolism and formation of glucuronide metabolites 153
7-2. Coumarin metabolism by primary human hepatocytes 157
7-3 3H-NNK metabolism by primary hepatocytes 159
7-4 Coumarin metabolism by mixed P450 and UGT 160
7-5 3H-NNAL and 3H-NNK metabolism by mixed P450 2A13 and UGT2B7 162
7-6 Detection of an HPB-releasing glucuronide 163
8-1 The influence of nicotine and NNK on lung cancer risk 169
xv
LIST OF TABLES
2-1 Distribution of urinary nicotine metabolites 25
2-2 Urinary nicotine and nicotine metabolite levels… 38
2-3 Predictors of the glucuronidation ratio: multivariate linear regression 42
2-4 Predictors of the C-oxidation ratio: multivariate linear regression 43
3-1 Nicotine and cotinine metabolism by expressed UGTs 1A4 and 2B10 57
3-2 Urinary nicotine metabolites in smokers by UGT2B10 haplotype 66
4-1 Distribution of urinary metabolites by genotype 81
4-2 Plasma nicotine metabolites by UGT2B10 genotype 86
4-3 Examples of discrepancies in assessing tobacco exposure 88
4-4 Stability of urinary nicotine metabolites ratios 90
4-5 Metabolite ratios by UGT2B10 genotype 93
4-6 Urinary nicotine equivalents and metabolite ratios by UGT2B10 genotype 94
5-1 Comparison of human P450 2A enzymes 107
5.2 Active site residues in human P450 2A protein 108
5-3 Primer sequences for cloning CYP2A7 112
xvi
6-1 Kinetic parameters for CYP2A13 and CYP2A13 Asn297Ala reactions 145
7-1 Product ratios from 3H-NNK metabolism by human hepatocytes 160
1
CHAPTER 1
Introduction
1.1 Tobacco use and health consequences
Tobacco use is a global public health problem that leads to over 5 million deaths per
year and shortens life expectancy by an average of 15 years (1). Smoking increases risk
of several cancers, chronic obstructive pulmonary disease, respiratory infections,
asthma, ischemic heart disease, and cerebrovascular disease (2). There is growing
recognition that smokeless tobacco use also increases risk of cancers, ischemic heart
disease, and cerebrovascular disease. Importantly, health risks are attenuated after
quitting, even after years of tobacco use (3) Health risks from secondhand smoke
exposure are lower than for smokers but also result in smoking-associated diseases, as
listed above (4;5). Tobacco is considered a major preventable cause of morbidity and
mortality, but it is a challenging problem. Preventing or successfully treating addiction
to tobacco products is imperative.
There are more than a billion smokers worldwide. In developed countries, 35
percent of men and 22 percent of women smoke (6). In developing countries, 50
percent of men and 9 percent of women smoke (6). Also, children and adolescents use
tobacco and very few people take up smoking after age 21 (1). The tobacco industry
spends over 10 billion dollars on product promotion and aggressively targets new and
2
expanding markets (6). Broadly, these potential markets include youth, women,
developing countries, and smokeless products in areas with smoke-free policies.
Current approaches to decrease tobacco use include smoke-free legislation, taxes on
tobacco products to raise prices, bans on product promotion, education outreach,
warning labels, and accessible quit programs.
Anti-smoking policies and increased awareness of health risks have resulted in a
decrease in tobacco use in the United States, though ~20 % of the population continues
to use tobacco regularly (7). Notably, 20 % of high school students smoke, based on
the number of students who reported smoking at least 20 days per month in 2007 (8).
Half of adults who have a history of smoking have succeeded in quitting (3). Indeed,
the majority of smokers are interested in quitting and around 70 % of smokers report a
quit attempt in the past year (9;10) However, only 58 % of smokers who tried quitting
were abstinent for more than a single day and less than 20 % maintained abstinence at
six months (9)!
There are several challenges to further decreasing tobacco use in the U.S. Only 1 of
every 5000 dollars collected in tobacco tax revenue is spent on tobacco control (1).
Meanwhile, tobacco companies are actively developing new products and marketing
strategies to promote tobacco use. Adolescents continue to access tobacco products,
and later encounter the difficulties of quitting (11). Pharmaceuticals to aid cessation are
only moderately effective as currently used. Health insurance companies are reluctant
to consider tobacco use as a chronic condition requiring long term treatment (12).
3
Addressing the tobacco problem also involves developing approaches to reduce
disease in tobacco users, former users, and individuals exposed to environmental
tobacco smoke. In the US, 81 billion dollars per year are currently spent on taking care
of tobacco-associated diseases (1). The cost of routine care is a significant challenge,
and yet investment in novel diagnostic and treatment modalities could improve health
outcomes significantly.
1.2 Tobacco use and cancer
The International Agency for Research on Cancer (IARC) of the World Health
Organization reviewed reports from laboratory animal toxicology studies to
epidemiology studies and concluded that tobacco increases the risk of several cancers.
There is sufficient evidence that cancers of the lung, larynx, nasal cavity, oral cavity,
esophagus, liver, pancreas, bladder, cervix, and leukemia are associated with tobacco
use (13). The US Surgeon general reported that smoking was the primary causal factor
in 30 % of cancer deaths (2). Over 60 known carcinogens are present in tobacco smoke
(14). Tobacco smoke is a complex mixture, and yet certain constituents have a
remarkable predilection for causing specific cancers in laboratory animals.
About 90 % of lung cancers are attributable to smoking (2). Lung cancer is the
second most common cancer and the leading cause of cancer death in the United States
(15). In 85 % of cases, lung cancer is diagnosed after regional spread or metastasis has
occurred. Risk of lung cancer increases with the number of cigarettes smoked per day
4
and with more years of smoking. Overall, about 16-18 % of lifelong smokers develop
lung cancer (16;17). An estimated 3000 deaths from lung cancer per year also occur in
nonsmokers exposed to secondhand smoke in the U.S. (5). Lung cancer is a well-
recognized risk of smoking among the US public, though young people in particular
underestimate risk of dying from lung cancer (18).
1.3 Nicotine and tobacco use
Nicotine is the addictive agent in tobacco products and it is the primary reason why
people continue their use. Nicotine accumulates in tobacco plant leaves to up to 3 % of
the dry weight. It serves the plant as a natural pesticide; nicotine is an alkaloid that acts
as an acetylcholine analog that is toxic to insects (19). In laboratory animals and human
smokers and nonsmokers, nicotine has psychoactive effects that reinforce its use
(20;21). Smokers will self-administer intravenous nicotine over placebo (22). When
switched to low nicotine cigarettes, smokers extract more nicotine per cigarette and
smoke more cigarettes (23-25). Abstinent smokers who receive the nicotine patch have
less craving than those who received placebo (26). The pharmacologic effects of
nicotine were investigated, in part, by the tobacco industry and in a 1971 Phillip Morris
document it was stated, “the cigarette should be conceived not as a product but as a
package. The product is nicotine.”
The effects of nicotine are related to blood levels of nicotine and the kinetics of
exposure. Rapid delivery of nicotine to the brain causes the effects that tobacco users
5
seek, namely relaxation, reduced stress, and pleasant mood (27). In the case of
smoking, nicotine is efficiently absorbed into the pulmonary circulation and it reaches
the brain in 10-20 seconds where it binds nicotinic cholinergic receptors (27). Due to
widespread distribution of receptors and the existence of various receptor subtypes, the
effects of nicotine in the brain are complex and are mediated by dopinergic and non-
dopinergic neurons (28). As nicotine levels fall, withdrawal symptoms arise and these
include nervousness, restlessness, irritability, and anxiety (29). Though smokers seek
the favorable effects of nicotine that occur when nicotine levels peak, their smoking
behavior more closely corresponds to maintaining a threshold concentration in blood
(30). Maintaining a nicotine threshold alleviates development of withdrawal symptoms.
Since the half-life of nicotine is relatively short, about 2 hours, smokers use cigarettes
repeatedly during the day and awaken in the morning with an urge to smoke (29).
The rate of decline in nicotine concentrations is predominantly a function of
metabolism, as well as renal clearance. Less than 5% of nicotine is protein-bound (29).
Nicotine is metabolized rapidly and extensively in the liver, though some metabolism
occurs in other tissues including the lungs and kidneys (29). Enzymes capable of
metabolizing nicotine are also present in brain (31). Nicotine is metabolized by C-
oxidation, N-oxidation, or glucuronidation and these metabolic pathways are described
in detail in Chapter 2. The major metabolites do not have psychoactive properties.
Nicotine and its metabolites are predominantly excreted in urine. Typically, 10 % of
nicotine is excreted unchanged in a 24-hour period (32). Higher concentrations of
nicotine are excreted in urine shortly after smoking. The rate of nicotine metabolism
and the distribution of metabolites vary among different individuals (33).
6
1.4 4-(methylnitrosamino)-1-(3-pyridyl)-1-butanone (NNK)
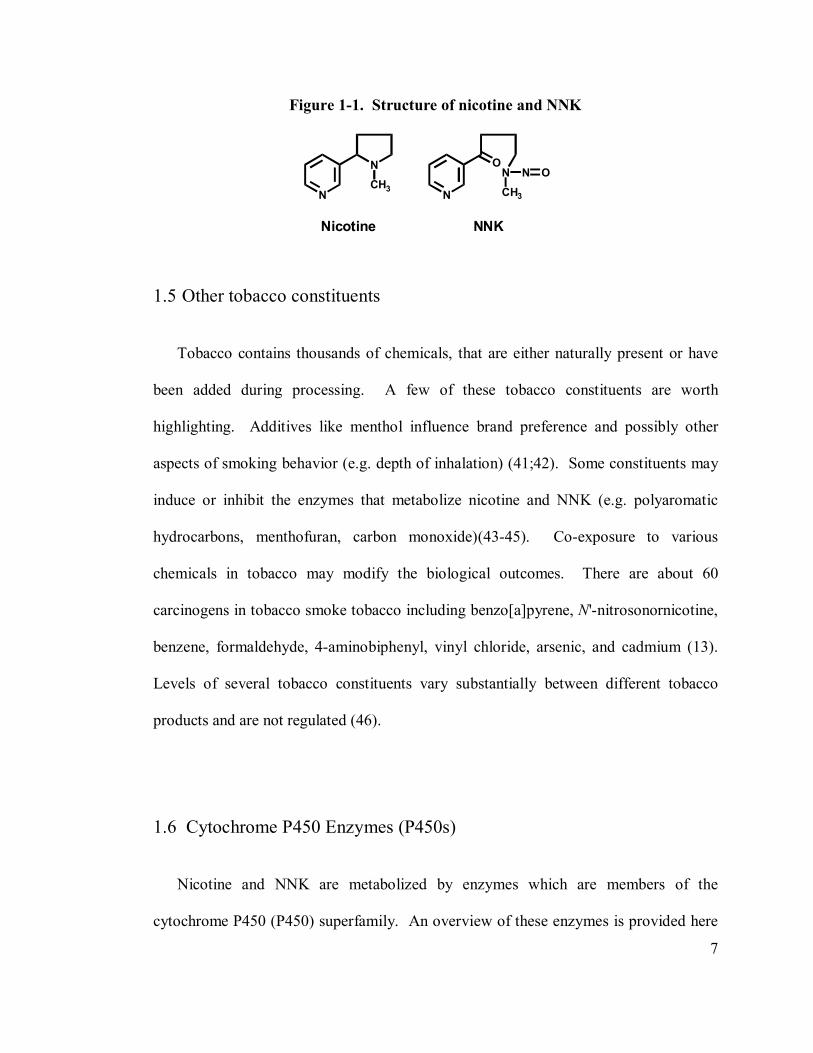
NNK is structurally related to nicotine, as it is a nitrosated product of nicotine
formed during the tobacco curing process (Figure 1-1). NNK is an abundant
nitrosamine in processed tobacco, albeit 1000-fold lower than nicotine (10 µg
NNK/cigarette compared to 10 mg nicotine/cigarette) (14). NNK is found only in
tobacco and it is therefore referred to as a tobacco-specific nitrosamine.
NNK is designated a class I carcinogen by the IARC, indicating that it is a likely
carcinogen in humans. In contrast, nicotine is not a carcinogen. NNK induces tumors
in lung, liver, pancreas, and nasal cavity in various species of rodents (34). In rats,
induction of lung adenocarcinomas occur independent of route of administration
including exposure through treated drinking water (35). Metabolism of NNK is
required for carcinogenesis, which is described in detail in Chapter 6. NNK exposure
has been documented by the detection of NNK metabolites in smokers’ urine and
toenails, as well as in urine samples from populations exposed to environmental tobacco
smoke (e.g. casino workers, children of smokers) (36-39). DNA adducts that would be
consistent with electrophilic attack from an NNK metabolite have been detected at
higher levels in clinical lung cancer samples than in controls (40). Overall, NNK
exposure is predicted to have a cumulative effect, with decades of low exposure
translating to an increased cancer risk in susceptible individuals (14).
7
Figure 1-1. Structure of nicotine and NNK
N
NCH3 N
ON NCH3
O
NNKNicotine
1.5 Other tobacco constituents
Tobacco contains thousands of chemicals, that are either naturally present or have
been added during processing. A few of these tobacco constituents are worth
highlighting. Additives like menthol influence brand preference and possibly other
aspects of smoking behavior (e.g. depth of inhalation) (41;42). Some constituents may
induce or inhibit the enzymes that metabolize nicotine and NNK (e.g. polyaromatic
hydrocarbons, menthofuran, carbon monoxide)(43-45). Co-exposure to various
chemicals in tobacco may modify the biological outcomes. There are about 60
carcinogens in tobacco smoke tobacco including benzo[a]pyrene, N'-nitrosonornicotine,
benzene, formaldehyde, 4-aminobiphenyl, vinyl chloride, arsenic, and cadmium (13).
Levels of several tobacco constituents vary substantially between different tobacco
products and are not regulated (46).
1.6 Cytochrome P450 Enzymes (P450s)
Nicotine and NNK are metabolized by enzymes which are members of the
cytochrome P450 (P450) superfamily. An overview of these enzymes is provided here
8
and discussion of the specific enzymes involved in nicotine and NNK metabolism is
covered in later chapters.
P450 enzymes are heme monoxgenases that catalyze diverse oxidation reactions and
are biologically important for their roles in the metabolism of both exogenous and
endogenous small molecules. Broadly, cytochrome P450 enzymes (P450s)
biosynthesize endogenous molecules, inactivate/activate compounds with biological
activity, and increase the hydrophilicity of compounds which facilitates their excretion
and prevents toxic accumulation (47;48). This ancient family includes more than 8500
genes that have been identified in animals, plants, fungi, unicellular eukaryotes, and
bacteria. Sequence homology is used to classify enzymes into families and subfamilies,
greater than 59 % and 70 % similarity, respectively (49). Some cytochrome P450
enzymes (P450s) fulfill a vital role for the organism and thus their disruption is lethal
(50). The disruption of other enzymes can have negligible effects; the enzyme may
protect the organism only under certain exposure conditions or redundancy in metabolic
pathways may prevent any toxicity (51). Nonfunctional P450 pseudogenes have also
been identified, particularly as evolutionary relics among higher eukaryotes (49).
Human cytochrome P450s contribute to normal development and homeostasis by
metabolizing lipids, steroids, vitamins, eicosanoids, retinoids, prostaglandins, and
xenobiotics (52). There are 57 cytochrome P450 genes (CYP) as well as 58
pseudogenes that have evolved from several gene duplication and deletion events
(53;54). The enzymes are membrane-bound in the endoplasmic reticulum, though six
are exclusively found in mitochondria (55). Regulatory networks including nuclear
9
receptors and transcription factors define the tissue-specific distribution of individual
P450s, and modulate constitutive and inducible expression (56-59). Xenobiotic-
metabolizing P450s are highly polymorphic and this leads to variation in the levels of
enzymes and catalytic function. Furthermore, P450 activity is affected by exposure to
inhibitors. Over 90 % of drugs on the market are metabolized by a relatively small
number of cytochrome P450s, listed here in order of their relative contribution to drug
metabolism: 3A4/3A5 > 2D6 > 2C9 > 2C19 > 2E1 ≈ 1A2 (55;60). The role of these
enzymes is widely studied to predict the potential for adverse reactions and variation in
drug efficacy.
Cytochrome P450s have characteristic absorbance spectra. P450 refers to a pigment
absorbing at 450 nm which can be observed for these heme-containing proteins when
carbon monoxide is bound to reduced enzyme (61). The absorption maximum at 450
nm depends on properly incorporated heme, with the heme iron coordinated to the P450
protein through a cysteine thiolate and stabilized by interactions between the heme and
other P450 residues. Carbon monoxide difference spectra are routinely used to quantify
the amount of P450 enzyme that is grossly intact from a catalytic perspective. Substrate
binding to P450s can be analyzed by following changes in the UV-vis heme Soret
spectrum that result from displacement of water or an amino acid ligand from the heme
iron (type I spectrum), or from direct coordination of substrate to the heme iron (type II
spectrum) (62) .
Cytochrome P450s catalyze a range of oxidative reactions. The heme iron-mediated
chemistry of catalysis, the role of key amino acids, and the mechanisms of specific
10
P450 reactions have challenged many investigators. Reactions catalyzed by P450s
include hydrocarbon hydroxylation, heteroatom oxidation and dealkylation (heteroatom
release), aromatic ring oxidation, acetylene oxidation, dehydrogenation, carbon-carbon
bond cleavage, and radical cross-linking of substrates (63;64).
A general catalytic cycle for cytochrome P450s is depicted in Figure 1-2 and is
summarized below. Binding of substrate in a productive orientation displaces the 6th
axial ligand of the heme iron (e.g. a water molecule) generating a penta-coordinated
iron-heme-thiolate complex (2) that is a better electron acceptor than the resting species
(1). Also, changes in the spin state can result in a more positive redox potential (65).
Catalysis requires the transfer of two electrons to the P450 enzyme, and in nature
NADPH is the electron source and P450 oxidoreductase transfers the electrons.
Cytochrome b5 can also transfer the second electron. However, recently the transfer of
electrons from a gold electrode to bonded purified P450 was achieved and conversion
of substrate to product was observed (66). Of note, substrate can bind and dissociate at
different stages of the catalytic cycle (67;68). Futile cycling and generation of
hydrogen peroxide can also occur (69).
Through a series of steps an oxygen atom derived from molecular oxygen is
transferred to the substrate. Molecular oxygen binds readily to the ferrous heme species
(3) in an end-on complex (4). A second electron reduction generates ferric-dioxygen
which is a strong base that undergoes protonation by a water molecule to form a Fe3+-
hydroperoxy complex (5). A local network of amino acids facilitate further protonation,
cleavage of the O-O bond, and formation of water and a reactive iron-oxo intermediate
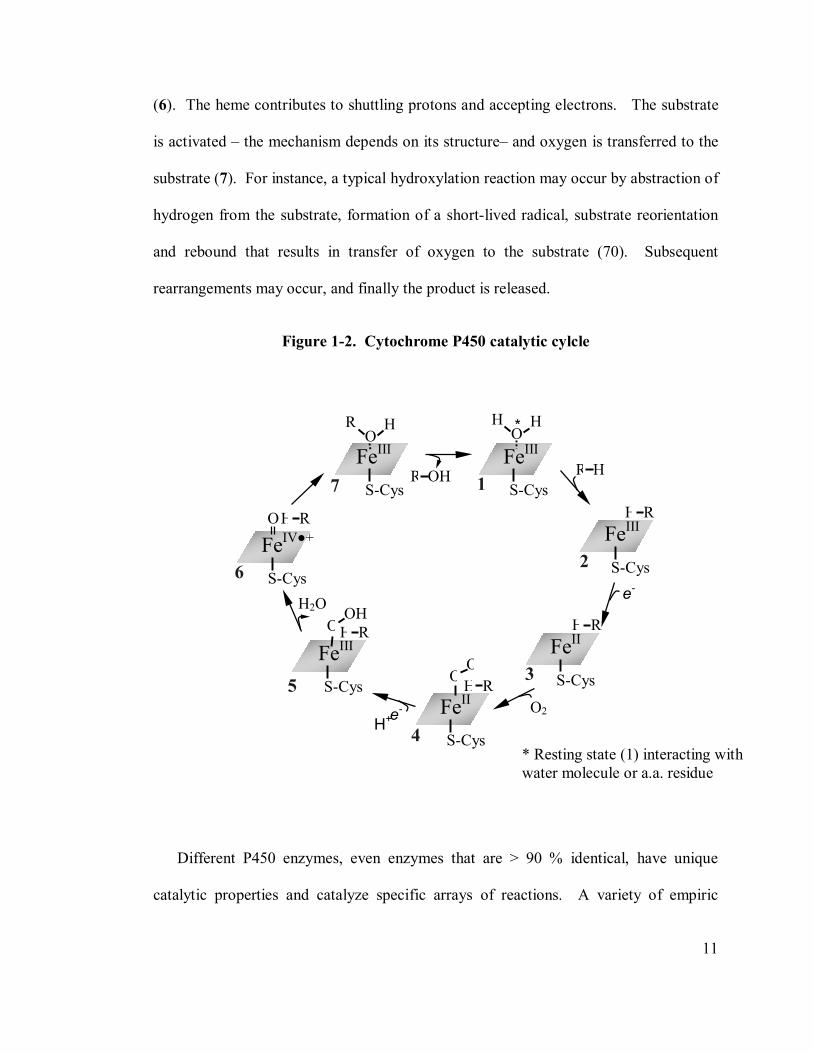
11
(6). The heme contributes to shuttling protons and accepting electrons. The substrate
is activated – the mechanism depends on its structure– and oxygen is transferred to the
substrate (7). For instance, a typical hydroxylation reaction may occur by abstraction of
hydrogen from the substrate, formation of a short-lived radical, substrate reorientation
and rebound that results in transfer of oxygen to the substrate (70). Subsequent
rearrangements may occur, and finally the product is released.
Figure 1-2. Cytochrome P450 catalytic cylcle
Different P450 enzymes, even enzymes that are > 90 % identical, have unique
catalytic properties and catalyze specific arrays of reactions. A variety of empiric
* Resting state (1) interacting with water molecule or a.a. residue
FeIII
R HO
S-Cys
FeIII S-Cys
R OH 1
FeIII S-Cys
H R
2
H HO
R H
e-
FeII S-Cys 3
FeII S-Cys 4
O2 e-
O
OO
FeIII S-Cys5
H+
H2O
FeIV●+ S-Cys 6
H R
H R
H R
H R
*
7
OH O
12
studies are conducted to identify and compare enzyme substrates and resulting products,
as theoretical prediction of enzyme activity and product distribution is still very limited.
In vitro analyses are greatly facilitated by studying individual P450s that have been
heterologously expressed (e.g. in E. Coli). Substrate binding spectra, product
characterization, kinetics, and structural determination provide substantial information
about an enzyme-substrate pair.
1.7 UDP-glucuronsyltransferase enzymes (UGTs)
Uridine diphosphate glucuronsyl transferase (UGTs) enzymes also metabolize
nicotine, its metabolites, and metabolites of NNK. These enzymes in particular serve an
inactivation and detoxification function (71). Overall, less is known about human
UGTs than P450s, due in part to later recognition of their importance in xenobiotic
metabolism and because UGTs have been difficult to characterize in vitro (e.g.
including not being amenable to purification).
Human UGTs belong to the GT1 superfamily of glycosyltransferases. The
predominant system to classify enzymes is based on amino acid sequence similarity
(72;73). The GT1 superfamily includes enzymes found in archaea, bacteria, and
eukaryotes; there are over 2800 entries for the GT1 superfamily in the Carbohydrate
Active Enzymes database (CAZy; www.cazy.org). GT1 enzymes catalyze glycosyl
transfer by an inverted mechanism in which the configuration of the sugar is changed
13
from an α- to β- linkage (74). Overall domain structure is also shared among GT1
enzymes despite relatively low sequence similarity.
There are 19 human UGTs that are classified into three subfamilies, UGT1A,
UGT2A, and UGT2B (73). Sequence identity between subfamilies is less than 50 %. A
unique feature of the UGT1A subfamily is that all UGT1As are transcribed from a
single gene locus that spans 200 kb by a process similar to alternative splicing (75).
Each enzyme has an independent promoter region and first exon that is spliced to shared
exon 2-5 sequence. Thus, the C'-terminal 240 amino acids are identical among UGT1A
enzymes. For all UGTs, the C-terminal domain is highly conserved and several
residues in this domain interact with the sugar donor (76). The N-terminus contributes
significantly to substrate specificity (77).
UGTs catalyze the transfer of a sugar moiety to a nucleophilic group on the
substrate, forming a glycosidic bond (72;76). Human UGTs utilize uridine diphosphate
glucuronic acid (UDPGA), but uridine diphosphate glucose can also serve as the sugar
donor in some situations. Substrates are structurally diverse small molecules that are
typically lipophilic. UGTs can catalyze the formation of O-, N-, S- or rarely C-
glycosidic linkages (78). In humans, UGTs metabolize the endogenous substrates
bilirubin, bile acids, steroids, hydroxylated eicosanoids, and leukotrienes (79). In
addition, UGTs metabolize a number of xenobiotics and contribute to the metabolism of
an estimated 20 % of drugs on the market (80). The addition of a sugar molecule
confers increases hydrophilicity of substrates leading to increased excretion in urine and
bile (81;82).
14
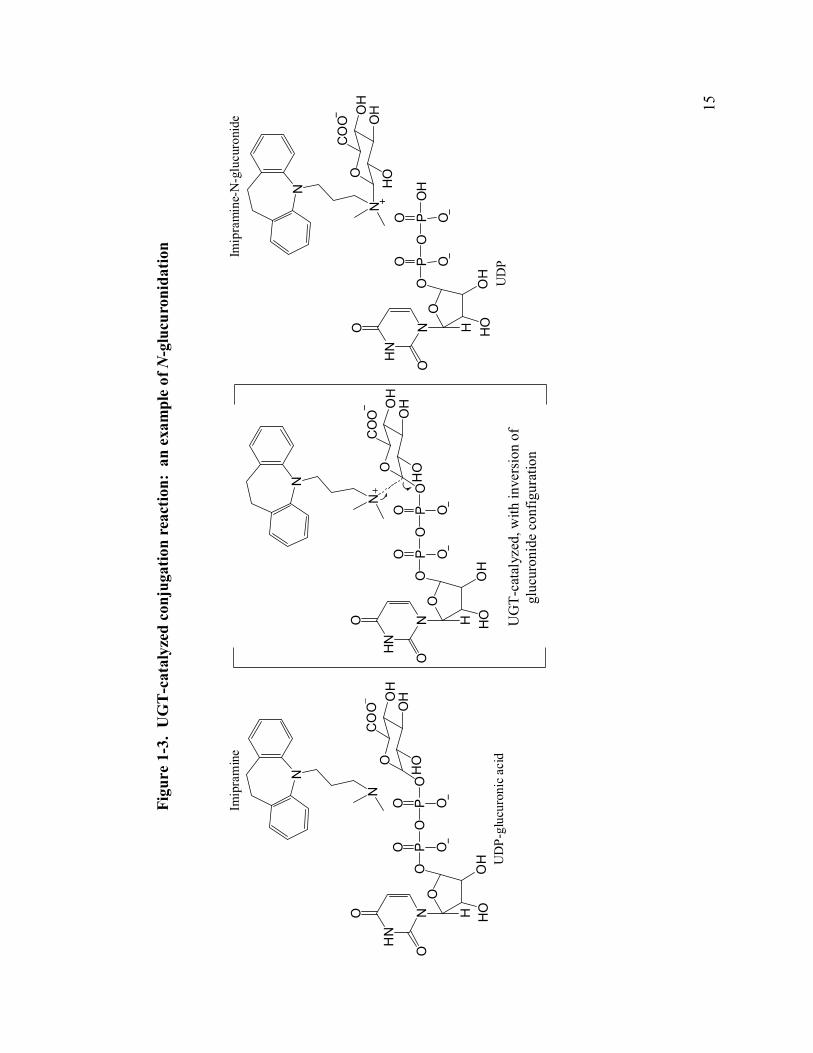
The predicted catalytic mechanism is that a nucleophilic substrate attacks the C1-
carbon of glucuronic acid in an SN2-like reaction (83) An example of an UGT-
catalyzed N-glucuronidation reaction is presented in Figure 1-3; an aspartate may
stabilize the positive charge on the nitrogen (84). For hydroxylated substrates, a
histidine residue is proposed to act as a base that activates the substrate by
deprotonation (76). Mutation of the active site histidine to alanine results in
substantially decreased O-linked but not N-linked glucuronidation (84). The
nucleophilic group on the substrate then attacks the sugar moiety, with uridine
diphosphate as the leaving group. The product has inverted configuration at the C-1
carbon from an α- to β- linkage as mentioned previously.
15
Figu
re 1
-3.
UG
T-c
atal
yzed
con
juga
tion
reac
tion:
an
exam
ple
of N
-glu
curo
nida
tion
N
HN
O
OO
HO
OH
H
OP
OP
OO
O
OO
OC
OO
HO
OHO
H
N
N
UD
P-gl
ucur
onic
acid
Imip
ram
ine
N
HN
O
OO
HO
OH
H
OP
OP
OO
O
OO
OC
OO
HO
OHO
H
N
N
N
HN
O
OO
HO
OH
H
OP
OP
OH
OO
OO
OC
OO
HO
OHO
H
N
N
Imip
ram
ine-
N-g
lucu
roni
de
UD
P
UG
T-ca
taly
zed,
with
inve
rsio
n of
gl
ucur
onid
e co
nfig
urat
ion
16
Human UGTs are embedded in the membrane of the endoplasmic reticulum. In
addition to a transmembrane helix, the enzymes are closely associated with the
membrane and the active site faces away from the cytosolic side of the membrane
(79;85). Purification of heterologously-expressed full-length UGTs has failed with the
exception of UGT1A9, but the purified form of this UGT has different substrate
specificity and kinetics than UGT1A9 microsomes (86). Currently, the activity of
individual UGTs is characterized using cell lysate or the membrane fraction from
heterologously-expressed enzyme. Unlike with P450s, the amount of UGT protein is
difficult to quantify. Addition of a his-tag and immunoblotting has been useful to
compare the activities of different heterologously-expressed UGTs (87). Expressed
UGTs have significantly lower activity than is observed with liver microsomes. A
limited repetoire of selective inhibitors and antibodies have also been used to
characterize enzyme activity in tissue preparations.
1.8 Flavin-containing monooxygenases (FMOs)
Flavin-containing monoxygenases (FMO) contribute to minor pathways of nicotine
and NNK metabolism. In some individuals with decreased P450 activity, and perhaps
decreased UGT activity, these enzymes have a more prominent role (88).
FMOs catalyze the oxidation of small molecules at nucleophilic heteroatoms
including nitrogen, sulfur, phosphorus, and selenium (89). Similar to cytochrome P450-
catalyzed metabolism, oxidation of typical lipophilic substrates generates products that
17
are more hydrophilic and therefore more readily excreted. In the Univeral Protein
Resource (UniProt; www.uniprot.org) database, there are currently a total of 999 FMO
protein sequence entries reflecting the presence of FMOs in viruses, bacteria, and
eukaryotes. There are five active FMO enzymes in humans, FMO1-5, with 52-60 %
sequence identity (90). There are also 6 pseudogenes for which no activity has been
demonstrated. Human FMOs have a broad substrate range and contribute to xenobiotic
detoxification (90). It is unclear if FMOs also have a role in endogenous biosynthetic or
catabolic pathways. Ziegler et al. proposed that FMOs may catalyze endogenous
disulfide bond formation through cysteamine oxidation (91). FMOs are localized to the
endoplasmic reticulum membrane, and are abundantly expressed in adult liver (FMO3)
and kidney (FMO1) (92).
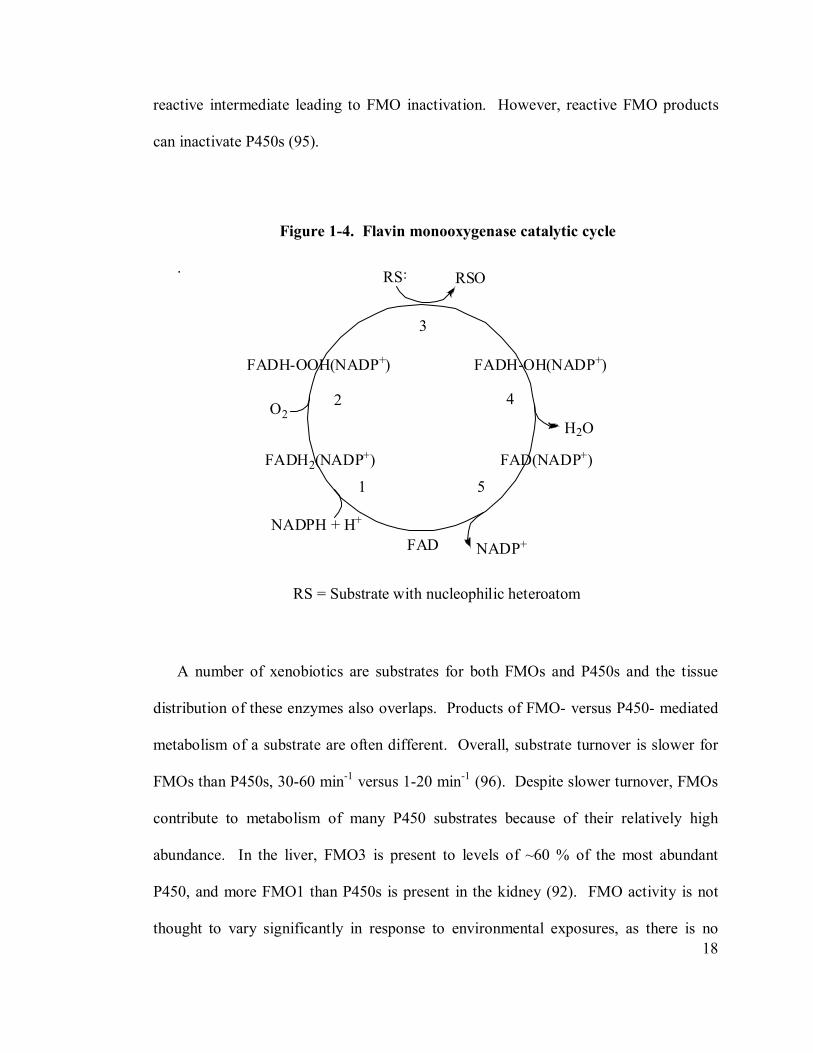
Human FMOs have a unique catalytic cycle in which substrate affinity does not
drive the velocity of the reaction (Figure 1-4) (91). FMOs bind NADPH resulting in a
two electron reduction of flavin (1). Molecular oxygen binds the reduced flavin and
C4α peroxyflavin is rapidly formed (2). Remarkably, this species is stable for minutes
to hours and thus the enzyme is primed for catalysis prior to substrate binding (93).
Ability of substrates to pass through the substrate access channel, depending on size and
charge state, largely determine which molecules are metabolized by FMOs (90;94).
When a substrate enters the active site, a nucleophilic moiety can react with the flavin
peroxide (3). An oxygen atom is then incorporated into the substrate and a molecule of
water is formed. Release of water is predicted to be the rate-limiting step (4). NADP
leaves the active site at the end of the catalytic cycle (5). FMOs are resistant to
inactivation by electrophiles, and there are no known examples of an FMO-generated
18
reactive intermediate leading to FMO inactivation. However, reactive FMO products
can inactivate P450s (95).
Figure 1-4. Flavin monooxygenase catalytic cycle
.
A number of xenobiotics are substrates for both FMOs and P450s and the tissue
distribution of these enzymes also overlaps. Products of FMO- versus P450- mediated
metabolism of a substrate are often different. Overall, substrate turnover is slower for
FMOs than P450s, 30-60 min-1 versus 1-20 min-1 (96). Despite slower turnover, FMOs
contribute to metabolism of many P450 substrates because of their relatively high
abundance. In the liver, FMO3 is present to levels of ~60 % of the most abundant
P450, and more FMO1 than P450s is present in the kidney (92). FMO activity is not
thought to vary significantly in response to environmental exposures, as there is no
RS RSO
FADNADPH + H+
1
FADH2(NADP+)
O2
FADH-OOH(NADP+)
2
3
FADH-OH(NADP+)
FAD(NADP+)
4
5
NADP+
H2O
RS = Substrate with nucleophilic heteroatom
19
evidence for enzyme induction and only competitive inhibition has been observed (90).
Nevertheless, genetic factors do cause inter-individual variation in FMO-mediated
metabolism, and these include FMO polymorphisms and other genes that mediate age
and gender differences in FMO expression. A note of caution is warranted in predicting
the in vivo contribution of P450- versus FMO- mediated metabolism from in vitro
experiments, as incubation conditions (ie. pH, buffer selection, timing of NADPH
addition) can favor one metabolic pathway over the other in microsomal studies, and
also influence the activity of individually-expressed enzymes. Heat inactivates FMOs
at a lower temperature than P450s and this can be useful to distinguish between P450-
and FMO- catalyzed reactions in vitro (97).
1.9 Regulation of P450s, UGTs, and FMOs
Regulation of P450s, UGTs, and FMOs may underlie some of the phenotypic
variation observed in nicotine metabolism among smokers that is discussed in
subsequent chapters, and is relevant to hypotheses generated about in vivo metabolism.
Regulatory mechanisms determine the amount and distribution of P450s, UGTs,
and FMOs, in an individual. Gene knock out models and chemical induction studies
have been instrumental to studying regulation. There are differences in the regulation
of these xenobiotic metabolizing enzymes in mice and rats compared to humans, and
therefore mice that are transgenic for various human genes (e.g. nuclear hormone
receptors, UGT1A locus) are being generated to better assess regulatory networks (98).
20
Much of what we know is based on regulation of gene transcription. The
arylhydrocarbon receptor (Ahr) and the nuclear hormone receptors, constitutive
androstane receptor (CAR), pregnane X receptor (PXR), and peroxisome proliferator
activated receptor (PPAR), are involved in upregulation of both P450s and UGTs (99-
101). Upon activation by ligands, these receptors are translocated to the nucleus where
they bind promoter gene elements and recruit transcription factors, such as the
hepatocyte nuclear factors (56). There is cross-talk between the different receptor
pathways in animal models. A number of P450s, UGTs, and FMOs, do not undergo
substantial induction. For example, mouse P450 2A5 that shares high sequence identity
with human P450 2A6 is induced through the arylhydrocarbon receptor (AhR) 3-fold
while P450 1A1 is induced over 1500-fold (102). In smokers P450 1A1 is induced by
polyaromatic hydrocarbons in tobacco smoke, but an effect on P450 2A6 has not been
demonstrated (103). A number of other factors may influence regulation such as DNA
methylation, transcriptional co-activators, and alternative splice variants.
In vitro enzymatic kinetics combined with estimates of in vivo expression are used
to make hypotheses about the role of an enzyme in in vivo metabolism. Determining
which enzyme(s) catalyzes a specific reaction can provide critical information about
exposure risks to a xenobiotic agent and potential adverse drug reactions. While this
provides a useful framework to consider the role of an enzyme, it is often not sufficient
to make conclusions about in vivo metabolism. Human pharmacokinetic studies can
provide specific information about the absorption, metabolism, distribution, and
elimination of a compound though these studies are expensive, and also, are frequently
not an option for studying carcinogens. Quantifying metabolites in body fluids of
21
exposed, and non-exposed, individuals is a mainstay for evaluating metabolism in
population-based studies. Genotype-phenotype analyses can provide information about
the role of an enzyme in in vivo metabolism. Gene-environment interactions, especially
with factors like diet which are difficult to measure or control, can be a complicating
factor. Overall, it is a challenge to assess factors that affect in vivo metabolism.
1.10 Goals of thesis research
The goals of the thesis were to better understand the role of specific enzymes in
nicotine and NNK metabolism, to consider metabolic flux through more than one
enzymatic pathway, and to improve the scientific basis of using selected tobacco
biomarkers.
22
CHAPTER 2
Ethnic differences in nicotine metabolism
Content included in this chapter is reprinted with permission of the American Society
for Pharmacology and Experimental Therapeutics. All rights reserved.
2.1 Introduction
African Americans have higher rates of lung cancer than European Americans
despite consistently reporting smoking fewer cigarettes per day (cpd) (104;105). Yet
higher levels of the nicotine metabolite cotinine have been documented in African
Americans at all levels of smoking during the last 20 years (41;106-109). In the
National Health and Nutrition Examination Survey III (NHANES III), cotinine was also
higher in African American nonsmokers than European American nonsmokers who
reported similar environmental tobacco smoke exposure (106). Higher cotinine among
African American compared to European American smokers likely reflects higher
exposure per cigarette, differences in nicotine metabolism, or a combination of both. A
difference in nicotine metabolism could impact cancer risk through an effect on
smoking behavior or because some of the same enzymes that metabolize nicotine also
metabolize carcinogens in tobacco smoke.
23
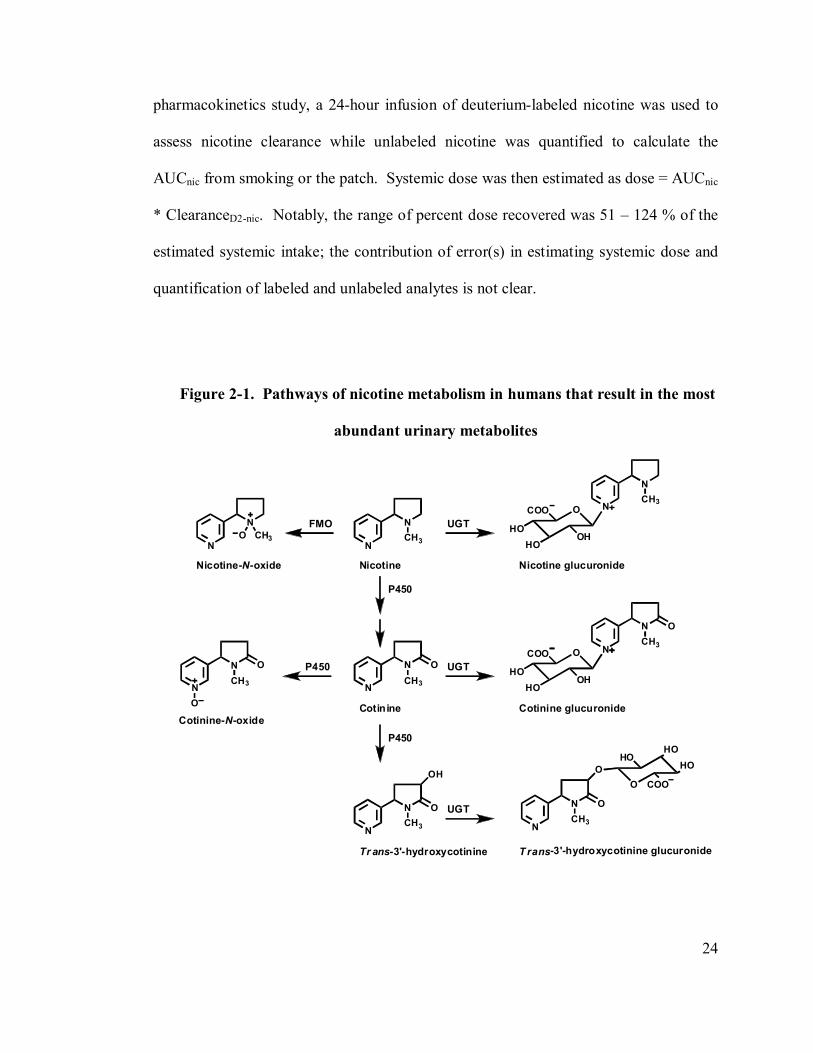
Nicotine is extensively metabolized into pharmacologically inactive metabolites by
C-oxidation, glucuronide conjugation, and N-oxidation (Fig. 2.1) (32;110;111).
Typically, only ~10 % of the nicotine dose is excreted unchanged in urine (32). There
is significant interindividual variation in the contribution of the three pathways to
nicotine metabolism, albeit in most people C-oxidation is the major pathway and 80 %
of nicotine is metabolized initially to cotinine (112). This metabolite is frequently used
as a biomarker of nicotine exposure, since nicotine itself has a short half-life of 1-2
hours compared to 16 hours for cotinine, and nicotine levels spike immediately after
smoking (113-115). Moreover, individuals who are not exposed to tobacco have
virtually no cotinine in their body fluids as nicotine intake from other sources (e.g.
eggplant) is insignificant (116;117). In urine, more than 40 % of nicotine and its
oxidation metabolites, cotinine and trans-3'-hydroxycotinine, are present as glucuronide
conjugates (111;112;118). N-oxidation is a minor metabolic pathway that typically
accounts for less than 10 % of nicotine metabolism (119).
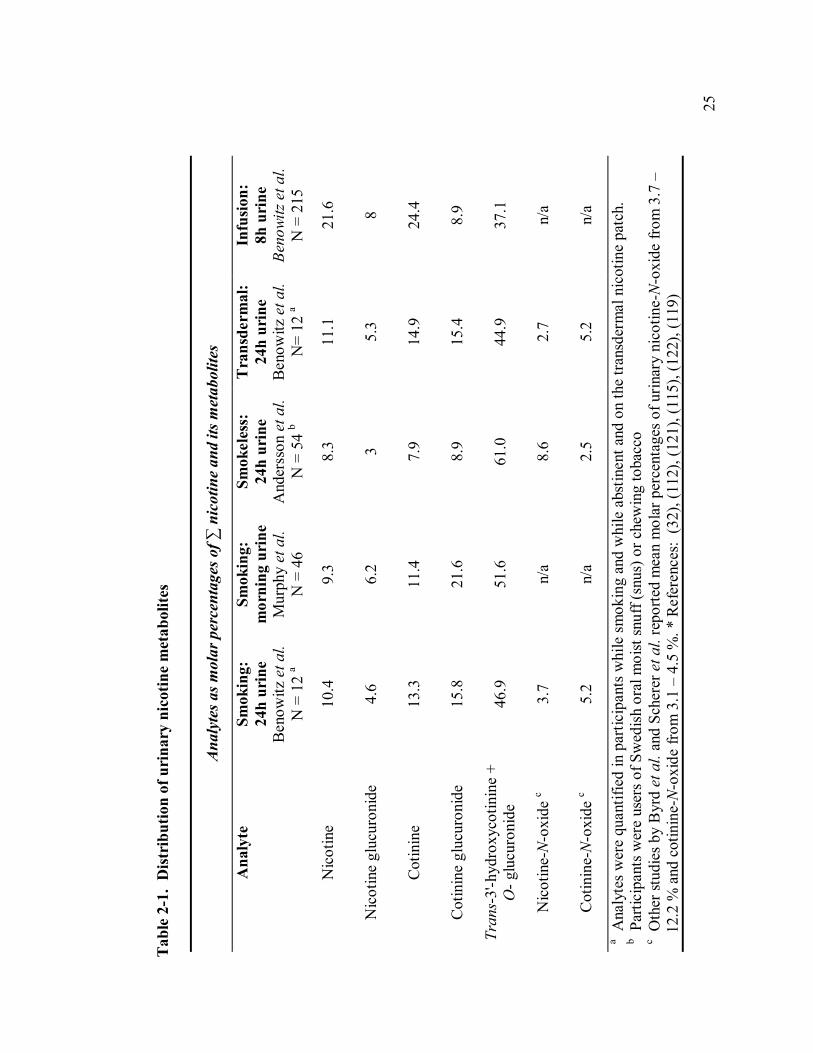
Quantifying the sum of nicotine and its major metabolites in urine reflects nicotine
intake and can be used to assess the molar distribution of urinary metabolites (Table 2-
1). The sum of nicotine, nicotine-N-glucuronide, cotinine, cotinine-N-glucuronide,
trans-3'-hydroxycotinine, and trans-3'-hydroxycotinine glucuronide has been referred to
as nicotine equivalents (120). This sum, with or without additional quantification of
nicotine-N-oxide and cotinine-N-oxide, has been used in pharmacokinetic studies to
quantify recovery of the administered nicotine dose. Furthermore, Benowitz et al.
reported that nicotine equivalents in 24 hour urine accounted for an average of 90 % of
the systemic nicotine intake from smoking or from the nicotine patch (32). In this
24
pharmacokinetics study, a 24-hour infusion of deuterium-labeled nicotine was used to
assess nicotine clearance while unlabeled nicotine was quantified to calculate the
AUCnic from smoking or the patch. Systemic dose was then estimated as dose = AUCnic
* ClearanceD2-nic. Notably, the range of percent dose recovered was 51 – 124 % of the
estimated systemic intake; the contribution of error(s) in estimating systemic dose and
quantification of labeled and unlabeled analytes is not clear.
Figure 2-1. Pathways of nicotine metabolism in humans that result in the most
abundant urinary metabolites
N
NCH3
Nicotine
UGTN
NCH3
Nicotine glucuronide
O
HOHO
OH
COO
N
NCH3
Cotinine
UGTN
NCH3
Cotinine glucuronide
O
HOHO
OH
COOO
O
P450
N
NCH3
Tr ans-3'-hydroxycotinine
UGTN
NCH3
T rans-3'-hydroxycotinine glucuronide
O
HOHO
HO
COO
O O
P450
OH O
FMO
P450
N
NCH3
Nicotine-N-oxide
O
N
NCH3
Cotinine-N-oxide
O
O
25
Tab
le 2
-1.
Dis
trib
utio
n of
uri
nary
nic
otin
e m
etab
olite
s
Ana
lyte
s as m
olar
per
cent
ages
of ∑
nic
otin
e an
d its
met
abol
ites
Ana
lyte
Sm
okin
g:
24
h ur
ine
Ben
owitz
et a
l. N
= 1
2 a
Smok
ing:
m
orni
ng u
rine
M
urph
y et
al.
N =
46
Smok
eles
s:
24h
urin
e A
nder
sson
et a
l. N
= 5
4 b
Tra
nsde
rmal
:
24h
urin
e B
enow
itz e
t al.
N=
12 a
Infu
sion
:
8h
uri
ne
Beno
witz
et a
l. N
= 2
15
Nic
otin
e 10
.4
9.3
8.3
11.1
21
.6
Nic
otin
e gl
ucur
onid
e 4.
6 6.
2 3
5.3
8
Cot
inin
e 13
.3
11.4
7.
9 14
.9
24.4
Cot
inin
e gl
ucur
onid
e 15
.8
21.6
8.
9 15
.4
8.9
Tran
s-3'
-hyd
roxy
cotin
ine
+
O- g
lucu
roni
de
46.9
51
.6
61.0
44
.9
37.1
Nic
otin
e-N
-oxi
de c
3.7
n/a
8.6
2.7
n/a
Cot
inin
e-N
-oxi
de c
5.2
n/a
2.5
5.2
n/a
a Ana
lyte
s wer
e qu
antif
ied
in p
artic
ipan
ts w
hile
sm
okin
g an
d w
hile
abs
tinen
t and
on
the
trans
derm
al n
icot
ine
patc
h.
b Par
ticip
ants
wer
e us
ers o
f Sw
edis
h or
al m
oist
snuf
f (sn
us) o
r che
win
g to
bacc
o c O
ther
stud
ies b
y B
yrd
et a
l. an
d Sc
here
r et a
l. re
porte
d m
ean
mol
ar p
erce
ntag
es o
f urin
ary
nico
tine-
N-o
xide
from
3.7
–
12.2
% a
nd c
otin
ine-
N-o
xide
from
3.1
– 4
.5 %
. * R
efer
ence
s: (
32),
(112
), (1
21),
(115
), (1
22),
(119
)
26
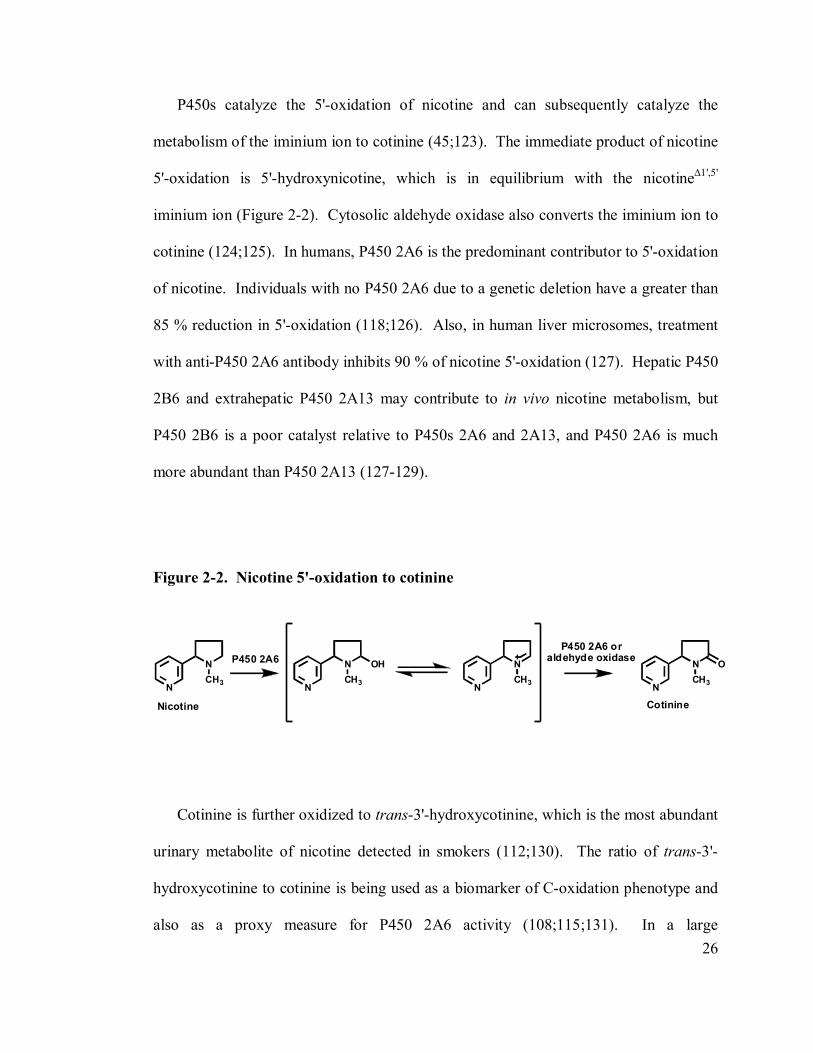
P450s catalyze the 5'-oxidation of nicotine and can subsequently catalyze the
metabolism of the iminium ion to cotinine (45;123). The immediate product of nicotine
5'-oxidation is 5'-hydroxynicotine, which is in equilibrium with the nicotine∆1',5'
iminium ion (Figure 2-2). Cytosolic aldehyde oxidase also converts the iminium ion to
cotinine (124;125). In humans, P450 2A6 is the predominant contributor to 5'-oxidation
of nicotine. Individuals with no P450 2A6 due to a genetic deletion have a greater than
85 % reduction in 5'-oxidation (118;126). Also, in human liver microsomes, treatment
with anti-P450 2A6 antibody inhibits 90 % of nicotine 5'-oxidation (127). Hepatic P450
2B6 and extrahepatic P450 2A13 may contribute to in vivo nicotine metabolism, but
P450 2B6 is a poor catalyst relative to P450s 2A6 and 2A13, and P450 2A6 is much
more abundant than P450 2A13 (127-129).
Figure 2-2. Nicotine 5'-oxidation to cotinine
N
NCH3
Nicotine
P450 2A6 oraldehyde oxidase
N
NCH3
Cotinine
O
N
NCH3
OH
N
NCH3
P450 2A6
Cotinine is further oxidized to trans-3'-hydroxycotinine, which is the most abundant
urinary metabolite of nicotine detected in smokers (112;130). The ratio of trans-3'-
hydroxycotinine to cotinine is being used as a biomarker of C-oxidation phenotype and
also as a proxy measure for P450 2A6 activity (108;115;131). In a large
27
pharmacokinetic study (n = 268) where non-smokers and smokers were co-administered
deuterium labeled nicotine (D2) and cotinine (D4), the plasma and urine ratio of trans-3'-
hydroxycotinine to cotinine was correlated with nicotine clearance, r = 0.6 and r = 0.5
respectively (115). While these correlations are moderate, differences in smoking
behavior have been observed among individuals with low ratios, particularly among
individuals with well-characterized low activity CYP2A6 alleles and Japanese
Americans who have a higher prevalence of these alleles (115;132;133). Briefly,
groups with low ratios have been reported to have lower urinary nicotine equivalents,
smoke slightly fewer cigarettes/day, smoke less intensely on a smoking machine, and
Malaiyandi et al. reported a higher 6-month success rate for smoking cessation
(132;134-137). Other studies have not found any associations with cigarettes/day or
indices of addiction (e.g. Fagerstrom index, time to first cigarette) (108;138). A
concern is that no study has controlled for a potentially independent effect of nicotine
dose on the ratio of trans-3'-hydroxycotinine to cotinine.
While there is strong evidence for CYP2A6 as the predominant catalyst of nicotine
C-oxidation to cotinine this is not the case for cotinine C-oxidation to trans-3'-
hydroxycotinine. If CYP2A6 is not the predominant catalyst of the latter reaction then
the ratio of of trans-3'-hydroxycotinine to cotinine would not be a specific marker for
CYP2A6 activity. There is an interesting case report of a pack-a-day smoker who had a
CYP2A6 null allele and had 10-fold lower than average plasma cotinine concentrations,
but was found to have essentially normal cotinine clearance in a pharmacokinetic study
(139). Nakajimi et al. demonstrated that P450 2A6 catalyzes cotinine oxidation, and a
product eluted at the retention time of trans-3'-hydroxycotinine standard (140). Product
28
inhibition was observed with anti-2A antibody and activity correlated with P450 2A6
content and coumarin 7-hydroxylation, which is catalyzed exclusively by 2A6 in
HLMs. Unfortunately, the product peak was not further characterized, and a conflicting
report that human liver microsomes formed surprisingly low levels of trans-3'-
hydroxycotinine from nicotine has been largely ignored (141). It turns out that trans-3'-
hydroxycotinine is only one of three products generated by P450 2A6 when incubated
with cotinine. N-(hydroxymethyl)norcotinine, is the major product formed by human
liver microsomes or P450 2A6, followed by trans-5'-hydroxycotinine and trans-3'-
hydroxycotinine which are formed at rates less than half of that for methyl
hydroxylation (142). However, consistently less than 5 % of metabolites in urine are
derived from N-(hydroxymethyl)norcotinine (114). Therefore, it is unclear which
enzyme is the major catalyst responsible for trans-3'-hydroxycotinine formation in vivo
either from cotinine or directly from nicotine.
Glucuronide conjugates are formed from nicotine, cotinine, and trans-3'-
hydroxycotinine and are excreted in urine (111). N-glucuronidation of nicotine and
cotinine occurs at the pyridyl nitrogen. These reactions are catalyzed by UGTs 2B10
and 1A4 in vitro; UGT2B10 has the lowest Km and it is ~10-fold lower than UGT1A4
(87). However, the Vmax may be higher for UGT1A4, as estimated by Chen et al. to be
10-fold and 3- fold higher for nicotine and cotinine glucuronidation respectively (143).
Hepatic mRNA levels are comparable between these UGTs, although protein levels
have not been compared (87). In an in vitro study of eleven UGTs, 2B7 and 1A9 were
identified as the strongest candidates for trans-3'-hydroxycotinine O-glucuronidation
(144). Indeed, trans-3'-hydroxycotinine O-glucuronide is the major glucuronide in
29
smokers’ urine. Cotinine and nicotine N-glucuronide concentrations are correlated in
vivo, and are not correlated with trans-3'-hydroxycotinine glucuronides (112). The ratio
of cotinine glucuronide:cotinine in urine was used previously to compare
glucuronidation phenotypes in a pharmacokinetic study but it has not been used as a
biomarker per se (115;145).
The fate of nicotine depends on the activity, and presence or absence, of enzymes
along the metabolic pathways. Studies on variation in nicotine metabolism have
focused primarily on the C-oxidation of nicotine, as it is the major pathway of nicotine
metabolism and polymorphisms resulting in inactive protein (CYP2A6*2, CYP2A6*4)
were identified in the 1990s (146-148). Indeed, the P450 2A6 (CYP2A6) gene is highly
polymorphic, and several variants are associated with altered (increased or decreased)
nicotine metabolism, including variants found in African Americans (149-151). Yet
even among African Americans who are genotypically considered CYP2A6 wild-type,
there is significant variation in phenotype (150). UGT1A4 and UGT2B10 are also
polymorphic, though few variants have been evaluated in nicotine metabolism and no
variants that have a specific role in the African American population have been
identified (143;152;153).
A controlled dose nicotine metabolism study of African Americans and European
Americans was conducted to evaluate intraindividual variation and any ethnic
differences in nicotine metabolism. Nicotine and its major metabolites were analyzed
in urine while participants were abstinent from smoking and at steady state on the
nicotine patch, as well as while participants were smoking ad libitum. Nicotine
30
equivalents and the metabolite ratios, trans-3'-hydroxycotinine to cotinine and cotinine
glucuronide:cotinine, were further explored as biomarkers of nicotinine intake and
oxidation and glucuronidation phenotypes.
2.2 Methods
2.2.1 Nicotine patch study
Patch Study Recruitment
The study was approved by the University of Minnesota’s Institutional Review
Board. Smokers were recruited from the Minneapolis-St. Paul area through newspaper
advertisements, flyers, and word of mouth. Potential participants were scheduled by
telephone for a screening visit. Inclusion criteria were (1) age 18-74, (2) grandparents
who were all either African American or European American, (3) daily smoking > 10
cpd, and (4) in good health. A medical history questionnaire and vital signs were used
to assess health. Individuals who used illicit drugs and women who were pregnant were
ineligible. A total of 105 individuals enrolled.
Patch Study protocol
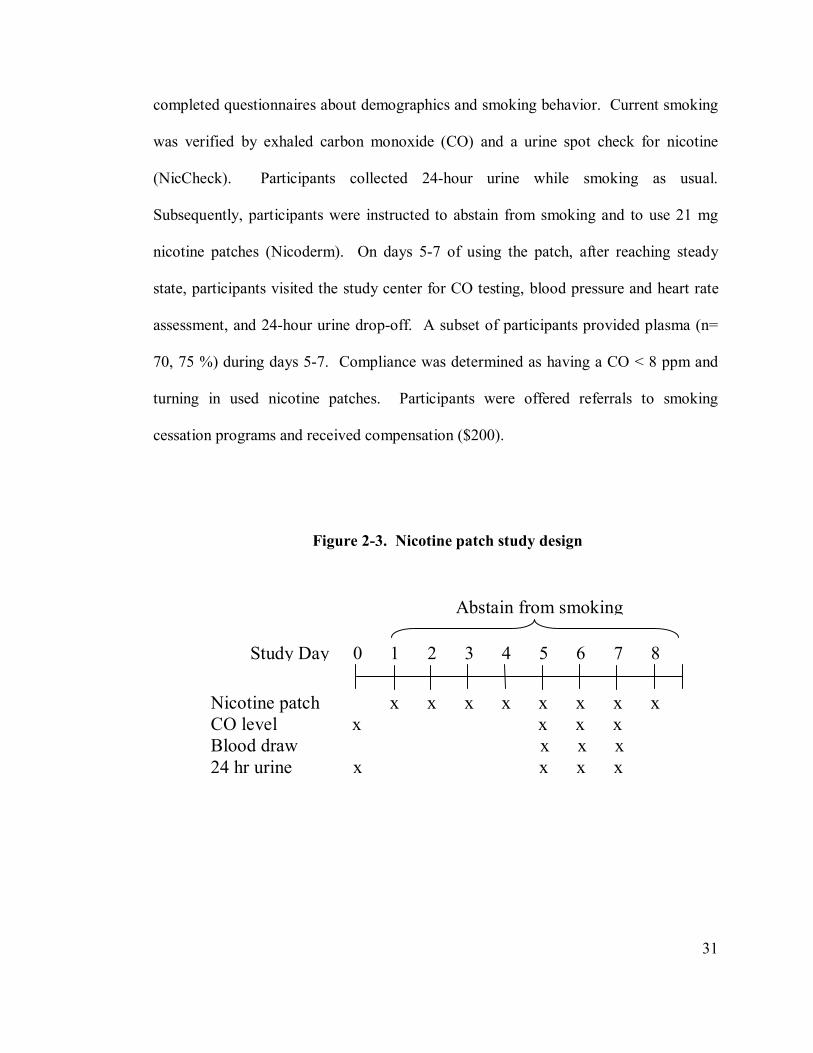
The 8-day study included baseline smoking assessment, and a controlled dose
period during which the nicotine patch was administered (Figure 2-3). Participants
31
completed questionnaires about demographics and smoking behavior. Current smoking
was verified by exhaled carbon monoxide (CO) and a urine spot check for nicotine
(NicCheck). Participants collected 24-hour urine while smoking as usual.
Subsequently, participants were instructed to abstain from smoking and to use 21 mg
nicotine patches (Nicoderm). On days 5-7 of using the patch, after reaching steady
state, participants visited the study center for CO testing, blood pressure and heart rate
assessment, and 24-hour urine drop-off. A subset of participants provided plasma (n=
70, 75 %) during days 5-7. Compliance was determined as having a CO < 8 ppm and
turning in used nicotine patches. Participants were offered referrals to smoking
cessation programs and received compensation ($200).
Figure 2-3. Nicotine patch study design
Study Day 0 1 2 3 4 5 6 7 8
Nicotine patch x x x x x x x x CO level x x x x Blood draw x x x 24 hr urine x x x x
Abstain from smoking
32
2.2.2 Chemicals and reagents
(S)-[5-3H]Nicotine was purified as previously described (123). Nicotine N-βD-
glucuronide was purchased from Toronto Research Chemicals (North York, ON,
Canada). Other chemicals were purchased from Sigma-Aldrich (St. Louis, MO) unless
otherwise noted.
2.2.3 Nicotine and metabolite analysis
Urine was stored at -20˚C until analysis. Four 24-hour urine samples were analyzed
(days 1 and 5-7) per participant by gas chromatography/mass spectrometry (GC/MS).
A brief description of these published methods is provided here (39;112;154). Base
treatment was used to cleave N-glucuronide conjugates of nicotine and cotinine; 0.1 N
NaOH for 30 min at 80°C. Internal standards, [methyl-D3]cotinine and [methyl-
D3]nicotine, were added prior to addition of 50 % aqueous K2CO3 and extraction with
CH2Cl2. The CH2Cl2 layer was mixed with CH3OH and concentrated under N2 (to ~100
µl). GC/MS was performed with selected ion monitoring for the nicotine-derived ions:
m/z 84 [C4H7NCH3]+, 87 [C4H7NCD3]+, 162 [M+, nicotine], and 165[M+,
[CD3]nicotine]; and cotinine-derived ions m/z 98 [C4H5ONCH3]+, 101 [C4H5ONCD3]+,
176 [M+, cotinine], and 179 [M+, [CD3]cotinine]. Free nicotine, total nicotine (free
nicotine + N-glucuronide), free cotinine, and total cotinine (free cotinine + N-
glucuronide) were quantified by comparison to the internal standards (39;112;154). β-
glucuronidase was used to cleave trans-3'-hydroxycotinine glucuronides for analysis of
33
total trans-3'-hydroxycotinine (trans-3'-hydroxycotinine + its glucuronides), and cis-3'-
hydroxycotinine was added as an internal standard. An extraction with CH2Cl2/IPA
was performed prior to derivitization with tert-butyldimethylsilyl followed by a second
extraction with toluene:butanol (154). Selective ion monitoring was performed for m/z
249, loss of the tert-butyl group. From whole blood, plasma was separated and stored at
-20ºC. Nicotine, cotinine and their N-glucuronides were quantified by GC/MS as
performed for urinary metabolites except that an initial solid phase extraction using a
MCX column was performed (Waters Corporation, Milford, MA) (39). Analyses were
performed in duplicate and repeated if values differed by > 10 %.
Other analyses
Exhaled CO was determined using a Medical Gas Monitor (Bedfont Scientific Ltd.,
Kent, United Kingdom). Urine spot checks for nicotine were performed using
NicCheck (Mossman Associates, Blackstone, MA).
2.2.4 Statistics
Patch participants were excluded from analyses if they were noncompliant: not
using the nicotine patch as directed, smoking during the abstinence period, or
incomplete urine collection. Specifically, participants were excluded if on more than
one visit they excreted < 20 % or > 120 % of the patch dose or had exhaled CO levels >
34
8 ppm. Single visits that met noncompliance criteria were excluded from analysis (8 of
279, 3%). Overall, 12 participants (7 African American) were excluded due to:
ethnicity was American Indian (n=1), not completing the study (n=2), dose recovery
was < 20 % (n=6), dose recovery was > 120 % (n=3). Included in analyses were 93
participants. Baseline urine was available for 59 participants, after exclusion of 4
participants who returned < 400 ml of 24-hour urine at baseline.
Statistical analyses were conducted using SAS (SAS Institute, Cary, NC) and Excel
(Microsoft, Redmond, WA). Wilcoxon two-sided t-approximation statistics were
calculated to compare means of continuous variables that did not have a normal
distribution, and a p-value less than 0.05 was considered significant. Chi-square
approximation statistics were analyzed for categorical variables. Spearman
nonparametric correlation was used to assess univariate correlations. Multivariate
linear regression models were evaluated to assess predictors of cotinine glucuronidation
(square-root transformed ratio of cotinine glucuronide to free cotinine) and the C-
oxidation ratio (square-root transformed ratio of total trans-3'-hydroxycotinine to total
cotinine) (133).
2.3 Results
2.3.1 Patch study population
African American and European American participants were not statistically
different in age (mean = 38; range 26-56), gender (51 % female), cigarettes per day
35
(cpd) (mean = 21), or quit attempts (mean = 4). The distribution of time to first
cigarette after waking was 48 %, 0-5 min.; 37%, 6-30 min.; 11.5 %, 31-60 min.; 3.5 %,
> 60 min, and there was no difference by ethnicity. African American women reported
more quit attempts than men (6.1 versus 3.2, p =0.012) or European American women
(6.1 vs. 3.3, p = 0.02). Mentholated cigarettes were smoked by 86 % of the African
Americans and 24 % of European Americans (p < 0.0001). Fewer African Americans
than European Americans reported attending at least some college (43 % vs. 64 %, p =
0.04).
2.3.2 Nicotine metabolism on the patch
Free nicotine and free cotinine were quantified in plasma to assess nicotine dosing
achieved with the patch in 70 of 93 (75 %) of participants. At steady-state (day 6), free
cotinine concentrations were comparable to levels observed in smokers. Mean free
nicotine and free cotinine were 28.1 +/- 30.6 ng/ml and 311 +/- 170 ng/ml for African
Americans and 18.3 +/- 11.8 ng/ml and 245 +/- 129 ng/ml for European Americans and
were not statistically different by ethnicity. Plasma free cotinine was correlated with
24-hour urinary free cotinine; 0.49, p < 0.0001.
The dose of nicotine obtained from patch use was estimated relative to the amount
of nicotine in a patch. Specifically, the molar sum of nicotine and its metabolites in 24-
hour urine were expressed as a molar percentage of nicotine in a 21 mg patch (estimated
dose recovered). The mean estimated dose recovered on days 5-7 was 61 +/- 20 % for
36
African Americans and 70 +/- 25 % for European Americans (p = 0.09). The
intraindividual variation in the estimated dose recovered was 13 % for both African
Americans and European Americans.
Nicotine and nicotine metabolites were quantified in 24-hour urine from each
collection day and the values of 3 days for each individual were analyzed. Mean
intraindividual variation was less than half of mean interindividual variation. This was
assessed by calculating the mean of standard deviations for individuals and comparing
this value to the group standard deviation for a given analyte. Free cotinine had the
lowest intraindividual variation while free nicotine had the largest intraindividual
variation relative to interindividual variation.
There were no significant differences by ethnicity in mean total nicotine or total
cotinine (Table 2-2). However, free cotinine was higher among African Americans than
European Americans, 12.7 +/- 6.2 nmol/ml versus 9.5 +/- 4.2 nmol/ml, respectively (p =
0.01). While free nicotine was higher among African Americans than European
Americans, 12.9 +/- 9.4 nmol/ml versus 9.9 +/- 6.5 nmol/ml, the means were not
statistically different (p = 0.17). The observation that African Americans had higher
free cotinine but similar total cotinine levels reflects a difference in glucuronidation.
Nicotine equivalents, defined as the sum of nicotine, cotinine, trans-3'-hydroxycotinine
and their respective glucuronides, expressed as nmol/ml or µmol/24-hour urine, were
the same for African Americans and European Americans; 81.2 +/- 39.4 nmol/ml and
84.0 +/- 42.7 nmol/ml, respectively (120).
37
Glucuronide conjugation of both nicotine and cotinine was significantly lower
among African Americans compared with European Americans (Table 2-2). The
percent of nicotine excreted as a glucuronide conjugate in 24-hour urine was 18.1 +/-
12.7 % for African Americans versus 29.3 +/- 16.9 % for European Americans (p =
0.002). The percent of cotinine excreted as a glucuronide conjugate was 41.4 +/- 20.7
% for African Americans versus 61.7 +/- 14.2 % for European Americans (p < 0.0001).
Nicotine and cotinine glucuronidation were correlated in African Americans and
European Americans, 0.73 and 0.53 respectively (p= 0.11 for difference in correlation
by ethnicity). The distribution of percent cotinine excreted as a glucuronide was
distinct for African Americans (Figure 2-4). Few European Americans excreted less
than 50 % of cotinine as its glucuronide while this was common among African
Americans. We observed large interindividual variation in glucuronidation regardless
of ethnicity. The ranges of percent glucuronidation for nicotine and cotinine were 0.4 –
67.5 % and 8.6 – 84.4 % respectively. Intraindividual variation in percent
glucuronidation on days 5 – 7 was low with a mean standard deviation of 7.3 % for
nicotine (range, 0.1-53 %) and 4.9 % for cotinine (range, 0.1-21.8 %). There was no
difference in intraindividual variation by ethnicity.
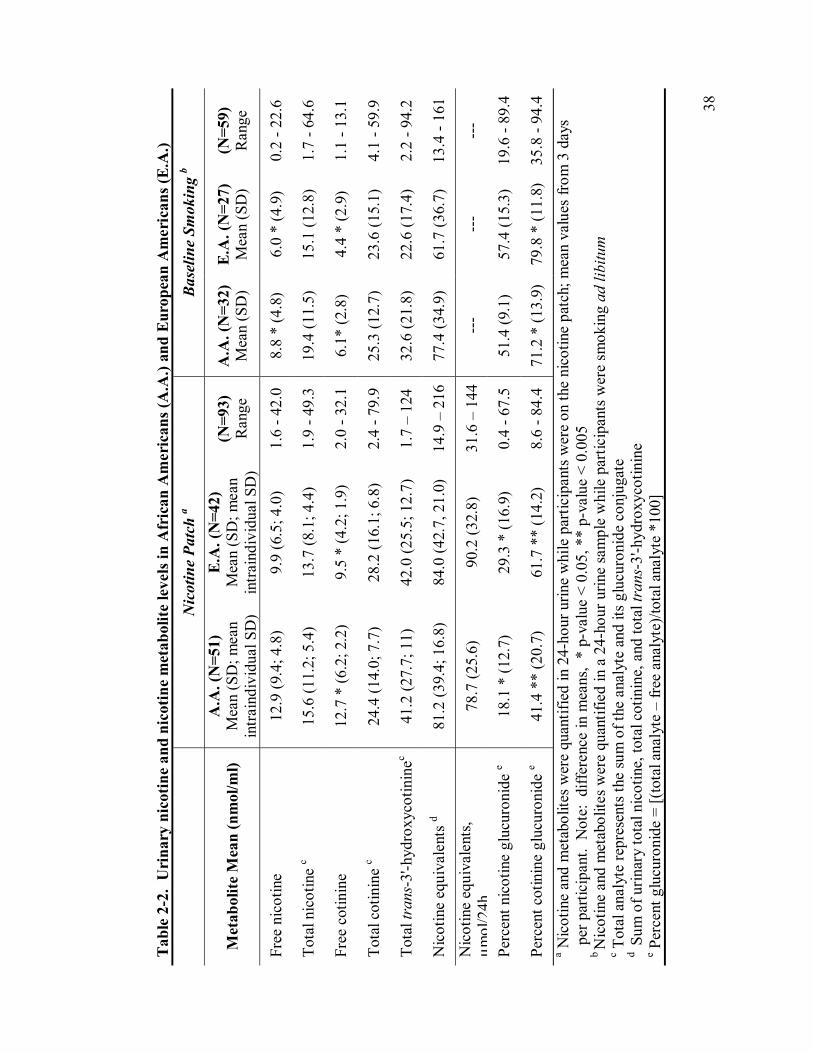
38
Tab
le 2
-2.
Uri
nary
nic
otin
e an
d ni
cotin
e m
etab
olite
leve
ls in
Afr
ican
Am
eric
ans (
A.A
.) an
d E
urop
ean
Am
eric
ans (
E.A
.)
Nic
otin
e Pa
tch
a B
asel
ine
Smok
ing
b
Met
abol
ite M
ean
(nm
ol/m
l) A
.A. (
N=5
1)
Mea
n (S
D; m
ean
intra
indi
vidu
al S
D)
E.A
. (N
=42)
M
ean
(SD
; mea
n in
train
divi
dual
SD
)
(N=9
3)
Ran
ge
A.A
. (N
=32)
M
ean
(SD
) E
.A. (
N=2
7)
Mea
n (S
D)
(N=5
9)
Ran
ge
Free
nic
otin
e
12.9
(9.4
; 4.8
) 9.
9 (6
.5; 4
.0)
1.6
- 42.
0 8.
8 *
(4.8
) 6.
0 *
(4.9
) 0.
2 - 2
2.6
Tota
l nic
otin
e c
15.6
(11.
2; 5
.4)
13.7
(8.1
; 4.4
) 1.
9 - 4
9.3
19.4
(11.
5)
15.1
(12.
8)
1.7
- 64.
6
Free
cot
inin
e 12
.7 *
(6.2
; 2.2
) 9.
5 *
(4.2
; 1.9
) 2.
0 - 3
2.1
6.1*
(2.8
) 4.
4 *
(2.9
) 1.
1 - 1
3.1
Tota
l cot
inin
e c
24.4
(14.
0; 7
.7)
28.2
(16.
1; 6
.8)
2.4
- 79.
9 25
.3 (1
2.7)
23
.6 (1
5.1)
4.
1 - 5
9.9
Tota
l tra
ns-3
'-hyd
roxy
cotin
inec
41.2
(27.
7; 1
1)
42.0
(25.
5; 1
2.7)
1.
7 –
124
32.6
(21.
8)
22.6
(17.
4)
2.2
- 94.
2
Nic
otin
e eq
uiva
lent
s d 81
.2 (3
9.4;
16.
8)
84.0
(42.
7, 2
1.0)
14
.9 –
216
77
.4 (3
4.9)
61
.7 (3
6.7)
13
.4 -
161
Nic
otin
e eq
uiva
lent
s, µm
ol/2
4h78
.7 (2
5.6)
90
.2 (3
2.8)
31
.6 –
144
--
- --
- --
-
Perc
ent n
icot
ine
gluc
uron
ide
e 18
.1 *
(12.
7)
29.3
* (1
6.9)
0.
4 - 6
7.5
51.4
(9.1
) 57
.4 (1
5.3)
19
.6 -
89.4
Perc
ent c
otin
ine
gluc
uron
ide
e 41
.4 *
* (2
0.7)
61
.7 *
* (1
4.2)
8.
6 - 8
4.4
71.2
* (1
3.9)
79
.8 *
(11.
8)
35.8
- 94
.4a N
icot
ine
and
met
abol
ites w
ere
quan
tifie
d in
24-
hour
urin
e w
hile
par
ticip
ants
wer
e on
the
nico
tine
patc
h; m
ean
valu
es fr
om 3
day
s pe
r par
ticip
ant.
Not
e: d
iffer
ence
in m
eans
, *
p-va
lue
< 0.
05, *
* p-
valu
e <
0.00
5
b N
icot
ine
and
met
abol
ites w
ere
quan
tifie
d in
a 2
4-ho
ur u
rine
sam
ple
whi
le p
artic
ipan
ts w
ere
smok
ing
ad li
bitu
m
c Tot
al a
naly
te re
pres
ents
the
sum
of t
he a
naly
te a
nd it
s glu
curo
nide
con
juga
te
d S
um o
f urin
ary
tota
l nic
otin
e, to
tal c
otin
ine,
and
tota
l tra
ns-3
'-hyd
roxy
cotin
ine
e Per
cent
glu
curo
nide
= [(
tota
l ana
lyte
– fr
ee a
naly
te)/t
otal
ana
lyte
*10
0]
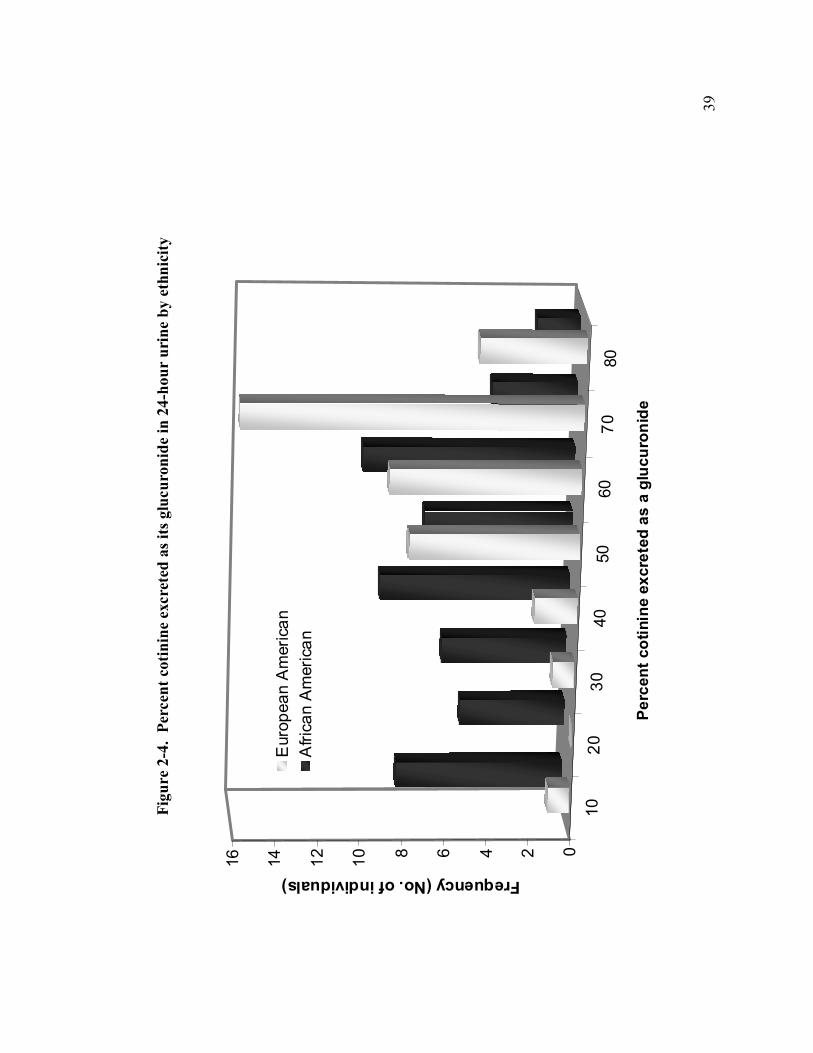
39
Figu
re 2
-4.
Perc
ent c
otin
ine
excr
eted
as i
ts g
lucu
roni
de in
24-
hour
uri
ne b
y et
hnic
ity
1020
3040
5060
7080
0246810121416
Frequency (No. of individuals)
Perc
ent c
otin
ine
excr
eted
as
a gl
ucur
onid
e
Eur
opea
n A
mer
ican
Afri
can
Am
eric
an
40
The ratio of trans-3'-hydroxycotinine to cotinine has been used and promoted as a
marker of nicotine oxidation phenotype (133;135), and we evaluated this ratio in urine
as total trans-3'-hydroxycotinine to total cotinine. The range of the ratio was 0.10 – 7,
plus an outlier of 15.8. The ratio was not statistically different by ethnicity; the mean
ratio was 2.28 +/- 2.42 for African Americans and 1.62 +/- 1.12 for European
Americans (p = 0.27). Total trans-3'-hydroxycotinine:total cotinine was highly
correlated with the ratio of total trans-3'-hydroxycotinine:free cotinine in both ethnic
groups, 0.79 (p < 0.0001). Notably, both ratios were correlated with percent cotinine
glucuronidation.
Predictors of glucuronidation, assessed as the ratio of cotinine glucuronide to
cotinine, were evaluated by multivariate linear regression (Table 2-3). The ratio of
cotinine glucuronide:cotinine has been used by Benowitz et al. to evaluate
glucuronidation phenotype (145). This is analogous to using trans-3'-
hydroxycotinine:cotinine as an estimate of nicotine C-oxidation activity (108;115). In
univariate comparisons, a lower glucuronidation ratio was significantly correlated with
a number of study variables including African American ethnicity, male gender, older
age, lower nicotine equivalents, higher C-oxidation ratio, lower percent of dose excreted
as nicotine, and lower percent dose recovered. The glucuronidation ratio was not
correlated with baseline cigarettes/day or urine volume. Variables that were correlated
with the glucuronidation ratio were entered into a multivariate regression model with
stepwise selection. In the final model, a low glucuronidation ratio was associated with
African American ethnicity, low nicotine equivalents, high C-oxidation ratio, and older
age. Gender was forced back into the model presented in Table 2-3, though it does not
41
affect the R2 value. The adjusted R2 value for the model was 0.41, compared with 0.35
if the C-oxidation ratio was not included.
Predictors of the trans-3'-hydroxycotinine:total cotinine ratio were evaluated during
use of the nicotine patch (Table 2-4). A higher C-oxidation ratio was correlated with a
lower glucuronidation ratio, higher nicotine equivalents, and lower percent of dose
excreted as total nicotine in univariate comparisons. In these data, the C-oxidation ratio
was not significantly correlated with ethnicity, age, gender, cpd, urine volume, or
percent of dose recovered. In multivariate linear regression, 30 % of variation in the C-
oxidation ratio was attributable to nicotine equivalents, the glucuronidation ratio, and
percent dose excreted as nicotine. Ethnicity, gender, and age were forced back into the
model presented in Table 2-4.
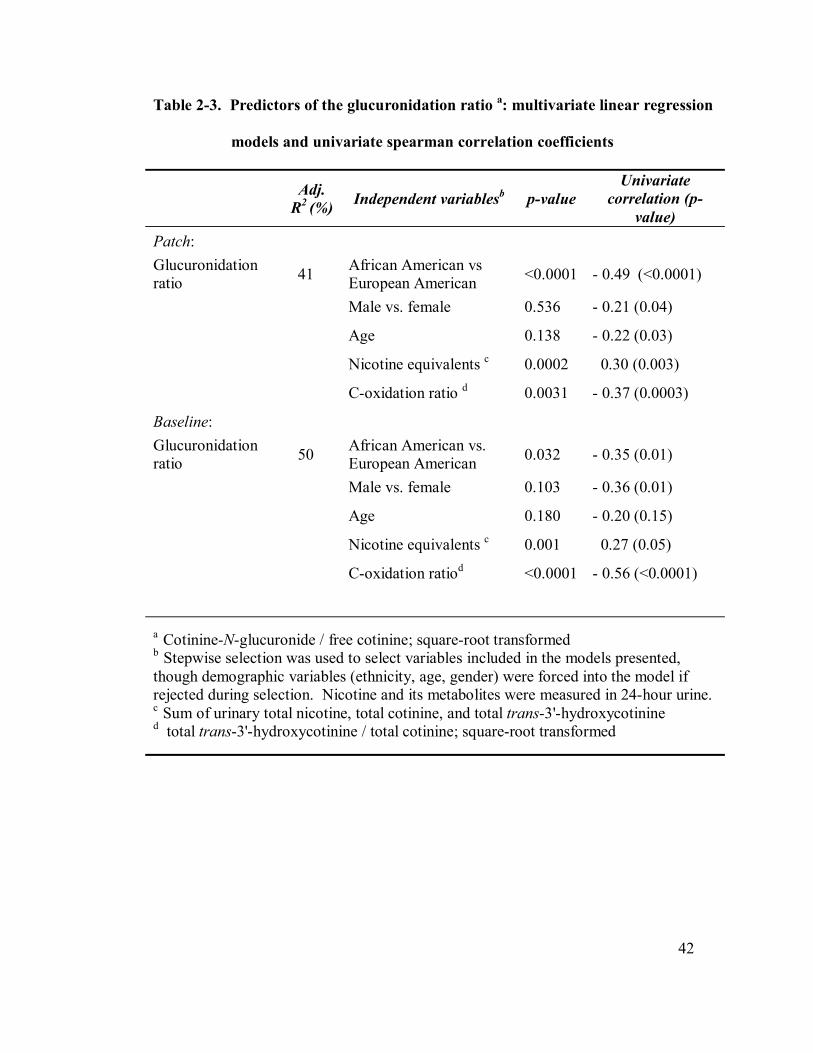
42
Table 2-3. Predictors of the glucuronidation ratio a: multivariate linear regression
models and univariate spearman correlation coefficients
Adj. R2 (%) Independent variablesb p-value
Univariate correlation (p-
value) Patch: Glucuronidation ratio 41 African American vs
European American <0.0001 - 0.49 (<0.0001)
Male vs. female 0.536 - 0.21 (0.04)
Age 0.138 - 0.22 (0.03)
Nicotine equivalents c 0.0002 0.30 (0.003)
C-oxidation ratio d 0.0031 - 0.37 (0.0003)
Baseline: Glucuronidation ratio 50 African American vs.
European American 0.032 - 0.35 (0.01)
Male vs. female 0.103 - 0.36 (0.01)
Age 0.180 - 0.20 (0.15)
Nicotine equivalents c 0.001 0.27 (0.05)
C-oxidation ratiod <0.0001 - 0.56 (<0.0001)
a Cotinine-N-glucuronide / free cotinine; square-root transformed b Stepwise selection was used to select variables included in the models presented, though demographic variables (ethnicity, age, gender) were forced into the model if rejected during selection. Nicotine and its metabolites were measured in 24-hour urine. c Sum of urinary total nicotine, total cotinine, and total trans-3'-hydroxycotinine d total trans-3'-hydroxycotinine / total cotinine; square-root transformed
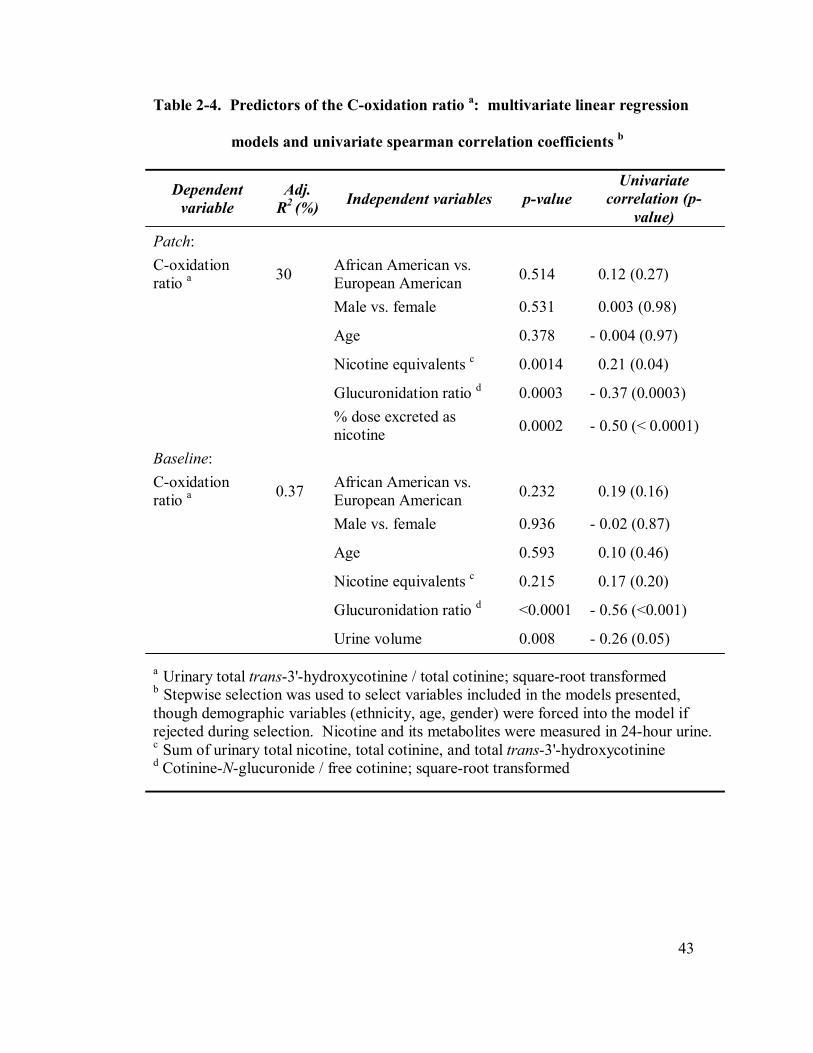
43
Table 2-4. Predictors of the C-oxidation ratio a: multivariate linear regression
models and univariate spearman correlation coefficients b
Dependent variable
Adj. R2 (%) Independent variables p-value
Univariate correlation (p-
value) Patch: C-oxidation ratio a 30 African American vs.
European American 0.514 0.12 (0.27)
Male vs. female 0.531 0.003 (0.98)
Age 0.378 - 0.004 (0.97)
Nicotine equivalents c 0.0014 0.21 (0.04)
Glucuronidation ratio d 0.0003 - 0.37 (0.0003)
% dose excreted as nicotine 0.0002 - 0.50 (< 0.0001)
Baseline: C-oxidation ratio a 0.37 African American vs.
European American 0.232 0.19 (0.16)
Male vs. female 0.936 - 0.02 (0.87)
Age 0.593 0.10 (0.46)
Nicotine equivalents c 0.215 0.17 (0.20)
Glucuronidation ratio d <0.0001 - 0.56 (<0.001)
Urine volume 0.008 - 0.26 (0.05)
a Urinary total trans-3'-hydroxycotinine / total cotinine; square-root transformed b Stepwise selection was used to select variables included in the models presented, though demographic variables (ethnicity, age, gender) were forced into the model if rejected during selection. Nicotine and its metabolites were measured in 24-hour urine. c Sum of urinary total nicotine, total cotinine, and total trans-3'-hydroxycotinine d Cotinine-N-glucuronide / free cotinine; square-root transformed
44
2.3.3 Baseline nicotine metabolism
Nicotine and nicotine metabolites were quantified in 24-hour urine at baseline while
participants were smoking ad libitum (Table 2-2). Free nicotine and free cotinine were
higher in African Americans compared to European Americans, 8.8 versus 6.0 nmol/ml
(p = 0.02) and 6.1 versus 4.4 nmol/ml (p = 0.01), respectively. Between ethnic groups
there were no statistically significant differences in total nicotine (p = 0.07), total
cotinine (p = 0.54), or total trans-3'-hydroxycotinine (p = 0.06). The correlation
between total nicotine and total cotinine was 0.70 (p < 0.0001). Mean nicotine
equivalents were 77.4 nmol/ml and 61.7 nmol/ml among African Americans and
European Americans respectively (p = 0.09). Notably, mean nicotine equivalents per
cigarette were higher for African Americans compared to European Americans, 4.7
nmol/ml versus 3.0 nmol/ml (p = 0.02).
The mean percent nicotine or cotinine excreted as a glucuronide at baseline is
presented in Table 2-2. The correlation between percent nicotine and cotinine
glucuronidation was 0.63 (p < 0.0001). The percent nicotine excreted as its glucuronide
was 51.4 % and 57.4 % among African Americans and European Americans
respectively (p = 0.05). The percent cotinine excreted as its glucuronide was lower
among African Americans compared to European Americans, 71.2 % versus 79.8 % (p
= 0.01).
There was no difference in the mean the trans-3'-hydroxycotinine : total cotinine
ratio by ethnicity at baseline. The ratio had an overall range of 0.1 – 3.7. The mean
ratios were 1.5 +/- 1.0 and 1.1 +/- 0.6 among African Americans and European
45
Americans respectively (p = 0.17). There was also no ethnic difference if the ratio was
calculated as total trans-3'-hydroxycotinine to free cotinine (p = 0.92). However, the
correlation between total trans-3'-hydroxycotinine and total cotinine was lower among
African Americans than European Americans; 0.36 versus 0.72 with 95 % confidence
intervals, 0.002-0.637 and 0.456-0.864, respectively (p = 0.06).
We analyzed predictors of the glucuronidation and oxidation ratios during smoking
(Table 2). In univariate comparisons, a low glucuronidation ratio was correlated with
male gender, lower nicotine equivalents, and a higher C-oxidation ratio. The strongest
correlation was between the glucuronidation ratio and the C-oxidation ratio; - 0.56, p <
0.0001). In a multivariate model, African American ethnicity, low nicotine equivalents,
and a high oxidation ratio were significant predictors of cotinine glucuronidation with
an adjusted R2 value of 0.50 (Table 3). Predictors of a high C-oxidation ratio were a
low glucuronidation ratio and low urine volume, and no associations were observed
with ethnicity, gender, age, or nicotine equivalents. A limited linear regression model
with the glucuronidation ratio and urine volume had an adjusted R2 value of 0.39, and
this model was not improved by inclusion of other variables.
2.4 Discussion
Higher free cotinine levels have been consistently reported among African
Americans compared to European Americans (41;106;108). To the extent that higher
cotinine levels reflect higher nicotine exposure and correspondingly exposure to
46
tobacco carcinogens, higher cotinine could explain a portion of the increased cancer risk
observed among African Americans. In our study, African Americans received a higher
dose of nicotine per cigarette than European Americans as observed by Benowitz et al.,
presumably due to a difference in smoking behavior (107;145). However, differences
in nicotine metabolism independent of dose per cigarette also contributed to ethnic
differences in free cotinine levels. The major finding of this study was that among
abstinent smokers on the nicotine patch, African Americans excreted less nicotine and
cotinine as their glucuronide conjugates than European Americans. Importantly, higher
free cotinine among African Americans was accounted for by lower glucuronide
conjugation in the controlled dose setting.
Our study bridges the findings of an elegant pharmacokinetics study published
several years ago by Benowitz et al. who originally observed that nicotine and cotinine
glucuronidation may be lower in African Americans compared to European Americans
(145). In this study, smokers were infused with deuterium-labeled nicotine (D2) and
deuterium-labeled cotinine (D4), and metabolites were quantified in plasma and urine.
Among African Americans, the percent glucuronidation of nicotine and cotinine was
lower for both labeled and unlabeled (ie. from smoking) analytes in 8-hour urine.
Moreover, nonrenal clearance of cotinine was decreased and renal clearance of free
cotinine was increased. Ours is the first subsequent study that was designed to quantify
any ethnic difference in glucuronidation; it corroborated the previous outcome in a
separate population, extended the findings to the nicotine patch, and evaluated short-
term intraindividual variation. Also, the observed difference in glucuronidation
occurred in the absence of exposure to other constituents in tobacco smoke since
47
participants had not smoked for 4 days prior to sample collection and this eliminated the
possibility that a tobacco constituent for which exposures differ between ethnic groups
caused the variation in glucuronidation.
Since the majority of African Americans smoke menthol cigarettes compared to a
minority of European Americans, this has been proposed as an explanation for ethnic
differences in nicotine metabolism. However, menthol was not a factor in our study
since the half-life of menthol is about an hour and our participants were biochemically
confirmed to be abstinent from smoking (155). In the study by Benowitz et al., menthol
could have affected metabolite concentrations only in later plasma samples (6- and 8-
hour timepoints) and in the 8-hour urine because participants were abstinent from 10
p.m. the night preceding the study to 1 pm during the procedure day (145).
In multivariate analyses, lower cotinine glucuronidation was associated with African
American ethnicity as well as a higher total trans-3'-hydroxycotinine to total cotinine
(C-oxidation ratio) in urine. However, there was no association between ethnicity and
the C-oxidation ratio, either while participants were on the patch or smoking. The C-
oxidation ratio in urine is highly correlated with the plasma ratio, which has been used
as a biomarker for P450 2A6 activity (135). Yet, Swan et al. reported that variation in
the urine ratio is greater than in the plasma ratio and it is likely influenced by the
contribution of other genes (156). We observed that glucuronidation is associated with
the urinary C-oxidation ratio, and contributes to variation in the urinary C-oxidation
ratio. Consequently, caution is warranted in comparing the urinary oxidation ratio as a
marker of P450 2A6 activity at least between populations with different glucuronidation
48
phenotypes. This observation is independent of the additional problem that P450 2A6-
catalyzes the formation of two other cotinine metabolites and that the in vivo catalyst(s)
has not been definitively ascertained.
We did not observe evidence for an ethnic difference in C-oxidation of nicotine or
cotinine. On the nicotine patch, there were no differences in total cotinine or total
trans-3'-hydroxycotinine in urine or plasma. Also, there was no difference in the ratio
of total trans-3'-hydroxycotinine to total cotinine by ethnicity. The higher cotinine
concentrations observed for African Americans on the patch were accounted for by a
decrease in its glucuronide conjugate.
In contrast, Benowitz et al. interpreted their data as indicating that African
Americans had lower glucuronidation and lower oxidation (145). The fractional
conversion of nicotine to cotinine (fnic->cot) was calculated as the AUC-D2-cotinine/dose-
D2-nicotine * dose-D4-cotinine/AUC-D4-cotinine. The first term reflects metabolism of
D2-nicotine to cotinine and the second term is total cotinine clearance based on co-
administered D4-cotinine. Total clearance of D4-cotinine was definitively lower among
African Americans in this pharmacokinetics study, perhaps due solely to decreased
glucuronidation. In any case, even if nicotine metabolism to cotinine was identical
between ethnic groups the fnic->cot still would have been lower based on the calculation
used. Only if total clearance of cotinine had been faster among African Americans,
resulting in a decreased AUC-D4-cotinine, could the calculated fnic->cot have been the
same or higher compared to European Americans. Thus, these data are not necessarily
49
consistent with decreased oxidation and it seems that a decrease in glucuronidation
among African Americans could entirely explain the previously published data.
2.5 Conclusion
In conclusion, the major finding of our study was that African Americans had lower
nicotine and cotinine glucuronidation than European Americans on the nicotine patch
and during baseline smoking. Cotinine is the most commonly used biomarker of
nicotine exposure (157;158). However, we have shown that use of cotinine as the sole
biomarker would result in overestimation of nicotine exposure among African
Americans compared to European Americans. For example, higher cotinine levels due
to lower glucuronidation, independent of exposure, could confound ethnic studies of
cancer risk. Knowledge of nicotine metabolism in a population can facilitate selection
of tobacco biomarkers, and in the situation where tobacco exposure is compared
between African Americans and European Americans, total cotinine (cotinine +
glucuronides) or nicotine equivalents are better biomarkers than free cotinine. We
expect that the higher prevalence of a low glucuronidation phenotype among African
Americans, due to genetic or environmental factors, will also proportionally affect the
disposition of other drugs and xenobiotics. A low glucuronidation phenotype could
increase risk of toxicity from compounds that are detoxified by N-glucuronidation.
50
2.6 Acknowledgements
Many thanks to Elizabeth Thompson, Gregory Blaufuss, and May Wang for their
assistance in preparing samples and quantifying nicotine metabolites. I also thank Dr.
Jasit Ahluwalia and Office of Clinical Research, Univ. of MN, for generous support.
2.7 Publication of thesis work
The work discussed in Chapter 2 was published: Jeannette Zinggeler Berg, Jesse
Mason, Angela J. Boettcher, Dorothy K. Hatsukami, and Sharon E. Murphy. Nicotine
metabolism in African Americans and European Americans: variation in
glucuronidation by ethnicity and UGT2B10 haplotype. J Pharmacol. Exp. Ther. 2009;
available online September 28, 2009.
51
CHAPTER 3
UGT2B10 genotype and nicotine metabolism
Content included in this chapter is reprinted with permission of the American Society
for Pharmacology and Experimental Therapeutics. All rights reserved.
3.1 Introduction
Nicotine and cotinine glucuronidation contribute to overall nicotine metabolism, and
there is significant interindividual variation in the formation of these glucuronides.
Nicotine and cotinine glucuronides constitute 25 % of the sum of nicotine and its
metabolites in smokers’ urine on average (159). A similar percentage of nicotine and
cotinine glucuronides are excreted in urine following intravenous or transdermal
nicotine administration (32). Nicotine glucuronide can account for greater than 40 % of
nicotine and its metabolites in individuals with low capacity for nicotine C-oxidation
(118). Cotinine glucuronide can also account for up to 40 % of the estimated nicotine
dose (112). However, in other individuals, nicotine and cotinine glucuronides are not
detected (32;111;112).
It is not known if differences in glucuronidation can explain variation in smoking
behavior or addiction to nicotine. However, individuals with substantially decreased
nicotine C-oxidation, such as individuals with deleted CYP2A6, do exhibit lower
52
intensity smoking behavior (e.g. lower nicotine equivalents, a modest decrease in
cigarettes/day) (115;132). The pharmacokinetics of nicotine metabolism are altered in
individuals who are homozygous or heterozygous for known low activity CYP2A6
alleles, resulting in a longer nicotine t1/2 and slower nonrenal nicotine clearance (115).
The prevailing view is that these individuals achieve and maintain similar levels of
nicotine compared to individuals with average nicotine oxidation while having lower
nicotine intake (134;137;160;161). Therefore a decrease in glucuronidation – perhaps
in the context of lower nicotine C-oxidation – may also affect smoking behavior. There
are no published reports that have evaluated an effect of glucuronidation on smoking.
Identifying the enzymes responsible for nicotine and cotinine glucuronidation has
progressed slowly, and has depended on several scientific advances. Around 1990,
nicotine and cotinine glucuronides were first identified as nicotine metabolites. The
structure of cotinine glucuronide was deduced based on liquid chromatography/mass
spectrometry (LC/MS) analysis of cotinine glucuronide in smokers’ urine in comparison
to NMR-confirmed synthetic standard (162). NMR analysis of nicotine glucuronide
standard as well as products from incubations with human liver microsomes (HLMs)
and UGT1A4 confirmed the structure of nicotine glucuronide (163). Specifically,
conjugation occurs at the nitrogen of the pyridine ring for both molecules (Figure 3-1).
These glucuronides were initially quantified in incubations with HLMs using
radioactive substrates and radioflow HPLC. However, a ~20-fold lower limit of
detection was achieved with LC/MS/MS and this facilitated evaluating the role of
individually-expressed UGTs, which have low activity compared to HLMs (87;163).
Unfortunately, there are still a limited number of specific antibodies and inhibitors.
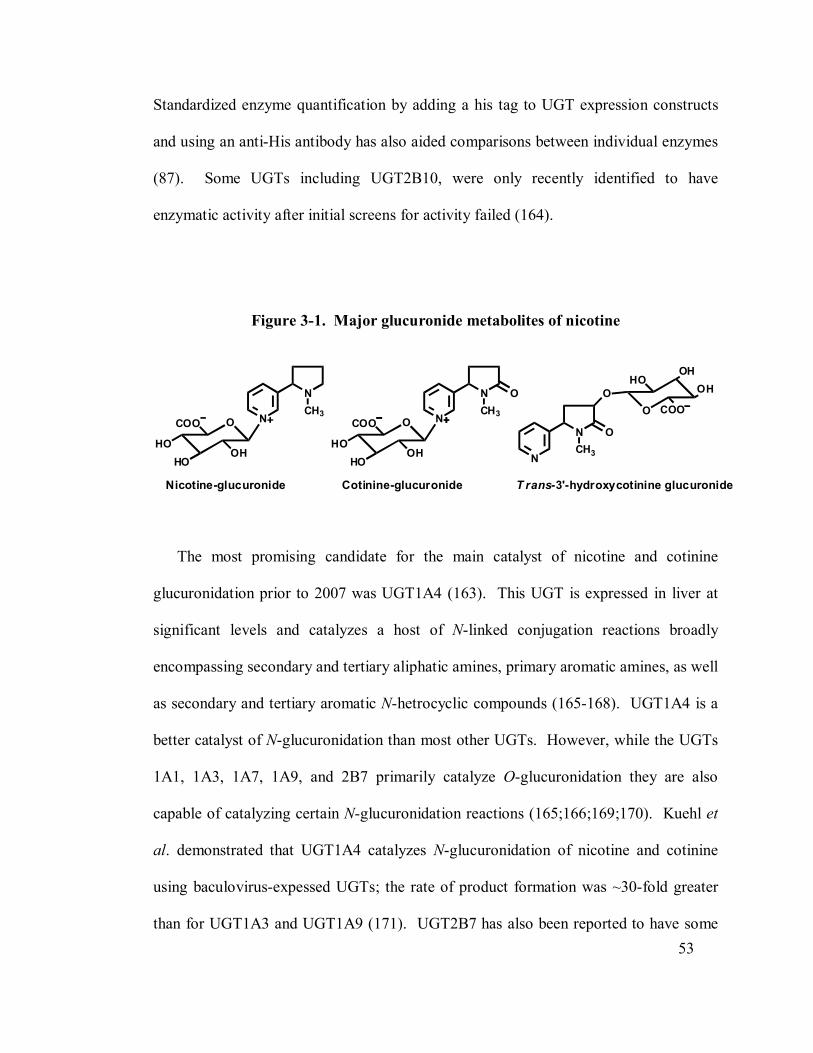
53
Standardized enzyme quantification by adding a his tag to UGT expression constructs
and using an anti-His antibody has also aided comparisons between individual enzymes
(87). Some UGTs including UGT2B10, were only recently identified to have
enzymatic activity after initial screens for activity failed (164).
Figure 3-1. Major glucuronide metabolites of nicotine
N
NCH3
Nicotine-glucuronide
O
HOHO
OH
COO N
NCH3
Cotinine-glucuronide
O
HOHO
OH
COO
O
N
NCH3
T rans-3'-hydroxycotinine glucuronide
O
OHOH
HO
COO
O
O
The most promising candidate for the main catalyst of nicotine and cotinine
glucuronidation prior to 2007 was UGT1A4 (163). This UGT is expressed in liver at
significant levels and catalyzes a host of N-linked conjugation reactions broadly
encompassing secondary and tertiary aliphatic amines, primary aromatic amines, as well
as secondary and tertiary aromatic N-hetrocyclic compounds (165-168). UGT1A4 is a
better catalyst of N-glucuronidation than most other UGTs. However, while the UGTs
1A1, 1A3, 1A7, 1A9, and 2B7 primarily catalyze O-glucuronidation they are also
capable of catalyzing certain N-glucuronidation reactions (165;166;169;170). Kuehl et
al. demonstrated that UGT1A4 catalyzes N-glucuronidation of nicotine and cotinine
using baculovirus-expessed UGTs; the rate of product formation was ~30-fold greater
than for UGT1A3 and UGT1A9 (171). UGT2B7 has also been reported to have some
54
nicotine glucuronidation activity, but no cotinine glucuronidation was observed (87).
Nicotine glucuronidation by HLMs was inhibited by 30-50 % with imipramine, a
UGT1A4 substrate (163). In 2007 the role of UGT1A4 as a catalyst of nicotine and
cotinine glucuronidation was again confirmed, but at this time two groups also
identified UGT2B10 as a good catalyst of nicotine and cotinine glucuronidation
(87;143). UGT2B10 has the lowest Km for nicotine and cotinine glucuronidation of all
UGTs tested in vitro.
UGT2B10 was considered an inactive or orphan UGT for years prior to discovery
that it is active and metabolizes both endogenous and exogenous molecules. UGT2B10
was cloned in 1993, expressed in COS-7 cells, and screened for activity with >40
compounds, including imipramine, but no glucuronidation activity was detected (172).
Subsequently, human embryonic kidney fibroblast (HEK) expressed UGT2B10 was
found to catalyze O-linked glucuronidation of hydroxyeicosatetraenoic acids and 13-
hydroxyoctadecadieneoic acid and N-linked glucuronidation of the heterocyclic amine
N-hydroxy-2-amino-1-methyl-6-phenylimidazo[4,5-b]-pyridine (N-hydroxy PhIP, a
dietary carcinogen)(164;173). It also turns out that UGT2B10 does catalyze impramine
glucuronidation. There has been no public discussion on if a difference in DNA
sequence or expression system contributed to the discrepancy in observed enzymatic
activity or lack thereof. Kaivosaari et al. have reported that UGT2B10 loses activity
during the preparation of microsomes; UGT2B10 microsomes lost 60 % of activity
compared to cell homogenate while no difference was observed for UGT1A4 (87).
55
UGT2B10 and UGT1A4 likely both contribute to nicotine metabolism. UGT2B10
and UGT1A4 are predicted to be expressed at similar levels in the liver, although the
only data available is quantitative RT-PCR of 47 pooled liver samples (87). In vitro
kinetic parameters published for UGT2B10 and UGT1A4 are presented in Table 3-1.
Kaivosaari et al. reported Km values for HEK-expressed UGT2B10 and UGT1A4 where
rates were standardized to mg his-tagged protein and products were analyzed by LC/MS
(87). Km values were 10-fold and 1.5-fold lower for UGT2B10 than UGT1A4 for
nicotine and cotinine glucuronidation, respectively. However, glucuronidation rates
(pmol/min/mg) were 100-fold lower for expressed enzyme than HLMs and therefore
Vmax was not estimated. Chen et al. determined Km and Vmax values for baculovirus-
expressed UGT2B10 and UGT1A4, where products were analyzed by radioflow HPLC
(143). This group reported Km values that were 37-fold and 3-fold lower for UGT2B10
than UGT1A4 for nicotine and cotinine glucuronidation, respectively. Interestingly,
Chen et al. observed a higher apparent Vmax for nicotine and cotinine glucuronidation
by UGT1A4 than by UGT2B10. However, if UGT2B10 is unstable during the
preparation of microsomes then the Vmax may be underestimated.
Polymorphisms exist in both UGT1A4 and UGT2B10, and some of these
polymorphisms cause or are linked to altered metabolism of substrates. UGT1A4 is
part of the complex UGT1A locus containing 13 genes, each with a unique exon that is
essentially spliced to four common 3′ exons that are shared by members of the locus
(75).(174) Throughout the UGT1A locus there are 598 NCBI SNPs, including 12
missense SNPs in the coding region of UGT1A4 and 11 SNPs in the 3'- untranslated
region (The Single Nucleotide Polymorphism Database (dbSNP) of Nucleotide
56
Sequence Variation (2008) NCBI, NIH). The UGT1A4 polymorphisms Leu48Val and
Pro24Thr have altered metabolism of several substrates (e.g. imipramine, clozapine, β-
naphthylamine, dihydrotestosterone) in vitro (153;175). For example, the presence of a
Pro24Thr substitution in UGT1A4 correlated with increased N-glucuronidation of the
tobacco carcinogen 4-(methylnitrosamino)-1-(3-pyridyl)-1-butanol (NNAL) in a series
of human liver microsomes (176). The UGT1A4 Leu48Val polymorphism is found in
17 % of the Japanese population in 9 % of Caucasians; Pro24Thr was found in 8 % of
Caucasians (153;175). No studies on nicotine or cotinine metabolism by these variants
have been published. In the gene region of UGT2B10 there are 139 NCBI SNPs
including at least 3 missense SNPs (dbSNP). Identifying haplotypes has facilitated
screening for genotype-phenotype associations and has led to the identification of
previously undescribed SNPs that affect enzyme function or stability (152;177). A
variant of UGT2B10, described in detail below, decreases but does not abolish nicotine
and cotinine glucuronidation by HLMs.
A haplotype of UGT2B10 was found that was associated with significantly
decreased NNAL glucuronidation by human liver microsomes. DNA sequencing
identified only one nonsynonymous SNP in the coding region. This SNP was present in
2 liver samples that were homozygous for the haplotype associated with low
glucuronidation and was absent in 5 liver samples with other haplotypes and average
glucuronidation (177). In vitro, HEK cells transfected with UGT2B10 67Tyr results in
mRNA levels that are similar to wild type, but microsomes prepared from these cells
had almost now NNAL glucuronidation activity (177).
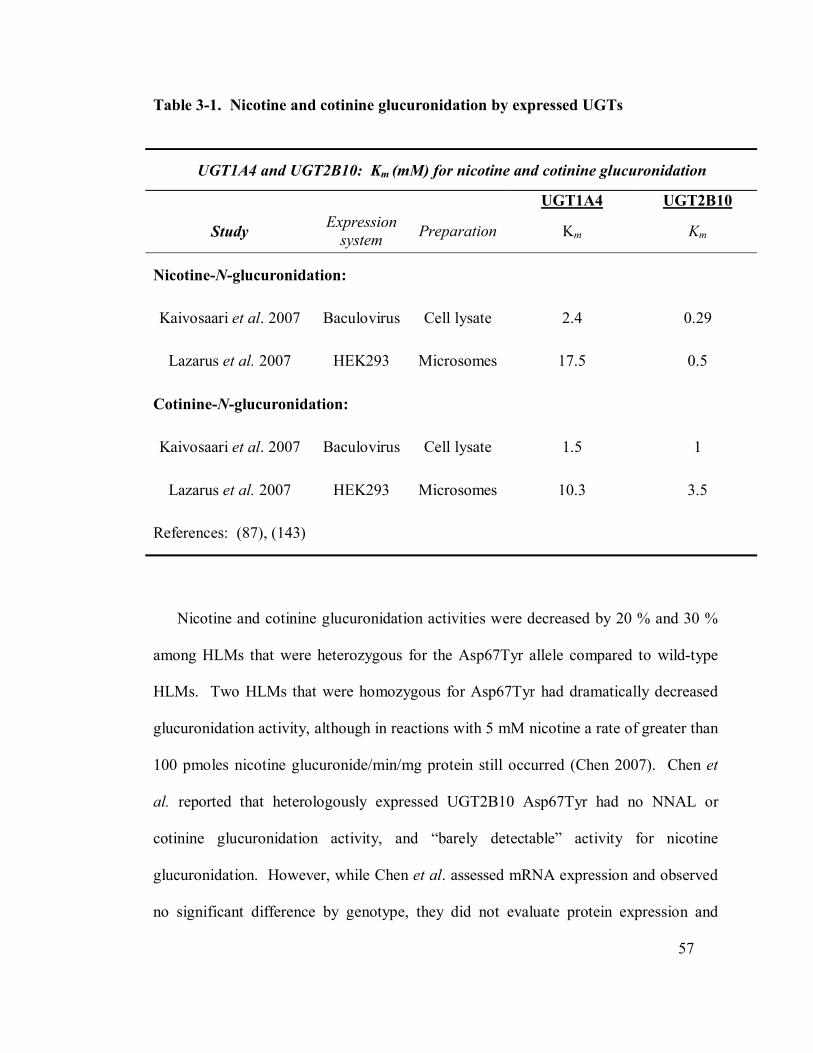
57
Table 3-1. Nicotine and cotinine glucuronidation by expressed UGTs
UGT1A4 and UGT2B10: Km (mM) for nicotine and cotinine glucuronidation
UGT1A4 UGT2B10
Study Expression system Preparation Km Km
Nicotine-N-glucuronidation:
Kaivosaari et al. 2007 Baculovirus Cell lysate 2.4 0.29
Lazarus et al. 2007 HEK293 Microsomes 17.5 0.5
Cotinine-N-glucuronidation:
Kaivosaari et al. 2007 Baculovirus Cell lysate 1.5 1
Lazarus et al. 2007 HEK293 Microsomes 10.3 3.5
References: (87), (143)
Nicotine and cotinine glucuronidation activities were decreased by 20 % and 30 %
among HLMs that were heterozygous for the Asp67Tyr allele compared to wild-type
HLMs. Two HLMs that were homozygous for Asp67Tyr had dramatically decreased
glucuronidation activity, although in reactions with 5 mM nicotine a rate of greater than
100 pmoles nicotine glucuronide/min/mg protein still occurred (Chen 2007). Chen et
al. reported that heterologously expressed UGT2B10 Asp67Tyr had no NNAL or
cotinine glucuronidation activity, and “barely detectable” activity for nicotine
glucuronidation. However, while Chen et al. assessed mRNA expression and observed
no significant difference by genotype, they did not evaluate protein expression and
58
different protein levels for the Asp67Tyr construct or a difference in enzyamtic activity
may explain the results.
A potential deletion of UGT2B10 may also exist, based on publically available
data from copy number variation (CNV) discovery projects. Putative insertion/deletion
regions overlap with UGT2B10. PCR analysis could positively identify the presence of
a deletion if primers are designed for sequences 5' and 3' to the break point regardless of
the size of the deletion. However, this approach is dependent on accurate assessment of
breakpoints which in turn depends on the coverage of comparative genome
hybridization arrays.
To determine if UGT2B10 influences nicotine and cotinine glucuronidaiton in vivo
we genotyped smokers for the UGT2B10 Asp67Tyr allele and evaluated the association
of genotype with nicotine metabolism phenotype. We hypothesized that individuals
with the Asp67Tyr variant would excrete less nicotine and cotinine as glucuronides in
urine. In addition, we investigated if the Asp67Tyr variant was present among African
Americans and if the frequency of the variant was increased relative to European
Americans, as a potential explanation for the decreased glucuronidation observed
among African Americans in Chapter 2. We analyzed in vitro nicotine glucuronidation
by HLMs from African American and European American donors and genotyped these
samples. Also, DNA samples available from a subset of participants in the ethnic
metabolism study were genotyped.
59
3.2 Methods
3.2.1 TRIP Study
UGT2B10 genotype-phenotype analyses involved samples from a prior study of
nicotine metabolism among European American smokers. Tobacco Reduction
Intervention Program (TRIP) participants were smokers aged 18 – 70 who smoked > 14
cpd (112;178). While smoking as usual, participants provided first morning urine; 2 – 4
samples were collected at least one week apart.
3.2.2 Human liver tissue source
Frozen normal liver tissues from African American (n=14) or European American
(n=14) donors were obtained through the Liver Tissue Cell Distribution System from
the University of Pittsburgh repository (NIH Contract # N01-DK-7-
0004/HHSN26700700004C). Donor characteristics were average age (49 years),
gender (50 % female), BMI (26.6 kg/m2), and smoker (36 %).
3.2.3 Chemicals and reagents
(S)-[5-3H]-Nicotine was purified as previously described (123). Nicotine N-βD-
glucuronide was purchased from Toronto Research Chemicals (North York, ON,
60
Canada). Other chemicals were purchased from Sigma-Aldrich (St. Louis, MO) unless
otherwise noted.
3.2.4 Nicotine and metabolite analysis
All urine samples were stored at -20°C prior to analysis. Urinary nicotine and
nicotine metabolite concentrations were analyzed by GC/MS and were previously
reported (112). Free nicotine, total nicotine (free nicotine + N-glucuronide), free
cotinine, and total cotinine (free cotinine + N-glucuronide) and total trans-3'-
hydroxycotinine (trans-3'-hydroxycotinine + its glucuronides) were quantified.
Analyses were performed in duplicate for each urine sample and repeated if values
differed by > 10 %. An overview of the analytic method is provided in Chapter 2.
3.2.5 UGT2B10 haplotyping
DNA was isolated from blood (Ethnic nicotine patch study, n=32; TRIP study,
n=84) with the GFX DNA purification kit (Amersham Biosciences, Piscataway, NJ) or
from frozen human liver tissue (n=28) using the DNeasy kit (Qiagen, Valencia, CA).
PCR-restriction fragment length polymorphism (RFLP) analysis was performed as
previously described on the UGT2B10 SNP rs7657958 that is linked with Asp67Tyr in
Caucasians (haplotype C) (177). DNA samples that tested positive for the rs7657958
variant and an equal number of samples that were called wild-type were subjected to a
61
second RFLP targeting the codon 67 position with HinfI digestion (177). DNA from all
African Americans and from all European Americans in the ethnic study was genotyped
at the codon 67 position. The Asp67Tyr substitution was confirmed by DNA
sequencing in 8 individuals (2 African Americans and 6 European Americans) and its
absence was confirmed in 2 wild-type individuals.
3.2.6 Nicotine glucuronidation by human liver microsomes (HLMs)
Microsomes from human liver samples were prepared by the method of Fowler et
al. and aliquots were stored at -80°C (179). Total protein concentrations were
determined by the Bradford assay with Coomassie Plus (Pierce, Rockford, IL).
Microsome quality was evaluated by p-nitrophenol O-glucuronidation activity. Product
formation was quantified by UV-HPLC after incubation with 500 µM p-nitrophenol and
5 mM UDPGA (163). These HLMs had p-nitrophenol glucuronidation activity ranging
from 10-55 nmol/min/mg protein.
HLMs (2mg/ml) were incubated with 0.5 or 5 mM (S)-[5-3H]nicotine (specific
activity, 25nCi/nmol or 2.5 nCi/nmol respectively) and 5 mM UDPGA essentially as
described by Kuehl et al. (163). Metabolites were quantified by radioflow HPLC using
a Gemini C18 5 µM 250 x 4.60 mm column (Phenomenex, Torrance, CA), SPD-10Avp
UV-VIS detector (Shimadzu, Kyoto, Japan), and β-RAM radioflow detector (IN/US
Systems, Tampa, FL). The mobile phase was 20 mM ammonium bicarbonate (pH 9.2)
in water (A) and acetonitrile (B) and the gradient was 2.5%B for 0-12 min., to 25% B in
62
15 min., hold at 25 % B for 5 min. The eluant flow was 0.8 ml/min and the scintillant
flow was 2.4 ml/min using Monoflow 5 (National Diagnostics, Atlanta, GA). Nicotine
glucuronide was retained longer on this HPLC system than when an acidic TFA
aqueous phase was used. No significant cleavage of nicotine N-glucuronide was
observed during HPLC analysis. We observed good separation between nicotine N-
glucuronide (11 min.) and nicotine (41 min.). The tritiated reaction product co-eluted
with nicotine N-glucuronide standard, and formed nicotine following β-glucuronidase
treatment. No other products were observed. Activity assays were performed with
microsomes that underwent a single freeze-thaw since repeated freeze-thaw resulted in
significantly decreased p-nitrophenol and nicotine glucuronidation activity; however,
this did not appear to vary by donor ethnicity or UGT2B10 haplotype.
3.2.7 Statistics
Statistical analyses were conducted using SAS (SAS Institute, Cary, NC) and Excel
(Microsoft, Redmond, WA). Wilcoxon two-sided t-approximation statistics were
calculated to compare means of continuous variables that did not have a normal
distribution, and a p-value less than 0.05 was considered significant. Since 2-4 urine
samples were available per participant, repeated measures analysis of variance was used
to compare the percent of analytes excreted as glucuronides and nicotine equivalents by
genotype. Spearman nonparametric correlation was used to assess univariate
correlations. Multivariate linear regression models were evaluated to assess predictors
of cotinine glucuronidation (square-root transformed ratio of cotinine glucuronide to
63
free cotinine) and the nicotine C-oxidation ratio (square-root transformed ratio of total
trans-3'-hydroxycotinine to total cotinine) (133).
3.3 Results
3.3.1 In vitro nicotine glucuronidation by human liver microsomes
Nicotine glucuronidation was characterized in vitro for 28 liver samples (14 from
African American donors) that were genotyped for UGT2B10 Asp67Tyr. A 50-fold
variation was observed in glucuronidation activity when liver microsomes were
incubated with either 0.5 mM or 5 mM nicotine; range, 1.1 to 51 and not quantifiable to
112.4 pmol/min/mg protein, respectively. Mean nicotine glucuronidation activity was
not different between samples obtained from African American and European American
donors, 15.1 +/- 12 versus 14.3 +/- 13 pmol/min/mg protein, respectively (p = 0.90).
Unlike ethnicity, UGT2B10 genotype did predict nicotine glucuronidation (Figure 3-2).
The UGT2B10 Asp67Tyr variant was present in 2 African American and 6 European
American samples. The mean rate of nicotine glucuronidation was 46-50 % lower for
Asp67Tyr samples compared to wild-type, 8.1 pmol/min/mg protein compared to 17.5
pmol/min/mg protein (p = 0.07).
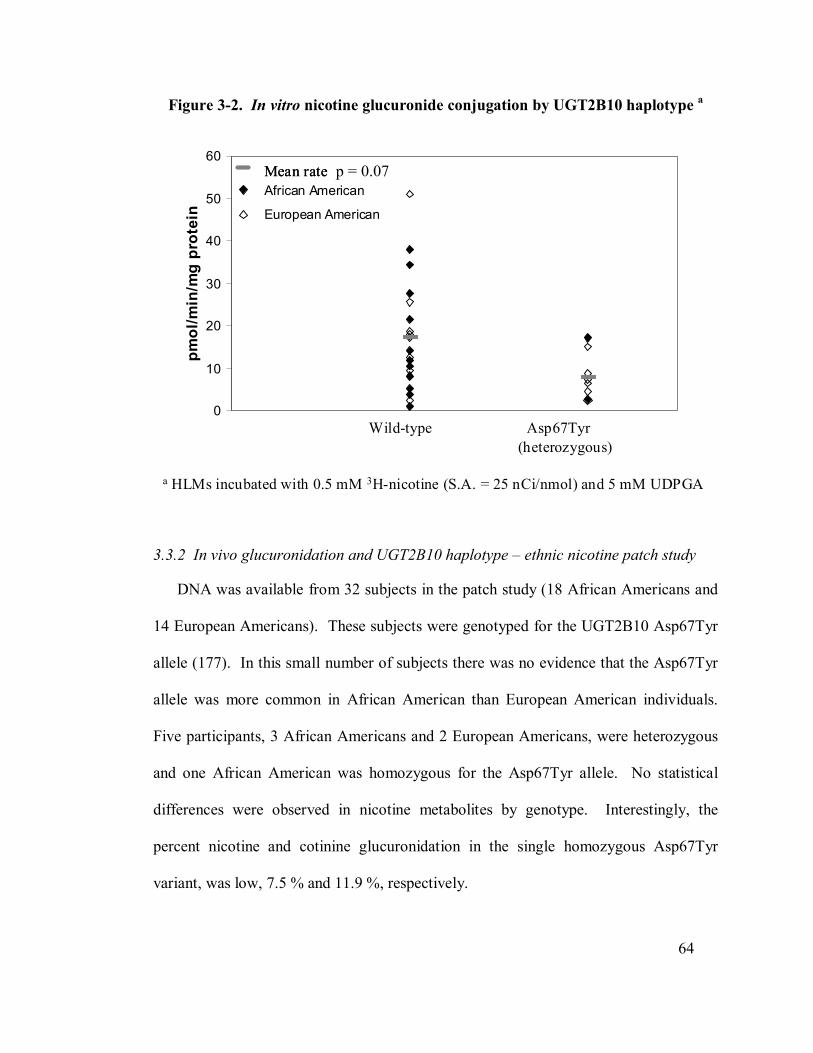
64
Figure 3-2. In vitro nicotine glucuronide conjugation by UGT2B10 haplotype a
Wild-type Asp67Tyr (heterozygous)
Mean rateMean rate
a HLMs incubated with 0.5 mM 3H-nicotine (S.A. = 25 nCi/nmol) and 5 mM UDPGA
0
10
20
30
40
50
60
pmol
/min
/mg
prot
ein
African American
European American
3.3.2 In vivo glucuronidation and UGT2B10 haplotype – ethnic nicotine patch study
DNA was available from 32 subjects in the patch study (18 African Americans and
14 European Americans). These subjects were genotyped for the UGT2B10 Asp67Tyr
allele (177). In this small number of subjects there was no evidence that the Asp67Tyr
allele was more common in African American than European American individuals.
Five participants, 3 African Americans and 2 European Americans, were heterozygous
and one African American was homozygous for the Asp67Tyr allele. No statistical
differences were observed in nicotine metabolites by genotype. Interestingly, the
percent nicotine and cotinine glucuronidation in the single homozygous Asp67Tyr
variant, was low, 7.5 % and 11.9 %, respectively.
p = 0.07
65
3.3.3 In vivo glucuronidation and UGT2B10 haplotype – TRIP study
In a population of smokers (TRIP study) for which both urinary nicotine metabolites
and DNA was available, we further investigated the relationship of the UGT2B10
Asp67Tyr variant to nicotine and cotinine metabolism. Nicotine metabolite data on this
population had been previously published (112;178). For the current study, participants
were genotyped for the UGT2B10 haplotype that is tagged by the rs7657968 SNP and
linked to Asp67Tyr (haplotype C) (177). Genotyping results were concordant in the
subset of samples, including all the heterozygous individuals, which were analyzed by
two RFLP analyses and a subset (n = 8 ) that were sequenced. Asp67Tyr was detected
as a G>T substitution at nucleotide +199, and this co-occurred with a synonymous SNP
at nucleotide 111 (T>C) as reported by Lazarus et al. (177). The allele frequency was
0.11 and was in Hardy-Weinberg equilibrium.
The mean percent glucuronidation of urinary metabolites in these smokers was
determined for each haplotype (Table 3-2). The percent of cotinine and nicotine
excreted in urine as glucuronide conjugates was 20 % lower among smokers who were
heterozygous for UGT2B10 Asp67Tyr relative to smokers with no Asp67Tyr alleles (p-
values; 0.006 and 0.03, respectively). The distribution of percent cotinine excreted as a
glucuronide was related to UGT2B10 genotype (Figure 3-3). However, there were wild-
type individuals who excreted less than 10 % of cotinine as its glucuronide conjugate
and heterozygotes who excreted as much as 80 % of cotinine as a glucuronide
conjugate. Interestingly, nicotine equivalents were significantly lower among
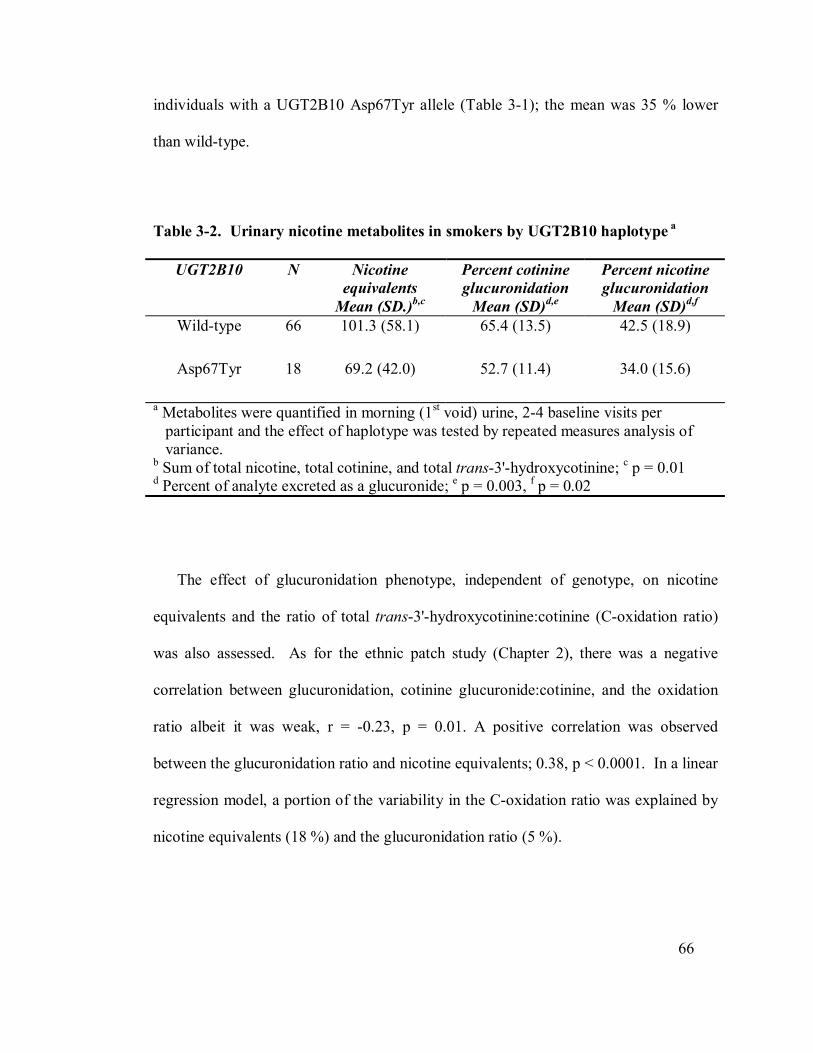
66
individuals with a UGT2B10 Asp67Tyr allele (Table 3-1); the mean was 35 % lower
than wild-type.
Table 3-2. Urinary nicotine metabolites in smokers by UGT2B10 haplotype a
UGT2B10 N
Nicotine equivalents
Mean (SD.)b,c
Percent cotinine glucuronidation
Mean (SD)d,e
Percent nicotine glucuronidation
Mean (SD)d,f
Wild-type 66 101.3 (58.1) 65.4 (13.5) 42.5 (18.9)
Asp67Tyr 18 69.2 (42.0) 52.7 (11.4) 34.0 (15.6)
a Metabolites were quantified in morning (1st void) urine, 2-4 baseline visits per participant and the effect of haplotype was tested by repeated measures analysis of variance.
b Sum of total nicotine, total cotinine, and total trans-3'-hydroxycotinine; c p = 0.01 d Percent of analyte excreted as a glucuronide; e p = 0.003, f p = 0.02
The effect of glucuronidation phenotype, independent of genotype, on nicotine
equivalents and the ratio of total trans-3'-hydroxycotinine:cotinine (C-oxidation ratio)
was also assessed. As for the ethnic patch study (Chapter 2), there was a negative
correlation between glucuronidation, cotinine glucuronide:cotinine, and the oxidation
ratio albeit it was weak, r = -0.23, p = 0.01. A positive correlation was observed
between the glucuronidation ratio and nicotine equivalents; 0.38, p < 0.0001. In a linear
regression model, a portion of the variability in the C-oxidation ratio was explained by
nicotine equivalents (18 %) and the glucuronidation ratio (5 %).
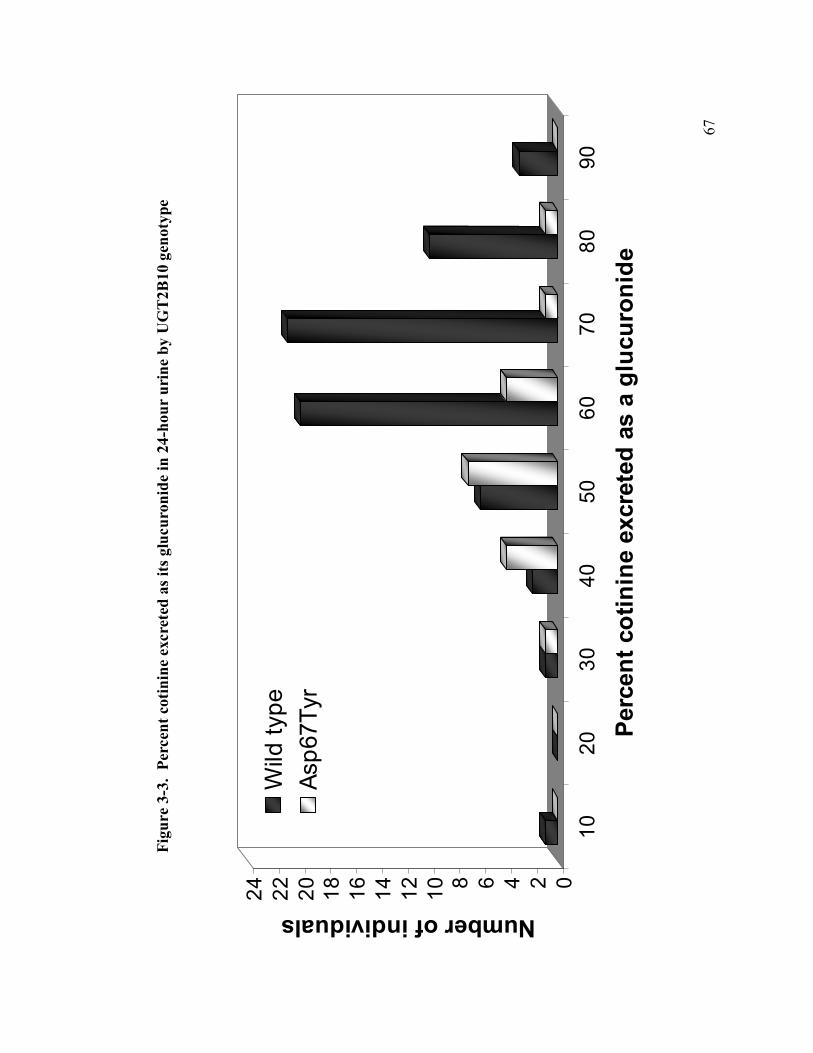
67
Figu
re 3
-3.
Perc
ent c
otin
ine
excr
eted
as i
ts g
lucu
roni
de in
24-
hour
uri
ne b
y U
GT
2B10
gen
otyp
e
024681012141618202224
Number of individuals
1020
3040
5060
7080
90
Perc
ent c
otin
ine
excr
eted
as
a gl
ucur
onid
e
Wild
type
Asp6
7Tyr
68
Discussion
Previously we observed lower glucuronidation of nicotine and cotinine among
African Americans compared to European Americans. Here we investigated the role of
the only UGT polymorphism that has been demonstrated to affect nicotine and cotinine
glucuronidation in vitro as a possible explanation for the decreased glucuronidation
observed in African Americans. While we demonstrated that the UGT2B10 Asp67Tyr
is present among African Americans, the frequency of this allele was not higher among
African Americans compared to European Americans in the 59 samples tested (N=31
participants from the ethnic patch study and 28 human liver samples). In vitro we
observed that UGT2B10 Asp67Tyr was a better predictor of low nicotine
glucuronidation than ethnicity. In fact, there was no difference in nicotine
glucuronidation by ethnicity in this small in vitro study. Regretfully, the availability of
liver tissue from African American donors was limited, in particular since we preferred
tissues from the same procurement source. In conclusion, we expect that the UGT2B10
Asp67Tyr allele is unlikely to explain the observed decreased levels of glucuronidation
in African Americans compared to European Americans. However, an uncharacterized
variant in UGT2B10 may well contribute.
UGT2B10 is predicted to be the major enzyme responsible for nicotine and cotinine
glucuronidation in smokers based on in vitro studies (87;143). This is the first report of
in vivo nicotine and cotinine glucuronidation by UGT2B10 genotype, and our finding
that smokers with a variant Asp67Tyr allele had decreased excretion of glucuronide
conjugates provides convincing evidence that UGT2B10 significantly contributes to
69
nicotine metabolism in vivo. However, as illustrated in Figure 4, the Asp67Tyr
UGT2B10 variant is clearly only one contributor to variation in nicotine and cotinine
glucuronidation. The relatively high percentage of cotinine glucuronidation in some
individuals who were heterozygous for this variant could be due to either variation in
UGT2B10 expression or the contribution of UGT1A4, as a second catalyst of cotinine
glucuronidation.
Biomarkers of glucuronidation that do not require knowledge of genotype would
have utility in comparing nicotine metabolism, particularly among diverse populations.
However, in this study and the ethnic patch study we observed that the urinary cotinine
glucuronide:cotinine and trans-3'-hydroxycotinine:cotinine ratios were both positively
correlated with nicotine equivalents. Therefore the possibility that these ratios vary as a
function of nicotine dose must be considered. Clearly, the tradeoff between ease of
measurement and more comprehensive profiling of phenotype or genotype depends on
the particular goals of a study. However, we assert that the use of metabolite ratios as
biomarkers of oxidation or glucuronidation in smokers requires further study, preferably
prior to application in large epidemiological studies of tobacco-associated cancers.
Interestingly, individuals with the UGT2B10 Asp67Tyr variant had lower nicotine
equivalents than individuals without this allele. Is it possible that these individuals
smoke less? We have accounted for the major metabolites of nicotine metabolism, and
no increases were observed in total C-oxidation. If a shift occurs in nicotine
metabolism to other minor pathways of nicotine metabolism, such as N-oxide
formation, we would have underestimated nicotine equivalents. For instance, nicotine
70
N-oxide represented 40 % of nicotine and its metabolites in the urine of an individual
who had very low C-oxidation activity and deleted CYP2A6 (118). Also, Benowitz et
al. observed that a higher amount of unchanged nicotine and nicotine glucuronide were
excreted in urine of individuals with a low activity CYP2A6 allele and decreased
nicotine C-oxidation compared to wild-type individuals. Yet, the percent of nicotine
excreted as a glucuronide was not different, and thus the increase in nicotine
glucuronide was due to an increase in free nicotine availability and not upregulation of
glucuronidation. If low glucuronidation results in elevated blood nicotine
concentrations, perhaps in the context of relatively low nicotine C-oxidation, an
individual may smoke less intensely as is observed for individuals with low nicotine
oxidation. The potential role of UGT2B10 on smoking behavior merits further
investigation based on the intriguing finding that individuals who were heterozygous for
Asp67Tyr had lower nicotine equivalents than wild-type.
We expect that differences in UGT2B10 activity, due to genetic or
environmental factors, will affect the disposition of other drugs and xenobiotics. For
instance, UGT2B10 was reported to catalyze the metabolism of the analgesic,
medetomidine, and its role in the metabolism of other drugs that undergo N-
glucuronidation is being investigated (180). UGT2B10 catalyzes N-glucuronidation of
the tobacco carcinogen 4-(methylnitrosamino)-1-(3-pyridyl)-1-butanol (NNAL) in vitro
and is predicted to contribute to its detoxification in vivo (177;181). UGT2B10 may
modulate cancer risk through an effect on smoking behavior or carcinogen metabolism.
In brief, low UGT2B10 activity may have important health consequences.
71
3.5 Conclusions
UGT2B10 contributes to in vivo nicotine and cotinine glucuronidation. The role for
UGT2B10 was demonstrated by the effect of a variant genotype on glucuronidation
phenotype. Smokers who were heterozygous for the variant UGT2B10 Asp67Tyr allele
had decreased excretion of nicotine and cotinine as their glucuronide conjugates.
UGT2B10 haplotype was a better predictor of glucuronidation phenotype than ethnicity
(African American versus European American). Also, the UGT2B10 Asp67Tyr allele
does not explain the ethnic variation in glucuronidation that was presented in Chapter 2.
When the study population was sorted by UGT2B10 genotype, nicotine equivalents
were lower among individuals with the variant allele. This observation could reflect a
gene-mediated effect on smoking behavior which would be a substantial finding. We
conclude that these genotype-phenotype analyses should be verified in another study
population.
3.6 Acknowledgements
Many thanks to Elizabeth Thompson and Jodi Blustin for their assistance with
UGT2B10 genotyping.
3.7 Publication of thesis work
Published in combination with Chapter 2 content; see page 50.
72
CHAPTER 4
Nicotine metabolite profiling including
nicotine-N-oxide and UGT2B10 genotype
4.1 Introduction
Cancer etiology and epidemiology studies frequently require assessment of tobacco
exposure due to tobacco’s role in the development of several cancers (14;182-184).
Error in estimating tobacco exposure can obscure important observations, while
accuracy in exposure assessment is useful to identify it as either a causal or confounding
factor. Many approaches have been used to evaluate tobacco exposure broadly
including: self-report of smoking history (cigarettes/day, pack-years of smoking, time
spent around a smoker, etc.), collection of used products (cigarette butts, discarded
chew), topography measures (puff volume, frequency), and biomarkers (exhaled carbon
monoxide, nicotine metabolites, tobacco specific nitrosamines) (112;120;122;185-187).
Selecting a measure to assess exposure is not a trivial choice and depends on the goals
of a particular study.
Quantifying one or more nicotine metabolites is an objective measure of current
exposure from smoking, smokeless tobacco use, or environmental/secondhand smoke.
73
Plasma or urinary cotinine are the most frequently utilized biomarker of tobacco
exposure, other than exhaled carbon monoxide (157;158;158). The only significant
source of cotinine is metabolism from nicotine, and it is highly correlated with nicotine
intake (32;117). However, interindividual differences in nicotine metabolism also
influence cotinine levels (33;188). A potentially more robust biomarker of nicotine
exposure is nicotine equivalents, defined as the sum of nicotine and its major
metabolites in urine (120). Total nicotine (nicotine + nicotine glucuronide), total
cotinine (cotinine + cotinine glucuronide) and trans-3'-hydroxycotinine (trans-3'-
hydroxycotinine + its glucuronides) can be assessed with minimal sample preparation
(e.g. a single solid phase extraction) by liquid chromatography/mass spectrometry with
high throughput capacity (LC/MS) (119). Therefore, assessing nicotine equivalents is
feasible in the time typically used to quantify a single nicotine metabolite. Nicotine
equivalents directly account for over 80 % of nicotine intake, and since it is a sum of
metabolites the effect of interindividual differences in any of the major metabolites is
minimized (32;117;119).
Polymorphisms are common in nicotine metabolism genes and their regulatory
regions, although only a minority of the known variants have been fully characterized
(189). Enzyme amount and relative activity affect the metabolic fate of nicotine.
Several polymorphisms in CYP2A6, the hepatic enzyme responsible for oxidation of
nicotine to cotinine and a major catalyst of cotinine oxidation to trans-3'-
hydroxycotinine, are associated with lower intensity smoking (115;136;190). For
example, CYP2A6 polymorphisms that influence smoking behavior include
CYP2A6*4, a deletion allele, CYP2A6*2, an inactivating point mutation, and
74
CYP2A6*9 which alters the TATA box promoter region (115;191;192). Furthermore,
low nicotine C-oxidation and low concentrations of the tobacco carcinogen NNAL have
been observed among Japanese Americans, a population with a high prevalence of
deletion alleles, compared to European Americans (133). UGT2B10 and UGT1A4
catalyze the N-glucuronidation pathways of nicotine metabolism in vitro and the genes
encoding these enzymes are also polymorphic (87;143;153;177).. Recently, we
reported that the UGT2B10 polymorphism Asp67Tyr was associated with a 20 %
decrease in the excretion of cotinine and nicotine as their glucuronide conjugates in
urine of 84 smokers (188). This UGT2B10 variant was characterized in vitro by Chen
et al. as having decreased nicotine and cotinine glucuronidation activity (188).
The main goals of the current study were to evaluate if the relationship between
Asp67Tyr and lower glucuronidation could be confirmed, to assess if glucuronidation
was associated with a shift in nicotine metabolism through other pathways including to
nicotine-N-oxide, and to explore nicotine equivalents as a pathway-independent
measure of tobacco exposure. In this population, where a defined genetic variant
influenced phenotype, we could probe the strengths and weaknesses of different
nicotine metabolites as biomarkers of exposure.
4.2 Methods
4.2.1 Study population and protocol
75
This research was approved by the University of Minnesota’s Institutional Review
Board. A total of 327 adult smokers who were recruited from the Twin Cities
metropolitan area and who participated in one of three tobacco research studies
conducted at the University of Minnesota were included in this genotype-phenotype
investigation. Participants were recruited through advertisements on campus and local
media, were screened by telephone, and were willing to participate in a smoking
reduction or cessation study similarly for these studies. Participants were in good
physical and psychiatric health, had no contraindications to nicotine replacement
therapy, were not pregnant or nursing, and were not using barbituates or anti-
convulsants.
For each study, participants were asked to provide a first void morning urine sample
while they were smoking as usual, and this sample was collected at least two weeks
prior to any study intervention (and before randomization to an intervention group). A
blood sample was also collected from participants. Study 1 included 110 participants
aged 18-65 who smoked > 15 cigarettes per day and who subsequently participated in a
cessation trial of traditional nicotine replacement or smokeless tobacco. Study 2
included 145 participants aged 18 – 70 who were smokers of 10 – 40 ‘‘light’’ cigarettes
(0.7–1.0 mg nicotine/cigarette) per day and who then participated in a study of low and
no nicotine cigarettes (132). Study 3 included 84 smokers aged 18 – 70 years who
smoked 15 – 45 cigarettes/day and subsequently participated in a smoking reduction
trial (112;188). Initial genotype-phenotype analyses of UGT2B10 Asp67Tyr genotype
and the percent of nicotine and cotinine excreted as glucuronide conjugates were
recently conducted on study 3 samples (188).
76
4.2.2 Nicotine and metabolite analysis
Urinary nicotine and nicotine metabolite concentrations were analyzed by GC/MS
and were previously reported (112). Free nicotine, total nicotine (free nicotine + N-
glucuronide), free cotinine, and total cotinine (free cotinine + N-glucuronide) and total
trans-3'-hydroxycotinine (trans-3'-hydroxycotinine + its glucuronides) were quantified.
Analyses were performed in duplicate for each urine sample and repeated if values
differed by > 10 %, and average error was 3 %. An overview of the analytic method is
provided in Chapter 2.
Nicotine-N-oxide was analyzed in urine of study 1 samples by LC/MS. In brief,
urine (20 µl) with added D3-nicotine N-oxide internal standard was processed by solid
phase extraction with an Oasis MCX column. LC/MS/MS was performed using a
Finnigan Discovery triple quadrupole mass spectrometer (Thermo Electron, San Jose,
CA) with an ESI source in positive ion mode. Selective reaction monitoring was
performed of the mass transitions for D0-nicotine N-oxide (m/z 179→130 and m/z
179→117).
Plasma was separated from blood and stored at -20ºC for study 1 samples. Plasma
free cotinine, total cotinine (free + N-glucuronide), and total trans-3'-hydroxycotinine
were quantified by GC/MS as performed for urinary metabolites except for an initial
solid phase extraction using an Oasis MCX column (Waters Corporation, Milford, MA)
(39). Analyses were performed in duplicate and repeated if values differed by > 10 %.
77
4.2.3 UGT2B10 Genotyping
DNA was isolated from blood using the DNeasy kit (Qiagen, Valencia, CA). PCR-
restriction fragment length polymorphism (RFLP) analysis was performed targeting
UGT2B10 at the codon 67 position with HinfI digestion as previously described (Chen
et al 2008). A second RFLP for the SNP rs7657958 that is linked with UGT2B10
Asp67Tyr in Caucasians (haplotype C) was performed in a subset of samples (N = 107
of 327, 32 %) (177). Genotyping results were concordant between the two assays, as
well as with DNA sequencing for 10 samples.
4.2.4 Statistical analysis
Statistical analyses were conducted using SAS (SAS Institute, Cary, NC) and Excel
(Microsoft, Redmond, WA). Wilcoxon two-sided t-approximation statistics were
calculated to compare means of continuous variables that did not have a normal
distribution, and a p-value less than 0.05 was considered significant. Spearman
nonparametric correlation was used to assess univariate correlations. A general linear
model was used to compare phenotypes by UGT2B10 genotype, and to adjust for
nicotine equivalents. Individuals with the highest and lowest 1 % of urinary nicotine
equivalents were excluded from analyses, < 9 nmol/ml or > 236 nmol/ml. Nicotine and
cotinine glucuronidation were assessed as the percent of the analyte that was present as
its N-glucuronide and as the square-root transformed ratio of glucuronide conjugate to
78
free analyte. The square-root transformed ratio of total trans-3'-hydroxycotinine to free
cotinine in plasma or total trans-3'-hydroxycotinine to free cotinine in urine was used as
an estimate of C-oxidation. K-median cluster analysis was performed using Cluster 3.0
and Java Treeview which is available at http://rana.lbl.gov/EisenSoftware.htm.
4.3 Results
4.3.1 Study population
A total of 327 participants were included in the genotype-phenotype analyses, which
included samples collected at baseline while participants were smoking as usual from 3
studies. Study participants were predominantly European American. The mean ages
+/- SD by study were 1) 43 +/- 11.6 years; 2) 41 +/- 14 years; and 3) 46 +/- 10.6 years.
Diary recorded cigarettes per day at baseline were mean +/ SD: 1) 21 +/- 6.5; 2) 21 +/-
8.8; 3) 24 +/- 5.8. Total allele frequency of the UGT2B10 Asp67Tyr variant was 10.6
%, and this was consistent with Hardy-Weinberg equilibrium. Correspondingly
individuals who were heterozygous for the Asp67Tyr allele represented 20 % of
participants: study 1, 17.4 %; study 2, 18.3 %; and study 3, 22.2%. The percent of
cotinine excreted as a glucuronide conjugate in first morning urine was significantly
decreased among individuals who were heterozygous for the Asp67Tyr allele compared
to individuals without this allele in each of the three studies. Subsequently, analyses
were conducted on the combined data unless indicated.
79
4.3.2 Urinary nicotine and its metabolites
The distribution of urinary nicotine and its metabolites by UGT2B10 Asp67Tyr
genotype is presented in Table 4-1. Analytes are presented as molar percentages of the
sum of nicotine and its metabolites in urine, and reflect the relative contribution of
different pathways to the fate of nicotine. The molar percentages of nicotine and
cotinine N-glucuronides in urine were 30 % lower for Asp67Tyr heterozygous
individuals than for wild-type, 4.2 % versus 6.1 % (p = 0.003) and 17.6 % versus 24.2
% (p < 0.0001) respectively. Similarly, the fractions of nicotine and cotinine excreted
as their glucuronide conjugates, ie. percent glucuronidation, were lower among
Asp67Tyr heterozygotes than wild-type; 29.5 % versus 38.2 % (p = 0.007) and 51.3 %
versus 62 % (p < 0.0001).
As might be expected, a decrease in the molar percent of cotinine glucuronide was
accompanied by an increase in excretion of free cotinine, 16 % versus 13.4 % (p =
0.003) for Asp67Tyr heterozygotes compared to wild-type. Moreover, a significant
increase was observed in the molar percent of total trans-3'-hydroxycotinine in urine of
Asp67Tyr heterozygotes compared to wild-type, 51.1 % versus 44.3 %, p = 0.001. In
summary, the Asp67Tyr allele was associated with relatively lower urinary abundance
of nicotine and cotinine N-glucuronides, higher free cotinine, and higher total trans-3'-
hydroxycotinine.
There were 3 individuals whose DNA yielded a restriction digest pattern that would
be consistent with homozygosity for UGT2B10 Asp67Tyr. No urine samples were
available for one individual who appeared homozygous, another individual excreted a
80
low percentage of cotinine as its glucuronide conjugate (7.1 %) and had undetectable
nicotine glucuronidation, and the third individual had a normal-to-high glucuronidation
phenotype (73 % cotinine glucuronidation, 67 % nicotine glucuronidation). DNA
sequence analysis of UGT2B10 is planned for these samples, and at this time they were
excluded from the analyses which were focused on characterizing heterozygous carriers
of UGT2B10 Asp67Tyr.
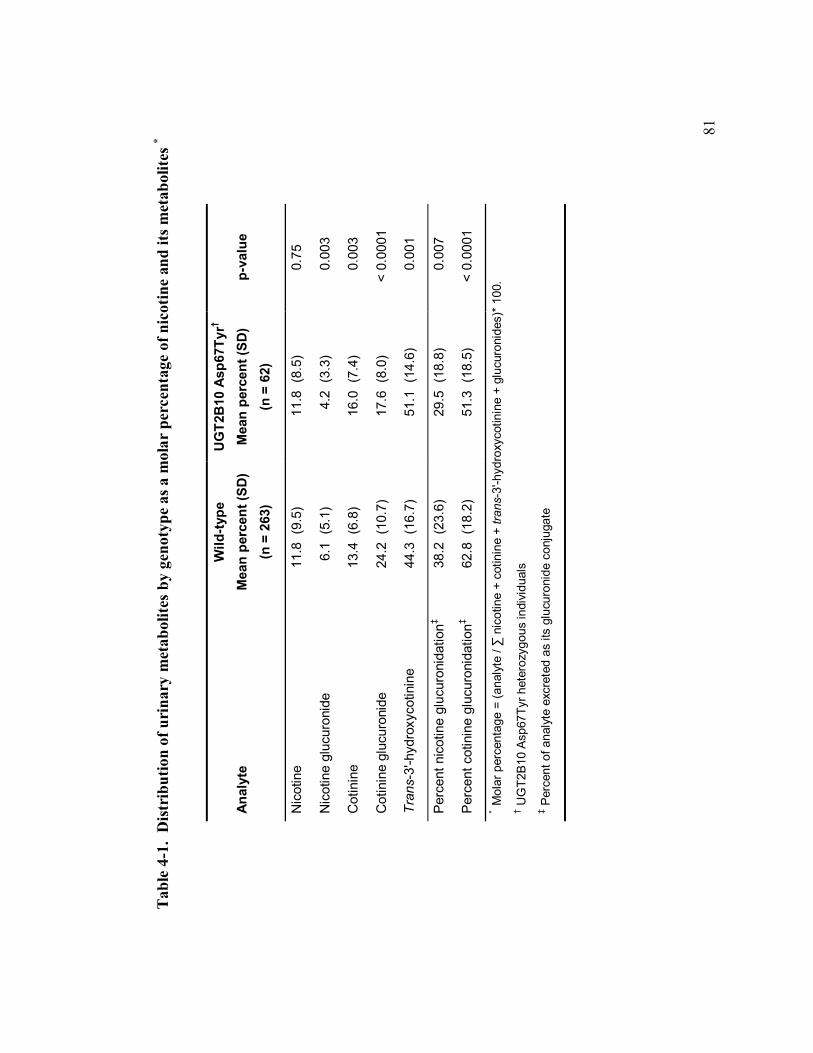
81
Tab
le 4
-1.
Dis
trib
utio
n of
uri
nary
met
abol
ites
by g
enot
ype
as a
mol
ar p
erce
ntag
e of
nic
otin
e an
d its
met
abol
ites *
Anal
yte
Wild
-type
M
ean
perc
ent (
SD)
(n =
263
)
UG
T2B
10 A
sp67
Tyr†
Mea
n pe
rcen
t (SD
) (n
= 6
2)
p-va
lue
Nic
otin
e
11.8
(9.
5)
11
.8 (
8.5)
0.
75
Nic
otin
e gl
ucur
onid
e
6.1
(5.1
)
4.2
(3.3
) 0.
003
Cot
inin
e
13.4
(6.
8)
16
.0 (
7.4)
0.
003
Cot
inin
e gl
ucur
onid
e
24.2
(10
.7)
17
.6 (
8.0)
<
0.00
01
Tran
s-3'
-hyd
roxy
cotin
ine
44
.3 (
16.7
)
51.1
(14
.6)
0.00
1
Per
cent
nic
otin
e gl
ucur
onid
atio
n‡
38.2
(23
.6)
29
.5 (
18.8
) 0.
007
Per
cent
cot
inin
e gl
ucur
onid
atio
n‡
62.8
(18
.2)
51
.3 (
18.5
) <
0.00
01
* M
olar
per
cent
age
= (a
naly
te / ∑
nic
otin
e +
cotin
ine
+ tra
ns-3
'-hyd
roxy
cotin
ine
+ gl
ucur
onid
es)*
100
.
† U
GT2
B10
Asp6
7Tyr
het
eroz
ygou
s in
divi
dual
s
‡ Pe
rcen
t of a
naly
te e
xcre
ted
as it
s gl
ucur
onid
e co
njug
ate
82
4.3.3 Urinary excretion of nicotine-N-oxide
Nicotine-N-oxide is a minor nicotine metabolite but it may be increased in
individuals with decreased metabolism through other pathways. Therefore, we
evaluated the effect of glucuronidation and C-oxidation phenotype on nicotine-N-oxide
abundance in urine (Figure 4-1) (118). Nicotine-N-oxide was quantified in study 1
participants (N = 108) and phenotype was assessed using metabolite ratios. The
phenotype biomarkers were urinary cotinine glucuronide:free cotinine ratio for
glucuronidation and plasma trans-3'-hydroxycotinine:free cotinine ratio for C-oxidation.
Phenotypes were categorized as low, high, or average, based on the lowest and highest
quartiles of the metabolite ratio distribution and the interquartile range. Nicotine-N-
oxide was assessed as a molar percent of nicotine and its metabolites in urine and
comparisons were performed by phenotype group.
The abundance of nicotine-N-oxide increased for each group with successively
lower trans-3'-hydroxycotinine:free cotinine ratios, means (95 % CI): 4.3 % (3.3 – 5.3),
6.1 % (5.4 – 6.8), and 8.7 (7.7 – 9.7) for high, average, and low C-oxidation phenotype
respectively (p < 0.005 between each group). No significant differences were observed
in mean nicotine-N-oxide abundance by glucuronidation phenotype, means (95 % CI):
5.5 % (4.4 – 6.6), 6.1 % (5.4 – 6.9), and 6.8 % (5.7 – 7.9) for high, average, and low
glucuronidation phenotype, respectively; and Chi-square test for trend, p = 0.055.
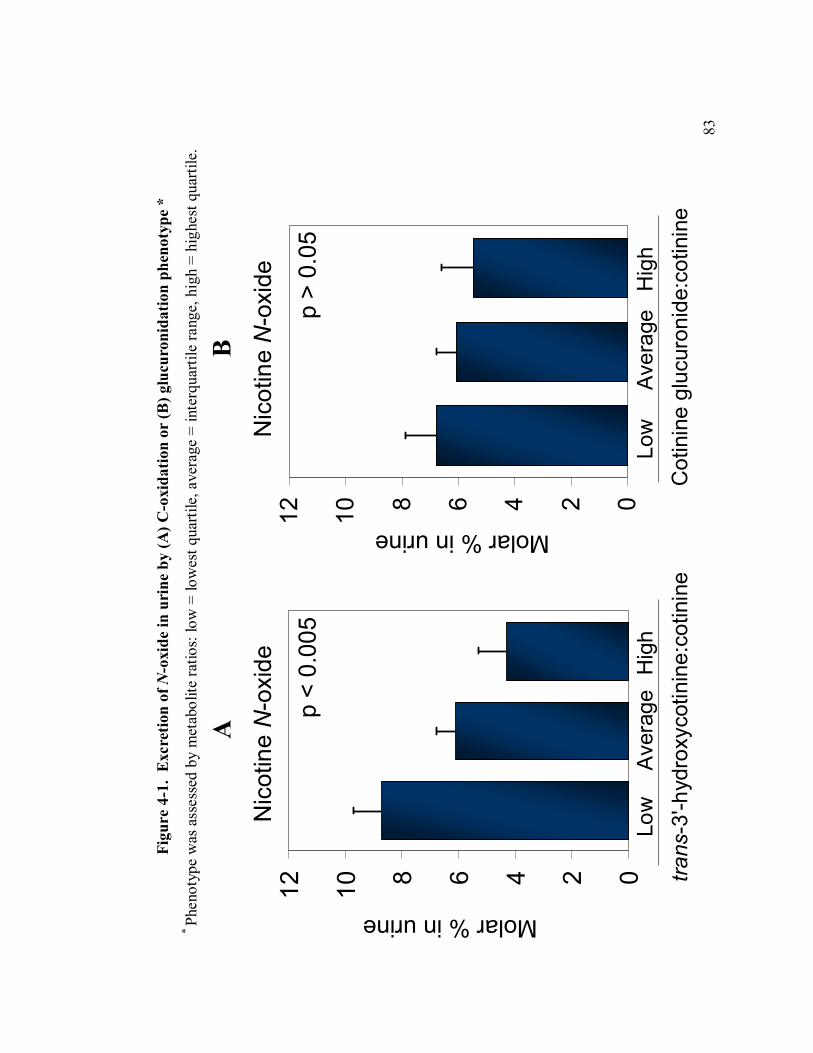
83
Figu
re 4
-1.
Exc
retio
n of
N-o
xide
in u
rine
by
(A) C
-oxi
datio
n or
(B) g
lucu
roni
datio
n ph
enot
ype
*
A
B
024681012
Molar % in urine
Nic
otin
e N
-oxi
de
Low
A
vera
geH
igh
trans
-3'-h
ydro
xyco
tinin
e:co
tinin
e
p <
0.00
5
Molar % in urine
Nic
otin
e N
-oxi
de
Low
Av
erag
eH
igh
Cot
inin
egl
ucur
onid
e:co
tinin
e
p >
0.05
024681012
* Phe
noty
pe w
as a
sses
sed
by m
etab
olite
ratio
s: lo
w =
low
est q
uarti
le, a
vera
ge =
inte
rqua
rtile
rang
e, h
igh
= hi
ghes
t qua
rtile
.
84
4.3.4 Plasma nicotine and metabolites
The effect of the UGT2B10 Asp67Tyr allele on plasma concentrations of nicotine
metabolites was evaluated in study 1 participants (Table 4-2). Free plasma cotinine was
higher among Asp67Tyr heterozygotes than wild-type individuals, 1.31 nmol/ml (231
ng/ml) versus 1.09 nmol/ml (192 ng/ml), p = 0.03. No difference in cotinine
glucuronide concentration was detected, 0.13 nnmol/ml versus 0.15 nmol/ml, for
Asp67Tyr heterozygotes and for wild-type individuals respectively. Since the percent
of cotinine that is conjugated in plasma is low with an overall mean of 10 % it is
difficult to quantify relatively small differences in cotinine glucuronidation in plasma.
Total trans-3'-hydroxycotinine was higher in the plasma of Asp67Tyr heterozygotes
compared to wild-type, 0.46 nmol/ml versus 0.39 nmol/ml, p = 0.04. Therefore, the
effect of the Asp67Tyr allele on free cotinine and total trans-3'-hydroxycotinine was
consistent in urine and plasma, both were higher among heterozygotes than wild-type.
4.3.5 Cluster analysis of urinary nicotine and metabolites
Urinary metabolite profiles were explored using cluster analysis and an example
array is depicted in Figure 4-2 that includes free nicotine, free cotinine, cotinine
glucuronide, and total trans-3'-hydroxycotinine. To account for the effect of variation
in nicotine exposure, analytes were expressed as a molar fraction of nicotine and its
metabolites in urine and were then normalized to the median value. The array serves as
a tool for thinking about several metabolites from over a hundred participants at a
85
glance. Foremost, it is clear that different distributions of nicotine metabolites are
common. An evident pattern is that when trans-3'-hydroxycotinine is high then cotinine
glucuronide is frequently low and vice versa. Typically low nicotine occurs when either
trans-3'-hydroxycotinine or cotinine glucuronide are high and the reverse is also
observed.
4.3.6 Nicotine equivalents as a pathway independent biomarker
Since nicotine equivalents is a sum of metabolites, it is insensitive to variation in
metabolite distribution and this can improve accuracy in tobacco exposure assessment,
as illustrated in Table 4-3. The first pair of observations in Table 4-3 depicts two
individuals with identical plasma free cotinine concentrations, but their exposure to
nicotine is different. In this case, the individual with lower nicotine equivalents has
relatively high plasma free cotinine as a consequence of decreased total clearance of
cotinine which was indicated by the very low urinary and plasma trans-3'-
hydroxycotinine concentrations. In the second example, two individuals have identical
free cotinine in urine due to a difference in glucuronidation phenotype, and this could
obscure the relatively high nicotine exposure of the individual who excreted 85 % of
cotinine as its glucuronide conjugate if free cotinine is the biomarker of exposure. In
the final example, nicotine equivalents were identical but use of free urinary cotinine as
the biomarker would result in classifying the individual with higher free cotinine as
being more exposed, when in fact the difference in free cotinine is attributable to a
difference in the distribution of urinary metabolites.
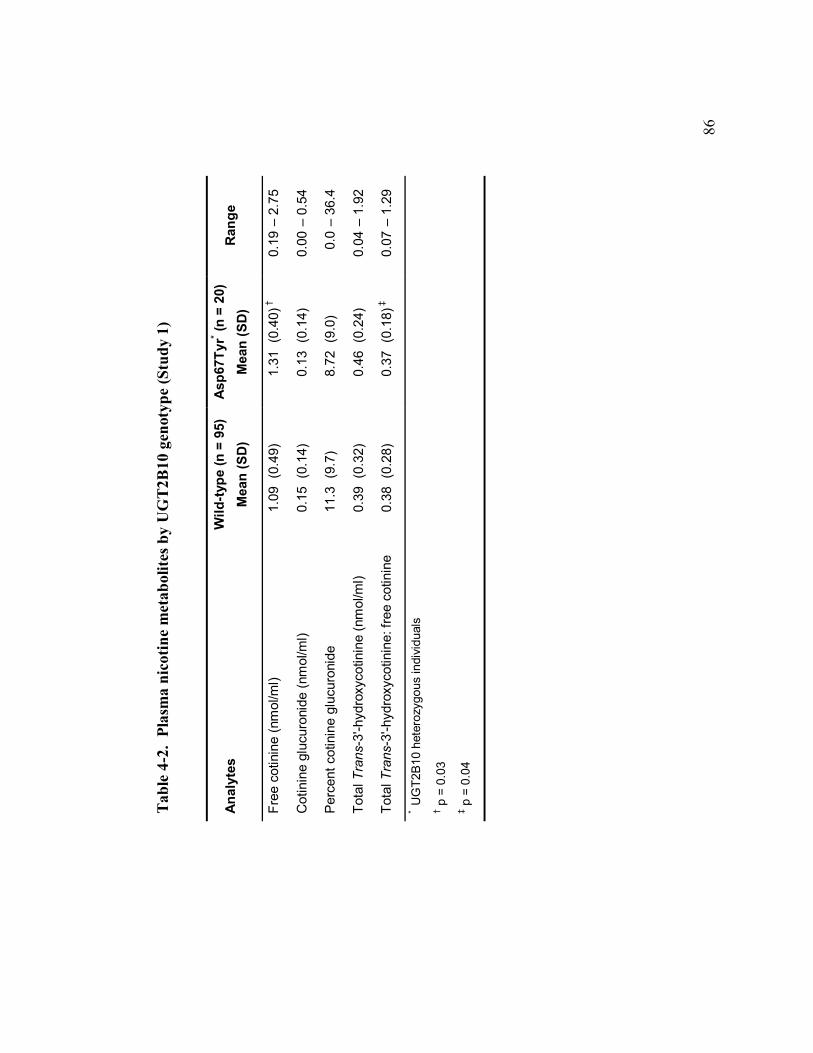
86
Tab
le 4
-2.
Plas
ma
nico
tine
met
abol
ites b
y U
GT
2B10
gen
otyp
e (S
tudy
1)
Anal
ytes
W
ild-ty
pe (n
= 9
5)
Mea
n (S
D)
Asp6
7Tyr
* (n =
20)
Mea
n (S
D)
Ran
ge
Free
cot
inin
e (n
mol
/ml)
1.
09 (
0.49
)
1.31
(0.
40) †
0.19
– 2
.75
Cot
inin
e gl
ucur
onid
e (n
mol
/ml)
0.
15 (
0.14
)
0.13
(0.
14)
0.
00 –
0.5
4
Per
cent
cot
inin
e gl
ucur
onid
e
11.3
(9.
7)
8.
72 (
9.0)
0.0
– 36
.4
Tota
l Tra
ns-3
'-hyd
roxy
cotin
ine
(nm
ol/m
l)
0.39
(0.
32)
0.
46 (
0.24
)
0.04
– 1
.92
Tota
l Tra
ns-3
'-hyd
roxy
cotin
ine:
free
cot
inin
e
0.38
(0.
28)
0.
37 (
0.18
) ‡
0.
07 –
1.2
9
* UG
T2B1
0 he
tero
zygo
us in
divi
dual
s †
p =
0.03
‡
p =
0.04
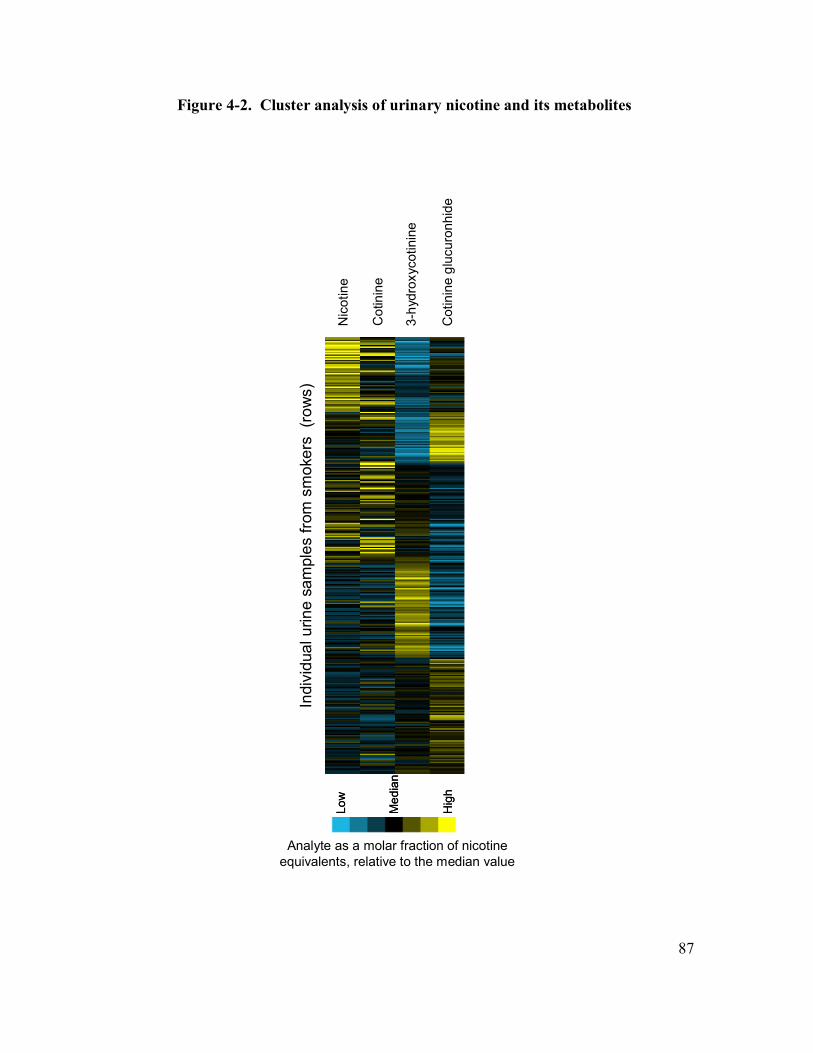
87
Figure 4-2. Cluster analysis of urinary nicotine and its metabolites
Nic
otin
e
Cot
inin
e
3-hy
drox
ycot
inin
e
Cot
inin
egl
ucur
onhi
de
Indi
vidu
al u
rine
sam
ples
from
sm
oker
s (r
ows)
Analyte as a molar fraction of nicotine equivalents, relative to the median value
Low
Med
ian
Hig
h
Low
Med
ian
Hig
h
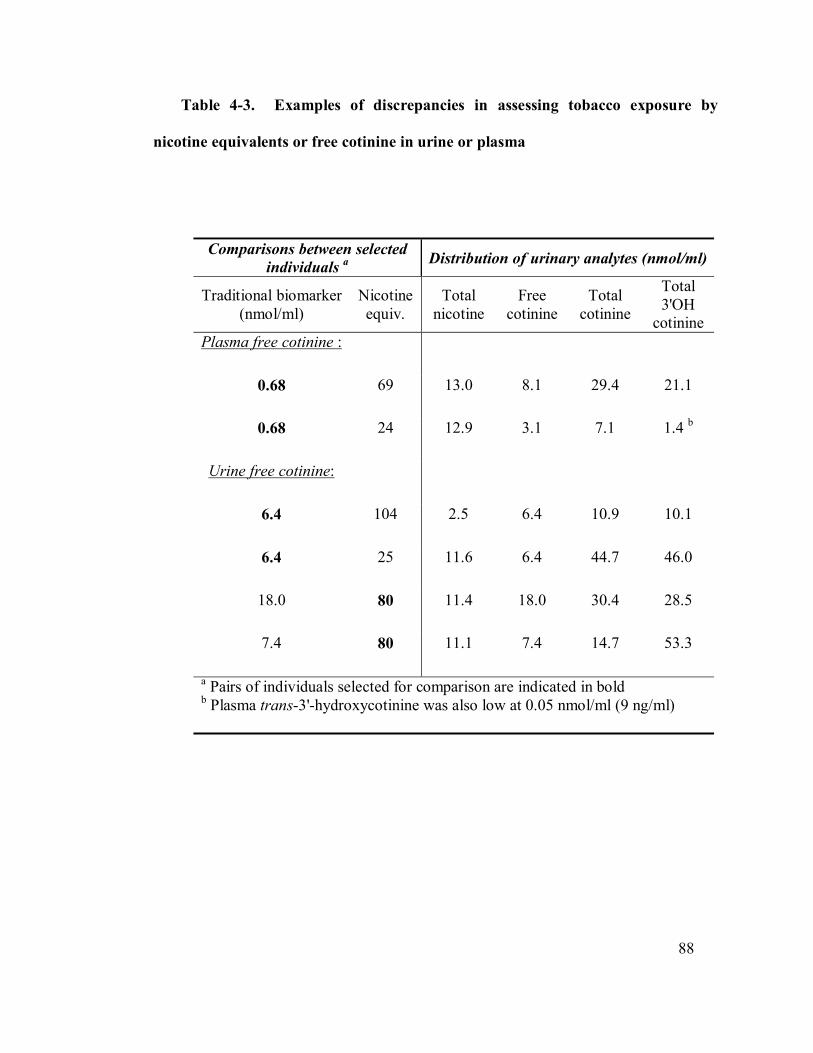
88
Table 4-3. Examples of discrepancies in assessing tobacco exposure by
nicotine equivalents or free cotinine in urine or plasma
Comparisons between selected individuals a Distribution of urinary analytes (nmol/ml)
Traditional biomarker (nmol/ml)
Nicotine equiv.
Total nicotine
Free cotinine
Total cotinine
Total 3'OH
cotinine Plasma free cotinine :
0.68 69 13.0 8.1 29.4 21.1
0.68 24 12.9 3.1 7.1 1.4 b
Urine free cotinine:
6.4 104 2.5 6.4 10.9 10.1
6.4 25 11.6 6.4 44.7 46.0
18.0 80 11.4 18.0 30.4 28.5
7.4 80 11.1 7.4 14.7 53.3
a Pairs of individuals selected for comparison are indicated in bold b Plasma trans-3'-hydroxycotinine was also low at 0.05 nmol/ml (9 ng/ml)
89
4.3.7 Effect of nicotine equivalents on metabolite ratios (Study 2)
To investigate the stability of the urinary glucuronide ratio and the effect of nicotine
dose, we evaluated the ratio among individuals who decreased their smoking (Table 4-
4). The ratio of cotinine glucuronide:cotinine was assessed in a group of individuals at
baseline and after 12 weeks at which point they had reduced their nicotine intake by 60
%, as assessed using nicotine equivalents. The ratio of cotinine glucronide:cotinine
decreased by 40 % as they decreased their nicotine intake, mean (95 % CI): 2.59 (2.05 –
3.24) at baseline versus 1.51 (1.04 – 2.10) at week 12, p = 0.008. However, when the
ratio was adjusted for nicotine equivalents this difference disappeared, mean (95 % CI):
1.99 (1.49 – 2.52) and 2.07 (1.58 – 2.63) for baseline and week 12 respectively, p =
0.81. A decrease of similar magnitude was observed in the urinary ratio of total trans-
3'-hydroxycotinine:free cotinine as individuals decreased their nicotine intake, and
adjusting for nicotine equivalents eliminated this difference.
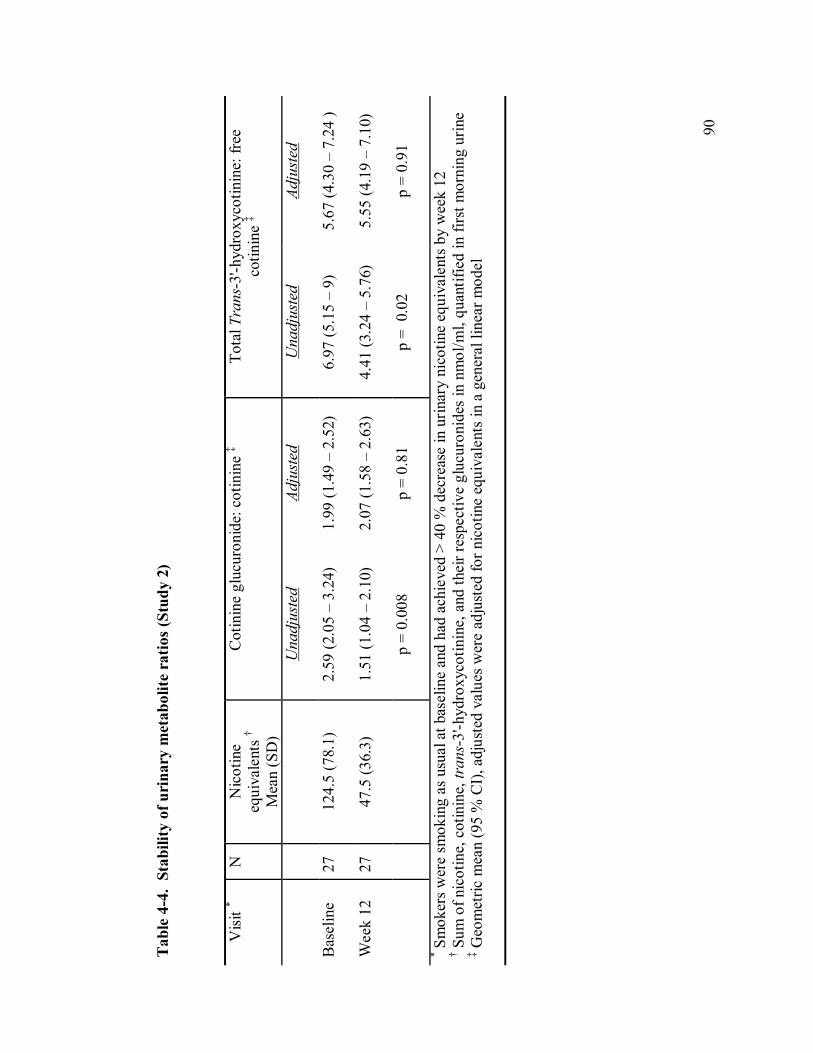
90
Tab
le 4
-4.
Stab
ility
of u
rina
ry m
etab
olite
rat
ios
(Stu
dy 2
)
Visi
t * N
N
icot
ine
equi
vale
nts †
M
ean
(SD
)
Cot
inin
e gl
ucur
onid
e: c
otin
ine
‡
Tota
l Tra
ns-3
'-hyd
roxy
cotin
ine:
free
co
tinin
e ‡
Una
djus
ted
Adju
sted
U
nadj
uste
d Ad
just
ed
Bas
elin
e 27
12
4.5
(78.
1)
2.59
(2.0
5 –
3.24
) 1.
99 (1
.49
– 2.
52)
6.97
(5.1
5 –
9)
5.67
(4.3
0 –
7.24
)
Wee
k 12
27
47
.5 (3
6.3)
1.
51 (1
.04
– 2.
10)
2.07
(1.5
8 –
2.63
) 4.
41 (3
.24
– 5.
76)
5.55
(4.1
9 –
7.10
)
p
= 0.
008
p =
0.81
p
= 0
.02
p =
0.91
* Sm
oker
s wer
e sm
okin
g as
usu
al a
t bas
elin
e an
d ha
d ac
hiev
ed >
40
% d
ecre
ase
in u
rinar
y ni
cotin
e eq
uiva
lent
s by
wee
k 12
† S
um o
f nic
otin
e, c
otin
ine,
tran
s-3'
-hyd
roxy
cotin
ine,
and
thei
r res
pect
ive
gluc
uron
ides
in n
mol
/ml,
quan
tifie
d in
firs
t mor
ning
urin
e ‡ G
eom
etric
mea
n (9
5 %
CI)
, adj
uste
d va
lues
wer
e ad
just
ed fo
r nic
otin
e eq
uiva
lent
s in
a g
ener
al li
near
mod
el
91
4.3.8 Metabolite ratios by UGT2B10 genotype
The relationship between Asp67Tyr genotype and phenotype assessed as metabolite
ratios is presented in Table 4-5. The urinary ratio of cotinine glucuronide to cotinine,
adjusted or unadjusted for nicotine equivalents, was significantly lower among
Asp67Tyr heterozygotes than wild-type individuals, mean (95 % CI): 1.26 (1.00 –
1.56) versus 2.03 (1.86 – 2.20), p < 0.0001. The ratio of urinary nicotine glucuronide to
nicotine was also significantly lower among Asp67Tyr heterozygotes than wild-type
individuals (p 0.005). In summary, UGT2B10 Asp67Tyr genotype and glucuronidation
ratios, as a biomarker of phenotype, were strongly associated. No statistical difference
was observed in the urinary ratio of total trans-3'-hydroxycotinine:free cotinine,
although a higher ratio of total trans-3'-hydroxycotinine:total cotinine was observed for
Asp67Tyr heterozygotes compared to wild-type, mean (95 % CI): 1.73 (1.46 – 2.03)
versus 1.29 (1.18 – 1.41), p = 0.048.
4.3.9 Nicotine equivalents by UGT2B10 genotype
During the evaluation of urinary nicotine metabolite concentrations, we suspected
that nicotine equivalents were lower among Asp67Tyr individuals than for wild-type.
Nicotine equivalents accounts for greater than 80 % of nicotine intake and therefore this
biomarker is useful to estimate nicotine intake during ad libitum smoking. Moreover,
we demonstrated in study 2 that there is no substantial shift to nicotine-N-oxidation
among Asp67Tyr heterozygotes (Figure 4-1). Nicotine equivalents were 15 % lower
92
for Asp67Tyr heterozygotes relative to wild-type, mean (95 % CI): 58.2 nmol/ml (48.9
– 68.2) versus 69.2 nmol/ml (64.3 – 74.5) respectively, p = 0.048 (Table 4-6).
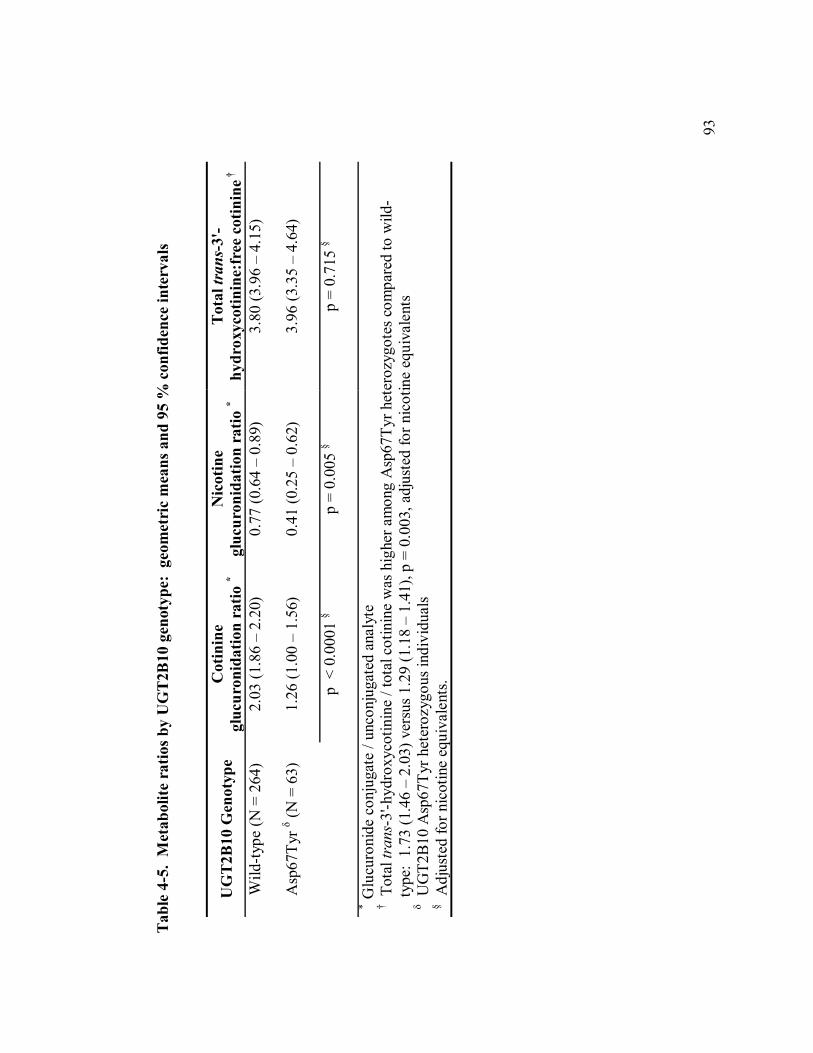
93
Tab
le 4
-5.
Met
abol
ite r
atio
s by
UG
T2B
10 g
enot
ype:
geo
met
ric
mea
ns a
nd 9
5 %
con
fiden
ce in
terv
als
UG
T2B
10 G
enot
ype
Cot
inin
e gl
ucur
onid
atio
n ra
tio *
Nic
otin
e gl
ucur
onid
atio
n ra
tio *
Tot
al tr
ans-
3'-
hydr
oxyc
otin
ine:
free
cot
inin
e †
Wild
-type
(N =
264
) 2.
03 (1
.86
– 2.
20)
0.77
(0.6
4 –
0.89
) 3.
80 (3
.96
– 4.
15)
Asp
67Ty
r δ (N
= 6
3)
1.26
(1.0
0 –
1.56
) 0.
41 (0
.25
– 0.
62)
3.96
(3.3
5 –
4.64
)
p
< 0
.000
1 §
p =
0.00
5 §
p =
0.71
5 §
* G
lucu
roni
de c
onju
gate
/ un
conj
ugat
ed a
naly
te
† Tot
al tr
ans-
3'-h
ydro
xyco
tinin
e / t
otal
cot
inin
e w
as h
ighe
r am
ong
Asp
67Ty
r het
eroz
ygot
es c
ompa
red
to w
ild-
type
: 1.
73 (1
.46
– 2.
03) v
ersu
s 1.2
9 (1
.18
– 1.
41),
p =
0.00
3, a
djus
ted
for n
icot
ine
equi
vale
nts
δ UG
T2B
10 A
sp67
Tyr h
eter
ozyg
ous i
ndiv
idua
ls
§ Adj
uste
d fo
r nic
otin
e eq
uiva
lent
s.
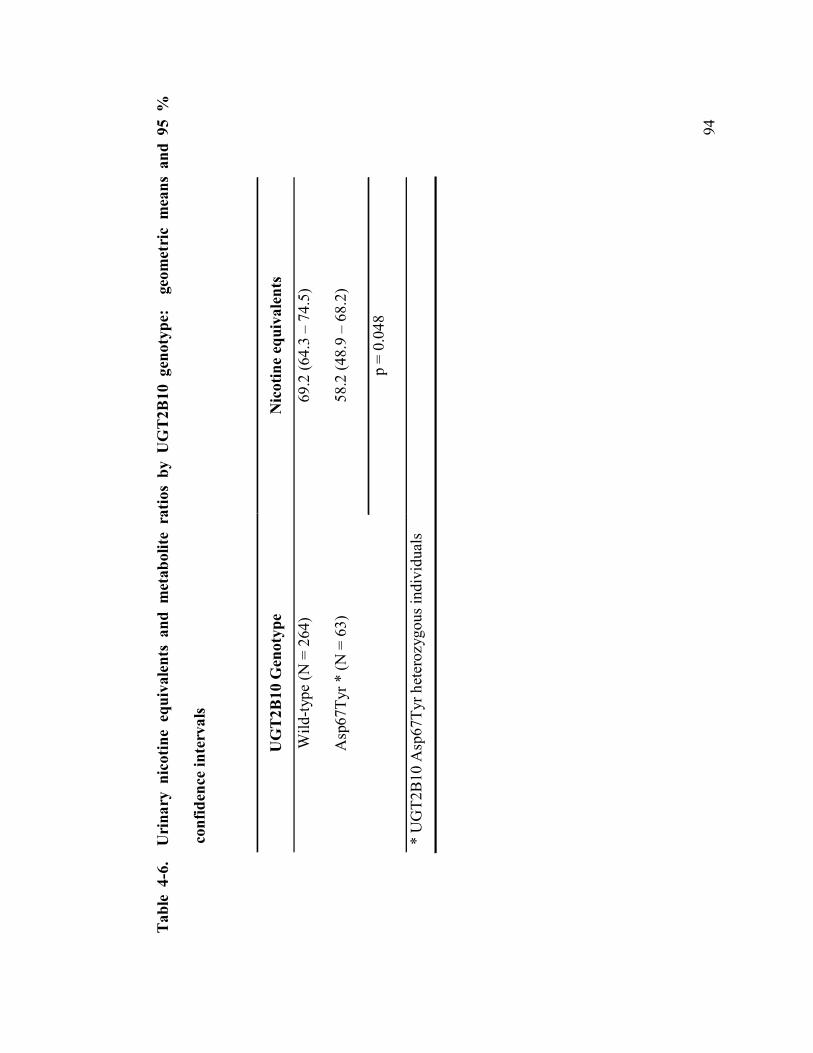
94
Tab
le 4
-6.
Uri
nary
nic
otin
e eq
uiva
lent
s an
d m
etab
olite
rat
ios
by U
GT
2B10
gen
otyp
e:
geom
etri
c m
eans
and
95
%
conf
iden
ce in
terv
als
UG
T2B
10 G
enot
ype
Nic
otin
e eq
uiva
lent
s
Wild
-type
(N =
264
) 69
.2 (6
4.3
– 74
.5)
Asp
67Ty
r * (N
= 6
3)
58.2
(48.
9 –
68.2
)
p
= 0.
048
* U
GT2
B10
Asp
67Ty
r het
eroz
ygou
s ind
ivid
uals
95
4.4 Discussion
Interindividual variation in glucuronidation of nicotine and cotinine is substantial
and the contribution of glucuronidation to total nicotine metabolism ranges from < 1 –
40 % based on nicotine and its metabolites recovered in smokers’ urine (112). On
average, an estimated 25 % of nicotine is metabolized to N-glucuronide conjugates of
nicotine or cotinine in individuals (159). Variation in glucuronidation influences the
distribution of nicotine metabolites and therefore may affect nicotine exposure
assessment using nicotine metabolite biomarkers. We observed that smokers who are
heterozygous for the Asp67Tyr allele have a unique distribution of nicotine metabolites
and that nicotine equivalents, a robust biomarker of nicotine intake, were lower among
Asp67Tyr heterozygotes compared to individuals without this allele. Therefore,
variation in nicotine glucuronidation, as with C-oxidation (115), may influence nicotine
consumption by smokers.
UGT2B10 is the most efficient catalyst of nicotine and cotinine N-glucuronidation
in vitro followed by UGT1A4 (87;163). Chen et al. identified the Asp67Tyr
polymorphism in UGT2B10 because it was linked to a haplotype that was associated
with decreased glucuronidation of the tobacco carcinogen 4-(methylnitrosamino)-1-(3-
pyridyl)-1-butanal (NNAL) by human liver microsomes (177). Subsequently, a 20 – 30
% decrease in nicotine and cotinine glucuonidation was observed among human liver
microsomes that were heterozygous for the Asp67Tyr allele compared to wild-type
(143).
96
Recently, we reported that the UGT2B10 Asp67Tyr allele is associated with a
decrease in the percent of cotinine and nicotine excreted as their glucuronide conjugates
in smokers’ urine (188). The allele frequency of this polymorphism is about 10 % in
European Americans and we demonstrated that it is also present in African Americans,
at an allele frequency that is likely similar to or lower than for European Americans
(177;188). To further investigate the effect of the Asp67Tyr polymorphism on nicotine
metabolism, beyond a direct effect on percent conjugation, we now have evaluated a
larger number of subjects while they were smoking as usual (n = 327; 263 wild-type
individuals and 63 heterozygotes).
In this study we corroborated our prior finding that UGT2B10 Asp67Tyr is
associated with decreased nicotine and cotinine N-glucuronidation. Significantly less
nicotine and cotinine were excreted as their glucuronide conjugates by individuals who
were heterozygous for the Asp67Tyr allele compared to wild-type; the mean values
were 22 % and 17 % lower for the Asp67Tyr group. The distribution of urinary
metabolites was distinct for individuals with the Asp67Tyr allele compared to wild-type
as these individuals had a lower fraction of nicotine and cotinine N-glucuronides, but
higher free cotinine and trans-3'-hydroxycotinine. Higher plasma concentrations of free
cotinine and trans-3'-hydroxycotinine were also observed in Asp67Tyr heterozygotes.
Overall, we observed that the Asp67Tyr allele affects concentrations of both plasma and
urinary nicotine metabolites and that the effect is consistent with a decrease in
glucuronidation.
97
UGT2B10 genotype clearly differentiated glucuronidation phenotypes, assessed as
the ratio of urinary cotinine glucuronide:cotinine or nicotine glucuronide:nicotine. The
glucuronide ratio for cotinine was 63 % lower and for nicotine was 53 % lower for
Asp67Tyr heterozygotes compared to wild-type (Table 4). Adjusting for variation in
nicotine equivalents did not diminish the difference in glucuronidation phenotype
observed by UGT2B10 Asp67Tyr genotype. We did not observe a significant increase
in nicotine-N-oxide excretion by glucuronidation genotype or phenotype. In
comparison, individuals with low glucuronidation genotype or phenotype had an
increase in the excretion of trans-3-hydroxycotinine. Perhaps low glucuronidation
phenotype is compensated by an increase in the clearance of cotinine through C-
oxidation to trans-3'-hydroxycotinine in some individuals. Shifts in the distribution of
metabolites that occur as a consequence of decreased metabolism through one pathway
are an indication that the relationships between metabolic pathways are dynamic. Total
nicotine metabolism is a function of the efficiency and capacity of all the major
pathways of nicotine metabolism.
Variation in metabolism is a source of error in estimating nicotine exposure.
Though free cotinine has been instrumental as a tobacco biomarker it can fail to
differentiate nicotine exposure between individuals in which the contribution of
glucuronidation and oxidation to total metabolism is different. Examples where
misclassification might occur, based on individuals in this study, were presented in
Table 4-3. Cluster analysis and generation of a metabolic heatmap was also used to
better visualize variation in the distribution of urinary nicotine metabolites. When
comparing groups in a study, misclassification error could be similar between the two
98
groups and may not be problematic. However, particularly in multi-ethnic study
populations where the frequency of polymorphisms in nicotine metabolizing genes is
different, nicotine exposure may be over- or under- estimated in one group relative to
another. Nicotine equivalents are better suited to estimate nicotine intake independent
of variation in the major pathways of nicotine metabolism.
We observed that urinary ratios of nicotine metabolites, including the ratio of
cotinine glucuronide:cotinine and trans-3'-hydroxycotinine:cotinine (total:total or
total:free), are influenced by nicotine equivalents and that this represents a dose effect.
Among individuals who were assessed both at baseline and after reducing nicotine
intake by 60 %, urinary metabolite ratios were significantly lower when the individuals
were smoking less, but this difference disappeared after adjusting for nicotine
equivalents. In contrast, adjusting for nicotine equivalents had no effect or actually
increased the strength of the reported associations between UGT2B10 genotype and
nicotine metabolite ratios (Table 4-4).
The most important finding of this study was that individuals who were
heterozygous for the Asp67Tyr allele had lower nicotine equivalents, which is a robust
measure of nicotine intake. When stratified by UGT2B10 genotype, nicotine
equivalents were 58.2 among heterozygotes compared to 69.2 nmol/ml for individuals
who did not have an Asp67Tyr allele (p < 0.05). Since the study participants were
smoking ad libitum this difference likely represents a moderate but significant decrease
in nicotine consumption that is attributable to the Asp67Tyr polymorphism in
UGT2B10. Nicotine equivalents were 84 % of that for wild-type. The effect of
99
CYP2A6 low activity alleles on nicotine equivalents specifically has not been reported.
However, nicotine equivalents are 34 % lower among Japanese Americans who have a
10-15 % higher allelic prevalence of the CYP2A6 deletion than European Americans
(133). Interestingly, we noticed that individuals with the lowest and highest plasma
trans-3'-hydroxycotinine to cotinine ratios had lower nicotine equivalents than
individuals with an average ratio. Then, individuals with incomplete metabolic
compensation for either low glucuronidation or low C-oxidation would represent groups
more likely to be low intensity smokers. Even a modest decrease in smoking intensity
could have a significant impact on risk of smoking attributable disease over a lifetime.
This is the first report demonstrating that a polymorphism in UGT2B10 may influence
smoking behavior. In different populations, the frequency of polymorphisms in
CYP2A6 and in UGT2B10 may influence the relative contribution of these alleles to
variation in nicotine metabolism and smoking behavior.
The extent to which variation in nicotine metabolism affects smoking behavior,
relative to other factors that influence smoking, is unknown. Ho et al. reported that
light smokers (<10 cigarettes/day) with low activity CYP2A6 alleles or a low oxidation
phenotype did not show behavioral compensation for slow metabolism based on having
higher plasma nicotine levels than other light smokers (150). Other genes that are not
involved with nicotine clearance also affect smoking behavior. The nicotinic CHRNA3
and CHRNA5 that encode subunits of the nicotinic acetylcholine receptor A was
recently reported by Derby et al. to influence smoking behavior (132). Polymorphisms
in CHRNA3 and CHRNA5 were associated with an increased risk of lung cancer, and it
was not until nicotine equivalents were measured that the increased cancer risk could be
100
attributed to increased smoking. Namely, polymorphisms in CHRNA3 and CHRNA5
are associated with increased nicotine equivalents and increased intake of tobacco.
4.5 Conclusions
The main finding was that UGT2B10 Asp67Tyr was associated with lower
glucuronidation phenotype and decreased nicotine intake, which supports the outcome
described in Chapter 3. Individuals who were heterozygous for the Asp67Tyr allele
excreted less nicotine or cotinine as their glucuronide conjugates than wild-type,
resulting in a 60% lower ratio of cotinine glucuronide:cotinine, a 50% lower ratio of
nicotine glucuronide: nicotine, and an increase in urinary and plasma cotinine and
trans-3'-hydroxycotinine. Moreover, nicotine equivalents, a robust biomarker of
nicotine intake, were lower among Asp67Tyr heterozygotes compared to individuals
without this allele. The distribution of metabolites in urine was affected by
glucuronidation or oxidation phenotype. Nicotine equivalents were useful to quantify
nicotine intake regardless of the relative contribution of the metabolic pathways.
4.6 Acknowledgements
Many thanks to Cassie Retzlaff, Nicole Thomson, and Aleks Knezevich for their
assistance in preparing samples and quantifying nicotine metabolites.
101
4.7 Publication of thesis work
The research discussed in Chapter 4 was submitted to Cancer Epidemiology
Biomarkers and Prevention in September 2009: Jeannette Zinggeler Berg, Linda von
Weymarn, Elizabeth A. Thompson, Katherine M. Wickham, Natalie A. Weisensel,
Dorothy K. Hatsukami, Sharon E. Murphy. UGT2B10 genotype influences nicotine
glucuronidation, oxidation and consumption.
102
CHAPTER 5
Cytochrome P450 2A7
5.1 Introduction
In the U.S. lung cancer is the most common fatal cancer and 90 % of lung cancers
are attributable to tobacco exposure (15). US adults and adolescents recognize smoking
as a risk of lung cancer, and in polls since 1990, over 90 % would agree that smoking is
a cause of lung cancer (18). Smokers interested in cessation also cite risk of lung
cancer as a motivating factor to quit. Nevertheless quitting and sustained cessation of
tobacco use are often difficult to achieve and thus tobacco use is likely to remain a
public health problem for some time to come. A common misperception is that nicotine
is carcinogenic, which it is not. There are 60 recognized carcinogens in tobacco
smoking, and among these polyaromatic hydrocarbons (i.e. benzo[a]pyrene) and 4-
(methylnitrosamino)-1-(3-pyridyl)-1-butanone (NNK) are potent lung carcinogens in a
number of animal models (34;193). The primary mechanism of NNK-mediated
carcinogenesis is metabolic activation by cytochrome P450 enzymes (P450s) and
generation of unstable metabolites that react with DNA and result in appreciable
genotoxicity (35;127;194;195). NNK metabolites have been quantified in plasma,
urine, and tissues including toe nails of smokers and individuals who are passively
exposed to smoke (37;38;196;197). The cumulative dose of NNK as well as variation
103
in the activation and detoxification of NNK is predicted to influence individual lung
cancer risk (132;193;198).
Metabolic activation is due to hydroxylation at the methylene and methyl carbons
adjacent to the N-nitroso group and these reactions result in the formation of reactive
electrophiles (Figure 5-1). Methyl α-hydroxylation generates 4-(3-pyridyl)-4-oxo-
butyldiazohydroxide which can form pyridyloxobutyl adducts with DNA or protein and
it reacts with water to form 4-hydroxy-4-(3-pyridyl)butanol (HPB) (199;200).
Methylene hydroxylation results in decomposition to methane diazohydroxide and 4-
oxo-4-(3-pyridyl) butanal (OPB). Methane diazohydroxide is a DNA and protein
methylating species; it also reacts with water and forms methanol (201). OPB can be
further oxidized to the carboxylic acid, denoted OPBA. In animal carcinogenicity
studies, NNK-derived adducts include O6-methylguanine, 7-methylguanine, O4-
methylguanine and pyridyloxobutyl-adducted nucleotides (202;203). Recently α-
hydroxylation metabolites were quantified in the urine of smokers who smoked low
nitrosamine cigarettes that were spiked with [pyridine-D4] NNK in place of their usual
cigarettes, which would contain a similar amount of unlabeled NNK (198). The
excretion of α-hydroxylation products represented 86 % of total NNK metabolites in
urine. In comparison, the percent of α-hydroxylation products previously reported in
the urine of laboratory animals was 58 %, 54 %, and 68 % for mice, rats, and primates
(198).
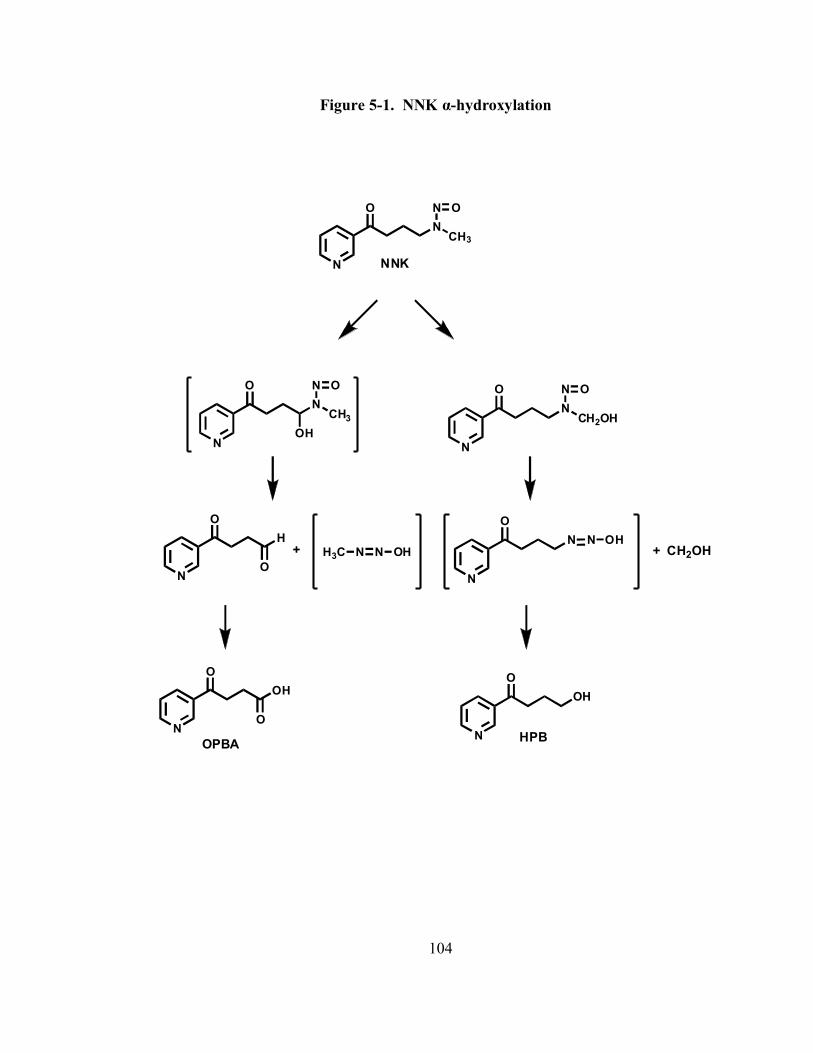
104
Figure 5-1. NNK α-hydroxylation
N
NCH3
O N O
NNK
N
NCH3
O N O
OHN
NCH2OH
O N O
N
OH
OH3C N N
N
ON
N
OOH
HPB
CH2OH+
N
OOH
O
OPBA
+ OHN OH
105
Since the half-life of reactive NNK metabolites is in the order of seconds, tissue
specific activation by cytochrome P450s is predicted to influence the site of
tumorgenicity in humans (200;204). NNK is not exclusively a lung carcinogen and also
causes cancers in the nasal cavity, liver, and pancreas of laboratory animals (35). Ding
et al. elegantly demonstrated that tissue-specific knock out of cytochrome P450
reductase in the lung or the liver of mice affects the distribution of tumors, with a
decrease in tumors in the lung when the reductase is absent in the lung but not when
reductase was absent in the liver. This demonstrated that NNK α-hydroxylation in the
lung is critical (204). The most efficient human catalyst of NNK α-hydroxylation is
P450 2A13 and this enzyme is an extrahepatic P450 that is expressed in the respiratory
tract (128;129). A more abundant hepatic enzyme, P450 2A6, is 93.5 % identical to
P450 2A13 but it is 300-fold less efficient at catalyzing α-hydroxylation (34). Crystal
structures of P450 2A13 and P450 2A6 have been solved, and docking of NNK into the
active site predicts that the volume and shape of the P450 2A13 active site is slightly
larger and can better accommodate NNK in a position that favors α-hydroxylation
(205;206).
Other human enzymes that likely contribute to hepatic NNK α-hydroxylation are
P450s 2B6 and 1A2. These enzymes are also poor catalysts compared to P450 2A13.
In human liver microsomes, 30 – 67 % of NNK hydroxylation is inhibited by anti-2A6
and anti-2B6 antibodies (127). Also co-incubation with phenacetin, a substrate of P450
1A2, results in up to 70 % inhibition of NNK metabolism (127). In Dr. Murphy’s
106
laboratory it was previously found that the total NNK hydroxylation attributable to
P450 2A enzyme in human liver microsomes is greater than expected for 2A6 alone
(unpublished). There is one other P450 2A in liver, P450 2A7, for which enzymatic
activity has not been demonstrated.
P450 2A7 is recognized as one of ~ 13 human P450s that have no known substrate
and unconfirmed function (207). The P450 2A7 proximal promoter appears to be intact
as individuals who are homozygous for a naturally-occurring 2A7/2A6 hybrid, where
the 5' regulatory region and exons 1–2 are of CYP2A7 origin and exons 3–9 are of
CYP2A6 origin, have significant 7-hydroxylation of the 2A6 probe substrate coumarin
(208). In liver, P450 2A7 mRNA is expressed at levels ranging from 1:10 to 10:1
relative to P450 2A6 mRNA (209). Ironically, P450 2A13 was predicted to be inactive
based on its similarity to P450 2A7, until it was successfully expressed in Spodoptera
frugiperda (SF9) insect cells and found to be an efficient catalyst of coumarin, NNK,
and nicotine oxidation (128).
A comparison of P450 2A7 to P450s 2A6 and 2A13 is presented in Table 5-1. The
National Center for Biotechnology Information (NCBI) reference amino acid sequence
is 94 % identical to P450 2A6 and 92 % identical to P450 2A13. P450 2A7 does not
have any unique residues in its predicted active site: 6 residues are identical to both
2A13 and 2A6, 3 residues are identical to 2A6 only, and 2 residues are identical only to
2A13 (Table 5-2). The conserved cysteine residue that forms a heme-thiolate ligand is
present in P450 2A7. However, in 2A6 and 2A13 residue 128 is an arginine that forms
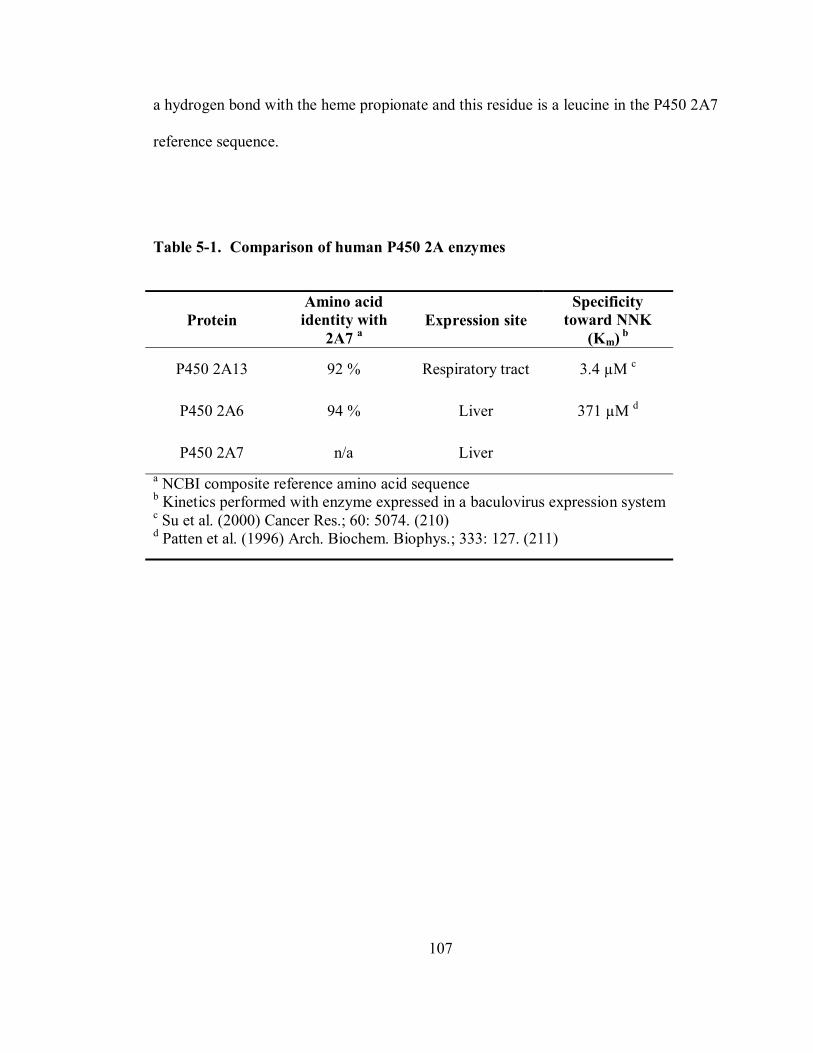
107
a hydrogen bond with the heme propionate and this residue is a leucine in the P450 2A7
reference sequence.
Table 5-1. Comparison of human P450 2A enzymes
Protein Amino acid identity with
2A7 a Expression site
Specificity toward NNK
(Km) b
P450 2A13 92 % Respiratory tract 3.4 µM c
P450 2A6 94 % Liver 371 µM d
P450 2A7 n/a Liver a NCBI composite reference amino acid sequence b Kinetics performed with enzyme expressed in a baculovirus expression system c Su et al. (2000) Cancer Res.; 60: 5074. (210) d Patten et al. (1996) Arch. Biochem. Biophys.; 333: 127. (211)
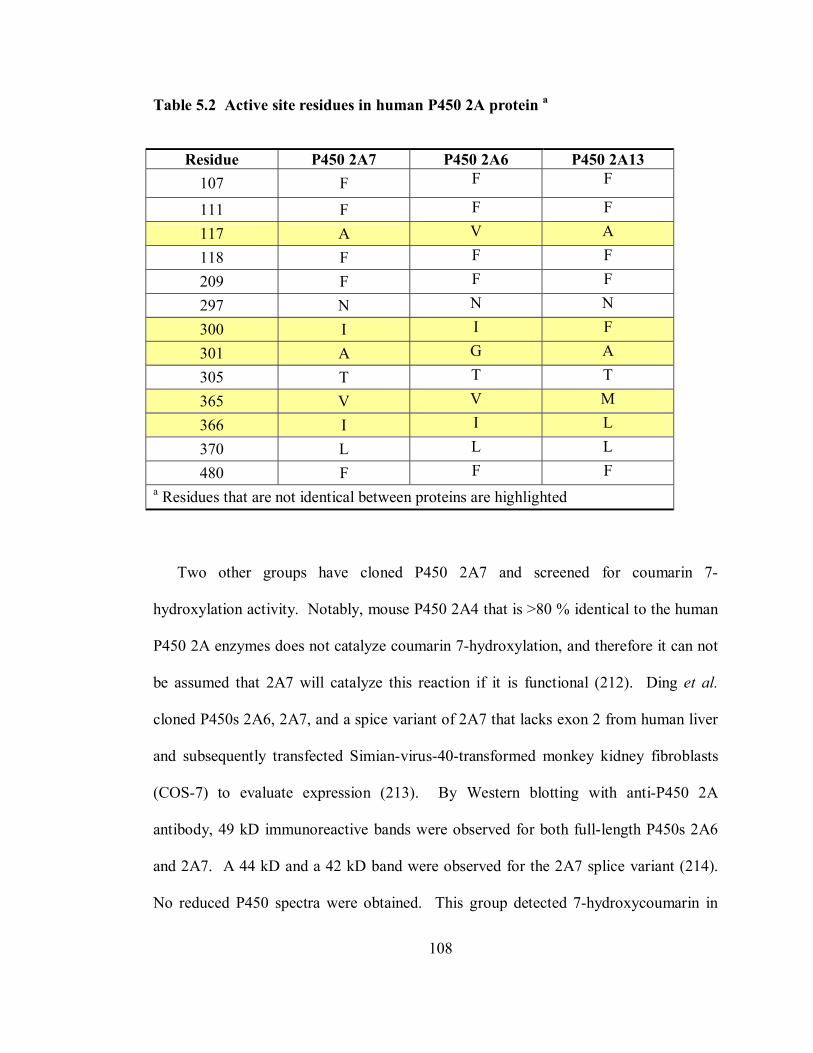
108
Table 5.2 Active site residues in human P450 2A protein a
Residue P450 2A7 P450 2A6 P450 2A13 107 F F F
111 F F F
117 A V A
118 F F F
209 F F F
297 N N N
300 I I F
301 A G A
305 T T T
365 V V M
366 I I L
370 L L L
480 F F F a Residues that are not identical between proteins are highlighted
Two other groups have cloned P450 2A7 and screened for coumarin 7-
hydroxylation activity. Notably, mouse P450 2A4 that is >80 % identical to the human
P450 2A enzymes does not catalyze coumarin 7-hydroxylation, and therefore it can not
be assumed that 2A7 will catalyze this reaction if it is functional (212). Ding et al.
cloned P450s 2A6, 2A7, and a spice variant of 2A7 that lacks exon 2 from human liver
and subsequently transfected Simian-virus-40-transformed monkey kidney fibroblasts
(COS-7) to evaluate expression (213). By Western blotting with anti-P450 2A
antibody, 49 kD immunoreactive bands were observed for both full-length P450s 2A6
and 2A7. A 44 kD and a 42 kD band were observed for the 2A7 splice variant (214).
No reduced P450 spectra were obtained. This group detected 7-hydroxycoumarin in
109
media from 2A6-transfected cells that were incubated with coumarin but not 2A7-
transfected cells. The methodology lacked sensitivity and low levels of product would
not have been detected. Yamono et al. also cloned P450s 2A6 and 2A7 from a human
liver and used recombinant vaccinia virus to express protein in HepG2 cells (146).
Significant protein expression was achieved for P450 2A6 but not for P450 2A7.
P450 2A7 does not appear to contribute significantly to in vivo coumarin 7-
hydroxylation or nicotine-5'-oxidation. A number of genetic crossover events have
occurred between CYP2A7 and CYP2A6 and have resulted in deletion and duplication
alleles that provide some insights about P450 2A7. Figure 5-2 illustrates the wild-type
chromosomal orientation of CYP2A6 and CYP2A7 and four allelic polymorphisms.
For instance, *1B represents a cross-over event in which a portion of the 3'-untranslated
region of CYP2A7 has replaced the analogous region in CYP2A6 (215). The *1B allele
is associated with increased nicotine oxidation (216). The *2 allele lacks CYP2A6
activity due to an inactivating point mutation, L160H, but has intact CYP2A7 (146).
Individuals who are homozygous for the *2 allele or the *4 deletion alleles exhibit very
low levels of coumarin 7-hydroxylation in vivo, and have 10-30 % of wild-type levels
of cotinine, the 5'-oxidation product of nicotine, in urine (115;217). In regards to P450
2A7 this could mean that the enzyme is (a) inactive; (b) poorly expressed; or (c) not
efficient at catalyzing nicotine C-oxidation or coumarin 7-hydroxylation compared to
P450 2A6. Alternatively, the *2 and *4 alleles may be exist as a haplotype that is
linked with a low activity allele of P450 2A7.
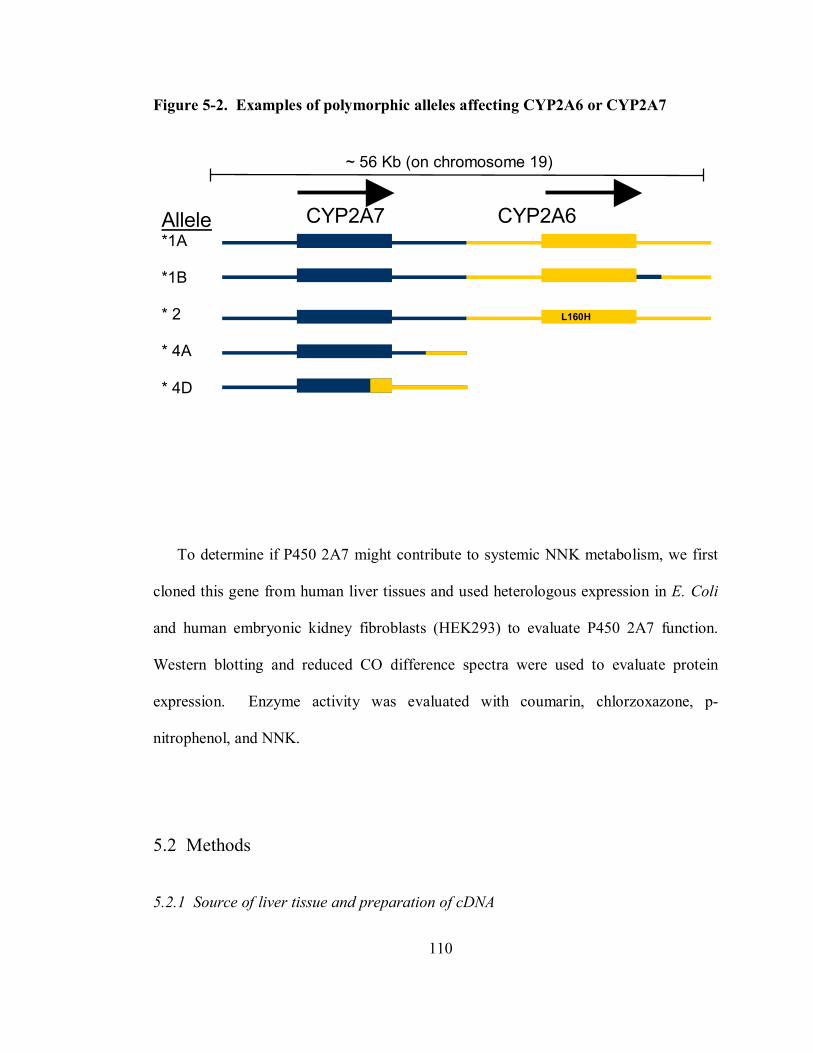
110
Figure 5-2. Examples of polymorphic alleles affecting CYP2A6 or CYP2A7
To determine if P450 2A7 might contribute to systemic NNK metabolism, we first
cloned this gene from human liver tissues and used heterologous expression in E. Coli
and human embryonic kidney fibroblasts (HEK293) to evaluate P450 2A7 function.
Western blotting and reduced CO difference spectra were used to evaluate protein
expression. Enzyme activity was evaluated with coumarin, chlorzoxazone, p-
nitrophenol, and NNK.
5.2 Methods
5.2.1 Source of liver tissue and preparation of cDNA
CYP2A7 CYP2A6
L160H
~ 56 Kb (on chromosome 19)
Allele*1A *1B * 2 * 4A * 4D
111
Frozen histologically normal human liver tissues (n = 5) were obtained from the
Masonic Cancer Center Tissue Procurement facility, University of Minnesota. The
frozen tissue, ~2 x 2 mm, was pulverized, homogenized using QIAshreader, and RNA
was extracted with RNeasy according to the manufacturer’s instructions (Qiagen,
Valencia, CA). First strand cDNA synthesis was performed with Superscript
(Stratagene, La Jolla, CA). Polymerase chain reaction was performed immediately after
first strand synthesis, to amplify CYP2A6 or CYP2A7 sequence.
5.2.2 PCR to detect CYP2A7 – partial sequence amplification
To assess if CYP2A7 mRNA was present, primers were designed to amplify exons
1-3 of CYP2A7 in a region where there were several nucleotide differences between the
CYP2A6 and CYP2A7 DNA sequence (Table 5-3). Pfx polymerase was used
(Invitrogen, Carlsbad, CA) and 35 amplification cycles of 94 ˚C for 45 sec., 60 ˚C for
45 sec., 68 ˚C for 90 sec were performed. The 350 bp products were visualized on 1 %
agarose gels. This assay would also amplify the uncommon CYP2A6*12 hybrid allele.
5.2.3 PCR amplification of full-length 2A7 and blunt-end cloning
Primers designed from the start to stop codons resulted in co-amplified CYP2A6
and CYP2A7. To more efficiently isolate CYP2A7 clones, a primer was designed to
anneal to the 3'-untranslated sequence of CYP2A7. Primer sequences are presented in
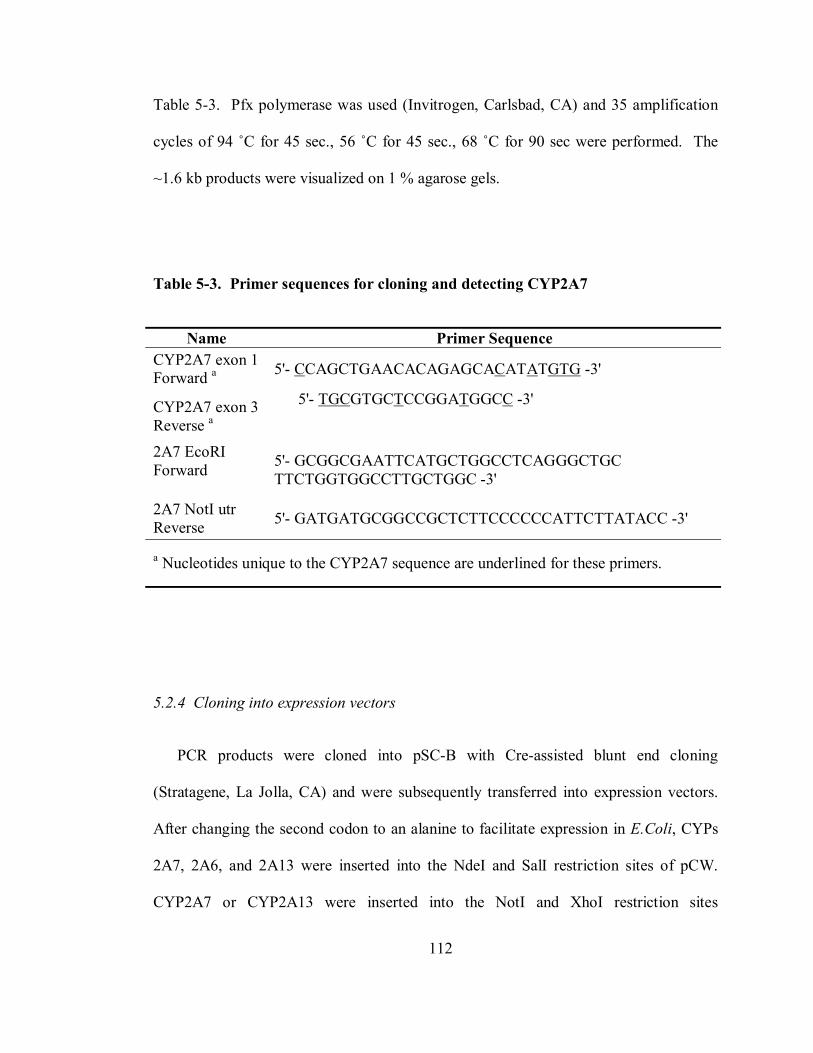
112
Table 5-3. Pfx polymerase was used (Invitrogen, Carlsbad, CA) and 35 amplification
cycles of 94 ˚C for 45 sec., 56 ˚C for 45 sec., 68 ˚C for 90 sec were performed. The
~1.6 kb products were visualized on 1 % agarose gels.
Table 5-3. Primer sequences for cloning and detecting CYP2A7
Name Primer Sequence CYP2A7 exon 1 Forward a 5'- CCAGCTGAACACAGAGCACATATGTG -3'
CYP2A7 exon 3 Reverse a
5'- TGCGTGCTCCGGATGGCC -3'
2A7 EcoRI Forward
5'- GCGGCGAATTCATGCTGGCCTCAGGGCTGC TTCTGGTGGCCTTGCTGGC -3'
2A7 NotI utr Reverse 5'- GATGATGCGGCCGCTCTTCCCCCCATTCTTATACC -3'
a Nucleotides unique to the CYP2A7 sequence are underlined for these primers.
5.2.4 Cloning into expression vectors
PCR products were cloned into pSC-B with Cre-assisted blunt end cloning
(Stratagene, La Jolla, CA) and were subsequently transferred into expression vectors.
After changing the second codon to an alanine to facilitate expression in E.Coli, CYPs
2A7, 2A6, and 2A13 were inserted into the NdeI and SalI restriction sites of pCW.
CYP2A7 or CYP2A13 were inserted into the NotI and XhoI restriction sites
113
downstream of the EF-1α promoter in the mammalian expression vector pBUDCE4.1
with or without a 6X His tag at the C-terminus (Invitrogen, Carlsbad, CA). The
constructs were confirmed by restriction enzyme digestions and by DNA sequence
analysis of the inserted gene.
5.2.5 Expression in E. Coli
Various expression conditions were tested. Expression constructs were transformed
into DH5α cells or Topp3 cells. Overnight cultures grown in Luria broth with 100
µg/ml ampicillin were used to seed 0.1 or 1L cultures (1:100). Expression media was
TB peptone containing 100 µg/ml carbenicillin, 1 mM thiamine, and trace elements
(218). The cells were grown at 32 ˚C or 37 ˚C until the OD at 600 nm was 0.6 at which
time δ-aminolevulinic acid (0.5 mM) was added. The cells were induced with freshly
prepared 1 mM isopropyl-b-D-thiogalactoside when the OD at 600 nm was 1.2;
induction at 0.7-1.5 was tested. The cells were incubated further for 24, 36, 48, or 72
hours at 32, 30, or 28 ˚C with 190-200 rpm shaking. A trial of co-expression +/- the
chaperone proteins pG-KJE8, pGro7, pKJE7, pG-Tf2, pTf16, was also performed
(Takara, Japan). Expression controls included simultaneously expressing CYP2A6 or
CYP2A13 as a positive control and untransformed E.Coli as a negative control.
114
5.2.6 Truncated CYP2A7 mutant
Dr. Emily Scott and Natasha DeVore generously provided truncated P450 2A7-
transfected E. Coli membrane fraction prepared from the full-length clone we isolated.
The truncated construct, 2A7dH, did not contain the N-terminal 30 residues. The
residues MAKKTSSK preceded amino acid 31, and a tetra-His tag was present at the C-
terminus.
5.2.7 Expression in human embryonic kidney fibroblasts (293T cells)
HEK293T cells were transfected using calcium phosphate, 20 µg plasmid per T-75
flask when cells were ~60 % confluent (219). Media was replaced with complete
DMEM after 6 hours and cells were incubated at 37 ˚C, 5 % CO2 for 48 hours.
5.2.8 Protein expression evaluation
SDS-page gel electrophoresis followed by gelcode blue staining (Pierce, Rockford,
IL) and Western blotting with anti-2A6 antibody (BD biosciences) was performed as
previously described (127). Heme-binding was assessed by dithionite-reduced CO
difference spectra obtained using an Olis DW- 2000 UV-Vis spectrophotometer (Olis
Inc., Bogard, GA) (61).
115
5.2.9 Activity assessment
Activity was assessed by incubating whole cells, cell lysate, or microsomes with
coumarin or 14C-coumarin (50 – 200 µM), chlorzoxazone (50, 150 µM), and p-
nitrophenol (50, 150 µM). HEK-expressed 2A7 was also incubated with 3H-NNK (80
µM). CYP2A7 or CYP2A7dH E.Coli preparations were pre-incubated with
oxidoreductase (1:2 – 1:6) and dilauroyl-L-α-phosphatidylcholine (0.2 µg/pmol P450)
for 15-45 min at 4°C just prior to use (206). Coumarin 7-hydroxylase activity was
determined as previously described (220). Detection of metabolites was performed
using UV-HPLC or radioflow HPLC analysis as described previously (206).
Chlorzoxazone 6-hydroxylation and 4-nitrocatechol formation were monitored by UV-
HPLC as previously reported (221;222).
5.3 Results
5.3.1 CYP2A7 cloning and isolation of wild-type and variant sequences
CYP2A7 was amplified successfully from 4 of 5 human livers. Initially, exons 1 to
3 were amplified to screen for the presence of CYP2A7 (Figure 5-3A), and DNA
sequencing confirmed the presence of CYP2A7. Full-length amplification generated
the expected 1.6 kB product, which was not affected by repeated digestion with a
CYP2A6-specific restriction enzyme (Figure 5-3B). Also, a 1.4 kB product was
observed for two samples. Several clones were isolated and sequenced from each
116
individual. Despite repeated attempts, no CYP2A7 was cloned from one liver from
which CYP2A6 was isolated.
Wild-type CYP2A7, a polymorphic variant, and a splice variant were cloned from 4
livers. Clones from two livers were identical to the NCBI reference sequence for
CYP2A7. However, a full-length variant that differed from the reference sequence of
CYP2A7 was detected in three different individuals. Since this variant was present in
multiple clones from different individuals it was not due to a cloning artifact or
sequencing error. The CYP2A7 variant (CYP2A7.1) shared 9 of 13 residues with
CYP2A7 that are not found in CYP2A6 or CYP2A13. These differences span the
coding region and therefore are unlikely to have arisen from a recent cross-over event..
Also the variant had two residues that differ from the reference CYP2A7 sequence and
are also not present in CYP2A6 or CYP2A13: Asp169Glu and Arg311Cys
substitutions. The splice variant was detected in all of the livers and was identical to the
previously published in-frame splice variant that results in replacement of a 163 bp
section of exon 2 with 10 bp. Splicing occurs at a G/gcagg alternative splice site. A
DNA sequence comparison of the CYP2A7 clones to wild-type 2A7 and 2A6 is
presented in Figure 5-4.
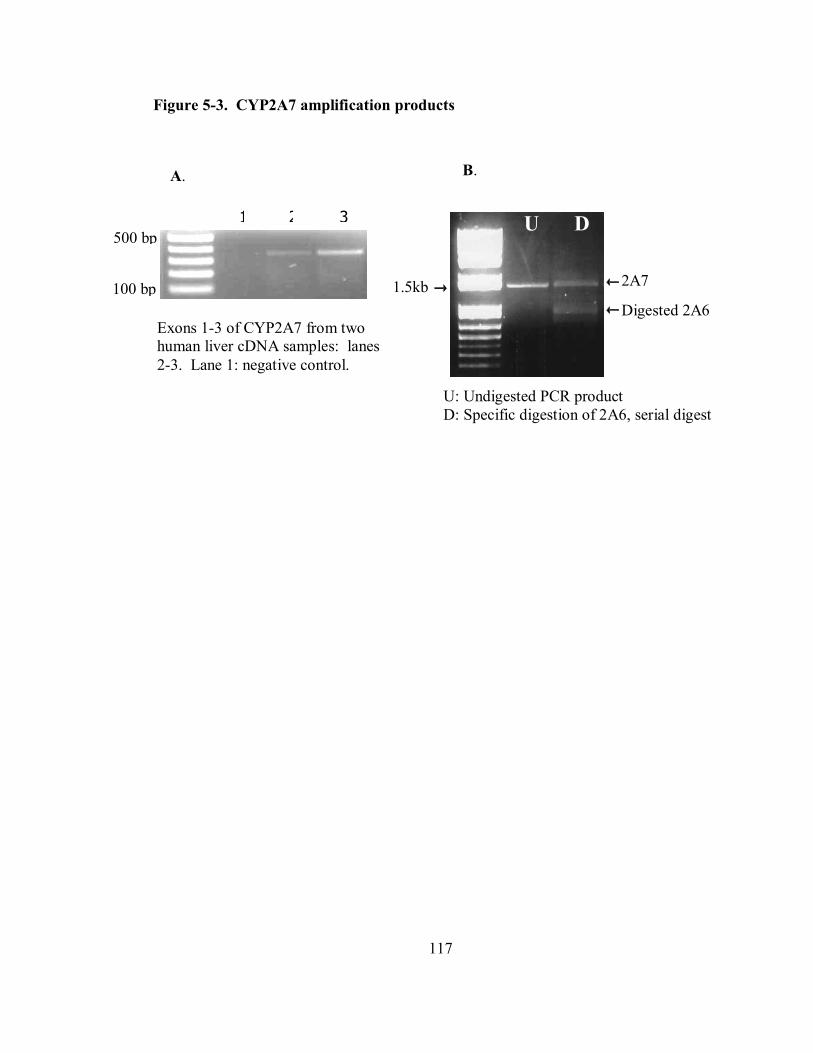
117
Figure 5-3. CYP2A7 amplification products
U: Undigested PCR product D: Specific digestion of 2A6, serial digest
1.5kb 2A7
Digested 2A6
U D 500 bp
100 bp
2 3
Exons 1-3 of CYP2A7 from two human liver cDNA samples: lanes 2-3. Lane 1: negative control.
1
A. B.
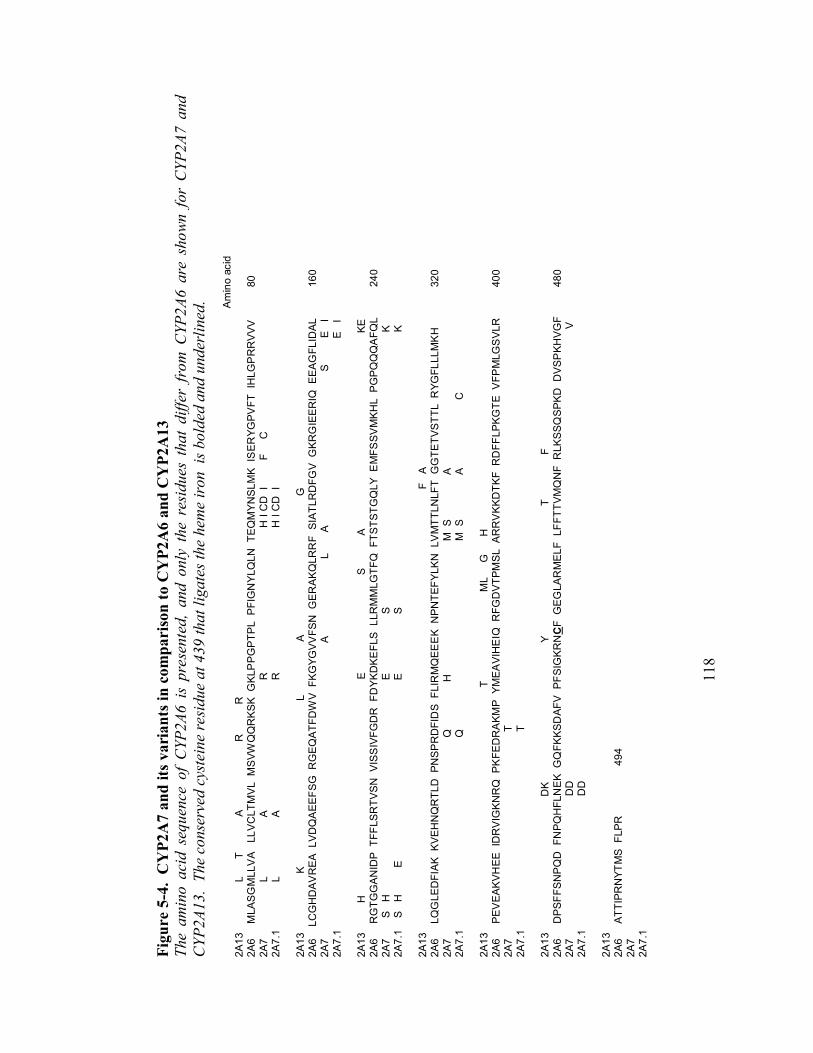
11
8
Figu
re 5
-4.
CY
P2A
7 an
d its
var
iant
s in
com
pari
son
to C
YP2
A6
and
CY
P2A
13
The
amin
o ac
id s
eque
nce
of C
YP2A
6 is
pre
sent
ed,
and
only
the
res
idue
s th
at d
iffer
fro
m C
YP2A
6 ar
e sh
own
for
CYP
2A7
and
CYP
2A13
. Th
e co
nser
ved
cyst
eine
resi
due
at 4
39 th
at li
gate
s the
hem
e ir
on i
s bol
ded
and
unde
rlin
ed.
A
min
o ac
id
2A13
L
T
A
R
R
2A6
M
LASG
MLL
VA
LLV
CLT
MV
L M
SVW
RKS
K G
KLP
PGPT
PL P
FIG
NY
LQLN
TE
QM
YNSL
MK
IS
ERYG
PVFT
IH
LGP
RR
VVV
80
2A
7
L
A
R
H I
CD
I
F
C
2A7.
1
L
A
R
H
I C
D I
2A13
K
L
A
G
2A6
LC
GH
DA
VR
EA L
VD
QA
EEFS
G R
GEQ
ATFD
WV
FKG
YGV
VFS
N G
ER
AKQ
LRR
F S
IATL
RD
FGV
GK
RG
IEER
IQ E
EAG
FLID
AL
160
2A7
A
L
A
S
E
I
2A7.
1
E
I
2A13
H
E
S
A
KE
2A
6
RG
TGG
AN
IDP
TFF
LSR
TVS
N V
ISS
IVFG
DR
FD
YK
DK
EFL
S L
LRM
MLG
TFQ
FTS
TSTG
QLY
EM
FSS
VM
KH
L P
GP
QA
FQL
240
2A7
S
H
E
E
S
K 2A
7.1
S
H
E
E
S
K
2A
13
F
A
2A6
L
QG
LED
FIAK
KVE
HN
QR
TLD
PN
SPR
DFI
DS
FLI
RM
QEE
EK
NP
NTE
FYLK
N L
VM
TTLN
LFT
GG
TETV
STTL
RYG
FLLL
MK
H
320
2A7
Q
H
M S
A
2A7.
1
Q
H
M S
A
C
2A13
T
ML
G
H
2A6
P
EVEA
KVH
EE I
DR
VIG
KNR
Q P
KFE
DR
AKM
P Y
MEA
VIH
EIQ
RFG
DVT
PMSL
AR
RV
KKD
TKF
RD
FFLP
KGTE
VFP
MLG
SV
LR
400
2A7
T
2A7.
1
T
2A13
D
K
Y
T
F
2A6
D
PSFF
SNP
QD
FN
PQH
FLN
EK G
QFK
KSD
AFV
PFS
IGK
RN
CF
GE
GLA
RM
ELF
LFF
TTV
MQ
NF
RLK
SSQ
SPKD
DVS
PKH
VGF
480
2A7
DD
V
2A7.
1
D
D
2A
13
2A6
A
TTIP
RN
YTM
S F
LPR
49
4 2A
7 2A
7.1
119
5.3.2 CYP2A7 expression
P450 expression with full-length CYP2A7 was achieved inconsistently and at low
levels of expression compared to either CYP2A6 or CYP2A13. Wild-type CYP2A7,
CYP2A7.1, and CYP2A7 with a portion of the 3'-untranslated region were transfected
into E. Coli or HEK293 cells for heterologous expression. Varying time of induction,
temperature of incubation, shaking speed, total incubation time, host E.Coli strain, and a
limited trial of co-expression with chaperone proteins did not improve expression of
CYP2A7. CYP2A6 or CYP2A13 transfections were conducted at the same time and
under the same conditions as for CYP2A7, and these constructs typically expressed
without difficulty. Western blotting with anti-2A6 antibody and reactions with
coumarin were used to evaluate expression, and reduced CO-difference spectra was
performed on a subset of expression trials.
A Western blot of full-length CYP2A7-transfected HEK cells with an
immunoreactive band at the expected size of 49 kD is presented in Figure 5-5. In later
experiments, new anti-body from BD biosciences had significantly lower sensitivity and
specificity compared to the prior lots. After adjusting blotting conditions, the new
antibody still performed poorly and was only marginally more better than Gel-code blue
staining at detecting purified P450 2A6 or purified P450 2A13. Therefore, the limit of
detection was ~ 0.5 pmol protein. Figure 5-6 illustrates non-specific banding on the
anti-CYP2A6 western blot in CYP2A7-transfected and untransfected HEK cells. Also,
Figure 5-6 depicts immunoreactive bands from E.Coli microsomes that were
transformed with truncated CYP2A7 (a gift from Natasha DeVore in the laboratory of
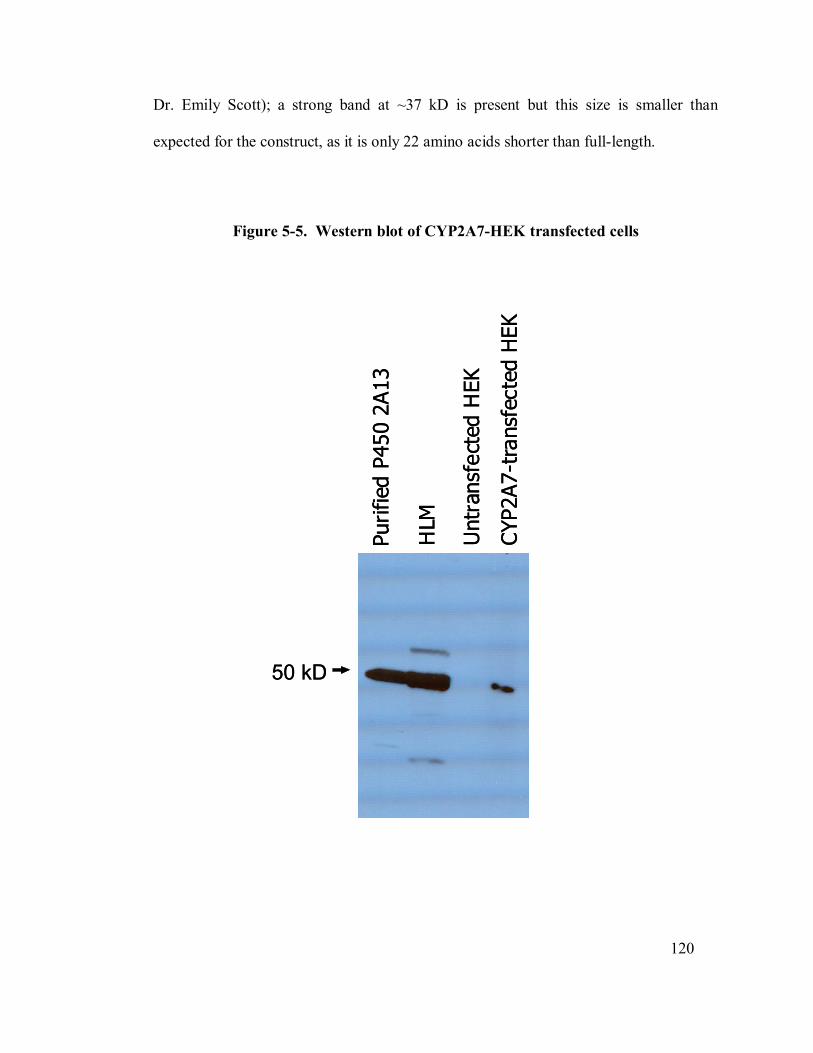
120
Dr. Emily Scott); a strong band at ~37 kD is present but this size is smaller than
expected for the construct, as it is only 22 amino acids shorter than full-length.
Figure 5-5. Western blot of CYP2A7-HEK transfected cells
Purif
ied
P450
2A1
3
HLM
Unt
rans
fect
edH
EK
CYP2
A7-t
rans
fect
ed H
EK
50 kD
Purif
ied
P450
2A1
3
HLM
Unt
rans
fect
edH
EK
CYP2
A7-t
rans
fect
ed H
EK
50 kD
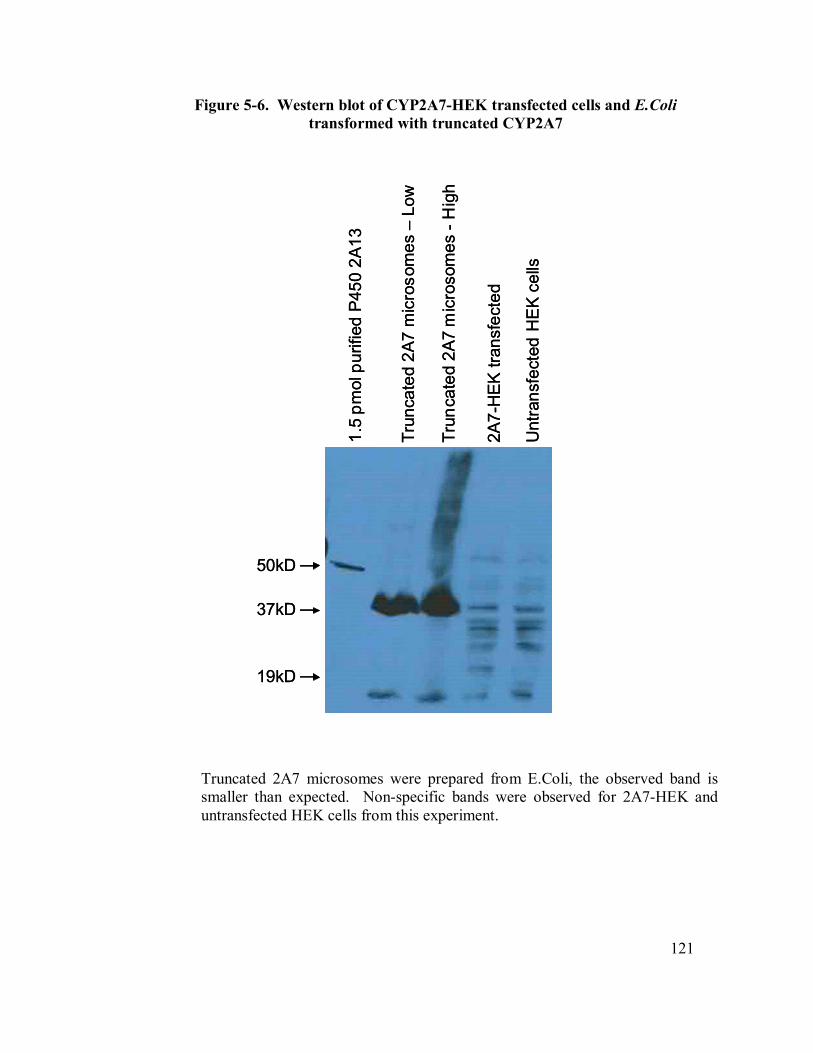
121
Figure 5-6. Western blot of CYP2A7-HEK transfected cells and E.Coli transformed with truncated CYP2A7
1.5
pmol
purif
ied
P450
2A1
3
Trun
cate
d 2A
7 m
icro
som
es–
Low
Trun
cate
d 2A
7 m
icro
som
es-H
igh
2A7-
HEK
tran
sfec
ted
Unt
rans
fect
edH
EK c
ells
50kD
37kD
19kD
1.5
pmol
purif
ied
P450
2A1
3
Trun
cate
d 2A
7 m
icro
som
es–
Low
Trun
cate
d 2A
7 m
icro
som
es-H
igh
2A7-
HEK
tran
sfec
ted
Unt
rans
fect
edH
EK c
ells
50kD
37kD
19kD
Truncated 2A7 microsomes were prepared from E.Coli, the observed band is smaller than expected. Non-specific bands were observed for 2A7-HEK and untransfected HEK cells from this experiment.
122
5.3.3 Reduced CO-difference spectra
Full-length and truncated P450 2A7 preparations exhibited a peak at 420 nm when
reduced-CO difference spectra were obtained. Spectra of truncated P450 2A7
microsomes was performed by Natasha DeVore in the laboratory of Dr. Emily Scott,
University of Kansas. A distinct peak at 450 nm was never observed.
5.3.4 Activity assays
Total coumarin metabolism and coumarin 7-hydroxylation by P450 2A7
preparations were compared to untransfected preparations and either P450 2A6 or P450
2A13. No coumarin 7-hydroxylation was observed for P450 2A7 preparations. In a
preliminary experiment, a peak that co-eluted with 8-hydroxycoumarin was observed
after incubating CYP2A7-transfected HEK microsomes with 14C-coumarin (Figure 5-
6); however this result was not reproduced subsequently. Incubation of the same
preparation with NNK did not show α-hydroxylation.
Full-length and truncated P450 preparations were evaluated for chlorzoxazone 6-
hydroxylation and p-nitrophenol oxidation to 4-nitrocatechol. No products were
observed for any P450 2A7 preparation, while P450 2A13 expressed under the same
conditions exhibited detectable activity even when Western blotting was inconclusive.
The addition of b5 and increasing the amount of oxidoreductase also did not have an
effect on P450 2A7 activity.
123
5.4 Discussion
We had predicted that P450 2A7 might be an active enzyme and that it would be a
good candidate to evaluate for NNK metabolism. We had no difficulty isolating
CYP2A7 mRNA, albeit co-amplification of CYP2A6 was a problem initially.
However, we failed to achieve robust levels of full-length CYP2A7 expression in HEK
or E.Coli cultures. Enzyme activity is detectable even when expression is low (< 1
pmol P450 per reaction volume) if the enzyme is an efficient catalyst of the screening
reaction. We observed no product formation upon incubating CYP2A7 preparations
with substrates that are metabolized by other P450 2A enzymes.
Also, no activity was observed with a truncated version of wild-type (identical to
reference sequence) CYP2A7 with coumarin, p-nitrophenol, or chlorzoxazone in our
laboratory or in the laboratory of Dr. Emily Scott. In the absence of a P450 peak,
indicating that there was no evidence of properly incorporated heme, we did not screen
additional substrates. The CYP2A7.1 variant has not been studied in its truncated form.
CYP2A7 is polymorphic and it is likely that some of these variants or the wild-type
have low or no activity. In the NCBI database, there are 114 single nucleotide
polymorphisms in CYP2A7, which is similar to the number documented for CYP2A6.
Interestingly, wild-type CYP2A7 has a leucine at position 128 and this would interfere
with an arginine-mediated interaction between the P450 enzyme and the heme
propionate. However, the variant CYP2A7.1 had a conserved arginine in this position
and still did not have characteristics of an active P450. A mutagenesis study between
124
CYP2A7 and CYP2A6 or CYP2A13 could be interesting from a structure-function
perspective.
5.5 Conclusion
To date, at least 4 laboratories have evaluated the expression and function of
CYP2A7 and none have observed a P450 spectra or enzymatic activity. However, we
lack structural information on why this protein might be inactive and therefore can not
conclude that CYPA7 protein is entirely inactive at this time. It is improbable that we
missed detecting a stable and efficient catalyst, and from a practical standpoint we can
assume that P450 2A7 is unlikely to contribute significantly to total NNK metabolism.
5.6 Acknowledgements
Many thanks to Katie Lee for her contribution to cloning CYP2A7 and to
expression trials.
125
CHAPTER 6
CYP2A13 active site mutation Asn297Ala
and metabolism of coumarin and tobacco-
specific nitrosamines
Content included in this chapter is reprinted with permission of the American Society
for Pharmacology and Experimental Therapeutics. All rights reserved.
6.1 Forward
This study was published in Drug Metabolism & Disposition with shared co-first
authorship between Dr. Kari Schlicht, a former graduate student in Dr. Murphy’s
laboratory, and myself. Dr. Schlicht described a significant portion of the research in
her PhD thesis and while I will discuss her findings related to NNN and NNK
metabolism, I will focus on my contribution which was coumarin metabolism by the
P450 Asn297Ala mutant.
126
6.2 Introduction
The tobacco-specific nitrosamines, (S)-N′-nitrosonornicotine ((S)-NNN) and 4-
(methylnitrosamino)-1-(3-pyridyl)-1-butanone (NNK) are carcinogens found in
unburned tobacco and cigarette smoke. Both NNN and NNK are classified as human
carcinogens (13;223). NNN induces esophageal and nasal tumors in rodents and NNK
is a potent lung carcinogen in rodents (35). Both NNN and NNK require P450-
catalyzed metabolism to exert their carcinogenic effects. Metabolic activation occurs
by hydroxylation of the carbons alpha to the nitroso moiety. For NNN, hydroxylation
occurs at the 2′- and 5′-carbon positions to ultimately form 4-oxo-4-(3-pyridyl)-1-
butanone (keto alcohol), 5-(3-pyridyl)-2-hydroxytetrahydrofuran (lactol), and reactive
diazohydroxide intermediates (Figure 6-1) (34). Hydroxylation of NNK occurs at the
α-methyl and α-methylene carbon positions, forming keto alcohol (HPB), 4-oxo-1-(3-
pyridyl)-1-butanone (keto aldehyde, OPB), and two diazohydroxides that are capable of
pyridyloxobutylating or methylating DNA (Figure 6-1) (34).
In humans, CYP2A13 is an important catalyst of NNN and NNK α-hydroxylation
(128;129). The high efficiency of CYP2A13 for NNK metabolic activation combined
with its expression in respiratory tissues including nasal mucosa, lung, and trachea
suggest that CYP2A13 plays a critical role in tobacco-specific nitrosoamine-induced
carcinogenesis (34;128;224)
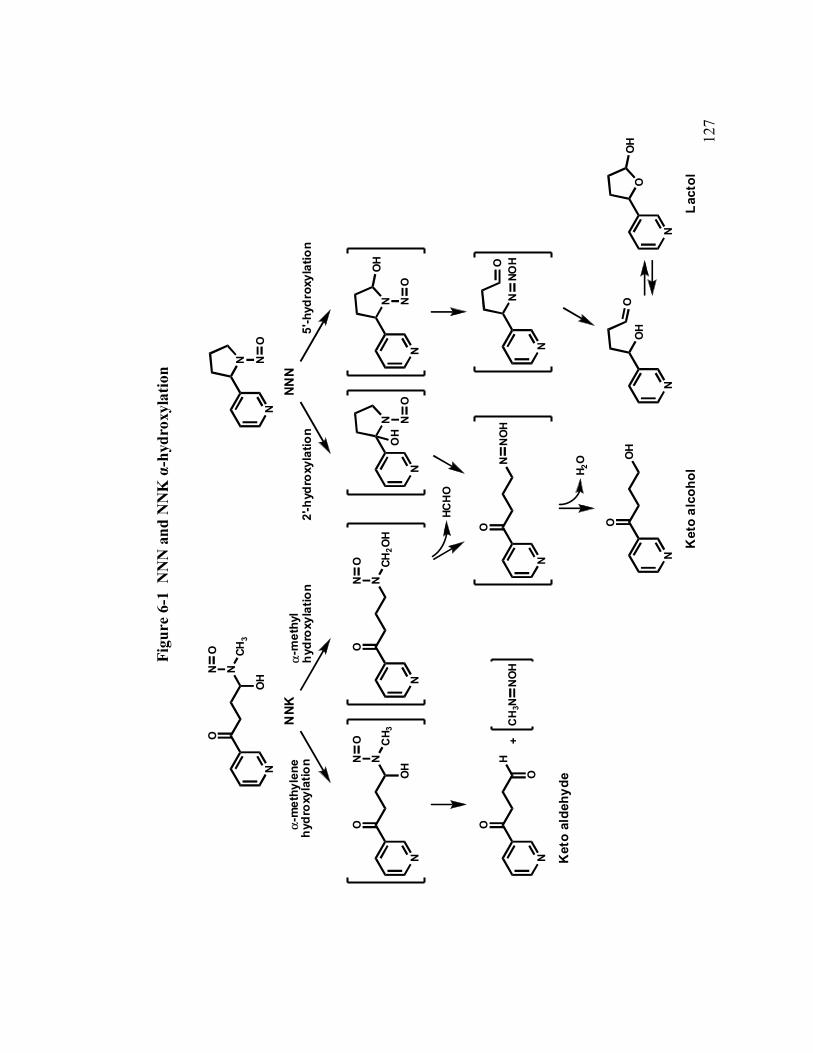
12
7
Figu
re 6
-1 N
NN
and
NN
K α
-hyd
roxy
latio
n
N
NCH
3
O
OH
NO
NNK
N
NNN
N NO
N
NC
H 3
O
OH
NO
N
NCH
2OH
ON
O
N
N NO
OH
N
N NO
OH
N
O
H
O
CH
3NN
OH
+
N
O
NN
OH
Ket
oal
dehy
de
N
OO
H
Ket
oal
coho
l
N
N
N
OH
O
ONO
H
N
OO
H
Lact
ol
α-m
ethy
lhy
drox
ylat
ion
α-m
ethy
lene
hydr
oxyl
atio
n2'
-hyd
roxy
latio
n5'
-hyd
roxy
latio
n
H 2O
HCH
O
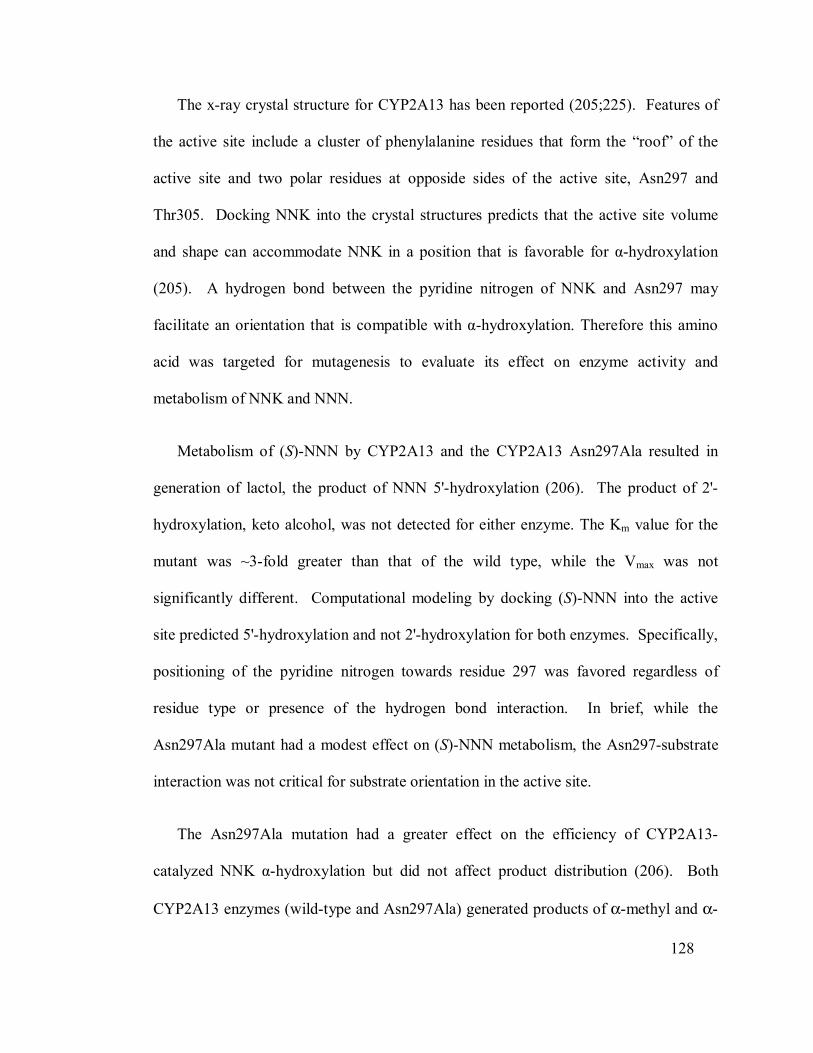
128
The x-ray crystal structure for CYP2A13 has been reported (205;225). Features of
the active site include a cluster of phenylalanine residues that form the “roof” of the
active site and two polar residues at opposide sides of the active site, Asn297 and
Thr305. Docking NNK into the crystal structures predicts that the active site volume
and shape can accommodate NNK in a position that is favorable for α-hydroxylation
(205). A hydrogen bond between the pyridine nitrogen of NNK and Asn297 may
facilitate an orientation that is compatible with α-hydroxylation. Therefore this amino
acid was targeted for mutagenesis to evaluate its effect on enzyme activity and
metabolism of NNK and NNN.
Metabolism of (S)-NNN by CYP2A13 and the CYP2A13 Asn297Ala resulted in
generation of lactol, the product of NNN 5'-hydroxylation (206). The product of 2'-
hydroxylation, keto alcohol, was not detected for either enzyme. The Km value for the
mutant was ~3-fold greater than that of the wild type, while the Vmax was not
significantly different. Computational modeling by docking (S)-NNN into the active
site predicted 5'-hydroxylation and not 2'-hydroxylation for both enzymes. Specifically,
positioning of the pyridine nitrogen towards residue 297 was favored regardless of
residue type or presence of the hydrogen bond interaction. In brief, while the
Asn297Ala mutant had a modest effect on (S)-NNN metabolism, the Asn297-substrate
interaction was not critical for substrate orientation in the active site.
The Asn297Ala mutation had a greater effect on the efficiency of CYP2A13-
catalyzed NNK α-hydroxylation but did not affect product distribution (206). Both
CYP2A13 enzymes (wild-type and Asn297Ala) generated products of α-methyl and α-
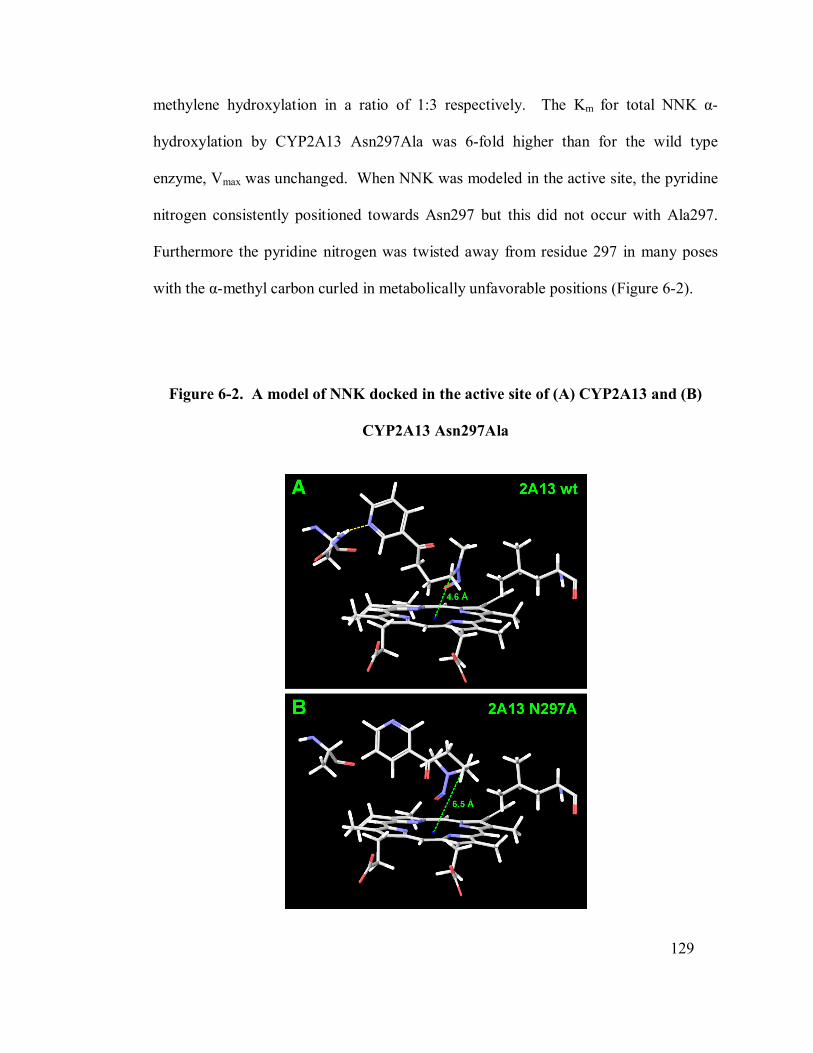
129
methylene hydroxylation in a ratio of 1:3 respectively. The Km for total NNK α-
hydroxylation by CYP2A13 Asn297Ala was 6-fold higher than for the wild type
enzyme, Vmax was unchanged. When NNK was modeled in the active site, the pyridine
nitrogen consistently positioned towards Asn297 but this did not occur with Ala297.
Furthermore the pyridine nitrogen was twisted away from residue 297 in many poses
with the α-methyl carbon curled in metabolically unfavorable positions (Figure 6-2).
Figure 6-2. A model of NNK docked in the active site of (A) CYP2A13 and (B)
CYP2A13 Asn297Ala
130
CYP2A13 is an efficient catalyst of coumarin metabolism (212;212;226).
CYP2A13 catalyzes both the 7-hydroxylation and 3,4-epoxidation of coumarin with
similar efficiency (Figure 6-3). In contrast, CYP2A6, which is 93.5 % identical to
CYP2A13 at the amino acid level, exclusively catalyzes coumarin 7-hydroxylation.
The crystal structure of CYP2A6 was solved with coumarin in the active site, and a
hydrogen bond interaction between Asn297 and the carbonyl oxygen of coumarin
contributes to the orientation of coumarin for 7-hydroxylation (225). The 7-
hydroxycoumarin product is very stable and is easily quantified by fluorescence
detection. However, the 3,4-epoxide is unstable and can react with other components
in the incubation. The 3,4 epoxidation of coumarin has been quantified as the formation
of o-HPA, which is generated non-enzymatically from coumarin 3,4-epoxide (Figure 6-
3) (227;228). The effect of an Asn297Ala mutation on the specificity of CYP2A13-
catalyzed coumarin metabolism is reported here.
13
1
Figu
re 6
-3.
Cou
mar
in 7
-hyd
roxy
latio
n an
d 3,
4-ep
oxid
atio
n pa
thw
ays
OO
OO
OO
HO
O
OH
OOSG
OH
OOSG
O
H
Cou
mar
in7O
HC
oum
arin
Cou
mar
in3,
4-ep
oxid
e
o-HP
A
P450
2A13
P450
2A6
P450
2A13
+G
SH,G
ST
H2O
132
6.3 Materials and Methods
6.3.1 Chemicals and Reagents
[U-14C-benzyl]coumarin (31 mCi mmol-1, 99.5% purity) was purchased from
Amersham Pharmacia Biotech (Piscataway, NJ). o-Hydroxyphenylacetaldehyde (o-
HPA) was a gift from Dr. Louis Lehman-McKeeman of Procter & Gamble (Cincinnati,
OH). All other chemicals and reagents were purchased from Sigma-Aldrich (St. Louis,
MO).
6.3.2 Site-Directed Mutagenesis
Full-length CYP2A13 (with the second codon changed from leucine to alanine and
four histidine residues added to the N terminus) in the pKK233-2 plasmid (Pharmacia,
Uppsala, Sweden) was a gift from Dr. Emily Scott (University of Kansas, Lawrence,
KS). The QuikChange (Stratagene, La Jolla, CA) method was used to introduce the
single nucleotide mutation. Primers used for site-directed mutagenesis were the
following: 5′-gtgatgaccaccctggccctcttctttgcgggc-3′ (forward primer, mutated bases are
underlined) and 5′-cccgcaaagaagagggccagggtggtcatcacc-3′ (reverse primer, mutated
bases are underlined). The single Asn297Ala mutation was confirmed by DNA
sequencing.
133
6.3.3 Protein Expression and Purification
Rat NADPH-P450 oxidoreductase was expressed in Escherichia coli and purified as
previously described (Hanna et al., 1998). Wild type CYP2A13 and CYP2A13
Asn297Ala were expressed in TOPP-3 E. coli cells (Stratagene, La Jolla, CA) at 30˚C
with 190 rpm shaking and an with an induction time of 72 hours using the protocol
previously described (229). Cells were harvested and purified using a previously
published protocol (230).
6.3.4 Protein Characterization and Enzyme Reconstitution
Enzyme expression and purity was visualized by SDS-Page with Gel Code Blue
staining (Pierce Biotechnology, Rockford IL). Expression of CYP2A13 and CYP2A13
Asn297Ala was confirmed by Western blot using anti-CYP2A6 antibody (BD
Biosciences, San Jose, CA) that also detects CYP2A13 (Wong et al., 2005b).
Cytochrome P450 content was determined for each enzyme preparation by dithionite-
reduced CO difference spectra obtained using an Olis DW-2000 UV-Vis
spectrophotometer (Olis Inc., Bogard, GA) (61). Enzymes were reconstituted with 1:4
P450:oxidoreductase and dilauroyl-L-α-phosphatidylcholine (0.2 µg/pmol P450) for 45
min at 4°C just prior to use.
134
6.3.5 Coumarin Metabolism
Total coumarin metabolism was determined using [U-14C-benzyl]coumarin and
radioflow HPLC analysis. The method used was a modification of a previously
described HPLC system (212). Reconstituted CYP2A13 or CYP2A13 Asn297Ala (40
pmol) were each incubated with 65 µM of [U-14C-benzyl]coumarin (31 mCi mmol-1),
100 mM Tris buffer, pH 7.4, an NADPH-generating system (0.4 mM NADP+, 100 mM
glucose-6-phosphate, and 0.4 units ml-1 glucose-6-dehydrogenase) in a final volume of
150 µL for 10-60 min at 37 °C. Reactions were terminated by addition of 15 µL 15%
tricholoroacetic acid. All analyses were conducted in triplicate. Products were
analyzed by radioflow HPLC with a Phenomenex Gemini C18 (5 µm, 250 × 4.60 mm)
column. A flow rate of 0.8 ml min-1 was used. An isocratic system of 72 % A [1%
acetic acid in water] and 28 % B [1% acetic acid in methanol] was used. As the column
aged, B was decreased to 25 %. Radioactive detection was accomplished using a β-
RAM radioflow detector (IN/US Systems, Tampa, FL) with a scintillant flow rate of 2.4
ml min-1 [Monoflow 5, National Diagnostics, Atlanta, GA]. 14C-labeled products were
co-injected with o-HPA, 8-hydroxycoumarin, 7-hydroxycoumarin, and 3-
hydroxycoumarin standards detected by absorbance at 270 nm. Initially, 4-
hydroxycoumarin, 5-hydroxycoumarin, and 6-hydroxycoumarin were also evaluated as
potential products based on retention times.
Coumarin 3,4-epoxidation was quantified by trapping the epoxide as a GSH
conjugate. The method used is analogous to that used previously to quantify
naphthalene epoxidation (231). Reactions were carried out as above with the addition
135
of 1 to 5 mM GSH and 2.5 to 20 units GST (from equine liver, Sigma:Aldrich). Using
14C-coumarin, conditions were determined under which the 3,4-epoxide was trapped by
the addition of GSH (1.5 mM) and glutathione-S-transferase (GST) (5 units), as
determined by the decrease in detection of o-HPA and no further increase in the GSH
conjugate peak with increasing amounts of GST. With CYP2A13 Asn297Ala, 87% of
the 3,4-epoxide was trapped, while with CYP2A13 o-HPA was no longer detectable
when GSH and GST were added to the reaction mix. To determine the kinetic
parameters of coumarin 7-hydroxylation and 3,4-epoxidation, reconstituted CYP2A13
(7.5 pmol) or CYP2A13 Asn297Ala (2-5 pmol) enzyme was incubated in the presence
of GST and GSH with 1 to 500 µM coumarin under the conditions described above.
Metabolites were analyzed by HPLC with UV detection at 310mn (λmax for coumarin).
By comparing absorbance at 310 nm to radioactivity in reactions carried out with 14C-
coumarin, the ratio of the absorbance of 7-hydroxycoumarin relative to the coumarin
GSH conjugate was determined to be 1.2. A standard curve of peak area versus 7-
hydroxycoumarin was used to determine metabolite concentrations. HPLC conditions
were those described above.
6.3.6 LC/MS/MS analysis of coumarin metabolites
Products of coumarin metabolism were collected from the HPLC system described
above and concentrated under N2. Reaction products and hydroxycoumarin standards
were analyzed using a Finnigan TSQ Quantum Ultra AM triple quadrupole mass
spectrometer operated with electrospray ionization (ESI) (Thermo Electron, San Jose,
136
CA). Sample (4-8µL) was loaded onto a Zorbax SB-C18 (5 µm, 0.5 x 150 mm) column
with a flow rate of 10µL min-1 of 70% A [1% acetic acid in water] and 30% B [1%
acetic acid in methanol] using a Waters nanoAcquity UPLC solvent delivery module
(Waters, Milford, MA). The hydroxycoumarins were analyzed by ESI-MS-MS with
selection for the protonated molecular ion at m/z 163. The ESI source was set in
positive ion mode, voltage 3.3 kV; capillary tube, 250 °C. The Ar collision gas pressure
was 1.0 mTorr, collison energy, 20-25 V; scan time, 0.5 sec.; peak width of Q1 and Q3,
0.7. A full scan was performed for detection of a coumarin GSH conjugate with m/z
452 [M + H]+ and product spectra were also generated. Additionally, the coumarin
GSH conjugate was analyzed in negative ESI mode and the full product scan of the
parent ion m/z 450 [M – H]- was evaluated. The ESI source parameters were voltage
3.5 kV; capillary tube, 250 °C. The Ar collision gas pressure was 1.0 mTorr, collison
energy, 30 V; scan time, 0.55 sec.; peak width of Q1 and Q3, 0.7.
6.3.7 Statistics
Kinetic parameters, Km and Vmax for coumarin 7-hydroxylation, coumarin 3-
hydroxylation, coumarin 3,4-epoxidation were determined using the EZ-fit 5 kinetics
software from Perrella Scientific (Amherst, NH). Statistical differences between mean
Km or Vmax values were determined using a Chi square test.
137
6.3.8 Computer Modeling and Docking
Coordinates from the X-ray crystal structure for CYP2A13 (PDB 2P85) (Smith,
2007), were obtained from the Protein Data Bank (http://www.rcsb.org) and used to
model CYP2A13 and CYP2A13 Asn297Ala in MAESTRO (version 3.5, Schrodinger,
LLC, New York, NY). Coumarin was generated and minimized in MAESTRO prior to
docking. Docking studies were conducted using the program GLIDE within
MAESTRO to view the top twenty-five possible binding orientations (out of 10,000
dockings) for the substrates within active sites of CYP2A13 and CYP2A13 Asn297Ala.
Substrates were allowed to dock flexibly within the active sites.
6.4 Results
6.4.1 CYP2A13 Asn297Ala expression
CYP2A13 and the single-residue mutant enzyme CYP2A13 Asn297Ala were
expressed and purified. Protein expression levels were not hindered by the introduction
of the Ala297 site-mutation as confirmed by Western blotting. Proper incorporation of
heme was verified with CO-difference spectra and P450 content was quantified.
138
6.4.2 14C-coumarin metabolism
The relative metabolism of 14C-coumarin by wild type CYP2A13 and the
Asn297Ala mutant were analyzed by radioflow HPLC (Figure 6-4). The major
metabolites generated by the wild type enzyme were o-HPA, a product of coumarin 3,4-
epoxidation and 7-hydroxycoumarin (Figure 6-4A). These two metabolites were
present in approximately equal amounts. In contrast, o-HPA was a 3-fold more
abundant metabolite of CYP2A13 Asn297Ala-catalyzed coumarin metabolism than was
7-hydroxycoumarin (Figure 6-4C). In addition, other radioactive products, eluting prior
to 10 min and at 48 min, accounted for a significant percentage of the radioactivity.
The later eluting metabolite co-eluted with 3-hydroxycoumarin. Its identity as 3-
hydroxycoumarin was confirmed by LS/MS/MS analysis of the collected peak. None
of the early eluting peaks co-eluted with available standards, including o-
hydroxyphenyl acetic acid, 6,7-dihydroxycoumarin and all hydroxycoumarin
metabolites. We hypothesized these peaks may be secondary metabolites of the
coumarin 3,4-epoxide or products of the conjugation of the 3,4-epoxide with a
nucleophile or nucleophiles present in the enzyme reaction mixture. A minor product of
both CYP2A13- and CYP2A13 Asn297Ala- catalyzed metabolism co-eluted with 8-
hydroxycoumarin.
139
6.4.3 Trapping coumarin 3,4-epoxide as its GSH conjugate
To confirm that the early eluting metabolite(s) are product(s) of coumarin 3,4
epoxidation, and to more accurately quantify the 3,4-epoxidation of coumarin a method
was developed which trapped coumarin 3,4-epoxide as its GSH conjugate. Conditions
were established under which 87% or greater of the o-HPA formed was no longer
detected as a product (Figure 6-4B, 6-4D). Efficient trapping of coumarin 3,4-epoxide
required GSH concentrations of at least 1 mM and excess GST, as the reaction was
sensitive to the amount of GST available.
Under these conditions, not only did little o-HPA remain but in addition the
majority of the radioactivity eluting prior to 12 min was no longer detected. In the
presence of GSH and GST the size of the early eluting radioactive peak was the same
with either wild type or mutant enzyme. The addition of GSH and GST to the enzyme
reactions resulted in the appearance of a new metabolite peak eluting 2 min later than 7-
hydroxycoumarin. This peak was presumed to be a GSH conjugate of coumarin 3,4-
epoxide (Figure 6-3). The ratio of this peak to 7-hydroxycoumarin was 1.3:1 for
CYP2A13 and 9:1 for CYP2A13 Asn297Ala (Figure 6-4B and 6-4D). These values are
significantly greater than the ratio of o-HPA to 7-hydroxycoumarin obtained in the
absence of GSH and GST (Figure 6-4A and 6-4C); consistent with our hypothesis that
quantifying o-HPA alone did not accurately reflect the extent of coumarin 3,4-
epoxidation.
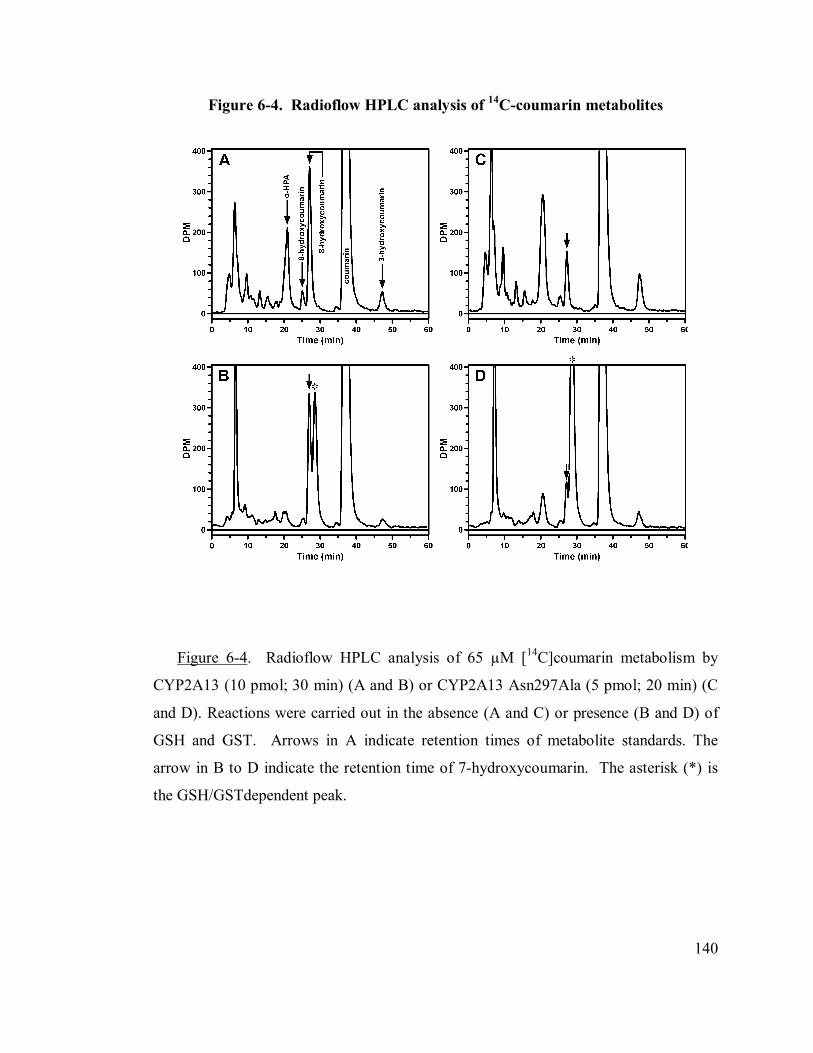
140
Figure 6-4. Radioflow HPLC analysis of 14C-coumarin metabolites
Figure 6-4. Radioflow HPLC analysis of 65 µM [14C]coumarin metabolism by
CYP2A13 (10 pmol; 30 min) (A and B) or CYP2A13 Asn297Ala (5 pmol; 20 min) (C
and D). Reactions were carried out in the absence (A and C) or presence (B and D) of
GSH and GST. Arrows in A indicate retention times of metabolite standards. The
arrow in B to D indicate the retention time of 7-hydroxycoumarin. The asterisk (*) is
the GSH/GSTdependent peak.
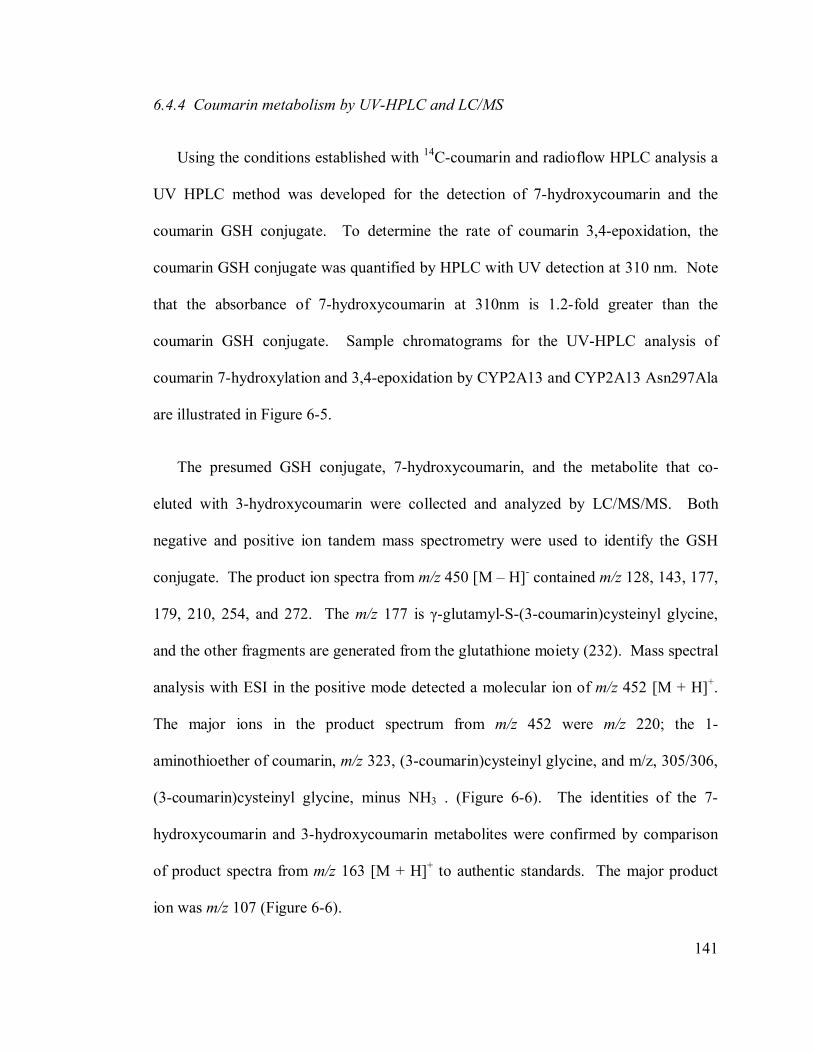
141
6.4.4 Coumarin metabolism by UV-HPLC and LC/MS
Using the conditions established with 14C-coumarin and radioflow HPLC analysis a
UV HPLC method was developed for the detection of 7-hydroxycoumarin and the
coumarin GSH conjugate. To determine the rate of coumarin 3,4-epoxidation, the
coumarin GSH conjugate was quantified by HPLC with UV detection at 310 nm. Note
that the absorbance of 7-hydroxycoumarin at 310nm is 1.2-fold greater than the
coumarin GSH conjugate. Sample chromatograms for the UV-HPLC analysis of
coumarin 7-hydroxylation and 3,4-epoxidation by CYP2A13 and CYP2A13 Asn297Ala
are illustrated in Figure 6-5.
The presumed GSH conjugate, 7-hydroxycoumarin, and the metabolite that co-
eluted with 3-hydroxycoumarin were collected and analyzed by LC/MS/MS. Both
negative and positive ion tandem mass spectrometry were used to identify the GSH
conjugate. The product ion spectra from m/z 450 [M – H]- contained m/z 128, 143, 177,
179, 210, 254, and 272. The m/z 177 is γ-glutamyl-S-(3-coumarin)cysteinyl glycine,
and the other fragments are generated from the glutathione moiety (232). Mass spectral
analysis with ESI in the positive mode detected a molecular ion of m/z 452 [M + H]+.
The major ions in the product spectrum from m/z 452 were m/z 220; the 1-
aminothioether of coumarin, m/z 323, (3-coumarin)cysteinyl glycine, and m/z, 305/306,
(3-coumarin)cysteinyl glycine, minus NH3 . (Figure 6-6). The identities of the 7-
hydroxycoumarin and 3-hydroxycoumarin metabolites were confirmed by comparison
of product spectra from m/z 163 [M + H]+ to authentic standards. The major product
ion was m/z 107 (Figure 6-6).
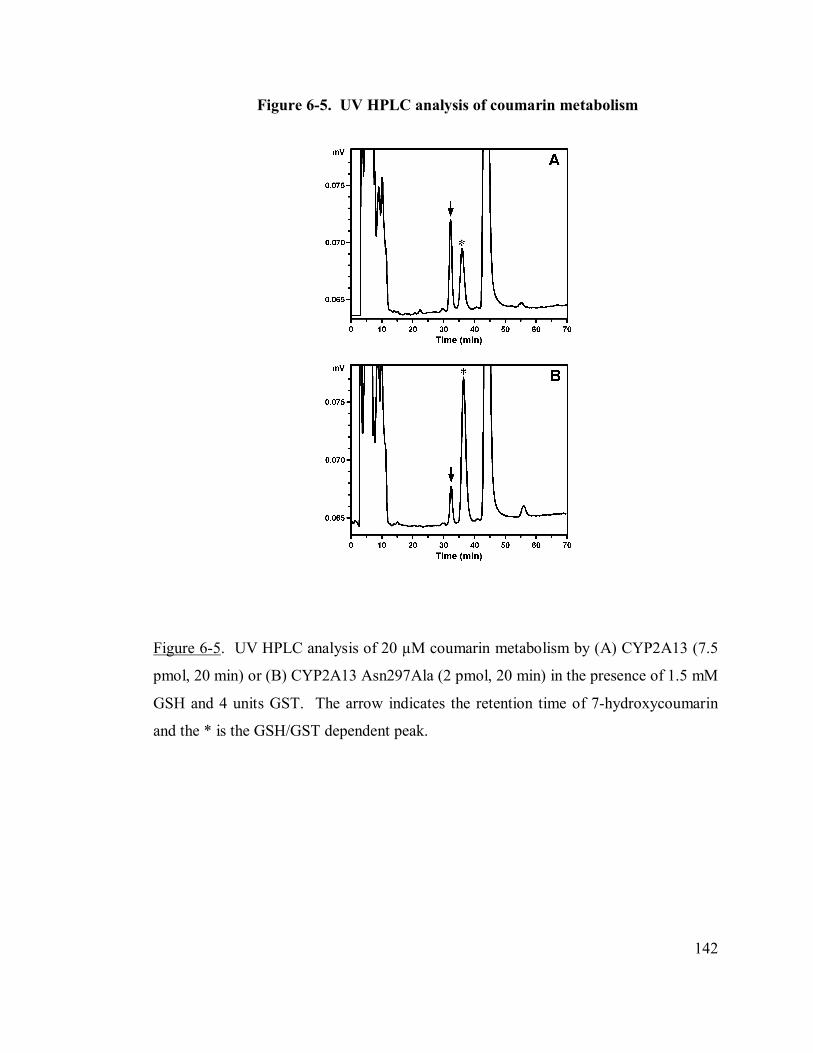
142
Figure 6-5. UV HPLC analysis of coumarin metabolism
Figure 6-5. UV HPLC analysis of 20 µM coumarin metabolism by (A) CYP2A13 (7.5
pmol, 20 min) or (B) CYP2A13 Asn297Ala (2 pmol, 20 min) in the presence of 1.5 mM
GSH and 4 units GST. The arrow indicates the retention time of 7-hydroxycoumarin
and the * is the GSH/GST dependent peak.
143
Figure 6-6. ESI-MS-MS positive ion product spectra
Figure 6-6. ESI-MS-MS positive ion spectra of (A) the collected coumarin-
GSH conjugate [M + H]+, m/z 452 and (B) the late-eluting coumarin metabolite,
3-hydroxycoumarin m/z 163. Spectra are identical to authentic standards.
144
6.4.5 Kinetic parameters for Asn297A and wild-type P450 2A13
The kinetic parameters of coumarin 7-hydroxylation, 3,4-epoxidation and 3-
hydroxycoumarin were determined for CYP2A13 Asn297Ala and CYP2A13 (Table 6-
1). Kinetic parameters were determined in the presence of GSH and GST to better
quantify 3,4-epoxidation. The Km values for these reactions were approximately 4-fold
greater for the mutant enzyme. However, the vmax values increased 3-fold for coumarin
7-hydroxylation, 19-fold for 3-hydroxylation and 40-fold for 3-4 epoxidation. The
catalytic efficiency of coumarin 3,4-epoxidation increased 10-fold while coumarin 7-
hydroxylation decreased by 25%. Interestingly, 3-hydroxycoumarin was still detected
in the presence of GSH and GST, which would be expected if coumarin 3-
hydroxylation occurs independently from the 3,4-epoxication pathway. The catalytic
efficiency of coumarin 3-hydroxylation was 6-fold greater for the mutant enzyme.
Coumarin 7-hydroxylation by wild-type CYP2A13 accounted for about 35% of
coumarin metabolism by the 3 pathways, but only 9% of that by the mutant enzyme.
Coumarin 8-hydroxylation was catalyzed by wild type and the mutant enzyme, but
accounted for less than 3 % of the total coumarin metabolism.
6.4.6 Modeling coumarin orientation in the active site
To further investigate the role of Asn297 on substrate orientation, coumarin, (S)-
NNN, and NNK were computationally docked into the active site of CYP2A13 and
CYP2A13 Asn297Ala. Docking studies generally complemented the enzyme kinetic
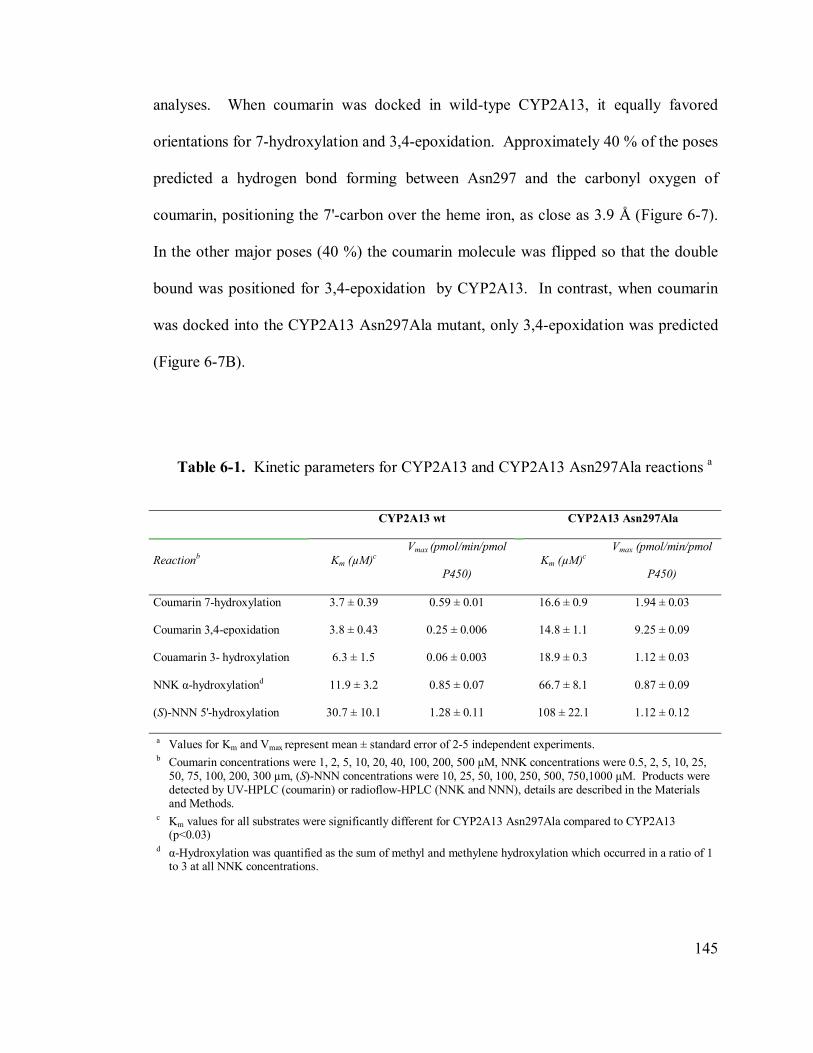
145
analyses. When coumarin was docked in wild-type CYP2A13, it equally favored
orientations for 7-hydroxylation and 3,4-epoxidation. Approximately 40 % of the poses
predicted a hydrogen bond forming between Asn297 and the carbonyl oxygen of
coumarin, positioning the 7'-carbon over the heme iron, as close as 3.9 Å (Figure 6-7).
In the other major poses (40 %) the coumarin molecule was flipped so that the double
bound was positioned for 3,4-epoxidation by CYP2A13. In contrast, when coumarin
was docked into the CYP2A13 Asn297Ala mutant, only 3,4-epoxidation was predicted
(Figure 6-7B).
Table 6-1. Kinetic parameters for CYP2A13 and CYP2A13 Asn297Ala reactions a
CYP2A13 wt CYP2A13 Asn297Ala
Reactionb Km (µM)c Vmax (pmol/min/pmol
P450) Km (µM)c
Vmax (pmol/min/pmol
P450)
Coumarin 7-hydroxylation 3.7 ± 0.39 0.59 ± 0.01 16.6 ± 0.9 1.94 ± 0.03
Coumarin 3,4-epoxidation 3.8 ± 0.43 0.25 ± 0.006 14.8 ± 1.1 9.25 ± 0.09
Couamarin 3- hydroxylation 6.3 ± 1.5 0.06 ± 0.003 18.9 ± 0.3 1.12 ± 0.03
NNK α-hydroxylationd 11.9 ± 3.2 0.85 ± 0.07 66.7 ± 8.1 0.87 ± 0.09
(S)-NNN 5'-hydroxylation 30.7 ± 10.1 1.28 ± 0.11 108 ± 22.1 1.12 ± 0.12
a Values for Km and Vmax represent mean ± standard error of 2-5 independent experiments. b Coumarin concentrations were 1, 2, 5, 10, 20, 40, 100, 200, 500 µM, NNK concentrations were 0.5, 2, 5, 10, 25,
50, 75, 100, 200, 300 µm, (S)-NNN concentrations were 10, 25, 50, 100, 250, 500, 750,1000 µM. Products were detected by UV-HPLC (coumarin) or radioflow-HPLC (NNK and NNN), details are described in the Materials and Methods.
c Km values for all substrates were significantly different for CYP2A13 Asn297Ala compared to CYP2A13 (p<0.03)
d α-Hydroxylation was quantified as the sum of methyl and methylene hydroxylation which occurred in a ratio of 1 to 3 at all NNK concentrations.
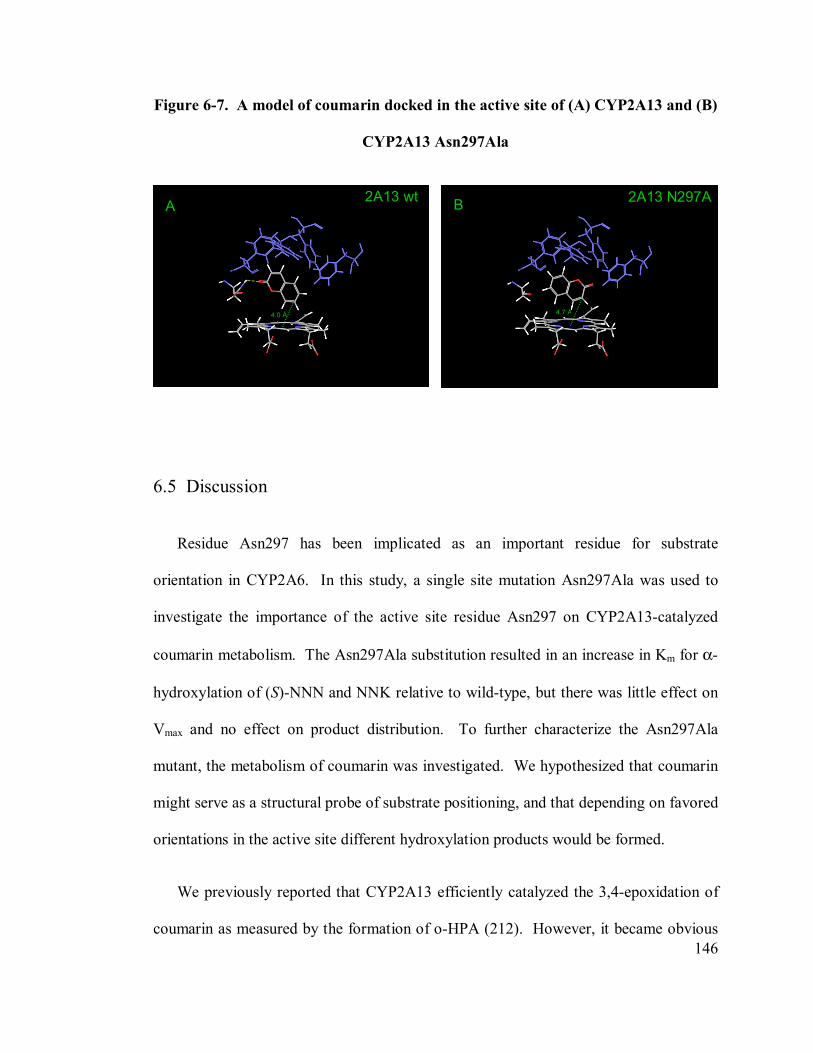
146
Figure 6-7. A model of coumarin docked in the active site of (A) CYP2A13 and (B)
CYP2A13 Asn297Ala
6.5 Discussion
Residue Asn297 has been implicated as an important residue for substrate
orientation in CYP2A6. In this study, a single site mutation Asn297Ala was used to
investigate the importance of the active site residue Asn297 on CYP2A13-catalyzed
coumarin metabolism. The Asn297Ala substitution resulted in an increase in Km for α-
hydroxylation of (S)-NNN and NNK relative to wild-type, but there was little effect on
Vmax and no effect on product distribution. To further characterize the Asn297Ala
mutant, the metabolism of coumarin was investigated. We hypothesized that coumarin
might serve as a structural probe of substrate positioning, and that depending on favored
orientations in the active site different hydroxylation products would be formed.
We previously reported that CYP2A13 efficiently catalyzed the 3,4-epoxidation of
coumarin as measured by the formation of o-HPA (212). However, it became obvious
*
4.0 Å
2A13 wt A 2A13 N297A
4.7 Å
*
B
147
in carrying out the studies reported here that o-HPA formation did not accurately reflect
the rate of coumarin 3,4-epoxidation. Therefore, to quantitively measure coumarin 3,4
epoxidation, GSH and GST were included in the reaction and the rate of coumarin GSH
conjugate formation was determined. Using this methodology, the ratio of coumarin 7-
hydroxylation to 3,4-epoxidation by wild-type CYP2A13 was 1.0 to 1.3 compared to a
ratio of 1.0 to 0.7 we reported previously (212).
The Asn297Ala mutation had a striking impact on coumarin metabolism,
significantly altering the product distribution. The CYP2A13 Asn297Ala mutant
catalyzed coumarin 3,4-epoxidation with 10-fold greater efficiency than wild type
enzyme. This shift to 3,4-epoxidation is consistent with the preferred substrate
orientation predicted by docking coumarin in the active site of the Asn297Ala model.
With wild type CYP2A13 coumarin may form a hydrogen bond with the carbonyl
oxygen positioning the molecule for 7-hydroxylation. However, a second orientation
stabilized by a cluster of phenylalanines in the active site positions coumarin for 3,4-
epoxidation. In the mutant enzyme this orientation predominates thereby favoring the
3,4-epoxidation of coumarin.
In contrast to the increase in total coumarin metabolism that was observed with
CYP2A13 Asn297Ala compared to CYP2A13, both NNN and NNK metabolism by
CYP2A13 Asn297Ala were significantly decreased. The catalytic efficiency of (S)-
NNN α-hydroxylation decreased 4-fold, due to an increase in the Km. While the
hydrogen bond to Asn 297 was not critical to NNN metabolism by CYP2A13, it does
appear to improve enzyme affinity for NNN. The impact of the Asn297Ala mutation on
148
NNK α-hydroxylation was greater. Catalytic efficiency was decreased 6-fold relative to
wild-type CYP2A13. Also, changing the 297 residue from an Asn to Ala in a model of
CYP2A13 caused NNK to dock in poses that are unfavorable for α-methyl and α-
methylene hydroxylation.
In CYP2A6, mutation of residue Asn297 has been shown to influence substrate
binding and metabolism. As observed in CYP2A13, mutation of Asn297 in CYP2A6
resulted in altered coumarin 7-hydroxylation. An Asn297Ser mutant was determined to
have ~ 4-fold decreased catalytic efficiency for coumarin 7-hydroxylation (Kim et al.,
2005). This mutation also decreased binding affinity for coumarin by nearly 30-fold.
The rate of coumarin 3,4-epoxidation was not measured in this study, however, given
the dramatically decreased binding affinity of coumarin it is unlikely the Asn297Ser
CYP2A6 mutant catalyzed this reaction. Two additional mutants, Asn297His and
Asn297Gln have also been shown to have decreased catalytic efficiency for coumarin 7-
hydroxylation compared to wild type CYP2A6 (233). Recently, the crystal structure for
the CYP2A6 Asn297Gln mutant was reported (234). Although the glutamine
substitution had little effect on the overall size of the active site, it did cause altered
protein folding interactions between the B′-C helix region and helix I. In addition, no
hydrogen bond interactions were able to form between Gln297 and substrates like
coumarin.
The ability of Asn297 to hydrogen bond with substrates has been demonstrated in
both CYP2A6 and CYP2A13 crystal structures. This interaction was shown to orientate
149
indole in the active site of CYP2A13 and to position coumarin for 7-hydroxylation in
CYP2A6.
6.6 Conclusions
The importance of Asn297 for CYP2A13 substrate orientation and catalysis was
confirmed by the present study. The polar amino acid residue Asp297 in the active site
contributes to substrate orientation through a hydrogen bonding interaction. An
Asn297Ala mutation substantially altered coumarin metabolism. In particular, a shift
from 7-hydroxylation to 3,4-epoxidation was observed and this would be consistent
with disruption of a hydrogen bond between the carbonyl oxygen of coumarin and
Asn297. Product distribution was not altered for NNK or NNN, but the Asn297Ala
mutant had decreased product formation. The Asn297Ala had a greater effect on NNK
than NNN metabolism, and Asn 297 likely contributes to orientation of NNK in a
position that is favorable for α-hydroxylation.
6.7 Acknowledgements
We thank Jessica van Lengerich for her assistance in carrying out the coumarin 3,4-
epoxidation assays, Linda von Weymarn for providing LC/MS/MS expertise, and Yuk
Sham for his guidance with P450 docking experiments, carried out in the Minnesota
Supercomputing Institute. Mass spectrometry was carried out in the Analytical
150
Biochemistry core supported in part by grant CA-77598 from the National Cancer
Institute.
6.8 Publication of thesis work
The work discussed in Chapter 6 was pubished in Drug Metabolism and
Disposition: Schlicht KE *, Zinggeler-Berg J *, Murphy SE. Effect of CYP2A13 Active
Site Mutation Asn297Ala on Metabolism of Coumarin and Tobacco-specific
Nitrosamines. Drug Metab Dispos, 2008; 37:665-671. *Contributed equally to this
work.
151
CHAPTER 7
Glucuronide conjugation of NNK
metabolites
7.1 Introduction
Carcinogenesis by the tobacco specific nitrosamine, 4-(methylnitrosamino)-1-(3-
pyridyl)-1-butanone (NNK) occurs as a result of metabolic activation by cytochrome
P450-catalyzed α-hydroxylation (34;235). UDP-glucuronsyltransferases (UGTs)
partially mitigate carcinogenesis by facilitating the detoxification of NNK metabolites
(200). NNK undergoes carbonyl reduction to NNAL and two glucuronide conjugates
are formed, an O-linked and an N-linked glucuronide (236;237). Also, a glucuronide of
the unstable hydroxylation metabolite, α-hydroxymethyl NNK, was previously detected
in hepatocyte incubations and in urine of phenobarbital-treated rats (200). In rats, the
formation of α-hydroxymethyl NNK glucuronide correlated with a decrease in
hemoglobin adducts (200). The glucuronidation of unstable product(s) of P450-
catalyzed NNK hydroxylation represents an intriguing functional relationship between
P450s and UGTs in xenobiotic metabolism wherein a reactive species with DNA-
adducting potential is captured by glucuronidation. The conjugation of unstable α-
152
hydroxymethyl or α-hydroxymethylene NNK metabolites by UGTs may represent an
uncharacterized detoxification pathway in humans.
The goals of this preliminary study were to investigate the formation of α-
hydroxymethyl NNK glucuronide in vitro by primary human hepatocytes; by co-
incubation with P450 2A13 and human liver microsomes; and by mixed or co-expressed
P450 2A13 and the UGTs 1A9, 2B7, and 2B17.
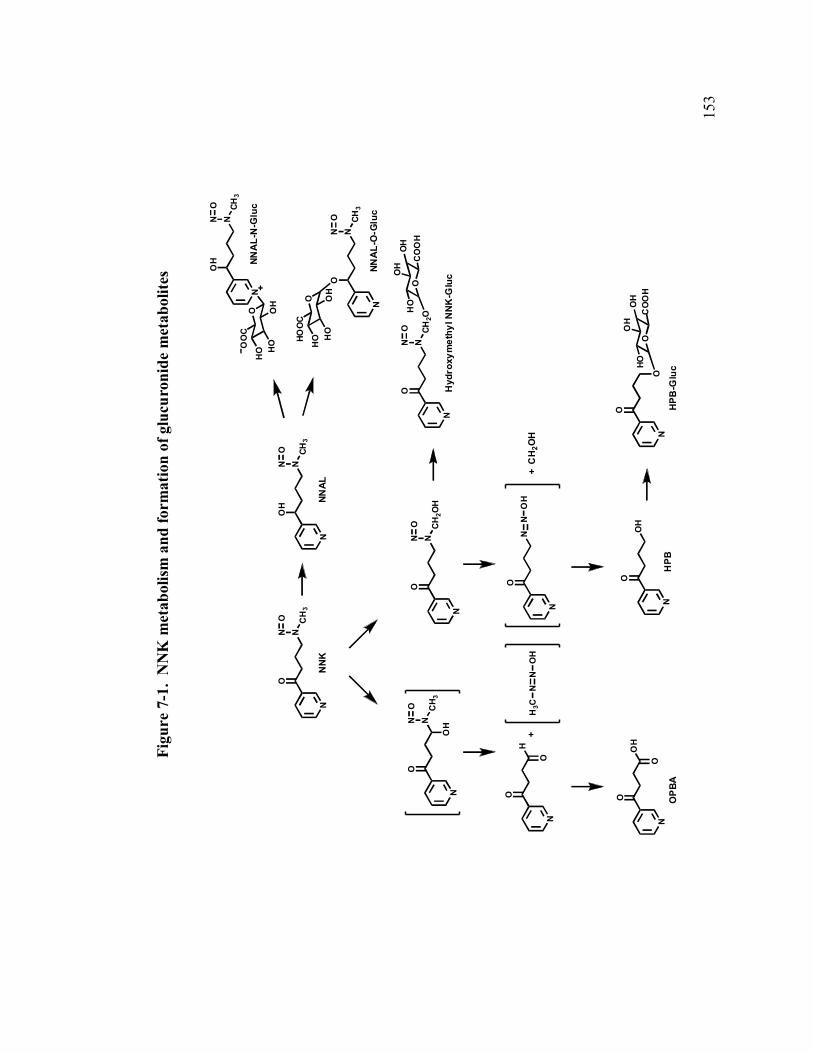
153
Figu
re 7
-1.
NN
K m
etab
olis
m a
nd fo
rmat
ion
of g
lucu
roni
de m
etab
olite
s
N
NC
H3
ON
O
NN
K
N
NC
H3
ON
O
OH
N
NC
H2O
H
ON
O
N
OH
OH
3CN
N
N
ON
N
OO
H
HPB
CH
2OH
+
N
OO
H
O
OP
BA
N
NCH
3
NO
OH
N
NCH
3
NO
OH
N
NCH
3
NO
O
N
NCH
2O
NO
OC
OO
HO
HO
HH
OO
OH
O HO
OH
HOO
C
OH
O HO
OH
OO
C
N
O
OO
CO
OH
OH
OH
HO
+
NNAL
NNA
L-N
-Glu
c
NNA
L-O
-Glu
c
Hyd
roxy
met
hylN
NK
-Glu
c
HPB
-Glu
c
OH
NO
H
154
7.2 Methods
7.2.1 Metabolism by primary human hepatocytes
Primary human hepatocytes (Cellzdirect) in 12-well plates with matrigel overlay
were incubated with 2 µM coumarin or 1-10 µM 3H-NNK, 3H-nicotine, or 3H-NNAL
in Williams E media supplemented with insulin, transferrin, selenium, +/-
dexamethasone. Coumarin metabolites in the media at 0.5, 1, 2, 6, and 12 hours were
analyzed by fluorescence HPLC and compared to authentic standards (212). 3H-NNK,
3H-nicotine, and 3H-NNAL metabolites in the media at 6, 12, and 24 hours were
analyzed by radioflow HPLC with co-injection of available authentic standards (200).
β-glucuronidase treatment was used to evaluate the presence of glucuronide
metabolites.
7.2.2 Enzyme sources
Human liver microsomes were previously prepared from human liver tissue
provided by Dr. F. P. Guengerich, Vanderbilt University (163). E.Coli-expressed,
purified P450 2A13 and E.Coli-expressed rat P450 oxidoreductase were prepared as
described (206). UGT2B17 supersomes were purchased from BD biosciences. Cell
lysate from UGT1A4 and UGT2B7 was from expressed in HEK293 cells. All enzymes
were stored in aliquots at -80 ۫۫ C until use.
155
7.2.3 Co-expression of CYP2A13 and UGT2B7
P450 2A13 was transferred from the pCW vector to pBUDCE4.1 (Invitrogen,
Carlsbad, CA) between the EcoI and NotI multiple cloning sites and placed under
control of the EF-1 promoter. HEK293 cells expressing UGT2B7 were transfected with
CYP2A13pBUD using calcium phosphate precipitation (219). UGT2B7 and P450
2A13 were under continuous selection using G418 and zeocin, respectively. Enzyme
activity was evaluated in whole cells and cell lysate use with coumarin, 7-
hydroxycoumarin, and p-nitrophenol (163;212).
7.2.4 Incubations with 3H-NNK, 3H-NNAL, and 3H-HPB
Incubations were performed with 2-100 µM coumarin, 50-500 µM 3H-NNK, 100
µM 3H-NNAL, and 100 µM 3H-HPB and UDPGA (0.1 – 2.5 mM). For incubations
with purified P450 2A13, a reconstitution including P450 2A13 (40 pmol), 1:4
P450:oxidoreductase, and 0.2µg/pmol DLPC was prepared on ice and incubated for 30
minute prior to addition of UGT enzyme (0.5-2 mg/ml final concentration) which was
then incubated for an additional 15 minutes. The reaction mix was prepared in 50 mM
Tris buffer, pH 7.4, 5 mM MgCl2, +/- 0.1mg/ml alamethicin, and reactions were
initiated at 37 ˚C with NADPH generating system and/or UDPGA. Incubations time
was 80 minutes. Products were analyzed by fluorescence HPLC (coumarin) or by
radioflow HPLC (200;212). The presence of glucuronide conjugates was tested by
treatment with β-glucuronidase followed by HPLC analysis.
156
7.2.5 LC/MS analysis of glucuronide metabolites
NNK metabolites were analyzed by LC/MS using electrospray ionization (ESI) with
positive ion detection using a Thermo Finnigan TSQ Discovery (200). Metabolites (1-8
µl) were separated on a Phenomenex Luna capillary flow system using a gradient with
10 mM ammonium acetate buffer, pH 6.7 and acetonitrile. Metabolites of NNK
metabolism, authentic standards, and metabolite standards previously collected from rat
urine or rat hepatocytes were analyzed. The monitored m/z range was 150 – 420 amu,
and metabolites standards were detected, [MH+ + 1]: HPB-glucuronide, 342; NNAL-
O-glucuronide, 386; α-hydroxymethyl NNK glucuronide, 400.
7.3 Results
7.3.1 Coumarin metabolism by primary human hepatocytes
Primary human hepatocytes incubated with 2 µM coumarin formed 7-
hydroxycoumarin and 7-hydroxycoumarin glucuronide, and the glucuronide conjugate
was the major metabolite that accumulated in media (Figure 7-2). Coumarin
metabolites, 7-hyroxycoumarin and 7-hydroxycoumarin glucuronide were detected
directly using fluorescence HPLC. The 7-hydroxycoumarin glucuronide was quantified
as free and total 7-hydroxycoumarin following treatment with β-glucuronidase. The
peak concentration of 7-hydroxycoumarin was 60 minutes while the glucuronide
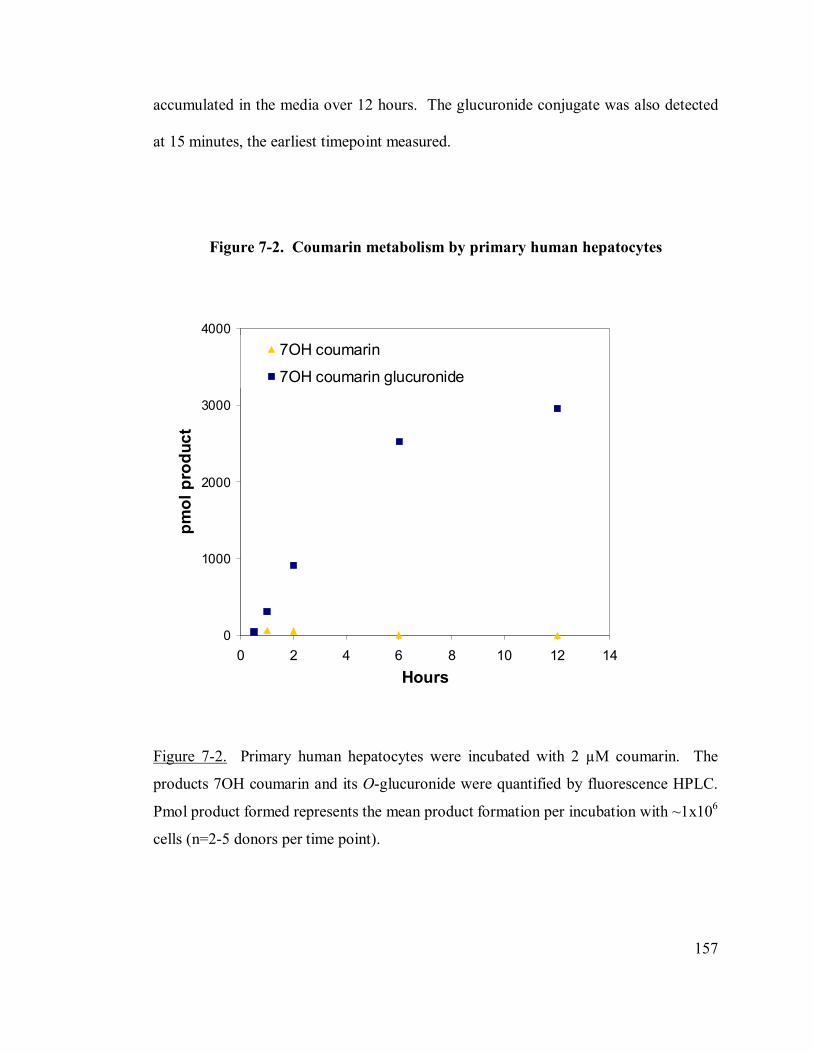
157
accumulated in the media over 12 hours. The glucuronide conjugate was also detected
at 15 minutes, the earliest timepoint measured.
Figure 7-2. Coumarin metabolism by primary human hepatocytes
Figure 7-2. Primary human hepatocytes were incubated with 2 µM coumarin. The
products 7OH coumarin and its O-glucuronide were quantified by fluorescence HPLC.
Pmol product formed represents the mean product formation per incubation with ~1x10⁶
cells (n=2-5 donors per time point).
0
1000
2000
3000
4000
0 2 4 6 8 10 12 14Hours
pmol
pro
duct
7OH coumarin
7OH coumarin glucuronide
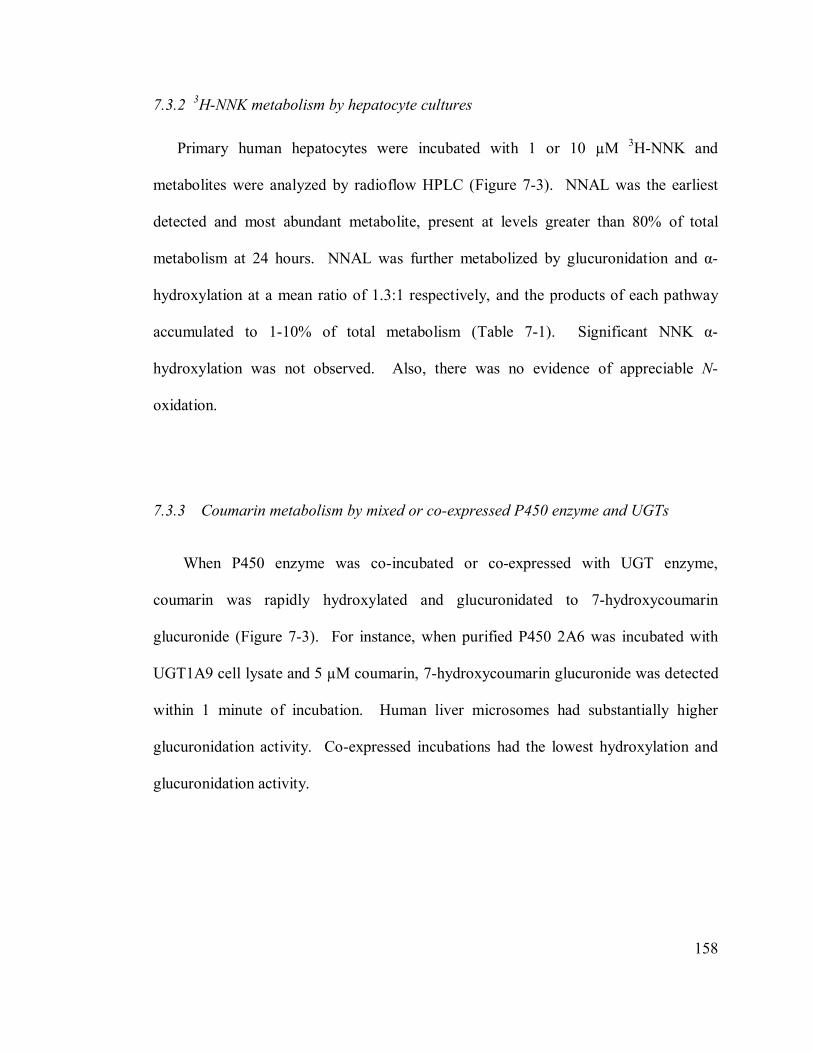
158
7.3.2 3H-NNK metabolism by hepatocyte cultures
Primary human hepatocytes were incubated with 1 or 10 µM 3H-NNK and
metabolites were analyzed by radioflow HPLC (Figure 7-3). NNAL was the earliest
detected and most abundant metabolite, present at levels greater than 80% of total
metabolism at 24 hours. NNAL was further metabolized by glucuronidation and α-
hydroxylation at a mean ratio of 1.3:1 respectively, and the products of each pathway
accumulated to 1-10% of total metabolism (Table 7-1). Significant NNK α-
hydroxylation was not observed. Also, there was no evidence of appreciable N-
oxidation.
7.3.3 Coumarin metabolism by mixed or co-expressed P450 enzyme and UGTs
When P450 enzyme was co-incubated or co-expressed with UGT enzyme,
coumarin was rapidly hydroxylated and glucuronidated to 7-hydroxycoumarin
glucuronide (Figure 7-3). For instance, when purified P450 2A6 was incubated with
UGT1A9 cell lysate and 5 µM coumarin, 7-hydroxycoumarin glucuronide was detected
within 1 minute of incubation. Human liver microsomes had substantially higher
glucuronidation activity. Co-expressed incubations had the lowest hydroxylation and
glucuronidation activity.
159
Figure 7-3. 3H-NNK metabolism by primary hepatocytes
Min.
10 20 30 40 50 60 70 800
200
400
600
800
1000
dpm
NNAL
NN
K
HPB
A
+ ß-glucuronidase
10 20 30 40 50 60 70 800
200
400
600
800
1000
dpm
NN
ALN
NK
NN
AL-O
-glu
curo
nide
s
HPB
A
NN
AL-N
-glu
curo
nide
Min.
dpm
NN
ALN
NK
NN
AL-O
-glu
curo
nide
s
HPB
A
NN
AL-N
-glu
curo
nide
*
dpm
NN
ALN
NKH
PBA
+ ß-glucuronidase
HPB
A
10 20 30 40 50 60 70 800
200
400
600
800
1000
10 20 30 40 50 60 70 800
200
400
600
800
1000
A B
Figure 7-3. Human hepatocytes were incubated with 1 or 10 µM 3H-NNK and media
was removed at 6, 12, and 24 hours for analysis by radioflow HPLC. Represenative
HPLC analyses of media at 24 hours, 1µM 3H-NNK, are presented. * Unidentified
peaks that disappear with β-glucuronidase treatment.
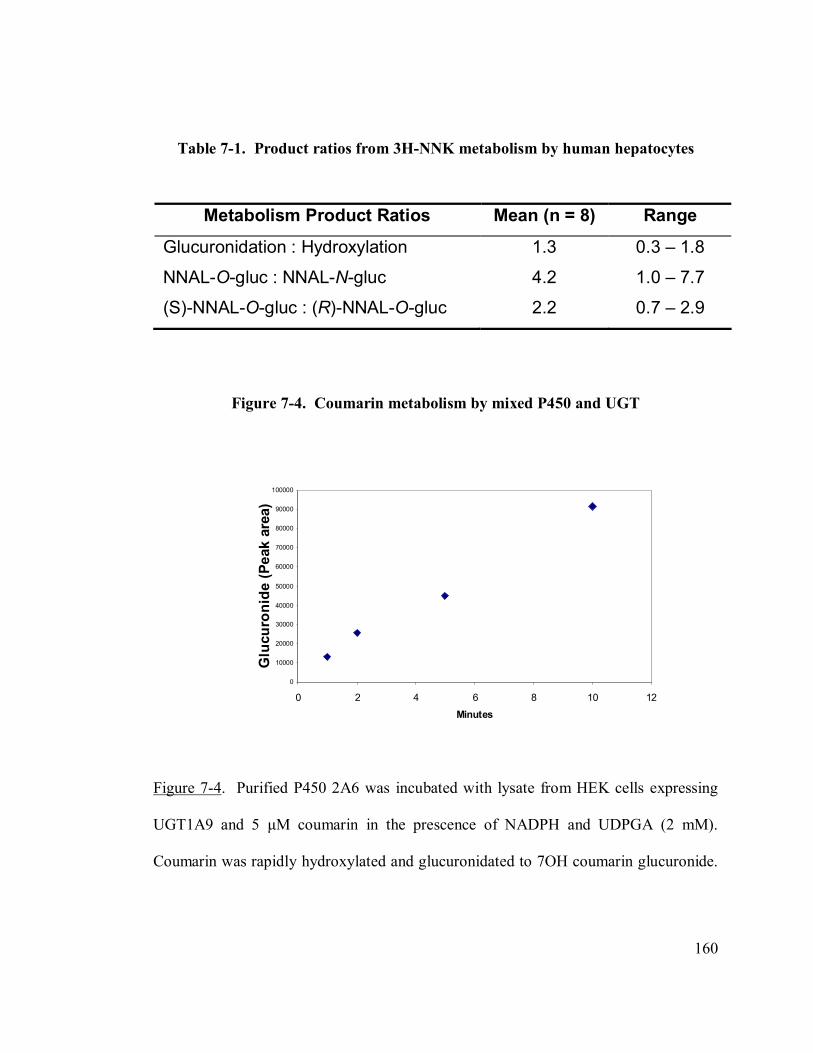
160
Table 7-1. Product ratios from 3H-NNK metabolism by human hepatocytes
Figure 7-4. Coumarin metabolism by mixed P450 and UGT
Figure 7-4. Purified P450 2A6 was incubated with lysate from HEK cells expressing
UGT1A9 and 5 µM coumarin in the prescence of NADPH and UDPGA (2 mM).
Coumarin was rapidly hydroxylated and glucuronidated to 7OH coumarin glucuronide.
0
10000
20000
30000
40000
50000
60000
70000
80000
90000
100000
0 2 4 6 8 10 12
Minutes
Glu
curo
nide
(Pea
k ar
ea)
Metabolism Product Ratios Mean (n = 8) Range
Glucuronidation : Hydroxylation 1.3 0.3 – 1.8
NNAL-O-gluc : NNAL-N-gluc 4.2 1.0 – 7.7
(S)-NNAL-O-gluc : (R)-NNAL-O-gluc 2.2 0.7 – 2.9
161
The glucuronide product was detected directly by fluorescence HPLC (λex= 320, λem=
375).
7.3.4 Nitrosamine metabolism by mixed P450 2A13 and UGT2B7 or HLMs
Glucuronide metabolites were detected following co-incubation of P450s and UGTs
with 3H-NNAL, 3H-HPB, or 3H-NNK. In the absence of NADPH generating system,
but with UDPGA, 3H-NNAL O-glucuronide and 3H-HPB glucuronide were observed;
no glucuronide metabolite of 3H-NNK was detected. β-glucuronidase treatment
released the starting substrate. In the presence of NADPH generating system and no
UDPGA cosubstrate, α-hydroxylation products of 3H-NNAL and 3H-NNK were
detected in the usual amount and distribution. However, in the presence of NADPH and
UDPGA a new product peak is formed when P450 2A13 is co-incubated with UGT2B7,
UGT1A9, or human liver microsomes (Figure 7-5). In addition, another product peak
co-elutes with OPBA. β-glucuronidase treatment results in a decrease but not
disappearance of the peak that eluted at 41 minutes. An increase in 3H-HPB is observed
when the reaction mix from an incubation with 3H-NNK is treated with β-glucuronidase
(Figure 7-6). The formation of NNAL O-glucuronide and HPB O-glucuronide has been
confirmed by analysis of the reaction mix by LC/MS. No α-hyroxymethyl NNK
glucuronide was detected in one reaction mix that was analyzed by LC/MS. Collected
product has not been analyzed by LC/MS.
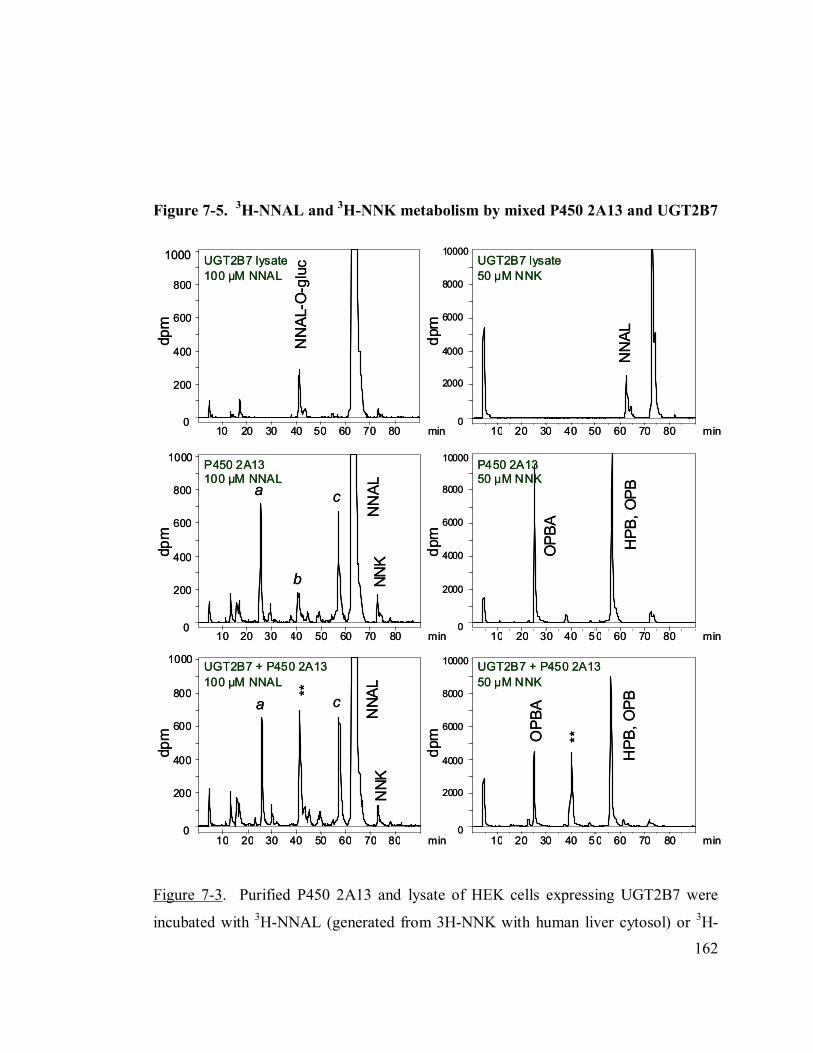
162
Figure 7-5. 3H-NNAL and 3H-NNK metabolism by mixed P450 2A13 and UGT2B7
Figure 7-3. Purified P450 2A13 and lysate of HEK cells expressing UGT2B7 were
incubated with 3H-NNAL (generated from 3H-NNK with human liver cytosol) or 3H-
10 20 30 40 50 60 70 80 min0
200
400
600
800
10 20 30 40 50 60 70 80 min0
200
400
600
800
1000
10 20 30 40 50 60 70 80 min0
200
400
600
800
1000
10 20 30 40 50 60 70 80 min0
2000
4000
6000
8000
10000
10 20 30 40 5 0 60 70 80 min0
2000
4000
6000
8000
10000
10 20 30 40 5 0 60 70 80 min0
2000
4000
6000
8000
10000
1000
dpm
dpm
dpm
dpm
dpm
dpm
NN
AL-O
-glu
c
NN
ALH
PB, O
PB
OPB
A
HPB
, OPB
NN
ALa
NNA
L
OPB
A
**
**
b
c
NNK
a c
NNK
UGT2B7 lysate50 µM NNK
UGT2B7 lysate100 µM NNAL
P450 2A13 100 µM NNAL
UGT2B7 + P450 2A13 100 µM NNAL
UGT2B7 + P450 2A13 50 µM NNK
P450 2A13 50 µM NNK
10 20 30 40 50 60 70 80 min0
200
400
600
800
10 20 30 40 50 60 70 80 min0
200
400
600
800
1000
10 20 30 40 50 60 70 80 min0
200
400
600
800
1000
10 20 30 40 50 60 70 80 min0
2000
4000
6000
8000
10000
10 20 30 40 5 0 60 70 80 min0
2000
4000
6000
8000
10000
10 20 30 40 5 0 60 70 80 min0
2000
4000
6000
8000
10000
1000
dpm
dpm
dpm
dpm
dpm
dpm
NN
AL-O
-glu
c
NN
ALH
PB, O
PB
OPB
A
HPB
, OPB
NN
ALa
NNA
L
OPB
A
**
**
b
c
NNK
a c
NNK
UGT2B7 lysate50 µM NNK
UGT2B7 lysate100 µM NNAL
P450 2A13 100 µM NNAL
UGT2B7 + P450 2A13 100 µM NNAL
UGT2B7 + P450 2A13 50 µM NNK
P450 2A13 50 µM NNK
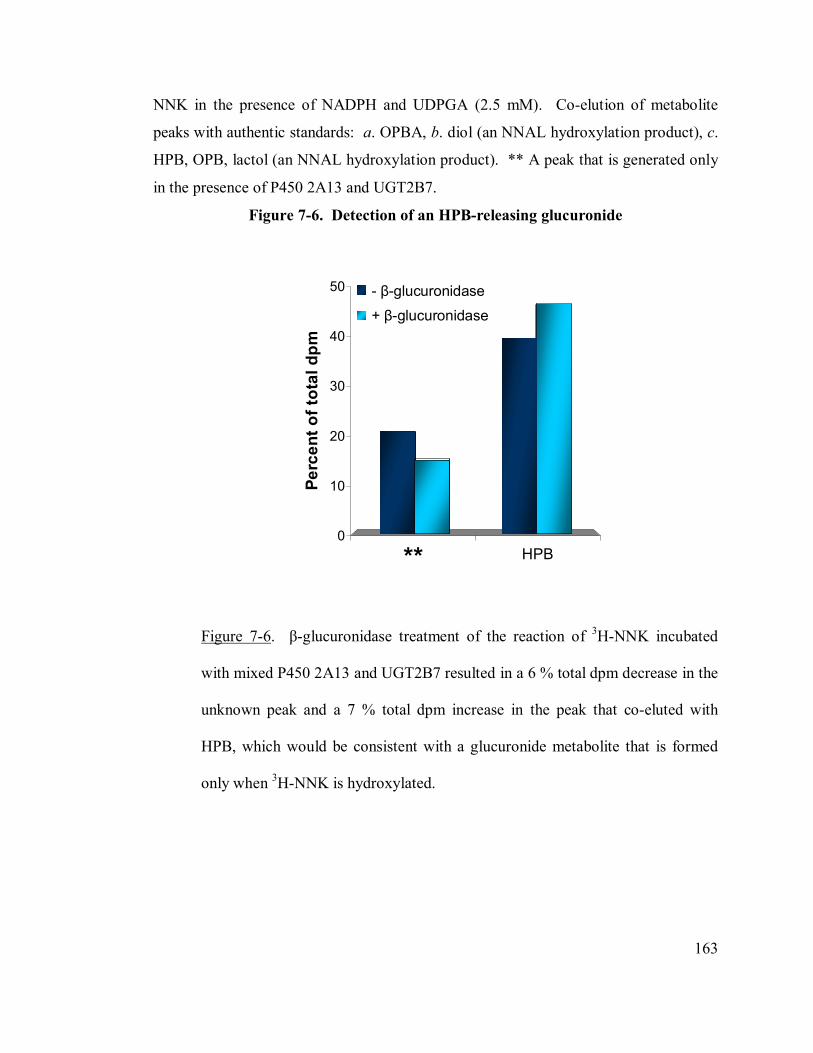
163
NNK in the presence of NADPH and UDPGA (2.5 mM). Co-elution of metabolite
peaks with authentic standards: a. OPBA, b. diol (an NNAL hydroxylation product), c.
HPB, OPB, lactol (an NNAL hydroxylation product). ** A peak that is generated only
in the presence of P450 2A13 and UGT2B7.
Figure 7-6. Detection of an HPB-releasing glucuronide
Figure 7-6. β-glucuronidase treatment of the reaction of 3H-NNK incubated
with mixed P450 2A13 and UGT2B7 resulted in a 6 % total dpm decrease in the
unknown peak and a 7 % total dpm increase in the peak that co-eluted with
HPB, which would be consistent with a glucuronide metabolite that is formed
only when 3H-NNK is hydroxylated.
** HPB0
10
20
30
40
50
Perc
ent o
f tot
al d
pm- β-glucuronidase
+ β-glucuronidase
**
164
7.4 Discussion
Primary human hepatocytes formed both N- and O-linked glucuronides of the NNK
metabolite, NNAL. This is constent with data from incubations with human liver
microsomes and the detection of both glucuronides in the urine of smokers. We
predicted the distribution of (S)-NNAL glucuronide to (R)-NNAL glucuronide based on
the retention time of metabolites compared to standard. Confirming the identity of
these enantiomers and the distribution of (S)- and (R-) NNAL formed from NNK
carbonyl reduction would be interesting as (S)-NNAL is more carcinogenic in
laboratory animals.
NNAL was the predominant metabolite of NNK. Compared to incubations with rat
primary hepatocytes, we observed less total α-hydroxylation and glucuronidation. It is
unclear how experimental conditions directly or indirectly (e.g. dexamethasone,)
influenced the metabolism of NNK. The viability of the hepatocyte cultures was varied,
though a few cultures had > 80 % viability at 24 hours. Differences in expression of
carbonyl reductases and transporters may have contributed to the observed difference
between rat and human hepatocytes. In regards to α-hydroxylation, the P450s in human
liver that can catalyze NNK and NNAL α-hydroxylation are quite inefficient. However,
in human smokers who received deuterated NNK, α-hydroxylation products account for
more than 80 % of total metabolites excreted in urine. The relative contribution of
165
hepatic and extrahepatic (e.g. P450 2A13-catalyzed) enzymes to in vivo NNK
metabolism is unknown.
Co-incubation of P450s and UGTs is a useful system to evaluate two-step
metabolism by P450s and UGTs. We observed rapid hydroxylation and
glucuronidation of coumarin even at low substrate concentration (5 µM). Starting from
NNK, we were able to detect HPB-glucuronide in reactions where P450 2A13 was co-
incubated with UGT2B7, UGT1A9, or human liver microsomes. This experimental
approach will be used to generate the unstable subtrate, α-hydroxymethyl NNK, with
the potential for rapid glucuronidation by UGTs present in the reaction mix.
Unfortunately, the activity of co-expressed P450 and UGT in HEK cells is low. Finel et
al. reported 100-fold lower product formation by HEK-expressed UGTs compared to
HLMs. Therefore, a comparison of inividual UGTs as potential catalysts of α-
hydroxymethyl NNK glucuronide formation will be challenging and will require highly
sensitive product detection.
7.5 Conclusion
A possible detoxification product of NNK in humans is α-hydroxymethyl NNK
glucuronide, but this has not been demonstrated. Since the half-life of α-hydroxymethyl
NNK is in the order of seconds it is a difficult to study the metabolism of this substrate.
Primary human hepatocyte cultures are not a good in vitro system to study the potential
metabolism of NNK to α-hydroxymethyl NNK glucuronide as little NNK α-
166
hydroxylation was observed. Co-incubation of P4502A13 and HLMs represents a
promising approach to study in vitro glucuronide conjugation of α-hydroxymethyl NNK
by human liver microsomes.
7.6 Acknowledgements
Many thanks to Dr. Stephen Hecht for kindly sharing cultures of primary human
hepatocytes and NNK metabolites standards. Thanks also to the Blazer lab for allowing
me to use their incubators for the primary human hepatocyte experiments.
167
CHAPTER 8
Concluding remarks
The goals of this thesis were to better understand the role of specific enzymes in
nicotine and NNK metabolism, to consider metabolic flux through more than one
enzymatic pathway, and to improve the scientific basis of using selected tobacco
biomarkers. Towards these goals, the major findings achieved were:
(1) In P450 2A13, the most efficient human catalyst of NNK hydroxylation, we
demonstrated that Asn297 influences the orientation of substrates that can form a
hydrogen bond wth Asn297 in the active site, including NNK and coumarin. Mutation
of Asn297 to Ala resulted in altered substrate binding, and in the case of coumarin, a
shift in product distribution. In designing a P450 2A13 inhibitor, it may be useful to
take advantage of this potential hydrogen bonding residue to facilitate orientation of the
inhibitor in a desirable position.
(2) We identified that UGT2B10 contributes to in vivo nicotine metabolism, since
individuals who were heterozygous for UGT2B10 Asp67Tyr, an allele previously
168
shown to decrease in vitro glucuronidation, had decreased excretion of nicotine and
cotinine as their glucuronide conjugates in urine. Furthermore, the ratio of cotinine
glucuronide to cotinine was a useful biomarker of glucuronidation phenotype. We
established that this ratio should be adjusted for nicotine equivalents. Surprisingly, we
observed that individuals who had the UGT2B10 Asp67Tyr allele had lower nicotine
equivalents, which is an indication that this gene influences nicotine intake analogous to
variation in CYP2A6, which catalyzes C-oxidation.
(3) In two studies of nicotine metabolism, focusing on the effect of ethnicity or
UGT2B10 genotype, we found that nicotine equivalents is a superior biomarker of
tobacco exposure than cotinine, as it is less sensitive to variation in individual metabolic
pathways. Nicotine equivalents are also a reasonable biomarker from a cost and time
standpoint, as advancements in LC/MS permit rapid and high throughput quantification.
As a biomarker, nicotine equivalents could provide a useful estimate of typical daily
tobacco exposure, which is critical for many cancer epidemiology and etiology studies.
Variation in the metabolism of nicotine may influence smoking and consequently
exposure to the tobacco carcinogen NNK (Figure 8-1). Risk of lung cancer is likely
affected not only by cummulative NNK exposure but also by the relative contribution of
activation and detoxification to total metabolism. An important gap is whether or not
an α-hydroxyNNK-linked glucuronide is formed in humans as it is in rats. Overall, the
majority of smokers will not develop lung cancer, but it would be useful to identify
smokers that are at high risk so that more intensive smoking cessation interventions,
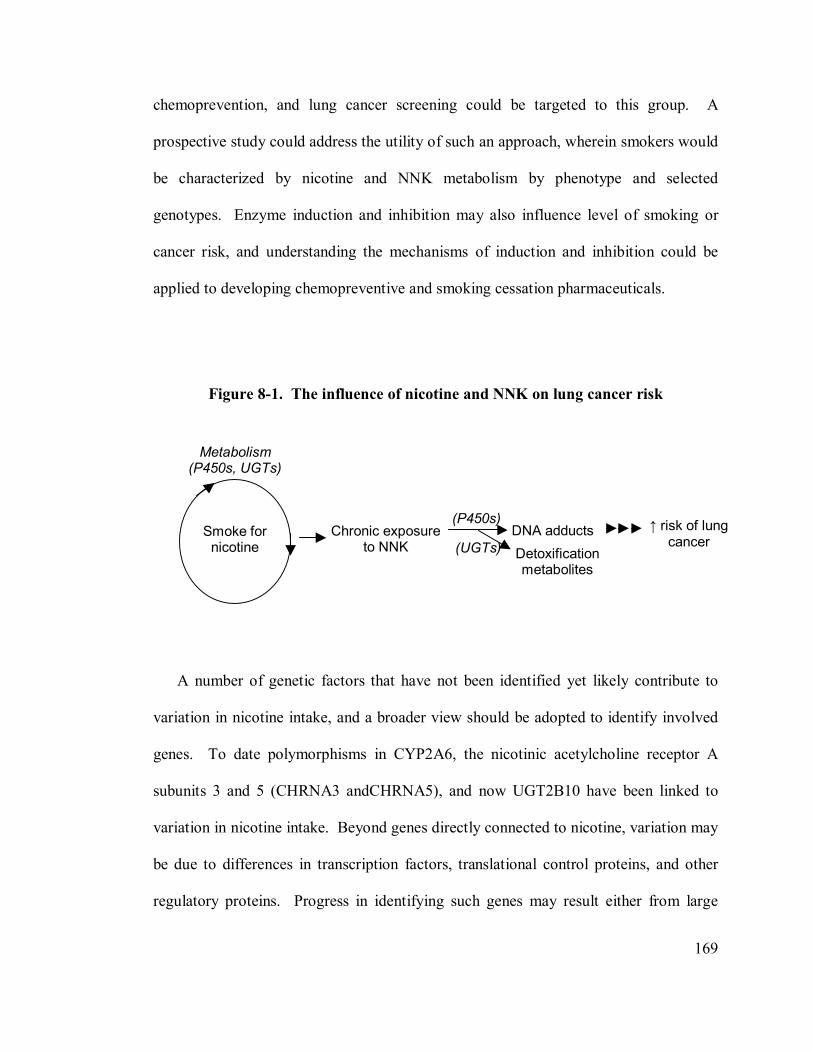
169
chemoprevention, and lung cancer screening could be targeted to this group. A
prospective study could address the utility of such an approach, wherein smokers would
be characterized by nicotine and NNK metabolism by phenotype and selected
genotypes. Enzyme induction and inhibition may also influence level of smoking or
cancer risk, and understanding the mechanisms of induction and inhibition could be
applied to developing chemopreventive and smoking cessation pharmaceuticals.
Figure 8-1. The influence of nicotine and NNK on lung cancer risk
A number of genetic factors that have not been identified yet likely contribute to
variation in nicotine intake, and a broader view should be adopted to identify involved
genes. To date polymorphisms in CYP2A6, the nicotinic acetylcholine receptor A
subunits 3 and 5 (CHRNA3 andCHRNA5), and now UGT2B10 have been linked to
variation in nicotine intake. Beyond genes directly connected to nicotine, variation may
be due to differences in transcription factors, translational control proteins, and other
regulatory proteins. Progress in identifying such genes may result either from large
Chronic exposure to NNK
(P450s) DNA adducts ↑ risk of lung
cancer Smoke for
nicotine Detoxification metabolites
(UGTs)
Metabolism (P450s, UGTs)
170
genome surveys of smokers or initially from a basic science approach (e.g. in vitro
systems like hepatocyte cultures, or animal models).
In the past, an important application of quantifying nicotine and NNK metabolites
was to demonstrate exposure in smokers and secondhand exposure in nonsmokers to
promote anti-smoking public health policies. In the future, knowledge of nicotine and
NNK metabolism could be increasingly employed to design other effective smoking
cessation and chemoprevention strategies.
171
References
(1) [Anon]. WHO report on the global tobacco epidemic, 2008: The MPOWER package. Population and Development Review 2008; 34(3):581.
(2) CDC. The health consequences of smoking: a report of the Surgeon General. 2004. Atlanta, US Department of Health and Human Services.
(3) Centers for Disease Control. The Health Benefits of Smoking Cessation. 1990.
Atlanta, GA, US Department of Health and Human Services.
(4) Miller M. NCI monograph links secondhand smoke to cancer and other diseases. J Natl Cancer Inst 2000; 92(1):14.
(5) International Agency for Research on Cancer. Tobacco Smoke and Involuntary Smoking. IARC Monographs on the Evaluation of Carcinogenic Risks to Humans. Lyon, FR: IARC, 2004: 1179-1187.
(6) McCay J, Ericksen M. The Tobacco Atlas. Geneva: World Health Organization, 2002.
(7) Centers for Disease Control. Behavioral Risk Factor Surveillance System (BRFSS): Prevalence of tobacco use. 2008. US Department of Health and Human Services.
(8) [Anon]. Cigarette use among high school students - United Sstates, 1991-2007 (Reprinted from MMWR, vol 57, pg 686-688, 2008). Jama-Journal of the American Medical Association 2008; 300(11):1292-1293.
(9) Messer K, Trinidad DR, Al Delaimy WK, Pierce JP. Smoking cessation rates in the United States: A comparison of young adult and older smokers. Am J Public Health 2008; 98(2):317-322.
172
(10) Centers for Disease Control. Cigarette smoking among adults--United States, 2002. MMWR Morb Mortal Wkly Rep 2004; 53(20):427-431.
(11) Centers for Disease Control. 1994 Surgeon General's Report—Preventing Tobacco Use Among Young People. Atlanta: US Department of Health and Human Services, 1994.
(12) Steinberg MB, Schmelzer AC, Richardson DL, Foulds J. The case for treating tobacco dependence as a chronic disease. Ann Intern Med 2008; 148(7):554-556.
(13) International Agency for Research on Cancer. IARC Monographs on the Evaluation of the Carcinogenic Risk of Chemicals to Humans: Tobacco Smoke and involuntary smoking. Lyon: World health Organization, 2002.
(14) Hecht SS. Tobacco carcinogens, their biomarkers, and tobacco-induced cancer. Nature Rev Cancer 2003; 3:733-744.
(15) Jemal A, Thun MJ, Ries LAG, Howe HL, Weir HK, Center MM et al. Annual Report to the Nation on the Status of Cancer, 1975-2005, Featuring Trends in Lung Cancer, Tobacco Use, and Tobacco Control. Journal of the National Cancer Institute 2008; 100(23):1672-1694.
(16) Thun MJ, Henley SJ, Calle EE. Tobacco use and cancer: an epidemiologic perspective for geneticists. Oncogene 2002; 21(48):7307-7325.
(17) Crispo A, Brennan P, Jockel KH, Schaffrath-Rosario A, Wichmann HE, Nyberg F et al. The cumulative risk of lung cancer among current, ex- and never-smokers in European men. Br J Cancer 2004; 91(7):1280-1286.
(18) Gallup AM, Newport F. U.S. smoking habits have come a long way. The Gallup Poll: public opinion 2004. Rowman & Littlefield, 2006, 2004: 417.
(19) Hoffman D, Hoffman I. Chemistry and Toxicology. Cigars: Health Effects and Trends. NCI Tobacco Control Monograph 9. National Cancer Institute, 1998: 55-104.
(20) Department of Health and Human Service US. The health consequences of smoking: nicotine addiction. Washington, DC: Government Printing Office, 1988.
(21) Picciotto MR. Common aspects of the action of nicotine and other drugs of abuse. Drug Alcohol Depend 1998; 51(1-2):165-172.
(22) Henningfield JE, Miyasato K, Jasinski DR. Cigarette Smokers Self-Administer Intravenous Nicotine. Pharmacology Biochemistry and Behavior 1983; 19(5):887-890.
173
(23) Ashton H, Stepney R, Thompson JW. Self-Titration by Cigarette Smokers. British Medical Journal 1979; 2(6186):357-360.
(24) Djordjevic MV, Hoffmann D, Hoffmann I. Nicotine regulates smoking patterns. Prev Med 1997; 26(4):435-440.
(25) Benowitz NL, Dains KM, Hall SM, Stewart S, Wilson M, Dempsey D et al. Progressive Commercial Cigarette Yield Reduction: Biochemical Exposure and Behavioral Assessment. Cancer Epidemiol Biomarkers Prev 2009; 18(3):876-883.
(26) Fiore MC, Bailey MC, Cohen SJ. Treating Tobacco Use and Depedence. Clinical Practice Guideline. Rockville, MD: U.S. Department of Health and Human Services, Public Health Service, 2003.
(27) Benowitz NL. Clinical pharmacology of inhaled drugs of abuse: implications in understanding nicotine dependence. Research findings on smoking of abused substances. [99], 12-29. 1990. Washington, DC, Superintendent of Documents. NIDA Research Monograph. Chiang, C. N. and Hawke, R. L.
(28) Laviolette SR, van der KD. The neurobiology of nicotine addiction: bridging the gap from molecules to behaviour. Nat Rev Neurosci 2004; 5(1):55-65.
(29) Benowitz NL. Nicotine pharmacology and addiction. In: Benowitz NL, editor. Nicotine Safety and Toxicity. New york: Oxford University Press, 1998: 3-16.
(30) Benowitz NL. The human pharmacology of nicotine. Research Advances in Alcohol Drug Problems 1986; 9:1-52.
(31) Gervot L, Rochat B, Gautier JC, Bohnenstengel F, Kroemer H, de B, V et al. Human CYP2B6: expression, inducibility and catalytic activities. Pharmacogenetics 1999; 9(3):295-306.
(32) Benowitz NL, Jacob P, III, Fong I, Gupta S. Nicotine metabolic profile in man: comparison of cigarette smoking and transdermal nicotine. J Pharmacol Exp Ther 1994; 268:296-303.
(33) Benowitz NL, Perez-Stable EJ, Herrera B, Jacob P, III. Slower metabolism and reduced intake of nicotine from cigarette smoking in Chinese-Americans. J Natl Cancer Inst 2002; 94(2):108-115.
(34) Jalas JR, Hecht SS, Murphy SE. Cytochrome P450 enzymes as catalysts of metabolism of 4-(methylnitrosamino)-1-(3-pyridyl)-1-butanone (NNK), a tobacco-specific carcinogen. Chem Res Toxicol 2005; 18:95-110.
174
(35) Hecht SS. Biochemistry, biology, and carcinogenicity of tobacco-specific N-nitrosamines. Chem Res Toxicol 1998; 11:559-603.
(36) Anderson KE, Kliris J, Murphy L, Carmella SG, Han S, Link C et al. Metabolites of a tobacco-specific lung carcinogen in nonsmoking casino patrons. Cancer Epidemiol Biomarkers Prev 2003; 12(12):1544-1546.
(37) Stepanov I, Hecht SS, Lindgren B, Jacob P, III, Wilson M, Benowitz NL. Relationship of human toenail nicotine, cotinine, and 4-(methylnitrosamino)-1-(3-pyridyl)-1-butanol to levels of these biomarkers in plasma and urine. Cancer Epidemiol Biomarkers Prev 2007; 16(7):1382-1386.
(38) Hecht SS, Carmella SG, Le KA, Murphy SE, Boettcher AJ, Le C et al. 4-(methylnitrosamino)-1-(3-pyridyl)-1-butanol and its glucuronides in the urine of infants exposed to environmental tobacco smoke. Cancer Epidemiol Biomarkers Prev 2006; 15(5):988-992.
(39) Hecht SS, Carmella SG, Chen M, Koch JFD, Miller AT, Murphy SE et al. Quantitation of urinary metabolites of a tobacco-specific lung carcinogen after smoking cessation. Cancer Res 1999; 59:590-596.
(40) Schloebe DHDREaTAR. Determination of tobacco specific nitrosamin hemoglobin and lung DNA adducts. Proc Am Assoc Cancer Res 2002; 43:346.
(41) Wagenknecht LE, Cutter GR, Haley NJ, Sidney S, Manolio TA, Hughes GH et al. Racial differences in serum cotinine levels among smokers in the Coronary Artery Risk Development in (Young) Adults study. Am J Public Health 1990; 80(9):1053-1056.
(42) Kreslake JM, Wayne GF, Alpert HR, Koh HK, Connolly GN. Tobacco industry control of menthol in cigarettes and targeting of adolescents and young adults. Am J Public Health 2008; 98(9):1685-1692.
(43) Landi MT, Zocchetti C, Bernucci I, Kadlubar FF, Tannenbaum S, Skipper P et al. Cytochrome P4501A2: Enzyme induction and genetic control in determining 4-aminobiphenyl-hemoglobin adduct levels. Cancer Epidemiol Biomarkers Prev 1996; 5(9):693-698.
(44) Khojasteh-Bakht SC, Koenigs LL, Peter RM, Trager WF, Nelson SD. (R)-(+)-Menthofuran is a potent, mechanism-based inactivator of human liver cytochrome P450 2A6. Drug Metab Dispos 1998; 26(7):701-704.
(45) von Weymarn LB, Brown KM, Murphy SE. Inactivation of CYP2A6 and CYP2A13 during nicotine metabolism. J Pharmacol Exp Ther 2006; 316:295-303.
175
(46) Hecht SS. Tobacco smoke carcinogens and lung cancer. J Natl Cancer Inst 1999; 91:1194-1210.
(47) Nebert DW, Russell DW. Clinical importance of the cytochromes P450. Lancet 2002; 360(9340):1155-1162.
(48) Guengerich FP. Common and uncommon cytochrome P450 reactions related to metabolism and chemical toxicity. Chem Res Toxicol 2001; 14(6):611-650.
(49) Lewis DFV, Watson E, Lake BG. Evolution of the cytochrome P450 superfamily: sequence alignments and pharmacogenetics. Mutat Res 1998; 410:245-270.
(50) Bair SR, Mellon SH. Deletion of the mouse P450c17 gene causes early embryonic lethality. Mol Cell Biol 2004; 24(12):5383-5390.
(51) Raunio H, Rautio A, Gullsten H, Pelkonen O. Polymorphisms of CYP2A6 and its practical consequences. Br J Clin Pharmacol 2001; 52(4):357-363.
(52) Nebert DW, Dalton TP. The role of cytochrome P450 enzymes in endogenous signalling pathways and environmental carcinogenesis. Nature Reviews Cancer 2006; 6(12):947-960.
(53) Nelson DR, Zeldin DC, Hoffman SM, Maltais LJ, Wain HM, Nebert DW. Comparison of cytochrome P450 (CYP) genes from the mouse and human genomes, including nomenclature recommendations for genes, pseudogenes and alternative-splice variants. Pharmacogenetics 2004; 14(1):1-18.
(54) Hoffman SM, Nelson DR, Keeney DS. Organization, structure and evolution of the CYP2 gene cluster on human chromosome 19. Pharmacogenetics 2001; 11(8):687-698.
(55) Guengerich FP. Human Cytochrome P450 Enzymes. In: Ortiz de Montellano PR, editor. Cytochrome P450: Structure, Mechanism, and Biochemistry. New York: Kluwer Academic/Plenum Publishers, 2005: 377-530.
(56) Tirona RG, Lee W, Leake BF, Lan LB, Cline CB, Lamba V et al. The orphan nuclear receptor HNF4alpha determines PXR- and CAR-mediated xenobiotic induction of CYP3A4. Nat Med 2003; 9(2):220-224.
(57) Finel M, Li X, Gardner-Stephen D, Bratton S, Mackenzie PI, Radominska-Pandya A. Human UDP-glucuronosyltransferase 1A5: identification, expression, and activity. J Pharmacol Exp Ther 2005; 315(3):1143-1149.
(58) Williams SN, Dunham E., and Bradfield C.A. Induction of cytochrome P450 enzymes. In: De Montellano PO, editor. Cytochrome P450 Structure, Mechanism, and Biochemistry. New York: Kluwer Academic, 2005: 323-346.
176
(59) Galijatovic A, Beaton D, Nguyen N, Chen S, Bonzo J, Johnson R et al. The human CYP1A1 gene is regulated in a developmental and tissue-specific fashion in transgenic mice. J Biol Chem 2004; 279(23):23969-23976.
(60) Evans WE, Relling MV. Pharmacogenomics: Translating functional genomics into rational therapeutics. Science 1999; 286(5439):487-491.
(61) Omura T, Sato R. The carbon monoxide-binding pigment of liver microsomes. I. evidence for its hemoprotein nature. J Biol Chem 1964; 239:2370-2378.
(62) Jefcoate CR. Measurement of substrate and inhibitor binding to microsomal cytochrome P450 by optical-difference spectroscopy. Methods Enzymol 1978; 52:258-279.
(63) Guengerich FP. Mechanisms of cytochrome p450 substrate oxidation: MiniReview. Journal of Biochemical and Molecular Toxicology 2007; 21(4):163-168.
(64) Isin EM, Guengerich FP. Complex reactions catalyzed by cytochrome P450 enzymes. Biochimica et Biophysica Acta-General Subjects 2007; 1770(3):314-329.
(65) Schenkman JB, Remmer H, Estabrook RW. Spectral studies of drug interaction with hepatic microsomal cytochrome. Mol Pharmacol 1967; 3(2):113-123.
(66) Yang ML, Kabulski JL, Wollenberg L, Chen XQ, Subramanian M, Tracy TS et al. Electrocatalytic Drug Metabolism by CYP2C9 Bonded to A Self-Assembled Monolayer-Modified Electrode. Drug Metab Dispos 2009; 37(4):892-899.
(67) Yun CH, Kim KH, Calcutt MW, Guengerich FP. Kinetic analysis of oxidation of coumarins by human cytochrome P450 2A6. J Biol Chem 2005; 280(13):12279-12291.
(68) Isin EM, Guengerich FP. Kinetics and thermodynamics of ligand binding by cytochrome P450 3A4. J Biol Chem 2006; 281(14):9127-9136.
(69) Makris TM, Denisov I, Schlichting I, Sligar SG. Activation of molecular oxygen by cytochrome P450. In: De Montellano PO, editor. Cytochrome P450: Structure, Mechanism, and Biochemistry. New York: Kluwer Academic/Plenum Publishers, 2005: 149-182.
(70) Groves JT. Models and mechanisms of cytochrome P450 action. In: De Montellano PO, editor. Cytochrome P450: Structure, Mechanism, and Biochemistry. New York: Kluwer Academic/Plenum Publishers, 2005: 1-43.
(71) Bock KW. Vertebrate UDP-glucuronosyltransferases: functional and evolutionary aspects. Biochem Pharmacol 2003; 66(5):691-696.
177
(72) Campbell JA, Davies GJ, Bulone V, Henrissat B. A classification of nucleotide-diphospho-sugar glycosyltransferases based on amino acid sequence similarities. Biochem J 1997; 326:929-939.
(73) Mackenzie PI, Walter BK, Burchell B, Guillemette C, Ikushiro S, Iyanagi T et al. Nomenclature update for the mammalian UDP glycosyltransferase (UGT) gene superfamily. Pharmacogenet Genomics 2005; 15(10):677-685.
(74) Coutinho PM, Deleury E, Davies GJ, Henrissat B. An evolving hierarchical family classification for glycosyltransferases. J Mol Biol 2003; 328(2):307-317.
(75) Gong QH, Cho JW, Huang T, Potter C, Gholami N, Basu NK et al. Thirteen UDPglucuronosyltransferase genes are encoded at the human UGT1 gene complex locus. Pharmacogenetics 2001; 11(4):357-368.
(76) Miley MJ, Zielinska AK, Keenan JE, Bratton SM, Radominska-Pandya A, Redinbo MR. Crystal structure of the cofactor-binding domain of the human phase II drug-metabolism enzyme UDP-glucuronosyltransferase 2B7. J Mol Biol 2007; 369(2):498-511.
(77) Luukkanen L, Taskinen J, Kurkela M, Kostiainen R, Hirvonen J, Finel M. Kinetic characterization of the 1A subfamily of recombinant human UDP-glucuronosyltransferases. Drug Metab Dispos 2005; 33(7):1017-1026.
(78) King CD, Rios GR, Green MD, Tephly TR. UDP-glucuronosyltransferases. Curr Drug Metab 2000; 1(2):143-161.
(79) Guillemette C. Pharmacogenomics of human UDP-glucuronosyltransferase enzymes. Pharmacogenomics J 2003; 3(3):136-158.
(80) Guengerich FP. Cytochrome P450S and other enzymes in drug metabolism and toxicity. AAPS J 2006; 8(220905):E101-E111.
(81) Tukey RH, Strassburg CP. Human UDP-glucuronosyltransferases: Metabolism, expression, and disease. Annu Rev Pharmacol Toxicol 2000; 40:581-616.
(82) Kiang TK, Ensom MH, Chang TK. UDP-glucuronosyltransferases and clinical drug-drug interactions. Pharmacol Ther 2005; 106(1):97-132.
(83) Radominska-Pandya A, Czernik PJ, Little JM, Battaglia E, Mackenzie PI. Structural and functional studies of UDP-glucuronosyltransferases. Drug Metab Rev 1999; 31(4):817-899.
(84) Patana AS, Kurkela M, Finel M, Goldman A. Mutation analysis in UGT1A9 suggests a relationship between substrate and catalytic residues in UDP-glucuronosyltransferases. Protein Engineering Design & Selection 2008; 21(9):537-543.
178
(85) Ouzzine M, Magdalou J, Burchell B, Fournel-Gigleux S. An internal signal sequence mediates the targeting and retention of the human UDP-glucuronosyltransferase 1A6 to the endoplasmic reticulum. J Biol Chem 1999; 274(44):31401-31409.
(86) Kurkela M, Morsky S, Hirvonen J, Kostiainen R, Finel M. An active and water-soluble truncation mutant of the human UDP-glucuronosyltransferase 1A9. Mol Pharmacol 2004; 65(4):826-831.
(87) Kaivosaari S, Toivonen P, Hesse LM, Koskinen M, Court MH, Finel M. Nicotine Glucuronidation and the Human UDP-Glucuronosyltransferase UGT2B10. Mol Pharmacol 2007; 72(3):761-768.
(88) Nakajima M, Yokoi T. Interindividual variability in nicotine metabolism: C-oxidation and glucuronidation. Drug Metab Pharmacokinet 2005; 20(4):227-235.
(89) Mitchell SC. Flavin mono-oxygenase (FMO) - The 'other' oxidase. CURRENT DRUG METABOLISM 2008; 9(4):280-284.
(90) Phillips IR, Shephard EA. Flavin-containing monooxygenases: mutations, disease and drug response. Trends Pharmacol Sci 2008; 29(6):294-301.
(91) Ziegler DM. An overview of the mechanism, substrate specificities, and structure of FMOs. Drug Metab Rev 2002; 34(3):503-511.
(92) Cashman JR, Zhang J. Human flavin-containing monooxygenases. Annu Rev Pharmacol Toxicol 2006; 46:65-100.
(93) Jones KC, Ballou DP. Reactions of the 4A-Hydroperoxide of Liver Microsomal Flavin-Containing Monooxygenase with Nucleophilic and Electrophilic Substrates. J Biol Chem 1986; 261(6):2553-2559.
(94) Kim YM, Ziegler DM. Size limits of thiocarbamides accepted as substrates by human flavin-containing monooxygenase 1. Drug Metab Dispos 2000; 28(8):1003-1006.
(95) Cashman JR. Some distinctions between flavin-containing and cytochrome P450 monooxygenases. Biochem Biophys Res Commun 2005; 338(1):599-604.
(96) Krueger SK, Williams DE. Mammalian flavin-containing monooxygenases: structure/function, genetic polymorphisms and role in drug metabolism. Pharmacol Ther 2005; 106(3):357-387.
(97) Kitchell BB, Rauckman EJ, Rosen GM. Effect of Temperature on Mixed-Function Amine Oxidase Intrinsic Fluorescence and Oxidative Activity. Mol Pharmacol 1978; 14(6):1092-1098.
179
(98) Senekeo-Effenberger K, Chen S, Brace-Sinnokrak E, Bonzo JA, Yueh MF, Argikar U et al. Expression of the human UGT1 locus in transgenic mice by 4-chloro-6-(2,3-xylidino)-2-pyrimidinylthioacetic acid (WY-14643) and implications on drug metabolism through peroxisome proliferator-activated receptor alpha activation. Drug Metab Dispos 2007; 35(3):419-427.
(99) Yueh MF, Bonzo JA, Tukey RH. The role of Ah receptor in induction of human UDP-glucuronosyltransferase 1A1. Methods Enzymol 2005; 400:75-91.
(100) Machemer DE, Tukey RH. The role of protein kinase C in regulation of TCDD-mediated CYP1A1 gene expression. Toxicol Sci 2005; 87(1):27-37.
(101) Gardner-Stephen D, Heydel JM, Goyal A, Lu Y, Xie W, Lindblom T et al. Human PXR variants and their differential effects on the regulation of human UDP-glucuronosyltransferase gene expression. Drug Metab Dispos 2004; 32(3):340-347.
(102) Arpiainen S, Raffalli-Mathieu F, Lang MA, Pelkonen O, Hakkola J. Regulation of the Cyp2a5 gene involves an aryl hydrocarbon receptor-dependent pathway. Mol Pharmacol 2005; 67(4):1325-1333.
(103) Kim JH, Sherman ME, Curriero FC, Guengerich FP, Strickland PT, Sutter TR. Expression of cytochromes P450 1A1 and 1B1 in human lung from smokers, non-smokers, and ex-smokers. Toxicol Appl Pharmacol 2004; 199(3):210-219.
(104) Haiman CA, Stram DO, Wilkens LR, Pike MC, Kolonel LN, Henderson BE et al. Ethnic and racial differences in the smoking-related risk of lung cancer. N Engl J Med 2006; 354(4):333-342.
(105) Stellman SD, Chen Y, Muscat JE, Djordjevic MV, Richie JP, Jr., Lazarus P et al. Lung cancer risk in white and black Americans. Ann Epidemiol 2003; 13(4):294-302.
(106) Caraballo RS, Giovino GA, Pechacek TF, Mowery PD, Richter PA, Strauss WJ et al. Racial and ethnic differences in serum cotinine levels of cigarette smokers - Third National Health and Nutrition Examination Survey, 1988-1991. J Am Med Assoc 1998; 280(2):135-139.
(107) Perez-Stable EJ, Herrera B, Jacob P, III, Benowitz NL. Nicotine metabolism and intake in black and white smokers. JAMA 1998; 280(2):152-156.
(108) Kandel DB, Hu MC, Schaffran C, Udry JR, Benowitz NL. Urine nicotine metabolites and smoking behavior in a multiracial/multiethnic national sample of young adults. Am J Epidemiol 2007; 165(8):901-910.
(109) Pirkle JL, Flegal KM, Bernert JT, Brody DJ, Etzel RA, Maurer KR. Exposure of the US population to environmental tobacco smoke: the Third National Health
180
and Nutrition Examination Survey, 1988 to 1991. JAMA 1996; 275(16):1233-1240.
(110) Cashman JR, Park SB, Yang ZC, Wrighton SA, Jacob P, III, Benowitz NL. Metabolism of nicotine by human liver microsomes: stereoselective formation of trans-nicotine N'-oxide. Chem Res Toxicol 1992; 5:639-646.
(111) Byrd GD, Chang KM, Greene JM, deBethizy JD. Evidence for urinary excretion of glucuronide conjugates of nicotine, cotinine, and trans-3'-hydroxycotinine in smokers. Drug Metab Dispos 1992; 20:192-197.
(112) Murphy SE, Link CA, Jensen J, Le C, Puumala S, Hecht SS et al. A comparison of urinary biomarkers of tobacco and carcinogen exposure in smokers. Cancer Epidemiol Biomarkers Prev 2004; 13:1617-1623.
(113) Benowitz NL, Kuyt F, Jacob P, III, Jones RT, Osman AL. Cotinine disposition and effects. Clin Pharmacol Ther 1983; 34:604-611.
(114) Davis RA, Curvall M. Determination of nicotine and its metabolites in biological fluids:in vivo studies. In: Gorrod JW, Jacob P, III, editors. Analytical Determination of Nicotine and Related Compounds and Their Metabolites. Amsterdam: Elsevier Science, 1999: 583-643.
(115) Benowitz NL, Swan GE, Jacob P, III, Lessov-Schlaggar CN, Tyndale RF. CYP2A6 genotype and the metabolism and disposition kinetics of nicotine. Clin Pharmacol Ther 2006; 80(5):457-467.
(116) Siegmund B, Leitner E, Pfannhauser W. Determination of the nicotine content of various edible nightshades (Solanaceae) and their products and estimation of the associated dietary nicotine intake. J Agric Food Chem 1999; 47(8):3113-3120.
(117) Benowitz NL. Cotinine as a biomarker of environmental tobacco smoke exposure. Epidemiol Rev 1996; 18:188-204.
(118) Yamanaka H, Nakajima M, Nishimura K, Yoshida R, Fukami T, Katoh M et al. Metabolic profile of nicotine in subjects whose CYP2A6 gene is deleted. Eur J Pharm Sci 2004; 22(5):419-425.
(119) Meger M, Meger-Kossien I, Schuler-Metz A, Janket D, Scherer G. Simultaneous determination of nicotine and eight nicotine metabolites in urine of smokers using liquid chromatography-tandem mass spectrometry. J Chromatogr B Analyt Technol Biomed Life Sci 2002; 778(1-2):251-261.
(120) Scherer G, Engl J, Urban M, Gilch G, Janket D, Riedel K. Relationship between machine-derived smoke yields and biomarkers in cigarette smokers in Germany. Regul Toxicol Pharmacol 2007; 47(2):171-183.
181
(121) Andersson G, Björnberg G, Curvali M. Oral mucosal changes and nicotine disposition in users of Swedish smokeless tobacco products: a comparative study. J Oral Pathol Med 1994; 23:161-167.
(122) Byrd GD, Robinson JH, Caldwell WS, deBethizy JD. Comparison of Measured and Ftc-Predicted Nicotine Uptake in Smokers. Psychopharmacology 1995; 122(2):95-103.
(123) Murphy SE, Raulinaitis V, Brown KM. Nicotine 5'-oxidation and methyl oxidation by P450 2A enzymes. Drug Metab Dispos 2005; 13:1166-1173.
(124) Murphy PJ. Enzymatic oxidation of nicotine to nicotine delta1'(5') iminium ion. J Biol Chem 1973; 248:2796-2800.
(125) Gorrod JW, Hibberd AR. The metabolism of nicotine-delta 1'(5')-iminium ion, in vivo and in vitro. Eur J Drug Metab Pharmacokinet 1982; 7:293-298.
(126) Kitagawa K, Kunugita N, Katoh T, Yang MH, Kawamoto T. The significance of the homozygous CYP2A6 deletion on nicotine metabolism: A new genotyping method of CYP2A6 using a single PCR-RFLP. Biochem Biophys Res Commun 1999; 262(1):146-151.
(127) Dicke K, Skrlin S, Murphy SE. Nicotine and 4-(methylnitrosamino)-1-(3-pyridyl)-butanone (NNK) metabolism by P450 2B6. Drug Metab Dispos 2005; 33:1760-1764.
(128) Wong HL, Zhang X, Zhang QY, Gu J, Ding X, Hecht SS et al. Metabolic activation of the tobacco carcinogen 4-(methylnitrosamino)-(3-pyridyl)-1-butanone by cytochrome p450 2A13 in human fetal nasal microsomes. Chem Res Toxicol 2005; 18:913-918.
(129) Zhang X, D'Agostino J, Wu H, Zhang QY, von Weymarn L, Murphy SE et al. CYP2A13: variable expression and role in human lung microsomal metabolic activation of the tobacco-specific carcinogen 4-(methylnitrosamino)-1-(3-pyridyl)-1-butanone. J Pharmacol Exp Ther 2007; 323(2):570-578.
(130) Neurath GB, Dunger M, Krenz O, Orth D, Pein FG. Trans-3'-hydroxycotinine - a main metabolite in smokers. Klin Wochenschr 1988; 66:2-4.
(131) Mwenifumbo JC, Sellers EM, Tyndale RF. Nicotine metabolism and CYP2A6 activity in a population of black African descent: impact of gender and light smoking. Drug Alcohol Depend 2007; 89(1):24-33.
(132) Le Marchand L, Derby KS, Murphy SE, Hecht SS, Hatsukami D, Carmella SG et al. Smokers with the CHRNA lung cancer-associated variants are exposed to higher levels of nicotine equivalents and a carcinogenic tobacco-specific nitrosamine. Cancer Res 2008; 68(22):9137-9140.
182
(133) Derby KS, Cuthrell K, Caberto C, Carmella SG, Franke AA, Hecht SS et al. Nicotine metabolism in three ethnic/racial groups with different risks of lung cancer. Cancer Epidemiol Biomarkers & Prev 2008; 17:3526-3535.
(134) Malaiyandi V, Lerman C, Benowitz NL, Jepson C, Patterson F, Tyndale RF. Impact of CYP2A6 genotype on pretreatment smoking behaviour and nicotine levels from and usage of nicotine replacement therapy. Mol Psychiatry 2006; 11(4):400-409.
(135) Benowitz NL, Pomerleau OF, Pomerleau CS, Jacob P, III. Nicotine metabolite ratio as a predictor of cigarette consumption. Nicotine Tob Res 2003; 5(5):621-624.
(136) Malaiyandi V, Sellers EM, Tyndale RF. Implications of CYP2A6 genetic variation for smoking behaviors and nicotine dependence. Clin Pharmacol Ther 2005; 77(3):145-158.
(137) Strasser AA, Malaiyandi V, Hoffmann E, Tyndale RF, Lerman C. An association of CYP2A6 genotype and smoking topography. Nicotine Tob Res 2007; 9(4):511-518.
(138) Mwenifumbo JC, Al Koudsi N, Ho MK, Zhou Q, Hoffmann EB, Sellers EM et al. Novel and established CYP2A6 alleles impair in vivo nicotine metabolism in a population of Black African descent. Hum Mutat 2008; 29(5):679-688.
(139) Benowitz NL, Jacob P, III, Sachs DP. Deficient C-oxidation of nicotine. Clin Pharmacol Ther 1995; 57(5):590-594.
(140) Nakajima M, Yamamoto T, Nunoya K, Yokoi T, Nagashima K, Inoue K et al. Role of human cytochrome P4502A6 in c-oxidation of nicotine. Drug Metab Dispos 1996; 24:1212-1217.
(141) Berkman CE, Park SB, Wrighton SA, Cashman JR. In vitro-in vivo correlations of human (S)-nicotine metabolism. Biochem Pharmacol 1995; 50(4):565-570.
(142) Brown KM, von Weymarn LB, Murphy SE. Identification of N-(hydroxymethyl)-norcotinine as a major product of cytochrome P450 2A6, but not cytochrome P450 2A13-catalyzed cotinine metabolism. Chem Res Toxicol 2005; 18:1792-1798.
(143) Chen G, Blevins-Primeau AS, Dellinger RW, Muscat JE, Lazarus P. Glucuronidation of nicotine and cotinine by UGT2B10: loss of function by the UGT2B10 Codon 67 (Asp>Tyr) polymorphism. Cancer Res 2007; 67(19):9024-9029.
(144) Kuehl GE, Murphy SE. N-Glucuronidation of trans-3'-hydroxycotinine by human liver microsomes. Chem Res Toxicol 2003; 16:1502-1506.
183
(145) Benowitz NL, Perez-Stable EJ, Fong I, Modin G, Herrera B, Jacob P, III. Ethnic differences in N-glucuronidation of nicotine and cotinine. J Pharmacol Exp Ther 1999; 291(3):1196-1203.
(146) Yamano S, Tatsuno J, Gonzalez FJ. The CYP2A3 gene product catalyzes coumarin 7-hydroxylation in human liver microsomes. Biochemistry 1990; 29:1322-1329.
(147) Inoue K, Yamazaki H, Shimada T. CYP2A6 genetic polymorphisms and liver microsomal coumarin and nicotine oxidation activities in Japanese and Caucasians. Arch Toxicol 2000; 73(10-11):532-539.
(148) Hadidi H, Irshaid Y, Vagbo CB, Brunsvik A, Cholerton S, Zahlsen K et al. Variability of coumarin 7- and 3-hydroxylation in a Jordanian population is suggestive of a functional polymorphism in cytochrome P450 CYP2A6. European Journal of Clinical Pharmacoloy 1998; 54:437-441.
(149) Ho MK, Mwenifumbo JC, Zhao B, Gillam EM, Tyndale RF. A novel CYP2A6 allele, CYP2A6*23, impairs enzyme function in vitro and in vivo and decreases smoking in a population of Black-African descent. Pharmacogenet Genomics 2008; 18(1):67-75.
(150) Ho M, Mwenifumbo JC, Al Koudsi N, Okuyemi K, Ahluwalia J, Benowitz NL et al. Association of Nicotine Metabolite Ratio and CYP2A6 Genotype With Smoking Cessation Treatment in African-American Light Smokers. Clin Pharmacol Ther 2009.
(151) Mwenifumbo JC, Tyndale RF. Genetic variability in CYP2A6 and the pharmacokinetics of nicotine. Pharmacogenomics 2007; 8(10):1385-1402.
(152) Saeki M, Saito Y, Jinno H, Sai K, Hachisuka A, Kaniwa N et al. Genetic variations and haplotypes of UGT1A4 in a Japanese population. Drug Metab Pharmacokinet 2005; 20(2):144-151.
(153) Ehmer U, Vogel A, Schutte JK, Krone B, Manns MP, Strassburg CP. Variation of hepatic glucuronidation: Novel functional polymorphisms of the UDP-glucuronosyltransferase UGT1A4. Hepatology 2004; 39(4):970-977.
(154) Hecht SS, Carmella SG, Murphy SE. Effects of watercress consumption on urinary metabolites of nicotine in smokers. Cancer Epidemiol Biomarkers Prev 1999; 8:907-913.
(155) Gelal A, Jacob P, III, Yu L, Benowitz NL. Disposition kinetics and effects of menthol. Clin Pharmacol Ther 1999; 66(2):128-135.
184
(156) Swan GE, Lessov-Schlaggar CN, Bergen AW, He Y, Tyndale R, Benowitz NL. Genetic and environmental influences on the ratio of 3'hydroxycotinine to cotinine in plasma and urine. Pharmacogenetics 2009; 19(5):388-398.
(157) Benowitz NL, Bernert JT, Caraballo RS, Holiday DB, Wang J. Optimal serum cotinine levels for distinguishing cigarette smokers and nonsmokers within different racial/ethnic groups in the United States between 1999 and 2004. Am J Epidemiol 2009; 169(2):236-248.
(158) Benowitz NL. Pharmacology of Nicotine: Addiction, Smoking-Induced Disease, and Therapeutics. Annu Rev Pharmacol Toxicol 2009; 49:57-71.
(159) Hukkanen J, Jacob P, III, Benowitz NL. Metabolism and disposition kinetics of nicotine. Pharmacol Rev 2005; 57(1):79-115.
(160) Schoedel KA, Hoffmann EB, Rao Y, Sellers EM, Tyndale RF. Ethnic variation in CYP2A6 and association of genetically slow nicotine metabolism and smoking in adult Caucasians. Pharmacogenetics 2004; 14(9):615-626.
(161) Benowitz NL. Nicotine addiction. Prim Care 1999; 26(3):611-631.
(162) Caldwell WS, Greene JM, Byrd GD, Chang KM, Uhrig MS, deBethizy JD et al. Characterization of the glucuronide conjugate of cotinine: a previously unidentified major metabolite of nicotine in smokers' urine. Chem Res Toxicol 1992; 5:280-285.
(163) Kuehl GE, Murphy SE. N-Glucuronidation of Nicotine and Cotinine by human liver microsomes and Heterologously-Expressed UDP-glucuronosyltransferases. Drug Metab Dispos 2003; 31:1361-1368.
(164) Turgeon D, Chouinard S, Belanger P, Picard S, Labbe JF, Borgeat P et al. Glucuronidation of arachidonic and linoleic acid metabolites by human UDP-glucuronosyltransferases. J Lipid Res 2003; 44(6):1182-1191.
(165) Green MD, Tephly TR. Glucuronidation of amine substrates by purified and expressed UDP- glucuronosyltransferase proteins. Drug Metab Dispos 1998; 26:860-867.
(166) Kaivosaari S, Salonen JS, Taskinen J. N-Glucuronidation of some 4-arylalkyl-1H-imidazoles by rat, dog, and human liver microsomes. Drug Metab Dispos 2002; 30(3):295-300.
(167) Zenser TV, Lakshmi VM, Hsu FF, Davis BB. Metabolism of N-acetylbenzidine and initiation of bladder cancer. Mutat Res 2002; 506-507:29-40.
185
(168) Rowland A, Elliot DJ, Williams JA, Mackenzie PI, Dickinson RG, Miners JO. In vitro characterization of lamotrigine N2-glucuronidation and the lamotrigine-valproic acid interaction. Drug Metab Dispos 2006; 34(6):1055-1062.
(169) Staines AG, Coughtrie MWH, Burchell B. N-glucuronidation of carbamazepine in human tissues is mediated by UGT2B7. J Pharmacol Exp Ther 2004; 311(3):1131-1137.
(170) Omura K, Nakazawa T, Sato T, Iwanaga T, Nagata O. Characterization of N-glucuronidation of 4-(5-Pyridin-4-yl-1H[ 1,2,4]triazol-3-yl) pyridine-2-carbonitrile (FYX-051): A new xanthine oxidoreductase inhibitor. Drug Metab Dispos 2007; 35(12):2143-2148.
(171) Murphy SE, Kuehl GE. Nicotine, cotinine, and trans 3'-hydroxycotinine glucuronidation by UDP-glucuronosyltransferases 1A3, 1A4 and 1A9. 9th Annual Meeting of the Society for Research on Nicotine and Tobacco, New Orleans, Louisiana, February 19-22, 2003 2003.
(172) Jin CJ, Miners JO, Lillywhite KJ, Mackenzie PI. Cdna Cloning and Expression of 2 New Members of the Human Liver Udp-Glucuronosyltransferase-2B Subfamily. Biochem Biophys Res Commun 1993; 194(1):496-503.
(173) Girard H, Thibaudeau J, Court MH, Fortier LC, Villeneuve L, Carom P et al. UGT1A1 polymorphisms are important determinants of dietary carcinogen detoxification in the liver. Hepatology 2005; 42(2):448-457.
(174) Girard H, Levesque E, Bellemare J, Journault K, Caillier B, Guillemette C. Genetic diversity at the UGT1 locus is amplified by a novel 3' alternative splicing mechanism leading to nine additional UGT1A proteins that act as regulators of glucuronidation activity. Pharmacogenet Genomics 2007; 17(12):1077-1089.
(175) Mori A, Maruo Y, Iwai M, Sato H, Takeuchi Y. UDP-glucuronosyltransferase 1A4 polymorphisms in a Japanese population and kinetics of clozapine glucuronidation. Drug Metab Dispos 2005; 33(5):672-675.
(176) Wiener D, Fang JL, Dossett N, Lazarus P. Correlation between UDP-glucuronosyltransferase genotypes and 4-(methylnitrosamino)-1-(3-pyridyl)-1-butanone glucuronidation phenotype in human liver microsomes. Cancer Res 2004; 64(3):1190-1196.
(177) Chen G, Dellinger RW, Gallagher CJ, Sun D, Lazarus P. Identification of a prevalent functional missense polymorphism in the UGT2B10 gene and its association with UGT2B10 inactivation against tobacco-specific nitrosamines. Pharmacogenet Genomics 2008; 18(3):181-191.
186
(178) Hecht SS, Murphy SE, Carmella SG, Zimmerman CL, Losey L, Kramarczuk I et al. Effects of reduced cigarette smoking on the uptake of a tobacco-specific lung carcinogen. J Natl Cancer Inst 2004; 96(2):107-115.
(179) Fowler BA, Kleinow KM, Squibb KS, Lucier GW, Hayes WA. Organelles as Tools in Toxicology. In: A.Wallace Hayes, editor. Principles and Methods of Toxicology. New York: Raven Press, 1994: 1267-1268.
(180) Kaivosaari S, Toivonen P, Aitio O, Sipila J, Koskinen M, Salonen JS et al. Regio- and stereospecific N-glucuronidation of medetomidine: the differences between UDP glucuronosyltransferase (UGT) 1A4 and UGT2B10 account for the complex kinetics of human liver microsomes. Drug Metab Dispos 2008; 36(8):1529-1537.
(181) Lazarus P, Zheng Y, Aaron RE, Muscat JE, Wiener D. Genotype-phenotype correlation between the polymorphic UGT2B17 gene deletion and NNAL glucuronidation activities in human liver microsomes. Pharmacogenet Genomics 2005; 15(11):769-778.
(182) Boffetta P, Clark S, Shen M, Gislefoss R, Peto R, Andersen A. Serum cotinine level as predictor of lung cancer risk. Cancer Epidemiol Biomarkers Prev 2006; 15(6):1184-1188.
(183) Vaccarella S, Herrero R, Snijders PJF, Dai M, Thomas JO, Hieu NT et al. Smoking and human papillomavirus infection: pooled analysis of the International Agency for Research on Cancer HPV Prevalence Surveys. Int J Epidemiol 2008; 37(3):536-546.
(184) Nieters A, Rohrmann S, Becker N, Linseisen J, Ruediger T, Overvad K et al. Smoking and lymphoma risk in the european prospective investigation into cancer and nutrition. Am J Epidemiol 2008; 167(9):1081-1089.
(185) Benowitz NL. Biomarkers of environmental tobacco smoke exposure. Environ Health Perspect 1999; 107:349-355.
(186) Etter JF, Perneger TV. Measurement of self reported active exposure to cigarette smoke. J Epidemiol Community Health 2001; 55(9):674-680.
(187) Strasser AA, Pickworth WB, Patterson F, Lerman C. Smoking topography predicts abstinence following treatment with nicotine replacement therapy. Cancer Epidemiol Biomarkers Prev 2004; 13(11 Pt 1):1800-1804.
(188) Zinggeler J, Mason J, Hatsukami DK, Murphy SE. Variation in nicotine and cotinine N-glucuronidation among African American and Caucasians on the nicotine patch. J Pharmacol Exp Ther 2009.
187
(189) Ho MK, Tyndale RF. Overview of the pharmacogenomics of cigarette smoking. Pharmacogenomics Journal 2007; 7(2):81-98.
(190) Gu DF, Hinks LJ, Morton NE, Day IN. The use of long PCR to confirm three common alleles at the CYP2A6 locus and the relationship between genotype and smoking habit. Ann Hum Genet 2000; 64(Pt 5):383-390.
(191) Kiyotani K, Yamazaki H, Fujieda M, Iwano S, Matsumura K, Satarug S et al. Decreased coumarin 7-hydroxylase activities and CYP2A6 expression levels in humans caused by genetic polymorphism in CYP2A6 promoter region (CYP2A6*9). Pharmacogenetics 2003; 13(11):689-695.
(192) Haberl M, Anwald B, Klein K, Weil R, Fuss C, Gepdiremen A et al. Three haplotypes associated with CYP2A6 phenotypes in Caucasians. Pharmacogenet Genomics 2005; 15(9):609-624.
(193) Hecht SS. Cigarette smoking: cancer risks, carcinogens, and mechanisms. Langenbecks Archives of Surgery 2006; 391(6):603-613.
(194) Jalas JR, Ding X, Murphy SE. Comparative metabolism of the tobacco-specific nitrosamines 4-(methylnitrosamino)-1-(3-pyridyl)-1-butanone (NNK) and 4-(methylnitrosamino)-1-(3-pyridyl)-1-butanol (NNAL) by rat cytochrome P450 2A3 and human cytochrome P450 2A13. Drug Metabol Dispos 2003; 31:1199-1202.
(195) Upadhyaya P, Kalscheuer S, Hochalter B, Villalta PW, Hecht SS. Quantitation of pyridylhydroxybutyl-DNA adducts in liver and lung of F-344 rats treated with 4-(methylnitrosamino)-1-(3-pyridyl)-1-butanone and enantiomers of its metabolite 4-(methylnitrosamino)-1-(3-pyridyl)-1-butanol. Chem Res Toxicol 2008; in press.
(196) Hecht SS, Carmella SG, Stepanov I, Jensen J, Anderson A, Hatsukami DK. Metabolism of the tobacco-specific carcinogen 4-(methylnitrosamino)-1-(3-pyridyl)-1-butanone to its biomarker total NNAL in smokeless tobacco users. Cancer Epidemiol Biomarkers Prev 2008; 17(3):732-735.
(197) Tulunay OE, Hecht SS, Carmella SG, Zhang Y, Lemmonds C, Murphy S et al. Urinary metabolites of a tobacco-specific lung carcinogen in nonsmoking hospitality workers. Cancer Epidemiol Biomarkers Prev 2005; 14(5):1283-1286.
(198) Stepanov I, Upadhyaya P, Feuer R, Jensen J, Hatsukami DK, Hecht SS. Extensive metabolic activation of the tobacco-specific carcinogen 4-(methylnitrosamino)-1-(3-pyridyl)-1-butanone in smokers. Cancer Epidemiol Biomarkers & Prev 2008; submitted.
188
(199) Murphy SE, Palomino A, Hecht SS, Hoffmann D. Dose-response study of DNA and hemoglobin adduct formation by 4-(methylnitrosamino)-1-(3-pyridyl)-1-butanone in F344 rats. Cancer Res 1990; 50:5446-5452.
(200) Murphy SE, Nunes MG, Hatala MA. Effects of phenobarbital and 3-methylcholanthrene induction on the formation of three glucuronide metabolites of 4-(methylnitrosamino)-1-(3-pyridyl)-1-butanone, NNK. Chemical Biological Interactions 1997; 103:153-166.
(201) Peterson LA, Hecht SS. O6-Methylguanine is a critical determinant of 4-(methylnitrosamino)-1-(3-pyridyl)-1-butanone tumorigenesis in A/J mouse lung. Cancer Res 1991; 51:5557-5564.
(202) Lao Y, Yu N, Kassie F, Villalta PW, Hecht SS. Formation and Accumulation of Pyridyloxobutyl DNA Adducts in F344 Rats Chronically Treated with 4-(Methylnitrosamino)-1-(3-pyridyl)-1-butanone and Enantiomers of Its Metabolite, 4-(Methylnitrosamino)-1-(3-pyridyl)-1-butanol. Chem Res Toxicol 2007; 20(2):235-245.
(203) Peterson LA, Matthew R, Murphy SE, Trushin N, Hecht SS. In vivo and in vitro persistence of pyridyloxobutyl DNA adducts from 4-(methylnitrosamino)-1-(3-pyridyl)-1-butanone. Carcinogenesis 1991; 12:2069-2072.
(204) Weng Y, Fang C, Turesky RJ, Behr M, Kaminsky LS, Ding X. Determination of the role of target tissue metabolism in lung carcinogenesis using conditional cytochrome P450 reductase-null mice. Cancer Res 2007; 67(16):7825-7832.
(205) Smith BD, Sanders JL, Porubsky PR, Lushington GH, Stout CD, Scott EE. Structure of the human lung cytochrome P450 2A13. J Biol Chem 2007; 282(23):17306-17313.
(206) Schlicht KE, Zinggeler-Berg J, Murphy SE. Effect of CYP2A13 Active Site Mutation Asn297Ala on Metabolism of Coumarin and Tobacco-specific Nitrosamines. Drug Metab Dispos 2008; in press.
(207) Guengerich FP, Wu ZL, Bartleson CJ. Function of human cytochrome P450s: characterization of the orphans. Biochem Biophys Res Commun 2005; 338(1):465-469.
(208) Oscarson M, McLellan RA, Asp V, Ledesma M, Ruiz ML, Sinues B et al. Characterization of a novel CYP2A7/CYP2A6 hybrid allele (CYP2A6*12) that causes reduced CYP2A6 activity. Hum Mutat 2002; 20(4):275-283.
(209) Koskela S, Hakkola J, Hukkanen J, Pelkonen O, Sorri M, Saranen A et al. Expression of CYP2A genes in human liver and extrahepatic tissues. Biochem Pharmacol 1999; 57(12):1407-1413.
189
(210) Su T, Bao Z, Zhang QY, Smith TJ, Hong JY, Ding X. Human cytochrome P 450 CYP2A13: Predominant expression in the respiratory tract and in high efficiency metabolic activation of a tobacco-specific carcinogen, 4-(methylnitrosamino)-1-(3-pyridyl)-1-butanone. Cancer Res 2000; 60:5074-5079.
(211) Patten CJ, Smith TJ, Murphy SE, Wang MH, Lee J, Tynes RE et al. Kinetic analysis of activation of 4-(methylnitrosamino)-1-(3-pyridyl)-1-butanone by heterologously expressed human P450 enzymes, and the effect of P450 specific chemical inhibitors on this activation in human liver microsomes. Arch Biochem Biophys 1996; 333:127-138.
(212) von Weymarn LB, Murphy SE. CYP 2A13-catalyzed coumarin metabolism, comparison to CYP2A5 and CYP2A6. Xenobiotica 2003; 33:73-81.
(213) Ding S, Lake BG, Friedberg T, Wolf CR. Expression and alternative splicing of the cytochrome P450 CYP2A6. Biochem J 1995; 306:161-166.
(214) Boyd GW, Coombs MM, Baird WM. The presence of a trifluoromethyl rather than a methyl substituent in the bay-region greatly decreases the DNA-binding and tumour-initiating activity of the cyclopenta[a]phenanthren-17-ones. Carcinogenesis 1995; 16:2543-2547.
(215) Oscarson M. Genetic polymorphisms in the cytochrome P450 2A6 (CYP2A6) gene: implications for interindividual differences in nicotine metabolism. Drug Metab Dispos 2001; 29(2):91-95.
(216) Mwenifumbo JC, Lessov-Schlaggar CN, Zhou Q, Krasnow RE, Swan GE, Benowitz NL et al. Identification of Novel CYP2A6*1B Variants: The CYP2A6*1B Allele is Associated With Faster In Vivo Nicotine Metabolism. Clin Pharmacol Ther 2008; 83(1):115-121.
(217) Tyndale RF, Sellers EM. Genetic variation in CYP2A6-mediated nicotine metabolism alters smoking behavior. Ther Drug Monit 2002; 24(1):163-171.
(218) von Weymarn LB, Sridar C, Hollenberg PF. Identification of Amino Acid Residues Involved in the Inactivation of Cytochrome P450 2B1 by Two Acetylenic Compounds: The Role of Three Residues in Non-Substrate Recognition Sites. J Pharmacol Exp Ther 2004.
(219) Jordan M, Schallhorn A, Wurm FM. Transfecting mammalian cells: Optimization of critical parameters affecting calcium-phosphate precipitate formation. Nucleic Acids Res 1996; 24(4):596-601.
(220) von Weymarn LB, Felicia ND, Ding X, Murphy SE. N-Nitrosobenzylmethylamine α-hydroxylation and coumarin 7-hydroxylation by rat esophageal microsomes and cytochrome P450 2A3 and 2A6 enzymes. Chem Res Toxicol 1999; 12:1254-1261.
190
(221) Cox SK, Hamner T, Bartges J. Determination of 6-hydroxychlorzoxazone and chlorzoxazone in porcine microsome samples. Journal of Chromatography B-Analytical Technologies in the Biomedical and Life Sciences 2003; 784(1):111-116.
(222) Larson JR, Coon MJ, Porter TD. Purification and Properties of A Shortened Form of Cytochrome-P-450 2E1 - Deletion of the Nh2-Terminal Membrane-Insertion Signal Peptide Does Not Alter the Catalytic Activities. Proc Natl Acad Sci U S A 1991; 88(20):9141-9145.
(223) International Agency for Research on Cancer. IARC monographs programme finds smokeless tobacco is carcinogenic to humans. IARC Press Release No 154 2005.
(224) Zhu LR, Thomas PE, Lu G, Reuhl KR, Yang GY, Wang LD et al. CYP2A13 in human respiratory tissues and lung cancers: an immunohistochemical study with a new peptide-specific antibody. Drug Metab Dispos 2006; 34(10):1672-1676.
(225) Yano JK, Hsu MH, Griffin KJ, Stout CD, Johnson EF. Structures of human microsomal cytochrome P450 2A6 complexed with coumarin and methoxsalen. Nat Struct Mol Biol 2005; 12(9):822-823.
(226) Honkakoski P, Negishi M. The structure, function, and regulation of cytochrome P450 2A enzymes. Drug Metab Rev 1997; 29:977-996.
(227) Born SL, Rodriguez PA, Eddy CL, Lehmann-McKeeman LD. Synthesis and reactivity of coumarin 3,4-epoxide. Drug Metab Dispos 1997; 25:1318-1323.
(228) Vassallo JD, Hicks SM, Born SL, Daston GP. Roles for epoxidation and detoxification of coumarin in determining species differences in clara cell toxicity. Toxicol Sci 2004; 82(1):26-33.
(229) von Weymarn LB, Zhang QY, Ding X, Hollenberg PF. Effects of 8-methoxypsoralen on cytochrome P450 2A13. Carcinogenesis 2005; 26(3):621-629.
(230) von Weymarn LB, Blobaum AL, Hollenberg PF. The mechanism-based inactivation of p450 2B4 by tert-butyl 1-methyl-2-propynyl ether: structural determination of the adducts to the p450 heme. Arch Biochem Biophys 2004; 425(1):95-105.
(231) Shultz MA, Choudary PV, Buckpitt AR. Role of murine cytochrome P-4502F2 in metabolic activation of naphthalene and metabolism of other xenobiotics. J Pharmacol Exp Ther 1999; 290(1):281-288.
(232) Vassallo JD, Morrall SW, Fliter KL, Curry SM, Daston GP, Lehman-McKeeman LD. Liquid chromatographic determination of the glutathione
191
conjugate and ring-opened metabolites formed from coumarin epoxidation. J Chromatogr B Analyt Technol Biomed Life Sci 2003; 794(2):257-271.
(233) Nakamura K, Hanna IH, Cai HL, Nishimura Y, Williams KM, Guengerich FP. Coumarin substrates for cytochrome P450 2D6 fluorescence assays. Analytical Biochemistry 292[2], 280-286. 5-15-2001.
Ref Type: Journal (Full)
(234) Sansen S, Hsu MH, Stout CD, Johnson EF. Structural insight into the altered substrate specificity of human cytochrome P450 2A6 mutants. Arch Biochem Biophys 2007; 464(2):197-206.
(235) Upadhyaya P, Kenney PMJ, Hochalter JB, Wang M, Hecht SS. Tumorigenicity and metabolism of 4-(methylnitrosamino)-1-(3-pyridyl)-1-butanol (NNAL) enantiomers and metabolites in the A/J mouse. Carcinogenesis 1999; 20:1577-1582.
(236) Human UDP-glucuronosyltransferases 1A7 and 1A9 form N- and N-OH linked glucuronides from procarcinogens. 2000.
(237) Carmella SG, Le KA, Upadhyaya P, Hecht SS. Analysis of N- and O-glucuronides of 4-(methylnitrosamino)-1-(3- pyridyl)-1-butanol (NNAL) in human urine. Chem Res Toxicol 2002; 15:545-550.