Embed Size (px)
Citation preview
INTRODUCTION
Page 1
Economics :
Economics is a social science which
deals with human wants and their
satisfaction. It is mainly concerned
with the way in which a society
chooses to employ its scarce
resources which have alternative
uses, for the production of goods for
present and future consumption. It
is simply defined as science of
production distribution and
consumption.
Political economy is another name
for economics. “Polis” in Greek means a State.
Definitions of Economics :
1. Adam Smith’s Wealth Definition : He defined, “Economics is the
science of wealth”. Book - Wealth of Nations - 1776
He is known as the Father of
Economics.(Political Economy).
2. Alfred Marshall’s Welfare Definition:
He defined economics as “a study of man’s actions in the ordinary business of life”.
Book - Principles of Economics.
3. Lionel Robbins’ Scarcity Definition:
He defined “Economics is the
science which studies human
behavior as a relationship
between ends and scarce means
which have alternative uses ".
Book - An Essay on the Nature
and significance of Economic
Science.
4. Samuelson’s Modern Definition of
Economics :
He defined, “Economics is a social science concerned chiefly
with the way society chooses to
employ its resources, which have
alternative uses, to produce
goods and services for present
and future consumption”. He has coined the concept of Net
Economic Welfare.
Net Economic Welfare :
It is an adjusted measure of total
national output that includes only
consumption and investment items
that contribute directly to economic
welfare.
Ancient Economic Thought:
Valluvar’s economic ideas are found mostly in the second part of the
Thirukkural, the Porutpal or the
part dealing with wealth.
Amarthya Sen was the first Indian to receive Noble Prize in 1998 for his
work on welfare Economics.
INTRODUCTION
Page 2
Kautilya's economic thought was
mentioned in his book Arthasastra.
Modern Economic Thought :
Mercantilism :
Mercantilism was a policy of power.
It was followed by European
governments between 15th and 18th
century.
The Physiocracy / Physiocrate
The term ‘physiocracy’ means ‘Rule of Nature’.
Physiocracy was essentially a revolt
by the French against mercantilism.
They advocated laissez–faire.(non-
interference by the governments in
the economic system)
Classical school :
Adam smith (first development
economist) was interested in the
nature and causes of the wealth of
nations.
Ricardo was interested in the
problems of distribution.
Malthus, who gave the theory of
population was interested in
finding out why some countries
were prosperous at one time and
why they were poor at other times.
J.S. Mill believed in individualism
as well as socialism and also
advocated socialist reforms in
distribution as the laws of
distribution were different from
the laws of production.
The Historical school :
It was a revolt against the
classical school.
It advocated protection for new
industries through tariffs.
It was dominant in Germany
during the second half of the
19th century.
Marxism :
Karl Marx is considered as the
Father of (scientific) socialism.
According to Marx, “all history is a history of class struggle”.
His teachings resulted in the
birth of a socialist State in Russia
and China.
The Institutional school :
It emphasizes the role of
institutions in economic life.
It is of American origin.
J.A. Schumpeter considered
economic life mainly as a
process of change and
development.
The Keynesian Revolution :
Father of new economics - John
Maynard Keynes.
Keynes suggested a greater role
for government and a bold fiscal
policy to tide over the crisis
during great depression (1920-
1930).
The New Deal policy of America
was greatly influenced by
Keynesian policy.
Basic Divisions in Economics :
1. Production
2. Distribution
3. Consumption
4. Exchange
INTRODUCTION
Page 3
1. Production :
Production refers to the creation of
wealth.
It deals with all activities which are
undertaken to produce goods
which satisfy human wants.
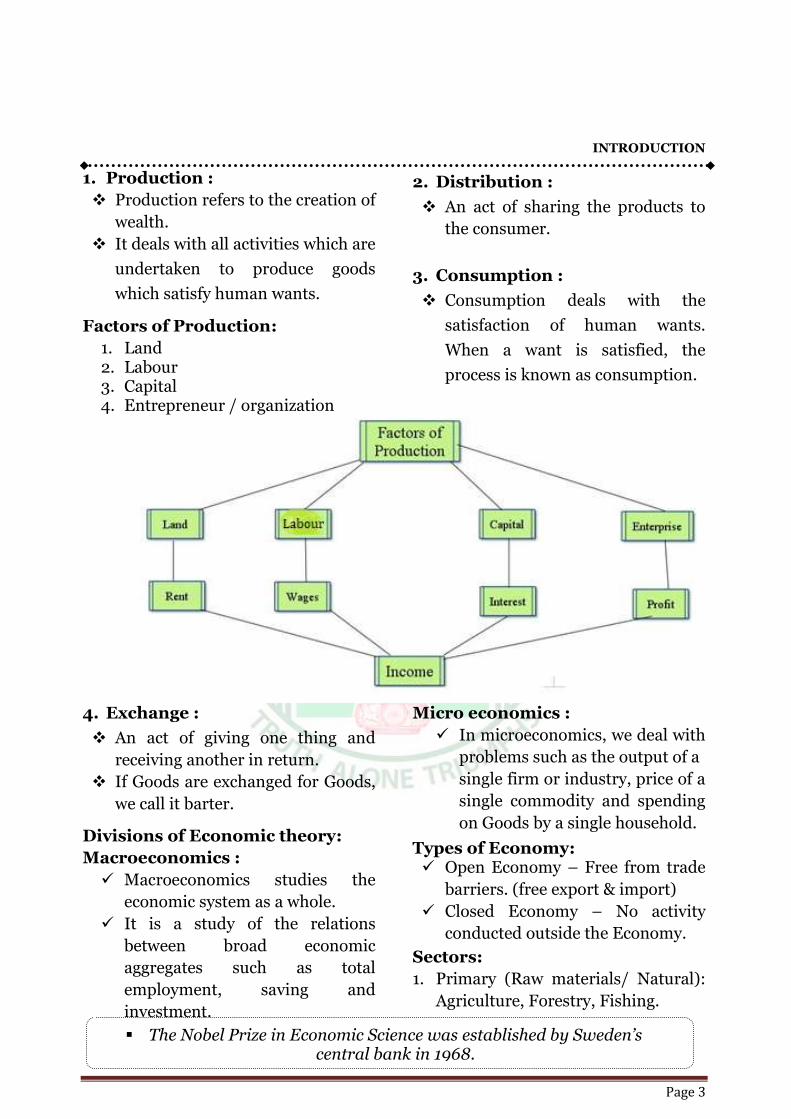
Factors of Production:
1. Land 2. Labour 3. Capital 4. Entrepreneur / organization
2. Distribution :
An act of sharing the products to
the consumer.
3. Consumption :
Consumption deals with the
satisfaction of human wants.
When a want is satisfied, the
process is known as consumption.
4. Exchange :
An act of giving one thing and
receiving another in return.
If Goods are exchanged for Goods,
we call it barter.
Divisions of Economic theory:
Macroeconomics :
Macroeconomics studies the
economic system as a whole.
It is a study of the relations
between broad economic
aggregates such as total
employment, saving and
investment.
Micro economics :
In microeconomics, we deal with
problems such as the output of a
single firm or industry, price of a
single commodity and spending
on Goods by a single household.
Types of Economy: Open Economy – Free from trade
barriers. (free export & import)
Closed Economy – No activity
conducted outside the Economy.
Sectors:
1. Primary (Raw materials/ Natural):
Agriculture, Forestry, Fishing.
The Nobel Prize in Economic Science was established by Sweden’s
central bank in 1968.
INTRODUCTION
Page 4
2. Secondary (Manufacturing) :
Mining, Manufacturing,
Electricity, gas and water
supply, construction.
3. Tertiary (Service): Business,
Transport, Banking, Tele
communication, Real Estate etc..,
Economic Systems:
Economic system refers to the way
in which resources are allocated in
the economy.
Economic system can be classified into:
1. Traditional economy on Self
contained economy :
This type of economy which are
governed by customs and
conventions.
It is also called village economy
or closed economy.
2. Capitalist economy or Market
economy :
It is an economic system in
which the production and
distribution of commodities take
place through the mechanism of
free markets without the
government interferences.
Hence it is also called as market
economy or free trade economy.
Eg: United States, Canada, Great
Britain.
3. Socialist economy or
Command economy :
It is an economic system in
which the means of production
are owned and operated by the
State.
All decisions regarding
production and distribution are
taken by the central planning
authority.
Hence it is also called as planned
economy.
E.g: China, Vietnam, Laos, Cuba
and North Korea.
4. Mixed economy :
Mixed economy is one in which
both public and private sectors
co-exist.
In the real world no economy is a
pure traditional economy, a pure
capitalist economy or a pure
socialist economy.
E.g: India.
Basic terms and concepts in
Economics:
1. Market: It is a place where goods
are bought and sold.
2. Trade: Buying and selling of
commodities.
3. Wealth : Stock of goods existing
at a given time that have money
value
4. Goods: Anything that satisfies a
human want can be considered as
“good” in economics. It refer to
material and non-material things.
5. Value: The term “value” refers to the exchange qualities of a good.
It is generally measured in money
6. Price: When value is expressed in
money, it is called price.
INTRODUCTION
Page 5
7. Labour : It refers to any work
undertaken for securing an
income or rewards. It is the
employer of capital.
8. Capital : It refers to part of man-
made wealth which is used for
the further production of
wealth.
9. Entrepreneur : It is a person who
combines the different factors of
production, in the right
proportion and initiates the
process of production and also
bears the risks .
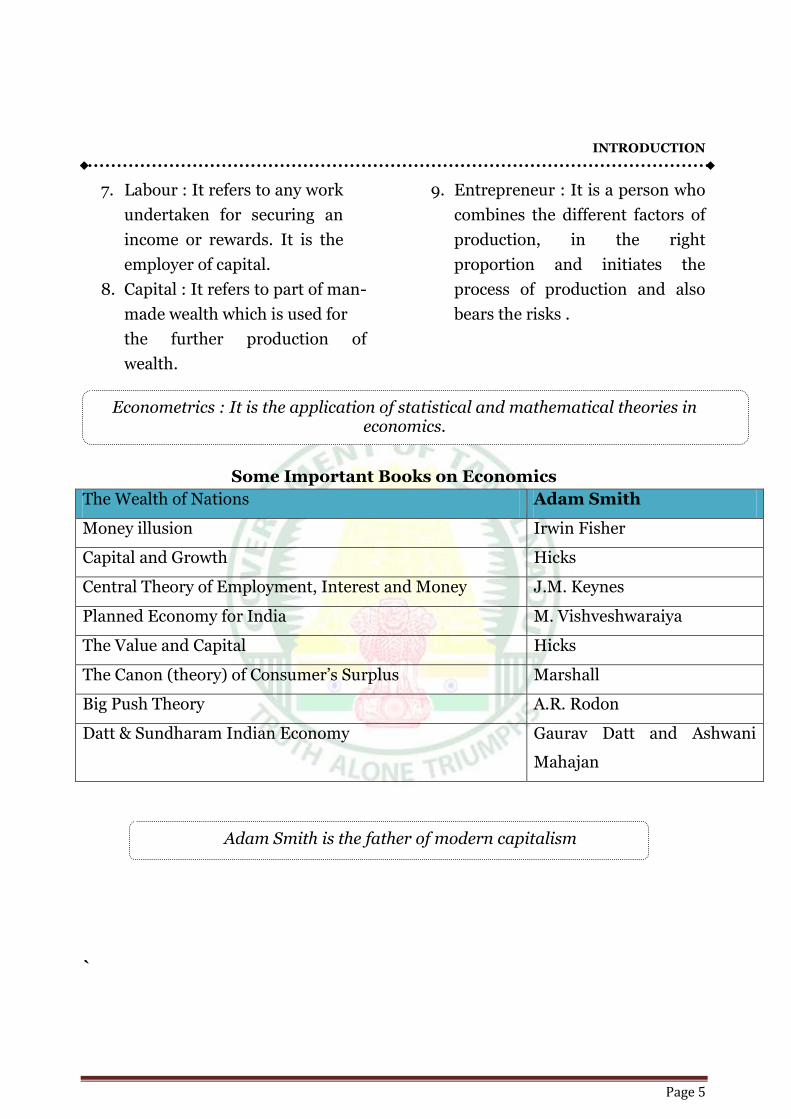
Some Important Books on Economics
The Wealth of Nations Adam Smith
Money illusion Irwin Fisher
Capital and Growth Hicks
Central Theory of Employment, Interest and Money J.M. Keynes
Planned Economy for India M. Vishveshwaraiya
The Value and Capital Hicks
The Canon (theory) of Consumer’s Surplus Marshall
Big Push Theory A.R. Rodon
Datt & Sundharam Indian Economy Gaurav Datt and Ashwani
Mahajan
`
Econometrics : It is the application of statistical and mathematical theories in economics.
Adam Smith is the father of modern capitalism
INTRODUCTION
Page 7
The term capitalism was introduced by Karl Marx.
BASIC FEATURES OF INDIAN
ECONOMY
Characteristics of Indian
Economy
Main Characteristics and various
aspects of Indian Economy are:
1. Agrarian Economy : Even after
six-decades of independence, 48.9%
of the work force of India is still
agriculturist and its contribution to
National Income in 2013-14 is
13.9% / 2017-18 = 16.4%
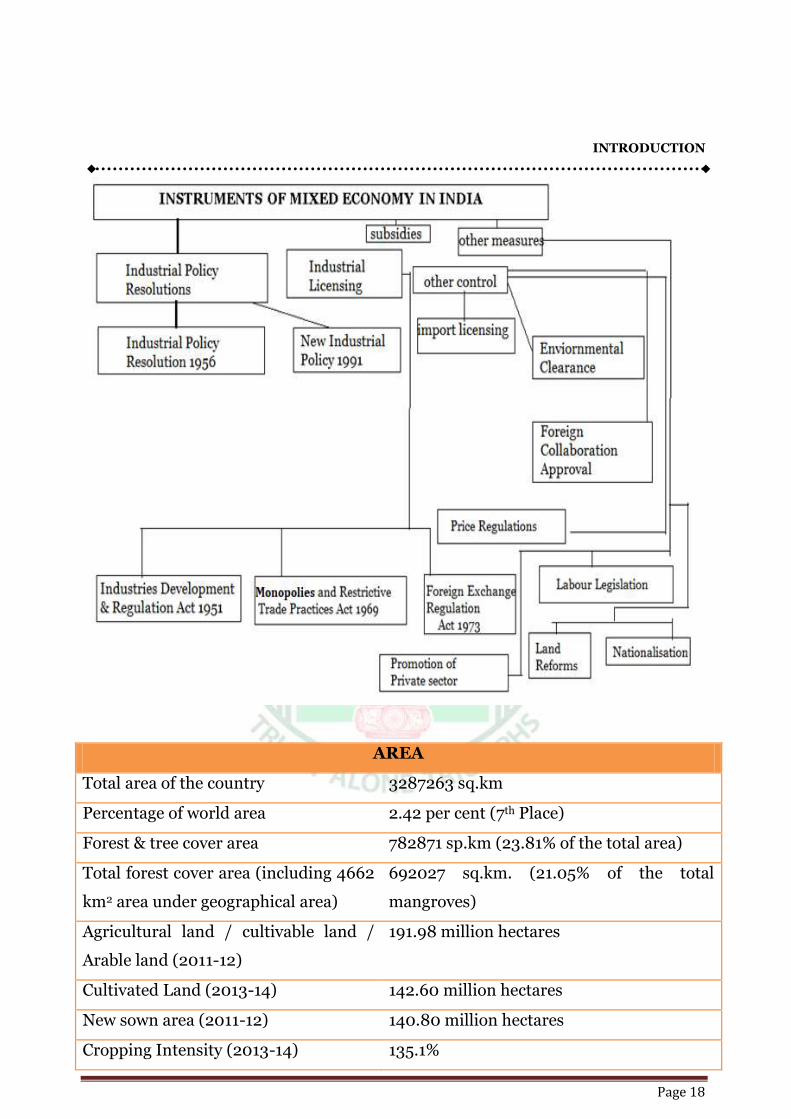
2. Mixed Economy : Indian
Economy is a unique blend of public
and private sector, i.e. a mixed
economy. After liberalisation,
Indian Economy is going ahead as a
capitalist economy or market
economy.
3. Developing Economy : The
following facts show that Indian
Economy is a developing economy :
(a) National Income : (is the net
national income of factor cost) of
India during 2013-14 at current
prices is estimated at ` 92.4 lakh
crore and at constant (2004-05)
prices, at 49.3 lakh crore.
At constant (2004-05) prices, the
National Income has shown a
growth of 4.2%, while at current
prices the growth rate of national
Income is 11.9%.
(b) According to Planning
commission of India’s report, India has 27 crore people or
21.9% population living below
Poverty Line (as on 31st March
2012).
(c) Level of unemployment is very
high. Unemployment in India is
mainly structural in nature
because the productive capacity is
inadequate to create sufficient
number of jobs.
There is an acute problem of
disguised unemployment in the
rural areas.
A person is considered employed if
he/she works for 273 days of a year for
eight hours every day.
(d) Savings are low in India due to
low national income and high
consumption expenditure. The
low savings results in shortage of
BPL: According to the
Rangarajan Committee, 30.95%
people in rural areas and 26.4% in
urban areas (as compared to
25.7% and 13.7% respectively as
per the Tendulkar Methodology
were below the poverty line in
2011-12.
Source : The IE 4 July 2015.
INTRODUCTION
Page 8
capital formation. Capital is an
important factor of production.
(e) India is the second most
populated country of the world.
During 2001-2011, population
increased by 17.69%. With this
high growth rate of population
about 1.83 crore new persons are
being added to Indian population
every year. According to 2011
census, the total Indian
population stands at a high level
of 121.07 crore which is 17.5% of
the world’s total population. To
maintain 17.5% of world
population India holds only
2.42% of total land area of the
world.
(f) India lacks in large
industrialisation based on
modern and advanced technology
which fails to accelerate the pace
of development in the economy.
Important facts relating to
characteristics of Indian
Economy
Primary sector of Indian Economy
is agriculture and the related
sectors.
Secondary sector of Indian
Economy is related to industry,
manufacturing electricity etc.
Tertiary sector of Indian Economy
is related to business, transport,
communication and services.
The best indicator of economic
development of any country is per
capital income.
The following factors are important
in Economic Development of a
developing country :
1. Natural resources,
2. Capital gain,
3. Skilled labour force,
4. Surplus sale of agriculture,
5. Justified social organisation,
6. Political freedom,
7. Freedom from corruption,
8. Technological knowledge and
general education.
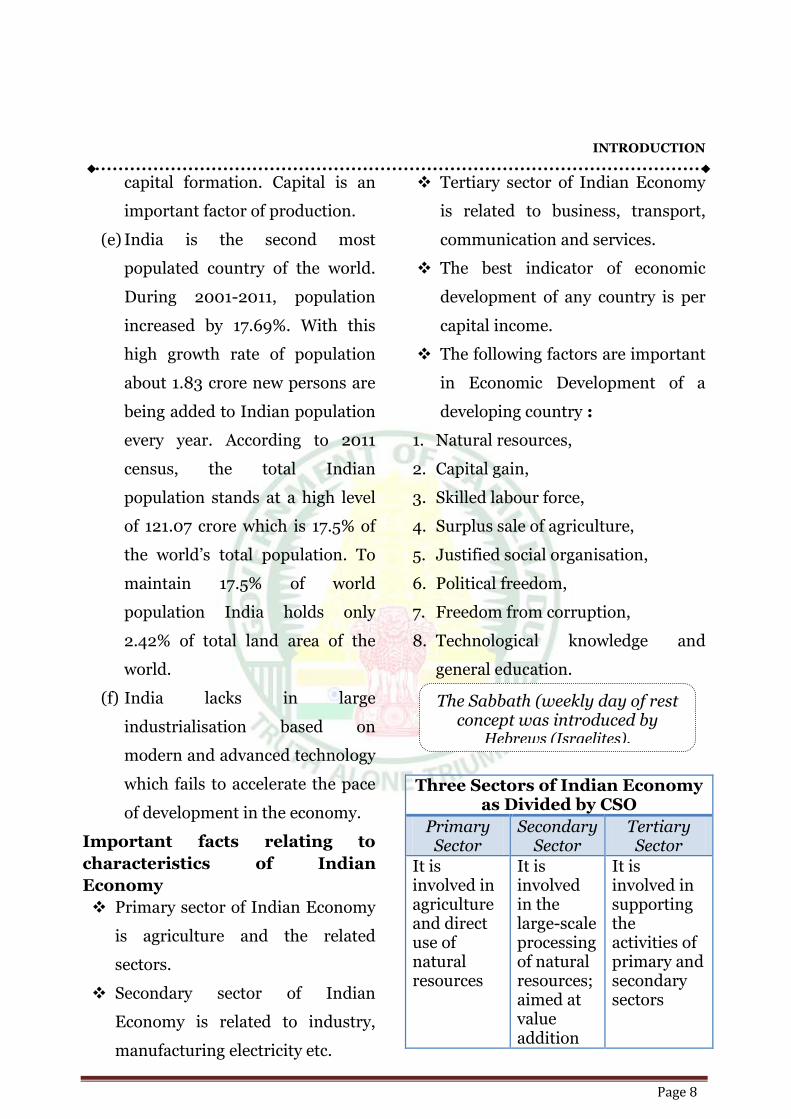
Three Sectors of Indian Economy as Divided by CSO
Primary Sector
Secondary Sector
Tertiary Sector
It is involved in agriculture and direct use of natural resources
It is involved in the large-scale processing of natural resources; aimed at value addition
It is involved in supporting the activities of primary and secondary sectors
The Sabbath (weekly day of rest concept was introduced by
Hebrews (Israelites).
INTRODUCTION
Page 9
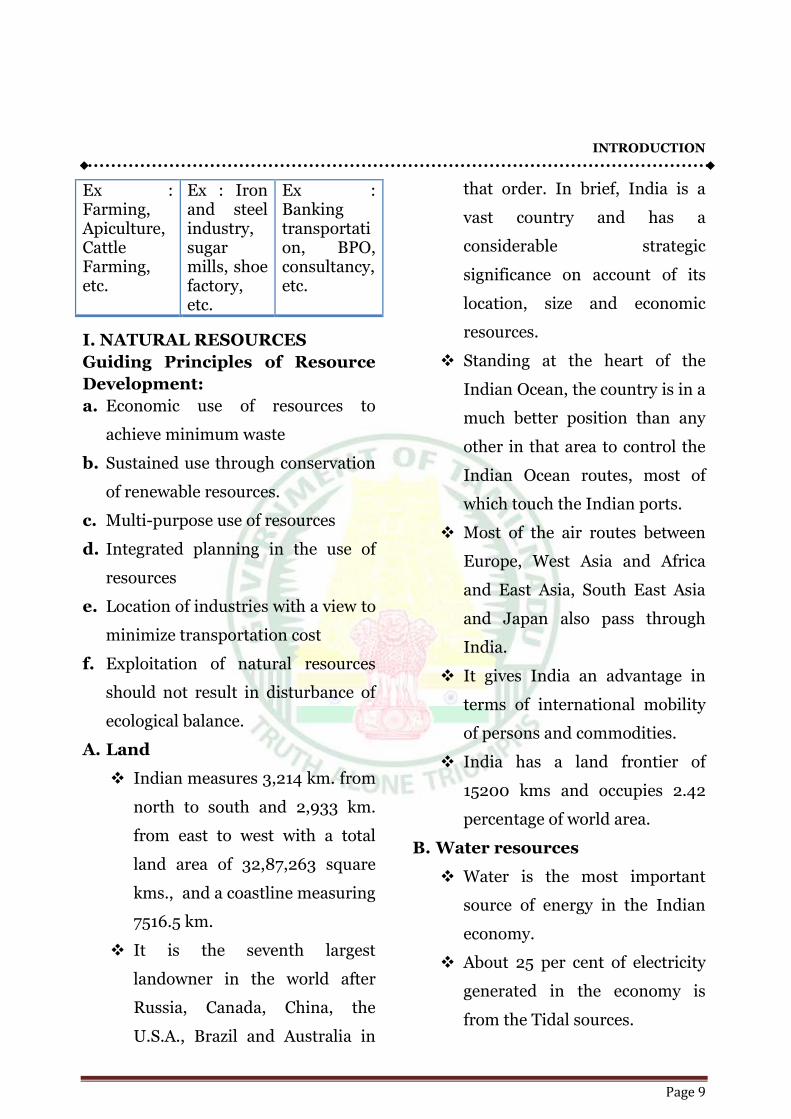
Ex : Farming, Apiculture, Cattle Farming, etc.
Ex : Iron and steel industry, sugar mills, shoe factory, etc.
Ex : Banking transportation, BPO, consultancy, etc.
I. NATURAL RESOURCES
Guiding Principles of Resource
Development:
a. Economic use of resources to
achieve minimum waste
b. Sustained use through conservation
of renewable resources.
c. Multi-purpose use of resources
d. Integrated planning in the use of
resources
e. Location of industries with a view to
minimize transportation cost
f. Exploitation of natural resources
should not result in disturbance of
ecological balance.
A. Land
Indian measures 3,214 km. from
north to south and 2,933 km.
from east to west with a total
land area of 32,87,263 square
kms., and a coastline measuring
7516.5 km.
It is the seventh largest
landowner in the world after
Russia, Canada, China, the
U.S.A., Brazil and Australia in
that order. In brief, India is a
vast country and has a
considerable strategic
significance on account of its
location, size and economic
resources.
Standing at the heart of the
Indian Ocean, the country is in a
much better position than any
other in that area to control the
Indian Ocean routes, most of
which touch the Indian ports.
Most of the air routes between
Europe, West Asia and Africa
and East Asia, South East Asia
and Japan also pass through
India.
It gives India an advantage in
terms of international mobility
of persons and commodities.
India has a land frontier of
15200 kms and occupies 2.42
percentage of world area.
B. Water resources
Water is the most important
source of energy in the Indian
economy.
About 25 per cent of electricity
generated in the economy is
from the Tidal sources.
INTRODUCTION
Page 10
The other important use of
water is in irrigation. The
irrigation potential through
major, medium and minor
irrigation projects has increased
from 22.6 million hectares in
1951 to 102.77 million hectares
(mha) at the end of 10th plan.
In a country where agriculture
gives twists and turns to the
whole economy, provision of
water can make all the
difference; it can either
stimulate the economic activity
or depress it altogether.
The important sources of water
can be classified into two parts;
(i) surface water and (ii) ground
water. Surface water is available
from such sources as rivers,
lakes etc. Ground water is
available from wells, springs etc.
The rivers in India may be
classified as
(i) The Himalayan rivers
(ii) Deccan rivers
(iii) Coastal streams and
(iv) Rivers of the inland
drainage system.
The Himalayan Rivers are
generally snow fed and have,
therefore a continuous flow
throughout the year.
During the monsoon months,
the Himalayas receive a very
heavy rainfall and the rivers
discharge the maximum amount
of water causing frequent floods.
The Deccan Rivers are generally
rain-fed and therefore fluctuate
in volume.
The Ministry of Water
Resources lays down the policies
and programmes for
development and regulation of
the country’s water resources.
The National Water Policy,
2002 lays emphasis on
integrated water resources
development and management
for optimal and sustainable
utilization of the available
surface and ground water.
C. Forest Resources
Forest produces the requisite
raw materials for industries,
defence, communication,
domestic use and other public
purposes.
They contribute to the country’s
exports and create a large
volume of employment in the
INTRODUCTION
Page 11
primary, secondary and tertiary
sectors.
They also provide materials like
fuel wood, small timber, fodder,
etc. for direct use by the
agriculturists.
The benefits from forests in the
matter of soil conservation,
recreation, wildlife, etc., have
been well recognized.
Forest Report – 2011
The Forest Survey of India (FSI)
has been publishing a series of
biennial assessment reports of the
forest cover in the country, since
1987.
The India State of Forest Report
2011, is the twelfth report in the
series.
As per the present assessment,
the forest and tree cover of the
country is 78.29 million
hectare, which is 23.81% of the
geographical area of the
country.
In comparison to the 2009
assessment, after taking into
account the interpretational
changes, there is a decrease of
367 sq km in country’s forest cover.
The State of Madhya Pradesh
has the largest forest cover in
the country, as 77700 sq. km,
followed by Arunachal Pradesh
at 67410 sq.km.
D. Mineral Resources
The mineral resources of India
encompass a wide range of
products that are necessary for
a modern developed economy.
There are, according to the
Geological Survey of India, 50
important minerals and 400
major sites where these
minerals occur.
These can be divided into four
categories as follows.
a. Minerals of which India’s exportable surplus can
dominate the world market;
to this category belong iron-
ore and mica;
b. Minerals of which the
exportable surplus forms an
important factor; these
include manganese ore,
bauxite, gypsum and others;
c. Minerals in which it appears
that the country is self-
sufficient, like coal, sodium
salts, glass sand, phosphates
etc.
M. Vishveshwarya, CE. Real GDP
INTRODUCTION
Page 12
d. Minerals for which India has
to depend largely or entirely
on foreign markets like
copper, nickel, petroleum,
lead, zinc, tin, mercury,
platinum, graphite, etc.
e. The various minerals can
also be classified into three
categories on the basis of
their nature and end use.
These three categories are:
Fuels like coal, lignite,
natural gas and petroleum
Metallic minerals like
bauxite, iron-ore,
manganese etc.
Non-metallic minerals like
phosphorous, graphite,
gypsum, limestone, mica etc.
National Mineral Policy, 2008
The new NMP was approved by
the government on March 13,
2008. It is based on the
recommendations of the
Anwarul Hooda Committee.
The new NMP enunciates
measures like assured right to
next stage mineral concession,
transferability of mineral
concessions and transparency in
allotment of concessions, in
order to reduce delays, which are
seen as impediments to
investment and technology flows
in the mining sector in India.
The Mining Policy also seeks to
develop a sustainable framework
for optimum utilization of the
country’s natural mineral
resources for the industrial
growth in the country and at the
same time improving the life of
people living in the mining areas,
which are generally located in
the backward and tribal region of
the country.
E. ENERGY Resources
The need for energy in a
developing economy can hardly
be over-emphasized.
It is a basic input required to
sustain economic growth and to
provide basic amenities of life to
the entire population of a
country. It is energy, which is the
dividing line between a
subsistence economy and a highly
developed economy. India is the
7th largest producer and 5th
largest consumer of energy in the
world.
Engineers day – Sep 15
INTRODUCTION
Page 13
Energy in India is produced from
different sources. These can be
classified into two groups. (i)
Commercial Sources – like
thermal power, hydro power,
power from oil, gas, nuclear, etc.
and (ii) non-commercial sources
like firewood, dung-cake, etc. Of
the two sets of sources,
commercial sources occupy a
more prominent position.
The bulk of the commercial
energy is consumed in the
industrial sector followed by the
transport and household sectors
whereas a large part of the energy
requirement in the rural and
domestic sectors is met from
non-commercial sources.
F. Natural Gas
Natural gas has aptly been
termed as the Prince of
Hydrocarbons. It occurs
either as associated gas or free
gas. Associated gas is produced
from underground reservoirs
along with crude oil and the
level of production depends
entirely on the level of crude oil
production.
Contrary to that, free gas,
though occurring in the
underground reservoirs is not
associated with crude oil and
can be produced as required.
Natural gas can be used for both
domestic and industrial
purposes.
It finds application in the power,
fertilizer and petrochemical
industries.
G. Production and Consumption
In India, exploration for oil and
gas was taken up first in 1955
after the ONGC was formed on
a national scale.
Substantial reserves of gas have
been located in different parts of
the country, more important
among which identified are
Cambay basin, Upper Assam,
Mumbai High, South Bassein
and other areas of Indian
Sedimentary Basin, such as
Krishna-Godavari, Jaisalmer,
Tripura, Cachar, Bengal and the
Himalayan foothills. The
geological reserves of gas have
been estimated at 1,154 million
tonnes (as oil equivalent)
presently.
INTRODUCTION
Page 14
Nominal GDP – India rank – 7th (in world level)
Acquisition of oil and gas assets
abroad
In view of the demand-supply gap
in hydrocarbons, national oil
companies are encouraged to
pursue equity oil and gas
opportunities overseas. Oil and
Natural Gas Corporation Videsh
Limited (OVL) produced about
8.78 million metric tonnes of oil
and equivalent gas during the
year 2008-09 from its assets
abroad in Sudan, Vietnam,
Russia, Syria and Colombia. In
2008, OVL acquired two oil
blocks each in Brazil and
Colombia.
The largest ever acquisition of a
foreign company, Imperial
Energy Plc., UK (IEC) by an
Indian Public Sector company,
ONGC-Videsh Ltd., took place in
2008. Besides IECOVL-IOC
alliance, BPCL along with
Videocon, too have acquired oil
assets abroad.
II. SALIENT FEATURES OF
INDIAN ECONOMY
1. Low Income
In India GNP (Gross National
Product) per capita is Rs.
111,9191.63 billion in 2013-14 at
market price, roughly one fourth of
the population was below the
poverty line.
On world scale, income
inequalities between the developed
and underdeveloped countries are
very large.
According to the World Bank
estimates, in 2010 the average
GNP per capita of the high income
economies was $38,685, whereas
it was $ 510 in low income
underdeveloped countries.
2. Predominance of Agriculture
In India agriculture and allied
sectors contribute nearly 13.7
percent of Gross Domestic Product
(GDP) according to the 2013-14
estimates released by the Central
Statistics Office (CSO).
Moreover, in India agriculture
provides employment to around
50 per cent of the workforce.
The share of income in agriculture
is however, considerably less than
the share of employment in
INTRODUCTION
Page 15
agriculture which clearly reflects
the relatively low productivity per
labour unit in the agricultural
sector.
3. Rapid Population Growth Rate
and High Dependency Ratio
High population growth rate is
also in indicator of under
development.
India’s population growth rate
was 1.64% per annum and
17.64% per decade during 2001-
2011, which is still very high as
compared to the developed
economies.
Dependency ratio refers to ratio
of dependent population (non-
working) to total population.
In India dependency ratio is
around 60% which is very high.
This is because of high birth rate
and social circumstances.
4. Mass Poverty
According to United Nations
Development Programme’s
(UNDP) Global Human
Development Index 2013, India is
ranked 135th among 187 countries.
The report says 55.3 per cent of the
Indians suffer from
multidimensional poverty.
The Planning Commission
released the second India Human
Development Report (HDR) 2013.
The report claims that poverty,
unemployment and child labour
are declining.
According to this report the
absolute number of the poor (27
per cent) stood at 302 million as
compared to 320 million in 1973.
Poverty is widespread in the
underdeveloped countries, though
the major progress has been
registered over the past 25 years,
the absolute number of poor has in
face increased.
5. Unemployment and Underemployment Unemployment is a
phenomenon of all economies
whether developed or
underdeveloped.
But nature and degree of
unemployment is different in
developed and underdeveloped
economies.
In developed economies most of
the unemployment is cyclical
which arises because of
fluctuations in business cycles.
In underdeveloped economies
like India, chronic
unemployment is found which
INTRODUCTION
Page 16
results from the structural
defects in the economy.
Moreover, underemployment is
widespread in underdeveloped
countries.
Underemployment is a
condition in which a person is
getting work but not according
to his/her capacity and
qualifications.
The 68th round (2011-2012) of
NSSO survey on employment-
unemployment indicates a
creation of 4.68 million work
opportunists between 2009-10
and 2011-12.
The Twelfth Five Year Plan aims
at generating 58 million work
opportunities in twenty-one
high growth sector.
6. Inequality
Inequality in distribution of
income and wealth is found in
every country but this is much
wider in underdeveloped
economies.
In India bottom 40% of rural
population posses only 5% of
rural assets while 8% top
households posses 46% of total
rural assets. This disparity is
more intensive in urban areas.
7. Security of Capital
Capital is considered as the
most important factor in the
development of an economy.
In underdeveloped economies
like India, capital availability
per person is very low which
results in low productivity and
low per capita income.
Low per capita income again
results in low savings, low
investment and low capital
formation. Thus
Underdeveloped Countries
(UDCs) are caught in the grip of
vicious circle of poverty.
Lack of capital does not allow an
economy to introduce the latest
technologies. Thus, economy
becomes technologically
backward and internationally in
competitive.
8. Low Level of Human
Development
Human Development Index
(HDI) constructed by United
Nations Development
Programme (UNDP) has
become an important indicator
of development.
INTRODUCTION
Page 17
HDI is a composite index of
three important parameters of
development in education,
health and income.
Every year, in Human
Development Report (HDR)
value of HDI is calculated for
each country and then they are
ranked and classified in to three
categories high, medium and
low human development
countries.
According to the UNDP Global
Human Development Index
(HDI) 2018, India is ranked
130th among 189 countries.
9. Balance of Payments (BoP)
BoP is the systematic record of
all economic transactions like
trade of goods, trade of services,
unilateral transfers, foreign
investment, etc. between a
country and rest of the world.
BoP of a country is also an
indicator of development or
underdevelopment of the
country.
BoP of UDCs like India shows
that these countries export
primary (agricultural) products
and raw material and import
final products and technologies
from developed countries.
They invite foreign capital to fill
their investment deficiency.
India’s BoP is generally
unfavourable i.e., it faces deficit.
To fill this deficit it has to
borrow from other countries
and international organisations
like IMF, World Bank, ADB, etc.
In lieu of loans, these
organisations interfere in
important policy matters and
impose their terms and
conditions.
Lowest forest cover state in
India Haryana
INTRODUCTION
Page 18
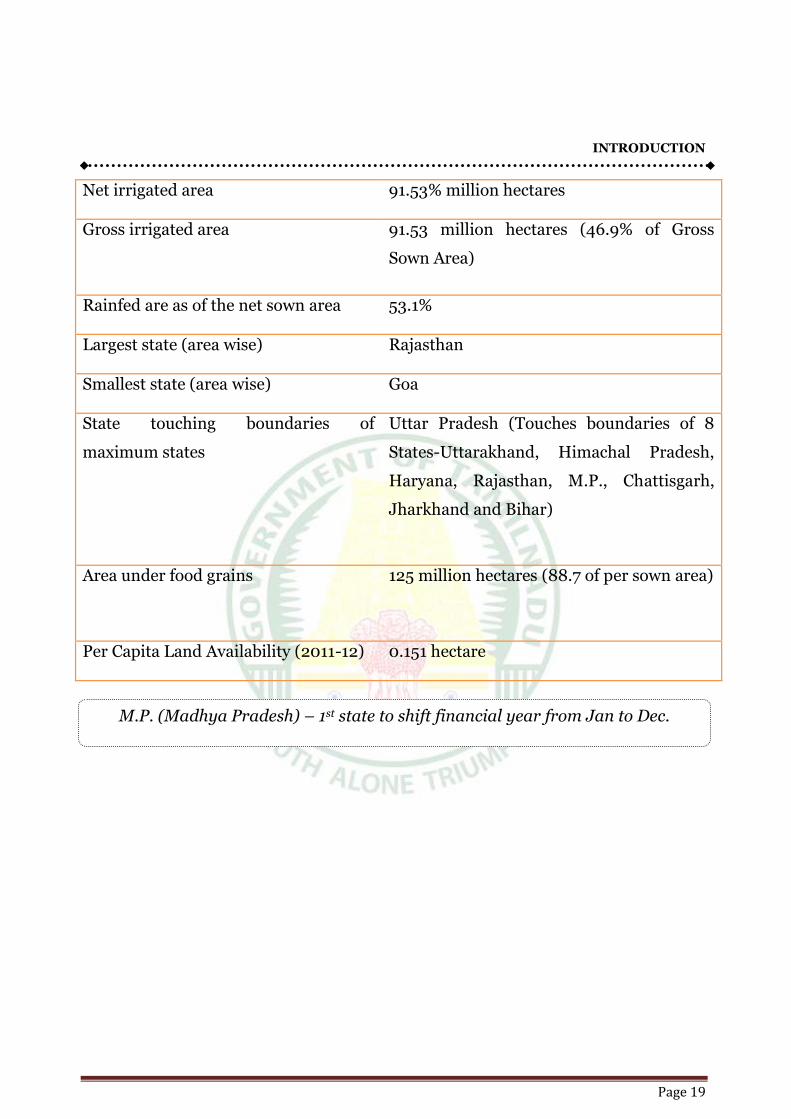
AREA
Total area of the country 3287263 sq.km
Percentage of world area 2.42 per cent (7th Place)
Forest & tree cover area 782871 sp.km (23.81% of the total area)
Total forest cover area (including 4662
km2 area under geographical area)
692027 sq.km. (21.05% of the total
mangroves)
Agricultural land / cultivable land /
Arable land (2011-12)
191.98 million hectares
Cultivated Land (2013-14) 142.60 million hectares
New sown area (2011-12) 140.80 million hectares
Cropping Intensity (2013-14) 135.1%
INTRODUCTION
Page 19
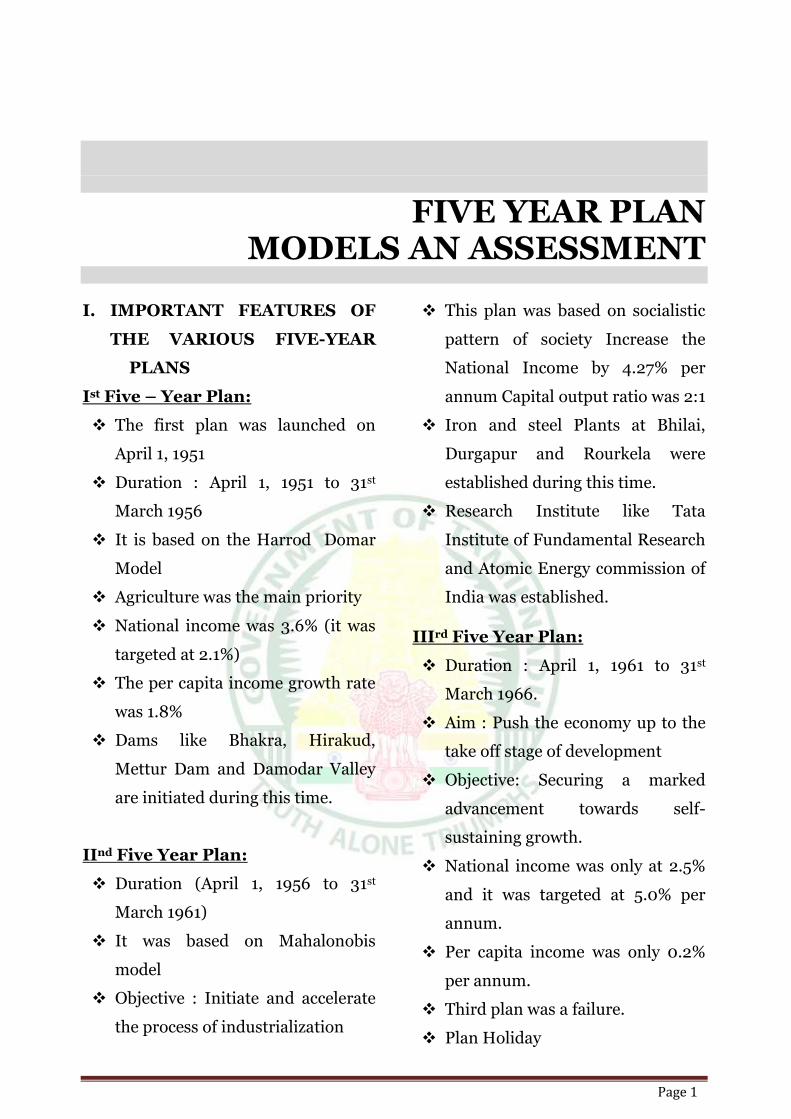
Net irrigated area 91.53% million hectares
Gross irrigated area 91.53 million hectares (46.9% of Gross
Sown Area)
Rainfed are as of the net sown area 53.1%
Largest state (area wise) Rajasthan
Smallest state (area wise) Goa
State touching boundaries of
maximum states
Uttar Pradesh (Touches boundaries of 8
States-Uttarakhand, Himachal Pradesh,
Haryana, Rajasthan, M.P., Chattisgarh,
Jharkhand and Bihar)
Area under food grains 125 million hectares (88.7 of per sown area)
Per Capita Land Availability (2011-12) 0.151 hectare
M.P. (Madhya Pradesh) – 1st state to shift financial year from Jan to Dec.
FIVE YEAR PLAN MODELS AN ASSESSMENT
Page 1
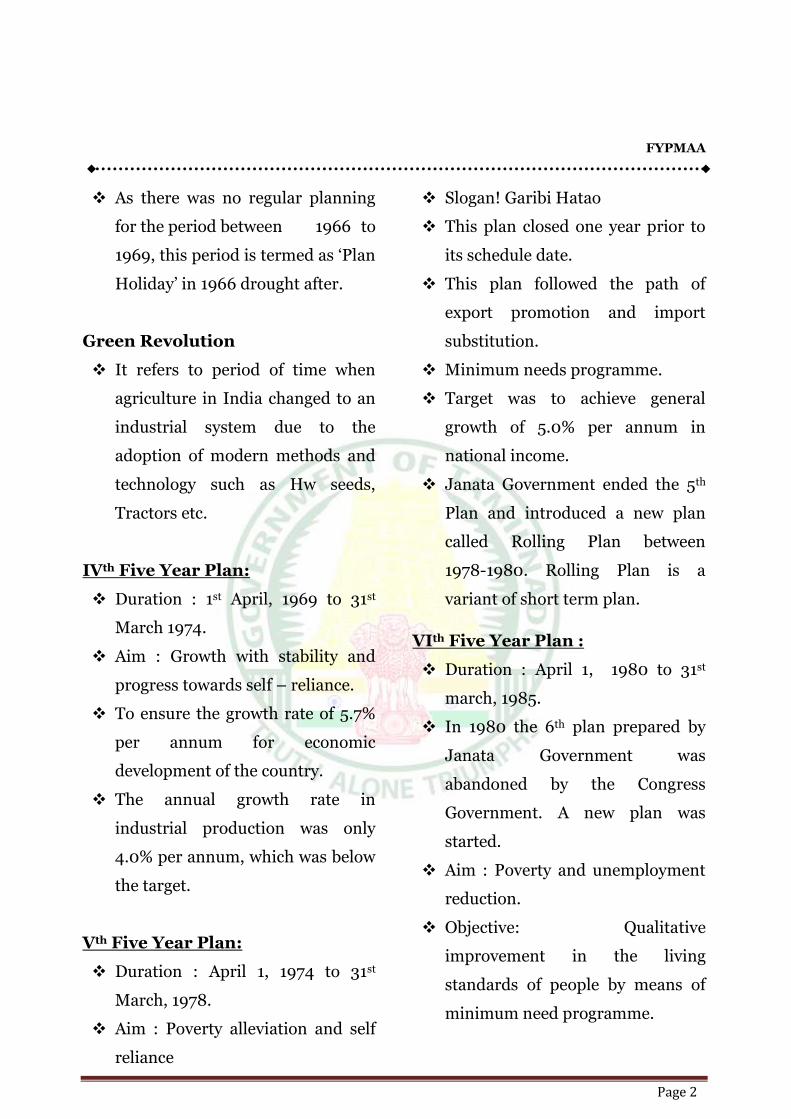
I. IMPORTANT FEATURES OF
THE VARIOUS FIVE-YEAR
PLANS
Ist Five – Year Plan:
The first plan was launched on
April 1, 1951
Duration : April 1, 1951 to 31st
March 1956
It is based on the Harrod Domar
Model
Agriculture was the main priority
National income was 3.6% (it was
targeted at 2.1%)
The per capita income growth rate
was 1.8%
Dams like Bhakra, Hirakud,
Mettur Dam and Damodar Valley
are initiated during this time.
IInd Five Year Plan:
Duration (April 1, 1956 to 31st
March 1961)
It was based on Mahalonobis
model
Objective : Initiate and accelerate
the process of industrialization
This plan was based on socialistic
pattern of society Increase the
National Income by 4.27% per
annum Capital output ratio was 2:1
Iron and steel Plants at Bhilai,
Durgapur and Rourkela were
established during this time.
Research Institute like Tata
Institute of Fundamental Research
and Atomic Energy commission of
India was established.
IIIrd Five Year Plan:
Duration : April 1, 1961 to 31st
March 1966.
Aim : Push the economy up to the
take off stage of development
Objective: Securing a marked
advancement towards self-
sustaining growth.
National income was only at 2.5%
and it was targeted at 5.0% per
annum.
Per capita income was only 0.2%
per annum.
Third plan was a failure.
Plan Holiday
FYPMAA
Page 2
As there was no regular planning
for the period between 1966 to
1969, this period is termed as ‘Plan
Holiday’ in 1966 drought after.
Green Revolution
It refers to period of time when
agriculture in India changed to an
industrial system due to the
adoption of modern methods and
technology such as Hw seeds,
Tractors etc.
IVth Five Year Plan:
Duration : 1st April, 1969 to 31st
March 1974.
Aim : Growth with stability and
progress towards self – reliance.
To ensure the growth rate of 5.7%
per annum for economic
development of the country.
The annual growth rate in
industrial production was only
4.0% per annum, which was below
the target.
Vth Five Year Plan:
Duration : April 1, 1974 to 31st
March, 1978.
Aim : Poverty alleviation and self
reliance
Slogan! Garibi Hatao
This plan closed one year prior to
its schedule date.
This plan followed the path of
export promotion and import
substitution.
Minimum needs programme.
Target was to achieve general
growth of 5.0% per annum in
national income.
Janata Government ended the 5th
Plan and introduced a new plan
called Rolling Plan between
1978-1980. Rolling Plan is a
variant of short term plan.
VIth Five Year Plan :
Duration : April 1, 1980 to 31st
march, 1985.
In 1980 the 6th plan prepared by
Janata Government was
abandoned by the Congress
Government. A new plan was
started.
Aim : Poverty and unemployment
reduction.
Objective: Qualitative
improvement in the living
standards of people by means of
minimum need programme.
FYPMAA
Page 3
The targeted growth rate was 5.2%
per annum.
The actual attained growth rate
was 5.3% per annum.
VIIth Five Year Plan:
Duration : April 1st, 1985 to 31st
March, 1990.
Aim : Growth, modernization, self-
reliance and social justice.
Increased employment
opportunity
Targeted growth rate was 5.0% per
annum
Actual growth rate of the N.I. was
5.9%
The growth rate of per capita
income was 3.7%.
Annual plan (1990-91, 1991-92)
New Industrial Policy – 1991
initiated.
VIIIth Five Year Plan:
Duration : April 1, 1992 to 31st
march, 1997.
Aim : Human Development in
various aspects.
Target : Full employment by the
end of this century.
The annual growth rate in 8th plan
was targeted to be 5.6% however,
the annual growth rate of NNP at
factor cost was estimated at 6.7%.
IXth Five Year Plan:
Duration : April 1, 1997 to 31st
March 2002.
Aim : Growth with equity and
distributive social justice.
To create employment and ensure
food security
Basic Minimum Service
To control population growth
The annual growth rate of total
GDP at factor cost was 5.5%.
Xth Five Year Plan:
Duration : April 1, 2002 to 31st
March 2007.
Reduction of poverty ratio to 20%
Universal access to primary
education
Compulsory elementary education
(SSA 2002).
Reduction in the decadal rate of
population growth between 2001
and 2011 to 16.2%
Increase in the literacy rate to 72%
by 2007
Reduction of IMR to 45
Reduction of MMR to 2 per 1000
live births
Increase in the forest and trees
cover to 25%
Cleaning all major polluted rivers
FYPMAA
Page 4
Domestic saving rate : 26.84% (of
GDP)
Current Account Deficit : 1.57% (of
GDP)
Investment Rate : 28.141% (of
GDP)
Incremental Capital Output Ratio
(ICOR) actual 4.3
GDP Growth Rate : 7.6%
XIth Five Year Plan (Described as
National Educational Plan)
Planning Commission on October
19, 2006 approved the Approach
Paper of the 11th Plan (2007-2012),
which proposes a target of 9%
yearly growth rate during the plan
and also set a 10% economic
growth by the end of the plan (i.e.
by 2012).
Agriculture occupies a special
treatment in the XI Plan approach
paper.
It aims to achieve 4% growth from
the X Plan growth of less than 2%.
XI plan is described as ‘A National
Education Plan’.
Targets for XIth Plan
1. GDP growth rate to be increased
to 10 percent by the end of the
plan.
2. Farm sector growth to be
increased to 4 percent from 2.13%
in X plan.
3. Create 7 crore new jobs.
4. Reduce educated unemployment
rate to below 5%.
5. Reduce dropout rate of school
children to 20% from 52% now
6. Literacy rate to be increased to
80%.
7. Infant mortality rate to be
reduced to 28 per 1,000 births.
8. Maternal mortality rate to be cut
to 1 per 1,000 births.
9. Clean drinking water to all by
2009.
10. Improve sex ratio to 935 by 2011-
12 and 950 by 2016-17.
11. Electricity connection to all by
2009.
12. A telephone in every village by
November 2007.
13. Broadband connectivity to all
villages by 2011-12.
14. Roads to all villages with 1,000
population by 2009.
15. Increase forest cover and tree
cover by 5 percent.
16. Achieve WHO standard air
quality in major cites by 2011-12.
FYPMAA
Page 5
17. Treat all urban wastewater by
2011-12 to clear rivers.
18. Double per capital income by
2016-17.
19. Saving rate 34.8%
20. Investment rate 36.7%
XII th Year Plan (2012-2017)
The Twelfth Plan is titled “Faster,
more inclusive and sustainable
growth”. The plan came into
operation after being approved by
the NDC on December 27, 2012.
Targets under Twelfth Plan
Economic Growth
Real GDP Growth Rate of 8.2%
Agriculture Growth Rate of 4.0%
Manufacturing Growth Rate of
10.0%
Every state must have a higher
average growth rate in the Twelfth
Plan than that achieved in the
Eleventh Plan.
Poverty and employment
Head-count ratio of consumption
poverty to be reduced by 10
percentage points over the
preceding estimates by the end of
Twelfth Five Year Plan.
Generate 50 million new work
opportunities in the non-farm
sector and provide skill certification
to equivalent numbers during the
Twelfth Five Year Plan.
Education
Mean years of schooling to increase
to seven years by the end of Twelfth
Five Year Plan.
Enhance access to higher education
by creating two million additional
seats in higher level institutions.
Eliminate gender and social gap in
school enrolment (that is, between
girls and boys and between SCs,
STs, Muslims and the rest of the
population) by the end of Twelfth
Five Year Plan.
Health
Reduce IMR to 25 and MMR to 1
per 1000 live births and improve
Child Sex Ratio (0-6 years), to 950
by the end of the Twelfth Five Year
Plan.
Reduce Total Fertility Rate to 2.1 by
the end of Twelfth Five Year Plan.
Reduce under-nutrition among
children aged 0-3 years to half of
the National Family Health Survey-
3 levels by the end of Twelfth Five
Year Plan.
FYPMAA
Page 6
Infrastructure, including Rural
Infrastructure
Increase investment in
infrastructure as a percentage of
GDP to 9% by the end of Twelfth
Five Year Plan.
Increase the Gross Irrigated Area
from 90 million hectare to 103
million hectare by the end of
Twelfth Five Year Plan.
Provide electricity to all villages by
the end of Twelfth Five Year Plan.
Connect all villages with all-weather
roads by the end of Twelfth Five
Year Plan.
Upgrade national and state
highways to the minimum two-lane
standard by the end of Twelfth Five
Year Plan.
Complete Eastern and Western
Dedicated Freight Corridors by the
end of Twelfth Five Year Plan.
Increase rural tele-density to 70%
by the end of Twelfth Five Year
Plan.
Ensure 50% of rural population has
access to 55 Litres Per Capita per
Day piped drinking water supply
and 50% of Gram Panchayats,
achieve the Nirmal Gram Status by
the end of Twelfth Five Year Plan.
Environment and Sustainability
Increase green cover (as measured
by satellite imagery) by 1 million
hectare every year during the
Twelfth Five Year Plan.
Add 30000 MW of renewable
energy capacity in the Twelfth Plan.
Reduce emission intensity of GDP
in line with the target of 20% to
25% reduction by 2020 over 2005
levels.
Service Delivery
Provide access to banking services
to 90% Indian households by the
end of Twelfth Five Year Plan.
Major subsidies and Welfare related
beneficiary payments to be shifted
to a direct cash transfer by the end
of the Twelfth Five Year Plan, using
the Aadhar Platform with linked
bank accounts.
Sixth Five year plan (1980-85) marked the beginning
of economic liberalisation.
FYPMAA
Page 7
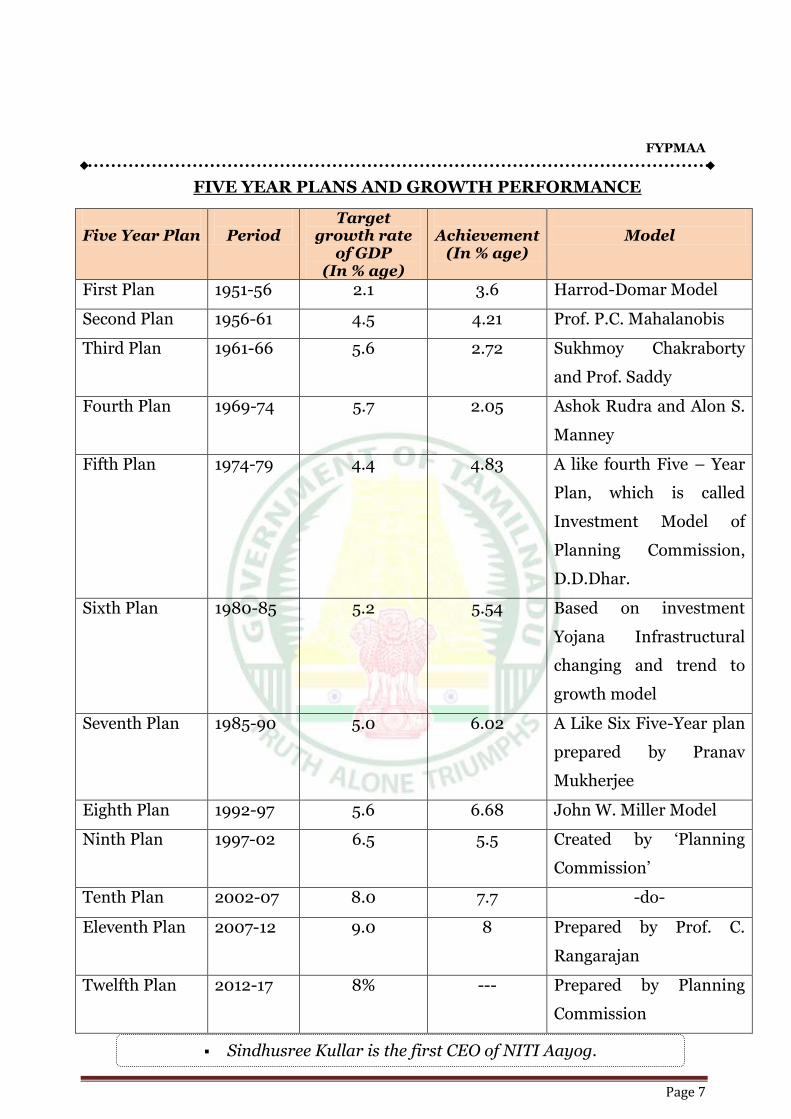
FIVE YEAR PLANS AND GROWTH PERFORMANCE
Five Year Plan
Period
Target growth rate
of GDP (In % age)
Achievement
(In % age)
Model
First Plan 1951-56 2.1 3.6 Harrod-Domar Model
Second Plan 1956-61 4.5 4.21 Prof. P.C. Mahalanobis
Third Plan 1961-66 5.6 2.72 Sukhmoy Chakraborty
and Prof. Saddy
Fourth Plan 1969-74 5.7 2.05 Ashok Rudra and Alon S.
Manney
Fifth Plan 1974-79 4.4 4.83 A like fourth Five – Year
Plan, which is called
Investment Model of
Planning Commission,
D.D.Dhar.
Sixth Plan 1980-85 5.2 5.54 Based on investment
Yojana Infrastructural
changing and trend to
growth model
Seventh Plan 1985-90 5.0 6.02 A Like Six Five-Year plan
prepared by Pranav
Mukherjee
Eighth Plan 1992-97 5.6 6.68 John W. Miller Model
Ninth Plan 1997-02 6.5 5.5 Created by ‘Planning
Commission’
Tenth Plan 2002-07 8.0 7.7 -do-
Eleventh Plan 2007-12 9.0 8 Prepared by Prof. C.
Rangarajan
Twelfth Plan 2012-17 8% --- Prepared by Planning
Commission
Sindhusree Kullar is the first CEO of NITI Aayog.
FYPMAA
Page 8
II. INDIA VISION – 2020
Planning Commission had
released India Vision – 2020
on January 23, 2003.
Which represents pre-assessment
of the progress of Indian Economy
for the next two decades.
Mr. Shyam Prasad Gupta, a
member of planning commission,
prepared this document.
The Salient points of the document
are :
The expected annual growth rate by
2020 to be 9%
Elimination of unemployment,
illiteracy and poverty by 2020
1.35 billion Population of the
country to have better living
standard by 2020.
Per capital income to get doubled by
2020.
Environment situation to remain as
unbalanced as present.
With 2% annual employment
generation rate, 20 Crore new
employment opportunities to be
created by 2020.
Employment share in agriculture to
come down from present 56 to 40 %
by 2020.
Unorganized sector to create more
additional employment
opportunities.
Urban population percentage to get
increased from existing 25% to 40%
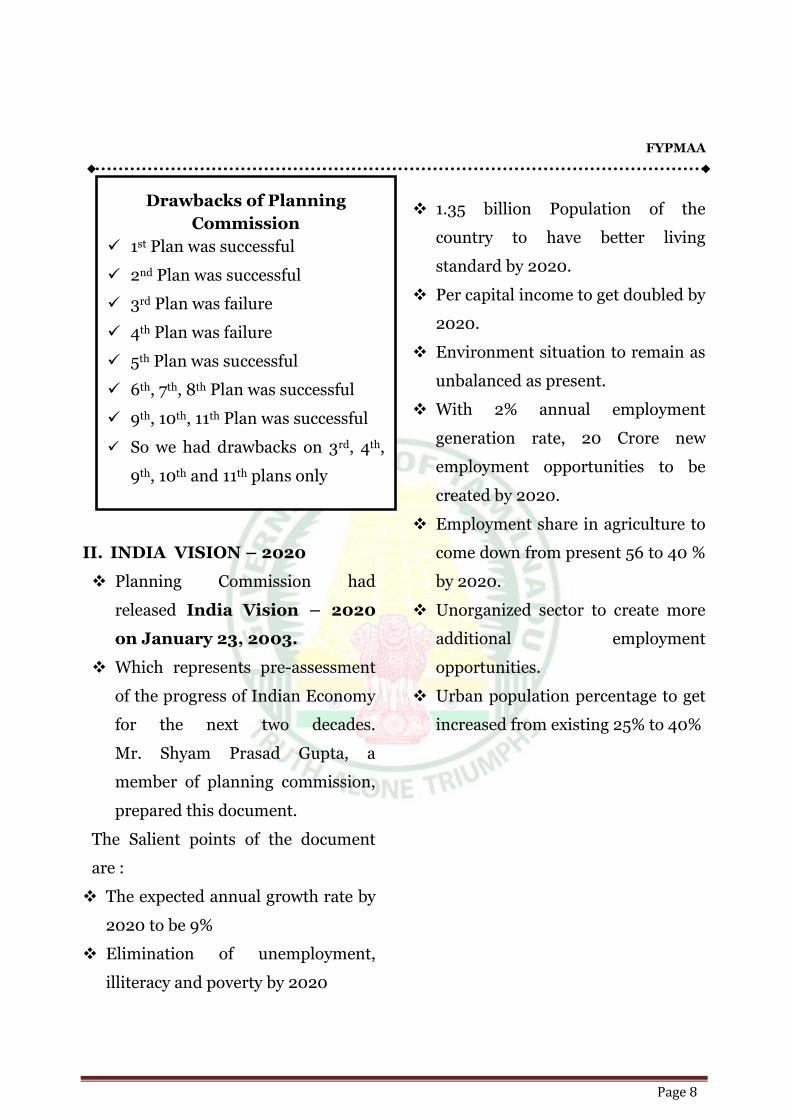
Drawbacks of Planning
Commission
1st Plan was successful
2nd Plan was successful
3rd Plan was failure
4th Plan was failure
5th Plan was successful
6th, 7th, 8th Plan was successful
9th, 10th, 11th Plan was successful
So we had drawbacks on 3rd, 4th,
9th, 10th and 11th plans only
LAND REFORMS AND AGRICULTURE
Page 1
Agriculture:
Agriculture is the backbone of our
economic system.
Agriculture has been the major
source of livelihood in the Indian
economy. (nearly 55 -60 % of the
people engaged in this sector )
India is primarily an agricultural
country.
Agriculture is not only the biggest
sector of the Indian economy but
also the most free private
sector, too.
It is the only profession which still
carries no burden of individual
income tax.
This is the biggest unorganised
sector of the economy accounting
for more than 90 per cent share in
the total unorganised labour-force
(93 per cent of the total labour force
of the economy i.e. 39.7 crores, is
employed in the unorganised
sector).
Importance of National Income:
Agriculture contributes even now a
major share of the national income
in India.
The main source of livelihood is
agriculture.
Provider of Employment
I provider direct and Indirect
Employment
Agriculture provides raw materials
to the industries.
Indian agriculture plays an
important vital role in the country’s
international trade.
Capital Formation and Investment
The major part of production assets
of the country is in the form of
agricultural assets like land,
irrigation facilities, tractors,
agriculture implements,
ploughs, pump sets and storages.
In India, agriculture meets almost
the entire food requirements of the
people.
LAND REFORMS & AGRICULUTRE
Page 2
Agriculture is the backbone of the
Indian economy and prosperity of
agriculture can also largely stand for
the prosperity of the Indian
economy.
International Ranking At the global
level, Indian agriculture has ranked
in certain commodities
Contribution of Agriculture to
Economic Growth:
They are:
Product contribution i.e., making
available food and raw materials.
Market contribution i.e., providing
the market for producer goods and
consumer goods produced in the
non-agricultural sector.
Factor contribution i.e., making
available labour and capital to
the non-agricultural sector and
Foreign Exchange contribution
Land Reforms :
Land reforms refer to all kinds of
policy-induced changes relating
to the ownership, tenancy and
management of land.
Objectives of land reforms in
India :
In India the land reform
programme has been one of the
major policies for rural
development.
The major objectives of land
reforms are as follows:
Restructuring of agrarian
relation to achieve egalitarian
social structure.
Elimination of exploitation in
land relations
Actualization of the goal of ‘land
to the tiller’
Improvement of socio-economic
conditions of the rural poor by
widening their land base.
Increasing agricultural
production and productivity
Facilitating land based
development of rural poor
Infusion of a greater measure of
equality in local institutions.
To realise the objectives of the
land reforms, the government
took three main steps which had
many internal sub-steps:
I. Abolition of Intermediaries :
Under this step, the age-old
exploitative land tenure systems
Total agricultural land in the world -7.5%
LAND REFORMS & AGRICULUTRE
Page 3
of the Zamindari, Mahalwari
and Ryotwari were fully
abolished.
II. Tenancy Reforms :
Under this broader step, three
inter-related reforms protecting
the land tenants were effected.
Regulation of rent so that a fixed
and rational rate of rent could be
paid by the share-croppers to the
land owners
Security of tenure so that a
share-cropper could be feel
secure about his future income
and his economic security and
ownership rights to tenants so
that the landless masses (i.e. the
tenants, the share-
croppers) could be transferred
the final rights for the land they
plough - “land to the tillers”.
III. Land ceiling
Consolidation land holding and
cooperative farming
Cropping Pattern in India:
Cropping pattern means the
proportion of area under
different crops at a point of time.
In other words, it means a ratio
of different crops cultivated at a
particular time.
A change in cropping pattern
implies a change in
the proportion of area under
different crops.
Important Crops:
Total agricultural land – out of
100% - food crops -74% , cash
crops -26%.
Food crops - rice , wheat , maize,
bajra
Beverage crops - coffee , tea
Fiber crops - jute, cotton
Oil seeds - groundnuts,
sunflower
Narcotic crops - tobacco
Plantation crop - tea, coffee,
rubber
Sugar crops - sugarcane, beet
root
Spice crops - mirchi, turmeric,
ginger, pepper
Horticultural crops - all types of
fruits
Major Producer of the Crops in
India
Onion - Maharastha, Madhya
Pradesh, Karnataka
Potato - Uttar Pradesh, West
Bengal, Bihar.
Tomato -Bihar, Karnataka, Uttar
Pradesh
LAND REFORMS & AGRICULUTRE
Page 4
Top Vegetable Producing States
of India
West Bengal
Uttar Pradesh
Bihar
Top Cereal producing States of
India
Uttar Pradesh
Punjab
Madhya Pradesh
Top Food grain Production
Uttar Pradesh
Punjab
Madhya Pradesh
Food Crops
Rice - World wide china tops -
next India, In India - West
Bengal, AP , UP , Punjab.
Wheat - Top -3 China, India,
USA, In India - UP , Punjab,
Harayana.
Jowar - Top - USA , China , In
India - Maharastra, Karanatka,
MP.
Maize - Top - USA, Mexico,
India, in India - AP (Andhra),
Karnataka
Bajra - In India -- Rajasthan,
Maharastra, Gujarat.
Ragi - Top - Karanataka,
Tamilnadu, Andhraprade.sh
Barley - Top - UP, Rajasthan.
Pulses - MP, UP.
Ground nut /Oil seeds -- AP,
Gujarat, Tamilnadu.
Spice crops :
Pepper -- Indonesia, India, In
India -Kerala
Cardamom -- India, Indonesia,
In India -Kerala
Cloves - Tanzania, In India –
Kerala
Turmeric -- India top in the
world , In india - Guntur
Saffron -- India 1st place, In
India - Jammu & Kashmir
Ginger -- India top in the world,
In India - Kerala
Mustard - Rajasthan.
Plantation Crops :
Tea - Top 3 - India, China,Srilanka
In India - Assam, west Bengal,
Tamilnadu
Coffee - top-3 . Santoos , Colombia
Ecuador , India - 5th, In India -
Karnataka
India agriculture contributes almost 4% of GDP
LAND REFORMS & AGRICULUTRE
Page 5
Rubber - TOP -3 -- Thailand ,
Indonesia, India, In India - Kerala,
Tamilnadu, Karnataka
Coconut – Top -3 , Indonesia ,
Philliphines, India - In India --
Kerala, Tamilnadu, Karnataka
Cash crops:
Cashewnut- Maharashtra,
Andhra Pradesh, Odisha.
Jute - West Bengal Bihar Assam
Cotton –Gujarat, Maharashtra
Andhra Pradesh.
Cropping Seasons in India :
Kharif Crops of India Sown in
summers between May and July,
and harvested after the rains, in
September and October.
Eg: Rice, Jowar, Bajra, Maize,
Cotton, Jute, Sugarcane,
Tobacco, Groundnut, Pulses, etc.
Rabi Crops of India Sown at the
beginning of winter and
harvested before the onset of the
summer season, between Feb
and April. Eg: Wheat, barley,
oilseeds, gram, potatoes, etc.
Zaid Crops They are raised
between April and June.
Eg :Melon, watermelon,
cucumber, toris, leafy and other
vegetables.
International Crops Research Institute for the Semi-Arid Tropics
(ICRISAT) -Hyderabad
India’s Ranking in Food Production
India is the largest producer of milk, pulses, livestock, jute, jute like fibres, tea and cauliflower.
India is the second largest producer of wheat, rice, fruit, sugar cane, groundnut and tobacco.
India ranks second worldwide in farm output.
India is also the world’s second or third largest producer of several dry fruits, agriculture-based textile raw materials, roots and tuber crops, pulses, farmed fish, eggs, coconut, sugar cane and numerous vegetables.
India ranked within the world’s five largest producers of over 80% of agricultural produce items, including many cash crops such as coffee and cotton.
India is also one of the world’s five largest producers of livestock and poultry meat.
LAND REFORMS & AGRICULUTRE
Page 6
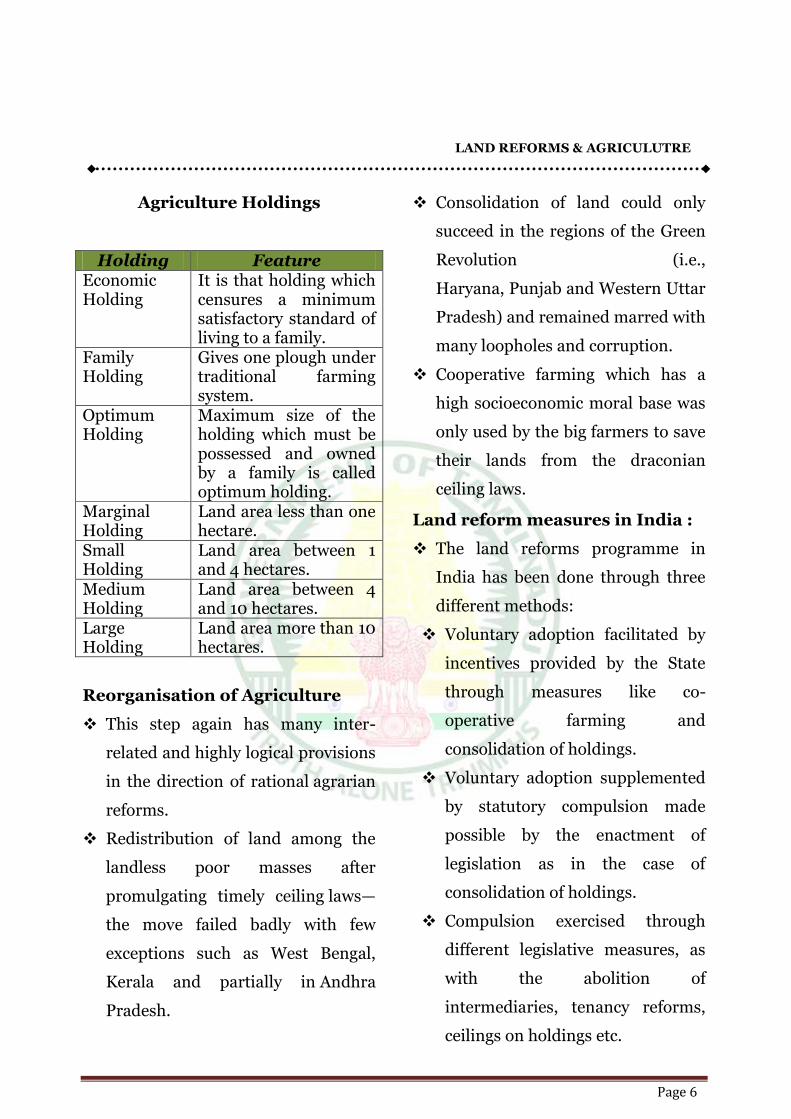
Agriculture Holdings
Holding Feature Economic Holding
It is that holding which censures a minimum satisfactory standard of living to a family.
Family Holding
Gives one plough under traditional farming system.
Optimum Holding
Maximum size of the holding which must be possessed and owned by a family is called optimum holding.
Marginal Holding
Land area less than one hectare.
Small Holding
Land area between 1 and 4 hectares.
Medium Holding
Land area between 4 and 10 hectares.
Large Holding
Land area more than 10 hectares.
Reorganisation of Agriculture
This step again has many inter-
related and highly logical provisions
in the direction of rational agrarian
reforms.
Redistribution of land among the
landless poor masses after
promulgating timely ceiling laws—
the move failed badly with few
exceptions such as West Bengal,
Kerala and partially in Andhra
Pradesh.
Consolidation of land could only
succeed in the regions of the Green
Revolution (i.e.,
Haryana, Punjab and Western Uttar
Pradesh) and remained marred with
many loopholes and corruption.
Cooperative farming which has a
high socioeconomic moral base was
only used by the big farmers to save
their lands from the draconian
ceiling laws.
Land reform measures in India :
The land reforms programme in
India has been done through three
different methods:
Voluntary adoption facilitated by
incentives provided by the State
through measures like co-
operative farming and
consolidation of holdings.
Voluntary adoption supplemented
by statutory compulsion made
possible by the enactment of
legislation as in the case of
consolidation of holdings.
Compulsion exercised through
different legislative measures, as
with the abolition of
intermediaries, tenancy reforms,
ceilings on holdings etc.
LAND REFORMS & AGRICULUTRE
Page 7
PDS :
PDS was envisaged in 1967 to act as
a price support programme for the
consumer during the periods of
food shortage of the 1960’s
The basic aim was to provide
essential commodities like rice,
wheat, sugar, edible oil & kerosene
at subsidised rate to the people to
eliminate poor.
The target public distribution
system (TPDS) was introduced with
effect from June 1997 in order to
make the TPDS more focussed and
targeted towards scheme
contemplates identification of 10
million poor families and providing
then with 35 kg of food grams at Rs.
2 /kg for wheat and Rs 3 / kg for
rice under PDS.
Main Constituents of Public
Distribution System :
Fair Price Shops or Ration Shops
Consumers Co-operative Stores
Shops selling Cloth at Controlled
Prices
Super Bazaars
Kerosene Retailers
Commodities of Distribution
Minimum support prices (MSP) :
It is a minimum price at which
the government will purchase
farmers’ crops—whatever may be
the market price for the crops.
The Government of India started
announcing the MSP in 1967 -68
for wheat which was expanded to
cover many more crops later.
It is declared by government,
normally at the beginning of
sowing season for every
important agricultural
commodity.
If the prices fall below minimum
support prices, government will
buy the entire marketable
surplus at procurement prices.
Procurement prices :
These are the prices which are
declared by government,
generally at the time of harvest
of crops.
These prices are announced by
government on the
recommendations of
Commission for Agricultural
Costs and Prices (CACP),
constituted on 1985.
LAND REFORMS & AGRICULUTRE
Page 8
These prices are widely used by
government for the procurement
of wheat and rice.
Procurement prices are generally
higher than minimum support
prices.
Issue Price
These are the prices at which
food grains are allocated
and supplied by Food
Corporation of India (FCI) to the
states and union territories.
These prices meet the
requirements of public
distribution system.
Prices of goods to be supplied
through fair price shops directly
depend upon issue prices.
Issue prices are normally less
than market prices and higher
than procurement prices.
Retail prices :
Public distribution system is
carried on through the network
of fair price shops (ration shops).
These shops supply essential
consumer goods to households
at the prices fixed by
government. These prices are
known as retail prices.
Retail prices are higher than
issue prices so that the expenses
of public distribution system
may be recovered and the
licensees may get a certain
margin.
Buffer stock operations:
Buffer stock operations refer to
buying and selling of food stocks
by government.
These operations serve two
important purposes:
To regulate and control price
fluctuations within a reasonable
limit.
To enable government to
procure food stocks so that
regular supply of these stocks
may be ensured throughout the
year as well as throughout the
country.
These operations are carried on
by Food Corporation of India
(FCI).
National food security bill :
The National Food Security Bill was
introduced in the Lok Sabha on 22
December, 2011. As per
the provisions of the Bill, it:
LAND REFORMS & AGRICULUTRE
Page 9
It is proposed to provide 7 kg. of
food grains per person per
month belonging to
priority households at prices not
exceeding Rs. 3 per kg of rice,
Rs. 2 per kg of wheat, and Rs. 1
per kg of coarse grains and to
general households not less than
3 kg of food grains per person
per month at prices not
exceeding 50 per cent of the MSP
for wheat and coarse grains and
derived MSP for rice.
Agricultural Price Policy:
Agricultural price policy means a
policy to determine, regulate
and control the prices of
agricultural products.
E-Choupal :
It is an initiative of ITC LIMITED
a conglomerate in India, to link
directly with rural farmers via
the Internet for agricultural
marketing and procurement
of agricultural and aquaculture
products.
TRIFED:
The Government established
TRIFED (Tribal Co-operative
Marketing Development
Federation of India Ltd.) in August
1987 and started functioning in
April 1988.
The basic aim of TRIFED was to
save tribals from exploitation by
private traders and to offer them
remunerative prices for their
minor forest produce and surplus
agriculture products.
NAFED :
NAFED (National Agricultural Co-
operative Marketing Federation of
India Ltd.) has been established
on 2nd October 1958 in co-
operative sector at national level
for marketing of agriculture
products.
Agricultural credit :
Three types of loans are provided
to Indian farmers to meet their
financial requirements—
Short term loans
Medium term loans
Long term loans
India agricultural population - 64%
LAND REFORMS & AGRICULUTRE
Page 10
Short Term Loans:
Short term loans are provided
for a period of less than 15
months to meet out expenses of
routine farming and domestic
consumptions.
This type of loan is demanded by
farmers for purchasing
seeds, fertilizers and for meeting
out family requirements.
Medium Term Loans:
Medium term loans are provided
for a period of 15 months to 5
years to purchase
agricultural equipments, animals
and for land improvements.
Long Term Loans:
Long term loans are provided for
a period of more than 5 years.
This type of loan is taken by
the farmers to purchase land and
expensive agricultural
equipment and for repayment of
old loans.
Irrigation :
The Planning Commission
classifies irrigation
projects/schemes in India on the
following lines :
Major Irrigation Schemes—those
with cultivable command areas
(CCA) more than
10,000 hectares.
Medium Irrigation Schemes—
those with cultivable command
areas (CCA) between 2,000 and
10,000 hectares.
Minor Irrigation Schemes—those
with cultivable command area
(CCA) up to 2,000 hectares.
Agricultural Productivity :
Agricultural productivity is the
ratio of agricultural inputs and
output.
It indicates the efficiency with
which the inputs have been
utilized.
It indicates how much production
has been obtained from a given
amount of inputs.
It can be measured as:
Agricultural Productivity
= Total Production / Amount
of Inputs Employed.
Productivity of Land = Total
Production / Area of Land.
Productivity of Labour = Total
Production / No of Workers
Employed.
LAND REFORMS & AGRICULUTRE
Page 11
Productivity of Capital = Total
Production/ Total Capital
Employed.
Green Revolution
Revolution was a part of new
agricultural strategy, to increase
the food production to eliminate
poverty, which included initially,
the intensive agriculture district
programme (IADD) and later the
high yielding varieties
programme (HYVP)
It was launched in the half of
1960’s it was the branch of
Norman Borlaug, in India it was
made successful by Dr. M. S.
Swaminathan.
The achievement by green
revolution were rise in cereal
production especially wheat and
rice, change in cropping pattern in
favour of wheat and increase in
employment opportunities.
Second Green Revolution :
The call was given by than
PM. Mr. ManMohan Singh at the
93rd science conference in 2006.
The second green revolution
seeks to build up on the
achievements of first green
revolution and bridge the
regional and crop in balance
which were not addressed by
first green revolution.
The second green revolution
seeks to cover dry land farming
and concentrate on the small and
marginal farmers.
It seeks to raise the food grain
production to 400 million
tonnes by 2020.
Evergreen Revolution :
Concept given by renowned
agricultural scientist Dr.
M.S.Swaminathan.
It emphasis on Organic
agriculture and green agriculture
with the help of integrated
nutrient supply and integrated
national resources management.
The cause of the evergreen
resolution is sustainability.
National food security Act 2013
– Tamil Nadu & Kerala are last
to join in their act.
LAND REFORMS & AGRICULUTRE
Page 12
Yellow Revolution
Oil seeds production.
Oil Seeds, Edible Oil , Especially
Mustard.
Father of Yellow Revolution
" Sam Pitroda ".
India occupied first place in
groundnuts.
White Revolution
Milk & milk products.
Father of white revolution -
"Varghese Kurien ".
India occupies world wide - 1st
place - Butter, Ghee, Cheese.
Blue Revolution
Fishes and Marine Products.
Fish production blue revolution
started -- 1960.
Father of Blue Revolution-
"Dr.Arun Krishnan".
Fish & sea foods production
World wide --- China 1st place
India -- 2nd place
In India- 1st place -- west
Bengal, 2nd Gujarat , 3rd -Kerala
Fresh water fish production -
top-2 -- west Bengal,
Andhrapradesh.
Salt water fish production -- top-
2 -- Gujarat , Kerala
Fish most usage state - West
Bengal
Pink Revolution
Prawn, Onions,
Pharmaceutical.
Father of Pink Revolution -
"Durgesh Patel"
Father of Induced Breeding -
"Prof.Hirlal Chaudri"
Leading producer of
pharchemicals - Switzerland,
Germany,USA
India ranks - 6th place
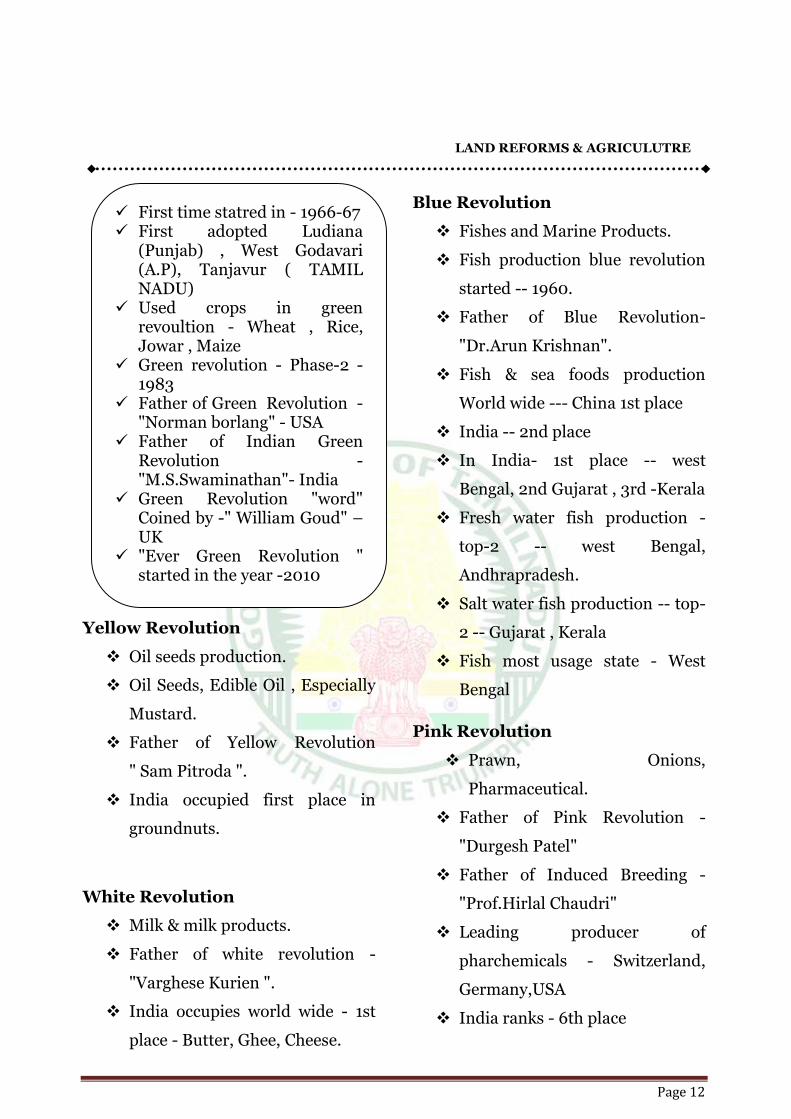
First time statred in - 1966-67 First adopted Ludiana
(Punjab) , West Godavari (A.P), Tanjavur ( TAMIL NADU)
Used crops in green revoultion - Wheat , Rice, Jowar , Maize
Green revolution - Phase-2 - 1983
Father of Green Revolution - "Norman borlang" - USA
Father of Indian Green Revolution -"M.S.Swaminathan"- India
Green Revolution "word" Coined by -" William Goud" – UK
"Ever Green Revolution " started in the year -2010
LAND REFORMS & AGRICULUTRE
Page 13
Grey Revolution
Fertilizers
Brown Revolution
Cocoa, Leather
India placed first in leather
industries
India occupies first in - number
of cows, sheeps
Top beef exporting countries
TOP --> India - 240 mn tonnes,
Brazil , USA
Silver Revolution
Egg (Poultry)
Father of Silver Revolution-
INDIRA
Violet Revolution
Woolen products
Australia - 1st position in wollen
production.
India occupies - 7th position , In
India – Punjab
Black Revolution
Crude oil & non conventional
energy
Red Revolution- Meat &
Tomatoes
Father of Red Revolution-Vishal
Round Revolution - Potato
Russia occupies first place in
potatoes.
Agriculture research centres in
India :
1. Indian Agricultural Research
Institute (IARI)--New Delhi.
2. Central Rice Research Institute -
Cuttack.
3. Central Sugarcane Research
Institute -Coimbatore.
4. National Sugar Research Institute -
Kanpur.
5. Central Tobacco Research Institute
- Rajahmundry.
6. Central Potato Research Institute -
Kufri, Shimla.
7. Central Island Agriculture
Research Institute - Port Blair.
8. Central Institute of Cotton
Research - Nagpur.
9. Central Institute of Agricultural
Engineering - Bhopal.
10. Central Institute of Fisheries
Education - Mumbai.
11. Central Institute of Fishery
Technology - Cochin.
12. Central Institute of Fresh Water
Agriculture - Bhubaneswar.
13. Central Inland Fisheries Research
Institute - Barrackpore.
14. National Institute of Agricultural
Marketing - Jaipur.
15. National Institute of Animal Health
- Baghpat (U.P)
16. Indian Council of Agricultural
Research (ICAR) - New Delhi.
LAND REFORMS & AGRICULUTRE
Page 14
17. Disease Investigation Laboratory -
Pune.
18. Central Soil Salinity Research
Institute - Karnal (Haryana).
19. Indian Instuite of Horticulture -
Bangalore.
20. Wheat Research Institute -
Karnal.
Agricultural Insurance Schemes:
National Agricultural Insurance
Scheme (NAIS): 1999-2000
Comprehensive Crop Insurance
Scheme-CCIS of 1985
Pilot Weather Based Crop
Insurance Scheme (WBCIS): 2007
Krishi Shramik Suraksha Yojana:
2001
Farm Income Insurance Scheme:
2004
Varsha Bima (Rainfall Insurance
Scheme): 2004
Pradhan Mantri Fasal Bima Yojana,
a new crop insurance scheme :
2016
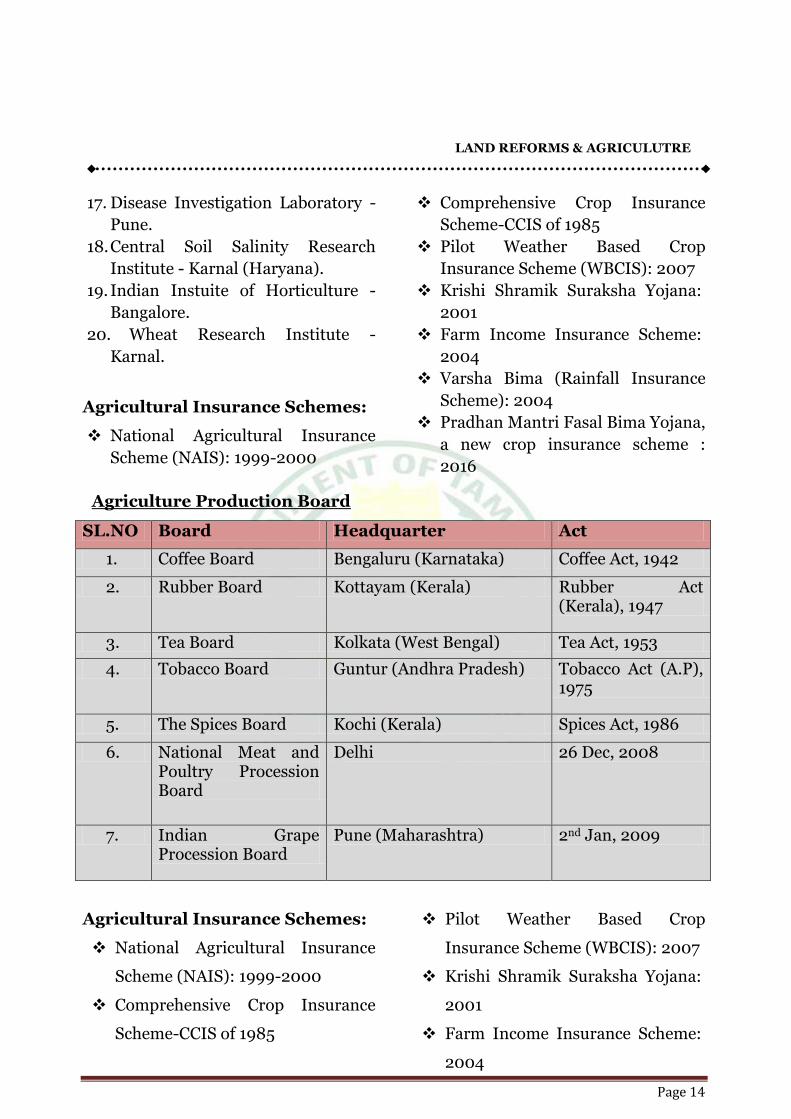
Agriculture Production Board
SL.NO Board Headquarter Act
1. Coffee Board Bengaluru (Karnataka) Coffee Act, 1942
2. Rubber Board Kottayam (Kerala) Rubber Act (Kerala), 1947
3. Tea Board Kolkata (West Bengal) Tea Act, 1953
4. Tobacco Board Guntur (Andhra Pradesh) Tobacco Act (A.P), 1975
5. The Spices Board Kochi (Kerala) Spices Act, 1986
6. National Meat and Poultry Procession Board
Delhi 26 Dec, 2008
7. Indian Grape Procession Board
Pune (Maharashtra) 2nd Jan, 2009
Agricultural Insurance Schemes:
National Agricultural Insurance
Scheme (NAIS): 1999-2000
Comprehensive Crop Insurance
Scheme-CCIS of 1985
Pilot Weather Based Crop
Insurance Scheme (WBCIS): 2007
Krishi Shramik Suraksha Yojana:
2001
Farm Income Insurance Scheme:
2004
LAND REFORMS & AGRICULUTRE
Page 15
Varsha Bima (Rainfall Insurance
Scheme): 2004
Pradhan Mantri Fasal Bima
Yojana, a new crop insurance
scheme : 2016
Agriculture Related Schemes :
Intensive Agriculture
Development Programme
(IADP) - 1960-61 :
The Objective was to provide
loan for seeds and fertilizers to
farmers.
It was started with the assistance
of Ford Foundation.
Also called "Package Program".
Intensive Agriculture Area
programme (IAAP) :(1964-65)
Emphasis should be given to the
development of scientific and
progressive agriculture in an
intensive manner in the areas which
have High production potentials.
The idea was to cover at least 20%
of the cultivated area of the country.
High Yielding Variety seeds
Programmes : (1966-67)
It was launched in the Kharif of
1966-67 with an objective to attain
self-sufficiency in food by 1970-71.
It envisaged the introduction of
High-yielding varieties of seeds
Increased use of fertilizers
Increased irrigation.
These three are collectively as the
Green Revolution.
Command Area Development
Programmes (1974-75)
To bridge narrow the gap between
irrigation potential created and
actually utilized in major and
medium irrigation schemes. It is
renamed as Command Area
Development and Water
Management Programme
(CADWMP) since April 1, 2004.
It has also been amalgamated with
the Accelerated Irrigation Benefit
Programme.
Accelerated Irrigation Benefit
Programme
The Central Government
launched the Accelerated
Irrigation Benefit Programme
(AIBP) from 1996-97 for
extending loan assistance to
states for the completion of near
complete irrigation scheme.
LAND REFORMS & AGRICULUTRE
Page 16
Drought Prone Areas Programme
(DPAP) – 1973 - 74 :
To tackle the special problems
faced by those fragile areas which
are constantly affected by severe
drought conditions.
Financial assistance 50:50 (Centre
and State).
Desert Development Programmer
(DDP) : 1977- 78
To mitigate the adverse effects of
desertification.
Funding - 100% Central
Government.
Integrated Wasteland
Development Programme
(IWDP)
DPAP, DDP and IWDP have been
consolidated as a comprehensive
programme named ‘Integrated
Watershed Management
Programme (IWMP).
Integrated Watershed
Management Programme :
The main objectives of the IWMP
are to restore the ecological
balance by harnessing, conserving
and developing degraded natural
resources such as soil, vegetative
cover and water.
Integrated Watershed
Development Programme (IWDP)
- 1989 :
It was launched under the aegis of
National Wasteland Development
Board for development of
wastelands on watershed basis.
INDUSTRIAL GROWTH
Page 1
Industry refers to an economic
activity concerned with the
processing of raw materials and
manufacture of goods in
factories.
Important of industry:
Rapid growth of national
income.
Industries can provide better
quality of more employment
than agriculture.
Value addition is possible in
industrial sector.
More foreign exchange
generation
Provides goods for the
development of basic
infrastructure of the country
like power telecom etc.
In India, different industries
generate employment
opportunities to nearly 20% of
the population, while their
share in the GDP is 28%.
TYPES OF INDUSTRIES
Basic Goods Industries (include
minerals, fertilizers, cement,
iron and steel, electricity etc.)
Capital Goods Industries
include machinery, machine
tools, rail-road equipment’s
etc.)
Intermediate Goods Industries
(include chemicals, rubber,
plastic, coal and petroleum
products)
Consumer Goods (include
consumer durables and non-
durables like man-made fibres,
beverages, mobile phones,
cosmetics, toiletries, etc.)
CORE INDUSTRIES IN INDIA
These are the industries that
are necessary for
industrialisation of a country.
The Eight Core Industries
comprise nearly 38% of the
weight of items include in the
Index of Industrial Production
(IIP).
INDUSTRY GROWTH
Page 2
Electricity Generation
(weight : 10.32%)
Steel production
(weight : 6.68%)
Petroleum Refinery Production
(weight: 5.94%)
Crude Oil Production
(weight: 5.22%)
Coal Production
(weight: 4.38%)
Cement production
(weight: 2.41%)
Natural Gas production
(weight: 1.71%)
Fertilizer production
(weight: 1.25%)
State-wise Distribution of
Industries
There is a great regional
imbalance in location of various
industries in the country. The
country can be divided into three
regions.
1. Industrially advanced states,
Maharashtra, Gujarat, Tamil
Nadu and West Bengal..
2. Middle – level industrial states;
Andhra Pradesh, Karnataka,
Uttar Pradesh, and Punjab.
3. Industrially backward states;
Rajasthan, Kerala, Haryana,
Orissa, Himachal Pradesh.
Industrial Policies
Industrial Policies were launched
in 1948, 1956, 1977, 1980 and
1991.
The Industrial Policy Resolution
of 1948 marked the beginning of
the evolution of the Indian
Industrial Policy.
The IPR 1956 called the
Economic Constitution of India,
gave the public sector a strategic
role in the economy.
The objective of the IPR 1956 was
establishment of socialistic
pattern of the society in the
country.
Industrial Policy Resolution 1948
It was announced by Minister of
industries and commerce shyama
prasad mulherge.
Salient Features of IPR 1948
Development of mixed economy
State programme for the
development of industries.
Promotion of small and cottage
industries.
Foreign intestine was allowed,
but effective control should be
with industries.
INDUSTRY GROWTH
Page 3
IPR 1956
Described as economic constitution
of India.
Its main objectives were to
accelerate the rate of economic
growth and to speed up industry
nation for achieving a socialistic
pattern of society.
Salient features :
Schedule A (Public sector)
seventeen industries were
exclusively reserved for the public
sector.
Schedule B (Mixed sector) twelve
industries were placed the mixed
sector of public and private
sector. These were to be proselyte
state owned and in which state
would generally set up new units.
Schedule C (private sector) all the
remaining industries and their
future development world in
general be left to the inactive and
enterpriser of the private sector.
IPR 1977:
The thrust of the policy was on
decentranational of the
industries and the promotion of
small scale and cottage
industries.
It introduce the concept of tiny
sector within the small scale
sector
IPR 1980
The policy emphasised the
optimum utilisation of installed
capacity technological up
gradation and moderation.
Monopoly and Restrictive
Trade Practices ( MRTP) Act
1969
MRTP Act was enacted in 1969
and MRTP Commission was
constituted in 1970 to prevent
the concentration of economic
power and to prohibit restrictive
or unfair trade practices.
Under the act companies having
assets beyond the threshold
limit (ie RS. 20 cr in 1985) were
placed under the preview of the
act.
Certain restrictions are imposed
on such companies like prior
approval of the MRTP
commission for establishment of
new undertakings, expansion of
under takings, mergers and
acquisition.
INDUSTRY GROWTH
Page 4
Competition Act 2002
The completion act was enacted
by the government in 2002, on
the recommendation by S.V.S.
Raghavan committee.
If repealed the MRTP Act and the
MRTP commission was placed by
the competition commission of
India.
Objectives of CCI
It encourage completion present
cubes of dominate (rather than
dominance as such) and to
ensure of level playing field for all
the enterprises in the Indian
economy.
Compulsory licensing
(5 industry) :
1. Distillation and brewing of
alcoholic drinks.
2. Cigars and Cigarettes of tobacco
and manufactured tobacco gab
statues
3. Electronic, aerospace and defence
equipments.
4. Industrial explosive including
match boxes.
5. Hazardous chemical : e.g
Hydrocyanic acid, Phosgene,
isocyanates and disocyanetes of
hydrocarbon
Reserved Industry:
1. Atomic energy
2. Railway
3. The substance specified in the
specified in the schedule to the
notification of the GOI in the
Department of Atomic energy
dated March 1995
New Industrial Policy, 1991
Formed the basis for the
economic reforms in India, which
proved to be a watershed in the
history of Indian economy.
The main aim of the new
industrial policy 1991 was to
unshackle the Indian industries
from the cobweb of unnecessary
bureaucratic control to introduce
liberalisation with a view to
integrate Indian economy with
the world economy to remove
restriction on FDI and to abolish
MRTP Act, 1969 and to shed the
load of the public enterprises
Disinvestment Policy
The Industrial Policy Statement
of 24th July, 1991 outlined the
disinvestment of selected PSEs.
INDUSTRY GROWTH
Page 5
Disinvestment is a process,
through which privatisation could
take place
The objective of pursuing
disinvestment in India were
unlocking resources trapped in
non-strategic PSEs, reducing
public debt and transferring
commercial risk to the private
sector.
First Disinvestment Commission
was set-up in 1996, under the
Chairmanship of Mr EV
Ramkrishna, which was later
reconstitute in July, 2001, under
Dr RH Patil.
To shed the load of the excess
workers in the public sector
government mooted with the idea
of Voluntary Retirement Scheme
(VRS). VRS is also called Golden
Hand Shake Scheme.
For this purpose, it had set-up a
National Renewal Fund (NRF) in
1992, which was abolished it in
2000.
Public Sector Enterprises
As on 31st March, 2011, there
were 248 Central Public Sector
Enterprises (CPSEs). Out of 248
CPSEs, 220 were in operation
and 28 were under construction.
To measure the performance of
management of PSEs at the end
of the year in an objective and
transparent manner, the concept
of Memorandum of
Understanding (MoU), on the
recommendation of Arjun
Sengupta Committee (1988), was
started in 1991.
New Company Bill, 2013
Six Decades Old Company Act,
1956 will replace by this act. In
this act, it has been made
mandatory for the companies to
include provisions for social
welfare. Till date, in the 53 years
Old Company Act, 1956 has been
amended 25 times.
For companies having an annual
turnover above Rs. 10 lakh, it has
been made mandatary to appoint
one third independent directors
and at least appointment of one
female director.
MAHARATNA
In 2009, the government
established the Maharatna status,
which raised the PSEs investment
INDUSTRY GROWTH
Page 6
ceiling from Rs. 1000 crore to Rs.
5000 crore.
The Maharatnas firm can now
decide on investments of upto
15% of their net worth.
Criteria for Maharatna
The six criteria for eligibility of
Maharatna are having Navratna
status.
Listed on Indian stock exchange
an average annual turnover of
more than Rs. 28000 crore
during the last three years.
An average annual net worth of
more than Rs. 10000 crore
during the last three years.
An average annual net profit after
tax of more than Rs. 2500 crore
during the last 3 years and should
have significant global presence.
List of Maharatna
There are seven Maharatnas in India
1. Oil and Natural Gas Corporation
(ONGC)
2. Gas Authority of India limited
(GAIL)
3. Steel Authority India Limited
(SAIL)
4. Indian Oil Corporation (IOC)
5. National Thermal Power
Corporation (NTPC)
6. Coal India Limited (CIL)
7. Bharat Heavy Electricals Limited
(BHEL)
NAVARATNA
To be qualified as a Navratna
Company
The company must obtain a score
of 60 (of the total 100)
The score is based on six
parameters, which included net
profit to net worth, total
manpower cost to total cost of
production, Profit before
Depreciation, Interest and Taxes
(PBDIT) to capital employed,
PBDIT to turnover, Earning per
share and inter-sectoral
performance.
The company must first be a
Miniratna-I and must have four
independent directors on its
board. The Navratna status
empowers a company to invest
upto Rs.1000 crore or 15% of
their net worth overseas without
government approval.
At present, there are 17
Navratnas.
INDUSTRY GROWTH
Page 7
List of Navratna
1. Bharat Electronics Limited
2. Bharat Petroleum Corporation
Limited
3. Hindustan Aeronautics Limited
4. Hindustan Petroleum
Corporation Limited
5. Mahanagar Telephone Nigam
Limited
6. National Aluminium Company
Limited
7. National Mineral Development
Corporation
8. Neyveli Ligmite Corporation
Limited
9. Oil India Limited
10. Power Finance Corporation
Limited
11. Power Grid Corporation of India
Limited
12. Rashtriya Ispat Nigam Limited
13. Rural Electrification Corporation
Limited
14. Shipping Corporation of India
Limited
15. Engineers India Limited
16. National Building Construction
Corporation Limited
17. Container Corporation of India
Limited
MINIRATNA
Miniratna Category I
Public Sector Enterprises (PSEs)
that have made profit
continuously for the last three
years or earned a net profit of Rs.
30 crores or more in one of three
years.
At present, there are 54
Miniratna I.
Miniratna Category II
PSEs that have made profit for
the 1st three years and should
have a positive net worth. At
present, there are 18 Miniratna
II.
Sick Industries
A sick unit is one, which is in
existence for at least 5 years and 15%
of its net worth has eroded
To combat industrial sickness
particularly with regard to the crucial
sectors and timely detection of sick
and potentially sick industrial
companies, Sick industrial
Companies Act, (1985) was enacted.
SICA provisions were extended to
public enterprises in 1993 so as to
enable public sector enterprises to be
referred to a quasi-judicial body
Board of Industrial and Finance
Reconstruction (BIFR) to take
appropriate measures for revival and
rehabilitation.
INDUSTRY GROWTH
Page 8
Small-Scale Industries
A new thrust in favour of small
scale industries was given in the
Industrial Policy Resolution of
1977.
With effect from 2nd October,
2006 government enacted the
Micro, Small and Medium
Enterprises Development Act.
The MSME Act, 2006, clearly
defines, for the first time, not
only the medium enterprises but
also extends it to the services
sector too according to the Fourth
Census (2009) of the MSME
sector, 67% are manufacturing
and 33% services enterprises.
MSME sector contributes 8% to
the GDP, 45% to the
manufactured output, 40% to the
exports and provides
employment to 42 million people.
SIDBI (Small Industries
Development Bank of India) is a
independent financial institution
to finance the growth of MSME’s.
Abid Hussain Committee was set-
up to look into the problems of
small-scale industries.
Micro, Small and Medium
Enterprises Policy, 2012
The policy was notified in March,
2012. The policy envisages that
every Central Ministry / PSU
shall set an annual goal for
procurement from the MSE
sector with the objective of
achieving minimum 20% of the
total annual purchase from
MSEs in a period of 3 years.
Enterprise Manufacturing Sector Service Sector
Large Enterprise Investment in Plant and machinery
Investment in Equipment’s
Micro Enterprises Does not exceed Rs.25 lakh Dose not exceed Rs.10 lakh
Small Enterprises More than Rs.25 lakh, but does not exceed Rs.5 crore
More than Rs.10 lakh rupees, but does not exceed Rs.2 crore
Medium Enterprises
More than Rs.5 crore, but does not exceed Rs.10 crore
More than Rs.2 crore, but does not exceed Rs.5crore
INDUSTRY GROWTH
Page 9
LARGE SCALE INDUSTRIES
Iron and Steel Industry
First steel industry at Kulti,
Paschim Banga-Bengal Iron
Works Company was established
in 1870. First large ‘scale steel
plant-TISCO at Jamshedpur
(1907) was followed by ISCO at
Burnpur (1919)
The first public-owned steel plant
was Rourkela Integrated Steel
Plant set-up in 1954 with the help
of German Kampp-Demag.
India is the fourth largest
producer of crude steel in the
world after China, Japan and the
USA in 2010. In 2009, India was
ranked third.
India is the largest producer of
sponge iron since 2002.
Steel Authority of India Limited
(SAIL) was established in 1974
for the development of the steel
industry.
Iron and Steel Plants in India
Location Assistance
Rourkela (Odisha) Germany
Bhiulai(Chhatisgarh) Russia
Durgapur (Paschim
Banga) West Bengal
Britian
Bokaro (Jharkhand) Russia
Vishakhapatnam
(Andhra Pradesh)
Russia
Cotton and Synthetic Textile
Industry
It is the largest industry in India
accounting for about 20% of
industrial output, provides
employment to 20 million
persons and contributes 33% to
total export earnings. The first
Indian modernised cotton cloth
mill was established in 1818 at
fort Gloster near Kolkata, but this
was unsuccessful.
The second mill was established
in 1854 at Bombay by KGN
Daber.
The share of cotton in total cloth
production declined from 65% to
50% in 2009-10. Whereas, that of
fabrics rose from 27% to 50%
The organised textile industry
comprises of (i) spinning mills;
(ii) coarse and medium
composite mills and (iii) fine and
superfine composite mills.
Jute Industry
Jute industry was started in 1856
at Rishra and India is the largest
INDUSTRY GROWTH
Page 10
producer and second largest
exporter of jute in the world. Jute
Technology Mission was
launched 2nd June, 2006.
Government has enacted jute
Packing Materials (compulsory
use in packing commodities) Act,
1997 to broaden the usage of jute.
Gems and Jewellery
Gems and jewellery is an
important emerging sector in the
Indian economy. According to the
date released by the World Gold
Council (WGC), India is the
largest consumer of gold.
India (especially, Surat and
Mumbai) ranks among the ‘big
four’ diamond cutting centres of
the world, the other three being,
Belgium (Antwerp), the USA
(New York) and Israel (Ramat
Gan).
Paper Industry
Paper Industry in India is the 15th
largest paper industry in the
world. It provides employment to
nearly 1.5 million people and
contributes Rs.25 billion to the
government Skitty.
The first paper mill in India was
set up at Sreerampur, Paschim
Banga, in the year of 1862.
On the basis of raw material,
paper industry divided into three
parts
1. Wood based industry
2. Waste paper based industry
3. Agro based industry
TNPL
It was established by Government
of Tamilnadu to produce
Newsprint and writing paper
using Bagasse, a sugarcane
residue.
The factory is situated at
Kagithapuram in Karur district,
Tamilnadu.
Silk Industry
India is the second largest (after
China) silk manufacturer
contributing to 18% of the total
raw silk production.
The majority of silk is produced
mainly in Bhoodan Pochampally
(also known as silk city),
Kanchipuram, Dharamvaram and
Mysore.
INDUSTRY GROWTH
Page 11
Sugar Industry
India is the largest producer of
sugar in the world with a 22%
share.
It is the second largest agro-
based industry in the country.
BB Mahajan Committee was set-
up to study the sugar industry.
The Sugar Development Fund
was set-up in 1982, under the
Sugar Cess Act.
Dual price mechanism with
partial control is applied to sugar
industry. Under this, the
government fixes the ratio of and
free sale sugar quota in the ration
28:72.
Cement Industry
The foundation of stable Indian
cement industry was laid in 1914,
when the Indian Cement
Company Limited manufactured
cement at Porbandar in Gujarat.
India is the second largest
producer of cement in the world.
The per capita consumption of
cement in India is just 68 kg.
Petrochemical Industry
The real thrust to this industry
came with the establishment of
Indian Petrochemical
Corporation Limited at Baroda.
Petrochemical industry mainly
comprises synthetic fibres,
polymers, elastomers, detergents
and performance plastics.
The main source of feedstock and
fuel to this industry are natural
gas and naphtha
Kapur Committee was set-up to
identify and support the growth
of basic petrochemical and their
end.
Fertilizer Industry
The first fertilizer industry was
set-up in 1906, in Ranipet near
Chennai.
Indian meets 85% of its urea
requirement through indigenous
production, but is largely import
dependent for meeting the
demand for phosphorus (90%)
and potassium fertilizer (20%).
India is the third largest producer
of fertilizer after China and USA
and second largest consumer
after China. Urea is the only
fertilizer under statutory price
control.
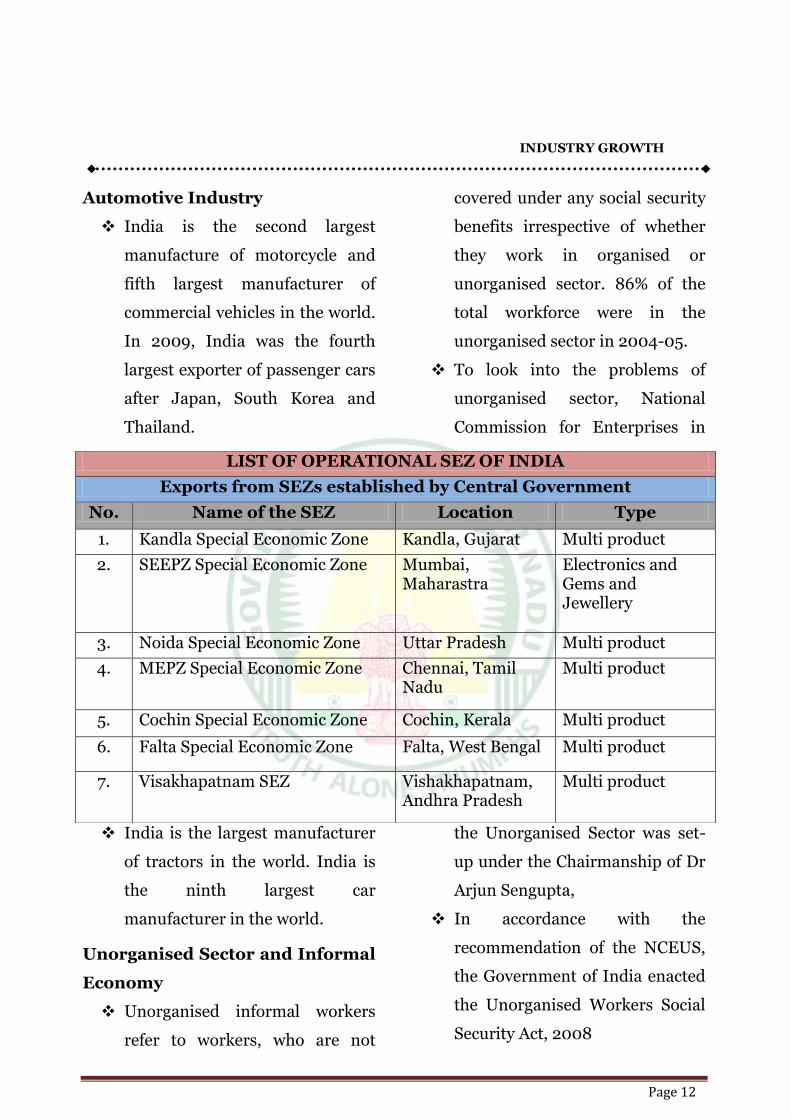
INDUSTRY GROWTH
Page 12
Automotive Industry
India is the second largest
manufacture of motorcycle and
fifth largest manufacturer of
commercial vehicles in the world.
In 2009, India was the fourth
largest exporter of passenger cars
after Japan, South Korea and
Thailand.
India is the largest manufacturer
of tractors in the world. India is
the ninth largest car
manufacturer in the world.
Unorganised Sector and Informal
Economy
Unorganised informal workers
refer to workers, who are not
covered under any social security
benefits irrespective of whether
they work in organised or
unorganised sector. 86% of the
total workforce were in the
unorganised sector in 2004-05.
To look into the problems of
unorganised sector, National
Commission for Enterprises in
the Unorganised Sector was set-
up under the Chairmanship of Dr
Arjun Sengupta,
In accordance with the
recommendation of the NCEUS,
the Government of India enacted
the Unorganised Workers Social
Security Act, 2008
LIST OF OPERATIONAL SEZ OF INDIA
Exports from SEZs established by Central Government
No. Name of the SEZ Location Type
1. Kandla Special Economic Zone Kandla, Gujarat Multi product
2. SEEPZ Special Economic Zone Mumbai, Maharastra
Electronics and Gems and Jewellery
3. Noida Special Economic Zone Uttar Pradesh Multi product
4. MEPZ Special Economic Zone Chennai, Tamil Nadu
Multi product
5. Cochin Special Economic Zone Cochin, Kerala Multi product
6. Falta Special Economic Zone Falta, West Bengal Multi product
7. Visakhapatnam SEZ Vishakhapatnam, Andhra Pradesh
Multi product
INDUSTRY GROWTH
Page 13
The act came into effect from 16th
May, 2009. The act among other
things provides for Constitution
of a National Social Security
Board and State Social Security
Board to recommend Social
Security Schemes.
Constitution of record keeping
functions by the district
administration.
Constitution of a workers
facilitation centre.
A National Social Security Fund
(NSSF) with initial allocation of
Rs.1000 crore for the unorganised
sector workers has been set-up.
A National Social Security Board
(NSSB) has been constituted in
2009.
National Manufacturing Policy
(NMP)
The NMP was released by the
government on 4th November, 2011
to bring about a qualitative and
quantitative change with following
objectives
Increase manufacturing growth to
12-14% over the medium term.
Enable manufacturing to
contribute at least 25% of GDP by
2011.
Create 100 million additional jobs
in the manufacturing sector by
2022.
Provides for National Investment
and Manufacturing Zone (NIMZ)
on lands, which are degraded and
uncultivable.
National Policy on Electronics
(NPE), 2011
NPE was released on 3rd October,
2011 providing for a roadmap for
the development of the electronics
sector in the country.
Infrastructure in the Indian Economy
Infrastructural facilities: Often
referred to as economic and social
overheads, consists of
Energy : Coal, Electricity, Oil and
non conventional sources.
Transport : Railways, roads,
shipping and civil aviation.
Communications : Posts and
telegraph, telephones,
telecommunication etc.
Banking, finance and insurance
Science and technology
Social overheads : health and
hygiene and education.
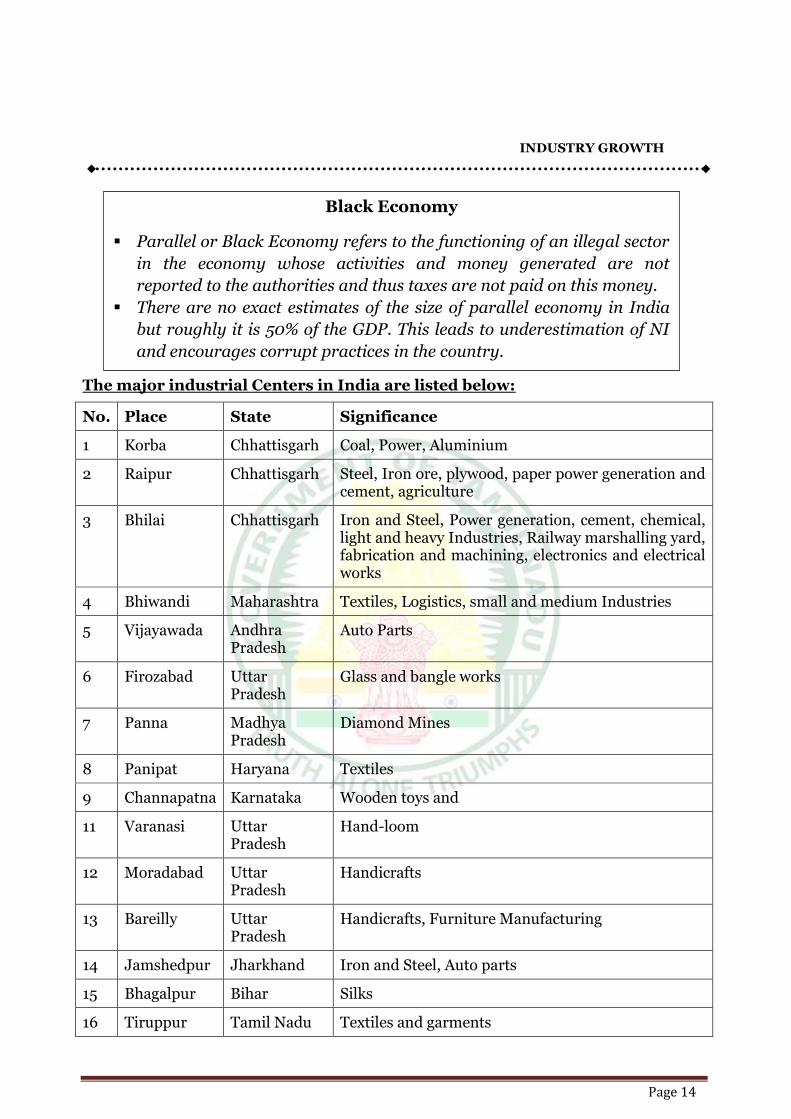
INDUSTRY GROWTH
Page 14
The major industrial Centers in India are listed below:
No. Place State Significance
1 Korba Chhattisgarh Coal, Power, Aluminium
2 Raipur Chhattisgarh Steel, Iron ore, plywood, paper power generation and cement, agriculture
3 Bhilai Chhattisgarh Iron and Steel, Power generation, cement, chemical, light and heavy Industries, Railway marshalling yard, fabrication and machining, electronics and electrical works
4 Bhiwandi Maharashtra Textiles, Logistics, small and medium Industries
5 Vijayawada Andhra Pradesh
Auto Parts
6 Firozabad Uttar Pradesh
Glass and bangle works
7 Panna Madhya Pradesh
Diamond Mines
8 Panipat Haryana Textiles
9 Channapatna Karnataka Wooden toys and
11 Varanasi Uttar Pradesh
Hand-loom
12 Moradabad Uttar Pradesh
Handicrafts
13 Bareilly Uttar Pradesh
Handicrafts, Furniture Manufacturing
14 Jamshedpur Jharkhand Iron and Steel, Auto parts
15 Bhagalpur Bihar Silks
16 Tiruppur Tamil Nadu Textiles and garments
Black Economy
Parallel or Black Economy refers to the functioning of an illegal sector
in the economy whose activities and money generated are not
reported to the authorities and thus taxes are not paid on this money.
There are no exact estimates of the size of parallel economy in India
but roughly it is 50% of the GDP. This leads to underestimation of NI
and encourages corrupt practices in the country.
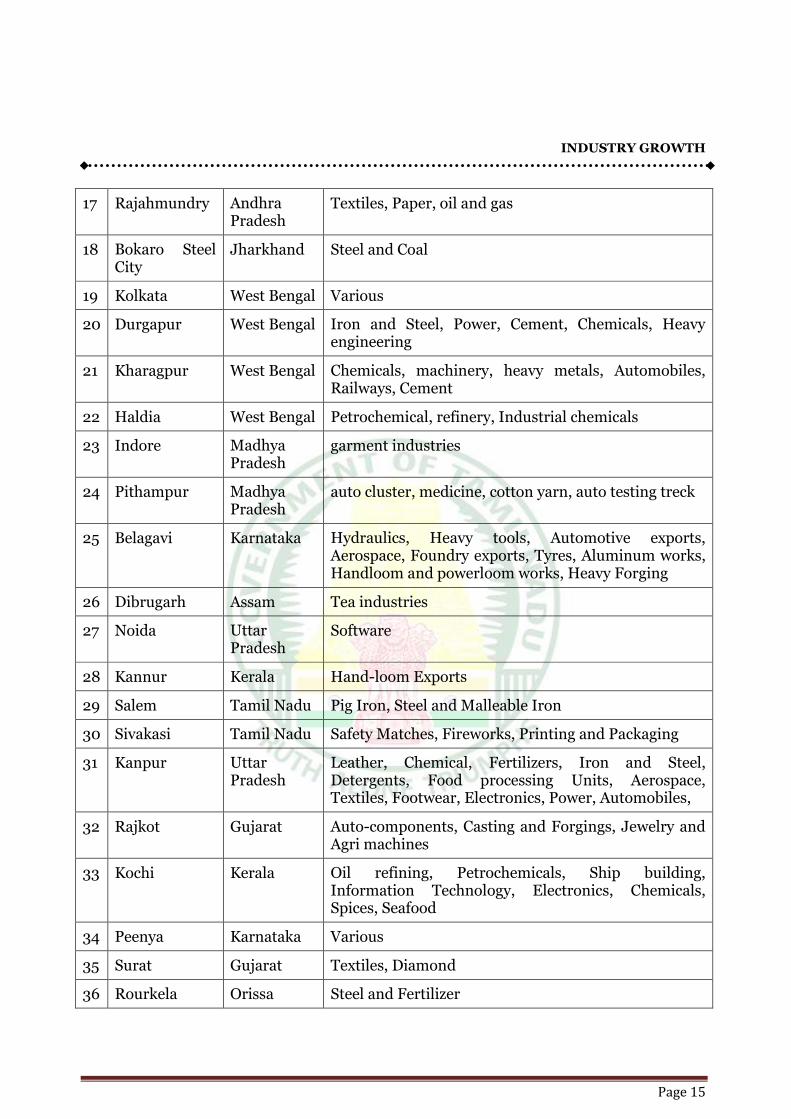
INDUSTRY GROWTH
Page 15
17 Rajahmundry Andhra Pradesh
Textiles, Paper, oil and gas
18 Bokaro Steel City
Jharkhand Steel and Coal
19 Kolkata West Bengal Various
20 Durgapur West Bengal Iron and Steel, Power, Cement, Chemicals, Heavy engineering
21 Kharagpur West Bengal Chemicals, machinery, heavy metals, Automobiles, Railways, Cement
22 Haldia West Bengal Petrochemical, refinery, Industrial chemicals
23 Indore Madhya Pradesh
garment industries
24 Pithampur Madhya Pradesh
auto cluster, medicine, cotton yarn, auto testing treck
25 Belagavi Karnataka Hydraulics, Heavy tools, Automotive exports, Aerospace, Foundry exports, Tyres, Aluminum works, Handloom and powerloom works, Heavy Forging
26 Dibrugarh Assam Tea industries
27 Noida Uttar Pradesh
Software
28 Kannur Kerala Hand-loom Exports
29 Salem Tamil Nadu Pig Iron, Steel and Malleable Iron
30 Sivakasi Tamil Nadu Safety Matches, Fireworks, Printing and Packaging
31 Kanpur Uttar Pradesh
Leather, Chemical, Fertilizers, Iron and Steel, Detergents, Food processing Units, Aerospace, Textiles, Footwear, Electronics, Power, Automobiles,
32 Rajkot Gujarat Auto-components, Casting and Forgings, Jewelry and Agri machines
33 Kochi Kerala Oil refining, Petrochemicals, Ship building, Information Technology, Electronics, Chemicals, Spices, Seafood
34 Peenya Karnataka Various
35 Surat Gujarat Textiles, Diamond
36 Rourkela Orissa Steel and Fertilizer
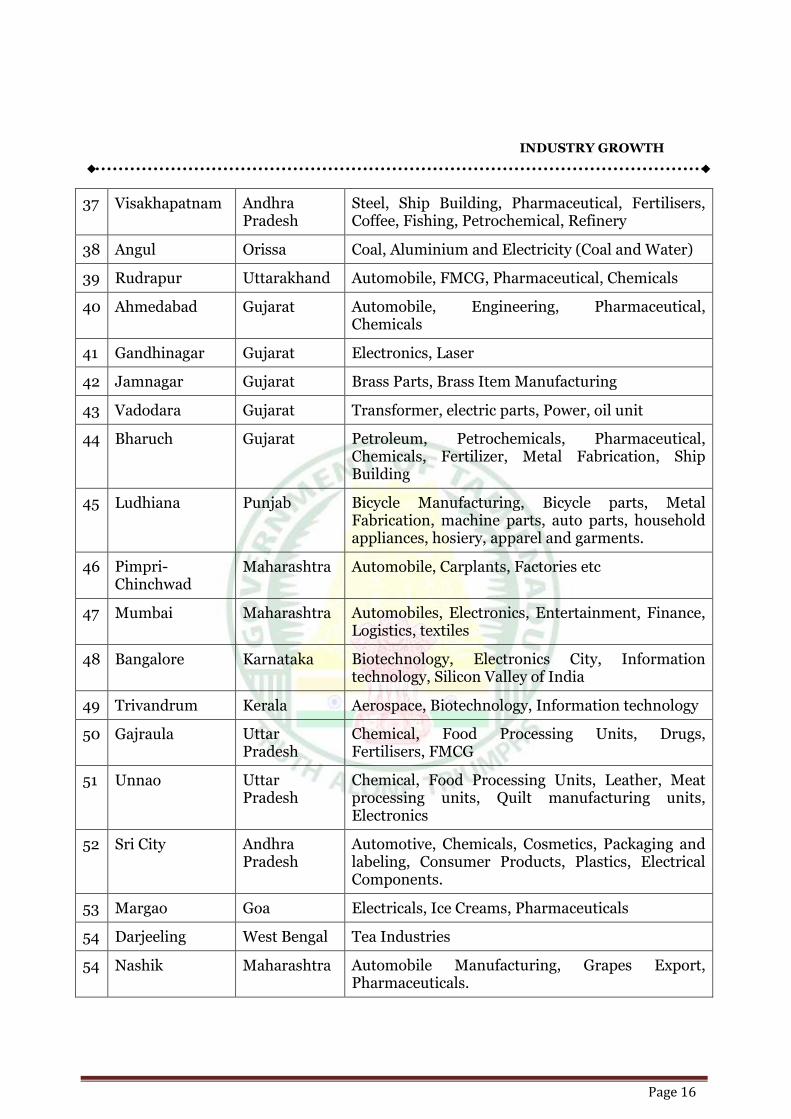
INDUSTRY GROWTH
Page 16
37 Visakhapatnam Andhra Pradesh
Steel, Ship Building, Pharmaceutical, Fertilisers, Coffee, Fishing, Petrochemical, Refinery
38 Angul Orissa Coal, Aluminium and Electricity (Coal and Water)
39 Rudrapur Uttarakhand Automobile, FMCG, Pharmaceutical, Chemicals
40 Ahmedabad Gujarat Automobile, Engineering, Pharmaceutical, Chemicals
41 Gandhinagar Gujarat Electronics, Laser
42 Jamnagar Gujarat Brass Parts, Brass Item Manufacturing
43 Vadodara Gujarat Transformer, electric parts, Power, oil unit
44 Bharuch Gujarat Petroleum, Petrochemicals, Pharmaceutical, Chemicals, Fertilizer, Metal Fabrication, Ship Building
45 Ludhiana Punjab Bicycle Manufacturing, Bicycle parts, Metal Fabrication, machine parts, auto parts, household appliances, hosiery, apparel and garments.
46 Pimpri-Chinchwad
Maharashtra Automobile, Carplants, Factories etc
47 Mumbai Maharashtra Automobiles, Electronics, Entertainment, Finance, Logistics, textiles
48 Bangalore Karnataka Biotechnology, Electronics City, Information technology, Silicon Valley of India
49 Trivandrum Kerala Aerospace, Biotechnology, Information technology
50 Gajraula Uttar Pradesh
Chemical, Food Processing Units, Drugs, Fertilisers, FMCG
51 Unnao Uttar Pradesh
Chemical, Food Processing Units, Leather, Meat processing units, Quilt manufacturing units, Electronics
52 Sri City Andhra Pradesh
Automotive, Chemicals, Cosmetics, Packaging and labeling, Consumer Products, Plastics, Electrical Components.
53 Margao Goa Electricals, Ice Creams, Pharmaceuticals
54 Darjeeling West Bengal Tea Industries
54 Nashik Maharashtra Automobile Manufacturing, Grapes Export, Pharmaceuticals.
ROLE OF PUBLIC SECTOR
AND DISINVESTMENT
Page 1
Introduction
Public Sector Enterprises
(PSEs) or State owned and managed
units have played a strategic role in the
Indian economy. The key factors
contributing to stronghold of these
enterprises are the need of rapid
industrialization with equitable
distribution of economic wealth and
inadequacies of free market. India
witnessed a greater degree of state
ownership and increased regulation
since second plan that envisaged
industrialization as a development
strategy. By 1980s the poor
performance of state-owned companies
was acknowledged and various efforts
were made to improve performance. In
an era of economic reform process
initiated since1991, privatization has
become a key component of public
sector policy of the government. The
survival of PSEs now depends upon
performance efficiency and
profitability.
Definition of Public Sector
Enterprises
Public Sector Enterprises often
referred to as government owned
undertakings/enterprises or state-
owned enterprises are wholly or partly
owned and controlled by the
government and produce marketable
goods and services i.e. PSEs
includes industrial and
commercial enterprises which
are managed and controlled by
government. Public sector and PSEs
are different from each other. The word
public sector is wider and includes all
kinds of organization commercial (i.e.
PSEs) and non-commercial that are
owned partly or fully and effectively
managed by Government. Thus
Government funded universities,
colleges, hospitals, schools are part of
public sector but are not PSEs because
these organizations lack commercial
orientation.
RPSD
Page 2
Rationale of PSEs In India
The policy rationale for public
ownership and government provision
of certain goods and services has been
based on the presence of some form of
market failure, which is addressed
through public ownership. In India,
PSEs are assigned the responsibility of
fulfilling specific social goals like
correcting regional and economic
imbalances, providing employment
and reducing the concentration of
monopoly power in the economy.
Further, as a pre-requisite for balanced
growth, the state controls the key
sectors of the economy which is
popularly known as the 'commanding
heights' rationale of PSEs. The
rationale of PSEs in India is discussed
as follows:
1. Rapid Economic Development
The prerequisite of faster
economic development is the creation
of infrastructure and the growth of
basic industries like power, steel
transportation; communication,
banking etc. These industries require
huge capital investment and involve
long-gestation period and so private
sector may not be interested to
undertake the development of such
industries. Further, the private sector
lack financial and technical skills to
develop such industries. In other
words, reluctance on the part of private
entrepreneurs to develop key
industries due to high risk and low
returns necessitated the establishment
of PSEs. Government with its capacity
to mobilize huge economic resources
can develop the industries that are
significant for growth prospects of the
country. Thus in the earlier phase of
development heavy state spending on
investment in basic infrastructural
sectors and service facilities(for
example financial institutions,
telecommunication banking etc.) is
essential for providing a congenial
atmosphere to the private sector to
facilitate the process of accelerated
development of the economy.
2. Reduction of Concentration of
Economic Powers
PSEs reduce inequalities of
income through welfare programmes,
favourable pricing policy towards small
industries and supply of cheaper goods
to the consumer. Private sector may
manipulate the price of essential goods
RPSD
Page 3
and indulge into quick profit-making
by controlling the volume and price of
such goods. PSEs prevent such
concentration of economic power.
3. Balanced Regional Growth
Private sector generally neglects
backward regions that lack
infrastructure and other basic facilities
such as power, roads,
telecommunication, skilled labour etc.
PSEs set up large projects in these
areas and spend huge cost to develop
such areas. In this manner PSEs help
to achieve balanced regional growth.
4. Employment Generation
The adequate generation of
employment opportunities is a major
objective of the public sector
enterprises. This sector has provided
direct employment to more than 80 %
of organized labour.
5. Import-Substitution and
Export-Promotion
In the initial period of
development foreign exchange
constraints exist due to huge imports of
capital goods and low exportable
surplus. PSEs produce importable
goods domestically which tend to save
precious foreign exchange and
facilitate exports.
6. Resource Mobilization
PSEs mobilize savings through
large network of banking and financial
institutions. The profits of PSEs are
ploughed back into developmental
activities of the country. Further, PSEs
contribute to the Government’s
exchequer through payment of tax and
dividends.
ROLE AND CONTRIBUTION OF
PSEs IN INDIA: RECENT
EVIDENCES
The role of PSEs in the provision
of social and economic infrastructure
has been impressive. It has significant
contribution to the country’s economy
by filling the gaps in the industrial
sector, generating employment and
balanced regional development. The
major contributions of PSEs are
explained as under:
Contribution towards Industrial
Development and GDP Growth
The role of Indian PSEs in the
process of industrialization is widely
RPSD
Page 4
acclaimed. The PSEs has helped to
build sound and diversified industrial
base. The capacity creation by PSEs in
basic industries such as generation and
distribution of electricity,
telecommunication public
transportation stood at around 50 %.
In case of basic metals fuel and
fertilizers it stood at 80 % to 100 %.
These industries are central to
economic development process of
industrialization. PSEs contribute
around 27% of total industrial
production of the economy. On the eve
of the First Five Year Plan there were 5
central public sector enterprises
(CPSEs) with a total (financial)
investment of Rs. 29 crore. Both the
number of enterprises and the
investment in CPSEs recorded an
overwhelming increase over the years,
especially so after the Second Five Year
Plan. As on 31st March, 2007, there
were a total of 247 CPSEs with a total
of Rs. 421089 crores. The contribution
of PSEs in the real gross capital
formation as clearly indicate that PSEs
occupy a significant position in the
process of country’s capital formation
and holds commanding heights of the
economy.
As far as the share in national
production is concerned, central PSEs
in the 1950-51, contribute 3 % of
national income which has increased to
around 8.23% in 2006-07.
Problems Facing PSEs in India
1. Defective Pricing Policy
The prices of goods and services
produced by the PSE in India for long
have been determined by Govt. under
administered price regimes (APR). In
post-91 era with intense market
competition Government has
dismantled the APR in most cases and
PSEs have been given independence to
fix their own price competitively. In the
recent years various price regulatory
commission for regulating prices in
best interest of both consumers and
producers have been established whose
recommendations are applicable both
for private and PSEs. Government on
its part continues to be sensitive to the
needs of the poor and price level in the
economy. Any rise in price generally
warranted by market conditions is
avoided. Pricing of petroleum is an
example in this respect. The rise in the
international price of crude oil is
hardly passed on to the consumers.
RPSD
Page 5
The social approach set prices in PSE
causes a lower returns and financial
losses.
2. Excessive Political Interference
There exists considerable
political interference in the operational
aspects of PSEs in terms of
appointment in the management,
pricing of products, location of
projects. The decisions are guided by
political considerations and not by
economic factors.
3. Delays in Decision-Making
The Red-Tapism and
bureaucratic management causes delay
in decision-making of these
organizations. PSEs thus fail to take
advantage of opportunities thrown
open by the market.
4. Over-Manning
The public sector enterprises are
overstaffed. It increases cost of
production and inefficiency in the
organization.
5. Lack of Accountability
The appraisal system lack
performance-based remuneration
system. The system lacks incentives to
improve and penalties for delays and
failures. The security of service makes
them lethargic and reduces creativity.
This lack of accountability causes
inefficiency and losses in the public
enterprises.
6. Under-Utilization of Capacity
The public enterprises operate at
less than their full capacity and
produce lower than potential output.
This increase the cost of production as
the fixed cost is distributed over small
output.
Public Sector Reforms
The Industrial policy resolution
of 1956 has been the guiding factor
which gave PSEs a strategic role in the
economy. Massive investments have
been made over the past five decades to
build public sector. These enterprises
have successfully expanded
production, opened up new areas of
technology and built up a reserve of
technical competence in various areas.
Initially, public sector investments
were in the key infrastructure areas,
but later on it begun to spread in all
areas of the economy including non-
RPSD
Page 6
infrastructure and non-core areas.
Since 1980’s, the performance of state
owned enterprises has been
undergoing a close scrutiny in India.
The existence of huge fiscal deficit
made it difficult to raise funds at home
and abroad. It was felt that the PSEs
were absorbing a large chunk of
government funds in the form of
subsidies, which has resulted in the
misallocation of resources brought
about by diversion of savings. In order
to overcome these problems
government allows relaxation in the
controls over PSEs and the emphasis
was put on efficiency and internal
resource generation of these
enterprises. The public sector reforms
in India since 1991 involves structural
changes that aim at increasing
efficiency, decentralization,
accountability and market orientation
of these enterprises. The important
reform measures introduced in the
recent years are discussed as follows:
1. Allowing Managerial Autonomy
Government has adopted
empowerment of PSEs as a continuous
process. The management of PSEs has
been given operational autonomy in
respect of human resource
development decisions like
recruitment, promotion and other
service related decisions. The profit-
making enterprises which don’t depend
on the budgetary support of the
government identified as Navratnas
and Miniratnas are given enhanced
powers to take investment and project
-related decisions such as decisions
relating to capital expenditure, raising
capital from the market, mergers and
acquisitions etc. Board of Directors of
PSEs exercises the delegated powers
subject to the broad guidelines issued
by Government. This would help PSEs
to mitigate problems relating to delay
in decision- making and help to
improve the competitive strength of
these enterprises.
2. Performance - based
Accountability through
Memorandum of understanding
(MOU) System
MOU is an instrument that
specifies mutual responsibilities of two
parties who sign it. It is signed
between government and management
of PSEs. MOU clarifies objectives and
targets expected form the management
RPSD
Page 7
and performance evaluation takes
place with reference to these objectives.
Thus it allows management by results
and objectives rather than
management by controls. Further an
attempt is made to evaluate
performance of PSEs on the basis of
financial and operational performance
indicators such as sales, growth in sales
and return on assets, dividend pay-out
ratio and earning per share.
3. Manpower Rationalization
PSEs for long have been suffering
from over manning. Voluntary
Retirement Scheme (VRS) has been
introduced in a number of PSEs to
shed the surplus manpower. In order
to provide security net to those who opt
for VRS, Counselling, Retraining and
Redeployment (CRR) scheme has been
launched. CRR aims at retraining
employees who have opted for VRS so
that the employees can adapt to new
vocation after their separation from
PSEs.
4. Professionalism in
Management
In order to improve efficiency,
Board of Directors (BOD) of PSEs has
been strengthened with the induction
of professional managers. The number
of Government nominated directors
has been reduced. Management
personnel are allowed greater
operational autonomy in implementing
the policies of the board. Efforts are
being made to reduce political and
bureaucratic interference in the
working of public sector enterprises.
5. Dereservation
The portfolio of the public sector
investments has been thoroughly
reviewed to focus the public sector on
strategic, high-tech and essential
infrastructure. The new industrial
policy 1991 adopted the policy of
dereservation that allowed the entry of
private sector in the activities
exclusively reserved for public sector.
The list of industries reserved solely for
the public sector - which used to cover
18 industries, including iron and steel,
heavy plant and machinery,
telecommunications etc. has been
drastically reduced to two: atomic
energy generation, and railway
transport. These reforms mainly aim at
providing competition to the public
sector.
RPSD
Page 8
6. Transparency in Operations of
PSEs
Corporate Governance
Code has been formulated to bring
greater amount of public accountability
and transparency amongst PSEs in an
era of competitive environment in
2005. Corporate governance refers to
ethical business and transparent
conduct of management of
organization so as to protect the
interest of stakeholders (i.e.
shareholders, employees, suppliers
etc.).These are the guidelines that
management is required to follow in
their decision-making process. The
code meet the regulatory framework,
builds harmonious relations with the
stakeholders, provide high degree of
accountability to the parliament and
the public and ensures transparency in
decisions. Further, PSEs are also
subject to Right to Information Act
(RTI).
7. Revival and Restructuring of
Sick PSEs
Efforts are made to modernize
and restructure PSEs and revive sick
industries. The chronically sick
industries have been sold off or closed.
Companies having potential for revival
have been allowed to be turned around
by private sector. In 2004, Board for
Reconstruction of PSE
(BRPSE) has been created to take up
restructuring and revival of PSEs.
BRPSE is an advisory body which
provides measures to strengthen,
modernize PSEs. It advises
government on disinvestment or
closure or sale of chronically sick or
loss making units that cannot be
revived. It also monitors incipient
sickness in PSEs so as to detect their
problems at the initial stage that can
result into sickness at the later stage.
As on 15-7-07, 57 PSEs have been
referred to BRPSE.
8. Allowing PSEs to Enter Capital
Market
In an era of reduced budgetary
support PSEs have been allowed to
raise equity finance from the capital
market. This has provided a market
pressure on PSEs to improve their
performance. As investors keep on
monitoring the shares listed on stock
exchange and market price movements
reflect the performance of the company
so management remain alert of their
RPSD
Page 9
operational efficiency. Further, the
listing of PSEs share in the market has
offered new opportunities to the
investors that have also improved the
trading activity of the stock exchanges
in India. In the year 2007, 44 central
PSEs were listed on the stock
exchange. Some of PSE shares are
enlisted on the international stock
exchange (for example MTNL share is
listed on New York stock exchange).
9. Modernization
The new policy provided for
modernization of plants,
rationalization of productive capacity
and changes in the product mix of
PSEs. Further PSEs have been allowed
to enter into technology joint ventures
and have alliance to obtain technology
and know-how. National
Investment Fund has been
established in 2005 to provide funds
for revival and capital investment
requirements of PSEs. The
disinvestment proceeds will be
channelized to this fund. This would
help them to develop competitive
strategy based on market needs.
10. Disinvestment and
Privatization
Disinvestment in India primarily
aims at improving corporate efficiency,
financial performance and
competition amongst PSEs. It involves
transfer of Government holding in
PSEs to the private shareholders.
Disinvestment introduces competition
and market discipline on PSEs and
depoliticizes the decision-making
process.
Disinvestment and Privatization
The New Economic Policy
initiated in July 1991, clearly indicated
that the Public Enterprises have shown
negative rate of return on capital
employed and in wake of economic
reforms the role of PSEs have to be
redefined so that it should withdraw
from the areas where no public
purpose is served by its presence,
and The public sector should make
investment only in those areas where
investment is mainly infrastructural in
nature and where private sector
participants are not likely to come
forth to an adequate extent within a
reasonable time perspective. In this
RPSD
Page 10
direction, Government has decided to
adopt disinvestment and privatization
policy which is explained as follows:
Disinvestment vs. Privatization
Disinvestment refers to the
dilution of government’s stake in a
public enterprise. If the dilution of
government’s stake involves the
transfer of management and control of
the enterprise as well then it is referred
to as privatization. Thus if the
government transfers 51 % or more
shares of public enterprise to the
private shareholders then this dilution
would transfer the majority of decision
making power of the government. If
less than 50 % government’s
shareholding is transferred then the
effective control would remain in the
hands of government and the
enterprise is not said to be privatized.
Thus privatization involves the
dilution of government’s shareholding
that also leads to the effective change
to management and control.
Disinvestment is wider in its meaning
that extends to dilution of
government’s shareholding to a level
where there is no change in the control
to the dilution that results in the
transfer of management i.e
privatization.
Objectives of Disinvestment
The following are the main objectives
of disinvestment:
i) To provide fiscal support: The
argument for fiscal support
emphasizes that the resources
raised through disinvestment must
be utilized for retiring past debts
and there by bringing down the
interest burden of the Government.
ii) To introduce, competition and
market discipline;
iii) To find growth;
iv) To encourage wider share of
ownership in the public
enterprises;
v) To depoliticise essential
services and improve efficiency.
Modalities of Disinvestment: In
India three modalities are used for
disinvestment:
(a) Offering shares of Public
Sector Enterprises at a fixed price
through a general prospectus. The offer
is made to the general public through
RPSD
Page 11
the medium of recognized market
intermediaries.
(b) Sale of Equity or Strategic
Sale through Auction of share
amongst predetermined clientele,
whose number can be large. The
reserve price for the PSE's equity can
be determined with the assistance of
merchant bankers. In case of strategic
sale, government retained a part of the
equity with it, though management
control is transferred to the strategic
partner. The strategic partner is
required to purchase an equity stake
which is large enough to ensure a
workable majority.
(c) Offer for Sale determining the
fixed price for sale of a public
enterprise, inviting open bidders and
accepting highest bidder’s quotation
for sale.
Until 1999-2000, it was
primarily the sale of minority shares of
CPSEs in small lots. From 1999-2000
till 2003-04, the emphasis of
disinvestment changed in favour
of 'Strategic Sale'. Currently, the
emphasis is on listing of unlisted
profitable CPSEs (other than the
Navratnas) each with a ‘net worth’ in
excess of Rs. 200 crore, through Initial
Public Offerings (IPOs). It also involves
sale of minority shareholding of the
Government in listed, profitable CPSEs
either in conjunction with a Public
Issue of fresh equity by the CPSE
concerned or independently by the
Government, subject to the residual
equity of the Government being at least
51 % and the Government retaining
management control of the CPSE. Thus
the emphasis is on the wider public
participation in the disinvestment
process.
Progress of Disinvestment
The Government in July 1991
initiated the disinvestment process in
India, while launching the New
Economic Policy(NEP). The crucial
shift in the Government policy for
disinvestment of PSE's was mainly
attributable to poor performance of
these enterprises and burden of
financing their requirements through
budget allocations. In 1991, there were
236 operating public sector
undertakings, of which only 123 was
profit making. The top 20 profit
RPSD
Page 12
making PSE's accounted for 80 % of
the profits, implying that less than 10
% of the PSE's were responsible for 80
% of profits. The return on public
sector investment for the year 1990-91
was a just over 2 %.
If we visualize the progress of
disinvestment in the Central
Government undertakings from 1991-
2007, the disinvestment proceeds are
encouraging but have been far lower
than the target except for few
years. Till 2007, cumulative amount
Rs.49, 241.64 crore have been collected
from disinvestment proceeds.
The reasons for such low
proportion of disinvestment proceeds
as against the target set were identified
and presented below:
(i) The unfavourable market
conditions are the main reason
responsible for this down ward
trend of disinvestment.
(ii) The offers made by the
Government for disinvestment of PSEs
are not attractive and stringent
bureaucratic procedures cause the
discouraging of the private sector
investors.
(iii) The valuation process,
procedures and surplus employees
are other factors hindering the
disinvestment process.
(iv) The Government is not
transparent about its approach towards
sequencing the restructuring and the
methods of privatisation of PSE's.
Disinvestment Policy in India:
Evolution and Recent Initiatives
The disinvestment of the
Government’s equity in CPSEs started
in 1991-92, when minority
shareholding of the Central
Government in 30 individual CPSEs
was sold to selected financial
institutions (LIC, GIC, and UTI) in
bundles. The shares were sold in
bundles to ensure that along with the
attractive shares, the not so attractive
shares also got sold. The Rangarajan
Committee recommended in April,
1993, that the %age of equity to be
disinvested should be generally under
49 per cent in industries reserved for
the public sector and over 74 per cent
in other industries. The Disinvestment
Commission was established in the
RPSD
Page 13
year 1996-97 to advise Government on
disinvestment issues. Government has
now emphasized the divestment in the
non-strategic PSEs even below 26 %.
Since 2000, the increasing emphasis is
placed on strategic sale and the entire
proceeds from
disinvestment/privatization is decided
to be deployed in social sector,
restructuring of PSEs and retirement of
public debts. At present the emphasis
is placed on public offering of shares to
the public. The salient features of
recent disinvestment policy since
2004 of the Government with respect
to Central Public Sector Enterprises
(CPSEs) are as follows:
(i) The profit-making companies on
principle are generally not
privatized. Privatization is
considered on a transparent and
consultative case-by-case basis.
The existing "Navratnas"
companies in the public sector are
allowed to raise resources from
the capital market.
(ii) The efforts are made to
modernize and restructure sick
public sector companies and
revive sick industry. The
chronically loss-making
companies are sold-off, or closed,
after all the workers have got their
legitimate dues and
compensation. The private
industry is inducted to turn
around companies that have
potential for revival.
(iii) The disinvestment proceeds are
used to provide resources for
social needs and to meet
investment requirements of
profitable and revivable
units. National Investment
Fund has been created in 2005
for this purpose that would
channelize the disinvestment
proceeds.
DEVELOPMENT OF
INFRASTRUCTURE
Page 1
DEVELOPMENT OF
INFRASTRUCTURE
Railways:
Indian Railways is the biggest
national undertaking. The first
Indian railway train rolled on its 34
km track from Bombay (Mumbai) to
Thane on April 16, 1853
Indian Railway system is the largest
railway system in Asia and second
in the world (First America)
The number of stations, at present
is 1,030.
The total length of Indian railways
is 63,030 km
At present, Indian railways have
8.593 engines, 51,030 passengers
compartments, 6,505 other
compartments for other passenger
trains and 2,19,931 goods
compartments.
About 29 per cent of the railways
routes have been electrified.
At present, Indian railways have 42
steam engines, 5,022 diesel engines
and 3,825 electric engines.
Railway finance is separate since
1924 – 1925 from the general
revenue.
Now merged, 2018 onwards a single
budget is prepared.
The only oldest running engine is
Fairy queen.
The first electric train rolled on
from Mumbai to Kurla on 3rd
February 1925.
Kolkata Metro Rail is the first
underground rail.
The longest railway platform of the
world is Kharagpur. Its length is
2,733 feet.
The longest tunnel of Indian
railways on Konkan Railways is 6.5
km long.
Indian Railway board was
established in 1905.
Indian Railway have three gauges
broad gauge, metre gauge and
narrow gauge.
At present, there are 19 Railway
recruitment boards.
DEVELOPMENT OF INFRASTRUCTURE
Page 2
In railways, there are AC, first class
and second class. Third class was
removed in 1974.
Computer reservation facility
covering the 95 per cent of the
passenger population, is available at
over 300 locations in the country.
Nehru Setu is the longest railway
bridge built on river Son.
Himsagar Express travels 66 hours
from Jammu Tavi to Kanyakumari
(3,751 km)
Recently national rail Vikas yojana
(NRVY) was launched to increase
the speed to enhance quadrilateral
network connecting all metros
(superfast + double line) and to
connect the ports.
Konkan Railway is run by a separate
corporation and it runs from
Mangalore to Roha (40 km south of
Mumbai)
Four states involved in this network
are Maharashtra, Goa, Karnataka
and Kerala. It does not pass through
Kerala.
51 per cent of the shares of Konkan
rail way is with Indian Railways,
It has the fastest of tracks in India
Total length is 760 km
10 percent of the line passes
through tunnels.
Longest tunnel is near Ratnagiri in
Karbude 6.5 km.
Rail density is maximum in North
Indian plains because of its levelled
surface and very high density of
population.
Railway density in hills and
plateaus are quite low.
East coast has more railway lines
than west coast.
Rail route per 1000 sq. km is
maximum in Punjab (42 kms.) then
West Bengal, Haryana, Bihar, U.P
Indian average rail route density is
18.6 km / 1000 sq.km.
Chhatrapati Shivaji Terminus,
Mumbai first Indian railway station
appear in World Heritage site.
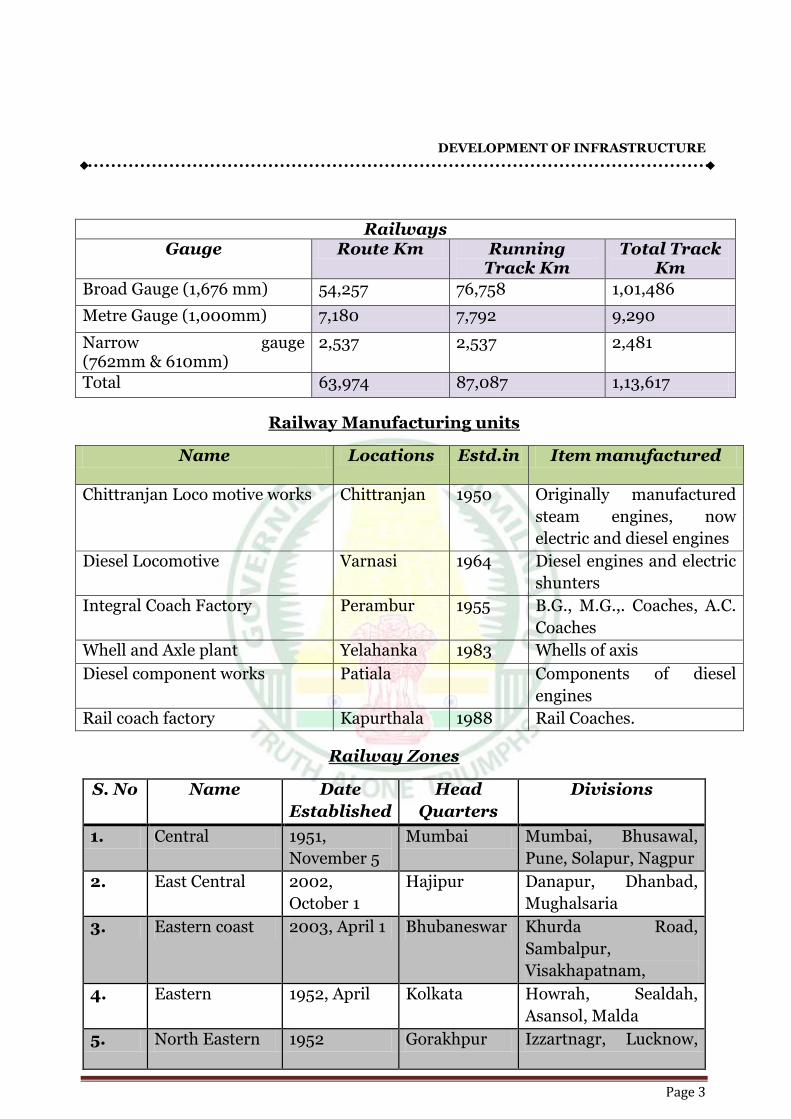
DEVELOPMENT OF INFRASTRUCTURE
Page 3
Railways Gauge Route Km Running
Track Km Total Track
Km
Broad Gauge (1,676 mm) 54,257 76,758 1,01,486
Metre Gauge (1,000mm) 7,180 7,792 9,290
Narrow gauge (762mm & 610mm)
2,537 2,537 2,481
Total 63,974 87,087 1,13,617
Railway Manufacturing units
Name Locations Estd.in Item manufactured
Chittranjan Loco motive works Chittranjan 1950 Originally manufactured
steam engines, now
electric and diesel engines
Diesel Locomotive Varnasi 1964 Diesel engines and electric
shunters
Integral Coach Factory Perambur 1955 B.G., M.G.,. Coaches, A.C.
Coaches
Whell and Axle plant Yelahanka 1983 Whells of axis
Diesel component works Patiala Components of diesel
engines
Rail coach factory Kapurthala 1988 Rail Coaches.
Railway Zones
S. No Name Date
Established
Head
Quarters
Divisions
1. Central 1951,
November 5
Mumbai Mumbai, Bhusawal,
Pune, Solapur, Nagpur
2. East Central 2002,
October 1
Hajipur Danapur, Dhanbad,
Mughalsaria
3. Eastern coast 2003, April 1 Bhubaneswar Khurda Road,
Sambalpur,
Visakhapatnam,
4. Eastern 1952, April Kolkata Howrah, Sealdah,
Asansol, Malda
5. North Eastern 1952 Gorakhpur Izzartnagr, Lucknow,
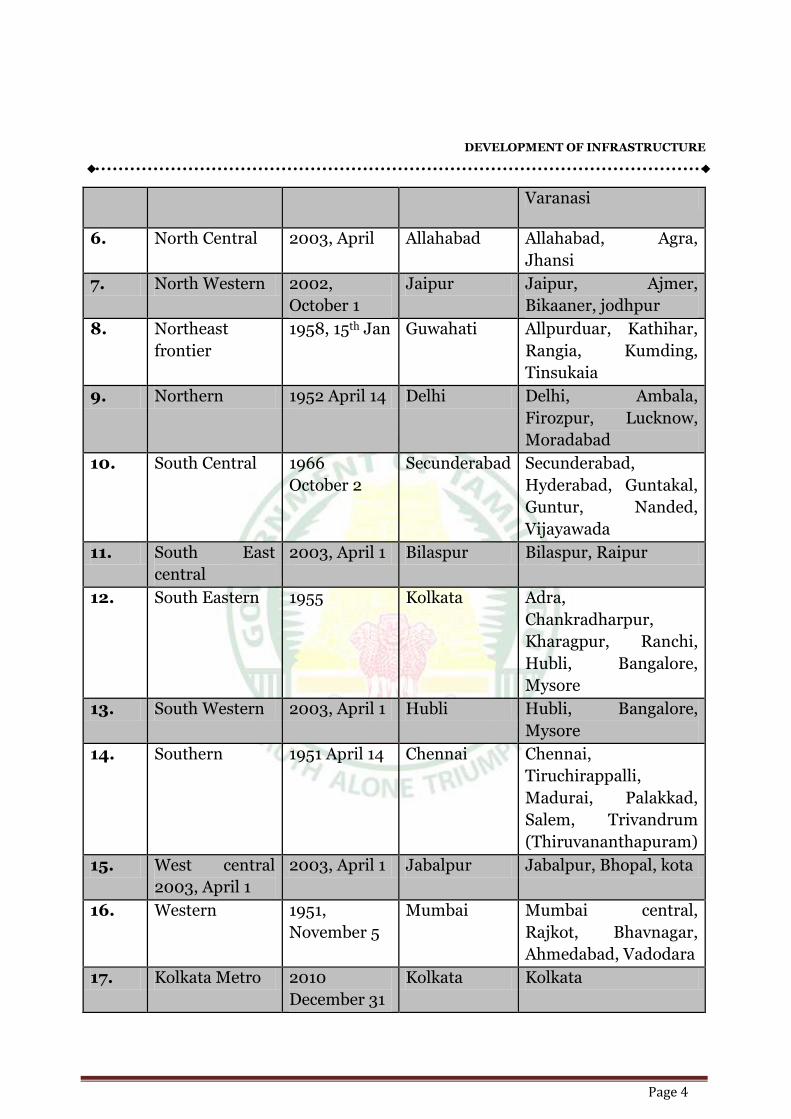
DEVELOPMENT OF INFRASTRUCTURE
Page 4
Varanasi
6. North Central 2003, April Allahabad Allahabad, Agra,
Jhansi
7. North Western 2002,
October 1
Jaipur Jaipur, Ajmer,
Bikaaner, jodhpur
8. Northeast
frontier
1958, 15th Jan Guwahati Allpurduar, Kathihar,
Rangia, Kumding,
Tinsukaia
9. Northern 1952 April 14 Delhi Delhi, Ambala,
Firozpur, Lucknow,
Moradabad
10. South Central 1966
October 2
Secunderabad Secunderabad,
Hyderabad, Guntakal,
Guntur, Nanded,
Vijayawada
11. South East
central
2003, April 1 Bilaspur Bilaspur, Raipur
12. South Eastern 1955 Kolkata Adra,
Chankradharpur,
Kharagpur, Ranchi,
Hubli, Bangalore,
Mysore
13. South Western 2003, April 1 Hubli Hubli, Bangalore,
Mysore
14. Southern 1951 April 14 Chennai Chennai,
Tiruchirappalli,
Madurai, Palakkad,
Salem, Trivandrum
(Thiruvananthapuram)
15. West central
2003, April 1
2003, April 1 Jabalpur Jabalpur, Bhopal, kota
16. Western 1951,
November 5
Mumbai Mumbai central,
Rajkot, Bhavnagar,
Ahmedabad, Vadodara
17. Kolkata Metro 2010
December 31
Kolkata Kolkata
DEVELOPMENT OF INFRASTRUCTURE
Page 5
Road Ways :
The road network in India is one of
the largest in the world.
The total length of roads, at present
is 33 lakhs kms.
The total length of metalled road
excluding roads constructed under
Jawahar Rozgar Yojana is 13,94,061
km and un metalled roads is
10,71,816 km.
The central government owns the
responsibility of 79,243 km long
national high ways.
Border road organisation was
established in 1960.
Though the national highways do
not constitute even 1.7 per cent of
the total road length of the country,
they bear about 40 per cent of the
traffic.
Number of vehicles has been
growing at an average pace of
10.16% per annum over the last five
years.
Maharashtra has the highest length
of roads (2,35,595 km) where case
the lowest length of road has
Lakshadweep (1km)
National Highway Development
Programme (NHDP)
1. The Golden Quadrilateral Project
involves connectivity of
a) Delhi to Kolkata 1453 km (NH2)
b) Delhi to Mumbai 1419 km (NH8,
NH76 and NH 79)
c) Mumbai to Chennai 1290 km
(NH4, NH7 and NH46)
d) Chennai to Kolkata 1684 km
(NH5, NH6 and NH60)
2. North – South and East –
West Corridors
a) NS corridor connects Srinagar to
Kanyakumari
b) EW corridor cross each other at
Jhansi (UP)
NS and EW corridors cross each
other at Jhansi (UP)
Total length of this project us
7300 km.
3. Maximum length of corridors is in
Tamil Nadu (851 km) followed
Uttar Pradesh (856 kms)
4. National Highways Development
project has been launched to link
the four corners of the country by
four or six lanes in a network. The
Rajiv Gandhi international Airport (Hyderabad) has achieved Carbon natural states (5-15 million category) and 1st in Asia Pacific region.
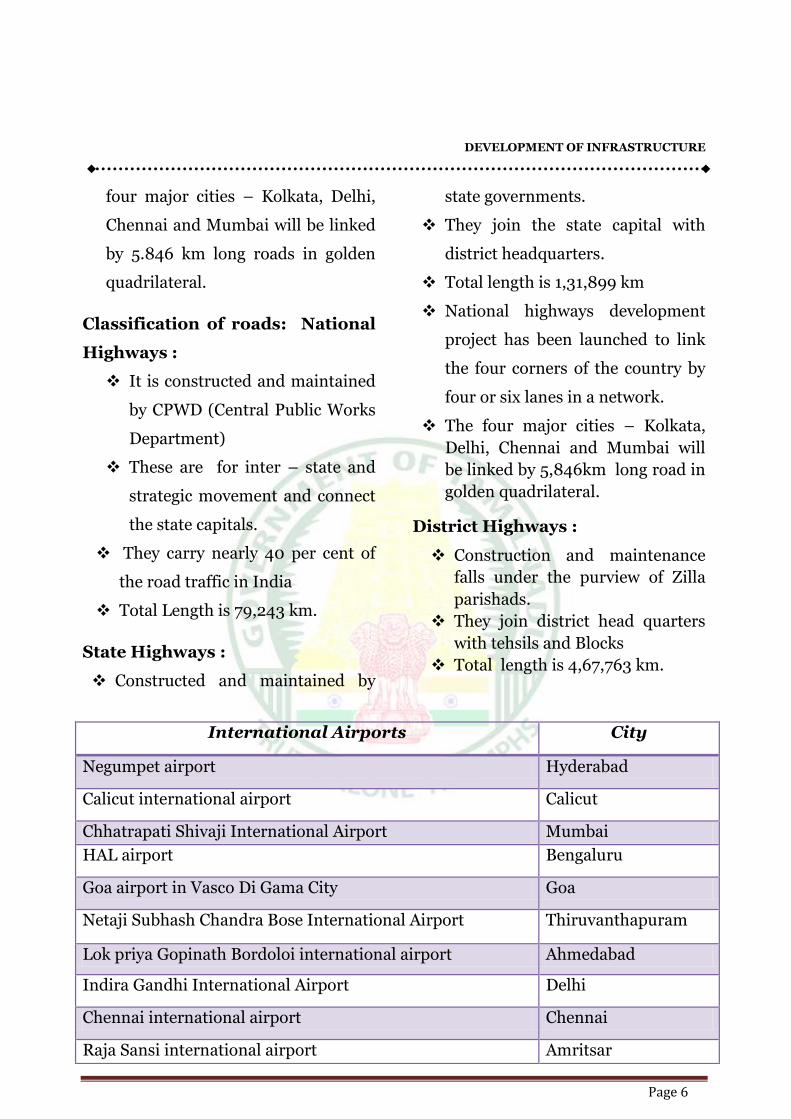
DEVELOPMENT OF INFRASTRUCTURE
Page 6
four major cities – Kolkata, Delhi,
Chennai and Mumbai will be linked
by 5.846 km long roads in golden
quadrilateral.
Classification of roads: National
Highways :
It is constructed and maintained
by CPWD (Central Public Works
Department)
These are for inter – state and
strategic movement and connect
the state capitals.
They carry nearly 40 per cent of
the road traffic in India
Total Length is 79,243 km.
State Highways :
Constructed and maintained by
state governments.
They join the state capital with
district headquarters.
Total length is 1,31,899 km
National highways development
project has been launched to link
the four corners of the country by
four or six lanes in a network.
The four major cities – Kolkata,
Delhi, Chennai and Mumbai will
be linked by 5,846km long road in
golden quadrilateral.
District Highways :
Construction and maintenance
falls under the purview of Zilla
parishads.
They join district head quarters
with tehsils and Blocks
Total length is 4,67,763 km.
International Airports City
Negumpet airport Hyderabad
Calicut international airport Calicut
Chhatrapati Shivaji International Airport Mumbai
HAL airport Bengaluru
Goa airport in Vasco Di Gama City Goa
Netaji Subhash Chandra Bose International Airport Thiruvanthapuram
Lok priya Gopinath Bordoloi international airport Ahmedabad
Indira Gandhi International Airport Delhi
Chennai international airport Chennai
Raja Sansi international airport Amritsar
DEVELOPMENT OF INFRASTRUCTURE
Page 7
Village Roads:
Responsibility of village
Panchayats
Connects the villages with
neighbouring towns
Total length is 26,50,000 km
Airways :
JRD Tata was the first person to
take a solo flight from Mumbai to
Karachi in 1931.
In 1935, the Tata Air Lines started
its operation between Mumbai and
Thiruvananthapuram and in 1937
between Mumbai and Delhi
In 1953, all the private air line
companies were nationalized and
Indian Airlines and air India came
into existence.
Vayaudoot limited started in 1981 as
a private air carrier and later on it
was merged with Indian Airlines.
International airports authority of
India and National airports
authority were merged on 1995 to
form airports authority of India.
Merger of Air India and Indian
Airlines There are 12 International
airports
Indian air lines operates to 54
domestic stations along with its
subsidiary
Water Ways :
India has 7,516 km long coast line
Shipping corporation of India is the
biggest shipping line of the country
having the longest number of
vessels.
India has the largest merchant
shipping tonnage.
The total length of navigation water
ways in India comprising river
canals, backwaters etc is 14,500 km
out of which 3700 km is navigable
by mechanised boats.
The public sector company, the
shipping corporation of India
limited has established on 2nd
October 1961.
There are 13 major ports in country
apart from about 187 minor ports.
Major ports are under central
government and others are
maintained by state government.
India has about 200 ports with 13
major and the rest intermediate and
minor.
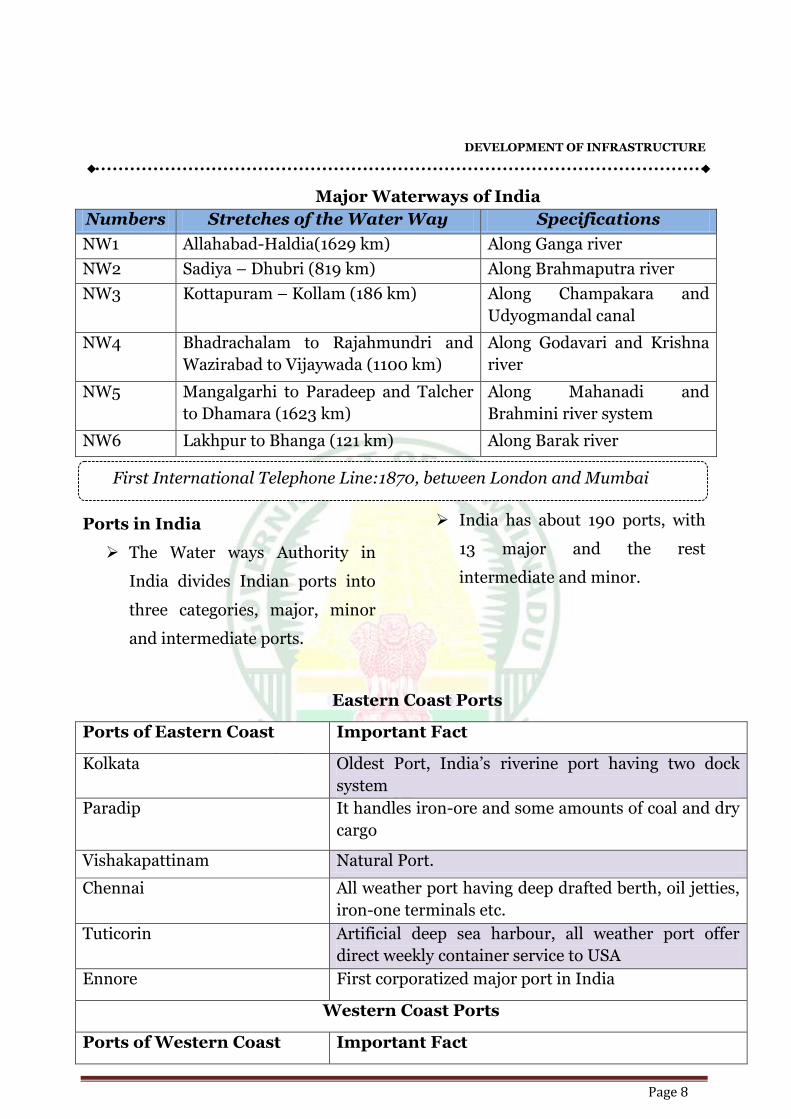
DEVELOPMENT OF INFRASTRUCTURE
Page 8
Major Waterways of India
Numbers Stretches of the Water Way Specifications
NW1 Allahabad-Haldia(1629 km) Along Ganga river
NW2 Sadiya – Dhubri (819 km) Along Brahmaputra river
NW3 Kottapuram – Kollam (186 km) Along Champakara and
Udyogmandal canal
NW4 Bhadrachalam to Rajahmundri and
Wazirabad to Vijaywada (1100 km)
Along Godavari and Krishna
river
NW5 Mangalgarhi to Paradeep and Talcher
to Dhamara (1623 km)
Along Mahanadi and
Brahmini river system
NW6 Lakhpur to Bhanga (121 km) Along Barak river
Ports in India
The Water ways Authority in
India divides Indian ports into
three categories, major, minor
and intermediate ports.
India has about 190 ports, with
13 major and the rest
intermediate and minor.
Eastern Coast Ports
Ports of Eastern Coast Important Fact
Kolkata Oldest Port, India’s riverine port having two dock
system
Paradip It handles iron-ore and some amounts of coal and dry
cargo
Vishakapattinam Natural Port.
Chennai All weather port having deep drafted berth, oil jetties,
iron-one terminals etc.
Tuticorin Artificial deep sea harbour, all weather port offer
direct weekly container service to USA
Ennore First corporatized major port in India
Western Coast Ports
Ports of Western Coast Important Fact
First International Telephone Line:1870, between London and Mumbai
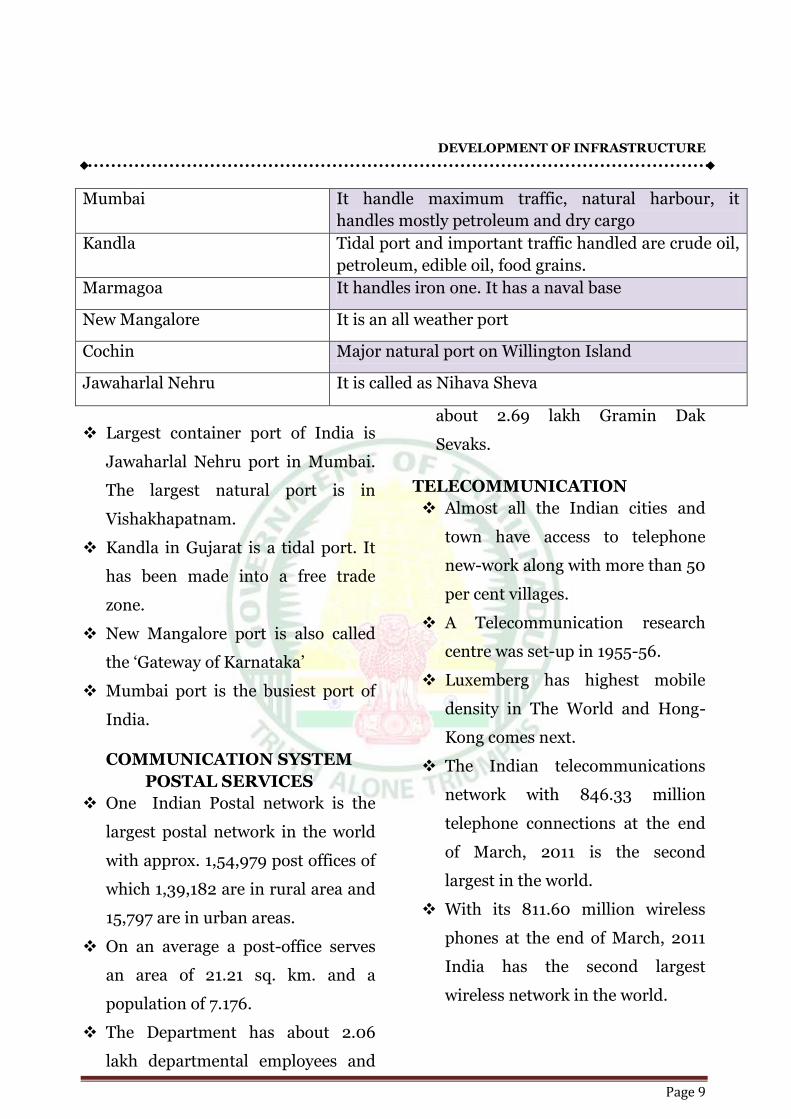
DEVELOPMENT OF INFRASTRUCTURE
Page 9
Mumbai It handle maximum traffic, natural harbour, it
handles mostly petroleum and dry cargo
Kandla Tidal port and important traffic handled are crude oil,
petroleum, edible oil, food grains.
Marmagoa It handles iron one. It has a naval base
New Mangalore It is an all weather port
Cochin Major natural port on Willington Island
Jawaharlal Nehru It is called as Nihava Sheva
Largest container port of India is
Jawaharlal Nehru port in Mumbai.
The largest natural port is in
Vishakhapatnam.
Kandla in Gujarat is a tidal port. It
has been made into a free trade
zone.
New Mangalore port is also called
the ‘Gateway of Karnataka’
Mumbai port is the busiest port of
India.
COMMUNICATION SYSTEM
POSTAL SERVICES
One Indian Postal network is the
largest postal network in the world
with approx. 1,54,979 post offices of
which 1,39,182 are in rural area and
15,797 are in urban areas.
On an average a post-office serves
an area of 21.21 sq. km. and a
population of 7.176.
The Department has about 2.06
lakh departmental employees and
about 2.69 lakh Gramin Dak
Sevaks.
TELECOMMUNICATION
Almost all the Indian cities and
town have access to telephone
new-work along with more than 50
per cent villages.
A Telecommunication research
centre was set-up in 1955-56.
Luxemberg has highest mobile
density in The World and Hong-
Kong comes next.
The Indian telecommunications
network with 846.33 million
telephone connections at the end
of March, 2011 is the second
largest in the world.
With its 811.60 million wireless
phones at the end of March, 2011
India has the second largest
wireless network in the world.
DEVELOPMENT OF INFRASTRUCTURE
Page 10
First Postal Service Started:1837
First Postal Stamp Issued:1852 in Karachi (provincial)
First all-India Postal Stamp Issued:1854
Establishment of Postal Department:1854
Money-order Service Started:1880
Post Office Saving Bank Started:1882
Airmail Service Started:1911
Speed-Post introduced: August 01, 1986
Post-shoppee Introduced: August 1994
e-Post Introduced: August 02, 2001
Gramin Sanchar Sewak Scheme (GSS): 24 December, 2002
First telegraph line:1851, between Calcutta and Diamond Harbour
First telephone Exchange:1881 in Calcutta
Telegraph system discontinue from 2013
First automatic Exchange:1913 in Shimla
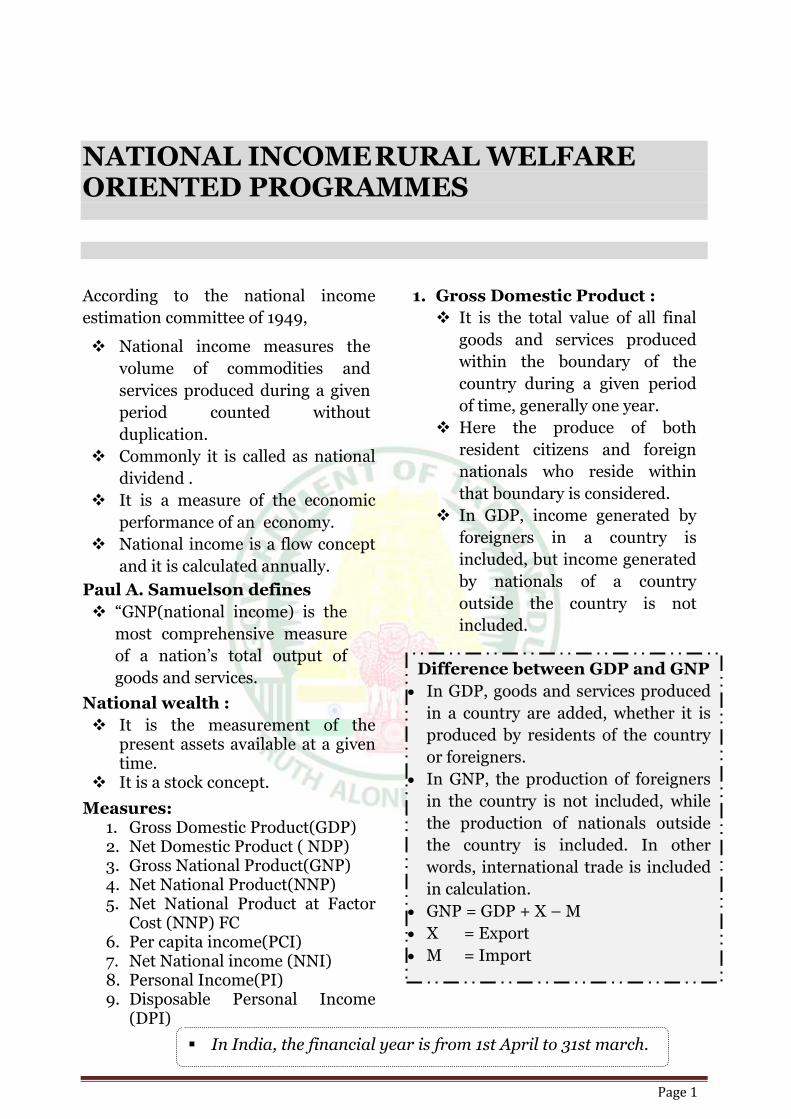
NATIONAL INCOME RURAL WELFARE ORIENTED PROGRAMMES
Page 1
According to the national income
estimation committee of 1949,
National income measures the
volume of commodities and
services produced during a given
period counted without
duplication.
Commonly it is called as national
dividend .
It is a measure of the economic
performance of an economy.
National income is a flow concept
and it is calculated annually.
Paul A. Samuelson defines
“GNP(national income) is the most comprehensive measure
of a nation’s total output of goods and services.
National wealth :
It is the measurement of the present assets available at a given time.
It is a stock concept.
Measures: 1. Gross Domestic Product(GDP) 2. Net Domestic Product ( NDP) 3. Gross National Product(GNP) 4. Net National Product(NNP) 5. Net National Product at Factor
Cost (NNP) FC 6. Per capita income(PCI) 7. Net National income (NNI) 8. Personal Income(PI) 9. Disposable Personal Income
(DPI)
1. Gross Domestic Product :
It is the total value of all final
goods and services produced
within the boundary of the
country during a given period
of time, generally one year.
Here the produce of both
resident citizens and foreign
nationals who reside within
that boundary is considered.
In GDP, income generated by
foreigners in a country is
included, but income generated
by nationals of a country
outside the country is not
included.
In India, the financial year is from 1st April to 31st march.
Difference between GDP and GNP
In GDP, goods and services produced
in a country are added, whether it is
produced by residents of the country
or foreigners.
In GNP, the production of foreigners
in the country is not included, while
the production of nationals outside
the country is included. In other
words, international trade is included
in calculation.
GNP = GDP + X – M
X = Export
M = Import
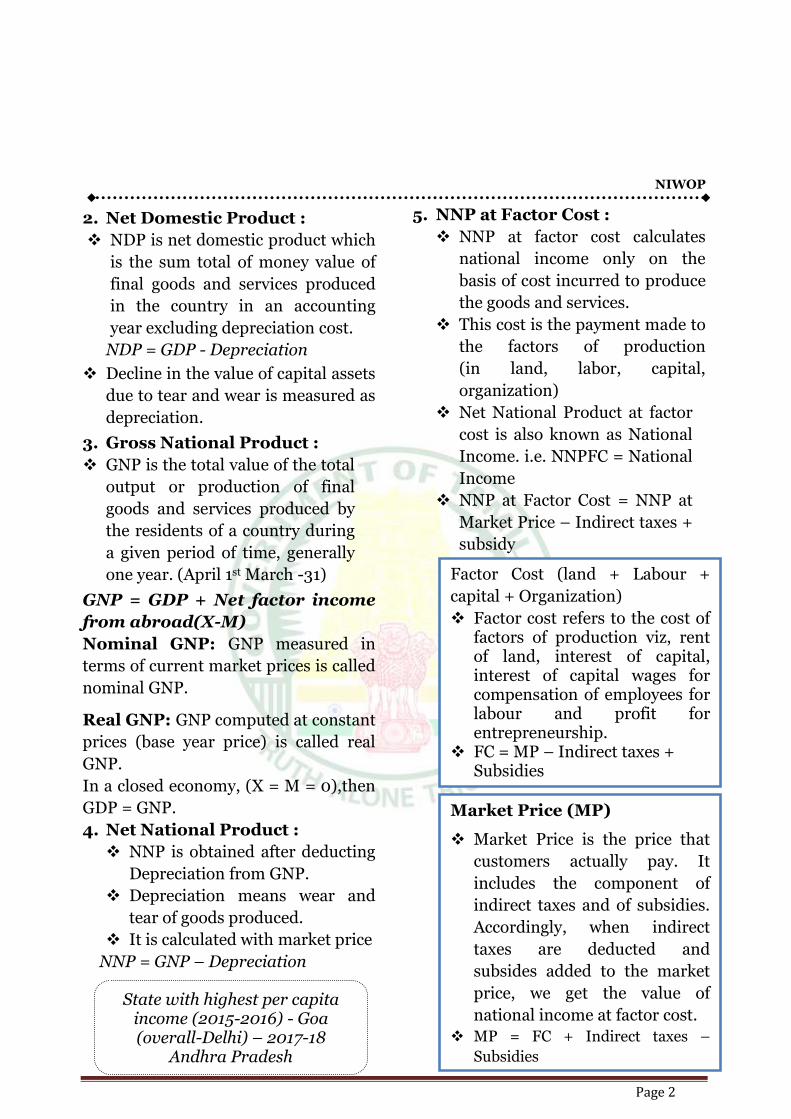
NIWOP
Page 2
2. Net Domestic Product :
NDP is net domestic product which
is the sum total of money value of
final goods and services produced
in the country in an accounting
year excluding depreciation cost.
NDP = GDP - Depreciation
Decline in the value of capital assets
due to tear and wear is measured as
depreciation.
3. Gross National Product :
GNP is the total value of the total
output or production of final
goods and services produced by
the residents of a country during
a given period of time, generally
one year. (April 1st March -31)
GNP = GDP + Net factor income
from abroad(X-M)
Nominal GNP: GNP measured in
terms of current market prices is called
nominal GNP.
Real GNP: GNP computed at constant
prices (base year price) is called real
GNP.
In a closed economy, (X = M = 0),then
GDP = GNP.
4. Net National Product :
NNP is obtained after deducting
Depreciation from GNP.
Depreciation means wear and
tear of goods produced.
It is calculated with market price
NNP = GNP – Depreciation
5. NNP at Factor Cost :
NNP at factor cost calculates
national income only on the
basis of cost incurred to produce
the goods and services.
This cost is the payment made to
the factors of production
(in land, labor, capital,
organization)
Net National Product at factor
cost is also known as National
Income. i.e. NNPFC = National
Income
NNP at Factor Cost = NNP at
Market Price – Indirect taxes +
subsidy
Factor Cost (land + Labour +
capital + Organization)
Factor cost refers to the cost of factors of production viz, rent of land, interest of capital, interest of capital wages for compensation of employees for labour and profit for entrepreneurship.
FC = MP – Indirect taxes + Subsidies
Market Price (MP)
Market Price is the price that
customers actually pay. It
includes the component of
indirect taxes and of subsidies.
Accordingly, when indirect
taxes are deducted and
subsides added to the market
price, we get the value of
national income at factor cost.
MP = FC + Indirect taxes –
Subsidies
State with highest per capita income (2015-2016) - Goa (overall-Delhi) – 2017-18
Andhra Pradesh .
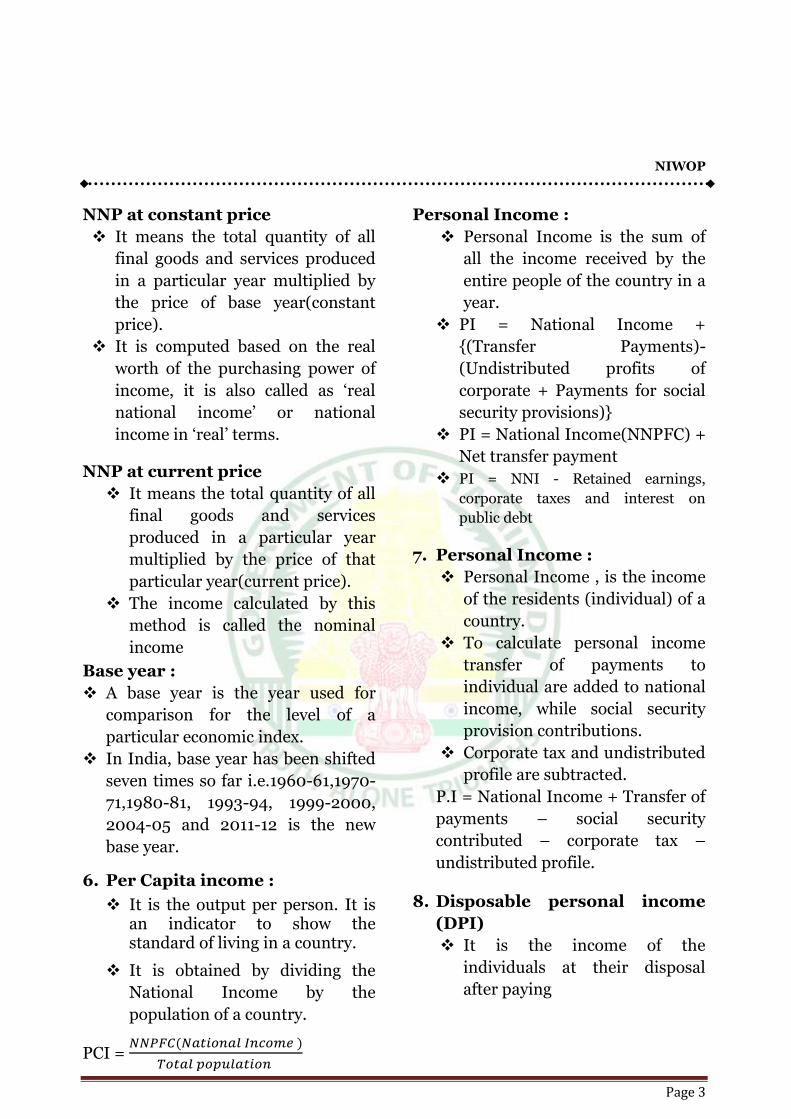
NIWOP
Page 3
NNP at constant price
It means the total quantity of all
final goods and services produced
in a particular year multiplied by
the price of base year(constant
price).
It is computed based on the real
worth of the purchasing power of
income, it is also called as ‘real national income’ or national income in ‘real’ terms.
NNP at current price
It means the total quantity of all
final goods and services
produced in a particular year
multiplied by the price of that
particular year(current price).
The income calculated by this
method is called the nominal
income
Base year :
A base year is the year used for
comparison for the level of a
particular economic index.
In India, base year has been shifted
seven times so far i.e.1960-61,1970-
71,1980-81, 1993-94, 1999-2000,
2004-05 and 2011-12 is the new
base year.
6. Per Capita income :
It is the output per person. It is an indicator to show the standard of living in a country.
It is obtained by dividing the
National Income by the
population of a country.
PCI =
Personal Income :
Personal Income is the sum of
all the income received by the
entire people of the country in a
year.
PI = National Income +
{(Transfer Payments)-
(Undistributed profits of
corporate + Payments for social
security provisions)}
PI = National Income(NNPFC) +
Net transfer payment
PI = NNI - Retained earnings,
corporate taxes and interest on
public debt
7. Personal Income :
Personal Income , is the income
of the residents (individual) of a
country.
To calculate personal income
transfer of payments to
individual are added to national
income, while social security
provision contributions.
Corporate tax and undistributed
profile are subtracted.
P.I = National Income + Transfer of
payments – social security
contributed – corporate tax –
undistributed profile.
8. Disposable personal income
(DPI)
It is the income of the
individuals at their disposal
after paying
NIWOP
Page 4
DPI = personal income – Direct taxes
(eg. Income tax) + Subsidy
National income growth :
National income growth at
current price = (national
income of this year at
current price - national
income of previous year at
current price)*100/(national
income of previous year at
current price)
It shows positive growth of
the country.
National income growth at
constant price = (national
income of this year at
constant price - national
income of previous year at
constant
price)*100/(national income
of previous year at constant
price)
It shows negative growth of the
country.
State income :
It refers to the total money value
of goods and services produced
in the state during a year.
Per capita state income can be
calculated by dividing state
income of the year by population
of the year in the state.
The state income is calculated in
the form of net state domestic
product at factor cost.
GDP Deflator:
It is a measure of the level of
prices of all domestically
produced goods and services in
an economy in a particular
period of time.
This is calculated to find the
overall rise in the level of price.
GDP Deflator = (Nominal GDP /
Real GDP) × 100
National Income series in India
National Income of India for the
post independence period has
been estimated in four different
series.
They are :
1. The conventional series
2. The Revised Series
3. A new series
4. CSO’s latest series (Central Statistical Organisation).
Methods of measuring national
income:
1. Product or Output method,
2. Income method,
3. Expenditure or Consumption
method
1. Product Method :
In this method, national income
is measured as a flow of goods
and services.
Here the measures of national
income are calculated by adding
the total value of the output
(goods and services) product by
all activities during any given
period, such as product or value June 29th National Statistics Day
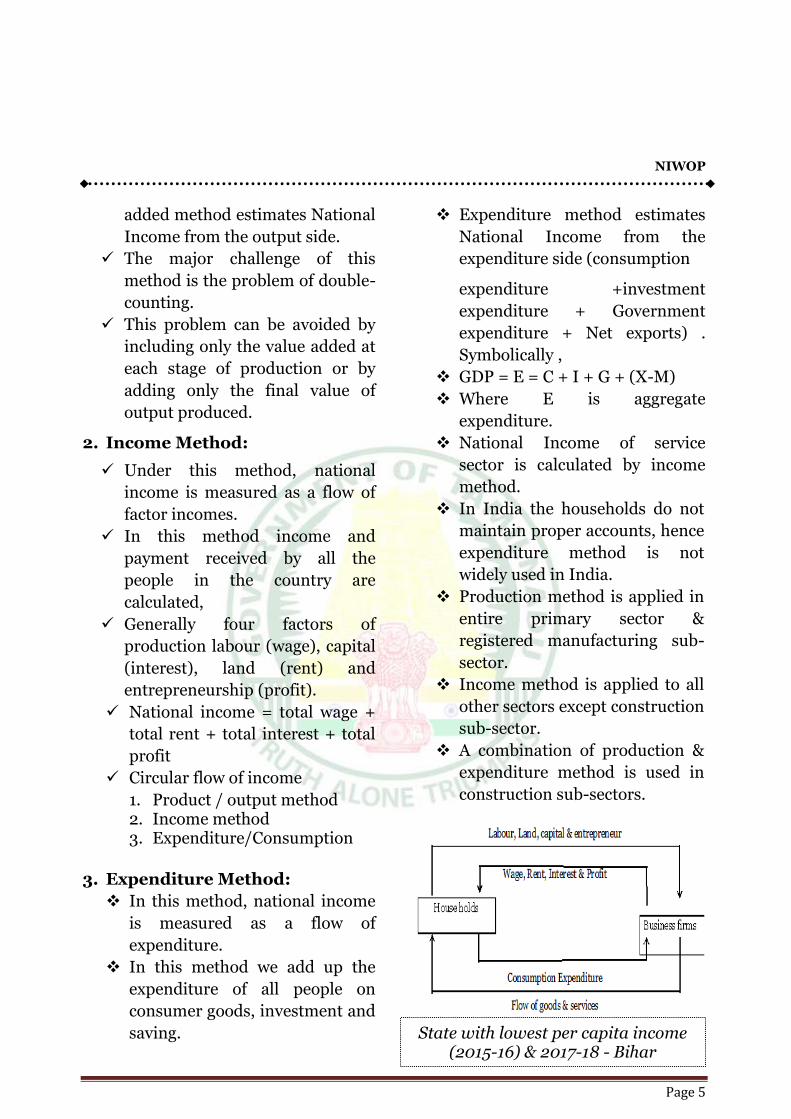
NIWOP
Page 5
added method estimates National
Income from the output side.
The major challenge of this
method is the problem of double-
counting.
This problem can be avoided by
including only the value added at
each stage of production or by
adding only the final value of
output produced.
2. Income Method:
Under this method, national
income is measured as a flow of
factor incomes.
In this method income and
payment received by all the
people in the country are
calculated,
Generally four factors of
production labour (wage), capital
(interest), land (rent) and
entrepreneurship (profit).
National income = total wage +
total rent + total interest + total
profit
Circular flow of income
1. Product / output method 2. Income method 3. Expenditure/Consumption
3. Expenditure Method:
In this method, national income
is measured as a flow of
expenditure.
In this method we add up the
expenditure of all people on
consumer goods, investment and
saving.
Expenditure method estimates
National Income from the
expenditure side (consumption
expenditure +investment
expenditure + Government
expenditure + Net exports) .
Symbolically ,
GDP = E = C + I + G + (X-M)
Where E is aggregate
expenditure.
National Income of service
sector is calculated by income
method.
In India the households do not
maintain proper accounts, hence
expenditure method is not
widely used in India.
Production method is applied in
entire primary sector &
registered manufacturing sub-
sector.
Income method is applied to all
other sectors except construction
sub-sector.
A combination of production &
expenditure method is used in
construction sub-sectors.
State with lowest per capita income (2015-16) & 2017-18 - Bihar
NIWOP
Page 6
Reconciliation of the three methods:-
Value added method Income method Expenditure method
Sum of GVAmp of all industrial sectors
Compensation of employee + Rent + Interest+ Profit
Private final consumption expenditure + Govt. final consumption expenditure + Gross domestic capital formation + Net exports
= GDP mp Consumption of fixed capital taxes Indirect taxes + Subsidies + Net factor income from abroad
= GDPFC + Net factor income from Abroad Taxes
= GDPmp Consumption of fixed capital Taxes Indirect taxes + Subsidies + Net factor income from abroad
= NNPFC = NNPFC = NNPFC
For calculation of National Income
CSO divided the economy into
Primary sector - extraction &
production of natural resources
(Agri, forestry, fishing, minoring,
quacking etc.)
Secondary sector - processing
of materials which have extracted at
primary state.
(Electricity, Jewellery, making gas
supply, registered & unregistered
manufacturing, water supply etc.)
Tertiary sector - Providing support
& services to primary & secondary
sector (Trade, Hotel, Transport,
Storage, Communication, Banking &
Insurance, Health, Education etc.)
Difficulties in the calculation of
National Income
1. Black money
2. Non-monetization
3. Double counting
4. Unscientific and unreliable
data
5. Exclusion of Household
services and social services.
Incremental Capital Output
Ratio (ICOR):
Capital to Output ratio is the
ratio between capital and
output.
COR = Capital / Output
It shows the amount of capital
required to produce a product.
It is used to are as a country’s level or production efficiency.
ICOR means the additional
amount of capital required to
produce additional product.
ICOR equals, Annual
investment, Annual increase
in GDP.
Indian Association for Research in National Income and Wealth
(IARNIW)-1964
NIWOP
Page 7
ICOR = Incremental Capital /
Incremental Output
It helps to calculate the
amount of capital investment
required to achieve a target
growth rate.
Growth Rate = Capital
Investment / ICOR
Higher levels of ICOR mean
that capital is not being used
efficiently to increase
production.
Estimates of National Income in
India :
The calculation of National
Income dates back to pre-
independence period.
Pre Independence :
In 1868, Dadabhai Naoroji
wrote a book named “Poverty and Un British Rule in India”. In that book, he estimated per
capita income of Indians as
20.
Other estimators are William
Digby in the year 1899,
Findlay Shirras in 1911, 1922
and in 1933,wadia and joshi in
1913, Shah and Khambatta in
1921, V K R V Rao during
1925-29 and 1931-32 and R C
Desai during 1931-40.
For the period of 1925-29 , Dr.
V.K.R.V.Rao calculated per
capita income of Indians as
76. He was the first person to
estimate National Income
scientifically with a proper
method in 1931-32 and
calculated PCI as 62.
He divided the entire
economy into 2 sectors viz
agriculture and industrial
sector.
Post Independence : Organizations In India Related To
National Income Accounts National Income Committee
(NIC) Government of India
appointed the NIC in August,
1949 with Prof. PC.
Mahalanobis as its Chairman
and Prof. D.R. Gadgil and Dr.
V.K.R.V. Rao as its two
members
For the estimation of national
income, it applied a mixture of
both ‘Product Method’ and the ‘Income Method’.
It divided the entire economy
into 13 sectors
It submitted its first report in
1951 and reported that the per
capita income was 265 .
It submitted its final report in
1954 and reported that the per
capita income was 246.50 for
the period of 1950-54.
Central Statistical
Organisation (CSO)
CSO was set up in 1949 in
Delhi.
NIWOP
Page 8
Functions-preparing and
publishing national accounts
statistics, industrial statistics,
conducting economic census.
The Industrial Statistics Wing
of CSO is located in Kolkata.
The first official estimate by
CSO was in 1956 with base year
1948-49.
National statistical organization
The Government of India
ordered the setting up of a
permanent National Statistical
Commission (NSC) on 1st
June 2005 under the
recommendations of the
Rangarajan Committee
(2000-01).
The NSC was constituted for the
first time on 12th July 2006 for
promoting statistical network in
the country.
It was then headed by prof SD
Tendulkar.
National Sample Survey Org
Set up in 1950 for conducting
large scale sample survey to
meet the data needs of the
country, for the estimation of
national income other
aggregate.
20th October : World Statistics Day
NIWOP
Page 9
RURAL DEVELOPMENT
Gram Swaraj Abhiyan
In continuation of “Gram Swaraj
Abhiyan”, started from 14th April
on the occasion of Ambedkar
Jayanti, Govt. of India has
extended it in 117 Aspirational
Districts identified by the NITI
Aayog.
This campaign which, undertaken
under “Sabka Sath, Sabka Gaon,
Sabka Vikas”, is to promote social
harmony, spread awareness about
pro-poor initiatives of the
government, reach out to poor
households to enroll them as also
to obtain their feedback on
various welfare programmes.
During this abhiyan, saturation of
eligible households/persons
would be made under seven
flagship pro-poor programmes
namely, Pradhan Mantri Ujjwala
Yojana, Saubhagya, Ujala scheme,
Pradhan Mantri Jan Dhan Yojana,
Pradhan Mantri Jeevan Jyoti
Bima Yojana, Pradhan Mantri
Suraksha Bima Yojana and
Mission Indradhanush.
In addition, 5 priority activities
under Education, Health,
Nutrition, Skills and Agriculture
also been identified as per district
plan.
About Mission Antyodaya
Mission Antyodaya is a convergence
framework for measurable effective
outcomes on parameters that
transform lives and livelihoods. Real
Difference comes about through
Convergence as it alone
simultaneously addresses multi
dimensions of poverty. Professionals,
Institutions and Enterprises make it
possible.
1. Evidence of convergence
reducing poverty, raising incomes
- IRMA Study.
2. ‘Communitization' through
Women SHGs improves
education, health, nutrition
indicators
3. Saturation approach creates
many more 'islands of success' –
Ex: Hivre Bazaar
4. Leveraging Bank loans promotes
an enterprise model.
NIWOP
Page 10
5. Many initiatives provide for
universal coverage of the eligible
beneficiaries - Ujwala, internet,
Bank accounts.
6. Integral positive co-relation
among infrastructure, human
development and sustainable
economic well-being.
7. 5000 islands of successful Rural
Clusters over 1000 days will be
transformational.
Mahatma Gandhi National
Rural Employment Guarantee
Act
The National Rural
Employment Guarantee Act
2005 (NREGA) is a social
security scheme that attempts
to provide employment and
livelihood to rural labours in
the country.
In an effort to make inclusive
and overall development a
reality, the NREGA was passed
as a labour law and
implemented across 200
districts in 2006. By 2008, it
came to cover the entire
country.
The scheme was designed to
provide any willing adult who
registers for rural employment,
a minimum job guarantee of
100 days each financial year.
This includes non-skilled work,
making it one-of-its-kind
across the world. It was later
renamed the Mahatma Gandhi
National Rural Employment
Guarantee Act (MGNREGA).
The MGNREGA is an
entitlement to work that every
adult citizen holds.
In case such employment is
not provided within 15 days of
registration, the applicant
becomes eligible for an
unemployment allowance.
The implementation of
MGNREGA was left to the Gram
Panchayats.
According to government
sources, since the inception of
the scheme, the government of
India has incurred a total
expenditure of INR 483399.51
crores towards the scheme,
thereby employing 72,85,831
NIWOP
Page 11
workers on 11,08,565 worksites
(data as on 01.10.2018).
The minimum wages initially
determined were INR 100 a
day, but later revised in
keeping with the state labour
employment conventions. The
minimum wages are now
determined by the states and
range between INR 163 in
Bihar to INR 500 in Kerala.
The MGNREGA has been at
the receiving end of much
criticism over the years. From
being criticised for
encouraging corruption to
increasing inequality to being
called an election card for the
UPA – the scheme has been
picked apart for a variety of
reasons.
Apart from causing a major
financial drain on the country’s
resources, the actual benefits
of the scheme do not reach the
rural labourers, detractors
claim.
Deen Dayal Upadhyaya
Grameen Kaushalya Yojana
(DDU-GKY) Antyodaya Diwas
The Ministry of Rural
Development (MoRD) announced
the Deen Dayal Upadhyaya
Grameen Kaushalya Yojana
(DDU-GKY) Antyodaya Diwas, on
25th September 2014. DDU-GKY
is a part of the National Rural
Livelihood Mission (NRLM),
tasked with the dual objectives of
adding diversity to the incomes of
rural poor families and cater to
the career aspirations of rural
youth.
DDU-GKY is uniquely focused on
rural youth between the ages of 15
and 35 years from poor families.
As a part of the Skill India
campaign, it plays an
instrumental role in supporting
the social and economic programs
of the government like the Make
In India, Digital India, Smart
Cities and Start-Up India, Stand-
Up India campaigns.
Over 180 million or 69% of the
country’s youth population
NIWOP
Page 12
between the ages of 18 and 34
years, live in its rural areas.
Of these, the bottom of the
pyramid youth from poor families
with no or marginal employment
number about 55 million.
Pradhan Mantri Suraksha
Bima Yojana(PMSBY)
The Scheme is available to people
in the age group 18 to 70 years
with a bank account who give
their consent to join / enable
auto-debit on or before 31st May
for the coverage period 1st June to
31st May on an annual renewal
basis.
Aadhar would be the primary KYC
for the bank account. The risk
coverage under the scheme is Rs.2
lakh for accidental death and full
disability and Rs. 1 lakh for partial
disability.
The premium of Rs.12 per annum
is to be deducted from the account
holder’s bank account through
‘auto-debit’ facility in one
installment.
The scheme is being offered by
Public Sector General Insurance
Companies or any other General
Insurance Company who are
willing to offer the product on
similar terms with necessary
approvals and tie up with banks
for this purpose.
DEENDAYAL ANTYODAYA
YOJANA - NRLM
Aajeevika - National Rural
Livelihoods Mission (NRLM) was
launched by the Ministry of Rural
Development (MoRD),
Government of India in June
2011.
Aided in part through investment
support by the World Bank, the
Mission aims at creating efficient
and effective institutional
platforms of the rural poor,
enabling them to increase
household income through
sustainable livelihood
enhancements and improved
access to financial services.
NRLM set out with an agenda to
cover 7 Crore rural poor
households, across 600 districts,
6000 blocks, 2.5 lakh Gram
Panchayats and 6 lakh villages in
the country through self-
NIWOP
Page 13
managed Self Help Groups
(SHGs) and federated institutions
and support them for livelihoods
collectives in a period of 8-10
years.
In addition, the poor would be
facilitated to achieve increased
access to rights, entitlements and
public services, diversified risk
and better social indicators of
empowerment. DAY-NRLM
believes in harnessing the innate
capabilities of the poor and
complements them with
capacities (information,
knowledge, skills, tools, finance
and collectivization) to
participate in the growing
economy of the country.
In November 2015, the program
was renamed Deendayal
Antayodaya Yojana (DAY-
NRLM).
National Social Assistance
Programme(NSAP)
The National Social Assistance
Programme(NSAP) which came
into effect from 15th August,1995
represents a significant step
towards the fulfillment of the
Directive Principles in Article 41
of the Constitution.
The programme introduced a
National Policy for Social
Assistance for the poor and aims
at ensuring minimum national
standard for social assistance in
addition to the benefits that
states are currently providing or
might provide in future.
NSAP at present, comprises of
Indira Gandhi National Old Age
Pension Scheme (IGNOAPS),
Indira Gandhi National Widow
Pension Scheme (IGNWPS),
Indira Gandhi National Disability
Pension Scheme (IGNDPS),
National Family Benefit Scheme
(NFBS) and Annapurna.
Saansad Adarsh Gram Yojana
(SAANJHI)
The Scheme was launched on 11th
October, 2014 - Lok Nayak Jai
Prakash Narayan Ji’s birth
anniversary – at Vigyan Bhawan,
New Delhi.
The goal is to develop three
Adarsh Grams by March 2019, of
which one would be achieved by
NIWOP
Page 14
2016. Thereafter, five such
Adarsh Grams (one per year) will
be selected and developed by
2024.
Inspired by the principles and
values of Mahatma Gandhi, the
Scheme places equal stress on
nurturing values of national
pride, patriotism, community
spirit, self-confidence and on
developing infrastructure.
The SAANJHI will keep the soul
of rural India alive while
providing its people with quality
access to basic amenities and
opportunities to enable them to
shape their own destiny.
Village Grain Bank Scheme:
I. This scheme was implemented by
the department of food and public
distribution.
II. Main objective of this scheme is to
provide safeguard against the
starvation during the period of
natural calamity or during lean
season when the marginalized food
insecure households do not have
sufficient resources to purchase
rations.
III. Under this scheme needy people
will be able to borrow food grains
from the village grain bank and
return it when they have abundant
food.
National Rural Health Mission:
I. The National Rural Health
Mission (NRHM), now under
National Health Mission is
initiated on 12 April, 2005.
II. Main aim of this plan is to
provide accessible, affordable and
accountable quality health
services even to the poorest
households in the remotest rural
regions.
III. Accredited social health
activists (ASHA) scheme is also
operational under this scheme.
IV. It is run by the ministry of
health and family welfare.
Aam Aadmi Bima Yojna:
I. It was launched on october2,
2007.
II. It’s a social security scheme for
rural households.
III. Under this scheme one member
of the family is covered.
IV. The premium of Rs. 200 per
person per annum is shared by the
state and central government.
NIWOP
Page 15
V. The insured person need not to
pay any premium if his/her age is
between the 18 years to 59years.
Kutir Jyoti Programme:
I. This programme was launched in
1988-89.
II. Its main motive was to improve
the standard of living of schedule
castes and schedule tribes including
the rural families who live below the
poverty line.
III. Under this programme, a
government assistance of Rs. 400 is
provided to the families who are
living below the poverty line for
single point electricity connections
in their houses.
Sarva Siksha Abhiyan:
I. SSA has been operational since
2000-2001.
II. Its main aim is to make free and
compulsory education to children
between the ages of 6 to 14, a
fundamental right.
III. This programme was pioneered
by former Indian Prime Minister Atal
Bihari Vajpayee.
IV. Right to education is related to
the 86th Amendment 2002 to the
Constitution of India.
V. Currently its expenditure is
shared by the centre and state into
50: 50 ratios.
Rural Development
Programmes
Community Development
Programme (CDP) - 1952.
National Fund for Rural
Development (NFRD) - 1984.
Council for Advancement of
People's Action & Rural
Technology(CAPART) - 1986.
Supply of Improved Toolkits to
Rural Artisans (SITRA) - 1992.
District Rural Development
Programme (DRDP) - 1993.
Jawahar Gram Samridhi Yojana -
1999.
Pradhan Mantri Gram Sadak
Yojana - PMGSY - 2000(link all
villages with pucca roads)
Bharat Nirman Programme -
2005.
Twenty Point Programme - 1975.
National Rural Drinking Water
Programme (NRDWP) - 2009.
Member of Parliament Local Area
Development Programme
(MPLAD) - 1993.
POPULATION
Page 1
Population refers to the total
number of people residing in a
country. Whether a big and growing
population is an asset or a liability
for the economy depends on the
respective economic conditions of a
country.
It is an asset when it provides
workforce to produce, market for
the products and facilitates division
of labour and innovation. However
a big population becomes a liability
when demand for food,
infrastructure, health and other
facilities exceed its supply.
India’s population in 1901 was
23.84 crores. After 100 years in
2001 it increased more than four
times and stood at 102.27 crores.
As per the census 2011, population
stands at 121.02 crores. India has
only about 2.4% of the world’s area
and less than 1.2% of the world’s
income but accommodates about
17.5% of the world’s population. In
other words every sixth person in
the world is an Indian.
DEMOGRAPHY
Demography is the statistics study
of the size, density, territorial,
distribution, composition growth
and composition of population,
change therein and the components
of such changes.
Birth Rate and Death Rate:
Birth rate refers to number of birth
per thousand of population.
Similarly death rate refers to
number of deaths per thousand of
population. Growth Rate = Birth
Rate – Death Rate. In 2010 – 11,
birth rate stood at 22.1 and death
Rate. In 2010-11, birth rate stood at
22.1 and death rate 7.2.
Density of Population:
This refers to the number of persons
per square kilometre. In 1951 it was
117 and in 2001 it has gone upto
324. In 2011 it has further increased
to 382. Density of population is not
same for all the states.
Sex Ratio:
This refers to the number of females
per 1000 males.
POPULATION & CENSUS
Page 2
In 1951 it was 946 and in 2001 it has
declined to 933. In 2011 it
marginally improved and stood at
940.
Only in Kerala and Pondicherry the
sex ratio is favourable to females. It
was 1,084 females in Kerala and
1038 females in Puducherry for
1000 males as per 2011 census.
Life Expectancy at Birth:
This refers to the mean expectation
of life at birth. Life expectancy has
improved considerably over the
years. In 1951 it was only 32.1 years.
In 2001 it has gone up to 63.8 years.
In 2011 it has gone up to 65.3 years.
Literacy Ratio:
This refers to number of literates as
a percentage of total population.
This has gone up from mere 16.7%
in 1951 to 65.38 in 2001.
In 2011 literacy rate stood at
74.04%. Male literacy rate was
82.14% and female literacy rate was
65.46%. Kerala has the highest
literacy rate. It was 93.91%.
Literacy rate in Bihar is the lowest.
It was 63.82%.
Urban-Rural Population:
As per the 2011 census 31.16%
population of the country is urban
based while the 68.84% population
is rural based.
Population Explosion
Population explosion means the
alarming and rapid rate of increase
in population.
Causes Of Population Explosion
Early Marriage
Poverty
low Standard of living
Illiteracy
social and religious reasons
high birth rate
low death rate
Population Explosion as an
obstacle to Economic
Development
Food Shortage
Burden of unproductive
Consumers Reduction in
National and Per Capita Income
Low savings and investment
Reduction in Capital Formation
Unemployment and
Underemployment
Loss of Women’s Labour
Low Labour efficiency
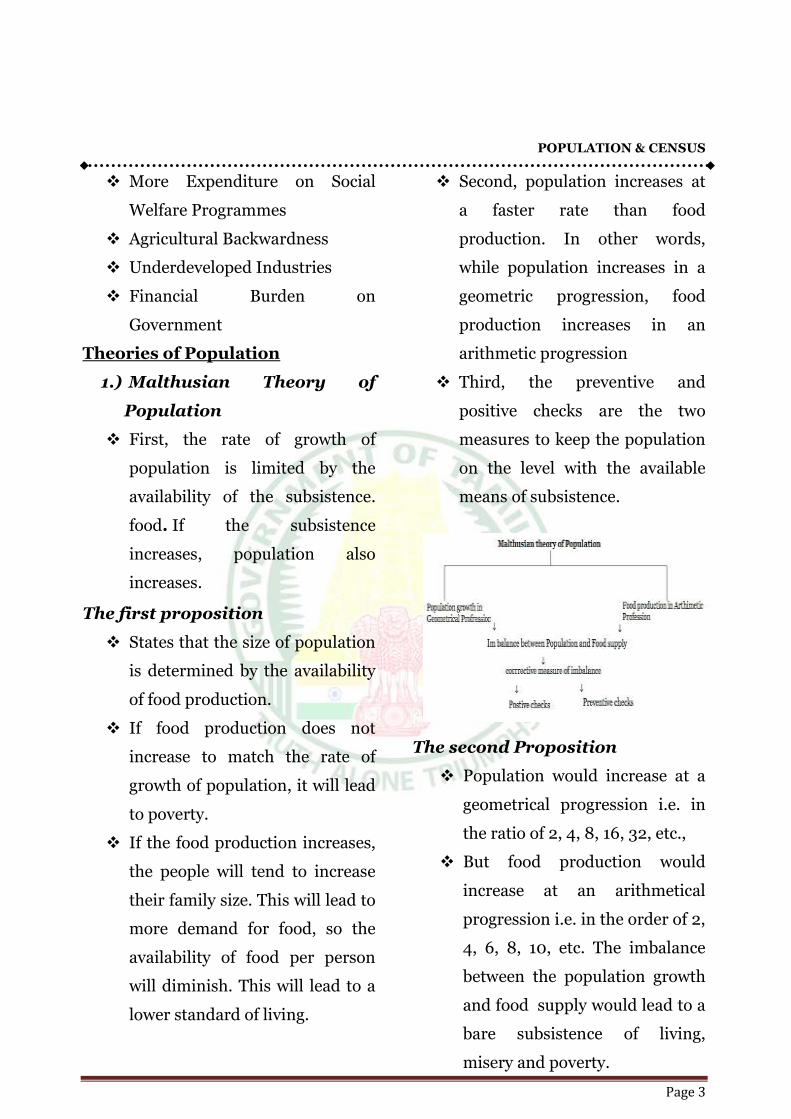
POPULATION & CENSUS
Page 3
More Expenditure on Social
Welfare Programmes
Agricultural Backwardness
Underdeveloped Industries
Financial Burden on
Government
Theories of Population
1.) Malthusian Theory of
Population
First, the rate of growth of
population is limited by the
availability of the subsistence.
food. If the subsistence
increases, population also
increases.
Second, population increases at
a faster rate than food
production. In other words,
while population increases in a
geometric progression, food
production increases in an
arithmetic progression
Third, the preventive and
positive checks are the two
measures to keep the population
on the level with the available
means of subsistence.
The first proposition
States that the size of population
is determined by the availability
of food production.
If food production does not
increase to match the rate of
growth of population, it will lead
to poverty.
If the food production increases,
the people will tend to increase
their family size. This will lead to
more demand for food, so the
availability of food per person
will diminish. This will lead to a
lower standard of living.
The second Proposition
Population would increase at a
geometrical progression i.e. in
the ratio of 2, 4, 8, 16, 32, etc.,
But food production would
increase at an arithmetical
progression i.e. in the order of 2,
4, 6, 8, 10, etc. The imbalance
between the population growth
and food supply would lead to a
bare subsistence of living,
misery and poverty.
POPULATION & CENSUS
Page 4
The third proposition
Imbalance is corrected by two
checks namely preventive checks
and positive checks.
1. Preventive checks are applied by
man to reduce the population. It
include late marriage, self-
restraint and other similar
measures applied by people to
limit the family.
2. Positive checks affect population
growth by increasing death rate.
It includes Common diseases,
plagues, wars, famines
unwholesome occupations,
excess labour, exposure to the
seasons, extreme poverty, bad
nursing of children are a few
examples for positive checks,
The Theory of Optimum
Population
Modern economists such as
Sidgwick, Cannon, Dalton and
Robbins have propagated this
theory.
Optimum population means the
ideal population relative to the
natural resources, stock of capital
equipment and state of technology
In other words, optimum
population is that level of
population at which per capita
output is the highest.
A country is said to be under
populated if the population is less
than the optimum and
overpopulated if the population is
more than the optimum.
3. The following formula measures
whether population at a point of
time is optimum or not
M = A-O
O
Where,
M = Maladjustment in level of
output
A = Actual population
O = Optimum population
If M is zero, then the total
population is equal to
optimum population
If M is positive, the total
population is more than the
optimum population.
If M is negative, the total
population is less than the
optimum population
11th July - World population day

POPULATION & CENSUS
Page 5
The Theory of Demographic
Transition
It was given by Frank W. Notestein
The demographic transition brings
out the relationship between
fertility and motility, i.e. between
the birth rate and the death rate.
Birth rate refers to the number of
births occurring per 1000 in a
year.
Death rate refers to the number of
deaths occurring per 1000 in a
year. This theory explains the
changes in these rates as a
consequence of economic
development. This theory points out
that there are three distinct stages
of population growth.
Stage I: High Birth Rate
and High Death Rate
In the first stage, the country is
backward and less developed.
Agriculture will be the main
occupation of the people. The
standard of living of the people will
be low.
The high death rate is due to poor
diets, improper sanitation and lack
of proper medical facilities.
Birth rate is high on account of
widespread illiteracy, ignorance of
family planning techniques, early
marriages, social beliefs, customs
and attitudes of the people.
In this stage, the rate of growth of
population is not high since high
birth rate is offset by the high death
rate and the population growth
stagnates.
Stage II: High Birth Rate
and Low Death Rate
As a country advances, it might
result in increase in industrial
activity, creating more
employment opportunities.
This will raise the national and
per capita income of the people,
thereby increasing their standard
of living.
The advancement in science and
technology will result in the
availability of better medical
facilities.
The eradication of many
epidemics and dangerous
diseases and better sanitary
conditions reduce the disease and
death.
The birth rate still remains high
due to the resistance to change,
and the long established customs
and beliefs.
POPULATION & CENSUS
Page 6
Stage III: Low Birth Rate
and Death Rate
Economic development leads to
change in the structure of the
economy from an agrarian to a
partially industrialised.
With the increase in
industrialisation, people migrate
from rural to urban areas, and
there is a change in the attitude of
the people.
With the spread of education,
people prefer small families in
order to increase the standard of
living. Thus the birth rate is
reduced.
Implementation of better medical
facilities, control of disease and
public sanitation result in low
death rate.
Steps to check rapid growth of
population
Couple Protection Rate (CPR)
should be increased
Infant Mortality rate (IMR)
should be reduced
Industrialisation of the country
Increase in Female Literacy
Rate and Education
Late Marriages must be
encouraged
Strict laws must be made and
enforced to check early
marriages and polygamy.
Family Planning
Population Policy
Father of India census L. Mayo
First census was taken during
1872
Census was taken once in 10
years
Prime Minister was the head of
the National Population
committee.
India was the first developing
country to adopt a population
policy and to launch a nationwide
family planning programme in
1952.
The main objective of the
population policy is to ensure
that there is reasonable gap
between the fall of death and
birth rates.
Population policy refers to the
efforts made by any Government
to control and change the
population structure.
Highest populated state in India –Uttar Pradesh
POPULATION & CENSUS
Page 7
Demographic gap :
It is the difference between the
birth rate and death rate of
population of a country.
Demographic dividend. It refers
to an opportunity before a
country with a high share of
population between the ages of
15 and 64 to boost economic
growth. Population pyramid it is
a graphical illustration of the
different age group in a
population along with the male
and female population.
Population Trend in India
1891 – 1921 Period of Stagnant
population
1921 – 1951 Period of steady
growth
1951 – 1981 Period of rapid
declining rate
1981 – 2011 Period of slow
declining rate
The year 1921 is known as the
Year of Great Divide.
National Population Policy –
2000.
With a view to encourage two-
child norm and stabilizing
population by 2046 A.D. the
Government adopted the
National Population Policy (NPP-
2000). The following are the
main feature of the NPP.
1. Address the unmet needs for
basic reproductive and child
health service, supplies and
infrastructure.
2. Make school education up to age
14 which is free and compulsory,
and reduce dropouts at primary
and secondary school levels to
below 20 percent for both boys
and girls.
3. Reduce infant mortality rate
below 30 per 1000 live births.
4. Reduce maternal mortality ratio
to below 100 per 100,000 live
births.
5. Achieve universal immunization
of children against all
preventable diseases.
6. Promote delayed marriage for
girls, not earlier than age 18 and
preferably after 20 years of age.
7. Achieve 80 per cent institutional
deliveries and 100 percent
deliveries by trained persons.
8. Achieve universal access to
information / counselling, and
services for fertility
POPULATION & CENSUS
Page 8
regularization and contraception
with a wide basket of choices.
9. Achieve 100 percent registration
of births, deaths, marriage and
pregnancy.
10. Prevent and control
communicable diseases.
11. Integrate Indian System of
Medicine (ISM) in the provision
of reproductive and child health
services and in reaching out to
households.
12. Promote vigorously the small
family norms to achieve
replacement levels of TFR.
The National Commission on
Population
The National Commission on
Population was constituted on May
11, 2000 under the Chairmanship of
the Prime Minister to provide
overall guidance for population
stabilization by promoting synergy
between demographic, educational,
environmental and developmental
programmes.
On May 19, 2005 the National
Commission on Population was
reconstituted. This commission has
now been transferred from Planning
Commission to Ministry of Health.
Population Census 2011 (At a Glance)
Total Population of the Country (Census 2011) 121.02 core
Percentage of World Population (2011) 17.5 percent
Total Urban Population (2011) 37.7 core
Sex Ratio (2011) 940
Child Sex Ratio (2011) (Female child / 1000 male children) 913
State with highest Female – Male Ratio (2011) Kerala (1084)
Birth rate (2010) 22.1 per thousand
population
Death rate (2010) 7.2 per thousand
population
Infant Mortality Rate (2010) 47 per thousand
Highest population density
Bihar
POPULATION & CENSUS
Page 9
Rural
Urban
51
31
Life Expectancy (At the time of birth) 63.5 years
Male (2002-06) 62.6 years
Female (2002 – 06) 64.2 years
Literacy Rate (2011)
Male
Female
74.4 percent
82.14 percent
65.46 percent
State with Highest Literacy (2011) Kerala (93.91%)
State with Lowest Literacy (2011) Bihar (63.82%)
Highlights of 2011 census
The population of India 1210.2
million is almost equal to the
combined population of USA,
Indonesia, Brazil, Pakistan,
Bangladesh and Japan
The population has grown by more
than 191 million during the decade
2001-2011.
2001-2011 is the first decade (with
the exception of 1911-1921) which
has added lesser population
compared to the previous decade.
Overall sex ratio at the national
level has increased by 7 points since
Census 2011 to reach 940.
Dependency ratio (children below
15 and elderly above 64) – ratio of
children and elderly to those in the
working age has shrunk from 0.6 to
0.55.
POPULATION & CENSUS
Page 10
TERMS YOU SHOULD KNOW
Aadhar
Aadhar is a 12-digit unique number, which the Unique Identification Authority
of India (UIDAI) will issue to residents of India on a voluntary basis. The
number will be generated randomly and will not be based on any
classification. The number will be linked to the basic biometric information of
the person, including photograph, iris and fingerprints.
Aadhar is meant to provide a unique identity to individuals and eliminating the
duplicate and fake identities existing in government records. It will help the
government in better targeting its services and benefits based on their needs.
1st Aadhar card given in – September 29th, 2010.
UIDAI (Unique Identification Authority of India)
UIDAI is an office under the planning Commission of India, which was set up in
January, 2009, to issue unique identify numbers to people in the country and own
and operate the Aadhar number database on an on-going basis. The agency will
issue only the number and not the smart cards. The agency is headed by a
chairman, who holds a cabinet rank. The first and current Chairman of UIDAI is
Nandan Nilekani, former Co-chairman of Infosys Technologies. The Government
plans to give statutory status to UIDAI through the National Identification
Authority of India Bill, 2010, which is yet to be passed by Parliament
India is currently in 3rd stage (low Birth rate and death Rate)
POPULATION & CENSUS
Page 11
Poverty and Unemployment
The Copenhagen Declaration 1995
at the “World Summit on Social
Development” describes poverty as
“a condition characterized by
severe deprivation of basic human
needs such as food, shelter, safe
drinking water, sanitation, health,
education, and information”.
The World Bank(1990) has
defined Poverty as the inability to
attain a minimal standard of
living.
The UN Human Rights Council has
defined poverty as, “a human
condition characterized by the
sustained or chronic deprivation of
the resources, capabilities, choices,
security and power necessary for
the enjoyment of an adequate
standard of living and other civil,
cultural, economic, political and
social rights”.
In the words of Dandekar
(1981) “want of adequate income,
howsoever defined is
poverty” Thus, lack of adequate
income to buy the basic goods for
subsistence living is an important
element in the definitions of
poverty.
It is a social phenomenon in which a
section of the society was unable to
satisfy its basic minimum needs.
Types of Poverty :
1. Absolute Poverty
It refers to a condition where a
person does not have the
minimum amount of income
needed, to meet the minimum
requirements for basic needs as
per national standards.
2. Relative Poverty :
It is an extreme form of
inequality.
It depends on the standards
being applied and implies that
within a particular society a
given standard of living is
unacceptably low.
Relative Poverty measure is used
to calculate inequality in the
society.
It refers to poverty on the basis
of comparison of per capita
income of different countries.
3. Temporary or Chronic Poverty
In countries like India, when
there is poor rainfall, the crops
fail and the farmers temporarily
enter into a poverty sample.
POVERTY AND EMPLOYMENT
Page 12
But when they are poor for long,
then we call it chronic or
structural poverty.
4. Primary and Secondary
Poverty
Rowntree (1901) made a distinction
between primary poverty and
secondary poverty.
Primary poverty refers to “families
whose total earnings are
insufficient to obtain the minimum
necessities for the maintenance of
merely physical efficiency”. “
Secondary poverty refers to a
condition in which earnings would
be sufficient for the maintenance
for merely physical efficiency were
it not that some portion of it is
absorbed by other expenditure,
either useful or wasteful such as
drink, gambling and inefficient
housekeeping.”
Extent of Poverty in India:
The extent of poverty in a country
depend mainly on two factors:
1. The average level of national
income.
2. The degree of inequality in its
distribution.
Measures of Poverty
Poverty Line :
Poverty line is the line, which
indicates the level of purchasing
power required to satisfy the
minimum needs of a person.
This lines divides the population
in two groups, one of those who
have this purchasing power or
more and the other groups of
those people, who do not have
this much of purchasing powers.
The former group is regarded as
livings above the poverty line
(APL). Those people are not
regarded as poor.
The latter group is considered as
living below the poverty line
these people are called poor.
Multi - Dimensional poverty
Index (MPI)
It was developed in 2010, by
Oxford Poverty and Human
Development initiative and the
United Nations Development
Programme.
It uses different factors to
determine poverty beyond
income - based lists. It uses a
range of deprivations that affect
an individual's life.
POPULATION & CENSUS
Page 13
This measure assesses the nature
and intensity of poverty at the
individual level in education,
health outcomes and standard of
living. The MPI is calculated as
follows
MPI = H x A
Where, H = Percentage of people,
who are MPI poor (incidence of
poverty)
A = Average intensity of MPI
poverty across the poor (%)
Human Poverty Index (HPI)
Earlier UNDP set HPI as
parameter to measure poverty in
its Human Development Reports
but 2010 onwards it switched over
to a new parameter, namely -
Multidimensional Poverty Index
(MPI)
The measures assesses the nature
and intensity of poverty at the
individual level in education.
Health outcomes and standards of
living.
Poverty Gap Index (PGI)
It is the difference between the
poverty line and the average
income of households living
below poverty Line (BPL),
expressed as a percentage of
poverty line.
It indicates the depth and
severity of poverty.
Squared poverty Gap Index
It is the mean of the squared
individual poverty gaps relative to
the poverty line.
It indicates the severity of poverty
as well as the inequality among the
poor.
Causes of Rural Poverty :
Rapid Population Growth,
Lack of alternate employment
opportunities other than
agriculture,
Illiteracy,
Regional Disparities,
Child Marriage,
Joint Family System,
Lack of proper implementation
of Public Distribution System
(PDS).
Causes of Urban Poverty :
Migration from rural areas,
Lack of skilled labour,
Lack of housing facilities,
POVERTY AND EMPLOYMENT
Page 14
Lack of vocational education and
training,
Less job opportunities in cities.
Poverty Alleviation through five
year plans:
These plans aim to set up a
socialistic pattern of society
based on equality and justice.
1. The First Five Year Plan(1951-
56) was agriculture oriented to
solve the food problems.
2. The Fourth Five Year Plan(1969-
74) aimed to reduce the price
level.
3. The Fifth Five Year Plan (1974-
79) took measures for raising the
purchasing capacity of the
people living below the poverty
line.
4. The Seventh (1980-85) aimed to
remove poverty and to attain self
sufficiency in food production.
5. Tenth Five Year Plan(1997-
2002) was introduced to double
the per capita income of Indians.
Estimation of Poverty in India :
1. Mr.V.M.Dandekar and Mr.Nilkanda
Rath :
They estimated the value of diet
with 2250 calories as the desired
level of nutrition.
Using this cut-off, they stated
that about 177 million people
were poor in 1960-61 and about
216 million in 1968-69.
3. Montek Singh Ahluwalia’s Study of
Rural Poverty(1977)
He studied the trends in
incidence of rural poverty in
India for the period 1956-57 to
1973-74.
He used the concept of poverty
line, i.e., an expenditure level of
15 in rural areas in 1960-61 and
20 per person for urban areas.
4. Estimate of Poverty by Seventh
Finance Commission(1978):
7th FC made an attempt to have
a more inclusive concept of
poverty line. (the augmented
poverty line.)
Alagh Committee (1977)
Chairman : YK Alagh.
Submitted its report in 1979.
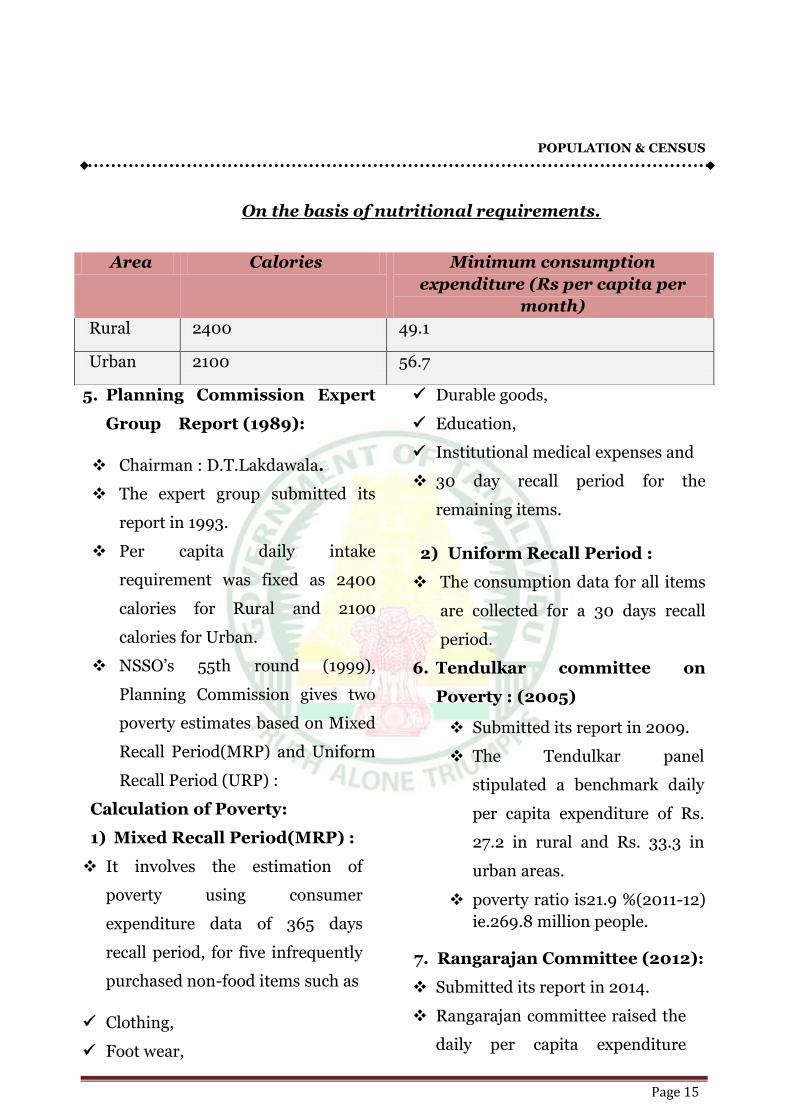
POPULATION & CENSUS
Page 15
On the basis of nutritional requirements.
5. Planning Commission Expert
Group Report (1989):
Chairman : D.T.Lakdawala.
The expert group submitted its
report in 1993.
Per capita daily intake
requirement was fixed as 2400
calories for Rural and 2100
calories for Urban.
NSSO’s 55th round (1999),
Planning Commission gives two
poverty estimates based on Mixed
Recall Period(MRP) and Uniform
Recall Period (URP) :
Calculation of Poverty:
1) Mixed Recall Period(MRP) :
It involves the estimation of
poverty using consumer
expenditure data of 365 days
recall period, for five infrequently
purchased non-food items such as
Clothing,
Foot wear,
Durable goods,
Education,
Institutional medical expenses and
30 day recall period for the
remaining items.
2) Uniform Recall Period :
The consumption data for all items
are collected for a 30 days recall
period.
6. Tendulkar committee on
Poverty : (2005)
Submitted its report in 2009.
The Tendulkar panel
stipulated a benchmark daily
per capita expenditure of Rs.
27.2 in rural and Rs. 33.3 in
urban areas.
poverty ratio is21.9 %(2011-12)
ie.269.8 million people.
7. Rangarajan Committee (2012):
Submitted its report in 2014.
Rangarajan committee raised the
daily per capita expenditure
Area Calories Minimum consumption
expenditure (Rs per capita per
month)
Rural 2400 49.1
Urban 2100 56.7
POVERTY AND EMPLOYMENT
Page 16
limits to Rs. 32.4 in rural and Rs.
46.9 in urban areas.
poverty ratio is 29.5%(2011-
12)ie.361 million people
Nature of poverty in india :
According to Rangarajan Committee
(2011-12) ,
State having maximum rural and
urban poverty - Odisha.
State having minimum rural and
urban poverty - Mizoram (Overall
Delhi).
According to world bank report
(2015) State having the highest
MPCE (Monthly Per Capita
Consumption Expenditure)
Kerala.
State having the lowest MPCE
( rural) Kerala
State having the lowest
MPCE(urban) Haryana
Committee on urban Slum
Statistics (2010)- Pranab Sen
Projected slum population in the
country for the year 2011 at 93.06
million
It has defined a slum as “a compact
settlement of at least 20 households
with a collection of poorly built
tenements, mostly of temporary
nature, crowded together usually
with inadequate sanitary and
drinking water facilities in
unhygienic conditions”.
Recent effort by Government:
In 2014, the NDA Government has
constituted a 14-member task force
under Arvind Panagariya to come
out with recommendations for a
realistic poverty line.
Committees related to poverty : SR Hashim Committee report on
Urbanpoor (2010- 2012) stated that roughly 35 per cent of urban Indian households live below poverty line (BPL). The highest fraction of Urban Poors are in Manipur . On the other hand, least proportion of Urban poor in India are in Goa.
Dr. N.C. Saxena Committee on rural
poor(2009) mentioned that the percentage of people entitled to BPL status should be revised upwards to
at least 50%C.Subramaniam former union Agricultural Minister headed the panel to U.N.O. to fight poverty and hunger in developing countries in the early 1970s'
First United Nations Decade for the
Eradication of Poverty
(1997-2006)
POPULATION & CENSUS
Page 17
Poverty alleviation programmes
The problem of poverty
eradication is one of providing
employment and raising the
productivity of low level of
employment. The following
measures have been taken by the
government to remove poverty
from the country.
1. Land Reforms
Land reforms legislation has
been passed by the state
governments, which aim at
improving the economic
conditions of agricultural
landless labourers.
Every state has passed the
necessary legislation fixing
ceiling on agricultural holdings
by which the maximum amount
of land which a person can hold
has been fixed by law.
The surplus lands thus acquired
were to be distributed to the
landless labourers and small
peasants.
National Social Assistance
Programme (NSAP)
It was launched on August 15,
1995 to provide social assistance
benefits to poor households
affected by old age, death of
primary bread winner or need
for maternity care.
8. IRDP: Integrated Rural
Development Programme 1980
All round development of the
rural poor through a
programme of asset
endowment for self-
employment
PMGY: Pradhan Mantri
Gramodya Yojana 2000
Focus on village level
development in 5 critical areas.
i.e. primary health, primary
education, housing, rural
roads and drinking water and
nutrition with the overall
objective of improving the
quality of life of people in rural
areas.
Annapurna Scheme
o 2000
o To ensure food security for all,
create a hunger free India in the
next five serve the poorest of the
poor in rural and urban areas.
POVERTY AND EMPLOYMENT
Page 18
Food for Work Programme
o 2001
o To give food security for all,
create a hunger free India in
the next five years, the poorest
of the poor in rural and urban
areas.
RAY: Rajeev Awaas Yojana
o 2010
o To make India slum free in
next 5 years
Nirmal Bharat Programme
o 2012
o To eradicate the practice of
open defecation by 2020
Direct Benefit Transfer
o 2013
o Anti-Poverty programme,
aimed to transfer subsidies
directly to the bank accounts
of people living below
poverty line.
CDP : Community
Development Programme
o 1952
o Overall development of rural
areas with peoples
participation
NFRD: National Fund for
Rural Development
o 1984
o To grant 100% tax rebate
to donors
CAPART: Council for
Advancement of People’s
Actions and Rural
Technology
o 1986
o To provide assistance for rural
prosperity
DRDA: District Rural
Development Agency
o 1993
o To provide financial assistance
for rural development
PMGSY: Pradhan Mantri
Gram Sadak Yojana
o 2000
o To line all villages with pakka
road
Bharat Nirman Programme
o 2005
o Development of rural
infrastructure including six
components: irrigation, water
supply, housing, road,
telephone and electricity.
POPULATION & CENSUS
Page 19
IAY: Indira Awaas Yojana
o 1999
o To help construction of new
dwelling units as well as
conversion of unserviceable
kutcha houses into
pucca/semi-pucca by
members of SC/STs rural
poor below the grant-in-aid.
Twenty Point Programme
o 1975
o Poverty eradication and raising
the standard of living
DPAP: Drought Prone Area
Programme
o 1973-74
o To minimize the adverse effects
of drought on production of
crops and livestock and
productivity of land, water and
human resources, ultimately
leading to drought proofing of
the affected areas.
NRDWP: National Rural
Drinking Water Programme
o 1st April 2009
o Aims to move forward from
achieving habitation level
coverage towards household
level coverage drinking water
coverage through resorting to
multiple sources like ground
water, surface water etc.
TSC: Total Sanitation
Campaign
o 1st April 1999
o It follows a community led and
people-centred approach and
places emphasis on
Information, Communication
and Education (ICE) for
demand generation of
sanitation facilities.
NGP: Nirmal Gram Puraskar
o October, 2003
o It is an incentive scheme to
encourage PRIs to take up
sanitation promotion.
DDP: Desert Development
Programme
o 1977-78
o To mitigate the adverse effects
of desertification
IWDP: Integrated Wasteland
Development Programme
o 1989-90
o For the development of
wasteland and degraded lands.
POVERTY AND EMPLOYMENT
Page 20
VAMBAY: Valmiki Ambedkar
Awaas Yojana
o December 2001
o Facilitates construction and up
gradation of dwelling units for
slum dwellers.
JNNURM: Jawaharlal Nehru
National Urban Renewal
Mission
o 3rd December 2005
o To assist cities and towns in
taking up housing and
infrastructural facilities for the
urban poor in 63 cities (now 65
cities in the country)
MPLADS: Member of Parliament Loca
o 1993
o It provides 12 crores to each
MP to undertake development
activities in their respective
constituency. It was raised to
15 crore from 2011.
AHIP: Affordable Housing in
Partnership
o 2009
o Aims at constructing one
million houses for the
EWS/LIG/MIG with at least
25% for EWS category. It
seeks to operationalize
National Habitat Policy, 2007.
1. Full Employment :
Full employment refers to a
situation in which all the
workers who are capable of
working and willing to work get
an employment at reasonable
wages.
It does not imply that all adults
have jobs.
A person is considered employed
if he /she works for 273 days of a
year for 8 hours every day.
2. Unemployment :
It refers to a situation, when a
person is able and willing to
work for the prevailing wage but
does not get the opportunity to
work.
Labour force includes all people
in the working age group (15 to
59 yrs) who are able and willing
to work.
Number of unemployed =
Labour force – Work
force(employed)
POPULATION & CENSUS
Page 21
Unemployment rate :
It is the percent of the labour
force that is without work.
Unemployment rate = (no of
unemployed individuals/labour
force) x 100
1. Estimation of Employment and
Unemployment :
B Bhagwathi committee on
unemployment (1973) gave 3
estimates of unemployment.
Measures of unemployment in
India
1. Chronic or Usual Principal
Status unemployment (UPS)
It is measured as number of
persons who remained
unemployed for a major part of
the year.
This is also referred to as ‘open unemployment’.
Here the reference period is one
year. (over 182 days)
Weekly Status
unemployment: (CWS)
It refers to the number of
persons who did not find even
an hour of work during the
survey week.
Here the reference period is one
week.
It also measures chronic
unemployment.
Daily Status unemployment
(CDS):
It refers to the number of
persons who did not find work
on a day or some days during
the survey week.
Here the reference period is one
week.
Includes chronic unemployment as
well as under employment.
2. Key Indicators for the
estimation of Under
Employment in India
Labour Force Participation
Rate (LFPR)
Worker Population Ratio (WPR)
= x1000
Population Unemployed (PU) = x1000
Unemployed Rate (UR) =
The unemployment rate at all India level stood at 3.8 per cent while in rural and urban areas it was 3.4 per cent and 5 per cent
POVERTY AND EMPLOYMENT
Page 22
3. Types of Unemployment :
Voluntary Unemployment :
This type of unemployment is
on account of persons not
interested to take the
employment ie: jobs are
available but the persons are
not interested in being
employed.
Involuntary Unemployment :
It refers to a situation in which
the persons are interested to
work but the jobs are not
available. Under this category
there are various categories of
unemployment. They are
1) Structural Unemployment :
Caused by structural changes
like rapidly growing
population; fall in the rate of
capital formation;
technological change etc.. in
the economy. It is of long run
nature.
2) Frictional Unemployment :
It occurs when people change
from one job to another and
remain unemployed during this
interval period. This type is short
in nature.
3) Cyclical Unemployment :
It refers to a situation where
people are thrown out of job due
to recession in the economy.
Also called Demand Deficiency
Unemployment or Keynesian
economy
The root cause of this type is lack
of aggregate demand.
4) Disguised Unemployment :
Here people are apparently
employed but their marginal
productivity is zero(contribution
to production is nil).Mostly
prevalent in agriculture.
If a part of the labour force is
withdrawn and the total
productivity remains unchanged,
this withdrawn labour will be
known as disguised unemployed
labour.
It is also known as concealed
unemployment.
5) Seasonal unemployment :
It is the unemployment created
from seasonal variations in
demand for goods and services.
In an economy there will be
certain times of year when the
John Maynard Keynes coined the term
technological unemployment
POPULATION & CENSUS
Page 23
demand for goods and services
are lower than normal.
Most prevalent in agro based
industries.
6) Technological unemployment
It is a term used to describe the
lack or loss of jobs due to
technological changes or
innovations.
Technology has always displaced
some manual works.
7) Open unemployment
Refers to a situation where large
labour force does not get jobs that
may yield them regular income.
8) Under employment :
It can be defined in two different
ways
A situation in which a person
does not get the type of work he is
capable of doing due to lack of
suitable jobs.
A Situation in which a person
does not get sufficient work to
absorb him for the total length of
the working hours a day. This
type of unemployment is known
as seasonal unemployment.
Rural and Urban Unemployment
in India :
To sum up rural unemployment
in India is characterized by the
existence of under employment,
seasonal unemployment and
disguised unemployment.
Whereas urban unemployment is
characterized by the existence of
both industrial and educated
unemployment.
Industrial Unemployment:
It refers to unemployment
among worker due to
developments in technology in
industries.
It is an open unemployment.
Educated unemployment:
It constitutes large part of urban
unemployment in India.
If a person fails to obtain a
suitable job suited to his
qualification, he is said to be
educated unemployed.
Natural unemployment
Unemployment ranging
between 2 to 3%in the country
is considered natural and
inevitable.
POVERTY AND EMPLOYMENT
Page 24
This minimal percentage cannot
be eliminated at all.
4. Causes of Unemployment:
Rapid Population Growth,
Seasonal Employment,
Joint Family System,
Increasing turnout of students
from Indian universities,
Insufficient rate of economic
progress,
Slow developing of Industries.
Unemployment and five year plan
Almost all the Five Year Plans
aim for the increase of
employment opportunities.
The Second Five Year Plan(1956-
1961) expanded employment
opportunities in India by creating
10 million new jobs.
The Tenth Five Year Plan(2002-
07) aimed for 10 million
employment opportunities per
year.
5. Measures to Solve
Unemployment Problem in
India
A Change in the pattern of
investment.
Encouragement to small enterprises
as against big enterprises.
Encouragement of New Growth
Centres in Small Towns and Rural
Areas.
Subsidies on the Basis of
Employment.
Reorientation of Educational Policy.
Emphasis should be given to
vocational and technical education.
Scientific method should be
adopted in cultivation
6. Employment related schemes
TRYSEM: Training Rural
Youth for Self-Employment
o 1979
o Programme for training
rural youth self-employment
NREP: National Rural
Employment Programme
o 1980
o To provide profitable
employment opportunities
to the rural poor
RLEGP: Rural Landless
Employment Guarantee
Programme
o 1983
o For Providing employment to
landless farmers and
labourers
Dantewala Committee on Unemployment Estimates set up by the Planning Commission in 1969 (N.S.S.O.) has developed and standardized the concepts and definitions of labour force, employment and unemployment suitable to our socio-economic conditions and adopted them in quinquennial surveys on employment and unemployment since 1972-73 (27th Round).
Article 41(DPSP) - Right to work, to education and to public assistance in certain cases(removal of untouchability is the responsibility of the state)
POPULATION & CENSUS
Page 25
SUWE: Scheme of Urban
Waged Employment
o 1990
o To provide waged employment
after arranging the basic
facilities for poor people in
the urban areas, where
population is less than 1 lakh.
EAS: Employment Assurance
Scheme
o 1993
o To provide employment of a
least 100 days in a year in
village
SJSRY: Swarana Jayanti
Shahari Rozgar Yojana
o 1997
o To provide gainful employment to
urban unemployed and under
employed poor through self-
employment or wage employment.
o This scheme has five components
o Urban Self-Employment
Programme (USEP)
o Skill Training for Employment
Promotion amongst Urban Poor
(STEP-UP)
o Urban Wage Employment
Programme (UWEP)
o Urban Community Development
Network (UCDN)
SJGSY: Swarana Jayanti
Gram Swarozgar Yojana
o 1999 1st April
o For elimination rural poverty and
unemployment and promoting self-
employment through establishing
micro enterprises in rural areas.
o Targets to cover 50% SCs/STs. 40%
women, 15% minorities and 3%
disabled.
JPNRGY : Jai Prakash
Narayan Rozgar Guarantee
Yojana
o Proposed in 2002 – 03 Budget
o Employment guarantee is must
in poor districts.
MGNREGA:
Mahatma Gandhi
National Rural
Employment
Guarantee Scheme
o 2nd February 2006
o It aims at enhancing livelihood
security of households in rural
areas of the country by providing
at least 100 days of guaranteed
wage employment in a financial
year to every household, whose
adult members volunteer to do
unskilled manual work.
o It also mandates 33 %
participation for women. The
primary objective of the scheme is
to augment wage employment.
PMEGP: Prime Minister’s Employment Generation
Programme
o 2008
o To generate employment
opportunities in rural as well as
urban areas through setting up
of self-employment
ventures/projects/micro
enterprises.
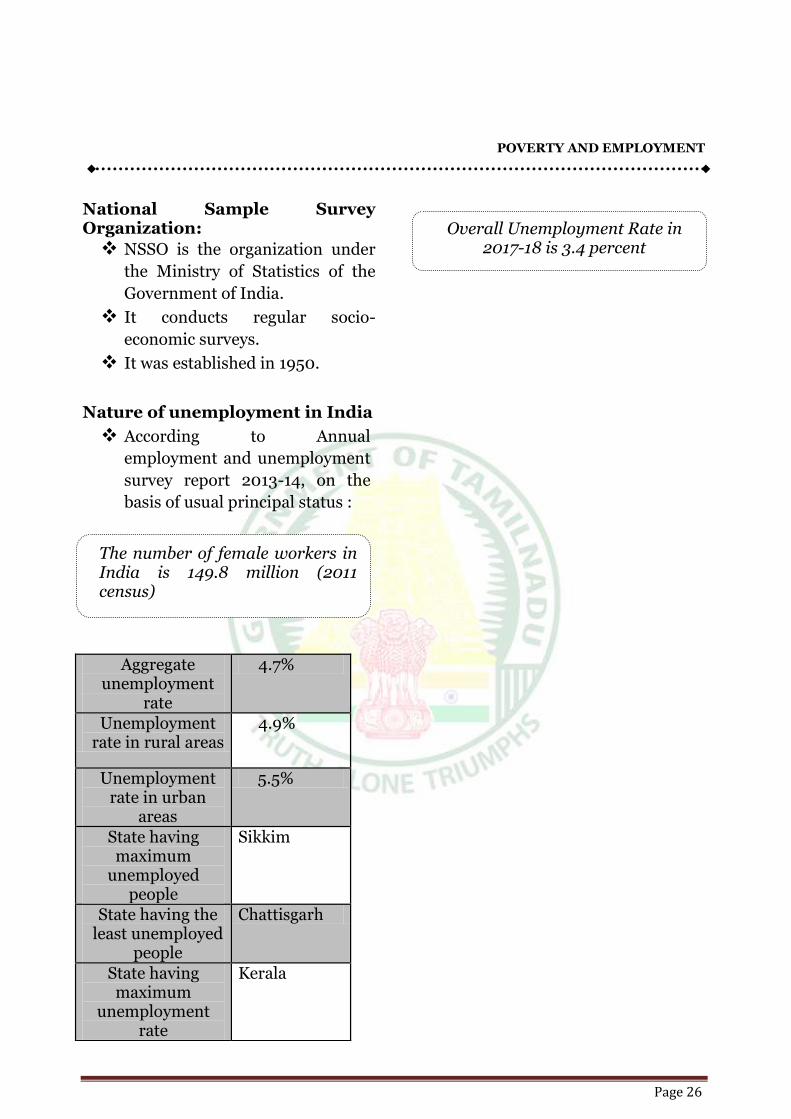
POVERTY AND EMPLOYMENT
Page 26
National Sample Survey Organization:
NSSO is the organization under
the Ministry of Statistics of the
Government of India.
It conducts regular socio-
economic surveys.
It was established in 1950.
Nature of unemployment in India
According to Annual
employment and unemployment
survey report 2013-14, on the
basis of usual principal status :
Aggregate unemployment
rate
4.7%
Unemployment rate in rural areas
4.9%
Unemployment rate in urban
areas
5.5%
State having maximum
unemployed people
Sikkim
State having the least unemployed
people
Chattisgarh
State having maximum
unemployment rate
Kerala
The number of female workers in India is 149.8 million (2011 census)
Overall Unemployment Rate in 2017-18 is 3.4 percent
HUMAN RESOURCES DEVELOPMENT
Page 1
Economic Growth and Human
Resource Development
Economic Development:
It is defined as the process of
increasing the degree of utilization
and improving the productivity of
the available resources of a country
which leads to an increase of the
economic welfare of the community
by stimulating the growth of
National Income.
Economic Development = Size of
Economic Output +Welfare (A
qualitative aspect)
Or
Economic Growth :
Economic growth has been defined
as an increase in real terms of the
output of goods and services that is
sustained over a long period of time,
measured in terms of value added.
Economic Growth = Size of Output
(A quantitative aspect)
Economic growth has been defined
by Arthur Lewis as “the growth of
output per head of population”.
In other words, economic growth
refers to an increase in per capita
national income..
According to Arthur Lewis,
economic growth is conditioned by
1. Economic activity,
2. Increasing knowledge and
3. Increasing capital.
Rostow’s Stages of Economic
Growth
W.W. Rostow, American economic
historian described the
transformation of countries from
underdevelopment to development
in terms of stages of growth. The
following stages are:-
The Traditional Society – It is
custom-bound and tradition-
oriented, the poor countries are
good example
The Transitional Society - In the
transitional society, the force of
customs and traditions will
become less, there will be
ED = Social Change + Economic
growth
HRD
Page 2
economic motivation, and there
will be improvements in physical
and social infrastructure
The take- off stage – It refers to a
situation where an economy
transforms itself from a
predominantly agricultural to a
predominantly industrial society
The mature stage - In this stage,
the government has to make some
basic decisions. As there will be
abundant resources and goods,
whether it has to use them for
strengthening the nation into a
strong and powerful state
militarily or to use the resources
for improving the welfare of the
people.
The age of high mass consumption
- The final stage is the age of high
mass consumption. During this
period, people will consume all
kinds of goods especially durable
goods like cars on a mass scale.
Human Resource Development :
HRD is defined as “organized
learning activities arranged within
an organization in order to
improve performance and / or
personal growth for the purpose of
improving the job, the individual
and/or organization”.
The term “Human Resource” refers to total knowledge, skills,
creative abilities, talents,
aptitudes as well as population of a
country. Adam Smith included the
acquired and useful abilities of
human beings in his analysis of
capital as Human Resources.
Human Resource Management
(HRM):
Human resource management is
that part of the Management
process which involves the ways in
which people develop their skills
Human: refer to the skilled
workforce in the organisation.
Resource: refer to limited
availability or scarce.
Management: refer to maximise or
proper utilisation and make best
use of limited and a scarce resource.
HRM aims at developing personal
qualities in an individual so that he
or she may contribute in a healthier
manner for the national and world
peace.
Human Capital :
Human capital consists of
knowledge and skills acquired by
individuals. It may be acquired in a
Happiness index of India – 133

HRD
Page 3
formal way through education or
employers training programmes.
Investing in human capital makes
people more productive and can
increase their earnings, provided
there is demand for the particular
skill and knowledge.
Human capital is an important
element in the process of economic
growth. Investment in education,
training, healthcare etc. is called
human capital formation.
The most important indicators of
HRD can be generally classified into
(1) those which measure a country’s
stock of human capital, and (2)
those which measure the additions
to this stock. This is the rate of
human capital formation over a
specified period. The stock of
human capital indicates the level of
HRD in a country, whereas the rate
of human capital formation
indicates its rate of improvement.
Based on the composite index of
HRD, they classified countries into
1) under-developed
2) Partially developed
3) semi- advanced
4) advanced.
HRD and Economic Development
There is a close relationship
between the indicators of HRD and
indicators of economic
development.
The level of economic development
can be studied by making use of the
following indicators :
1. Gross National Product (GNP)
per capita in United States
dollars.
2. Percentage of the active
population engaged in
agricultural occupation.
3. Public expenditures on
education as a percentage of
national income, and the
percentage of the total
population in the age group five
to fourteen inclusive.
Human Development Report :
The Human Development
report was published by the
UNDP since 1990 captures the
initiator was Pakistan economist
Mahbub – ul –haq and indian
economist Amartya sen.
The hence of the HDR 2014 is
the sustaining Human progress
reducing vulnerabilities and
building resilience.
HRD
Page 4
HDR calculation was based on 3
variables
1. Life expectancy at birth
2. Literacy (mean year of
schooling and expected years
of schooling)
3. Standard of living (GNI per
capita (PPIS))
HDI Valuation
On the basis of HDI valuation,
countries are classified into three
categories with valuation scale
running between 0 and 1.
1. High - 0.8 and above
2. Medium - 0.5 to 0.8
3. Low - Less than 0.5
Out of total 177 countries, 55 are in
High group, 86 in Medium group
and 36 in the Low group. India is
placed in the Medium group.
The three parameters are as given
below:
o High Human Development
Countries: 0.800–1.000 points on
the index.
o Medium Human Development
Countries: 0.500–0.799 points on
the index.
o Low Human Development
Countries: 0.000–0.499 points on
the index.
Gender Related Development
Index :
GDI adjusts the HDI to reflect the
inequalities between men and
women.
The three measures used are
related to
1. Female life expectancy,
2. Female adult literacy and gross
enrolment ratio and
3. Female per capita income.
Gross National Happiness :
The term gross national happiness
was coined in 1972 by the then
Bhutan king Jigme sing ye
wangchuck.
It was designed in an attempt to
defined an indicator that measures
quality of life or social progress in
more hysteretic and psychological
terms than the economic indicator
of GDP.
Without rejecting the idea of
human development propounded
by the UNDP, the kingdom has
Gender inequity Index – 124
India ranks of 159 countries in
Human Development Index - 130
Theme for 2017 - Education
for all & Quality Education
HRD
Page 5
been officially following the
targets set by the GNH.
Bhutan has been following up the
GNH since 1972 which has the
following parameters to attain
happiness/development:
a. Higher real per capita income.
b. Good Governance.
c. Environmental Protection.
d. Cultural Promotion.
Inequality adjusted HDI :
It adjusts the HDI for inequality
in distribution of the dimensions
- life expectancy, years of
schooling and household income
or consumption.
Adjusted means the inequality in
each dimension is discounted
from the average level of
achievement in each dimension.
If HDI and IHDI are equal, it
means there is no inequality.
If IHDI is less than HDI, it means
there is inequality and vice versa.
Gender inequality index :
It measures inequality that exists
between men and women across
three dimensions viz, reproductive
health, empowerment and the
labour market.
The indicators for reproductive
health are Maternal Mortality Rate
and Adolescent Fertility Rate.
The indicators for Empowerment
are parliamentary representation
and attainment of secondary and
higher education. Labour market
indicator is labour market
participation.
GII ranges from 0 to 1.
Zero represents fair equality and
one represents very poor equality.
Global Hunger Index :
It is based on the three indicators :
1. Proportion of the population
that is undernourished.
2. The proportion of children who
are underweight and
3. Under five Chid Mortality.
Human Sustainable Development
Index :
It measures overall quality of life. It
includes 4th parameter "per capita
carbon emission" to the existing
three HDI.
Physical Quality Life Index
(PQLI):
o It was developed by D Morris.
o It is the average of three values.
1. Life Expectancy
2. Basic literacy rate
HRD
Page 6
3. Infant Mortality rate.
Each value was scaled on 1 to 100,
where 1 represented the 'worst' and
100 represented the best.
Misery Index :
Created by Arthur Okun.
It is found by adding the
unemployment rate to the inflation
rate.
It is assumed that both a higher
rate of unemployment and
worsening of Inflation create
economic and social costs for a
country.
Economic Development Index
(EDI):
EDI was developed by National
Council of Applied Economic
Research (NCAER). It is based on
three components :
1. Health attainment index,
2. Education attainment index,
3. Per capita GDP.
Gini Coefficient :
An inequality indicator in an
economy.
The coefficient varies from 'zero' to
'one'.
A 'zero' Gini coefficient indicates a
situation of perfect equality (i.e.
every household earning the same
level of income) while a 'one'
signifies a situation of absolute
inequality (i.e. a single household
earning the entire income in an
economy).
Lorentz Curve :
A graph showing the degree of
inequality in income and wealth in
a given population or an economy.
It is a rigorous way to measure
income inequality. In this method
(for example), personal incomes in
an economy are arranged in
increasing order; the cumulative
share of total income is then
plotted against the cumulative
share of the population.
The curve’s slope is thus
proportional to per capita income
at each point of the population
distribution.
In the case of complete equality of
income, the Lorenz curve will be a
straight line and with greater
curvature the inequality rises
proportionally–the Gini
Coefficient measures this
inequality.
India 108 in gender gap index
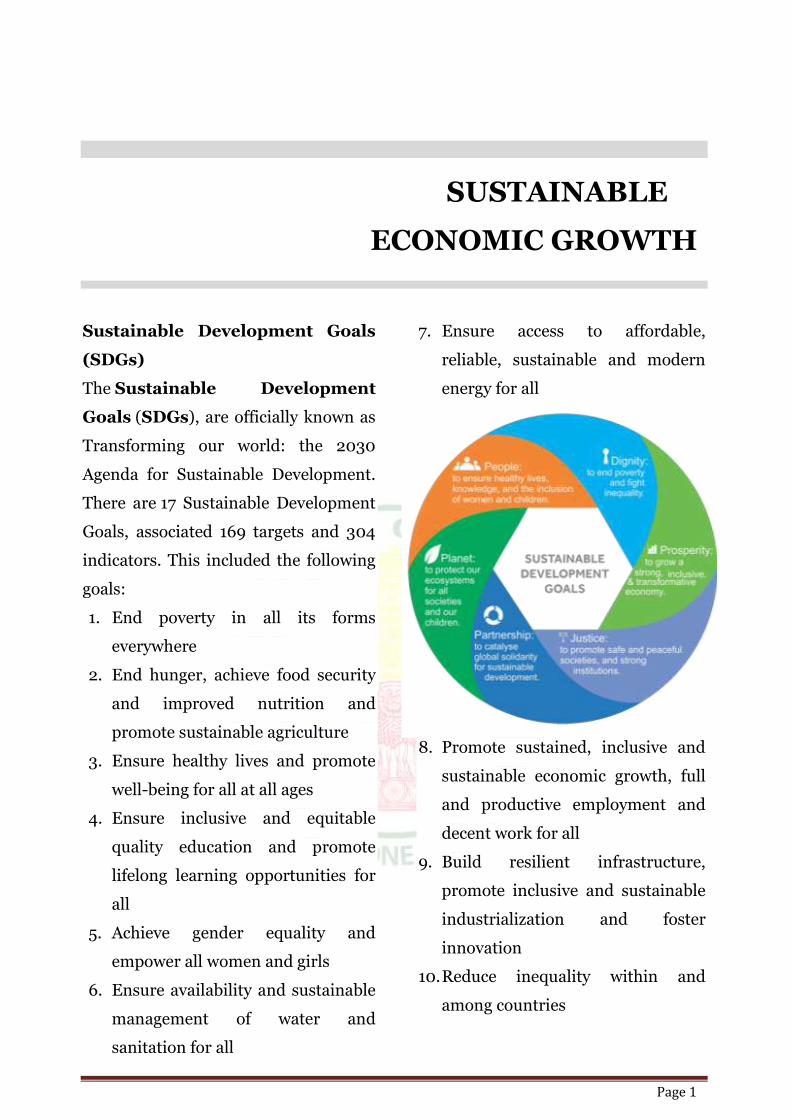
SUSTAINABLE
ECONOMIC GROWTH
Page 1
Sustainable Development Goals
(SDGs)
The Sustainable Development
Goals (SDGs), are officially known as
Transforming our world: the 2030
Agenda for Sustainable Development.
There are 17 Sustainable Development
Goals, associated 169 targets and 304
indicators. This included the following
goals:
1. End poverty in all its forms
everywhere
2. End hunger, achieve food security
and improved nutrition and
promote sustainable agriculture
3. Ensure healthy lives and promote
well-being for all at all ages
4. Ensure inclusive and equitable
quality education and promote
lifelong learning opportunities for
all
5. Achieve gender equality and
empower all women and girls
6. Ensure availability and sustainable
management of water and
sanitation for all
7. Ensure access to affordable,
reliable, sustainable and modern
energy for all
8. Promote sustained, inclusive and
sustainable economic growth, full
and productive employment and
decent work for all
9. Build resilient infrastructure,
promote inclusive and sustainable
industrialization and foster
innovation
10. Reduce inequality within and
among countries
Sustainable Economic Growth
Page 2
11. Make cities and human settlements
inclusive, safe, resilient and
sustainable
12. Ensure sustainable consumption
and production patterns
13. Take urgent action to combat
climate change and its impacts
14. Conserve and sustainably use the
oceans, seas and marine resources
for sustainable development
15. Protect, restore and promote
sustainable use of terrestrial
ecosystems, sustainably manage
forests, combat desertification, and
halt and reverse land degradation
and halt biodiversity loss
16. Promote peaceful and inclusive
societies for sustainable
development, provide access to
justice for all and build effective,
accountable and inclusive
institutions at all levels
17. Strengthen the means of
implementation and revitalize the
global partnership for sustainable
development
Measurement of Sustainable
Development
The measurement of sustainable
development is done in terms of two
different aggregates
Green Net National Income
It is the difference between Net
National Income and Depreciation of
Natural Capital. Net National Income
is the market value of the final goods
and services produced by the residents
of the country during the period of one
year. Depreciation of Natural Capital
means loss of value of the capital
because of its continuous use. Natural
capital refers to the sum total of
natural resources including
environment.
Green Net National Income = Net
National Income − Depletion of
Natural Resources − Environmental
Degradation.
Sustainable development is to be
measured in terms of the rise in Green
National Income.
Genuine Savings
The genuine savings are the rate of
savings adjusted not only for
depreciation of man-made capital but
also for loss of value of the natural
capital.
Genuine Savings = Gross Savings −
Depreciation of Manmade Capital −
Depreciation of Natural Capital
Sustainable Economic Growth
Page 3
(Depletion of Natural Resources and
Degradation of Environment).
Increase in Genuine Savings implies
higher rate of sustainable development
and vice versa.
Millennium Development
Goals(MDGs) vs Sustainable
Development Goals(SDGs)
As the MDG deadline approaches,
about 100 crore people still live on less
than $1.25 a day – the World Bank
measure on poverty. More than
80 crore people do not have enough
food to eat. Now let’s have a quick look
on why we need SDGs.
MDGs were too narrow.
MDGs failed to consider the root
causes of poverty.
The millennium development goals
made no mention of human rights.
In reality MDGs were considered
targets for poor countries to
achieve from the finance of wealthy
countries.
Every country will be expected to
work towards achieving the SDGs.
Goal 16 has a target to promote the
rule of law and equal access to
justice.
MDGs were drawn up by a group of
men in the basement of UN
headquarters.
Establishing post-2015 goals was
an outcome of the Rio+20 summit
in 2012, which mandated the
creation of an open working group
to come up with a draft
agenda. Alongside the open
working group discussions, the UN
conducted a series of “global
conversations”.
ENERGY DIFFERENT SOURCES
AND DEVELOPMENT
Page 1
Introduction
Major sources of energy in India
are classified as −
o Conventional sources (e.g.
coal, petroleum, and nuclear
power).
o Non-conventional sources
(e.g. solar energy, hydro
energy, geo-thermal energy,
etc.)
Fossil fuel or conventional
sources of energy are found
exhaustible in nature and also
not environmental friendly; on
the other hand, the non-
conventional sources of energy
such as solar energy, wind
energy, geo-thermal energy,
tidal energy, etc. are renewable
sources of energy and they are
also environmental friendly (as
they do not pollute
environment).
Coal
About 80% of the coal deposits
in India is of bituminous type
and is of non coking grade.
The most important Gondwana
coal fields of India are located in
Damodar Valley region.
Raniganj, Jharia, Bokaro,
Giridih, and Karanpura are
major coalfields of Jharkhand-
Bengal coal belt.
Jharia is the largest coal field
followed by Raniganj.
Other important coal mines are
Singrauli (partially in Madhya
Pradesh and partially in Uttar
Pradesh); Korba in
Chhattisgarh; Talcher and
Rampur in Odisha; Chanda–
Wardha, Kamptee, and Bander
in Maharashtra; Singareni in
Telangana; and Pandur in
Andhra Pradesh.
Tertiary coalfields are largely
located in Darangiri,
Cherrapunji, Mewlong, and
Langrin in Meghalaya; Makum,
Jaipur, and Nazira in upper
Assam; Namchik – Namphuk in
Arunachal Pradesh; and Kalakot
in Jammu and Kashmir.
EDSD
Page 2
The brown coal or lignite are
found in the coastal areas of
Tamil Nadu, Pondicherry,
Gujarat, and Jammu and
Kashmir.
Petroleum
Hydrocarbons of liquid and
gaseous states varying in
chemical composition, color,
and specific gravity are
collectively known as petroleum
resource.
Petroleum industries produce
various by-products; for
example, fertilizer, synthetic
rubber, synthetic fiber,
medicines, vaseline, lubricants,
wax, soap, and cosmetics.
Crude petroleum normally
occurs in sedimentary rocks of
the tertiary period.
For the systematic oil
exploration and production,
the Oil and Natural Gas
Commission was set up in
1956.
Digboi, Naharkatiya, and Moran
are important oil producing
areas in Assam.
Ankaleshwar, Kalol, Mehsana,
Nawagam, Kosamba, and Lunej
are the major petroleum
producing regions in Gujarat.
Located 160 km off Mumbai,
Mumbai high, an offshore
oilfield was discovered in 1973.
Production of petroleum at the
field was started in 1976.
Krishna-Godavari and Kaveri
basin on the east coast are
significant regions of petroleum
production.
Oil extracted from the wells
remains in crude oil form and
contains many impurities;
hence, it needs to be extracted
in oil refineries.
Based on destination, there are
two types of oil refineries — oil-
field based (e.g. Digboi) and
market based (Barauni).
To transport and develop the
market for natural gas, the Gas
Authority of India
Limited was set up in 1984 (it
is a public sector
undertaking).
Though natural gas reserves
have been located along the
petroleum reserves, but some
exclusive natural gas reserves
are found along the eastern
EDSD
Page 3
coast of Tamil Nadu, Odisha,
and Andhra Pradesh; as well as
around Tripura, Rajasthan, and
off-shore wells in Gujarat and
Maharashtra.
Nuclear Energy
Essential minerals used for the
generation of nuclear energy
are uraniumand thorium.
Geographically, uranium ores
are found at many different
locations along the Singbhum
Copper belt.
Other important uranium
reserve regions are also found
in Udaipur, Alwar, and
Jhunjhunu districts of
Rajasthan; Durg district of
Chhattisgarh; Bhandara district
of Maharashtra; and Kullu
district of Himachal Pradesh.
Thorium is mainly obtained
from monazite and ilmenite,
which is largely found along the
coast of Kerala and Tamil Nadu.
Palakkad and Kollam districts of
Kerala have the world’s largest
monazite deposits.
Atomic Energy
Commission was established
in 1948 and the Atomic
Energy Institute at
Trombay was founded in 1954.
However, the Atomic Energy
Institute at Trombay was
renamed as Bhabha Atomic
Research Centre in 1967.
The important nuclear power
projects are located at Tarapur
(Maharashtra); Rawatbhata
near Kota (Rajasthan);
Kalpakkam (Tamil Nadu);
Narora (Uttar Pradesh); Kaiga
(Karnataka); and Kakarapara
(Gujarat).
Solar Energy
Solar energy is 7% more
effective than coal or oil based
plants and 10% more effective
than nuclear plants.
The western part of India has
greater potential for the
development of solar energy.
Other Sources of Energy
The Ministry of Non-
conventional Sources of Energy
is responsible for the
development of wind energy in
India as the major source of
renewable energy.
Ocean currents are the store-
house of infinite energy. Hence,
EDSD
Page 4
India has great potential for the
development of tidal energy.
Natural hot
springs and geysers are being
used since medieval period, but
in the present world, these
could be potential sources of
renewable energy.
Manikaran, a hot spring in
Himachal Pradesh is a major
renewable source of energy in
India.
Bio-energy is the energy
derived usually from the
biological products, such as
agricultural residues and other
bio-waste.
Bio-energy can be converted
into electrical energy, heat
energy, and gas for cooking.
Okhla in Delhi presents a good
example by producing bio
energy from municipal waste.
ENERGY SECTOR in tamilnadu
Introduction
Power sector is the most
important sector among various
infrastructure sectors in the
country. Energy security and
environmental Sustainability are vital
to our future. Energy security is very
important for economic growth.
Renewable energy sources are essential
in view of the depleting nature of
conventional energy resources.
Electricity is a critical infrastructure for
sustainable growth of economy.
Power development is an
important input for the States
Industrial, Commercial and Socio
economic growth. For this, the
availability of affordable, reliable and
quality power is necessary. Therefore,
adequate provision has to be made for
augmenting power supply to bridge the
gap between demand and supply as
well as to meet the increasing future
demand. Keeping this in view,
Government is giving utmost
importance to power sector in Tamil
Nadu.
Tamil Nadu has one of the best
power utilities in the country and the
power sector in the State has grown
manifold in capacity generation. All the
villages and the towns are fully
electrified. Tamil Nadu Generation and
Distribution Corporation Limited
EDSD
Page 5
(TANGEDCO) is responsible for power
generation and distribution.
Tamil Nadu Transmission
Corporation Limited (TANTRANSCO)
is responsible for transmission of
power. Further, the electricity network
has been extended to all villages and
towns throughout the State and all the
villages in the State are 100%
electrified.
GENERATION:
Present Status of Demand –
Supply:
The present average demand of
power in the State is around 14,500
MW. It is expected to go upto 17,500
MW by the end of 2018-19. This
demand will be met by generation from
existing power stations and power
projects to be commissioned in the
year 2018-19. At present this deficit is
managed through power purchase and
Restriction and Control measures.
TANGEDCO is taking several steps to
bridge the gap between demand and
supply to provide uninterrupted power
supply to the consumers.
The state as on installed capacity
of 24,433 MW as on 31.3.2016.
RENEWABLE ENERGY SOURCES
The State is blessed with various
forms of renewable energy sources. The
environment-friendly renewable
energy sources are perennial in nature,
available locally and quite suitable for
decentralized applications. The
important renewable energy sources
are as follows:
• Wind Energy (including offshore
wind)
• Solar Energy
• Biomass and other forms of bio
energy
• Small Hydro
• Tidal Energy
• Ocean Thermal Energy
Among the above mentioned
sources, the first three renewable
energy sources, viz., wind, solar and
bio energy are being harnessed in a big
way in India and also in Tamil Nadu.
With a view to develop and propagate
the non-conventional sources of
energy, the Tamil Nadu Energy
Development Agency (TEDA) was
formed.
Apart from serving as a
coordinating agency to promote and
harness the use of renewable energy
sources, TEDA acts as nodal agency to
EDSD
Page 6
the Ministry of New and Renewable
Energy (MNRE), Government of India
to implement centrally funded and
sponsored schemes in the state.
Present Scenario – Renewable
Energy Sources
Tamil Nadu is a leader in
Renewable Energy. At present, the
total installed capacity of renewable
energy including solar, wind etc., is
10,480 MW. In the last wind season,
the State has harnessed around 13,000
Million Units of energy from wind
generators, which is an all time record.
Also, the State has harnessed around
1,644 million units of energy from solar
generators during 2016-17. Proactive
steps are being taken to maintain this
prominent position in renewable
energy.
In the State, the contribution to
the installed capacity is highest from
wind energy, followed by biogases-
based cogeneration plants in sugar
industries. This has largely come
through private investments
encouraged by policy initiatives of the
Central and the State Governments.
Solar Energy
1. Tamil Nadu has a very good solar
potential with 300 clear sunny days
as it receives very high solar
radiation.
2. The Solar Photo Voltaic (SPV)
technology which enables the direct
conversion of sun light into
electricity has several distinct
advantages, since it does not have
moving parts, produces no noise or
pollution, requires very little
maintenance and can be installed
anywhere.
3. These advantages make them an
ideal power source for use especially
in remote and isolated areas which
are not served by conventional
electricity, making use of ample
sunshine available in the State.
4. SPV technology provides for
decentralized installations thereby
minimizing the need for
transmission infrastructure.
5. Tamil Nadu has total solar installed
capacity of 2000 MW as on
08.04.2018. Considerable quantum
of solar generation is being realized
during day time to a tune of
around 1200 MW to 1700 MW.
EDSD
Page 7
6. Further, an all-time high generation
of 1498 MW and the all time
maximum energy of 9.40 Million
Units has been harnessed from solar
generators on 27.03.2017.
7. It is proposed to increase the solar
power installed capacity by further
5000 MW in a phased manner in the
forthcoming years. In this regard a
tender has been floated for the
procurement of 1500 MW under
reverse bidding route.
WIND ENERGY
Wind energy is one of the
cleanest renewable sources of power.
The potential area that are suitable for
establishment of wind generators are
mostly confined to the southern
(Aralvoimozhi pass and Shengottai
pass) and south western (Palghat and
Cumbum pass) parts of the State.
Total installed capacity under
wind mill generation is 7470.86 MW.
Tamil Nadu tops in harnessing
resources of energy among all Indian
States of the installed capacity, thus
making it a clear leader in the wind
energy sector.
Tamil Nadu is a pioneer in
promoting wind energy in the
country, with an installed capacity of
8197 MW as on 31.03.2018 (34.293
GW as on 30.06.2018) and which is
the highest wind power capacity in
the country and contributes to about
28.43% of the country’s total
installed wind power capacity.
It is proposed to increase the wind
installed capacity by further 4500
MW in a phased manner in the
forthcoming years.
As Tamil Nadu is already having a
huge installed capacity of wind power
which satisfies the States Renewable
Energy Purchase Obligation (RPO), it
is in a position to sell wind power to
the other needy States who require
this power to fulfill their RPO.
During the last wind season around
120MW of wind power has been
scheduled daily to Odisha as sale of
green power.
Similarly efforts are being taken to
schedule around 500MW of green
power daily to the needy States.
Biomass Energy
Bio-mass produced by green
plants through photosynthesis using
EDSD
Page 8
sunlight, contains organic matter
which could be converted to energy.
Biomass can be obtained by raising
energy plantations or may be obtained
from organic waste.
The biomass resources can be used
in bio-energy technologies viz., biogas,
gasifier, biomass combustion,
cogeneration, etc., to produce energy-
thermal or electricity. Biomass can be
used in three ways – one in the form of
gas through gasifiers for thermal
applications, second in the form of
methane gas to run gas engines and
produce power and the third through
combustion to produce steam which
drives a turbine to generate electricity.
Biomass power & cogeneration
programme is implemented with the
main objective of promoting
technologies for optimum use of
country’s biomass resources for grid
power generation and captive power
production. Biomass materials used
for power generation include juliaflora,
bagasse, rice husk, straw, cotton stalk,
coconut shells, soya husk, de-oiled
cakes, coffee waste, jute wastes,
groundnut shells, saw dust etc.
Biogas
A combustible gas (composed
primarily of methane) produced when
Organic waste, sewage or manure is
fermented in the absence of oxygen.
The solid material that remains in the
digester after fermentation can be used
as an organic fertilizer.
Biogas – a gas mixture of methane,
carbon dioxide and small quantities of
hydrogen and hydrogen sulphide – is
created under air exclusion through the
fermentation of organic substances
with microorganism assistance. Biogas
is a gas mixture, consisting of
approximately 40 to 75 % methane
(CH4), 25 to 60 % carbon dioxide
(CO2), and approx. 2 % of other gases
(hydrogen, hydrogen sulphide and
carbon monoxide).
Advantages of Biogas
No smoke , Clean Fuel
Produces organic manure for a
sustainable agriculture
It reduces fossil fuel Dependency
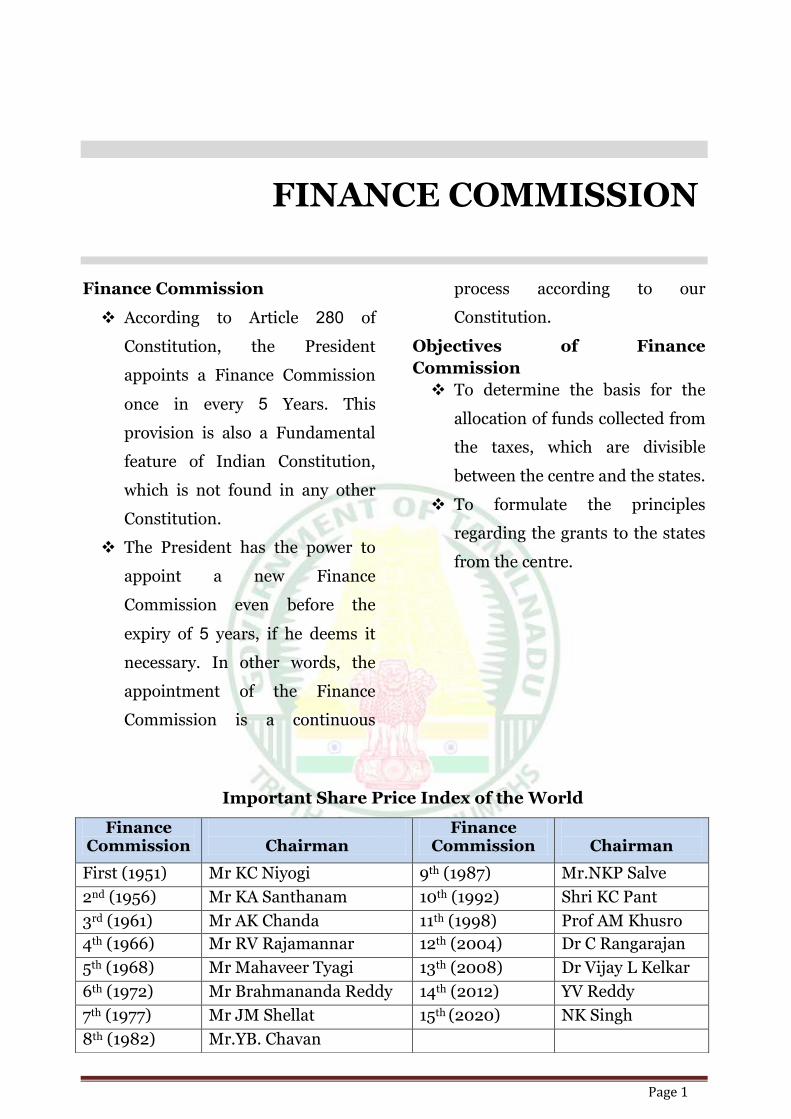
FINANCE COMMISSION
Page 1
Finance Commission
According to Article 280 of
Constitution, the President
appoints a Finance Commission
once in every 5 Years. This
provision is also a Fundamental
feature of Indian Constitution,
which is not found in any other
Constitution.
The President has the power to
appoint a new Finance
Commission even before the
expiry of 5 years, if he deems it
necessary. In other words, the
appointment of the Finance
Commission is a continuous
process according to our
Constitution.
Objectives of Finance
Commission
To determine the basis for the
allocation of funds collected from
the taxes, which are divisible
between the centre and the states.
To formulate the principles
regarding the grants to the states
from the centre.
Important Share Price Index of the World
Finance Commission
Chairman
Finance Commission
Chairman
First (1951) Mr KC Niyogi 9th (1987) Mr.NKP Salve
2nd (1956) Mr KA Santhanam 10th (1992) Shri KC Pant
3rd (1961) Mr AK Chanda 11th (1998) Prof AM Khusro
4th (1966) Mr RV Rajamannar 12th (2004) Dr C Rangarajan
5th (1968) Mr Mahaveer Tyagi 13th (2008) Dr Vijay L Kelkar
6th (1972) Mr Brahmananda Reddy 14th (2012) YV Reddy
7th (1977) Mr JM Shellat 15th (2020) NK Singh
8th (1982) Mr.YB. Chavan
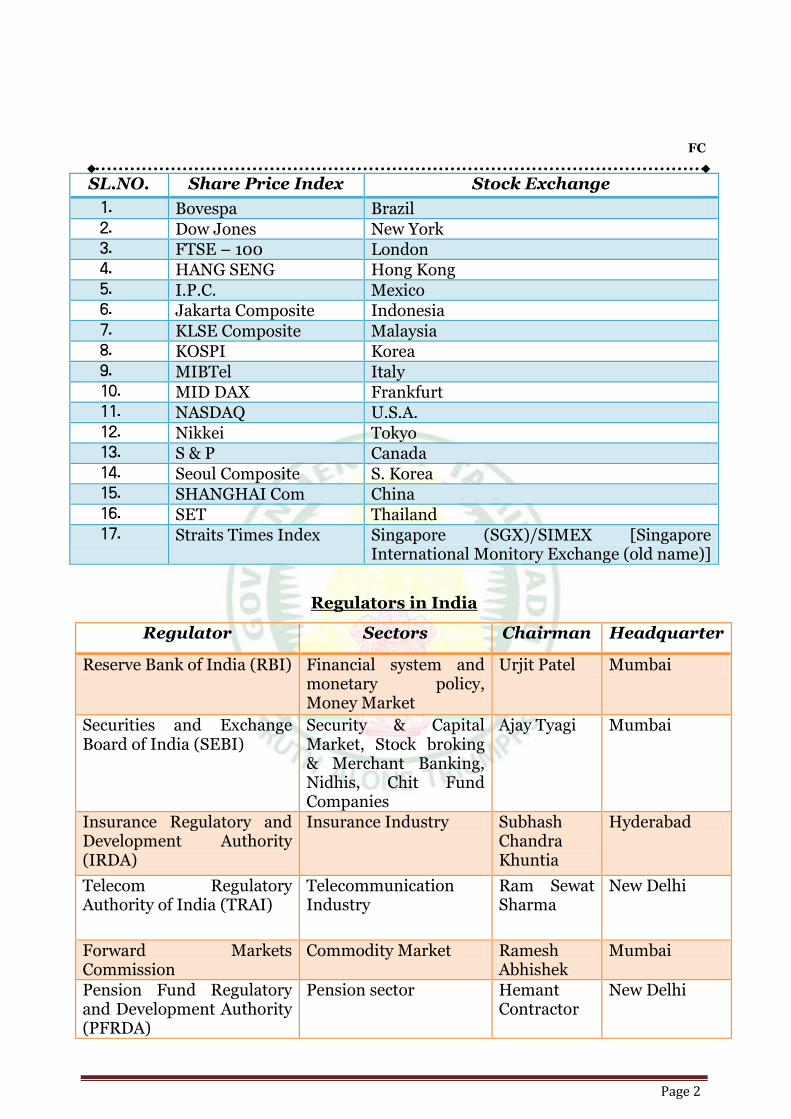
FC
Page 2
SL.NO. Share Price Index Stock Exchange
1. Bovespa Brazil 2. Dow Jones New York 3. FTSE – 100 London 4. HANG SENG Hong Kong 5. I.P.C. Mexico 6. Jakarta Composite Indonesia 7. KLSE Composite Malaysia 8. KOSPI Korea 9. MIBTel Italy 10. MID DAX Frankfurt 11. NASDAQ U.S.A. 12. Nikkei Tokyo 13. S & P Canada 14. Seoul Composite S. Korea 15. SHANGHAI Com China 16. SET Thailand 17. Straits Times Index Singapore (SGX)/SIMEX [Singapore
International Monitory Exchange (old name)]
Regulators in India
Regulator Sectors Chairman Headquarter
Reserve Bank of India (RBI) Financial system and monetary policy, Money Market
Urjit Patel Mumbai
Securities and Exchange Board of India (SEBI)
Security & Capital Market, Stock broking & Merchant Banking, Nidhis, Chit Fund Companies
Ajay Tyagi Mumbai
Insurance Regulatory and Development Authority (IRDA)
Insurance Industry Subhash Chandra Khuntia
Hyderabad
Telecom Regulatory Authority of India (TRAI)
Telecommunication Industry
Ram Sewat Sharma
New Delhi
Forward Markets Commission
Commodity Market Ramesh Abhishek
Mumbai
Pension Fund Regulatory and Development Authority (PFRDA)
Pension sector Hemant Contractor
New Delhi
PLANNING
COMMISSION & NDC
Page 1
Planning :
In the words of Barbara Wootten,
“Planning may be defined as the
conscious and deliberate choice of
economic priorities by some public
authorities”.
Economic planning refers to the
path of actions interns of policy
measures to be followed in future
in pursuance of per determine
objectives.
Planning involves setting of
quantifiable goals in pursuance of
the broad objectives along with the
strategy to achieve those goals.
Objectives of Planning in India : A major function of the Planning
Commission was to “formulate
a plan for the most effective and
balanced utilization of the
country’s resources”.
Growth with social justice is our
basic goal.
The main objectives of Planning
in India may be grouped
under the following heads:
1. Economic Growth
2. Modernization
3. Social justice
4. Self reliance
5. Social equality
6. Full employment
7. Removal of poverty
8. Technologic up gradation
The other objectives of developmental
planning in India :
To raise the national income.
This is known as
Growth Objective ;
To increase investment to a
certain level within a given time ;
To reduce inequalities in the
distribution of income and
wealth and to reduce
concentration of economic
power over resources ;
To expand employment
opportunities and elimination of
poverty
PC
Page 2
To setup a society based on
equality and justice and absence
of exploitation.
To remove bottlenecks in
agriculture, manufacturing
industry and the balance of
payments.
History of Planning in India :
First attempt to initiate economic
planning in India was made by Sir
M. Visvesvarayya, in 1934 through
his book, ‘Planned Economy for
India’. He was called as father of
Indian planning.
In 1938, National Planning
Committee was set up by Subhash
Chandra Bose and chaired by
Jawaharlal Nehru.
In 1944, Bombay Plan was
presented by 8 leading
industrialists of Bombay.
In 1944, Gandhian Plan was given
by S N Agarwal.
In August 1944, The British India
government set up Planning and
Development Department under
the charge of Ardeshir Dalal.
In 1945, People’s Plan was given by
M N Roy.
In 1950, Sarvodaya Plan was given
by J P Narayan.
In 1946 the Interim Government
was formed and it established a
high level advisory planning board
in order to study the problems of
planning.
In 1947, Economic Programme
Committee (EPC) was formed
under the chairmanship of Nehru
and in 1948 it recommended the
formation of permanent planning
commission.
I. PLANNING COMMISSION
The Government of India
constituted planning commission
on March 15th, 1950.
Every planning decision in India
originates from the planning
commission and is finally
approved by the National
Development Council, constituted
on August 1952.
The planning commission has
fixed the period of plans at five
years.
Planning Commission:
1. It is an extra constitutional body
2. Non constitutional body
3. Non statutory body
PC
Page 3
4. Advisory body
5. Executive body
It is an extra – constitutional (i.e.
non-constitutional) and non-
statutory body.
Functions
Formulate a plan for the most
effective and balanced utilization
of the country’s resources.
On a determination of priorities,
define the stages in which the
plan should be carried out and
propose the allocation of
resources for the due completion
of each stage.
Indicate the factors which are
tending to retard economic
development, and determine the
conditions which, in view of the
current social and political
situation, should be established
for the successful execution of the
plan.
Determine the nature of the
machinery which will be
necessary for securing the
successful implementation of
each stage of the plan in all its
aspects.
To evaluate from time to time the
progress achieved in every stage
of plan and also to suggest
remedial measures.
To advise the Centre and the
State Governments from time to
time on special matters referred
to the commission.
Composition of Planning
Commission
Planning commission is composed
of eight members.
Prime Minister (Ex-Officio
Chairman)
Four full time members (including
deputy chairman)
Secretary
Major Sources of Financing Plans
The major sources of financing
development programmes are as
follows:
i. Government savings which
consist of Surplus on revenue
budget i.e., excess of current
revenue over current
expenditure, Additional taxation
and surpluses of the Public
Enterprises (PEs).
The major sources of domestic
borrowings are:
Public loans and small savings
and Deficit financing.
PC
Page 4
II. NATIONAL DEVELOPMENT
COUNCIL – NDC
1. National Development Council is
a non-statutory body, which was
constituted to build co-operation
between the States and the
Planning Commission for
economic planning.
2. The National Development
Council was constituted on 6th
August 1952. The National
Development Council is an
important organization, whose
main functions are as follows:
To evaluate the
implementation of National
Planning from time to time.
To examine the social and
economic policies that
influences the economic
development.
To give suggestions in order
to achieve the determined
goals in National Plan.
To study the plan prepared by
the Planning Commission and
after mutual discussions give
it the final shape. It is only
after its ratification that the
format of the five-year plan is
released.
Strategies of Planning :
1. Harrod Domar Strategy :
First five year plan was based on it.
It emphasized the role of capital
accumulation’s dual character. i.e.
increases national income on one
side and increases production
capacity on other side.
2. Nehru-Mahalanobis Strategy :
Second five year plan was based on
it.
It is a two sector model- Consumer
goods sector and capital goods
sector.
It emphasized investment in heavy
industry to achieve rapid
industrialisation.
Here the state controlled the
commanding heights of economy
through the public sector.
It was based on Russian experience.
The objective was to be self-reliant
and overcome capital contrivance.
3. Gandhian Strategy :
It was enunciated by Acharya S.N.
Agarwal in his Gandhian plan.
The main objective was to raise the
material as well as cultural level of
the masses so as to provide a basic
standard of life.
It laid emphasis on scientific
development of agriculture and
PC
Page 5
rapid growth of cottage and village
industries.
LPG Strategy
(Liberalisation, Privatisation and
Globalisation) :
It was introduced by Dr.Manmohan
Singh in 1991. Under Prime
Minister Narashima Rao
Government.
It ended the licence permit raj and
opened hitherto areas reserved for
the public sector to private sector.
PURA Strategy (Providing Urban Amenities in Rural Areas) It was introduced by former
President Dr.APJ Abdul Kalam.
Government implemented this
strategy in their programmers since
2004.
The objective is to propel economic
development without population
transfers.
It emphasizes on three
connectivities i.e Physical,
Electronic and Knowledge which
enhance the prosperity of cluster of
villages in rural areas.
Types of Planning : 1. Centralized Planning :
In a socialist economy (eg.
Former Soviet Russia), there was
centralized planning; it was
planning by direction
(Imperative Planning).
All economic decisions are taken
by central authority.
Government or Central
Authority decides upon every
aspects of Economic plan,
determines objectives sets
targets & priorities.
In a socialist state, most of the
means of production are owned
by the State.
This strategy is also called new
grandma strategy of
development.
2. Decentralised Planning : It is connected with the capitalistic
economies and implemented
through market mechanism.
It empowers the individuals or
small groups to carry out their
plans for the achievement of a
common goal.
PC
Page 6
3. Structural Planning :
It aims at bringing changes in
socio-economic set up of
country.
In this system of planning land-
lord system was abolished,
collective farming was
introduced, trade, industries and
transport system was
nationalised.
4. Functional Planning :
No changes brought in the
existing socio economic set up
and planning made in the
context to existing institutions.
The planning that is made to
ensure smooth working of the
organisation taking into account
the needs of each and every
department.
The purpose of functional
planning is to promote
standardised administrative
practices.
5. Planning by Inducement : It is often referred as 'market
incentives'.
In a democracy, Planning is
done by inducement.
This type of planning is mostly
found in a country that follows
mixed economy.
The government has to persuade
the industries in the private
sector to fullfil the goals of
the Plan through inducements
such as tax concessions and by
providing incentives.
6. Indicative planning :
This type planning found in
capitalist country.
In this type of planning,
the government invites
representatives of industry, and
business and discuss with them
in advance what it proposes to
do in the Plan under question
and indicates to them its
priorities and goals.
Then the Plan is formulated after
detailed discussions.
After we embraced liberalization
and privatization policies in
1991,(8th five year plan) our
Indian planning has become
indicative planning.
7. Short term plans :
Short term plans are Annual
Plans.
They are also known as
controlling plans.
'Planning in India' derives its objectives and social premises
from the 'Directive Principles of State Policy'
PC
Page 7
During the period of
implementation, Five Year Plans
operated by dividing them into
Annual Plans.
The main objective of short term
plan is to raise the revenue,
attain the short-term economic
targets, bring price stability and
remove deficit in Balance of
Payment(BOP).
8. Midterm plans :
It lasts for a period of 3 to 7
years.
Our Five Year Plans are in fact,
midterm plans.
It is related to allocation of
financial resources and physical
resources.
9. Long-term plans : It lasts for a period of 10-30
years.
They are also known as
'Perspective plans'.
10. Perspective plans
First long term plan was Goelro
plan (1920-35) implemented in
USSR.
To bring about structural and
functional changes in the Economy.
11. Rolling Plan : In this plan, every year the
performance of the plan will be
assessed and a new plan will be
made next year based upon this
assessment.
In the rolling plans there are three
kinds of plans.
1. First is the plan for the
current year which comprises
the annual budget.
2. Second is the plan for a fixed
number of years, which may
be 3, 4 or 5 years. This second
plan is kept changing as per
the requirements of the
economy.
3. Third is a perspective plan
which is for 10, 15 or 20 years.
12. Core Plan : Here the planning commission
asks the state to submit their
projected revenue estimates.
Then it determines the
expenditure heads for state
annual plans.
This helps in keeping the plan
target to realistic limits and
prevents the diversion of funds
from the priority items to the
non plan account.
Niti Aayog CEO - Amitabhkant
PC
Page 8
Vice Chairperson of NITI Aayog Mr. Aravind Panagariyua
National Institution for Transforming India Aayog (NITI)
Government has replaced the erstwhile Planning Commission with
the NITI (National Institution for Transforming India) Aayog on
January 1, 2015. NITI Aayog has a unique innovative framework to
facilitate states to participate in policy making. The Aayog has been mandated
to serve as a policy think-tank for the central as well as state governments and
has Prime Minister as its Chairperson. NITI Aayog represents an
innovative and appropriate institutional framework to replace Planning
Commission, which had lost its relevance and effectiveness in the post-reform
era. With a new focus on sound strategic and technical advice covering the
entire gamut of socio-economic policy issues within a unique framework of
Cooperative Federalism, NITI Aayog is expected to transform Indian Economy
into a formidable economic super power in the years to come.
Unlike this predecessor, NITI Aayog will have all Chief Ministers and lt.
Governors on its Governing Council in the spirit of cooperative federalism.
Besides, it will also have Regional Councils, which would be formed to address
specific issues and contingencies impacting more than one state or a region.
The Aayog will also have experts, specialists and practitioners with relevant
domain knowledge nominated by the Prime Minister as special invitees.
Planning Commission released Vision document (India Vision 2020) on January 2003.