Embed Size (px)
Citation preview
SUPPORTING INFORMATION
Smart Assembly of Mn-Ferrites/Silica Core-Shell with Fluorescein and Gold Nanorods: A Robust and Stable Nanomicelle for In Vivo Triple Modality Imaging.
Ilaria Monaco,a Paolo Armanetti,b Erica Locatelli,a Alessandra Flori,c Mirko Maturi,a Serena Del Turco,b Luca Menichetti,b* Mauro Comes Franchini a*
a. Dr. I. Monaco, Dr. E. Locatelli, M. Maturi, Prof. M. Comes FranchiniDepartment of Industrial Chemistry "Toso Montanari”. University of Bologna. Viale Risorgimento 4, 40136 Bologna (Italia)E-mail: [email protected]
b. P. Armanetti, S. Del Turco, L. MenichettiCNR Institute of Clinical Physiology, Via Moruzzi, 1 56124 Pisa (Italia)E-mail: [email protected]
c. A. FloriCNR /Fondazione Toscana G. Monasterio, Via Moruzzi, 1 56124 Pisa (Italia)
Electronic Supplementary Material (ESI) for Journal of Materials Chemistry B.This journal is © The Royal Society of Chemistry 2018

Experimental procedures
Synthesis of HS-PEG-Alkyne
Thiol moiety able to interact with the gold nanorods surface has been introduced in the ɑ-Amino-ω-alkyne PEG chains by using EDC Chemistry to form an amine bond with thioglycolic acid (TGA). ɑ-Amino-ω-alkyne PEG (Mw 3000 g/mol, 0.13 mmol) has been added to 6 mL of ultrapure water at room temperature under magnetic stirring until the complete dissolution. In a different flask thioglycolic acid (0.040 mmol) has been added in a water solution containing N-(3-Dimethylaminopropyl)-N-ethylcarbodiimide hydrochloride (0.040 mmol, EDC), in order to activate the carboxylic group of TGA. After 10 minutes, the activated TGA has been added to the first solution and the reaction has been left under magnetic stirring over night at room temperature.Then water has been removed under vacuum, the product has been characterized by used without further purification. The product was characterized with H-NMR and FTIR-ATR spectroscopy.
Synthesis of GNRs-Alkyne
GNRs stabilized with the surfactant agent hexadecyltrimethylammonium bromide (GNRs-CTAB) were prepared following the seed mediated grow method reported in literature. i,ii After purification GNRs-CTAB (5 mL) were incubated with a water solution (5 mL) containing ɑ-Mercapto-ω-amino PEG hydrochloride (0.007 mmol) and ɑ-Mercapto-ω-carboxy PEG (0.007 mmol) and the previously synthetized ligand ɑ-Thiol-ω-alkyne PEG (0.013 mmol). The suspension was left under mechanical stirring for 24 h, in order either to form on GNRs surface a moiety able to react with the azide group of MnFe2O4@SiO2-NH2/N3completely but also to remove the surfactant CTAB, which is considered extremely cytotoxic. The so-obtained PEGylated GNRs were collected by centrifugation (3 X 6000 RPM, 30 minutes) and dissolved in 5 mL of water. The PEGylated GNRs were completely characterized with 1H-NMR, C-NMR and FTIR-ATR, that showed the CTAB removal (Figure S4).
Synthesis of azide modified 3-aminopropyl)trimethoxysilane (APTMS-N3)
Under nitrogen atmosphere, the (3-Iodopropyl)trimethoxysilane (0.01 mmol) has been dissolved in 5 mL of anhydrous DMF. After that, sodium azide (0.02 mmol) has been added to the solution in order to realize a nucleophilic heterogeneous reaction with the silane precursor. The reaction was left overnight under magnetic stirring at room temperature. Then, anhydrous pentane has been used to extract the formed (azide-propyl)trimethoxysilane from the reaction mixture. 10 mL of anhydrous pentane has been added to the reaction and the suspension was stirred for 3 hours under inert atmosphere.After that the salts present in the solution, have been removed by filtration on Bucker, in order to collect the solvent. The pentane organic phase, contained in the organic biphasic solution has been separated from the phase constituted by DMF, which has been further washed with anhydrous pentane in order to collect the entire formed product.

After the pentane evaporation, the (azide-propyl)trimethoxysilane has been obtained as pale-yellow oil that was stored at 4°C. The product has been characterized with FTIR-ATR.
Synthesis of fluorescein modified 3-aminopropyl)trimethoxysilane (APTMS-FITC)
Fluorescein 5-isothiocyanate (0.90 mmol) has been dissolved in 20 mL of ethanol under magnetic stirring. Then, (3-Aminopropyl)trimethoxysilane (0.86 mmol) has been added to the formed solution, and the reaction was left over night at room temperature. After that, the ahanol has been evaporated and the fluorescein modified 3-aminopropyl)trimethoxysilane (APTMS-FITC) was used without further purification.
Synthesis of MnFe2O4
Manganese iron oxide nanoparticles (MnFe2O4) was synthetized through the thermal decomposition method following procedure reported in literature.17 Oleic acid (6 mmol), oleyl ammine (6 mmol) and 1,2-hexadecandiol (10 mmol) have been dissolved in benzyl ether (20 mL) under magnetic stirring in nitrogen atmosphere. After that, iron (III) acetylacetonate (2 mmol) and manganese (II) acetylacetonate (1 mmol) have been introduced in the solution. The mixture was heated at 200°C for 2 hours then lead to reflux for 1 hour. The mixture was then cooled to room temperature. The MnFe2O4 nanoparticles were purified by magnetic precipitation with excess of cold ethanol, dispersed in 5 mL of hexane, and washed with ethanol. The nanoparticles were redispersed in 5 mL of hexane (15 mg/mL).
Synthesis of fluorescent Core−Shell Manganese Iron Oxide−Silica Nanoparticles (MnFe2O4@SiO2-NH2/N3/FITC)
The MnFe2O3@SiO2-NH2/N3/FITC have been synthetized by following a method recently reported in literature with slight modifications.iii Briefly, hydrophobic MnFe2O4 NPs have been encapsulated in hydrosoluble micelles constituted by cetyltrimethylammonium bromide (CTAB). For this purpose, CTAB (1.37 mmol) was dissolved in 25 mL of water and sonicated with a tip-probe sonicator (600 W, 50% amplitude, 6 min) with 2.5 mL of a solution of MnFe2O4 NPs (60 mg) in hexane. The hexane was then removed from the obtained solution by heating at 70 °C for 10 min under magnetic stirring. The as-synthesized micelles were diluted with 125 mL of water, and 2.5 mL of ethyl acetate and 3.4 mL of a 28% NH3 solution were added under vigorous stirring. After 10 min, 1.5 mL of MTEOS was added drop-wise, and the mixture was stirred for 3 days at room temperature (25−30 °C). Next, 0.9 mL of 3 aminopropyl-methoxysilane (APTMS), 0.3 mL of APTMS-N3 and 0.1 mL of APTMS-FTIC were added dropwise, and the mixture was stirred for 3 more days at room temperature.The MnFe2O4@SiO2-NH2/N3/FITC NPs were purified by centrifugation (6000 rpm, 1 h) in water. To remove the CTAB, the MnFe2O4@SiO2-NH2/N3/FITC were stirred for 30 min in a mixture of ethanol and acetic acid (95:5) and centrifuged (6000 rpm, 30 min) three times. Finally, the last purifications were performed by centrifugation in ethanol and water (1:1). The MnFe2O4@SiO2-NH2/N3/FITC were dispersed in 10 mL of water (5 mg/mL).

MRI relaxivity measurements at 3T
An in-house developed T2 mapping sequence was used for measuring the transverse (T2) relaxation time, prescribed as follows: Field of View (FOV) = 16 x 16 cm2, 224 x 224 matrix, Repetition Time (TR) = 1200 ms, slice thickness = 5 mm, Number of Excitations (NEX) = 2, Echo time (TE) = 7, 14, 21, 28, 35, 42, 49, 57, 64, 71, 78, 85, 92, 99, 106, 113 ms. A Spin Echo Inversion Recovery (IR) sequence was used for longitudinal (T1) relaxation measurements with the following parameters: FOV = 16 x 16 cm2, 224 x 224 matrix, TR = 5000 ms, slice thickness = 5 mm, NEX = 2, TE = 8.5 ms, Inversion Time (TI) = 50, 100, 300, 450, 600, 900, 1100, 1200, 1300, 1500, 1700, 2000, 2400 ms.Post-processing of the MRI data was conducted in Matlab (The MathWorks Inc., Natick, MA, USA). Regions-of-interest (ROIs) were selected on MRI images for each nanoparticles concentration values, and the corresponding average signal was determined.
For IR acquisitions, the average MR signal was reported as a function of TI and the T1 relaxation time was obtained from the fit of the curve, according to:
𝑀 = 𝑀0(1 ‒ 2 ∗ 𝑒‒ 𝑇𝐼
𝑇1)
where M stands for the magnetization signal and M0 is the equilibrium magnetization.
Conversely, T2 was determined by fitting the curve obtained by reporting the average MR signal in the ROI as a function of TE and using the following equation:
𝑀 = 𝑀0 ∗ 𝑒‒ 𝑇𝐸
𝑇2
The relaxation rates R1,2 were then calculated as the inverse of the relaxation times T1,2 for each nanoparticles solution. To provide a semi-quantitative evaluation of the nanoparticles -induced relaxation effect, the longitudinal (r1) and transverse (r2) relaxivities were estimated from the slope of the best-fit line between R1,2 and nanoparticles concentration (expressed in mM Fe3+ concentration).iv
Phantom and ex vivo fluorescence tests
The fluorescence intensity of the nanoparticles containing fluorescein (excitation, and emission wavelengths were 495 and 519 nm, respectively) was measured by Photon ImagerTm (PIT) product by Biospace Lab. detection. The tests of localization and quantification of dynamic optical signal were carried out in PE tube and in ex-vivo model. A PE tube was loaded with around 30µL and the fluorescence was calculated acquiring an image of 966 x 750 pixels. The sample of chicken breast was injected with a bolus of 10µL of MnFe2O4@SiO2@GNRs@PMs using the same previous parameters.
In vitro haemolysis test
To assess the effect of nanoparticles on erythrocyte integrity, hemolysis test was performed by spectrophotometric measurement of hemoglobin release, after erythrocyte lysis. 0.2 mL of NP suspension at different concentrations (5-50-500 μg/mL) diluted in PBS, were added to 0.8 mL of sodium-citrate whole blood from healthy volunteers and incubated at 37°C for 1, 2 and 4 h at constant vortexing. Then, plasma was separated by centrifugation at 1000 g for 10 min and optical density of the supernatant was measured at 540 nm in a plate reader. Control samples were prepared incubating whole blood with PBS, without NP suspension, at the ratio corresponding to NP sample dilution. Data are expressed in arbitrary units of absorbance (AU) (mean ± SD, n=3). Sample absorbance was corrected for background interference due to NP suspension in PBS without blood.
Photoacoustic Acquisitions
The photostability (PHS) and the spectroscopic PA analysis (SPA) were studied to characterize the PA behavior of MnFe2O4@SiO2@GNRs@PMs. The PA values were calculated into selected regions of interest (ROI), drawn by software tool, on the PA images acquired. For each acquisition, the dataset of PA signals was obtained from ROIs of the same size. The SPA was performed studying the spectral PA response of the sample, using a laser stimulation of 146 wavelengths (step 2 nm) in the range between 680 and 970 nm, at 26 mJ of maximum energy peak. The PHS was evaluated over 1 minute (335 laser shots) under pulsed irradiation at 730 nm and 800 nm respectively for in vitro and ex vivo tests. The average of PA signals and their relative standard deviations σ were calculated on average of 335 points. The PA signal is proportional to the absorbance spectrum, that was acquired by a spectrophotometer (Tecan infinite 200 PRO) for all dilutions and the linear relation between concentration and absorption was checked. The linear relation between PA signal and concentration was verified by linear fitting of values obtained from the PHS acquisitions. By this method, the sensitivity was extrapolated and the MDC calculated by the following equation:
𝑀𝐷𝐶 =
𝑖
∑1
𝜎𝑖
𝑆
Where the sensitivity (S) was obtained from the slope of the calibration curve (IUPAC) and i are the standard deviations of each acquired point during the PHS measurement. The PA gain losses for each concentration of MnFe2O4@SiO2@GNRs@PMs during time, due to the laser irradiation, were assessed with the percentage difference between the data acquired at the first and last 3 seconds of PHS acquisitions. In this work, the quality of acquisition was improved, coupling the PA probe with water; by this way, the ultrasonic path and the region between the probe and the sample was air bubbles free. Post processing, into the PA images acquired from the in vitro tests, testing region was drawn around the section of each tube filled with a different dilution of MnFe2O4@SiO2@GNRs@PMs and another one drowns around the MC tube, that it was used as background PA estimation. The in vivo / ex vivo study were performed acquiring the PAS from the left leg in basal condition and after the subcutaneous injection of 100μL of MnFe2O4@SiO2@GNRs@PMs stock solution. During the in vivo test, the PHS at 710 nm was studied and SPA extrapolated. The contrast to noise ratio (CNR) and the contrast (C) were employed as image quality parameters and estimated according to the following equations:
(5)𝐶𝑁𝑅 =
𝑆𝑖𝑔𝑛𝑎𝑙 ‒ 𝑏𝑎𝑐𝑘𝑔𝑟𝑜𝑢𝑛𝑑
𝜎2𝑠 + 𝜎2
𝑏
; 𝐶 =𝑆𝑖𝑔𝑛𝑎𝑙 ‒ 𝑏𝑎𝑐𝑘𝑔𝑟𝑜𝑢𝑛𝑑
𝑏𝑎𝑐𝑘𝑔𝑟𝑜𝑢𝑛𝑑
Where Signal and background are the average of acquired signals, σs and σb their standard deviations calculated in the regions of interest in the PA images. Finally, the mouse was sacrificed and the injected region was surgically resected to study more finely the distribution of MnFe2O4@SiO2@GNRs@PMs in this sample section.
Chemophysical Characteristics of the nanosystems
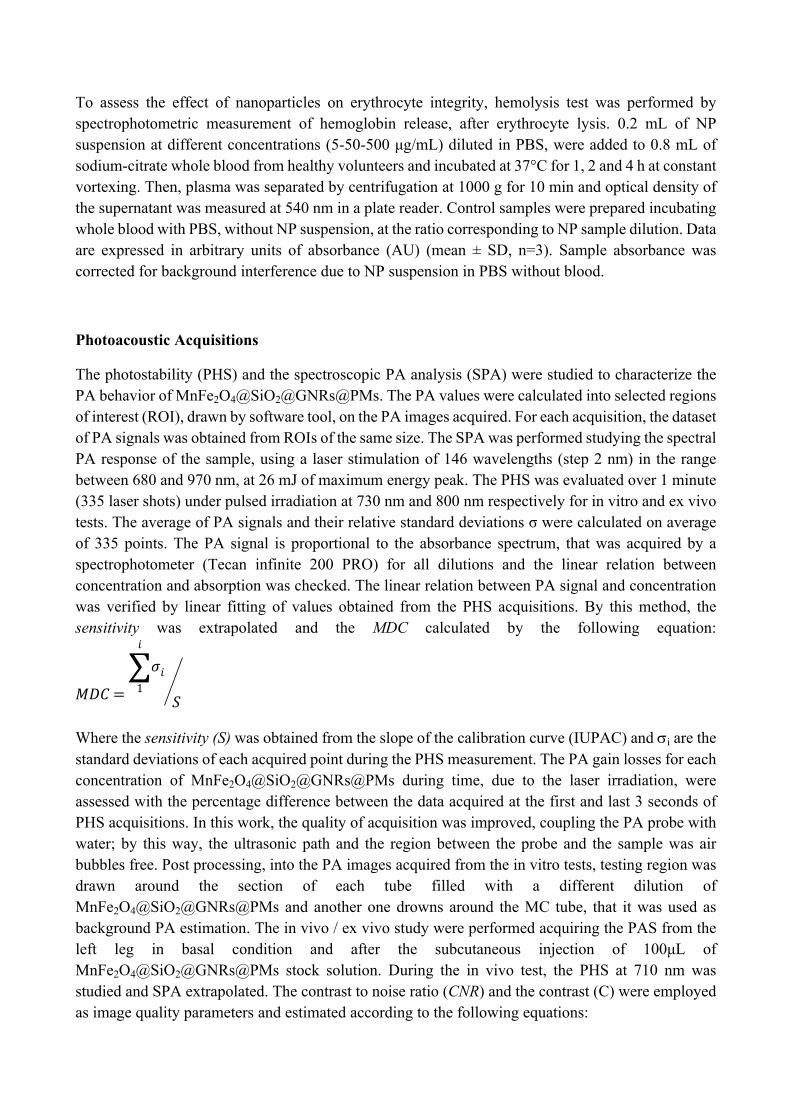
Figure S1.Dynamic light scattering (DLS) results of MnFe2O4 nanoparticles in hexane.
Figure S2. TEM images of MnFe2O4 nanoparticles
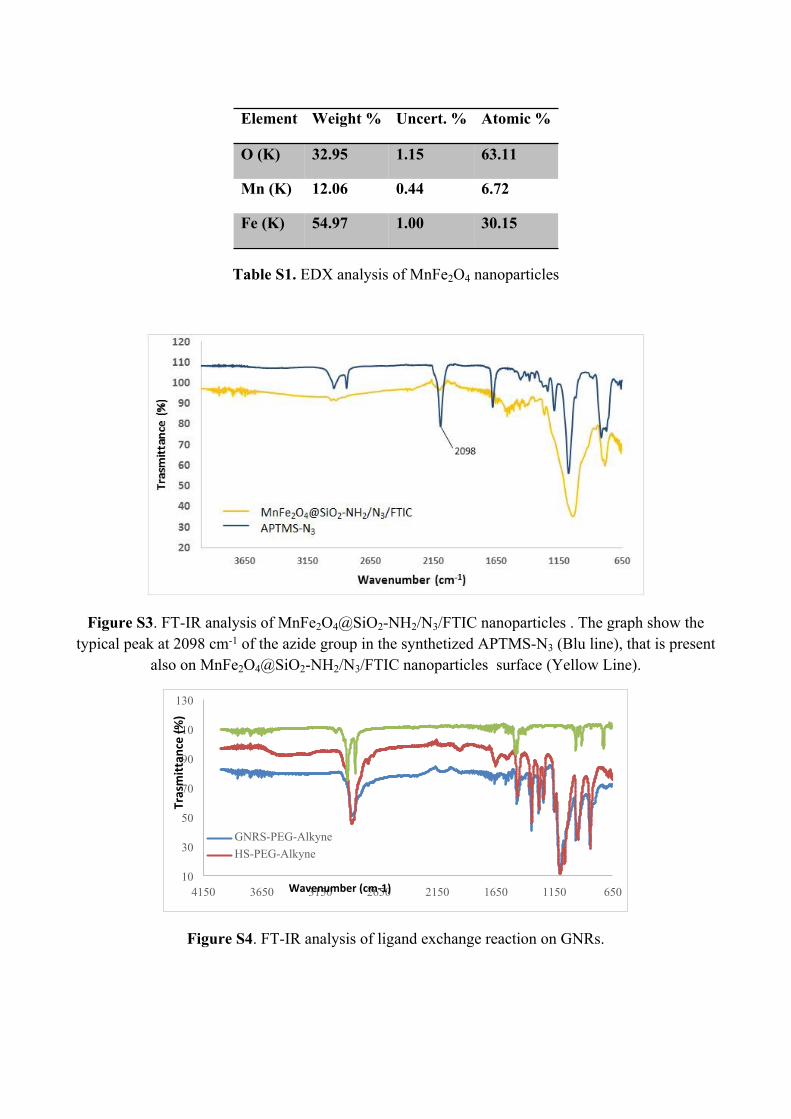
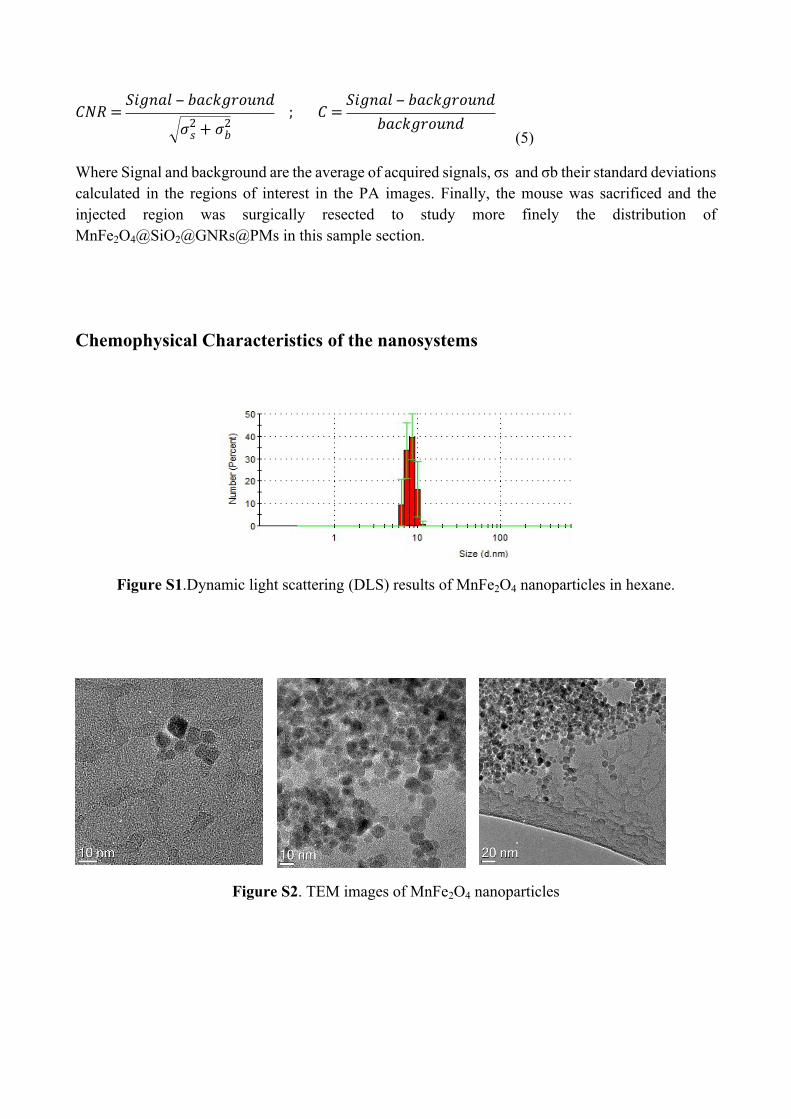
Table S1. EDX analysis of MnFe2O4 nanoparticles
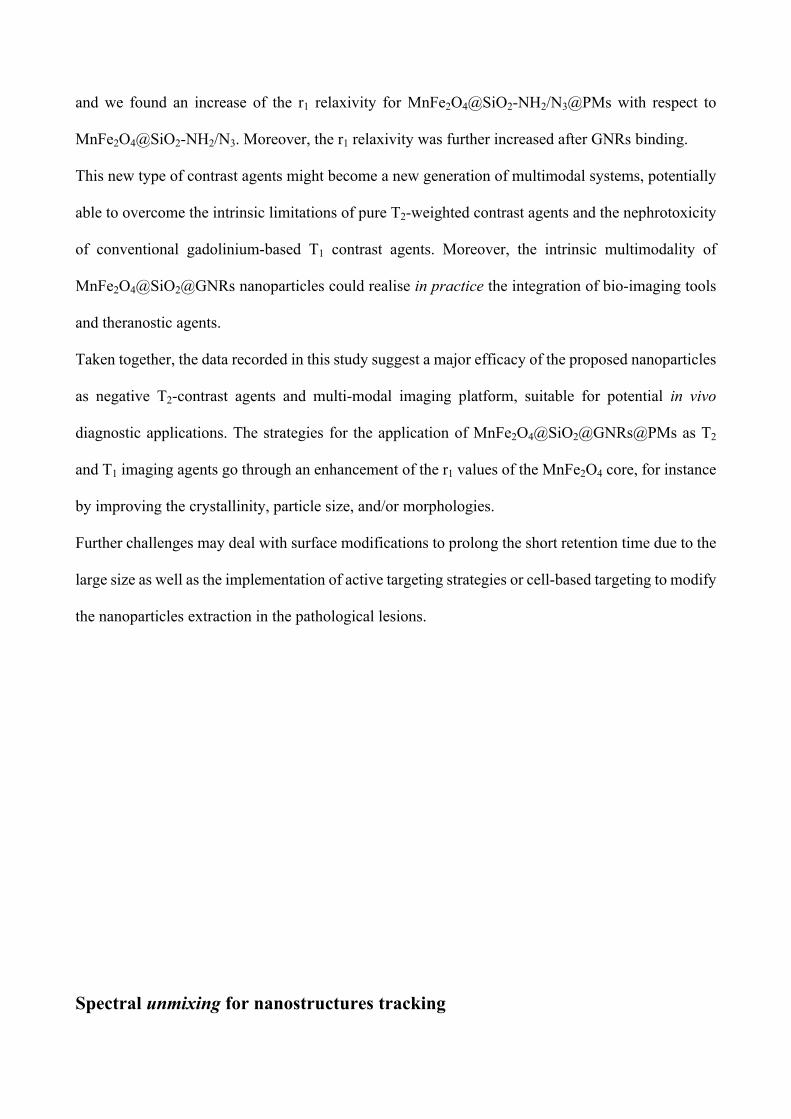
Figure S3. FT-IR analysis of MnFe2O4@SiO2-NH2/N3/FTIC nanoparticles . The graph show the typical peak at 2098 cm-1 of the azide group in the synthetized APTMS-N3 (Blu line), that is present
also on MnFe2O4@SiO2-NH2/N3/FTIC nanoparticles surface (Yellow Line).
650115016502150265031503650415010
30
50
70
90
110
130
GNRS-PEG-AlkyneHS-PEG-Alkyne
Wavenumber (cm-1)
Tras
mitt
ance
(%)
Figure S4. FT-IR analysis of ligand exchange reaction on GNRs.
Element Weight % Uncert. % Atomic %
O (K) 32.95 1.15 63.11
Mn (K) 12.06 0.44 6.72
Fe (K) 54.97 1.00 30.15

Figure S5. Dynamic light scattering (DLS) results of MnFe2O4@SiO2-NH2/N3/FTIC nanoparticles in water.
Figure S6. TEM images of MnFe2O4@SiO2-NH2/N3/FTIC nanoparticles
Figure S7. EXD analysis of MnFe2O4@SiO2-NH2/N3/FTIC nanoparticles
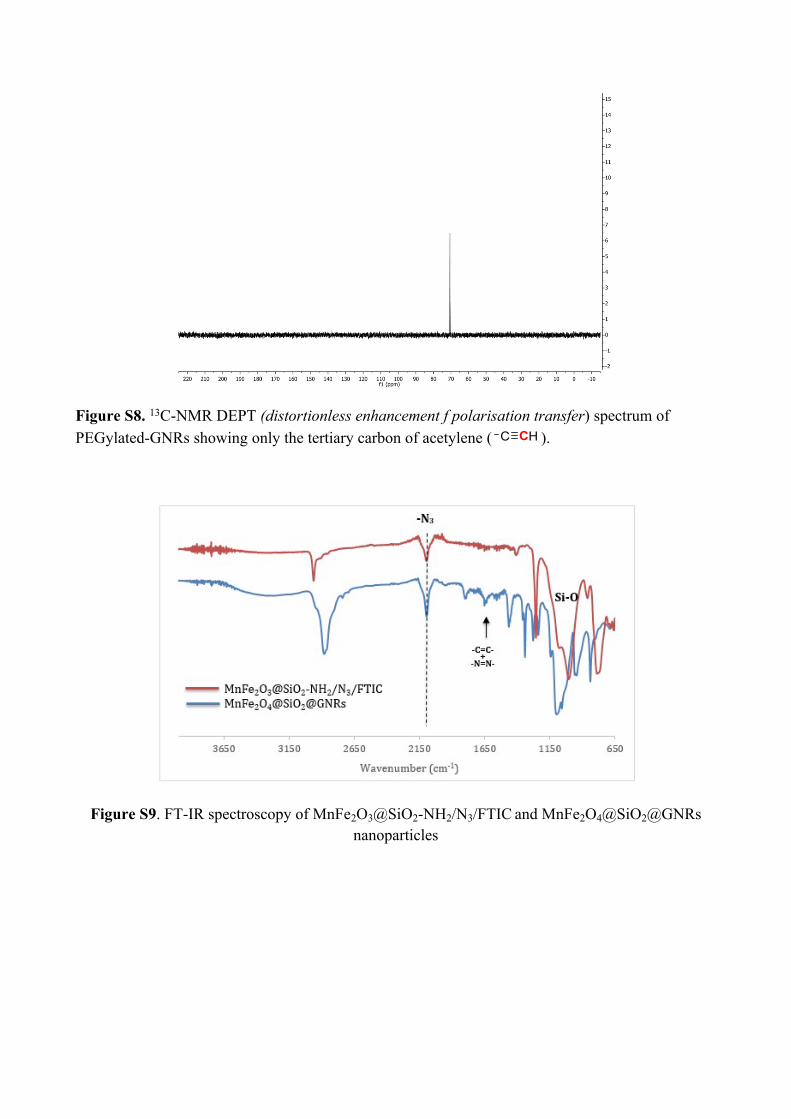
Figure S8. 13C-NMR DEPT (distortionless enhancement f polarisation transfer) spectrum of PEGylated-GNRs showing only the tertiary carbon of acetylene ( ).C CH
Figure S9. FT-IR spectroscopy of MnFe2O3@SiO2-NH2/N3/FTIC and MnFe2O4@SiO2@GNRs nanoparticles

Figure S10. TEM and STEM-HAADF images of MnFe2O4@SiO2@GNRs nanoparticles
Figure S11. UV-Vis analysis of MnFe2O4@SiO2@GNRs
Figure S12. EXD analysis of MnFe2O4@SiO2@GNRs nanoparticles
MnFe2O4@SiO2@GNRs
Not completed coated

Figure S13. Dynamic light scattering (DLS) results of MnFe2O4@SiO2@GNRs@PMs nanomicelles in water.
MnFe2O4@SiO2@GNRs@PMs Size (nm) Zpot (mV)
0 h 48 h 0 h 48 h
H2O uup 376.6 ± 7.4 388.1 ± 9.1 -13.5 -11.2
PBS Buffer (pH = 7.4) 381.3 ± 8.1 395.7 ± 6.5 - 8.2 - 7.8
Serum 393.1 ± 3.4 399.4 ± 9.0 - 2.5 - 3.7
Table S2. Dynamic light scattering (DLS) characterizations of the MnFe2O4@SiO2@GNRs@PMs in different aqueous environment after the synthesis and after 48 hours.
MRI relaxivity measurements at 3T
As previously demonstratedv, the Mn content of paramagnetic nanoparticles could reduce the T1
relaxation time, leading to a positive MRI contrast. In particular, the nanoparticles size can be suitably
tailored to exert either negative or positive contrast effect, for which a smaller size (of the order of 5
nm) favors a T1-dominated contrast. Although the positive contrast capability of these systems was
not comprehensively investigated here, we reported the R1 values as a function of Mn concentration
and we found an increase of the r1 relaxivity for MnFe2O4@SiO2-NH2/N3@PMs with respect to
MnFe2O4@SiO2-NH2/N3. Moreover, the r1 relaxivity was further increased after GNRs binding.
This new type of contrast agents might become a new generation of multimodal systems, potentially
able to overcome the intrinsic limitations of pure T2-weighted contrast agents and the nephrotoxicity
of conventional gadolinium-based T1 contrast agents. Moreover, the intrinsic multimodality of
MnFe2O4@SiO2@GNRs nanoparticles could realise in practice the integration of bio-imaging tools
and theranostic agents.
Taken together, the data recorded in this study suggest a major efficacy of the proposed nanoparticles
as negative T2-contrast agents and multi-modal imaging platform, suitable for potential in vivo
diagnostic applications. The strategies for the application of MnFe2O4@SiO2@GNRs@PMs as T2
and T1 imaging agents go through an enhancement of the r1 values of the MnFe2O4 core, for instance
by improving the crystallinity, particle size, and/or morphologies.
Further challenges may deal with surface modifications to prolong the short retention time due to the
large size as well as the implementation of active targeting strategies or cell-based targeting to modify
the nanoparticles extraction in the pathological lesions.
Spectral unmixing for nanostructures tracking

Figure S14: Spectral Unmixing Analysis: (a1),(a2),(a3), PA images processed with spectral unmixing control: in the first one was discriminated the spectral response of oxy and deoxy hemoglobin, in the second one, the previous spectral responses with the discrimination and localization of MnFe2O4@SiO2@GNRs@PMs perfusion inside the same region, the last one, semi quantitative analysis in two ROIs in which were evaluated the sO2, the Hbt and the PA signal weighted for each different spectral contribute; (b) 3D render of PA distribution of MnFe2O4@SiO2@GNRs@PMs into the tissue of biological sample.
We performed spectral unmixing analysis to evaluate and distinguish the spectral contributes of
different molecular patterns. As shows in Figure S10a1,2,3, the deoxygenayted (blue scale)/oxygenated
(red scale) hemoglobin and the MnFe2O4@SiO2@GNRs@PMs (green scale) spectra were processed
by the unmixing algorithm, that were differentiated and spatially localized into the image without
overlapping (Figure S10(a1,2)). The PA unmixing analysis provided a semi quantitative evaluation of
haemoglobin oxygen saturation (sO2), the total number of hemoglobin (Hbt) and the amount of the
PA response produced by the three components (Figure S10(a3)), that were related to their
concentrations in the selected region (injected and non-injected). At least, in Fig. 9b there are the 3D
render of photoacoustic distribution of MnFe2O4@SiO2@GNRs@PMs inside the chicken breast
sample. The results of semiquantitative analysis (Table S7) confirm the clear discrimination of

different PA responses in the selected ROIs by using the molecular fingherprint of
MnFe2O4@SiO2@GNRs@PMs.
Photoacoustic Data
Impedance (kRayl) Sound Speed(m/s) Density (g/cm3)
Soft Tissues ~1,64 ~1540 ~1,0
Water (37°C) ~1,48 ~1520 ~0,99
Agar ~1,57 ~1500 ~1,04
Polyethylene ~1,73 ~1950 ~1,73
Polypropilene ~2,40 ~2740 ~0,88
Table S3: Physical properties of material used for phantom preparation
CNR CONTRASTConcentration Mean
Value Std.Dev.Mean 3s Mean 3s
PHS (a.u. · min-1)
1:4 6.4 0.2 31 46 38 36 ±3%
1:8 3.0 0.1 29 37 17 17 ±1.7%
1:16 1.87 0.06 27 16 10 11 ±6%
1:32 0.69 0.03 18 14 3 3 ±2.3%
Sensitivity 27±3
MDC 0.014
Table S4: Photoacoustic in vitro results, the values CNR and Contrast were calculated by averaging on the total irradiation time (mean) and in the first 3s of irradiation (3s)
Linear Regression for PAS vs Concentration
PAS = Sensitivity * Concentration + q
Coefficient Value Error
q -0,29 0,18
Sensitivity 27 3
R SD #Points Pearson
0,98518 4,69168 4 0,01482
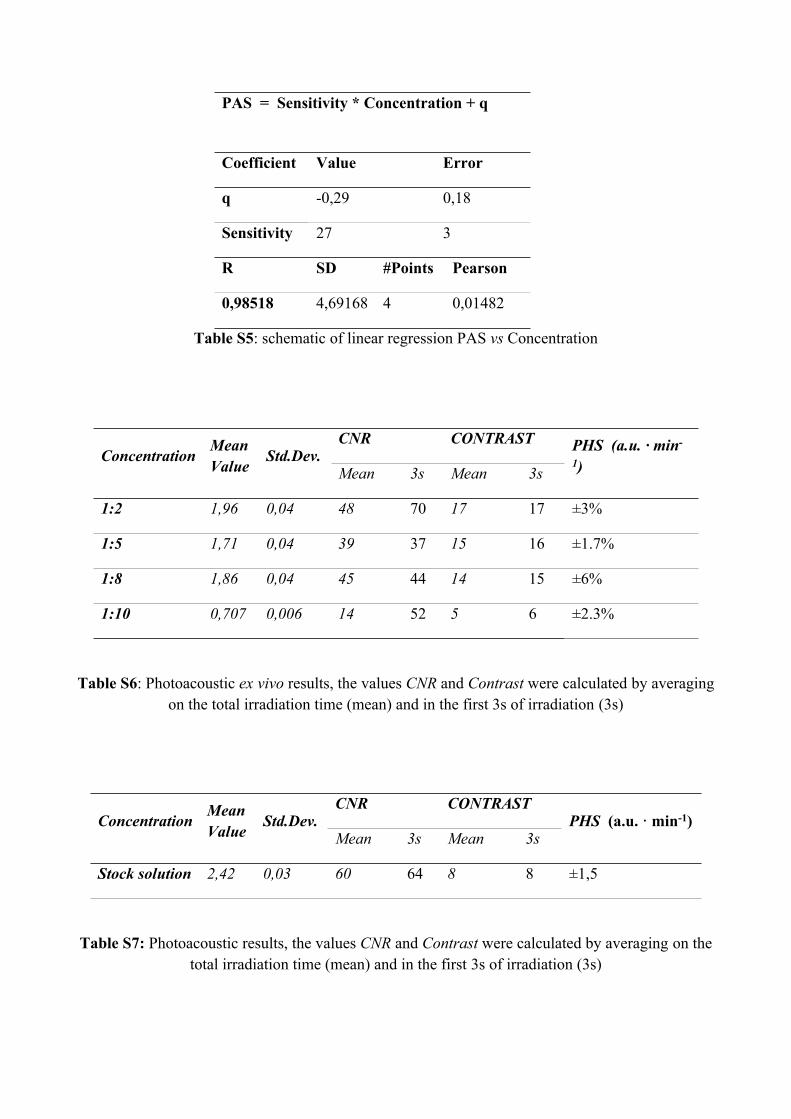
Table S5: schematic of linear regression PAS vs Concentration
Table S6: Photoacoustic ex vivo results, the values CNR and Contrast were calculated by averaging on the total irradiation time (mean) and in the first 3s of irradiation (3s)
Table S7: Photoacoustic results, the values CNR and Contrast were calculated by averaging on the total irradiation time (mean) and in the first 3s of irradiation (3s)
CNR CONTRASTConcentration Mean
Value Std.Dev.Mean 3s Mean 3s
PHS (a.u. · min-
1)
1:2 1,96 0,04 48 70 17 17 ±3%
1:5 1,71 0,04 39 37 15 16 ±1.7%
1:8 1,86 0,04 45 44 14 15 ±6%
1:10 0,707 0,006 14 52 5 6 ±2.3%
CNR CONTRASTConcentration Mean
Value Std.Dev.Mean 3s Mean 3s
PHS (a.u. · min-1)
Stock solution 2,42 0,03 60 64 8 8 ±1,5

Table S8: Spectral unmixing analysis: discrimination of different molecules and semiquantification of oxygen saturation (sO2) and total hemoglobin (Hbt)
PA ValueROI Area (mm2)
GNRs DeOxy Oxy%sO2
Normal tissue 4,499 0,062 0,079 0,368 82,561
Injected tissue 3,785 0,795 0,193 0,279 60,906

Figure S15: PA test ex vivo: SPA and PHS for 1:5, 1:8, 1:10 dilution (1° column), 3D PA render of sample in basal condition (up) and after injection (down) (2° column), the PA distribution is drown in rainbow scale; 2D slice of injected region, Pa (up) and Echographic (down) images (3° column)
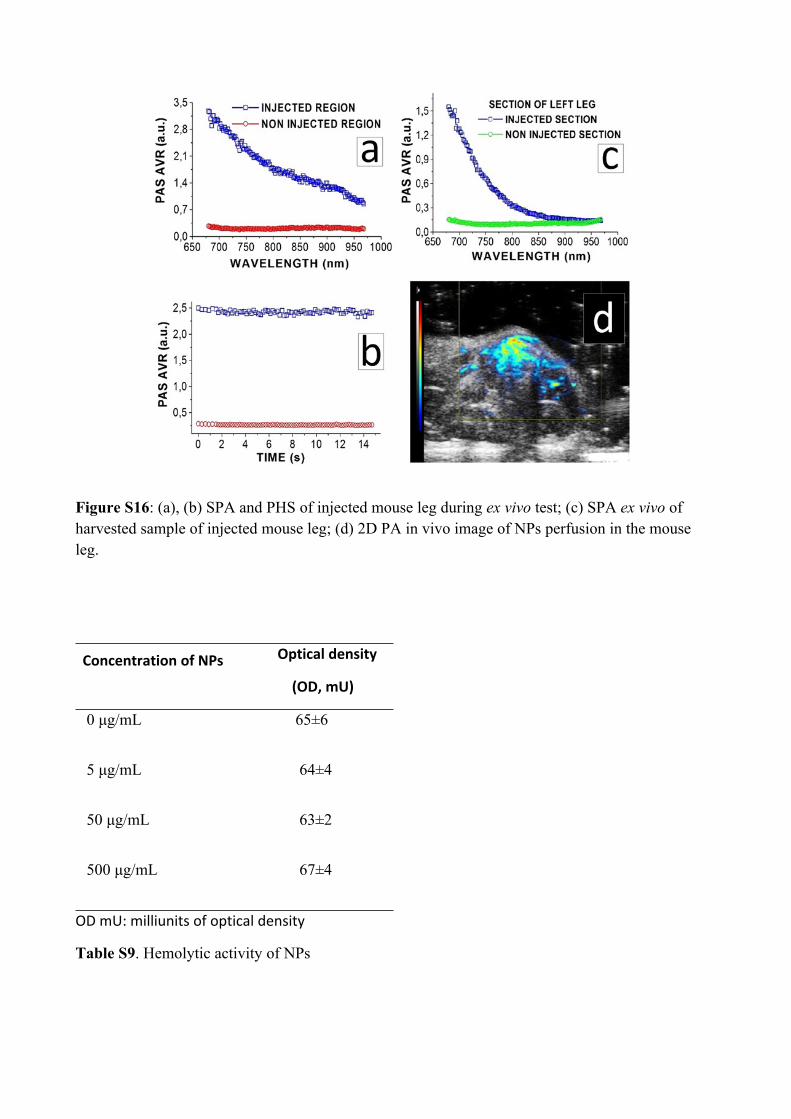
Figure S16: (a), (b) SPA and PHS of injected mouse leg during ex vivo test; (c) SPA ex vivo of harvested sample of injected mouse leg; (d) 2D PA in vivo image of NPs perfusion in the mouse leg.
Concentration of NPs Optical density
(OD, mU)
0 μg/mL 65±6
5 μg/mL 64±4
50 μg/mL 63±2
500 μg/mL 67±4
OD mU: milliunits of optical density
Table S9. Hemolytic activity of NPs

References
i B. Nikoobakht, M.A. El-Sayed, Chem. Mater., 2003, 15, 1957–1960.ii C. J. Murphy, T. K. Sau, A. M. Gole, C. J. Orendorff, J. Gao, L. Gou, S. E. Hunyadi, T. Li, J. Phys. Chem. B, 2005, 109, 13857–13870.iii I. Monaco, F. Arena, S. Biffi, E. Locatelli, B. Bortot, F. La Cava, G. M. Marini, G. M. Severini, E. Terreno, M. Comes Franchini; Bioconjugate Chem. 2017, 28, 1382−1390.iv Laurent et al. Chem. Rev. 2008, 108, 2064–2110, 10.1021/cr068445ev Huang et al. Nanoscale, 2014, 6, 10404-10412, DOI: 10.1039/c4nr02680b