Embed Size (px)
Citation preview

National Criminal Jl:)sti'ce Reference Servic_e -------------------~
I - ... ;
nCJrs This microfiche was' produced from documents received fOl: . inclusion in the NCJRS data base. Since NCJRS cannot exercise controi over the physical condition of the documents submitted; the individual frame quality will vary. The resolution chart on this frame may be used to evaluate the document quality.
1.0 ng 11111
2.8
111112.5
M,g ~ 1~113.2 B~
~p-~ u: JI.I
~~ Il.I &:1. l:. " w .... 1.1
111111.25 /11/11.4 /////1.6
MICROCOPY RESOLUTION TEST CHART NATIONAL BUREAU Of STANDARDS·1963·A
Microfilming procedures us~d to create this fiche comply with the standards set forth in 41CFR 101-11.504. '
Points of view or opinions stated in this document are those of the author(s) and do not represent the official position or policies of the U. S. Depmtment of Justice.
National Institute of Justice United States Department of Justicle
'Washington, D. C. 20531
.. -
I I-
cJ .
, ~
". '
.~
r~: ',~
.-
-p.
f.-'~'~;-~ , {
f
••. ~ -~ , Ii
, ','<t. 0 j~
1 il jf
l~
rl I,
;p,. If. IU
.' Ii"
!~ l .J.
~. i& 'iif
1~'
I~ ;!~ li~
1'1'
I~ . ~l~ >' j
\. '" ,\; ,I;
:, ,\jJ~ if
, .~ ~
..
D
- n
:;1 0 ",
':"':,,;' :'"
0
,"0
~. -.
'" <b.
.,
¢
~/'I'
;?',
9'
'" <:;
.0 .. " a o
i:1 "t. f"
.~. ~-'
,i._~'!ijjr." t~' rn. '
• -;., .il C' _ .-...... .. '" . '.' - ..•.. _ ..........•..
~Dr.lI?LllEfUZED ·JRflC.-UDllll;1f STDtEDf Off'GE~lJlIlpmE~l.
-,' -,' '-' ,t! " .', ' " . ,': ,'." . a ' ,,' '."", -' , ,.- {t.'"
." .;' '. . . ' - • ". -. . • /". . . .;.' '.. . . . _If - .
·A· NEWEN·FORCEME-NTQ,tF;FENSJVE'~ IN THEMAKII\IO .Q
" .:;. ,
U.S. Department of Justice National Institute of Justice
This document has been reproduced exactly as received from the person or organization originating it. Points of view or opinions stated In this document are those of the authors and do not necessarily represent the official position or policies of the National Institute of Justice.
Permission to reproduce this olilf3')rigRled material has been granted by
Public Domain u.s. Dept. of Justice
to the National Criminal Justice Reference Service (NCJRSj.
Further reproduction oll!side of the NCJRS system requires permis. sion of the c~owner.
• Q
'. A SPECIAL REPORT TO THE ADMINISTRATOR . , " , o· - " , . . ' ,~.," : .. I" ~"", , •
.0 o n
.MARCH.1·S79·
'0' ,
',-
@.
0- ..
'=tl i>. rx i ! ,
., , "
Q <!--'.
, .i
;O/J
,tJ : '. -
.1 '"
,
If you have issues viewing or accessing this file contact us at NCJRS.gov.

" :»:~~.
-
Caution I ed information should
Any media release of the enc os oration and the word delete .referencesfto theIIB~oC~~~ general word/term typewriters.. Re e~, on y iloffice eqUIpment. .
. . r pertaining to this caution, If there are any t~uec ~~~al Conspiracies Division, please cont~c~ leJUSr~iCe Programs on 202/376-3990. Office of Cumma .
1
82690 ent of Justice
U.S. oeparto;' 01 Justice Nationallnst!tute cI Irom \he
actlv as receive cI been reprocluced ex '. W or opinions state
ThiS document ha~ n originating It pOints 01 VI~ do not necessarily person or organlza I~ those 01 lhe authOrS! ~~e Na\lonal Ins\ltute 01 in this document ar l oSI\<on or poliCies a represent the offlcla P
Justice hted matenal has been roouce thiS Copyng h
Permission to rep Affa irs Researc grantedbBattelle Human .~ .. ~_". __ .---.--
---~ee1')tel"-- __ ~ _-~.~-~--'-----.- Reference Service (NCJRS).
to the National Criminal Justice requireS permiS'
. tside 01 the NCJRS system Further reprodUCtion au sian of the Copynght owner
I
I, ,
L[]I~FlUTER~ZE(] TRJ1LK~~[j []f ET[]LEI)I []ff~LE E[JU~Flr:lEr.iT
A NEW ENFORCEMENT OFFENSIVE IN THE MAKING
A SPECIAL REPORT TO THE ADMINISTRATOR
MARCH 1979
PREPARED BY
MARILYN E. WALSH, Ph. D. BATTELLE LAW AND JUSTICE STUDY CENTER
CRIMINAL CONSPIRACIES DIVISION OFFICE OF CRIMINAL JUSTICE PROGRAMS
LAW ENFORCEMENT ASSISTANCE ADMINISTRATION UNITED STATES DEPARTMENT OF JUSTICE
WASHINGTON, D.C. 20531

-I
- ,
----------~',.."
'"
? I.
TO: Henry S. Dogin, Administrator Law Enforcement Assistance Administration
THROUGH: J. Robert Grimes, Assistant Administrator Office of Criminal Justice Programs
It is with enthusiasm that I transmit to you this Special Confidential Report on Computerized Tracking of Stolen Office Equipmen~. This report describes an effective new investigative technique, based on computerized matching of automated stolen property files with repair records of private industry, which makes possible the identification and recovery of stolen goods, and the investigation of illicit traffickers in such items. Documented for the first time in this report are national distribution patterns for stolen office equipment, with special emphasis on the marketplace for stolen typewriters in the State of California.
This project is worthy of special note because in sixteen months and with budgeted expenditures of less than $60,000 it has resulted in the following:
identification of the current location across the United States of approximately 10,000 pieces of stolen office equipment;
initiation and documentation of approximately 2,500 field investigations into the redistribution of stolen office equipment in the State of California;
recovery of approximately 2,100 typewriters stolen from residents of the State of California, valued at $1.3 million; and
enhancement of the recovery rate for stolen office equipment in California, 22.7% over a base period before project implementation.
All these a~complishments could not have been possible without the special commitment and painstaking efforts of the California Department of Justice, Organized Crime & Criminal Intelligence Branch, which developed the computer match technique described here; the support and cooperation of the IBM Corporation, whose excellent record-keeping systems made use of the techni~2e especially successful; and the documentation and analysis provided by Dr. Marilyn Walsh, of the Bat,telle Law and Justice study Center. Their combined efforts represent a unique public/private partnership in support of law enforcement objectives which is often sought, but rarely achieved. While the emphases of the project on the State of California and on stolen office equipment are derived from this partnership, it is clear that project benefits can be extended to all jurisdictions which maintain automated stolen property records, and to all serialized commoditie3 where manufacturers maintain adequate sales and repair records.
The information provided by this project has never before in the history of law enforcement been available. Now it is possible for law enforcement agencies to develop the pattern and flow of stolen goods, and to document the activities of organized criminal fencing operations on a nationwide basis. In light of these singular benefits and of the accomplishments noted above, I transmit this report to you as a document with broad and promising proactive implications for the law enforcement community.
Golden Director Criminal Conspiracies Division
,- "'"".
;:
Ii Ii II r{ il [1 d
I •

..,....''''' -
...
..
"
. " - . ,
.. .
,
~ , ,
...
, .'
~- ",-' , , - '\,
7 I
, "
I 1 ~ fl
H 'I I, I' Il \1 II lj \1 "
Ii
n JI II
;1 t II II
I Ij h il ~ l l:J
~l rI tl !I l' 11 ti \ \ ? i ;1 U \1 '}"l
t ! ri n ~ t , j
H tJ "
EXECUTIVE SUMMARY
I
I
THIS REPORT SUMMARIZES THE rNFOR~1ATION GENERATED BY AND THE RESULTS OBTAINEfr THROUGH APPLICATION OF A NOVEL INVESTIGATIVE TECHNIQUE WHICH SHOWS GREAT PROMISE FOR INHIBITING THE MARKET FOR STOLEN GOODS) BY SURFACING AND TRACKING THE PATHS TAKEN BY STOLEN PROPERTY FROM THE POINT OF THE ORIGINAL THEFT TO THE FINAL CONSUMER. THE TECHNIQUE CONSISTS OF IDENTIFYING THE CURRENT LOCATIONS OF STOLEN GOODS BY MAKING MACHINE COMPARISONS BETWEEN AUTOMATED STOLEN PROPERTY FILES MAINTAINED BY LAW ENFORCEMENT AGENCIES,. AND AUTOMATED REPAIR RECORDS OF PRIVATE INDUSTRY. BECAUSE THE TECHNIQUE UTILIZES EXISTING AUTOMATED RECORD-KEEPING SYSTEMS) IT REPRESENTS A PRACTICAL AND COST EFFECTIYE METHOD OF GENERATING LARGE NUMBERS OF QUALITY INVESTIGATIONS OF ILLICIT TRAFFICKERS IN STOLEN MERCHANDISE) AND OF IDENTIFYING AND RECOVERING STOLEN PROPERTY.
THE COMMODITY FOCUSED O~ IN THIS REPORT IS STOLEN OFFICE EQUIPMENT) AND IN PARTICULAR STOLEN IBM TYPEWRITERS. THIS IS BECAUSE OF THE SUPPORT AND COOPERATION OF THE IBM CORPORATION IN THE PROJECT. IT IS CLEAR) HOWEVER) THAT THE TECHNIQUE APPLIED HERE HAS THE POTENTIAL FOR MUCH BROADER,APPLICATION TO ALL CLASSES OF SERIALIZED GOODS) WHERE ADEQUATE RECORD-KEEPING SYSTEMS EXIST.
THE REPORT IS DIVIDED INTO TWO PARTS. PART I DESCRIBES THE NATIONAL DISTRIBUTION PATTERNS FOR STOLEN OFFICE EQUIPMENT REVEALED BY THE IDENTIFICATION OF THE, CURRENT LOCATIONS ACROSS THE COUNTRY OF APPROXIMATELY 7)000 STOLEN TYPEWRITERS. THE MAJOR CHARACTERISTICS OF THESE DISTRIBUTION PATTERNS ARE:
• WESTERN U.S. JURISDICTIONS WHICH HAVE LARGE INTERNAL MARKETS FOR STOLEN OFFICE EQUIPMENT ARE SUPPLIED LARGELY BY IN-STATE THEFTS) AND SECONDARILY BY IMPORTS OF STOLEN ITEMS FROM OTHER STATES
• EASTERN U.S. JURISDICTIONS WHICH HAVE LARGE INTERNAL MARKETS FOR STOLEN OFFICE EQUIPMENT ARE SUPPLIED LARGELY BY IMPORTS OF STOLEN ITEMS FROM OTHER STATES) AND SECONDARILY BY IN-STATE THEFTS
• IN WESTERN U.S. JURISDICTIONS IMPORTS OF STOLEN TYPEWRITERS GENERALLY EXCEED EXPORTS OF 'SUCH ITEMS
• IN EASTERN U.S. JURISDICTIONS EXPORTS OF STOLEN TYPEWRITERS GENERALLY EXCEED IMPORTS OF SUCH ITEMS
• THE KEY ELEMENT OF THE STOLEN OFFICE EQUIPMENT MARKETPLACE IN WESTERN JURISDICTIONS IS A BOOMING LOCAL DEMAND FOR SUCH ITEMS WHICH KEEPS MANY IN STATE FOR RESALE
• THE KEY ELEMENT OF THE STOLEN OFFICE EQUIPMENT ,MARKETPLACE IN EASTERN JURISDICTIONS IS TRANSPORTATION SINCE LARGE AMOUNTS
, I
, I
t

•
,--- ---------~ ~~ -~ ---- --
OF SUCH ITEMS ARE MOVED IN AND OUT OF THESE STATES FOR RESALE AND REDISTRIBUTION FIVE STATES--CALIFORNIA) ILLINOIS) NEW YORK) OHIO) AND TEXAS-FORM A KEY GROUP OF JURISDICTIONS WHICH ARE MAJOR IMPORTERS OF STOLEN TYPEWRITERS FROM OTHER STATES AND MAJOR SUPPLIERS OF SUCH ITEMS TO OTHER STATES, THEY ARE ALSO PRIME TRADING PARTNERS WITH EACH OTHER IN THE ILLICIT REDISTRIBUTION OF STOLEN OFFICE EQUIPMENT.
PART II OF THE REPORT FOCUSES IN DETAIL ON THE STOLEN OFFICE EQUIPMENT MARKETPLACE WITHIN THE STATE OF CALIFORNIA. IT IS BASED ON THE RESULTS OF A SERIES OF DOCUMENTED FIELD INVESTIGATIONS OF ILLICIT TRANSACTIONS INVOLVING STOLEN TYPHlRITERS THAT WERE INITIATED BY THE CALIFORNIA DEPARTMENT OF JUSTICE AND CONDUCTED BY LOCAL LAW ENFORCEMENT AGENCIES. BASED UPON THIS PILOT EFFORT IN THE STATE OF CALI FORN IA) THE FOLLO\AII NG RESULTS WERE ACH I EVED:
• IHE IDENTIFICATION OF THE CURRENT LOCATIONS OF APPROXIMATELY ~)OOO TYPEWRITERS ORIGINALLY STOLEN FROM CALIFORNIA RESIDENTS;
• THE5 INITIATION) DOCUMENTATION) AND PROCESSING OF APPROXIMATELY 2) 00 FIELD INVESTIG . .\TIONS OF STOLEN TYPE\'lRITER TRANSACTIONS IN THE STATE OF CALIFORNIA;
• THE RECOVERY OF 2)100 STOLEN TYPEWRITERS) VALUED AT $1.3 MILLION;
• AN INCREASE OF 22.7% IN THE STATEWIDE RECOVERY RATE FOR STOLEN OFFICE EQUIPMENT) OVER A BASE PERIOD PRECEDING PROJECT IMPLEMENTATION.
IN ADDITION TO THESE ACHIEVEMENTS) THE DOCUMENTED FIELD INVESTIGATIONS CONDUCTED BY LAW ENFORCEMENT AGENCIES PROVIDED THE FOLLOWING INFORMATION ABOUT THE THEFT AND REDISTRIBUTION OF STOLEN TYPEWRITERS IN THE STATE OF CALIFORNIA:
• THE MOST FREQUENT VICTIMS OF TYPEWRITER THEFTS ARE THE BUSINESS AND PROFESSIONAL COMMUNITIES) AND GOVERNMENT AGENCIES AND INSTITUTIONS. .
• TOTAL LOSSES IN THE TYPEWRITER THEFTS PROFILED HERE WERE $2.3 MILLION) WITH AN AVERAGE LOSS PER VICTIM OF APPROXIMATELY $2)500.
• TRADITIONAL ENFORCEMENT RESPONSES IN THE CASES PROFILED HERE YIELDED CLEARANCES BY ARREST IN LESS THAN 1% OF THE CASES) AND PARTIAL RECOVERIES OF PROPERTY STOLEN IN ONLY 3% OF THE CASES. THUS VICTIMS OF TYPEWRITER THEFTS ARE UNDER ORDINARY CIRCUMSTANCES GIVEN LITTLE HOPE OF EVER SEEING THEIR PROPERTY AGAIN OR OF HAVING THEIR THEFTS SOLVED BY THE CRIMINAL JUSTICE SYSTEM.
7 i . " .
• " - ,
-------~ -----~~--
----~ -~-~------------
• ~g~~E~~~kEN A~6P~~~ITERS WERE LOCATED IN THE SAME TYP.ES OF AND INSTITUTIONS) ~~g~I~~~~HO~~~~E~ADA~DEE~~BTLIC SECTOR AGENCIES
.1', S OLEN .
• 58% OF THE IDENTIFIED FINA PURCHASED THEM FROM INDIVItU~E~SU~NEDRS48e STOLEN TYPEWRITERS SUPPLIERS. ) ~ro FROM COMMERCIAL
• THE MOST FREQUENT COMMERCIAL SU . WERE OFFICE EQUIPMENT"WHOLESALE~~Lr~~SR~~ASTOLEN TYPEWRITERS ~~~~~~: ~~S~O:R~~~~:~LY APPROACHED POTENTlitE:~~ER~N~~V~~~~~
•
..
. ",
•
1 }"
f -1 ~

'.
,. -'"
. , . ..... '.~ ..
" , . V I
. ';:' "
't
"
TABLE OF CONTENTS
INTRODUCTION . . . • . . • • .
PART I: DISTRIBUTION PATTERNS FOR STOLEN OFFICE MACHINES - THE NATIONAL SCENE . .
A. Current Locations of Identified Stolen Typewriters .........•.
1. Jurisdictions dominated by a domestic market for stolen office machines . . . . . . . . . .
2. Jurisdictions dominated by an import market
1
5
11
16
for stolen office equipment. . . .. ••. 24
B. Patterns of Movement for Stolen Typewriters f.or Selected Jurisdictions . . . . . . • . .
1. Jurisdictions where stolen office equipment
39
IS more likely to remain in state. . . . . .. 41
2. Jurisdictions where stolen office equipment is more likely to be exported to other states. 50
C. The Distribution of Stolen Office Equipment at the National Level: Sbme- Implications for Law Enforc'ernent . . • . . . . • . . . . . . . 53
PART II: THE THEFT AND DISTRIBUTION OF ,STOLEN OFFICE MACHINES - THE CALIFORNIA SCENE. . • 73
A. Nature of the Thefts in Which Typewriters Were S to'len . . . . . . . . . . . . . . . . . . . . 78
B. Characteristics of the Setting Where Stolen Type-writers Were Found ..••......•... 81
C. Cir'cumstances Surrounding the Purchase of Stolen Typewri ters . . . • •. •.•••....• 89
D. Special Inquiries' into the Movement of Stolen Typewriters 'withi'nthe State of. California 95
E. Project Results and Implications . . • . . 102
i

TABLE 1:
TABLE 2:
TABLE 3:
TABLE 4:
TABLE 5:
TABLE 6:
TABLE 7: '.
TABLE 8: . '
TABLE 9: , ..
TABLE 10:
TABLE 11:
- - -- ------ -,--, - -----
LIST OF TABLES
JURISDICTIONS WHERE 75 OR MORE STOLEN TYPEWRITERS WERE LOCATED, BROKEN DOWN BY THE DOMESTIC AND IMPORT COMPONENTS OF TBE MARKETPLACE . . . . . . . • . . . . . • . 14
STATES WHERE MORE THAN 60 PERCENT OF THE STOLEN TYPEWRITERS REMAINED IN THE JURISDICTION. . • . . . . . . . . . . . • •. 23
ALL JURISDICTIONS WITH 50 OR MORE IDENTIFI~ CATIONS OF STOLEN TYPEWRITERS, INCLUDING TOTAL NUMBER OF IDENTIFICATIONS MADE, NUMBER AND PERCENTAGE REMAINING IN STATE, AND NUMBER AND PERCENTAGE BEING EXPORTED FROM JURISDICTION. . . . . . . . . . . . . . • 40
NUMBER OF STOLEN TYPEWRITERS IMPORTED BY AND EXPORTED FROM THE STATES OF ARIZONA, CALIFORNIA, COLORADO, LOUISIANA, TEXAS AND WASHINGTON . . . . . . . . . . . . . . . . . NUMBER OF STOLEN TYPEWRITERS IMPORTED BY AND EXPORTED FROM THE STATES OF CONNECTICUT, FLORIDA, GEORGIA, ILLINOIS, MARYLAND, MICHIGAN, MISSOURI, NEW JERSEY, NEW YORK, OHIO, PENNSYLVANIA, TENNESSEE, VIRGINIA AND THE DISTRICT OF COLUMBIA. . . •
TYPES OF THEFT VICTIMS.
DOLLAR VALUES OF THEFT LOSSES
STATUS OF THEFT CASES PRIOR TO PROPERTY RECOVERY INVESTIGATION . . . . • .
MOST FREQUENT SETTINGS WHERE STOLEN TYPEWRITERS WERE LOCATED. . . . . . . .
SETTINGS WHERE STOLEN TYPEWRITERS WERE LOCATED . . . • . . . . . . . . .
RELATIONSHIP BETWEEN SETTINGS WHERE TYPEWRITERS WERE LOCATED AND TYPES OF VICTIMS FROM WHICH THEY WERE STOLEN ......•.
ii
50
52
78
80
81
82
84
88
TABLE 12:
TABLE 13:
TABLE 14:
TABLE 15:
TABLE 16:
TABLE 17:
-.
TYPE OF SETTING WHERE PURCHASE WAS MADE, BY TYPE OF SETTING WHERE STOLEN TYPEWRITER WAS LOCATED. . . • . . • • • . • . . • . • .
THE GEOGRAPHIC MOBILITY OF TYPEWRITERS STOLEN IN CALIFORNIA AND REMAINING IN STATE.
THE GEOGRAPHIC MOBILITY OF TYPEWRITERS STOLEN FROM NORTHERN VERSUS SOUTHERN CALIFORNIA JURISDICTIONS • . . • • • • . • . • •
DISTANCES LOGGED BY TYPEWRITERS STOLEN AND REMAINING IN CALIFORNI~ INCLUDING ALL JURISDICTIONS AND THE NORTHERN AND SOUTHERN CALIFORNIA SUBGROUPS . . . . . . • . . . • .
ELAPSED TIME BETWEEN THE DATE OF THEFT AND PURCHASE OF STOLEN TYPEWRITERS BY NEW OWNERS
SUMMARY OF ACCOMPLISHMENTS: CALIFORNIA TYPEWRITER RECOVERY PROJECT. . • . • . •
iii
9.3
96
98
99
101
104
. \
! I , I
" !
')

LIST OF FIGURES
Page
FIGURE 1: NUMBER OF TYPEWRITERS STOLEN FROM EACH STATE. 6
FIGURE 2: NUMBER OF STOLEN TYPEWRITERS LOCATED IN EACH STATE . . . . . . . . . . . . . . . • . . . . 12
FIGURE 3: STATES DOMINATED BY A DOMESTIC VERSUS AN IMPORT MARKETPLACE FOR STOLEN OFFICE EQUIP-MENT. . . . . . . . . . • . . . . . . . . • . 1
7
FIGURE 4: STATES OF ORIGIN FOR STOLEN TYPEWRITERS NOW LOCATED IN CALIFORNIA . . . . . . . . . 19
FIGURE 5: STATES OF ORIGIN FOR STOLEN TYPEWRITERS NOW 20 LOCATED IN TEXAS. . . . . . . . . . . •
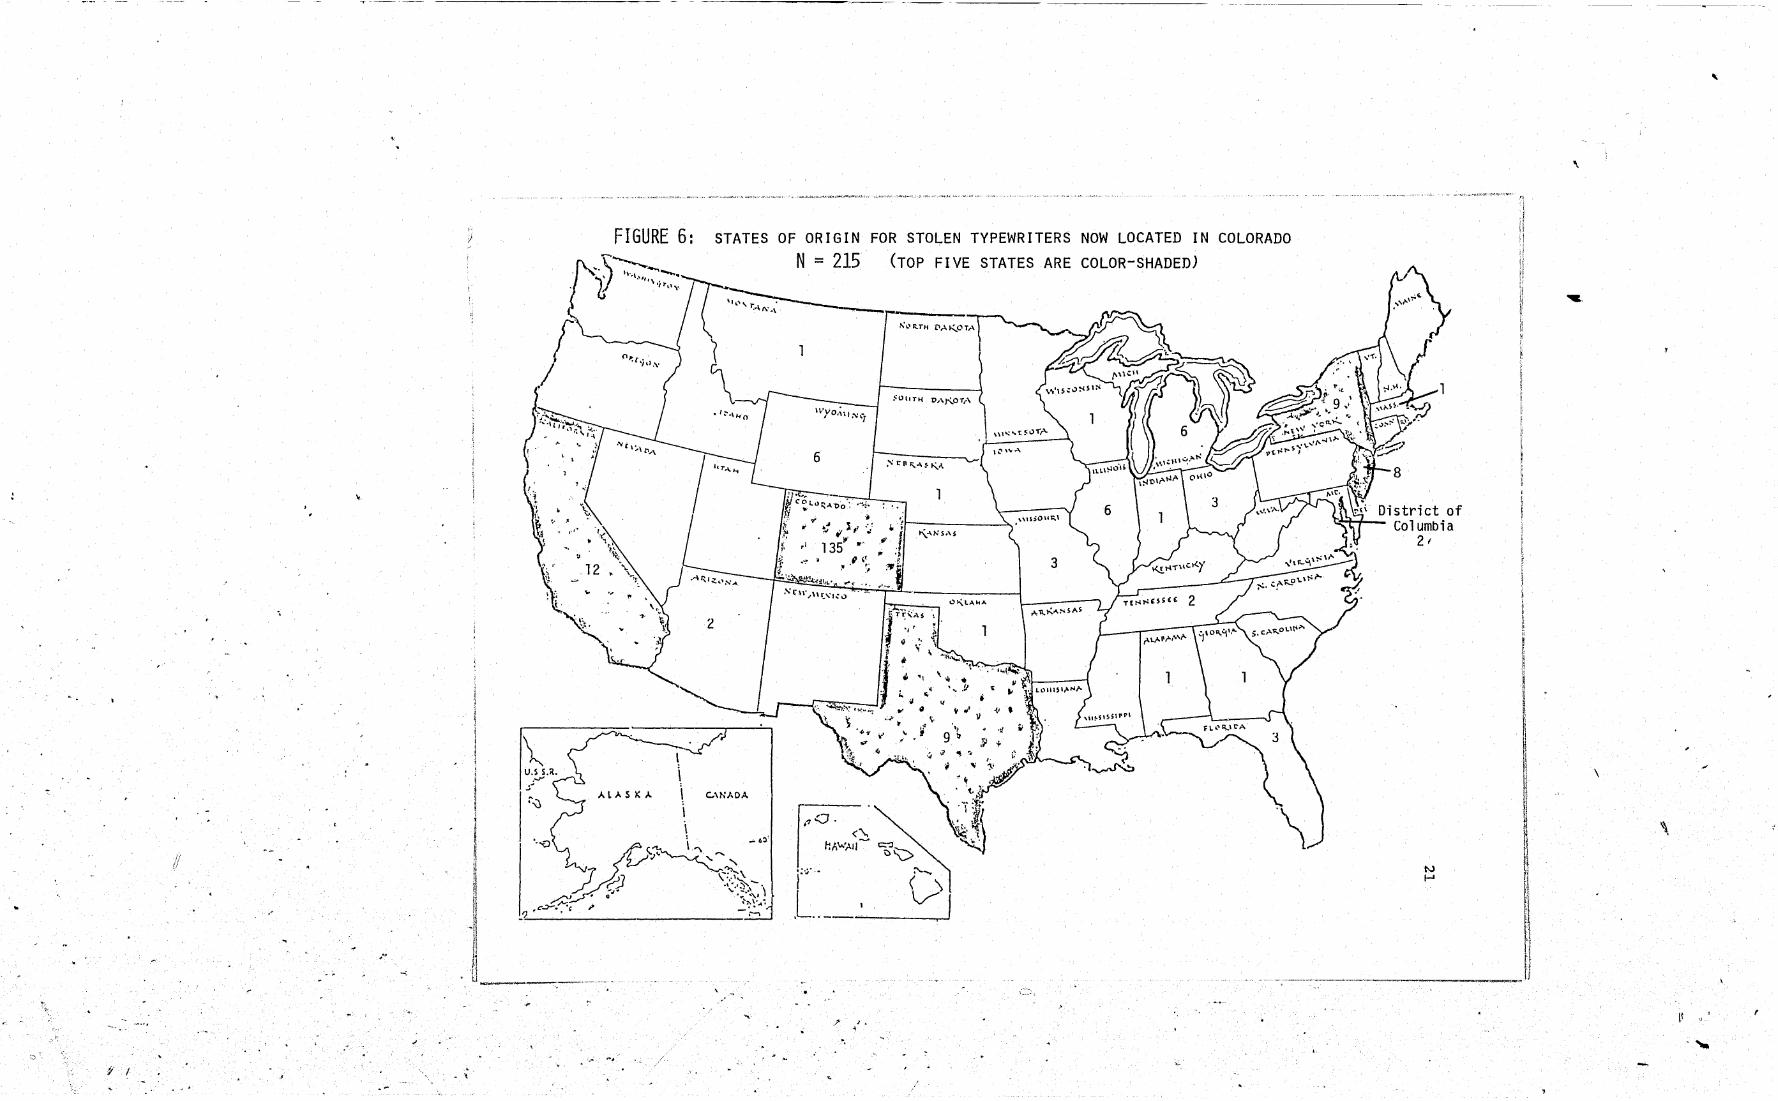
FIGURE 6: STATES OF ORIGIN FOR STOLEN TYPEWRITERS NOW LOCATED IN COLORADO . . . . . . . . . . 21
FIGURE 7: STATES OF ORIGIN FOR STOLEN TYPEWRITERS NOW LOCATED IN ARIZONA. . . . . . . • . . .
-,,--r7
FIGURE 8: STATES OF ORIGIN FOR STOLEN TYPEWRITERS NOW LOCATED IN NEW YORK • . . . • • . . . •
FIGURE 9: STATES OF ORIGIN FOR STOLEN TYPEWRITERS NOW LOCATED IN ILLINOIS . . . . . . • . . .
FIGURE 10: STATES OF ORIGIN FOR STOLEN TYPEWRITERS NOW LOCATED IN THE DISTRICT OF COLUMBIA . .
FIGURE 11: STATES OF ORIGIN FOR STOLEN TYPEWRITERS NOW LOCATED IN FLORIDA. . . • . . . . . • .
FIGURE 12: S'rATES OF ORIGIN FOR STOLEN TYPEWRITERS NOW LOCATED IN LOUISIANA. . . . . . . • . .
FIGURE 13: STATES OF ORIGIN FOR STOLEN TYPEWRITERS NOW LOCATED IN MICHIGAN . • . . • . . . . .
FIGURE 14: STATES OF ORIGIN FOR STOLEN TYPEWRITERS NOW LOCATED IN TENNESSEE. . . . . . • . . .
FIGURE 15~ STATES OF ORIGIN FOR STOLEN TYPEWRITERS NOW LOCATED IN VIRGINI,A .. . . . • . . . . .
FIGURE 16: STATES OF ORIGIN FOR STOLEN TYPEWRITERS NOW LOCATED IN WASHINGTON . . . • • . • . .
iv
. .. 't'
22
27
28
29
30
31
32
33
34
35
------~--
FIGURE 17: STATES OF ORIGIN FOR STOLEN TYPEWRITERS NOW LOCATED IN NEW JERSEY . . . . . . . . . . .
FIGURE 18: STATES OF ORIGIN FOR STOLEN LOCATED IN OHIO TYPEWRITERS NOW . . . . . . . . . . . . . "".
FIGURE 19: STATES OF ORIGIN FOR STOLEN TYPEWRITERS NOW LOCATED IN PENNSYLVANIA • . . . . . . .
FIGURE 20: STA'l'ES RETAINING STOLEN TYPEWRITERS IN-STATE VERSUS STATES EXPORTING STOLEN TY.PEWRITERS.
FIGURE 21: IDENTIFIED LOCATIONS 01':' TYPEWRITERS ALLY STOLEN IN ARIZONA ORIGIN-
, . . . . . . . . . . . . FIGURE 22: IDENTIFIED LOCATIONS OF TYPEWRITERS
ALLY STOLEN IN CALIFORNIA ORIGIN-· . . . . . . . . FIGURE 23: IDENTIFIED LOCATIONS OF TYPEWRITERS
ALLY STOLEN IN COLORADO ORIGIN-• • • • • • • I· • •
FIGURE 24: IDENTIFIED LOCATIONS OF TYPEWRITERS ALLY STOLEN IN LOUISIANA ORIGIN-· . . . . . . . . .
FIGURE 25: I~ENTIFIED LOCATIONS OF TYPEWRITERS ALLY STOLEN IN.TEXAS. . ORIGIN-· . . . . . . . . .
FIGURE 26: IDENTIFIED LOCATIONS OF TYPEWRITERS ALLY STOLEN ,IN WASHINGTON ORIGIN-· . . . . . . . .
,FIGURE 27: IDENTIFIED LOCATIONS OF TYPEWRITERS ORIGINALLY STOLEN IN CONNECTICUT. . . • . . . . .
FIGURE 28: IDENTIFIED LOCATIONS OF TYPEWRITERS ALLY STOLEN IN FLORIDA. . . • . • . ~R:G:N~
FIGURE 29: IDENTIFIED LOCATIONS OF TYPEWRITERS ORIGINALLY STOLEN IN GEORGIA. . . . . 0 • . . . .
FIGURE 30: IDENTIFIED LOCATIONS OF TYPEWRITERS ALLY STOLEN IN ILLINOIS ~RIGIN-• • • • ,>. • • • • •
FIGURE 31: IDENTIFI~D LOCATIONS OF TYPEWRITERS ALLY STOLEN IN MARYLAND ORIGIN-· . . . . . . . . .
FIGURE 32: IDENTIFIED LOCATION'S OF TYPEWRITERS ORIGIN-ALLY STOLEN IN MICHIGAN · . .. . . . . . . .
FIGURE 33: IDENTIFIED LOCATIONS OF TYPEWRITERS ORIGIN ALLY STOLEN IN'MISSOURI -· . . . . . .. . . .
FIGURE 34: IDENTIFIED LOCATTONS OF TYPEWRITERS ORIGINALLY STOLEN IN NEW JERSEY · . . . . . . . .
FIGURE 35: IDENTIFIED LOCATIONS OF TYPEWRITERS ALLY STOLEN IN NEW YORK ORIGIN-· . . . . . . .. . .
v
36'
37
38
42
44
45
46
47
48
49
54
55
56
57
58
59
60
61
62
j I , ;
,

\.
\ \ 1 l \ I
.,J '1
\
OF TYPEWRITERS ORIGIN-
FIGURE 36: IDENTIFIED LOCATIONS • . . . • . • • .
'ALLY STOLEN IN OHIO. . • • OF TYPEWRITERS,ORIGIN
FIGURE 37: IDENTIFIELDENL~~A~i~~~YLVANIA ....•... ALLY STO '
OF TYPEWRITERS ORIGIN-IDENTIFIED LOCATIONS • . . •
FIGURE 38: ALLY STOLEN IN TENNESSEE .....•
OF TYPEWRITERS ORIGIN-
FIGURE 39: IDENTIFIED LOCATIONS A ..••..••
ALLY STOLEN ~N VIRGINI . • . OF TYPEWRITERS ORIGIN
FIGURE 40: IDENTIFIED LOCATDi~~iICT OF COLUMBIA •..• • ALLY STOLEN IN
vi
63
64
65
66
67
" "
" '
, ,
, '
INTRODUCTION
Each year as property crimes continue to dominate the
national crime picture--accounting for 90-95 percent of
all reported crimes--it has become apparent that more
effective enforcement techniques must be developed if
this major crime problem is to be controlled. Since 1972
careful analyses of the theft problem~/ have demonstrated
that traditional enforcement approaches focusing exclu-
sively on the thief are at best short sighted and ineffec-
tual, since they fail to take account of the market for
stolen property to which the thief relates~ As a result
of these analyses, innovative strategies have been
developed giving enforcement priority to the criminal
receiver of stolen goods (the fence). These anti-fencing
strategies have shown great promise in combatting property
crimes because they address the profit motive of the stolen
property marketplace. Indeed, ?irguments have been made that
recent decreases in theft ra~es~ are attributable to anti-
fencing enforcement activities undertaken nationwide.
Despite great strides in innovative property theft
enforcement since the early 1970's, knowledgeable observers
must conclude that the goal of taking the profit out of
property crimes is far from being realized. A firm
~/See, for example, Walsh, Marilyn E. The Fence - A New Look at the World of Property Theft (Westport, Conn.: Greenwood, 1977); and Blakey, G. Rooert and Michael Goldsmith. "Criminal Redistribution of Stolen Property: The Need for Law Reform," Michigan Law Review, August 1976, Vol. 74, No.8, pp. 1511-1626.
**1 -- For the year 1977, for example, burglary decreased 1.2 percent from 1976 and larceny-theft decreased 5.8 percent; see Crime in the United States, Uniform Crime Reports, U.S. Department of Justice Federal Bureau of Investigation (Washington, D. C.: U.S. Government Printing Office, 1978).

2
commitment to qnti-fencing enforcement, though showing
great promise, is still the exception rather than tpe
rule in most jurisdictions. Instead the traditional and
self-defeating approaches to property theft centered on
the thief continue to be pursued, allowing not only
thieves, but also fences and final consumers of stolen
propert~ to benefit at the expense of theft victims.
While there have been individual situations in which
the stolen property marketplace has been interrupted or
totally disrupted in some jurisdictions, in most parts
of the country trafficking in purchasing and possessing
stolen property remain low-risk activities undertaken
with impunity. The stolen property marketplace more
often flourishes as a successful profit-making enterprise
than it is successfully combatted.
The confidential report which follows is based upon
information generated through the use of a novel investi
gative technique employed on a pilot basis by the Cali
fornia Department of Justice. The technique permits
stolen property transactions to be" traced and their
criminal content to be audited. The substance of the
technique is to make computer comparisons between automated
stolen property files of law enforcement agencies and auto-
mated records of repair transactions of (in this case) the
IBM Corporation. Whenever. a match-up occurs, it then pe-
comes possible to identify the current possessQr of the
repai~ed item. Once this identification is made and the
, ,
I , 'j
J 1
3
location of the stolen;t d t ' , - em e erm~ned, an investigation
can be conducted which peels back the layers of" trans-
actions that oCcurred between the time of the original
theft and the time the stolen item came into the custody
of the current possessor. In the course of this investi
gation, it is possible not only to trace the movement
of the stolen item, but also to identify all culpable
parties who have benefitted from the sale or use of the
stolen property to the detriment of the rightful owner,
including the thief who originally stole it, the fence(s)
who handled its redistribution, and the final consumer
who bought the item knowing it to be stolen.
This technique, though simply stated, is truly remark
able both for its uniqueness and for the quality of the
investigative information it generates. What makes the
technique unique is that it provides the rare opportunity
for law enforcement authorities to intervene and initiate
an investigation at a point when a crime has already been
successfully completed, i.e., where all culpable parties
have succeeded in escaping traditional enforcement detec
tion mechanisms. Thus, crimes that would have remained
unsolved and offenders who would have escaped unscathed
become fruitful investigative targets. Also remarkable
is the quality of th' t' , , e ~nves ~gat~ve ~nformation developed
by the technique. Each investigative lead, when followed
up by a quality investigati~,~ permits a full audit of *! - It m~st be stressed that the full potential of the technique can
~ot be,real~zed unless the leads generated by it are competently field
b~nvefs~~gated. Where slipshod or poor investigation occurs much of the ene ~t of the technique is lost. '
-, , :1 .it
" " it /. Ii
11 I' n h
h II 11
11 I; , L I: ,I ~ ~ Ii
~
I !I t!
~ ~ ti t:
i II i [l[ >
·1
I). i' , I
f , J
\
q Ii iJ II ., ·i .J !
:: 11 I
,

· __ . _._'_"'O~~·_'~_~' \. " .. I.
- - - -------~ --- - ----- ----------
4
the persons, places, and events involved in the theft
and redistribution of stolen property and of the crime(s)
committed in the process. At minimum, then, the techni-
que provides for the recovery of stolen property. At its
best, however, it makes possible the identification of
culpable parties to transactions involving a single
stolen item, but also the documentation of the overall
distribution paths and patterns, and the major traffickers
responsible, for the redistribution of stolen goods gener-
ally.
The project reported on here could not have
taken place without the excellent record-keeping systems
and cooperation and support of the IBM Corporation. Be-
cause of this support, the project and the analyses in
this report focus on application of the matching technique
to one class of stolen goods, i.e., stolen IBM typewriters.
The report is divided into two parts. Part I provides an
overview of national distribution paths for stolen type-
write!:'s as revealed by comparisons made between the National
Crime Information Center (NCIC) stolen office equipment
files and nationwide repair records of the IBM Corporation.
While some caution must be taken in interpreting this
information because it has not as yet been field verified,':;
it provides rare insights into the national trafficking
patterns for a major "class of stolen property, office equip
ment.**/
~/An application currently being prepared by the California Department of Justice proposes extension of field.investigations and recoveries on a nationwide basis.
**/The significance of thefts of this type of goods was highlighted in recent newspaper accounts. See Klein, Frederick C. "Urban Office Buildings Becore Prime Locales for Thefts and Assaults, I; Hall Street Journal, December 5, 1978, p. 1 and p. 14.
.-
tl
5
P'~'l..ft II of the report focuses on the experience of "6
1 ...... ,
the State of 9alifornia which has used this technique on
a pilot basis, attempting to structure and document follow
up investigations based upon the leads generated. In this
portion of the report, information developed through
field investigations in which indiv.idual property theft
cases' were audited provides a more detailed picture of
the stolen office equipment marketplace existing in Cali
fornia. As both parts of the report amply demonstrate,
the technique used here offers great potential to the law
enforcement community, as yet another valuable component
of an effective property theft enforcement program. This
report, then, should be considered both as a tool for
planning enforcement action, and as a basis for designing
a batt,ery of similar tools to deal with the challenge
of property crimes.
PART I: DISTRIBUTION PATTERNS FOR STOLEN OFFICE MACHINES -THE NATIONAL SCENE
In order to gain a national perspective on the distri
bution patterns of stolen office equipment, repair records
of the IBM Corporation were compared (using the technique
described above) with the automated file of stolen office
machines maintained by the National Crime Information Center
(NCIC). The information in this latter file is supplied to
NCIC by law enforcement agencies around the country and it
contains some 50,000 items. The IBM records used for compari
son totaled about 1.2 million records. Using these records,
nearly 7,000 matches on stolen typewriters were generated.
Figure 1 d,epicts the number of typewriters originally stolen
from each jurisdiction (including the 50 states, the District
,
, i Ii

:
\ u.s S.il •
• oJ'
I·~· '.'0
.' .
, . • 't'
FIGURE 1: NUMBER OF TYPEWRITERS ,STOLEN FROM EACH STATEJ
N = 6944 ~.~~...., (IDENTIFICATIONS MADE BY COMPARING NCIC STOL[:N OFFICE EQUIPMENT Y \"""//\.i:::n: FILE WITH REPAIR RECORDS OF IBN CORPORATION)
115 ~~------~-r __ ·'·I.'s:.,TH L'AJZOTA
10 2
186
Sr\\'~\\r:"I~l)
27
ALASKA
15 r~~~w>~), V"'" 6
.. L .. --_-.-J
..
25
17
70
11
Puerto Ri,co 2
-.. ,-.>'--District of Columbia
138
. Il j1
"
\
\
"

! ..
t
"
" ,
I
'" .. i f • I
f! I
"
[~ .J
.~ U .,
7
of Columbia, and Puerto Rico) that were identified usinsr .
the matching technique. Thus, of the 7,000 stolen machines
identified, 2,039 were from thefts occurring in California;
1,212, from thefts occurring in Texas; 662, from thefts
occurring in New York; and so forth.
Several cautionary notes are appropriate here.
First, while th~ volume of stolen machines identifed is
quite large, it should be viewed as representing only
a small propertion of those that would be possible with
a file more complete than the one available from NCIC.
The NCIC file with its 40,000 entries reflects at best
only a small subset of the office machines stolen nation-
wide. The reason the NCIC file is incomplete is that
rates of participation in entering items to the file
varies greatly among the states and among law enforcement
agencies wi thin states. At the same time, many stat'es
have their own automated, stolen property files that are
used in lieu of entering items to the NCIC system. The
State of California, for example, has its own Automated
Property System in which some 18,000 stolen typewriters
are entered--far more than were found in the NCIC file
for California. In addition, practices with respect to
the use of the NCIC system vary from jurisdiction to
jurisdiction. Some agencies, for example, only enter
items in NCIC when the loss in a theft exceeds a given
dollar value; others only use NCIC in cases where the
jurisdiction would be prepared to extradite for the crime.
,
:1 "
,

8
~hus, the 7,000 identifications made here grossly under-
Id be possible with a more represents the number that wou
. */ complete stolen property f~le.-
Given the incompleteness of the NCIC fi'le, care
should be taken in interpreting the statistics found in
Figure 1, and in particular in comparing the number of
identifications of stolen items made for the various
states. This is because the number of stolen machines
h state represents not only an index identified for eac
of the magnitude of the stolen typewriter problem in a
jurisdiction, but also an indication of participation
in the NCIC system. Thus, the states of California and
Texas for which a far· greater number of stolen items
were identified than for any other states, both have a
se:t;'ious stolen office equipment problem. It would be
1 d however, that the magnitude inappropriate to conc u e,
of that problem is as much greater in California and
Texas as the number of identifications seems to indicate.
Rather, the number of identifications made can be linked
to a high rate of participation in NCIC by law enforce-
ment agencies in those two states. At the other end of
the spectrum, it would be erroneous to conclude that
2/This is the major reason for advising project monit~rs that, should they wish to pursue use of the technique at the nat~onal 1 1 foc us should be directed at obtaining access to automated eve , .. 1 property files maintained by ind1v1dua states.
I ,
. f I ~
9
such populous states as Connecticut, Maryland, and Massa-
chusetts, where relatively few identifications were made,
do not have a stolen office equipment problem, when the
number of identifications made undoubtedly has a great
deal to do with the participation of these states in
NCIC. In reviewing Figure 1, then, it should be noted
that the picture it portrays, while generally accurate
in that the states having the largest number of identi-
fications are also likely t.o be those with the greatest
number of office equipment thefts, may not accurately
reflect the comparative magnitude. of the problem among
various states.
Two additional problems of interpretation relating
both to Figure 1 and to the information to be presented
subsequently should be noted. First, none of the nation-
wide matches discussed here have as yet been field veri-
fied and investigated. The verification feature used
in the matching technique is a critically important one
since different models of IBM machines in the lower
range of serialization have duplicate serial numbers.
Thus, if errors in identifying the model of a machine
occurred either in IBM records or in the NCIC file, then
the resulting matches would not be accurate. Until field
verification, however, it is difficult to establish what
portion of the matches recorded here are accurate ones.
~
f:
~ i' ~ Ii Ii II
11 ~
f;
I
I I)
1 .1 p
III
II II t , .

10
A second similar source of error may occur when a
customer fails to notify IBM that his/her machine has been
stolen. In this case, the stolen item appears on the NCIC
tape while the theft victim's original repair record re-
mains on t e IB ape. h M t Thus, What was an apparent match
would actually identify the theft victim as the current
possessor of t e s 0 en ~ m. • h t 1 'te Aga4n, since verification
ld not be undertaken on the national matches, procedures cou
it is impossible to estimate how many such matches may
have occurred. It is possible, however, to describe the
impa0c of such matches on the national figures discussea
below. The effect of such matches would be to reduce
the number of stolen machines recorded as staying within
a state and hence would increase the proportion identified
as moving interstate. Thu!"" it is quite possible that the
interstate component of the national distribution patterns
for stolen office equipment is actually more significant
than the figures discussed below may iLdicate.
Despite these no e • t d caut40ns and problems, the infor-
mation presented here is believed to reflect a generally
accurate overview of the structure of nationwide trafficking
patterns for stolen office equipment. It should be remembered
that i:his is the first opportunity ever available to observe
the movements of stolen goods on a nationwide basis,
not tied to.a specific set of investigations or prose
cutions. As such, the information provided here is
both unique and extraordinarily valuab~e in suggest-
ing appropriate law enforcement responses to organized
----------------------------------------------
/ '. "
I
11
stolen property transactions, even though the precise
magnitudes of the problem as described below may be
modified if and when field verifications and investiga-
tions are undertaken.
A. Current Locitions of Identified Stolen Tvpewriters
Figure 1 (presented earlier) depicted the origin
ating jurisdictions, i.e., original place of theft, for
the nearly 7,000 stolen typewriters located using
the NCIC-IBM matching procedure. Figure 2 (below)
indicates the identified, current locations of these
7,000 typewriters. As can be seen in Figure 2F
the jurisdictions for which the largest number of stolen
typewriters were identified tended also to be those in
which the greatest number of stolen typewriters were
located. The State of California, for example, which
had more of its stolen typewriters identified (2,039)
than any other jurisdiction, also led all jurisdictions
in having the greatest number of stolen typewriters
(2,015) found within its borders. Texas, which had
1,212 of its stolen typewriters identified, was found
to have 1,199 stolen machines within its boundaries.
At the other end of the spectrum, there were some
states which had relatively few of their own stolen
typewriters identified, but which nevertheless were
found to be "home" to a significant number of stolen
machines. The State of Louisiana, for example, might
,\

---~--- -~--
~-----~
FIGURE 2:
203 42 26
1,199
.-
~AlASKA CANADA
r-.~~,~;~ (;". 24
.L ..
1 I . -'
24
/
75
Puerto Rico 21
"
\
184 ~+----53
\

----- -------
i'
13
be placed in this category; whereas only 68 of Louisiana's
stolen typewriters were identified using the matching
technique, 184 stolen machines were identified as being
within her borders. A similar pattern occurs in the
state of Virginia where 98 stolen machines were located,
but which had only 53 of its own machines identified.
North Carolina and Massachusetts which both had only 37
of their own stolen machines located, were shown to be
"horne" respectively to 74 and 63 stolen typewriters.
The number of stolen typewriters I09ated in each
state is generally comprised of two components: (1) ma-
chines stolen in the state and remaining there (repre-
senting a domestic or intrastate marketplace); and
(2) machines stolen in other states and migrating there
(representing an import or interstate marketplace) .
Depending upon which of these components is focused on,
one can observe different patterns of significance for
the nationwide distribution of sto.len office equipment
among the varjous states. Thus, some states which repre-
: sent an important market for stolen office equipment,
as evidenced by the number of stolen typewriters located
"
Ii
I I ~
/' ' I
there, exhibit a marketplace dominated by a domestic
traffic in such goods. Other states portray a marketplace
dominated by an import traffic in stolen typewriters.
These contrasting marketplace patterns are depicted
in Table I (below) where all jurisdictions in which 75
...... " J' ,!. 0
":.
-_ .. 0
_-.-' Ok .' ,. ,.,.~
,. f f '.

14
TABLE 1
JURISDICTIONS WHERE 75 OR MORE STOLEN TYPEWRITERS WERE LOCATED, BROKEN DOWN BY THE DOMESTIC AND IMPORT COMPONENTS OF THE MARKETPLACE
N = 16
Domestic Type- Import Type-writers in writers in
Total # of Jurisdiction Jurisdiction Typewriters Located in % of % of
Jurisdiction Jur-isdiction Number Total Number Total Ar~zona 203 160 79% 43 21% Californ~a 2,015 1,518 75% 497 25% Colorado 215 135 63% 80 37% D~str~ct of
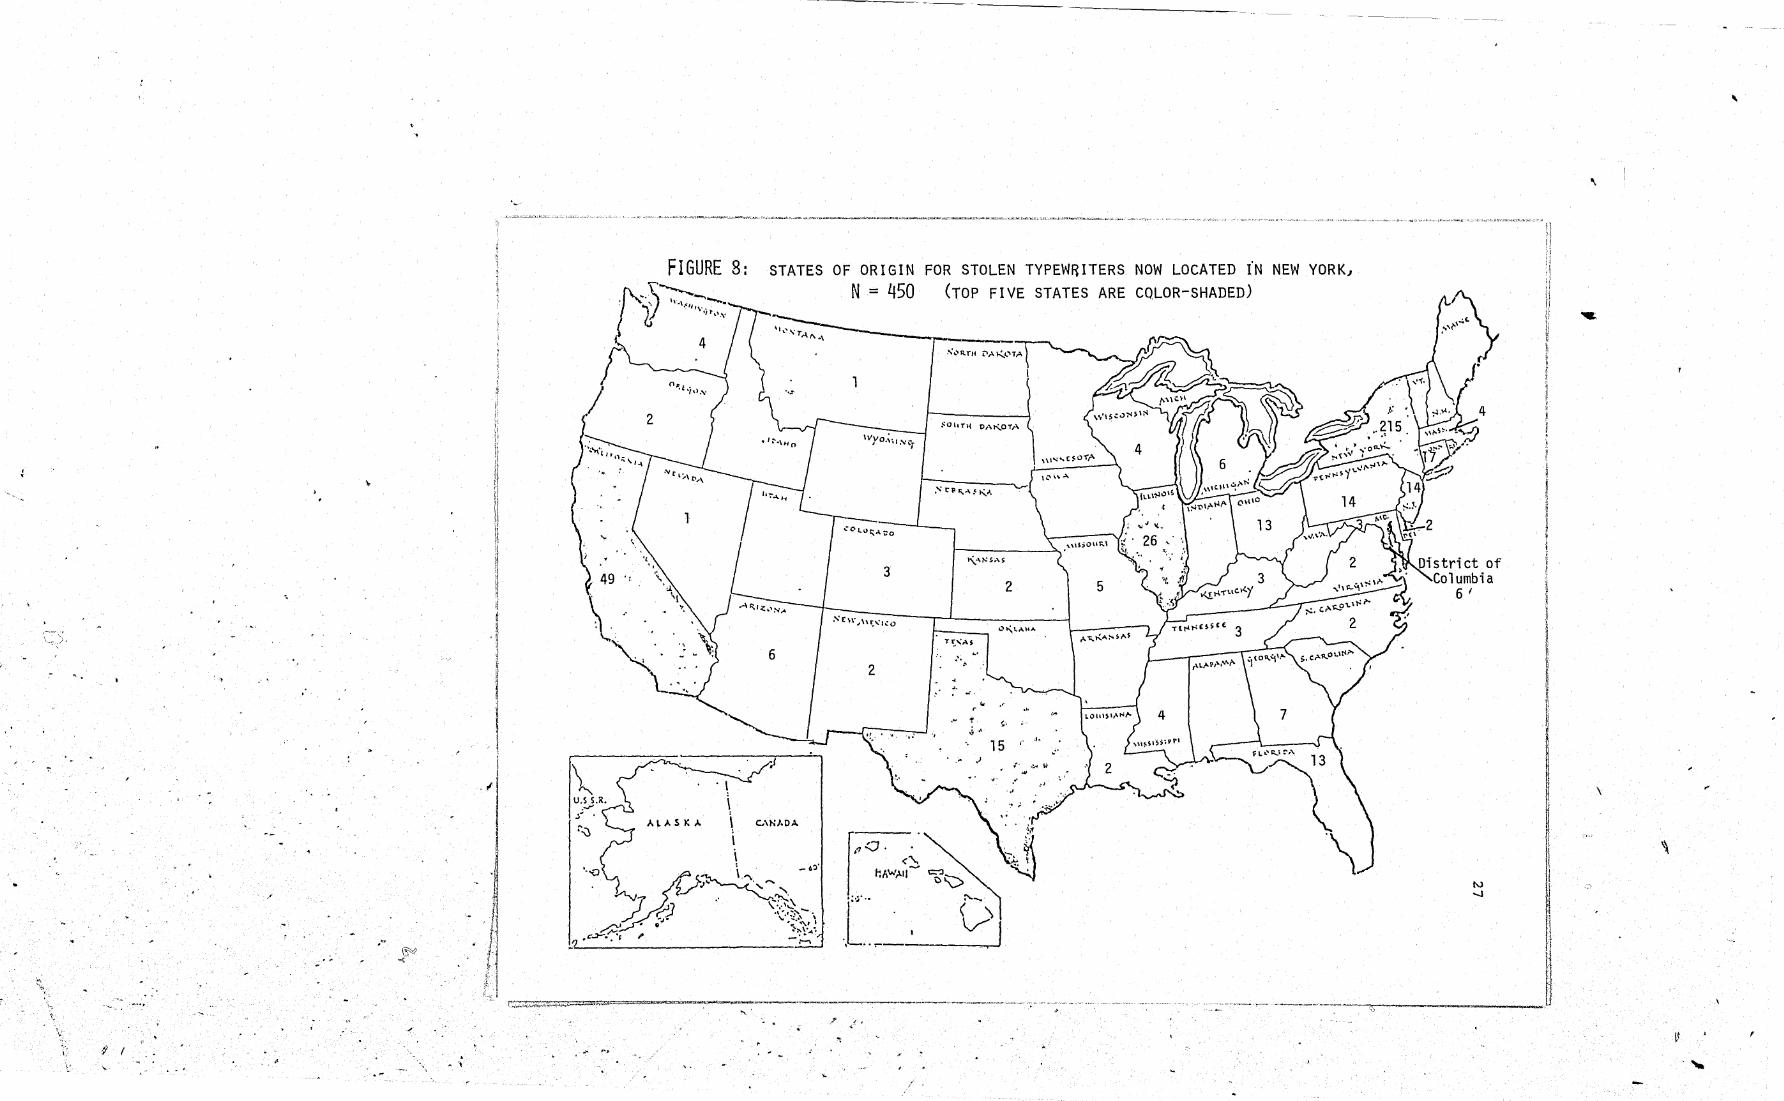
Columbia 78 32 41% 46 59% Flor~da 182 75 41% 107 59% Illinois 271 113 42% 158 58% Lou~s~ana 184 54 29% 130 71% M~chigan 134 41 31% 93 69% New Jersey 184 80 43% 104 57% New York 450 215 48% 235 52% Ohio 195 47 24% 148 76% Pennsylvan~a 156 49 31% 107 69% Tennessee 75 26 35% 49 65% Texas 1,199 924 77% 275 23% V~rg~n~a 98 19 19% 79 81% WaEjh~ngton 160 75 47% 85 53%
. -
, i
I I I I
I
i i r i I "
1 .. ;
I,
II i ~
I "
l.
15
or more stolen typewriters were located are listed.
For each jurisdiction listed, the total number of
stolen machines located there is given, followed by
the number and proportion of those representing the
domestic marketplace and the number and proportion of
those representing the import marketplace for that
jurisdiction.
Two separate patterns emerge in Table 1 that
appear to be based at least in part on geography.
Thus all of the jurisdictions displayed in the table
located in the western United States are dominated by a
domestic market for stolen office equipment.~ The
largest number of stolen typewriters identified, for
example, were located in California and Texas, :!)ut three
fourths of these had been originally stolen in those
jurisdictions. Similarly in Arizona where 203 stolen
machines were located, 79 pera':nt had been stolen and
remained in that state.
A somewhat different marketplace pattern emerges
as one moves eastward across the country, however. Thus,.
of the 450 stolen machines locat~d in New York, more than
half had been stolen elsewhere and imported into the
state. Similarly 58 percent of the typewriters found in
Illinois and 76 percent of those located in Ohio had been
stolen in other states. Because there is some reason to
speculate that £actors other than mere geographic location
~/ThiS is with the exception of the state of Washington where the domestic and import components are roughly equivalent.
,
,

I
I , I i I
16
may affect the marketplace patterns found in various
jurisdictions, each group of states is discussed in
more detail below. The divergent marketplace'patterns
among states described in Table 1 are disp1ay~d pic-
toria11y in Figure 3.
1. Jurisdictions dominated by a domestic market for
stolen office machines. Apart from their geographic
placement within the united States, the jurisdictions
in Table 1 with a stolen office equipment marketplace
dominated by a domestic component (CaliforTlia, Texas,
Colorado, and Arizona) share another characteristic in
common. They are all sta,tes characterized by rapid
growth, spurred by commercial and industrial expansion.
The industrial boom and accompanying growth in California
has been of longer duration than that presently occurring
in Texas, Colorado, and Arizona, but all four states
represent areas of the country experiencing rapid ex-
pansion. This shared characteristic is of more than
passing significance since the marketplace discussed
here involves a commodity, office equipment, closely
linked to commercial and industrial development. Thus
one would expect to find a large and.growing demand for
of£ice equipment to exist in these states--a demand that
can be met by illegitimate as well as legitimate suppliers.
Because of the rapid and concentrated growth in the states,
it i.snot surprising to find that many typewriters stolen
t~'f~::--~?r-~~.--------~----,-.-#--------·--~~--~----"-~~'--~--, .'f.~.' . ,. ~- .-
,
., .
/
Z LU ..J 0 I-(I)
LU 0:: 0:: 0 0 lL. :E w 0:: U 0
:5 I.J'1 0... I-
r-...... LU LU ::.::: 0:: a::: LU 0::( :c :E ~
I- (I) 0:: Z 0 0 a. ...... :E I-- u -z 0 0::( (I) -(I) 0:: => => (I) "") 0:: UJ ..J > ..J
<C u ........ ........ ...... ~ l- I- LU (I) Z I-UJ LU <C :E :E u 0 a. 0 ~ ...... ..J
=> <C C3 LU
LU 0:: >- LU t:Q LU 3:
u ~ ...... (I) LU lL. 0:: l- lL. LU <C 0 I-Z >--< ..... Z 0:: :E LU ~ 0 ..J LU ~ 0 a.
I- >-(I) (I) I-LU I-<C I-(I)
N'"\
LW 0:::: :::::> <..!J ...... LL
0(
~ r,
;S ~ !}
t1 ,~ <
'" p
I- :r " '"
.. <:
4-o
.f.J·~D u.o . 'r- E s... ::J . .f.J r-- ' tnO
'r-,0
~
< ~
z ~ «
'i Z
" LW 0(. <..!J LW -.J
17
LU Z u <C
>-5 >-t:Q0... r:QLU
I- U ow BJ:5 LU::'::: 1-0:: 1-0... <CO::( <CI-z~ ZLU - ...... ::.:::
:EU :EO:: 0_ 0<C 01- O:E (I) (l)UJ (1)1-W:E wo:: 1-0 1-0 ~~ <co...
I-:E (I)<C (I) ......
~ 0
I

-j
\
- !
'" ! i
18
there never leave the jurisdiction, but remain there to
satisfy a lively local demand for such items. For
the illicit trafficker in office equipment, there is no
point in arranging for interstate transport of such
items when a viable market for them is "right around
the corner." The marketplace pattern observed for these
states, then, with its large domestic component, is quite
consistent with the larger economic portrait one might
paint of these jurisdictions. It is also not surprising
to find that a listing of states in which more than 60
percent (60%) of the office equipment stolen from the state
remained there for resale is dominated by jurisdictions
in the \'lestern part of the United States. This listing
is provided in 'Table 2.
While the stolen office equipment marketplace in
California, Texas, Colorado, and Arizona is dominated
by the domestic component, the import side of the market
for stolen typewriters is also of interest. Figures 4
through 7 depict the original jurisdictions from which
stolen typewriters made their way to each of these four
states. What is clear from these figures is that Cali-
fornia and Texas not only have large internal markets
for stolen typewriters but also represent major supply
sources of such items to meet the demand in other states.:;
Also in Figures 4-7 Illinois and New York, known to be
major importing states, are shown to be prominent as
well in supplying stolen times to other states.
!:../Thus California was a major out-of-state supplier of stolen typewriters in Texas, Colorado, and Arizona; and Texas, a major supplier to the ~ther three states •
. . '
----
q 11
! J I j
j :j 'l 1 I 1 i j ~ 1
1
j 'A I 1 I J
• !
'\ t
, .
c:( .... :z a: 0 u.. .... -' c:( U ...-.
t:l :z UJ .... t:l c:(
t:l ::I: UJ en ..... I c:( a: u 0 0 -' -' 0
:3: U
0 UJ :z c:::
c:( CI)
a: en UJ UJ ..... ..... .... c:( a: ..... :3: en UJ CL. UJ >- > ..... ....
u. :z UJ CL. -' 0 0 ..... ..... ......., en a:: 0 Lr\ u. ri
a :z '\ .... N (,!) .... " a: 0 2:
U. 0
en UJ ..... ~ CI)
.::::r-ll.J a:::: => (..!:) -u..
LO
;S is :} ~ -( r~ < Q
~ :r
" I-.... :.
4-o ttl
-< 'L ., of ~
'< ... I,
.~
" -{
,....
19
C\J
, 9 .'

. ,
t I
]1
t i
FIGURE 5: ~.~
;\ ",.",,/;----. j \';""\' 3
.b j I _<="'''''= ... ''''''''''''''''''_'''''"''~ _____ ~~, _____ ._~. __
. . '\
-----~ -'-- - ------ -----------
,
,
STATES OF ORIGIN FOR STOLEN TYPEWRITERS NOW LOCATED IN TEXAS N = 1J199 (TOP FIVE STATES ARE COLOR-SHADED)
2
14 -':::::;;:~d---8
5
~(\
. District of Columbia
6 2 8
3 6
~
.. FLI.'" t",.,\
\
~3 "\
N 0
r ~ ~~,>~~ 'i?'V
V'J·'·
.L .. -~~---r-J
I
" , . ",
j
1/ (l
. " f I
. -' .-
~.-- . ------ -----------
FIGURE 6: ~'----"
;). II"""'~-.
STATES OF ORIGIN FOR STOLEN TYPEWRITERS NOW LOCATED IN COLORADO N = 215 (TOP FIVE STATES ARE COLOR-SHADED)
IS 1,,.\\,.
~ /'
i ALAS~"" \ C,\N/.OA.
..
r:-.
{70. <'\,
hA""AI/~
( ...
. L ..
.? J •
"
1
• ~r-------------~ .~.f '\:,N 5-'$
.. ,~
:" f . 3 ........ ,
'"
\
1
\
'\
r

"
- ~
.-
,
"
7 j
~----- --------------
."
~ . 1· t!
!i '. J; I' }, l' Ii \ k
I; ii It g l4 II 1) h t'· H
:i Ll
ALAS K A
\
. - -\;
~
~
STATES OF ORIGIN
\.
.. '.,.. '\. <I-
FOR TYPEWRITERS NOW LOCATED IN ARIZONA J
FIVE STATES ARE COLOR-SHADED)
'1Jf./ .. _ .. ~ .... ~
t Tr'AS
,/ -." j't 1
,-
',' v
'. '" .;.
i \ 1, -, .'
~~-.I.1 ),.
. / ,-.-
\ '
.. < .. , .",
./
N = 203
l\.)
l\.)
2
I J
,
,
\
,

~, ,
,
~ .
" ,. ~
r I
.
"
, ,I-
~~~----
.
. . "
------- ~~-- - ------~-------
l I State ~ I
I ! I Alaska
l I, , IJ 1
~ Arizona
California
1
1 Colorado
. 1
I Hawaii
~
i tl 1
Louisiana
Texas
, I J Washington
" -
:' ! f
"
I
23
TABLE 2
STATES WHERE MORE THAN 60% OF THE STOLEN TYPEWRITERS REMAINED IN THE JURISDICTION
N = 8
Total # of State's # of Stolen % of Stolen Stolen Typewriters Typewriters Typewriters
Identified Remaining in State Remaining in State
15 11 73%
247 160 64%
2,039 1,518 74%
186 135 72%
6 5 83%
68 54 79%
1,212 924 76%
115 75 65%
f .. ~ \ j
I
I.

....
. - ..
24
Thus in Figure 4 where the sources supplying the
California stolen office equipment marketplace are depicted,
New York is shown to be the major supply source after the
state of California itself. In Figure 5 where Texas'
sources of supply are noted, California is the major out
of-state supplier. For Colorado and Arizona (Figures 6 and
7 respectively), California is once again the major supply·
source. Clearly states like California and Texas with
large typewriter theft problems can manage both to meet a
large domestic demand for such goods and to be important
sources of supply for such demand in other jurisdictions.
2. Jurisdictions dom~:-;-,.;\ted by an import market for
stolen office equipment. As noted in Table I above, most
of the states with a stolen office equipment marketplace
dominated by the import component are located in the
eastern half of the country. The 12 jurisdictions noted
in Table I as displaying this marketplace pattern are:
New York, Illinois, Ohio, Louisiana, New JerseY, Florida,
Pennsylvania, Michigan, Virginia, Tennessee, the District
of Columbia, and Washington (the only western U.s. repre
sentative in the group). Apart from their geographic
placement within the country, most of these states share
the characteristic of being heavily industrialized with
industry concentrated in densely populated urban and sub
urban areas. Another chara~teristic shared by at least
two thirds of these states is that they are commonly re
srarded as major centers of organized crime activity within
the nation.
--~---- ---- ----------------
~-,
/
25
Because of the extent of commercial activity in
these jurisdictions, they have, as expected, a substantial
domestic demand for office equipment. Curiously enough,
however, this demand appears less likely to be satis fied in the
illicit marketplace by office machines stolen internally
than it is by stolen items being imported from outside
the jurisdiction. The other side of this picture, of
course, is that domestically stolen office equipment ap-
pears more likely to be exported to other jurisdictions
than to be resold intrastate. For illicit traffickers of
stolen office equipment in these states the presence of a
large domestic demand for such items is clearly less signi
ficant in determining their distribution patterns than are
other factors.
In speculating about what these other factors might
be, some consideration should be given to the key element
of transportation. Obviously when an illegitimate market
place is dominated by the movement of stolen items into and
out of a jurisdiction, it must be facilitated by ready
access to reliable transportation mechanisms. In this
regard, the sborter distances between major markets in the
eastern United states can be expected to be of some benefit
to the illicit transporter of stolen office equipment.
Also of importance--and at least as worthy of speculation-
to the efficient movement of stolen goods may be the exis
tence in many of these states of well-established, illicit
relationships that while typically associated with more
---------
26
"
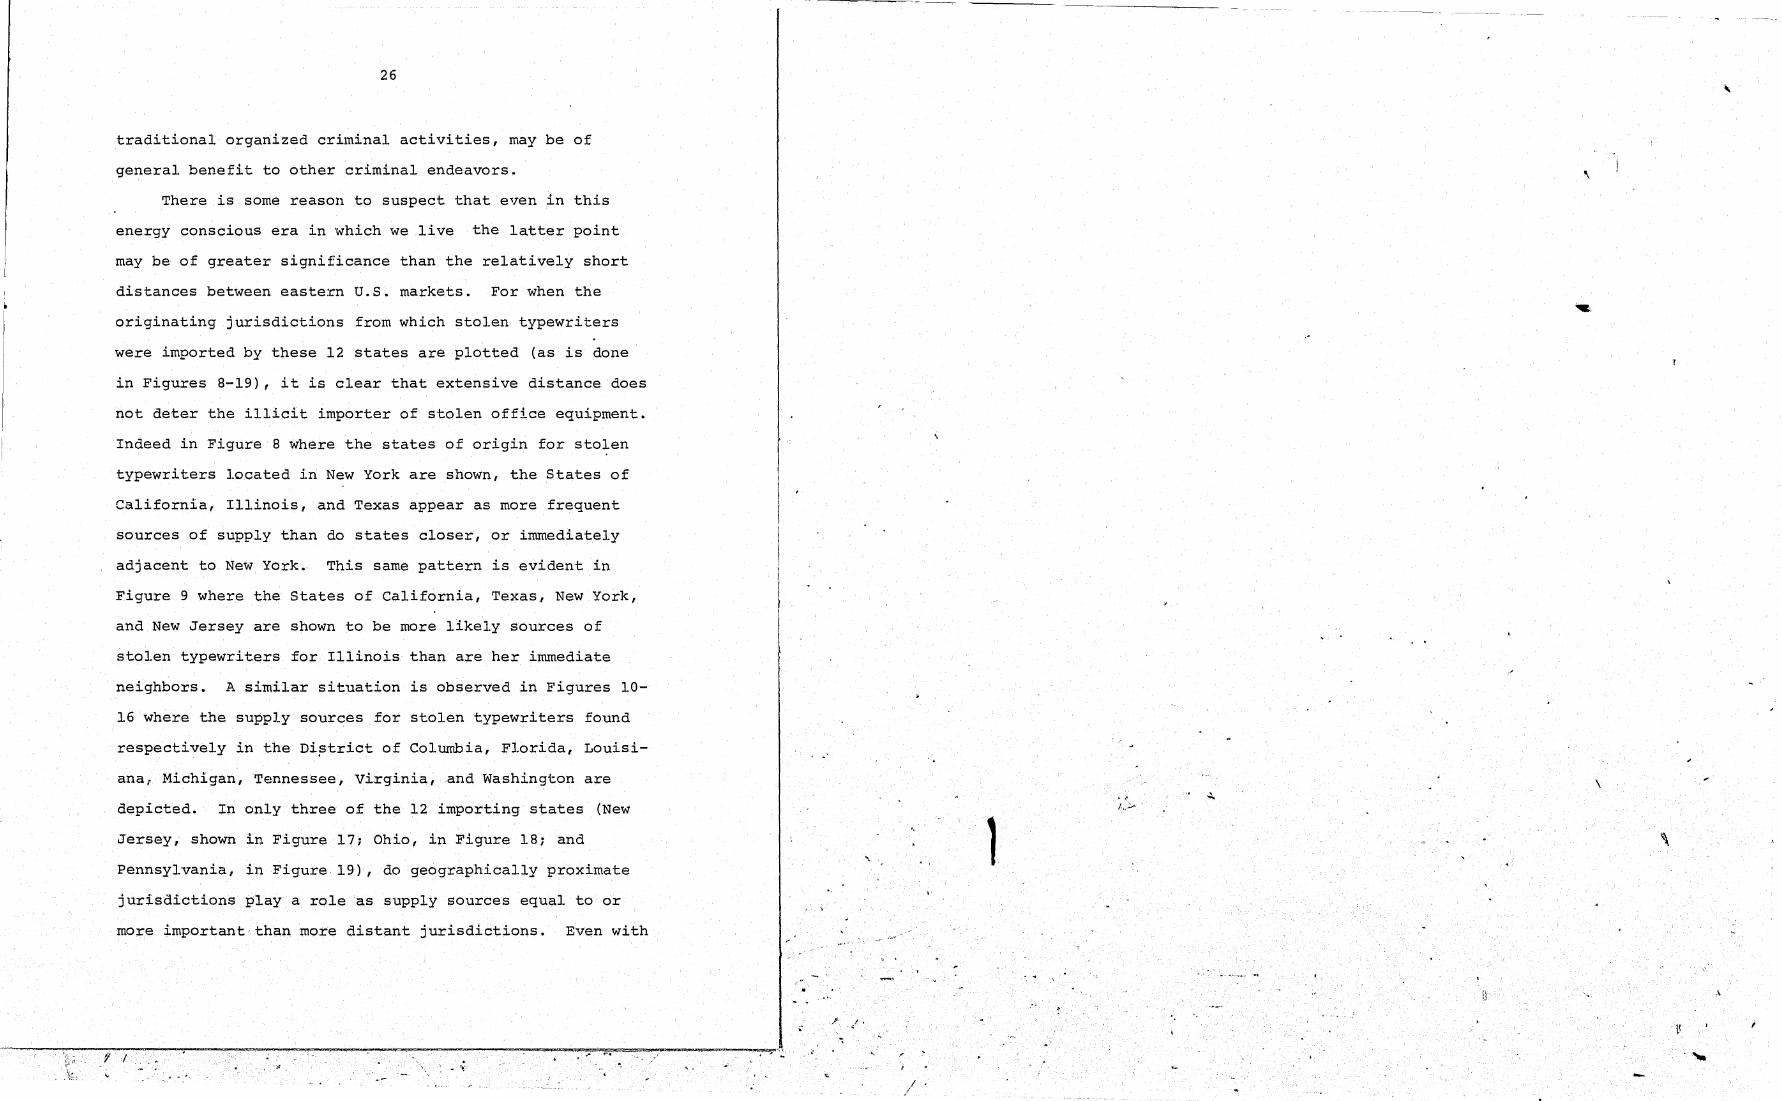
traditional organized criminal activities, may be of
general benefit to other criminal endeavors. \
There is some reason to suspect that even in this
energy conscious era in 'which we live the latter point
may be of greater significance than the relatively short
distances between eastern U.S. markets. For when the
originating jurisdictions from which stolen typewriters
were imported by these 12 states are plotted (as is done
in Figures 8-19), it is clear that extensive distance does
not deter the illicit importer of stolen office equipment.
Indeed in Figure 8 wh!:re the states of origin for stolen \
typewriters located in New York are shown, the States of
California, Illinois, and Texas appear as more frequent
sources of supply than do states closer, or immediately
adjacent to New York. This same pattern is evident in
Figure 9 where the States of California, Texas, New York,
and New Jersey are shown to be more likely sources of
stolen typewriters for Illinois than are her immediate
neighbors. A similar situation is observed in Figures 10-
16 where the supply sources for stolen typewriters found
respectively in the Diptrict of Columbia, Florida, Louisi-
ana p Michigan, Temnessee, Virginia,and Washington are \
depicted. In only three of the 12 importing states (New
Jersey, shown in Figure 17; Ohio, in Figure 18; and
Pennsylvania, in Figure 19), do geographically proximate 1
jurisdictions play a role as supply sources equal to or \'
more important,than more distant jurisdictions. Even with
" '
'. .\
, ~----':"-,, ,-..;....,'::'". -I---"';-"-----~---=-·-·-·-----'"'!"""-------....... ---.--""""''''',.=!:!~.'''''=="",,=."''''':. ... ,.,,''''-''''''=--• ...,'1FM1' ___ '''~.;.:
\i 0 , t! ... ~:: .. ~ .' .,
'. /
, .,
~>., 1 I I,'
t~ ~ .-. . '\'
49
\" .' , .
~.
" .' . L "
. .
-~------ ----, ------ ------------------
STATES OF ORIGIN FOR STOLEN TYPEWRITERS NOW LOCATED iN NEW YORK) N = 450 (TOP FIVE STATES ARE CQLOR-SHADED)
........
2
, ... '
f{10'
<"" t:A .... 'AI'--
(j" .
. ,L ...
::OlITl-(, Dj\l"\..OTA
'" .' .'~
~ ~.
~ ,\
15 .. '
4
Oistrict of Columbia
6 f
1\ ;! I) H )1 :\ ., ., 11
(l 11
(I
11 h ~ r , I , , ! !
,
,
,

"
:
--... "
{! f
"
"",
. ... . ,.
FIGURE 9: ;~~,~;-:"",. ;j ""'\,
2
ALAS K ...
------------____ r.,~_
STATES OF ORIGIN FOR STOLEN TYPEWRITERS NOW LOCATED IN ILLINOISJ
N = 271 (TOP FIVE STATES ARE COLOR-SHADED)
,',
... , .
N co I
I ! ! , i I
\
\
\\
tt
.....
,
,

, '
. ,
---------~ ---------- ----------- --------------------------------
,
STATES OF ORIGIN FOR STOLEN TYPEWRITERS NQW LOCATED IN THE DISTRICT OF
/~ , . 'I
\ ALASKA \ eMl AD A
\
-, ,0'
N = 78 lTOP 5 STATES ARE COLOR-SHADED)
J
/
District of Columbia
32
,
\
.,
t
'""" -

",
, ,
i;' I
. _~~ ~r __ '~_'~--'""_'~_"""""d'~' __ ." __ ""'_"""~'''''_~'''''4_''~'_~~~'.:1~~~~",.-.I-~""'-"'="""""'"""""' '_'" '" ~ .~ .. <v., __ ~>",_~..n" ~,.,-" ..... " -_.
FIGURE 11: STATES OF ORIGIN FOR STOLEN TYPEWRITERS NOW LOCATED IN FLORIDA (TOP FIVE STATES ARE COLOR-SHADED) rp--:::~-:::T[~N = 182
1 \1,,"'Io,or s.... 1 ...\/\.\ r------.-...-.....
·'\"IIlTtf i'A"zl"-tTA
\ ,> 1
4 1 1
".
C,.\NJ.OA.
/
w a
---------
\
,

,
\
STATES OF ORIGIN FOR STOLEN TYPEWRITERS NOW LOCATED IN LOUISIANA (TOP FIVE ARE COLOR-SHADED)
1 , .
1 1
\.
ALASKA
\\
"
tt
.-f / . '"
.' . . ~ , .. - .I

, '-',,-
~
,
~ . 'l , .
".
: ....
/
.,: I. fr I
•. . 23 ..
\. h
:~
ALASKA
----------' -----~-----------
STATES OF ORIGIN FOR STOLEN TYPEWRITERS NOW LOCATED IN MICHIGA~1 N = 134 (TOP FIVE STATES ARE COLOR-CODED)
~~--------
3
8 .:r ~J .•
CANADA.
'~ ,
,
\
I 11
! .... i/
il
II lJ ii Ii
II 'I I. l!
'I Ii ff
~ ~ ! ! M if II I! '! !i H
II II. If Ij " fi
II 11
Ii 11
If .-I)
\
~ ~ I
w I\J
~
,
"

\,
. .
"-'t .-
l' I
'l "
;j :1 i' iI ;1
!, I
H d t) ·i
FI·GURE 14:
8 i"
..
~J L'"
ALASKA
'".
------------------------------ ----------------------
STATES OF ORIGIN FOR STOLEN TYPEWRITERS NOW LOCATED TN TENNESSEE N = 75 (TOP FIVE STATES ARE COLOR-SHADED)
-.. ""
. 1 '{ , ( i'
.~ " . .... ~
.,. .. .," ,
.--."' .I
' .
. " "'" .,. " .. ~ . ,.' ..
5 • ..,.
"" .r #
'.l ~~
District of Columbia
1
w w
I \ -l \
['1
J
,
\
\
.\
,

"
..
ALASKA
. , ..
.-j I
.< . ,
----~--- - --
STATES OF ORIGIN FOR STOLEN TYPEWRITERS NOW LOCATED IN VIRGINIA N = 98 ~TOP FIVE STATES ARE COLOR-SHADED)
~ r----.--._ .....
r~~~w>~~ (r ..
. L .. ___ ~
,.'
-,
, .
istrict of ,,,Co 1 umbi a
11
\
\
,
\
,

I:'
, 1,'
. ,
1 i .. '
. •
~
/'
"
-------- ---,------ -----------~--- -------------------------------~
I ti
li I J 1 J' t! ).-\ " l !
I! I, II 'I
I' II \" 11 fI \)
!] q u 11 tl 1\ it 11 J' ; I , , i'1 t f ; ; { I
j I
'I !
." ...
6
STATES OF ORIGIN FOR STOLEN TYPEWRITERS NOW LOCATED IN WASHINGTON N = 160 (TOP FIVE STATES ARE COLOR-SHADED)
-
1
1 1
~/.':)
'J~.
~-- . I
4
i I , I
:~J ______________________________ ~.-,~~
, '.
".
." . • 1 ,I
"
,
\
f'
! I !I
: I ,",
~ [i
II IJ If I]
1\
!l .1 I· I
I j
i fl il
t II fl
I]
I \
w 1 01
, .
.l J. j
Ii \
It r
. "'-
@ -

'.
l'
" I' 'I
Il ~)
!) J l/ M
I ~ , ., ~
," i
:r I , , .
------- ---- ------- -----------
FIGURE 17: STATES OF ORIGIN FOR STOLEN TYPEWRITERS NOW LOCATED IN NEW JERSEY . ..,
r ,""----- N = 184
: 1J II'\""~::TC~' \1-."1\ TAf\.,.,· _______
~\. 1
(TOP FIVE STATES ALL COLOR-SHADED)
J ~" ( !~ • tl ..
; "" '-\ ,. .... .
I L
sr\\'ti\~"I''''
~.
" ", ... }.,
" .. ·,1 .. y:
J:
..... ,. . >. . • ..
• .. ..... .. ... ;, .. - .. "12. • w:
!. I
r-------I "~ .....
....
~ /. I
:J
, . .....
Di stri ct of Columbia
3
w 0\
~ f< , 1I
I I J
I
,
\
... ,
.-\
,

ALASKA
.' ? /
STATES OF ORIGIN FOR STOLEN TYPEWRITERS NOW LOCATED IN OHIO N = 195 (TOP FIVE STATES ARE COLOR-SHADED)
1 2
,J'
/ /
District of Columbia
8
\
\
,
,

"
"
"/
If I
:
.,
)
J I,
f
-:
• . "\
FIGURE 19: ,'----. ~.) ""',\'1" ............ 11 \'i~tt\'
ALASKA
STATES OF ORIGIN FOR STOLEN TYPEWRITERS NOW LOCATED IN PENNSYLVANIA N = 156 (TOP FIVE STATES ARE COLOR-SHADED)
'-
" .-
1
'- ........... , • .!:." •.•. ~'...:.
.... ' ..
"" .. \ ..
" .. '"
1-----;
District of Columbia
5
w 00
\
\
-
,
'\
,\
It

.~
'-
"
:
. .
..
,.'
",,'
," .... " ' .
j{ " .~.
.~
--_._-- _._-' ----- ----------
'/' '
,.
.'
39
respect to these three states, however, the states of
California and Texas remain important supply sources.
B. Patterns of Movement for Stolen Typewriters for Selected Jurisdictions
Having looked in some detail at the originating
jurisdictions for stolen typewriters currently located
in various states and having described the varied market-
place patterns thereby revealed, we now turn attention
to the other side of" the picture, i.e., the distribution
paths taken by office, machines as they move within and
are exported from the jurisdiction from which they were
originally stolen. Figure 1 presented earlier provided
a rough index~ of the magnitude of the office equipment
theft problem in each state as reflected in the number of
stolen machines identified for each using the matching
technique. Considered below are the intra- and interstate
movement patterns for stolen office equipment for all
jurisdictions which had 50 or more identifications made
on items stolen from their residents. with the data
bases used in this project, 20 such jurisdictions, which
can be viewed as having the more serious typewriter
theft problems, are available fo~ analysis. These 20 juris-
dictions--together with the number of identifications made
for each, the number and percentage of stolen machines
remaining in state, and the number and percentage being
exported to other states--are listed in Table 3.
~/The cautions earlier stated at pp. 7-10 should be noted here .
I •• ~'!;
I '
,
! I "

.'
40
TABLE 3
ALL JURISDICTIONS WITH 50 OR MORE IDENTIFICATIONS OF STOLEN TYPEWRITERS,
INCLUDING TOTAL NUMBER OF IDENTIFICATIONS MAD~, NUMBER AND PERCENTAGE REMAINING
IN STATE, AND NUMBER AND PERCENTAGE BEING EXPORTED FROM JURISDICTION, N = 20
. - Machines # of Identi- Remaining
Jurisdiction fications Made in State Machines Exported
lNumber % Number % Arizona 247 160 65% 87 35% California 2,039 1,518 75 521 25 Colorado 186 135 73 51 27 ConnectJ.cut 90 15 17 75 83 Florida 222 75 34 147 66 GeorgJ.a 80 21 26 59 74 Illinois 319 113 35 206 65 Louisiana 68 54 79 14 21 Maryland 70 16 23 54 77 MJ.chJ.qan 139 41 29 98 71 MJ.ssouri 70 13 19 57 81 New Jersey 277 80 29 197 71 New York 662 215 32 447 68 Ohio 170 47 28 I 123 72 PennsylvanJ.a 159 49 31 110 69 Tennessee 53 26 49 27 51 Texas 1,212 924 76 288 24 VJ.rgJ.nJ.a 53 19 36 34 64 WashJ.ngton 115 7.5 65 40 35 DJ.strJ.ct of
Columbia 138 32 23 106 77
--~-~---
i I-!
i. I \.
, .
'~-~"""""""'-"""""""'---_% ~~ .. __ ~I " I .-
41
As before when the domestic and import market compon-
ents of typewriters located in each state were described,
two divergent patterns of stolen property movements, based
roughly on whether a jurisdiction is located in the eastern
or western half of the United States, emerge in Table 3
when the paths taken by machines stolen from each state are
described. Thus, typewriters stolen in eastern states are
far more likely to be exported than to remain in state for
resale. The reverse is true with respect to Western states.
These divergent patterns of movement, discussed separately
below, are pictorially represented in Figure 20.
1. Jurisdictions where stolen office equipment is
more likely to remain in state. Six states represented in
Table 3 display distribution patterns in which office
machines stolen in the jurisdiction are most likely to remain
in state for resale. Of these six states--Arizona, Cali-
fornia, Colorado, Louisiana, Texas and Washington--only
one, Louisiana, is not in the western half of the United
States. For all these states, the rat~ of. in-state redis-
tribution is quite high when compared with the proportion
of stolen typewriters exported for resale. Thus, 65 per-
cent of the typewriters stolen in Arizona and Washington
remain in state with only 35 percent available for resale
elsewhere. California and Colorado retain 75 percent and
73 percent of the typewriters stolen internally for resale
in the domestic marketplace, exporting only 25 percent and
27 percent respectively to other jurisdictions for resale.
f

I· i
..
-F'
-:
(I /
.. '
FIGURE 20: STATES RETAINING STOLEN TYPEWRITERS IN-STATE VERSUS STATES EXPORTING
ALAS Ii: A
STOLEN TYPEWRITERS (ALL JURISDICTIONS WHERE 50 OR MORE TYPEWRITERS WERE STOLEN)
LEGEND
~ r"··· L " " .. -----_---,....J D
f L"".' t'",
~~~
STATES RETAINING OR t'1ORE OF THE I R TYPEWRITERS
50% '\' STOLEN "\
STATES EXPORTING 50% OR MORE OF THEIR STOLEN TYPEWRITERS
District of Columbia
D
,
\
f !
I , ii ~ ft II
" " ~ t[ II
~ 11 1/
II ~ II 'I I, Ii
H
~ !t
II H
I f, 11
! I I \
'\

-- - -~------ -~--
'"
·, .
..
/ .
.. ... r I .-
43
Texas and Louisiana exhibit the same pattern of movement
with 76 percent and 79 percent (respectively) of the
domestically stolen office machines remaining in state,
and only 24 percent and 21 percent being exported.
It is likely that the speculation made ea);lier about
the rapidly growing domestic markets in Western states
is equally valid here in explaining the dominance of intra-
state redistribution of stolen typewriters in these juris-
dictions. Indeed a comparison of the number of stolen
typewriters exported from these states with the number
imported by them (this comparison is shown in Table 4
below) reveals that imports typically exceed exports. .For
three of these states, i.e., Colorado, Louisiana, and Washing-
ton, imports substantially exceed exports. For California
and Texas the number of stolen typewriters imported and
exported are roughly even. It is only with respect to the
state of Arizona that exports clearly and substantially
exceed imports.
Despite the dominance of the internal redistribution
of st~len office equipment in these six states, the external
movement patterns for their stolen items are also of inter-
est. Figures 21-26 present these movement patterns for each
state separately with the most freq~ent export destinations
for their stolen typewriters color-shaded in each figure.
While individual variations in export patterns are apparent
for each state, four states--Ca1ifornia, Texas, Illinois,
i: i' "
Ii
" ;{ <",
:l
1\
I' ! I !
! 1 ! I ! ' I ~ I
! ! I I I \
I j
i , [,I; , 1 I II i ! !

',.
1 I .
r:: . . ".
.":' "
FIGURE 21: IDENTIFIED LOCATIONS OF TYPEWRITERS ORIGINALLY STOLEN IN. ARIZONA
N = 247 (TOP FIVE EXPORT LOCATIONS ARE COLOR-SHADED)
.1 v ........ u-...~--.. .. ~.' -'
f
,.
ALASKA CANADA
j
" .J'- f . .-.'
, .
District of Columbia
1
\
\
,
,

, .
'.
......... .-; ~.
,
,') 't·, ;; I
...
. .
FIGURE 22: ~.----1"~ "" < ~-. \J "11\. ,I ·/~l.! ,.
19
\.,1.518
l~
~ 15
IDENTIFIED LOCATIONS OF TYPEWRITERS ORIGINALLY STOLEN IN CALIFORNIA
N = 2J 039 (TOP FIVE EXPORT LOCATIONS ARE COLDR-SHADED)
~ \1,'\'T..\r ..... \ _______ r-___ ~._-_
4 2
. "r':SAS
4 .
"J .', ....
.. it ....
... ~ .. ~l ... l\p
.:f .. , 66 .. ... ,'"
4
3 4
Puerto Rico 3
2 District of
olumbia 7
,
\
"'

~. ... -,
" .. \ -
, .
..
ALASKA
(~ .
-.
.'
,;, 7 { .... "".t;
.. .
IDENTIFIED LOCATIONS OF TYPEWRITERS ORIGINALLY STOLEN IN COLORADO N = 186 tTOP FIVE EXPORT LOCATIONS ARE COLOR-SHADED)
:::::--- . \1""TA"_~_r _____ .-.-_ ..... ~\'<:'T" "A KPTA \
1 I .. ;-
$OIIT~ Oi\,,-OTA 1
." t:1l ...... ~ ,,0\
1
1
135 >-\. ... /.:5.\5
1
.,. ... 1
~. .1
5 .J' 0;> .., , .. .'
..,. '"
.., ,.. ... .' l-,..-
to>
'I' C-\N/'DA
"
",'
/
,
District of Columbia
1
i j
I
t \
I of:>,
I en
!

,
\
FIGURE 24: IDENTIFIED LOCATIONS OF TYPEWRITERS ORIGINALLY STOLEN IN LOUISIANA i>-:::~::Tc N = 68 (TOP THREE EXPORT LOCATIONS ARE COLOR-SHADED)
:::::---1 ""STA" .• \ ------r----__ ''':''''TII "AK.L'T~
(
, .
I
\ ALASKA I
I \
I
t
" ,
-, , ~ .
, /.< I ~l ¥ - ~ ..

..
ALASKA C,\NADA
, .
'" f / .'1'
.. '
9
5
..,0.
v ... ··
OF TYPEWRITERS ORIGINALLY STOLEN IN TEXAS (TOP SIX EXPORT LOCATIONS ARE COLOR-SHADED)
2
4
3
2
Puerto Rico 3
.L .. ___ -, ~
' .
. .
6
4
,
\
t , , I
,J
I 'j I .. I
'I I I
'1 ;1
I' d " !
:1 '., :1 ~ J 'I 1i
') 'j '1
ii i
Ii q Ii II ,I d li 'I j1 ,( .j q
Ii
n 'i I,
Ii r! Ii
II If . If Ij
II
\
'\
I f
,

f I (~
. , .
. •
"
"
FIGURE 26: ~.---~.) I --........ '1' 1'\"'11 .,
(j \ '''"'.\,
75
ALASKA
IDENTIFIED LOCATIONS OF TYPEWRITERS ORIGINALLY STOLEN IN WASHINGTON N = 115 (TOP FOUR EXPORT LOCATIONS ARE COLOR-SHADED)
~ \1,'''TAf .... ~_-r _______ -.-____
." c\\"~, \ r;."I~"
,~ .. "'iI .. ~
.. 1(1
,; 3 'if ..
" " '" " t;r4' • ., .J' " "
~
.... .. I' ... £
" '\i i,I "
.I 'II i'
~ '~, 1 n'i l
:--. ..... ( \ VI
r~~~-,~:, t'"
.. L .. __ ._' I ----.--J
"
1
.. ..
Puerto Rico 1
1
~"-Il'" 1 .
~ \
District of Columbia
~:-t---=--1
"'" '-0
\
I •
I
\
f

-----
J I
I
I \ !
-.... '
" l ~
J
/' ' '\
." ,
. "
, . ,;

"
50
TABLE 4
NUMBER OF STOLEN TYPEWRITERS IMPORTED BY AND EXPORTED FROM THE STATES OF ARIZONA, CALIFORNIA,
COLORADO, LOUISIANA, TEXAS, AND WASHINGTON (STATES WITH 50 OR MORE IDENTIFICATIONS OF STOLEN TYPEWRITERS)
# of Stolen Type- # of Stolen Type-Jurisdiction wri ters Itnp'orted writers Exported Arizona 43 87 Cal~forn~a 497 521 Colorado 80 51 Louisiana 130 14 Texas 275 288 . Washington 85 40
TOTAL IMPORTS - 1,110 TOTAL EXPORTS - 1,001
and New York--emerge as important export markets for type-
writers stolen in these six states. Indeed, of the 1,001
stolen typewriters exported from these six states, 315 or
nearly one third are found in the four states noted above.
2. Jurisdictions where stolen office equipment is
more likely to be exported to other states. Fourteen juris
dictions listed in Table 3 demonstrated dis,tribution patterns
in which stolen office equipment was more likely to be ex-
ported to other states for resale than to be resold in
state. These 14 jurisdictions, which include Connecticut,
Florida, Georgia, Illinois, Maryland, Michigan, Missouri,
New Jersey, New York, Ohio, Pennsylvania, Tennessee, Virginia,
and the District of Columbia, are all in the eastern half of
the United states. The rates at which internally stolen of
fice equipment is exported from these states is remarkably
high, ranging from a minimum ra·te of export of 51 percent
for Tennessee to a maximum of 83 percent for connecticut.~/
*/ - Table 3 at p. 40 can be consulted for a listing of the export rates for all these jurisdictions.
,
, .
,"
51J,.
These rates are particularly intriguing when one con
siders that the densely-populated and commercially-impor
tant urban/suburban centers in most of these jurisdictions
constitute a substantial market for office equipment. But
when one remembers the extent to Whi?h many of these same
ptates were also found to be major importers of stolen
typewriters, then the earlier-noted comments about the key
element of transportation in'their distribution systems
for stolen office equipment become once again relevant
here. Indeed, inspection of Table 5 below, where the num
ber of stolen typewriters imported by and exported from
these 14 jurisdictions are summarized, demonstrates the
degree to which movement of stolen items in and out of
these states is a hallmark of their stolen property distri
bution and marketing systems. What is clear from Table 5
is just how different the patterns of movement for type
writers stolen in Eastern states are when compared with
those'of Western states. To begin with, substantially
more stolen typewriters were exported by the 14 Eastern
juriSdictions listed in Table 5 than were imported by them.
In addition, in only three of these jurisdictions--Ohio,
Tennessee and Virginia--did imports exceed exports. Rather
in most of these states exports substantially exceed imports,
with the import-export traffic being roughly equivalent in
but three jurisdictions, i.e., Michigan, Missouri, and Penn
sylvania.
i-I Ij i ' " il n :1
Ii ,j
Ii
1,'-
1
!\ i t
l 11 1\ It
1
' 1 . , \ .
,

-------------------
52
- .
# of Stolen TYi:~ writers 75 iters Impor 147 . 'sdiction wr 39
Jur~ - t- 'TI7c:=----r-___ = 59 Gonhect~cu 19 1----~2i70if6)'""' ~F~I~o~r~~~d~a~=-_i===== 311. ----~ 54 Georgi':l __ ~ ___ t-__ 1~87tj-----l....I__ 98 I11ino~s 57 Marylan __ d=-_ 93, ---- 197
an 56, ___ _ Mich~g_=_ 104 447 M~ssour~ 123 New Jersey 235 110
,
New York 148 27 Ohio. 107 34 Pennsylvan~a 49
106
. ' ~ , .
/
53
Because of the dOminance of Out-of-state movement of
typewriters stolen in these jurisdictions, the sPecific
eXport destinations of their stolen items are of special
interest. Figures 27-40 Present the current locations of
the typewriters stolen from each of these states, with
the mOst prominent export destinations cOlor-shaded in
each figure. Once again, while individual variations in
movement Patterns are apparent for each jurisdiction, a
small group of five states--california, Texas, Illinois,
Ohio, and New York--represent the major export markets for
typewriters stolen in all of these jurisdictions. Forty_
five Percent (777 Out of 1,740) of the stolen typewriters
eXPOrted by the 14 juriSdictions represented in Figures
27-40 are to be found in these five states alone. When
it is remembered that four of the five, i.e., California,
Texas, Illinois and New York, were also important export
markets for typewriters stolen in Western juriSdictions,
then the prominence Of these four states for the nation_
wide distribution of stolen office equipment becomes apparent.
C. The DistribUtion of Stolen Office EqUipment at the ~on"l LeVel: Sbme ImpUcahbns for Law Enforcement
This preliminary oVerview of the nationwide. distribution
patterns for stolen office equipment has Presented informa_
tion of a kind that until now has not been available to the
law enforcement conununity. SUch unavailability did not occur
I I
I ! I
,

I
r •
:
ALASKA
/
1 /"") ." ,
" " .-
IDENTIFIED LOCATIONS OF TYPEWRITERS ORIGINALLY STOLEN IN CONNECTICUT N = 90 (TOP FOUR EXPORT LOCATIONS ARE COLOR-SHADED)
I.
" 2
" f
t. 5
., t' .;/
\i e " r,.
'" "
" " C-\NAOA
Puerto Rico 1
" .,.P I.
..
,
t \
I " lJl
! ~
,

·0
Or
1 I o.
FIGURE 28: IDENTIFIED LOCATIONS OF TYPEWRITERS ORIGINALLY STOLEN IN
'-~"::.:::::-: ...... , N = 222 (TOP S I X EXP ORT lOCATIONS ARE C OlOR-SHADED)
'6 "t"O\'!7'r~o 4 ,. ~ TAN., ----------r---_____ ~ __
"',,, Jl..rff i'A J.Z(."\TA
L{ ";' 1
3
r---___ -::-_ '___ ___ ---, __ ...:...,
-..,: ~./' . I ,~
.-v- 2 l ALAS~A
3
I
Q
()
1
~O"rH DA "\.0 TA
3
..... t R '1.-\ ~ J.\.~
1
'\.-\/o:S.\5
1
, .". ", • ,
or I 13 iT. ,
;]
" • ,iJ ., I:
I ~
" I
2
... ~t( ... "s ... s
2
2
FLORIDA
. ~"', '"' ~7 ~J .'. \'~_ '/..... ~J~ '\:'~ •• \ \
\ ~ '. ' •. ",j c,J--.~, , '''~~.",,~ .:J' . _ ......
J'
'." - - -.'. -~- ~.
lFl tTl
i I I
I I
,
\
\

f
FIGURE 29~
, '
1 I . • 't
IDENTIFIED LOCATIONS OF TYPEWRITERS ORIGINALLY STOLEN IN GEORGIA N = 80 (TOP SIX EXPORT LOCATIONS ARE COLOR-SHADED)
f! .. ~ t.6 ..
;: v {1
r~~·,~~ ( ...
·.L .. --~~--:--------'--J
.' ,0'
,
'\
f

·, ,
f I
"
/'
. " ...
"
, 't
FIGURE 30:
..... t ASK .... CANADA
IDENTIFIED LOCATIONS OF TYPEWRITERS ORIGINALLY ST~LEN IN ILLINOIS N = 319 (TOP SIX EXPORT LOCATIONS ARE COLOR-SHADED)
6
IJ
';
.. -.,,:~ IS
~ a
f-o <'\., hA ...... ,l.I' ....
i;'~' .. ,--. .. L ..
30 ~
rJ :f :J
,
="- .... ( \ VI
i iI
" ~
!J
Puerto Rico 3
"
\
\
'\'
,

FIGURE 31:
ALASKA CANADA
1 I .' . "
..
------- ----------~ ----------~
IDENTIFIED LOCATIONS OF l'YPEWRITERS ORIGINALLY STOLEN IN MARYLAND N = 70 (TOP SIX EXPORT LOCATIONS ARE COLOR-SHADED) .
f
,,,,Q, <"\,
hA ..... ·".I'~
(~ .. -
.. L ..
.'
/
District of Columbia
2
U1 (Xl
L
,
,
\
.,

, ,
f! !
\
~ f,;.'·
. . '\
FIGURE 32: IDENTIFIED LOCATIONS OF TYPEWRITERS ORIGINALLY STOLEN IN MICHIGAN N = 139 (TOP SIX EXPORT LOCATIONS ARE COLOR-SHADED)
1,1
,;., 6
J
," OJ
",<' .. .. ,
.r 9 :}
;>
,;
/' ;, •
1
~r
I'
/'
" ,; "
,~
&'
If
~"''' ... ''SAS
.'
Puerto Rico 1
/1 v
\
\
"
.\
,

f I
FIGURE 33:
-------- ---- - -------
IDENTIFIED LOCATIONS OF' TYPEWRITERS ORIGINALLY STOLEN IN MISSOURI N = 70 (TOP FOUR EXPORT LOCATIONS ARE COLOR-SHADED)
·3 1 13
ALASKA C,\NJ.DA.
_6:)'
t""
<"\; hAW).I'..... ~'V
1
.. L .. ----,--1 ----.-J
",'
\ .
... ,. -.--.. --~-- ... ,~~- ,
m o
"
I I
\
,
\
I.>

"
\
.. /
...... , .. ,
J' I . .,. );.;~< " .. ' .-
------------------------------
FIGURE 34: IDENTIFIED LOCATIONS OF TYPEWRITERS ORIGINALLY STOLEN IN NEW JERSEY
ALASKA CANADA
N = 277 (TOP SIX EXPORT LOCATIONS ARE COLOR-SHADED)
8
rp~~WA~~ V;i'" 1
.. L ..
.:
1 3
,/~ I •
Puerto Rico 2
"
,
\
\
.\
,

FIGURE 35:
"
ALASKA
, )
" /
f I . , .. '
IDENTIFIED LOCATIONS OF TYPEWRITERS ORIGINALLY STOLEN IN NEW YORK . .. , . N = 622 (TOP FIVE EXPORT LOCATIONS ARE COLOR-SHADED)
9
3
r ~ •• ..;a .... , .....
30. ~,
5 • ~
' .
/
10
Puerto
2
Rico O't N
\
\
,
. "

~------
',\
"
- .. :
~.
y f . ~
,--
FIGURE 36:
----~----
IDENTIFIED LOCATIONS OF TYPEWRITERS ORIGINALLY STOLEN IN OHIO N = 170 (TOP THREE EXPORT LOCATIONS ARE COLOR-SHADED)
, '1
"'llt( ... ~s ... s
1 ..
... -- .... :. ' .. <I it ,~ 2
.(J. 6-.. Ii f ,j)
~ 15 ('
~ ..
,\ , J
~,
-1 ~
~ ~. ~
ALASKA C,\NADA.
2 _,:I'
(j" .
.. L .. -----.--J
.'
,
\
! !
I· I I I ,!
\
,
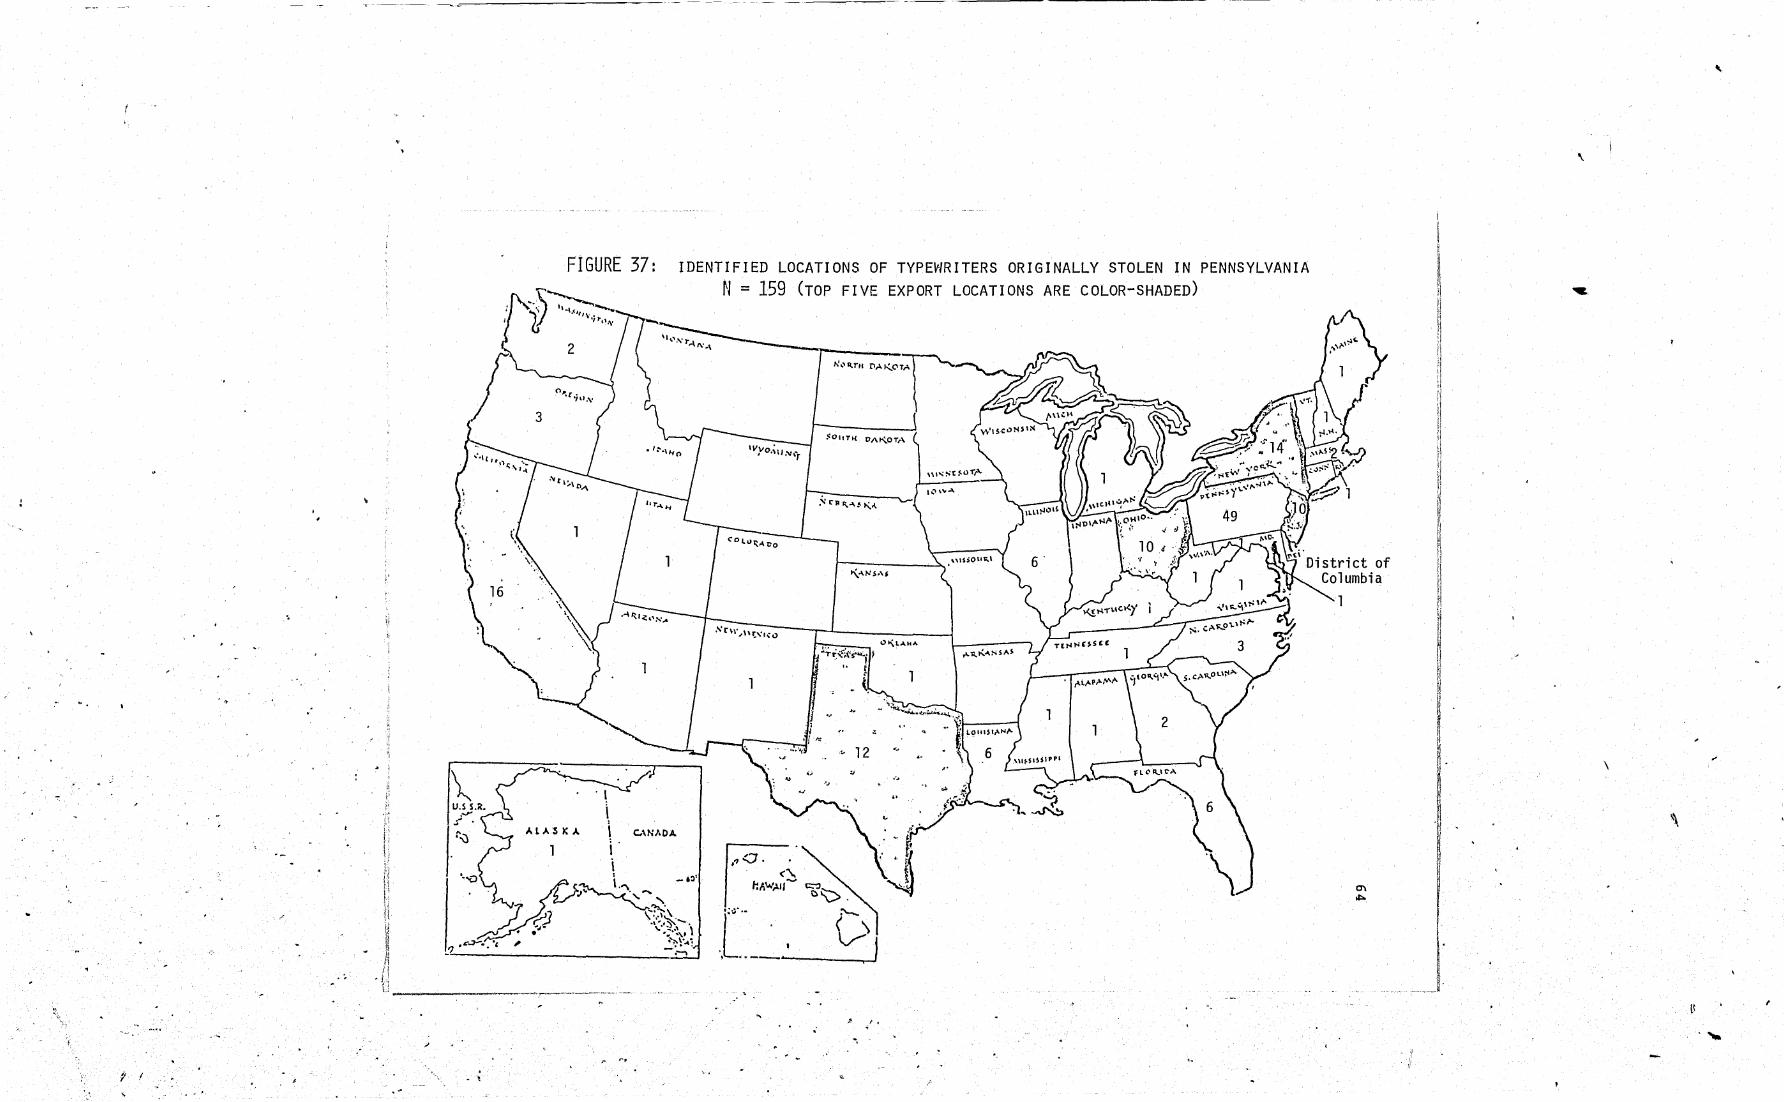
"
j! •.
! 1. Ii }; Ii j: Ii, tl \i ~ ,~ n
~ f 1 U ________ _
. '\
ALAS K A
- -- -- - - - - -------- ---
CANADA.
IDENTIFIED LOCATIONS OF TYPEWRITERS ORIGINALLY STOLEN IN PENNSYLVANIA N = 159 (TOP FIVE EXPORT LOCATIONS ARE COLOR-SHADED)
.' '.
" I •
-,
,
\
I I
~ II , ji il I' I) iI
il Ii
II Ii 'I I' 'I \1 n 1) 1\ I' [) ~
~ II ~l I,
!f , I I 1 k L rt
~ \1 11
II ~ .
11
I· .-
\
.~ II
0\ 01>0
[I ,

ALASKA C..\NMl)l.
r I . .. . ,
IDENTIFIED LOCATIONS OF TYPEWRITERS ORIGINALLY STOLEN IN TENNESSEE N = 53 (TOP FOUR EXPORT LOCATIONS ARE COLOR-SHADED)
""
. ,
,:,' «~.
M -, '/
:r:----;~JJ ., , 4·
J "
" ~ ~ ~. • ,0, I , __ ::
3 .'
"
. '
,
,
\
,

FIGURE 39:
~~~ 0\, '" ........ ,\ .... t"I\'. (j 'It",.,.
'.
.ALASKA
"
.....
--------------------------------.~------------------------------
IDENTIFIED LOCATIONS OF TYPEWRITERS ORIGINALLY STOLEN IN VIRGINIA N = 53 (TOP THREE EXPORT LOCATIONS ARE COLOR-SHADED)
. .-'
to .. .. L ..
";' /'
;'
I
I ! I I i
I ~
I I I ! I 1!
~ ~ ~ H
\
.\
,

;,
I' il
"'I J.I
"
- ... .'.
"\ (! /J
Y 'j ,
'" /
\~;:
'/
• or:-
" .' /1. '
,,14"
, , .
.,
. .-• '. ,
FIGURE 40.:
----~------- -----~---------
IDENTIFIED LOCATIONS OF TYPEWRITERS ORIGINALLY STOLEN IN DISTRICT OF COLUMBIA) N = 138 (TOP FIVE EXPORT LOCATIONS ARE COLOR-SHADED)
2
Sfn· ... \\r.Sllo7o
ALAS K,r.. C-\NAOA.
J.;( Puerto Rico
./ !,
"
.; -
, .
... _-------------'.
,
\
\
'\
,

, I 1
lj •
! 1
I 1
fit }
j ~ I
. I I 1
'\ 1 I
-----------~------ ---
68
because it would have been previously impossible to
gene:cate this information. Rather, it stemmed from the
fact~ that the innovative thinking that went into the
development of the matching technique used here did not
take place previously. BecauSf~ of the novelty and unique
ness of this information, one is hard pressed to spell
c,ut the full extent of its implications for and value to
law enforcement agencies. Nevertheless it is possiole to
identify at least three implications at the present time.
First, it is clear that the innovative use of auto
mated identification and record-keeping systems is cap-
able of yielding information tha~ not only is of great
value to investigative agencies, but also would be unavail-
able otherwise. Much of the information presented above
could not have been developed except through the matching
technique used he.re; and yet, this technique is but one
example of the investigative payoffs possible through
more creative uses of existing identification and record-
keeping resources. The law enforcement community undoubt
edly possesses the skill and creativity needed to realize
such investigative potential. What has not been forth-
coming, however, is the kind of sustained commitment to
property theft e.nforcement necessary to ensure that avail
able skills and creativity are applied to this important
crime area. Instead,. property theft enforcement has
been allowed to drift, using investigative techniques and
! •
.-
/ .
69
ago een shown to be ineffective. approaches that have long b
The incompleteness of the ~ NCIC file used here points up
the extent ·to which agencies are not making optimal use of
resources that currently exist. Th e matching technique
applied in this project, th en, by demonstrating the kind
of valuable information that is available to law enforce- )
ment, demonstrates as well J'ust h ow dissatisfied we shoUld
be with t d' , ra ~t~onal enforce~ent approaches and how impatient
we should be for law enfor~ement to begin to successfully
inhibit the trafficking in 'stolen goods.
A second implication is related to the substance of
the nationwide distribution patterns for stolen office
equipment described above. I t was clear from the infor-
mation generated by the ,matChing technique that very dis-
tinctive patterns of distribution could be discerned among
the various jurisdictions and particularly for eastern
versus western states. As these distinctive patterns
were presented and described, some speculations were
offered to account for them. Regardless of whether the
particular sp 1 t" ecu a ~ons suggested are accurate or not, it
is clear·that one factor that does not appear to shape or
~s r~bution patterns is the determine stolen property d' t '
criminal justice system. I nstead, traffickers in stolen
m~rchandise appear to establish distribution systems
based upon economic conditions in their own· or neighbor-
or ~n e same region, or upon other factors ing states 'th
... services. The such as the availability of transportat 4on
\..;; ,
I
.\
f

- 1 , , I r
, J I
" ~ . j
'>
i ~ 1
I
70
criminal justice system is quite irrelevant to all of ...
this, since trafficking in stolen goods is basically a
high-profit, low-risk activity, poorly monitored and con-
trolled by law enforcement. With so little law enforce-
ment activity in this crime area, it is small wonder
. that fences and their customers can easily disregar~
the criminal justice system, as a factor not worth being
concerned about.
This is, of course, just the point. For when one
sees with what apparent ease expensive and readily iden
tifiable office equipment il3 stolen and resold wi thin
jurisdictions, and then moved about from coast to coast,
one gets the impression of an illicit marketplace oper-
ating with an impunity that is rarely disturbed. Un
doubtedly, most of the nearly 7,000 stolen typewriters
identified in this project have already been written off
as "unrecovered theft losses" by investigating agencies,
leaving fences and their customers as undisputed benefi-
ciaries. Continuation of traditional enforcement approaches
to property theft will o~ly assure that this situation
will remain unchanged, that the criminal justice system
-will continue to be irrelevant, and that the stolen pro-
perty marketplace will persist virtually unchallenged.
Finally, it is clear that the matching technique
applied here is useful not only in ge,nerating valuable
investigative information but also in providing an agenda
--------~- ----.-----------
71
for action. Because it is possible using the technique
to distinguish various marketplace and distribution pat-
terns for individual jurisdictions, it is possible also
to set enforcement priorities and make decisions among
alternative enforcement strategies. Thus, a state domin-
ated by a domestic marketplace, with a stable import com-
ponent, but very few exports, might decide to devote
virtually all its resources to the investigation of internal
traffickers in stolen goods, adopting strategies tailored
to fit these operations. Another state with a considerably
large import/export trade might alternatively decide to
contact outside jurisdictions known to be associated with
this trade and attempt to launch coordinated investigations
of interstate traffickers in stolen goods. In this case,
effective control of the stolen property marketplace would
require the assistance and cooperation of those in other
jurisdictions. -
Setting enforcement priorities and choosing among
alternative strategies is not quite as simply done as
stated above. For many states, however, a clear choice
between focusing resources internally or on an interstate
basis is implicit in the marketplace patterns observed.
For others, in particular New York, Illinois, California,
and. Texas, the choice is not nearly so clear. Thus, while
California and Texas both have dominant domestic markets,
neither one of them can be sanguine aqout the import/export
,

72
trade it generat~s. This is because both are major
exporters of stolen.office equipment as well as pr~minent
import markets ~~r such items stolen elsewhere. New
York and Illinois with marketplaces characterized by f
significant import/export trafficking, also have large
domestically supplied markets that cannot be safely ig-
nored. For all these states the interaction between the
domestic and the import/export components of their mar
ketplaces, would have great significance for determining
an effective enforcement program.
until the information provided here has been field
verified and investigated, it is impossible to specify
with certainty the enforcement steps that would make most
sense for individual jurisdictions .. It is important to
note, however, that the matching technique providing this
information does more than point up current law enforce
ment failures and shortcomings. It also provides clear
direction as to how law enforcement agencies can begin to
cope more effectively and ultimately inhibit the stolen
property marketplace.
- -- ~ ------ -,-- - ---------------
"F J I
, ___ J /
73
PART II: THE THEFT AND DISTRIBUTION OF STOLEN OFFICE MACHINES--THE CALIFORNIA SCENE
As noted earlier, it is the California Department
of Justice which developed the matching technique des
cribed here,'and it was the a:t:>plication of-this technique
within the State of California that formed the basis
of this project. The development and use of the tech
nique in California was possible under recently enacted
provisions of the state's Business and Professions code:/
which require businesses taking items for repair to con
form to reporting requirements similar to those imposed
upon pawnbrokers and other secondhand goods dealers. To
our knowledge, California is the only state with such a
statute~ or alternatively, which treats repair outlets
in a class with secondhand merchandisers.
On the basis of this statute, the California Depart
ment of Justice (hereafter DOJ) established a coopE'~rative
relationship with the IBM Corporation to ensure receipt
of its automated records of repair transactions for com-
parison with the state's Automated Property System, a
statewide file of property stolen. For the purpose of
this project, DOJ agreed to apply the matching technique
to the above records on a pilot basis, documenting the
information obtained through the use of a structured
*/ - The relevant section of this code is Article IV, Section 21628.5 which was enacted in 1977.
: 1
I il
d "I !)
f'1 ,. iI 11 1· r.! !'f ii 1\ It
II ~ \
l-} f.i I) ., , ' t I
r~ i,t
! l !
II [\ I' It ,I 11 1]
H ) 1 k·f It 1',1 1 t
!t \ ! ( , '\ I,e >i ~.! 1 , i
,

74
reporting form--.2/ and providi~g access to this information
by the project director. It was the firm hope that this
pilot effort not only would provide considerable informa
tion about the trafficking of stolen office equipment,
but also would form the basis for an assessment of the
investigative potential of the new Business and Professions
Code provisions: This part of the report summarizes the
investigative activity of law enforcement agencies wi£hin
the State of California stimulated by this project, and
the information obtained as a result of this activity.
Several points should be noted at the outset. First,
impl~mentation of the pilot effort reported on here involved
not only the use of new reporting forms by local law enforce--
. . Cal~forn~a, but also the transmission of ment agenc~es ~n • •
an entirely new type of investigative lead to agencies for
follow up. Despite the novelty of the effort and attempts
by the project to provide guidance through written materials,
it is clear that many agencies did not fully understand the
value of the information provided them or what was being
asked of them in the nature of an investigative follow up.
In hindsight, it is believed that the project could have
benefi.tted immeasurably had regional orientation meetings
for investigators been held throughout the state of
california,~ which could have explained the effort in
detail and fielded questions or problems. Instead, such
~/This form, with its accompanying investigative guidelines, has been earlier transmitted to project monitors.
**/ Ii' b' eared by the State of California for the - An app catl.on el.ng pr p . extension of this technique on a nationwide basis provides for such an orientation component.
--,.----- _. __ . ----- ----------
--_ ..... . 2
75
orientation occurred on an ad hoc basis with representatives
of DOJ traveling to individual agencies to p'rovide assis
tance, when lack of response to leads indicated that there
was a problem.
A second issue affecting field response to ~he prOject
was an apparent lack of appreciation on the part of many
investigators for the ultimate value of the leads they
were given or for the sett~ngs ~n wh~ch . . • • • ~nvest~gations
were to be conducted. Thus many investigators who were
quite willing to conduct field visits for the purpose of
verifying and recovering stolen items, were substantially
unprepared to use those visits as a start~ng off point
for a deeper probe into the transaction(s) that had given
rise to an individual's possession of a stolen item.
Similarly, experienced investigators known to be adept at
debriefing street offenders found in possession of stolen
or contraband items, were often unaccountably inhibited
when confronted with the prospect of debriefing managers
of business establishments or members of the professions,
two groups frequently found to be in possession of stolen
items. In a large number of cases, then, recovery of the
stolen item was undertaken as an end in itself, such that
little or no follow-up investigation occurred. This/pre-
vented enforcement exploitation of the full Potential of
the information for establishing the layers of_the stolen
office equipment marketplace.
""--~-' .. --..
:1 I :j
" i U
1 d I' II I'
i Ii Ji Ii l"~ .. j !j H 1: 11 " Ii
H " [I if
Ii Ii J 'I /i I.
f N If ,
l ~
I ~
~
I I ! , 1 I
I't ~ :1
.\
! ,~ .~
I ,
U . I ,
I~ i \ !:t
1 0"'

I 'j
.1 j ,
76
Finally, the responses of some agencies were not
received in a manner timely enough to be included in
the analyses reported below. Part of the problem here is
that at the same time support to DOJ was terminated under
the current project, the Department was experiencing per
sonnel cuts which limited its ability to enter information
already on hand into the system. Thus in addition to
leads outstanding, DOJ estimates that it has a backlog of
some 300-400 cases not included in this report.
Each of these factors--lack of orientation, reluctance
to pursue follow-up investigations and timeliness of res
ponse--affected the ~xtent of information available for
analysis. As it turned out, while most agencies responded
positively to the reporting form itself, overall compli
ance in returning materials for documentation purposes is
estimated to have been at a 60-70 percent rate. This
leaves 30-40 percent of the leads transmitted which either
received no field response or where the response was too
late for inclusion in the analysis here. But even within
the 60-70 percent group from which some response was re
ceived, many of the forms were only partially filled out.
Exactly which factor(s) was most responsible for a lack
of compliance with the reporting system is not known.
In only a few instances did there appear to be an outright
refusal to comply. Rather, in most ca~es, lack of res
ponsiveness seemed to result from a misunderstanding of
.'''' '
------- ----
, -"
"
I ,-,
77
what was expected and/or a reluctance to press for
answers from "respectable" possessors of stolen items.
Whatever the reason, lack of compliance did result in
a considerable loss of information, which accounts for
the widely varying sizes of the samples on which aspects
of the following analysis are based.
The report which follows focuses in some detail on
the domestic marketplace for stolen office equipment in
the State of California. This is of particular interest
since as was noted above when national distribution pat-
terns were discussed, California is one of those states
with a prominent domestic component to its market for
stolen office machines. Understanding what happens to
typewriters stolen and redistributed in California, then,
may be of value to other states with signficant domestic
markets. '- , ..
The disctission is divided into five sections: first,
an analysis of the nature of the thefts in which type
writers were taken (including the types of persons/institu
tions victimized); second, a description of the character
istics of those persons found to be in possession of stolen
typewriters; third, a description of the reported circum
stances by which possession of stolen machines was obtained;
fourth, a section reporting on some special studies conducted
of the movement of stolen typewriters within the state, andof
the timing of that movement"and, finally, a section summariz-
ing project results and implications.
,>< • ..,.<-,'''',.,-,._"...,.''''''-------_ .. ..-... ~
I
I ! I! ~ Ii ~ !
I
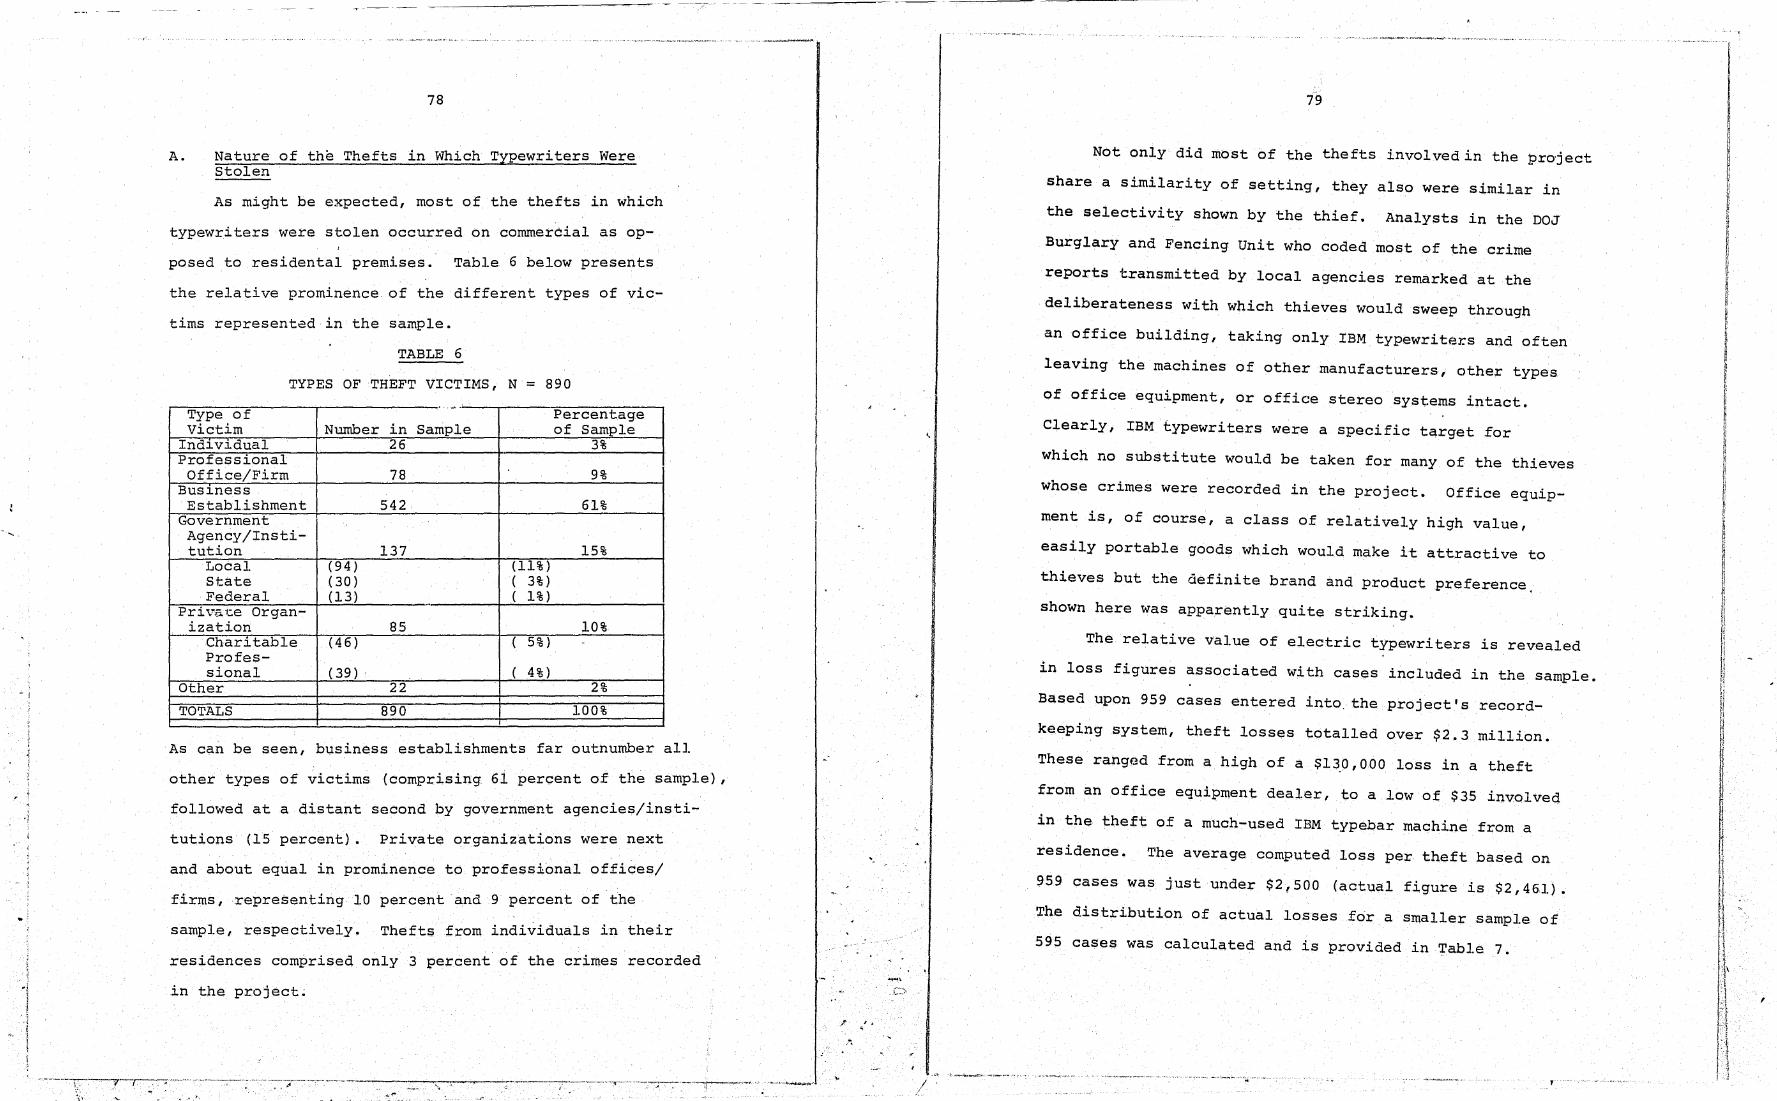
" I
·i I , ; ,l !
<, !
78
A. Nature of the Thefts in Which Typewriters Were Stolen
As might be expected, most of the thefts in which
typewriters were stolen occurred on commercial as op-
posed to residental premises. Table 6 below presents
the relative prominence, of the different types of vic-
tims represented in the sample.
TABLE 6
TYPES OF THEFT VICTIMS, N = 890
-<. --Type of Percentage Victim Number in Sample of Sample Ind~v~dual 26 3% Pro,fessional Office/Firm 78 9%
Bus~ness
Establishment 542 61% Government Agency/Insti-tution 137 15%
Local (94) (11% ) State (30) ( 3%) Federal (13) ( 1% ) ..
Priva1.:e Organ-ization 85 10% Char~table (46) ( 5%) Profes-sional (39) , ( 4%)
Other 22 2%
TOTALS 890 100%
As can be seen, business establishments far outnumber all
other types of victims (comprising 61 percent of the sample),
followed at a distant second by government agencies/insti
tutions (15 percent). Private organizations were next
and about equal in prominence to professional offices/
firms, representing 10 percent and 9 percent of the
sample, respectively. Thefts from individuals in their
residences comprised only 3 percent of the crimes recorded
in the project.
-~----- --- - ~---- -~-------~
' ..
/ /
"
79
Not only did most of the thefts involved in the project
share a similarity of setting, they also were similar in
the selectivity shown by the thief. Analysts in the DOJ
Burglary and Fencing Unit who coded most of the crime
reports transmitted by local agencies remarked at the
deliberateness with which thieves would sweep through
an office building, taking only IBM typewriters and often
leaving the machines of other manufacturers, other types
of office equipment, or office stereo systems intact.
Clearly, IBM typewriters were a specific target for
which no substitute would be taken for many of the thieves
whose crimes were recorded in the project. Office equip
ment is, of course, a class of relatively high value,
easily portable goods which would make it attractive to
thieves but the definite brand and product preference,
shown here was apparently quite striking.
The relative value of electric typewriters is revealed
in loss figures associated with cases included in the sample.
Based upon 959 cases entered into the project's record-
keeping system, theft losses totalled over $2.3 million.
These rangfad from a high of a $13.0,000 loss in a theft
from an office equipment dealer, to a low of $35 involved
in the theft of a much-used IBM typebar machine from a
residence. The average computed loss per theft based on
959 cases was just under $2,500 (actual figure is $2,461).
The distribution of actual losses for a smaller sample of
595 cases was calculated and is provided in 'J:'able 7.
I tl
t Ii " h I' r,
II ,r ;'
~ U i r ~ II ! H ~
I J' , !l ~ Ii 11
~: II J r-I'
~ ~ ~
~ H II
II
f1 Ij !I I:
! I ~' 11
tl ft '1
r 1 I
I{ 11' I
1:\ ,
1'1 , 1 r
tj
11 ! }

' ... ,
: - ,
" I )
l
I , 'I
1 ·1
1
t
·1
------------~~--~- ---~ ---~ ---------
80
TABLE 7
DOLLAR VALUES OF THEFT LOSSES, N = 595
Dollar Loss Number of Thefts Percentage-of Categories in Category Thefts 'in CateqorY
$500 or less 95 16% $501 - $1,000 179 30% $1,001 - $1,500 69 12% $1,501 - $2,000 69 12% $2,001 - $3,000 69 12%
-$3, 001 - 1? 5, 000 62 10% $5,001 - $10,000 37 6%
. 1?10,000 -
$20,000 9 2% Over $20,000 6 1% ,
While the largest proportion of theft losses were in the
$500-$1,000 range, nearly 10 percent involved losses of
$5,000 or more.
Despite the high average value of office equipment
thefts, they do not appear to experience a rate of solution
that is any better than the average burglary. Before leads
had been transmitted to them, local agencies were asked to
indicate the status of the original theft case in which a
typewriter had been stolen. The results of this query
appear in Table 8. By far the vast majority of cases (97.2
percent) were listed as "inactive," meaning that they neither
were being worked nor had any arrests occurred. In
less than 1 percent of the cases in the sample had an
arrest been made and theft convictions had been obtained in
only one half of the percent of the cases. Such was the
sorry record that had been logged by traditional responses
to these thefts. Clearly very little had happened or was
likely to happen with respect to the solution of most of
./ ' .
/
81
'I'ABLE~
STA'I'US OF THEFT CASES PRIOR TO PROPERTY RECOVERY INVESTIGATION, N = 894
Case Status Number of Cases Percentage of Cases
in Cateqory in Cateqory Act~ve Inact~ve
2 .2% 869 97.2% Except~onal Clear-
ance 3 Cle'arance by Arrest .3%
3 .3% Az:;rest/Conviction for Burqlary 4 .4% Arrest/Conv~ct~on ' for Larceny-Theft 1 .1% Other 3 .3%
these crimes--not t t' h o men ~on t, e recovery of the property
stolen. Indeed, when asked about the recovery of stolen
goods in these ca,ses, local age ' nc~es reported that partial
recoveries had been made in only three percent of them.
The story told in this sample of cases ' ~s borne out in the
general experience of local 'agencies in C~lifornia which
continue to use traditional h approac es to property theft
enforcement. Thus for 1976 the average clearance rate on
burglari.es and larcenies in California was 15.8 percent,
with the recovery rate for serialized goods hovering at
about nine percent. F t f or mos 0 the businesses and other
victims in the sample who had 1 ost office equipment to
thieves, the criminal justice system-offered little hope
of seeing their property again or of a solution to the
crime they had suffered.
B. -Characteristics of the Settings Where Stolen Typewriters Were Found
An earlier project report summarized the settings in
which stolen typewriters were locat'ed for a group of cases
that formed a backlog at the time the project began. f

. j , \ , , J
.. J !
~ 1 1
I I
1
82
t his early listing of stolen Table 8 below provides
typewriter locations. At that time, the largest number of
TABLE 9
MOST FREQUENT SE~TINGS WHERE STOLEN TYPEWRITERS WERE LOCATED, N = 1,550
# of Typewriters Percentage of Typewriter~ in Business/Occupational Identified in
Each Setti~ Each Sett~ng Setti~s Ba~l bond firms 35 2% Assoc~,ated legal
services 91 6% Pharmacies/drug stores 120 8%
Private law firms/ attorneys' offices 316 20%
Private medical firms/ physicians' offices 320 21%
Small service-o~iented businesses 668 43%
1 t d in small serv~ce-'t (43 percent) were oca~e typewr~ ers
oriented business establishments. These included real
, firms, secretarial estate offices, management serv~ces
11 construction f~rms, services, sma , and office supply firms.
would be disaggregated It was noted then that this category
that the relative proin the new data collection effort so
f' could be presented. portions of different types of ~rrns
{nterest here, however, was the extent to Of particular ....
which the offices of
and physicians, were
items were located.
professionals, primarily attorneys
frequent settings in which stolen
a more detailed listing of the Table'l:O below provides
, re located. sett -i ngs in which stolen typew'r~ terswe types of ....
This listing is developed
system implemented by the
from the ~ew information gathering
project. Unfortunately, out of a
"
IJ
I 1 } J
, , , ,. /
----~--~>----~----'-.'-~.~.-"~", .. ~~ /
83
total of 9S9 cases in the record-keeping sys~em; infor-
mation about the settings for stolen items was available
for only 538 cases.
As can be seen in Table 10, business establishments
remain the most frequent settings for stolen typewriters.
Of these, wholesalers and retailers led the list with
11 percent of the stolen typewriters found in such busi-
nesses, followed next by financial institutions (10 per-
cent), light manufacturing firms (8 percent), and heavy
industrial firms (7 percent). A particularly interesting
group of firms are the service businesses in which 5 per-
cent of the stolen typewriters from the sample were located.
One might speculate that these firms corne into possession
of such items by stealing from their business clients for
whom they provide services.
After business establishments, the next most frequent
setting in Which stolen typewriters were located was public
institutions, accounting for 13 percent of the sample. If
government agencies are added to these, then nearly one
fifth of the typewriters in the sample were to be found in
public settings. These represent a curious setting for
stolen items since one would expect most government agen-
cies and public institutions to purchase equipment and
sUppiies through a centralized procurement mechanism.
Sev~ral 'issues are raised by this finding. First, one may
qnestion the extent to which many sUppiier-contractors for
,

"
84
TABLE 10
SETTINGS WHERE STOLEN TYPEWRITERS WERE LOCATED
N = 538
NUMBER OF PERCENTAGE OF SETTINGS FOR STOLEN TYPEWRITERS FOUND TYPEWRITERS
TYPEWRITERS IN SETTING FOUND IN SETTING
BUSINESS ESTABLISHMENTS 340 63% Whoiesalers/Retailers (58 ) ( 11%) Financial Institutions (banks, mortgage,and insurance companles) (53) (10% ) Ll_9.ht Manufacturing Firms (40l 8%) Heavy Industrial Firms (40) ( 7"1,,) Management Consultant/ Investment Fi rms (29) ( 5%) Servlce Business (tempo-ra ry / secretari a 1 ~erVi,Ces,;) janitorial, securlty flrms (29) ( 5%) Laboratori(~/Research Organizations (17) ( 3%) Realtors 16) 3% Publishers/Print and Electronic Media (16) 3%) Transportation Firms 16 3% Travel and Tourism Firms 12 , 2% Construction Firms 10 2%
PUBLfC INSTITUTIONS 69 13% -Elementary/~econdary Schools 26) ( 5% Hospitals/Clinics 20 4% Colleges/Universities 14 3% Churches 9 2%
PROFESSIONAL OFFICES/ 54 10% FIRMS
Caw F'i rms ~/j ~ Physiclans' Offices ·20 4% Other Professionals 6 1%
PRIVATE RESIDENC~S 29 5% -.-GOVERNMENT AGENCIES 26 5%
PRIVATE ORGANIZATIONS/ 20 4% ASSOCIATIONS
'~~L __ .-= _____ -:----::--;--_. __ ._ .. _, __ - '\,
, ,
I ~ "''''"''-' ,~ ... ~ .. ---'
!
85
government and public institutions are fences of stolen
goods who are dealing off such merchandise to these insti
tutions. A further issue is the degree to which govern-
ment and public institutions may be victims of procure-
ment frauds through their purchasing agents who may have
IIspecialll
buying arrangements with illicit suppliers. At
minimum, however, one must question the degree of looseness
in the procurement practices of government agencies and
public institutions which allows them to become frequent
outlets for stolen goods. In view of the special at ten-
tion which is currently being given to the issue of procure
ment fraud at all levels of government, these findings
should be of significance to a broad constituency.
Inspectors-general are now being appointed and taking hold
throughout the federal government under new federal legis
lation, and are particularly charged with protecting the
integri,ty of the procurement process. State and local
government agencies are being urged to emulate this approach.
The new American Bar Association Model Procurement Code is
about to be pilot tested in a number of jurisdictions, with
the support of the Law Enforcement Assistance Administration.
There is a national association of state and local procure-
ment officials who should be alerted to their potential
(inadvertent) inVOlvement in providing avenues for the ,
marketing of stolen property. Case histories--taken from

'I ,
~----
86
the Cali.fornia experience--make it clear that the range
of subversions of the procurement process must be expanded
to comprehend the danger of such involvement~
The next most prominent setting in which stolen type
writers were located were professional offices and firms,
with 10 percent of the stolen machines in the sample found
in these settings. The relative prominence of this type
of setting is much less significant than was true of the
earlier listing found in Table 9. Whether this represents
a true difference in the frequency of these settings ,or an
artifact of the reporting practices of local law enforce
ment agencies is not known. Finally, about 5 percent and
3 percent of the stolen typewriters in the sample were
located respectively in private residences and in the of-
fices of private organizations or associations.
One question that was asked in the analysis of these
settings was the extent to which different settings are
supplied by thefts from different types of victims. That
is, did the stolen typewriters found in business establish
ments originate from thefts of other business establishments,
, .
.- /
87
or from ather kinds of theft victims? Table 11 below
presents the relationship between the settings where
typewriters were located and the victims from which they
were stolen for' 270 cases where this was known. As can be
seen, businesses and professional offices were the most fre
quent settings for typewriters regardless of the type
,of victim experiencing the theft. Residences are also
prominent, particularly as settings for type~riters
stolen from businesses or the offices of government
or public institutions. And not infrequently the machines
stolen from private professional or chQritable organiza
tions end up in the offices of similar organizations.
What is not demonstrated in Table II, however, are
distinctly different distribution paths for office equip
ment stolen from differen't types of victims,. Instead"
the major markets for such equipment, and in particular
business establi.13hments, appear to draw to themselves a
supply of typewriters stolen from all types of victims.
This' look at the identified final consumers of
stolen office equi.pment has confirmed the view that such
items do not end up being hawked on street corners to the
first passerby, nor in the possess·ion of a small group of
shady entrepreneurs. Instead, most stolen typewriters
re-emerge in the same commercial, industrial, and public
milieus from which they were stolen. More important,
they do so with little risk to the traffickers in stolen
, I;
r1
, i
I ! I I If t ~
>1 \ J
,

,-----
TYPES OF VICTIMS FROM WHICH
TYPEWRITERS WERE STOLEN
Individuals
" Professionals
Business Establishments
~ . .' Gov't/public Agencies and Institutions
Private Organi-zations/Ass'ns
TOTALS FOR TYPES OF SETTINGS
/
.<
J ! .' .
TABLE 11
RELATIONSHIP BETWEEN SETTINGS WHERE TYPEWRITERS WERE LOCATED AND TYPES OF VICTIMS FROM WHICH THEY WERE STOLEN, N ~ 270
NUMBER OF TYPEWRITERS IDENTIFIED IN EACH TYPE OF SETTING
Bus~ness Profes- Gov' t/Publ~c Pr~vate
Establish- sional Agencies and Organizations/ ments Offices Residences Institutions Associations
4 2 - 2 -
8 3 3 - -
120 36 18 3 11
13 7 7 6 1
11 5 1 1 8
156 53 29 12 20
TOTALS FOR TYPES OF VICTIMS
8
14
188
34
26
270
co co
,
\
,
-

" '
"
, .,
/
;'
. ,
: .
.' , .
,..
? I.
I I
'j
/
89
goods who handle the resale transaction or to the con-
sumers who make the purchase. This is because tradi-
tional approaches to property theft enforcement provide
neither the impetus nor the efficient method for trac-
ing and monitoring such transactions that is available
through the matching technique applied here. Just how
and where such transactions typically take place is the
subject to which we next turn.
c. Circumstances Surrounding the Purchase of Stolen Typewriters
If there was one area in which field investigators
were particularly remiss in gathering information, it
was in debriefing final possesso~s on the circumstances
surrounding their purchase of stolen typewriters. Many
final possessors, as might be expected, were stricken
with sudden lapses of memory when asked to reconstruct
the events surrounding their acquisition of a stolen
typewriter. Others gave explanations the credibility
of which should have been, but never was, questioned by
investigators. Far too often, then, information about
the purchase transactions for stolen typewriters was
either unavailable or of such questionable validity that
it could not be used. This was despite the f~cts that
tll the most frequent possessors of such items, businesses,
must maintain purchase records for tax purposes; and
(21 field investigators had a legal right to seize not
, , . ,
1
? , i' , . , .
i-
f 1 il
I ! \ I
I ! I I
j I'
I I~. ! '(, { ;~
I~ 1 I

'i
90
only the stolen machine but also the records that would
document its purchase.
The substantial loss of information in this portion
of the project was particularly disappointing since one
of the most attractive aspects of the matching technique
used here is its capacity to permit law enforcement to
trace backwards from the point of final consumption to
the theft and fencing networks supporting office equipment
thievery. In spite of the frequent loss of information,
however, some ... ... useful ~ns;ghts into how stolen typewriters
are redistributed was revealed in th'e project and these
findings are summarized here.
Inquiry into the circumstances surrounding purchase
transactions centere on our e erne . d f 1 nts · the type of
seller (whether an individual or a business) from whom
the machine(s). had been purchased: where/how the purchase
was made: how much was paid for the item(s); and how pay-
ment was made._
Information about the type of seller was available for
175 cases. From these cases the majority of final con-
sumers (58 percent) reported having purchased stolen
typewriters from individuals, tTith 42 percent reporting
businesses as having been the sellers of such items.
While business and professional firms, a,s might be expected,
frequently reported purchasing typewriters thrOU,gh businesses,
a sizeable number r~ported making typewriter purchases from
,0' "b,
~,
. .
"
91
individuals. In fact, of the 100 business possessors
of stolen typewriters, 54 percent reported buying those
machines from individual sellers rather than business
entities. Information about the type of seller was
available for 40 professional firms, 60 percent of which
reported purchasing the typewriter in question from an
individual, while only 40 percent had done so through a
commercial entity.
Inquiry was also made to determine Where/how the
purchase had taken place. Here information was available
for 101 cases. Of these, the purchase of a stolen type
writer was most often reported to have taken place through
an office equipment wholesaler or retailer (39 percent of
the cases). The next most frequent setting for purchase
transactions was at the purchaser's office or job site,
with 28 percent of the final consumers reporting the pur
chase of the typewriter in question from an individual
who carne to their offices selling such items. "Through
a friend" was the third most frequent method by which
stolen typewriters were reportedly purchased, indicated in
17 percent of the cases. Not surprisingly the name of
this "friend" and/or his or her current whereabouts were
gen~rally "not known" by possessors of stolen typewriters.
In ei'ght percent (8 percent) of the cases, possessors of
stolen typewriters reportedly purchased them by responding
to advertisements in newspapers. Especially important
It i 1 II 1/ If II t! "l /,1 ,( it Ii ;r 11 Ii d 1/ /, II I' II
/1 jl
If ,1 i1
f I f i 1
~ ~ ff
i
I I 11 I
f!
~ 1 j l
-!
II ! it ~ -j
'.1
1, !
, f ~
i >! \ 1
, 1 \
It (1 , [~ ". '. ~ ~, ,'{
~ 11_" ;

92
here were the booklet-type newsletters devoted solely to
advertisements of goods wanted and goods for sale. Fin-
ally, in about six percent (6 percent) of the cases pur-
chases of stolen typewriters were made through second-
hand stores, outlets much less prominent as sellers of
such items than conventional wisdom often suggests.
Table 12 below disaggregates the settings in which
purchases of stolen typewriters were made according'l::o
the type of setting in which the typewriter was located.
As can be seen, while professional and business firms
were more likely to have purchased stolen typewriters
through office equipment wholesalers/retailers than from
any other single source, approaches by individuals at
business or professional offices or by "friends" were
also frequent sources of supply.
The project was also interested in determining how
much possessors of stolen typewriters' had paid for these
items. Information on amount paid was ,available in 124
cases. Tf,le average amount paid for a stolen typewriter
was $409. When, it is realized that IBM typewriter models
average in cost anywhe~e from $500-$1 , 000, with the current
selectric model the most popular at $800, then current
possessors were purchasing stolen machines for about one
half to two t:hirdsthe legitimate retail price. While it
is impossible to ini:er culpability on the part of current
possessors on the sole basis of the price paid, this
,.,' " ," r',
'" ~" '"
.,~
'<, •
• .,...... .~ '1 ,",,:.
I I
"
--- - --,.,----~
\
' '
'1
... :" .
'0
""";'
/1
',. ,j,
/r I
,
\
/'
\
'\
."
.\
,
" o -'

.- '\
"
, '
.' /'
7 I .-
TYPE OF SET'fING WHERE
TYPEWRITER LOCATED
Residence
Professional Office/Firm
Business Establishment
Government , Agency/Institu-tion
Private Organi-zation/Associa-tion
Other
TOTALS FOR PURCHASE SETTINGS'
. " .. ",' , "
TABLE 12
TYPE OF SETTING WHERE PURCHASE WAS MADE, BY TYPE OF SETTING WHERE
STOLEN TYPEWRITER WAS LOCATED, N = lOl
# OF TYPEWRITERS PURCHASED IN EACH TYPE OF Off~ce Equ~pment Through
Wholesaler/ At Office Through a 1-1edia Retailer or Jobsite 'a Fri'end' Advert.
2 5 4 3
l4 4 7 1
20 .l8 6. ,3.
2 l - -
1 - - --" .,
- - - 1
39 (35%) 28 (28%) 17 (17% ) 8 (8%)
.. /
J. ' •
j' .•
I !
,
\
SETTING Second- '
hand Pawn- At a DeaJ.eJ;' shop Bar
2 - -
- - 1
3 2 -
- - -
1 - -
- - -
\ 6 (6% ) 2(2%) 1(1%)
I

~-------------------------
94
information do~s lead one to question whether the possessors <-' .' ..
were adequately suspicious of the "bargain" prices they
were quoted for the typewriters purchased.
In 95 cases, information was also available on how
payment for the typewriter was made. In 62 percent of
these cases payment was made by check, with cash transactions
occurring in 35 percent of the cases, and purchases made in
installments in three percent (3 percent) of the cases.
The level of transactions by check may seem surprising and
mitigate somewhat the inference of culpability on the part
of most purchasers. However, a fairly common practice
reported by current possessors was to be asked to write a
check for cash in payment for the typewriter, a practice
which most said they did not think "suspicious" and with
which ,they willingly obliged.
Investigation of the circumstances surrounding the
purchase of stolen typewriters reveals a marketplace
(1) commercial office dominated by ,two types,of sellers:
(2) , d' ·'d 1 sellers who approach equipment firms: and ~n ~v~ ua
. 1 buyers as "friends" or at their offices or job, potent~a,
What is also revealed is a failure on the part of sites. buyers of stolen typewriters to question such transactions
even when the pri.ce quoted represents a significant mark
down from the legitimate pri'ce or when asked to make pay
ment in cash or by writing a check to cash.
, .
I I
D.
95
Special Inquiries into the Movement of Stolen Typewriters'within the State of California
Because of field verification efforts undertaken
by the project in the State of California, it was pos
sible to chart the movement patterns of stolen typewriters
in California's domestic marketplace in greater detail
t~an could be done for other jurisdictions in the national
analysis provided in Pa~t I of this report. Based upon a
sample of 714 cases, both the geographic mobility of
stolen typewriters within the state and the mileage log
ged by them were calculated. Separate calculations were
made for typewriters stolen from northern as opposed to
southern California jurisdictions since there was some
suspicion that distinctive movement patterns might be
revealed.
Table 13 below depicts the geographic mobility of
stolen typewriter~ fOr all jurisdictions in California.
Of particular interest is the finding that most stolen
typewriters remain very close to home for resale and re
distrioution. Indeed, a full third of the typewriters
in the sample were resold in the same jurisdiction where
they were stolen, and more than two thirds remained within
the same county! This finding tends to confirm the specu
lation made earlier that a boo,ming market "around the
corner" obviates the need and/or th,e inclination for traf
fickers of stolen goods to transpor~ items any great
I .

, I'
., .
96
TABLE 13
THE GEOGRAPHIC MOBILITY OF TYPEWRITERS STOLEN IN CALIFORNIA AND REMAINING IN STATE
N = 714
NUMBER OF TYPEWRITERS~ % OF SAMPLE
MOBILITY PATTERN EXHIBITING MOBILITY EXHIBITING PATTERN MOBILITY PATTERN
Typewriter remain-ed in same town/ 237 33% city where theft occurred
Typewriter re-mained in same 258 36% county where theft occurred
Typewriter was located in a county adja- 108 15% cent to one where theft occurred
Typewriter moved further 16% away than to 111 an adjacent county
. \'
~, ..
\
, '
./" ./ t
. 97
distance. Thus, only 16 percent of thE:! stolen type
writers in the sample had moved further away from the
scene of the original theft than the same or an adjacent
county.
Table 14 presented here disaggregabes the figures
shown in Table 13 above, comparing the geographic
mobility of typewriters stolen from northern versus
southern California jurisdictions. Here slightly differ
ent patterns of mobility can be observed· for goods stolen
in each region of the state. Thus, typewriters stolen
from northern California were twice as likely as their
southern California counterparts to be moved for resale
to a location further away than an adjacent county_
Similarly, while 60 percent of the typewriters stolen in
northern California are resold in the same town or" county
where the theft occurred, a full 75 percent of the type-
writers stolen in southern California exhibit this pattern.
Overall, however, the general finding remains that most
stolen typewriters have limited geographic mobility
within the state.
Given this limited geographic mobility, it should not
be surprising to find in Table 15 below that the mileage
lo~ged by most stolen typewriters was not very substantial.Indeed, fo
Indeed, for all jurisdictions a full 90 percent of stolen
typewriters remained within lOO"mi1es of the place where the
theft occurred, wi.th southern California typewriters being
slightly more likely than their northern counterparts (91 per-
cent versus 87 percent) tOGO so. Also apparent in Table 13
,.-,-~"~~~"""--~.-~"~-~~~~.,,,".~-- -~ .~~ > ". ~ • ..---.. .,...-............... "-.~- ~""--~''''''--~<' . -[)
I
j j
I

... "
. ,
"'''-10 "'-.." ,
:
. , .
MOBILITY PATTERN
Typewriter remained in same town/city where theft occurred
Typewriter remain-ed in same county where theft occurred
Typewriter was loca-ted in a county adjacent to one where theft occurred
Typewriter moved further away than to an adjacent county
TOTALS FOR SUBSETS
.-
. , . . .
--~--- -.-- . -------------
TABLE 14
THE GEOGRAPHIC MOBILITY OF TYPEWRITERS STOLEN FROM NORTHERN VERSUS SOUTHERN
CALIFORNIA JURISDICTI~NS, N = 714
NORTHERN CALIFORNIA JURISDICTIONS SOUTHERN CALIFORNIA JURISDICTIONS if in Subset % of Subset # in Subset % in S,ubset
Exhibiting Pattern Exhibiting Pattern Exhibiting Pattern ExhibitingiPattern
-106 41% 131 29%
49 19% 209 46%
-43 17% 65 14%
-59 23% ·52 11%
257 100% 457 100%
, .
.' .. , .
,
"-
\
I ~ 1/
n " II
II !( 'I
!l )1 Ii If q 11
'I II lJ II
I 1\ Ii d rt l! ~ ,I
i ~
\
II
"
-

· .
'. (
.-
~~.------
----------,~-
TABLE 15
DISTANCES LO~GED BY TYPEWRITERS STOLEN AND REMAINING IN CALIFORNIA, INCLUDING ALL JURISDICTIONS AND THE NORTHERN AND SOUTHERN CALIFORNIA
SUBGROUPS, N = 714
ALL CALIFORNIA NORTHERN CALIFORNIA SOUTHERN CALIFORNIA JURISDICTIONS JURISDICTIONS JURISDICTIONS
DISTANCE LOGGED # of Machines % Machines * in Subset % of Subset # ~n Subset % of Subset IN MILES at.Distance at Distance at Distance at Distance at Distance at Disuance
Typewriter traveled 100 miles or 640 90% 225 87% 415 91% less
Typewriter traveled 101-250 miles 30 4% 7 3% 23 5%
Typewriter traveled 251-500 miles 34 .5% 17 7% 17 4%
Typewriter traveled 501-1,000 miles 10 1% 8 3% 2 0.4%
_. JURISDICTION
TOTALS 714 100% 257 100% 457 100+%
1 \ I
~~~~~~~_~~------7~----~~---______ ~ ____ .~_1 ,?- I.
() ,. ~~. ""i:
.'
,
\
\
[t ,

_------------~--- ________ --c------ ---
.,
". ! -,- l ,~ t
,j - ~ \~
,-----.
100
is the point noted earlier that northern Californ.i.a
typewriters show a slightly greater tendency to move
further away from the location of the original theft
than is the case with those stolen in southern Cali-
fornia. Thus, 10 percent of the northern California
typewriters were located at a distance greater than
250 miles from the point of the originq.l theft, .a char-
acteristic true of just over 4 percent of southern
California machines.
Perhaps because of the short distances traveled
by most stolen typewriters, the elapsed time between
the original theft and the purchase of a stolen machine
by a final consumer was not on the average very long.
It should be noted 'chat this finding is based on very
'-"'
little information ,since the date of purchase was another
area in which possessors of stolen typevlrit,ers ha.d 'faulty
memories that remained uncr.a.llenged by investigators.
. Nevertheless, it is of some interest to review the time
between the date of the theft and the date of purchase
found in Table ],6 below. As can be seen, 21 percent of
the sample typewriters had been resold to neW owners
within the first three days after the theft teok place;
and a total of 52 percent were redistributed within a
month of the theft. On the other hand, a 'sizeable number . -
of machines (27 percent) took as 'long as six months to
be resold. still nearly all machines (92 percent) had
\ __ ~._--:? ....... __________ --,"--.."....--...,----c-: ... -~, - - .... -~----"""./-~-.,;;;~.-." . Y::.-' .y./ . "~'A" ')'" .:!: ~ • ~ , • ,~. ~' ---}
-~! '. '~ .. ,-
I
(~)
.,-)
"
.t ,,0;' •
~~~
, .
I ./
101
TABLE 16
ELAPSED TIME BETWEEN THE DATE OF THEFT AND PURCHASE OF STOLEN TYPEWRITERS BY NEW OWNERS, N = 75
# OF TYPEWRITERS % OF TYPEWRITERS ELAPSED TIME PURCHASED WITHIN PURCHASED WITHIN
ELAPSED' TIME ELAPSED TIME
Within 3 days of theft 16 21%
. Between 3 and 7 days of theft 11 15%
1--'-'
Between one \'leek and one month after 12 16%
theft .
Between one and six months 20 27%
~ after theft·
Between six months and one year 10 13%
after theft --
More than one year after 6 8% theft
- ---------- -" - --
\
f

' . .
102
reached final consumers within a year of the theft.
This is an important point since it means that most
leads generated using the mat.Qhing technique will be
active, viable cases when sent to the field for
investigation.
E. Project Results and Implications
As the foregoing sections make clear, the intensive
field investigation efforts undertaken in the state of
California permit a more detailed analysis of the distri
bution patterns for stolen office equipment in tha~ juris
diction than was possible at the national level where no
tield verification or investigation had occurred. On the
basis of the information available, a comprehensive pic
ture could be drawn of the persons, places and events
involved in the theft, redistribution and consumption of
stolen office equipment. Below the major elements of this
d ' d through the proJ'ect are restated and picture ~scovere
their implications discussed. It is worth noting here~
however, the accomplishments of the project and what
these have meant for the citizens of California.
From the time the California Department of Justice
began comparing IBM repair records with the statewide
Automated Property .system file of s,tolen office equipment
<.a time whic}:J, partially predates ~he project), a ~otal of
5,000 leads on stolen typewriters have been transmitted
.-/
103
to the field for investigation. Of these, some form of
field response has been received and processed by DOJ
on approximately 2,500 leads. Another 400 leads have been
followed up and await processing, and th~ remainder (many of
which involve interstate investigations) are still being
worked in the field.
On the basis of the leads already investigated and
processed, law enforcement agencies have recovered a
'total of 2,100 stolen typewriters, valued at approxi
mately $1,260,000. From the point of vlew'of the people
of California, it should ,be recognized that in the absence
of this special effort it is unlikely that any of these
stolen typewriters would have been recovered. Thus,
Califor.nia citizens have received a net gain of over one
million dollars worth of recovered stolen goods. Or,
looked at another way, traffickers and purchasers of
stolen office equipment have lost the benefit and use of
$1.25 million worth of stolen merchandise!
Further testimony:, to the impact of the project is
the fact that in the period since its inception the theft
rate for office equipment has increased 1.8 percent over
the preceding base period.~ The recovery rate for
stolen office equipment, however, has in this same period
increased a whopping 22.7 percent! Thus, while incentives
to steal office equipment have risen very slowly, the
* ' -'The year 1976 is used as the base period.
.\
f

'. , '-.
; " I !
1
j \
1 I" ~
"
104
disincentives in the marketplace for stolen typewriters
have increased substantially. Table 17 below summarizes
and highlights these,project accomplishments.
TABLE 17
SUMMARY OF ACCOMPLISHMENTS: CALIFORNIA TYPEWRITER RECOVERY PROJECT
Total number of leads on typewriters stolen in California developed by the project
Total number of Field Investigations initiated and processed by the California Department of Justice
Total number of stolen typewriters recovered from leads already processed
Value of stolen typewriters already recovered
Percentage change in Theft Rate for stolen office equipment since project inception, over base period
Percentage change in Recovery Rate for stolen office equipment since project inception, over base period
5,000
2,500
2,100
$1.26 million
+1.8%
+22.7%
But beyond the specific accomplishments of the pro
jecj; noted here.' perhaps even more important to the people
of California is the greater understanding the law enforce
ment community has gained of how, where, and by whom stolen
office equipment is stolen, fenced and consumed in the
state.. This enhanced undeJ;:'standing, the details of which
are noted below, will enable California law enforcement
authorities to better deploy their resources inord~r to'
further inhibit the marketplace for stolen typewrit~rs.
'\ '
.f ! I ~.
I ,I' i I ..
-'._-"""""""" ''''''''-'''''--,,"'' .,."-,~,_",,,I
, .
,/
105
The analysis of typewriter thefts conducted by the
project made clear how serious a crime problem such
thefts are ~or many California citi.zens, and in parti
cular for the business and professional communities, and
for public sector agencies and institutions •. These
groups are most directly impacted by this type of theft
because they are its most frequent victims. The total
losses sustained by victims ,of typewriter theft exceeded
$2.3 million, with an average per victim at $2,461. Fur
ther enhancing the seriousness of this form of theft is
the fact few such crimes appear to be solved through tradi
tional enforcement responses. Thus, of the cases reviewed
by the project, only 1 percent had been cleared by arrest;
and recoveries of the property stolen had been made in
only 3 percent of the cases. Analysis of typewriter thefts
reveals~ then~ a serious crime problem which results in substantial
losses sustained by victims~ 'but which cannot be eff@ctively con
trolled through traditional enforcement measures.
The description of the settings in which stolen type
writers were located revealed by the project confirmed the
view that. such items are not redistri.buted on street corners
or through a small number of shady entrepreneurs. Rather,
most stolen typewriters re-emerged in the same types of
commercial, professional and public stettings from which'
tney had been stolen. Thus, the market for stolen office
equipment is comprised of the same segments of the society
,

106
which are the most T'Fequent victim~ of office equipment
thefts. What is abundantZy cZear is that so Zong as business ,
and professionaZ firms .. and pubUc agencies and institutions .. con
tinue to serve as wiZZing purchasers and/or convenient outZets for
stoZen office equipment.. they wiU continue as weU to sow the
seeds of their own victimization.
Analysis of the circumstances surrounding the pur
'chase of stolen typewriters revealed that the majority
of final consumers of such items identified the seller as
an individual rather than a business. They further re-
ported that they were most frequently approached by such
individuals at their offices or job sites. Of the 42 per
cent of the final consumers studied who repo~ted ~u~~has
ing stolen typewriters from a business, the most. frequent
business sellers noted. were office equipment wholesalers
and retailers. Two disturbing aspects of the marketplace
are revealed in these findings. First, traffickers of
,stolen typewriters demonstrated little reluctance to per-
sonally visit legitimate business and professional estab
lishments for the purpose of selling stolen goods .. This
suggests perhaps a certain amorality to the purchase
12ractices o£ such firms. Second, the involvement of
office .eguipment firms in the illicit trafficking in
stolen ty'pewriters s~ggests a large "quasi..-legitimate"
component to this marketplace which represents a serious
law enforcement challenge. Finally, while the culpability
-~~---,,---'-~- ~----
" .
---------
107
of most final consumers of stolen typewriters cannot
properly be established from the data system records, the
fact that many had paid on the average one half to two
thirds of the legitimate market price for the typewriters
they bought suggests more guilty knowledge on their part
than they might ever be willing to admit. Once again ..
there is ZittZe doubt that untiZ such potentiaZ victims of type
writer thefts stop suppZying a.~arket for such items .. they wiZZ
continue to enhance their chances of becoming actuaZ·victims.
A review of timing and movement patterns for stolen
office equipment in the state of California demonstrates
just how fleeting are the transactions in the stolen
property marketplace starting with the original theft and
leading up to the resale of stolen goods to a final con-
sumer. It also shows how fragile is the audit trail of a
property crime, end how difficul t--if not futile--i t may be
to attempt to preserve this trail using traditional enforce-
ment approaches. The matching technique used here permits
re-establishment of this audit trail, once broken, and re
construction of the persons, places, and events involved
in the theft and redistribution of stolen goods. without
such a technique, the enforcement activities of this pro
ject could not have taken place, nor would it have been
possible to paint as clear a picture of the market for
stolen office equipment presented here.
{rU.S. GOVERNMENT PRINTING OFFICE. '1979-281-380/1570 ,

------------------,--- --
'-.
/. "
.-
,
.' '<, ,~
/ '/ ~
, .-
\ . ,I
'I !