Embed Size (px)
Citation preview

ADMS2320.com
We Make Stats Easy.
Chapter 1 Tutorial Length
15 Minutes
ADMS2320.com | Tutorials | Past Tests

In this chapter we get an overview of some basic terminology and concepts.
How to use ADMS2320.com
The goal of this website is to quickly and efficiently make you understand all the major concepts. We have many years of experience tutoring students for ADMS 2320 and we have a pretty good idea of what you need to concentrate on in order to do well.
Each chapter, we will go through theory and then apply that theory through multiple choice and short answer questions. We attempt to make our videos quick and to the point. As such, it is a good idea to always review your class notes and textbook readings to go over additional topics and examples.
Note: Not all theory is covered prior to answering practice questions. Some theory is taught while answering questions in order to put the theory into immediate practice. Make sure to go through all the videos in a given chapter.
Chapter 1 Note
Chapter 1 Page 1
ADMS2320.com
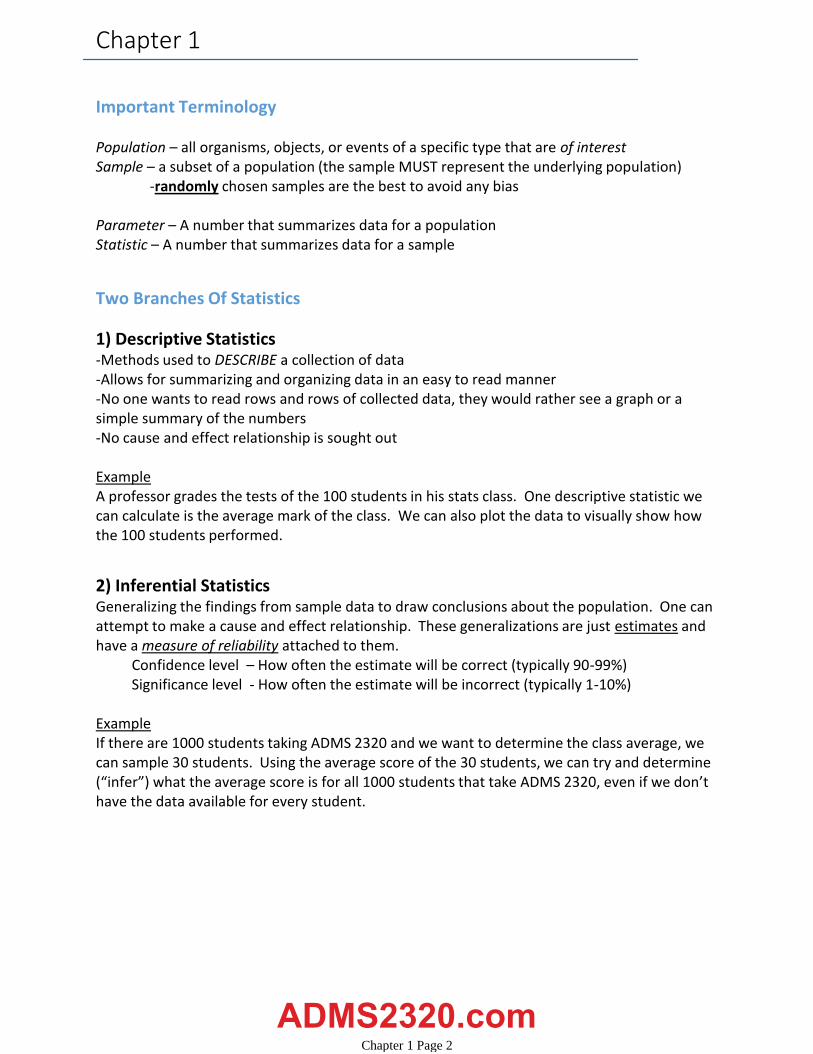
Two Branches Of Statistics
1) Descriptive Statistics-Methods used to DESCRIBE a collection of data-Allows for summarizing and organizing data in an easy to read manner-No one wants to read rows and rows of collected data, they would rather see a graph or a simple summary of the numbers-No cause and effect relationship is sought out
Example A professor grades the tests of the 100 students in his stats class. One descriptive statistic we can calculate is the average mark of the class. We can also plot the data to visually show how the 100 students performed.
2) Inferential Statistics
Confidence level – How often the estimate will be correct (typically 90-99%)Significance level - How often the estimate will be incorrect (typically 1-10%)
Generalizing the findings from sample data to draw conclusions about the population. One can attempt to make a cause and effect relationship. These generalizations are just estimates and have a measure of reliability attached to them.
ExampleIf there are 1000 students taking ADMS 2320 and we want to determine the class average, we can sample 30 students. Using the average score of the 30 students, we can try and determine (“infer”) what the average score is for all 1000 students that take ADMS 2320, even if we don’t have the data available for every student.
Important Terminology
Population – all organisms, objects, or events of a specific type that are of interest
-randomly chosen samples are the best to avoid any biasSample – a subset of a population (the sample MUST represent the underlying population)
Parameter – A number that summarizes data for a populationStatistic – A number that summarizes data for a sample
Chapter 1
Chapter 1 Page 2
ADMS2320.com

1. From the 1500 students that attend City College, 100 students are randomly selected. The average GPA of the 100 students is 3.3. What branch of statistics is applied if we wish to use this information to estimate the GPA of all 1500 students?
A) Random SamplingB) Descriptive StatisticsC) Population statisticsD) Inferential Statistics
3. GE has developed a new lightbulb whose average lifetime is currently unknown. Technicians on the assembly line have randomly selected 200 light bulbs and found the average lifetime to be 7 years. The 200 light bulbs represent a:
A) StatisticB) SampleC) PopulationD) Parameter
4. GE has developed a new lightbulb whose average lifetime is currently unknown. Technicians on the assembly line have randomly selected 200 light bulbs and found the average lifetime to be 7 years. The 7 years represent a:
A) StatisticB) SampleC) PopulationD) Parameter
2. From the 1500 students that attend City College, 100 students are randomly selected. The average GPA of the 100 students is 3.3. In this case, the ____ students make up the population.
A) 100B) 3.3C) 1500D) None of the above
5. Numbers that summarize population data are called:
A) StatisticsB) SamplesC) Population SummaryD) Parameters
6. Numbers that summarize sample data are called:
A) StatisticsB) SamplesC) PopulationsD) Parameters
Multiple Choice
Chapter 1 Page 3
ADMS2320.com
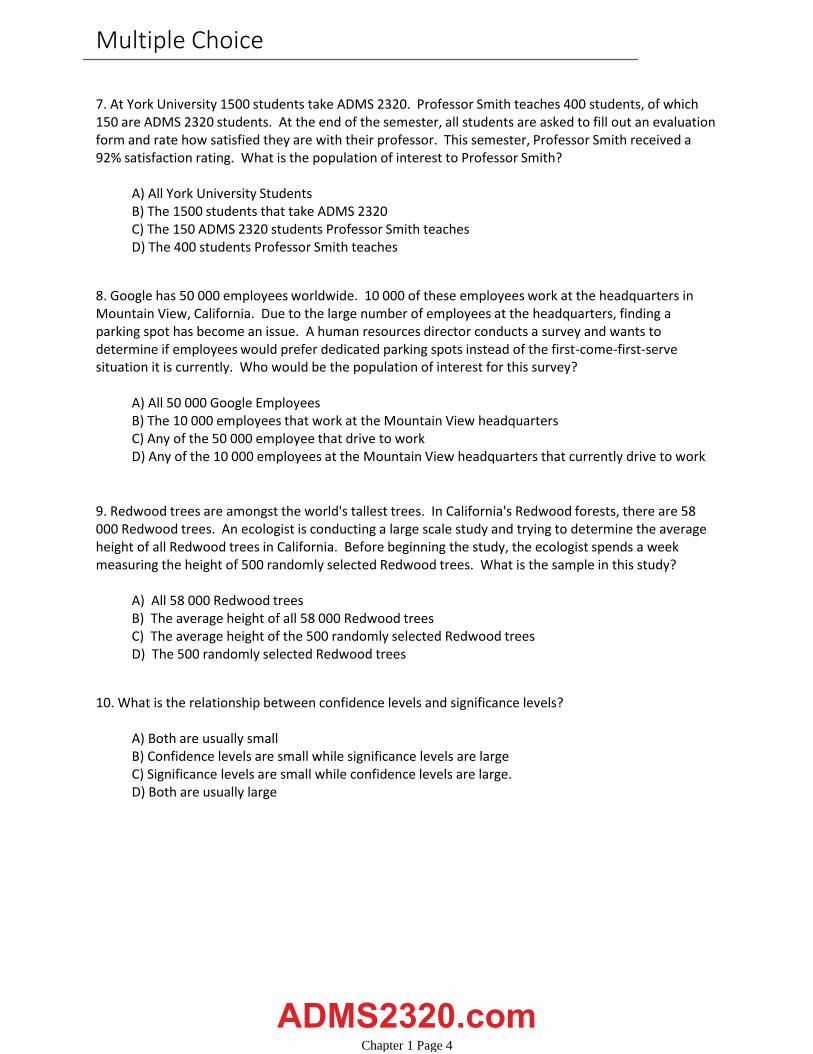
7. At York University 1500 students take ADMS 2320. Professor Smith teaches 400 students, of which 150 are ADMS 2320 students. At the end of the semester, all students are asked to fill out an evaluation form and rate how satisfied they are with their professor. This semester, Professor Smith received a 92% satisfaction rating. What is the population of interest to Professor Smith?
A) All York University StudentsB) The 1500 students that take ADMS 2320C) The 150 ADMS 2320 students Professor Smith teachesD) The 400 students Professor Smith teaches
8. Google has 50 000 employees worldwide. 10 000 of these employees work at the headquarters in Mountain View, California. Due to the large number of employees at the headquarters, finding a parking spot has become an issue. A human resources director conducts a survey and wants to determine if employees would prefer dedicated parking spots instead of the first-come-first-serve situation it is currently. Who would be the population of interest for this survey?
A) All 50 000 Google EmployeesB) The 10 000 employees that work at the Mountain View headquartersC) Any of the 50 000 employee that drive to workD) Any of the 10 000 employees at the Mountain View headquarters that currently drive to work
9. Redwood trees are amongst the world's tallest trees. In California's Redwood forests, there are 58 000 Redwood trees. An ecologist is conducting a large scale study and trying to determine the average height of all Redwood trees in California. Before beginning the study, the ecologist spends a week measuring the height of 500 randomly selected Redwood trees. What is the sample in this study?
A) All 58 000 Redwood treesB) The average height of all 58 000 Redwood treesC) The average height of the 500 randomly selected Redwood treesD) The 500 randomly selected Redwood trees
10. What is the relationship between confidence levels and significance levels?
A) Both are usually smallB) Confidence levels are small while significance levels are largeC) Significance levels are small while confidence levels are large.D) Both are usually large
Multiple Choice
Chapter 1 Page 4
ADMS2320.com