Embed Size (px)
Citation preview
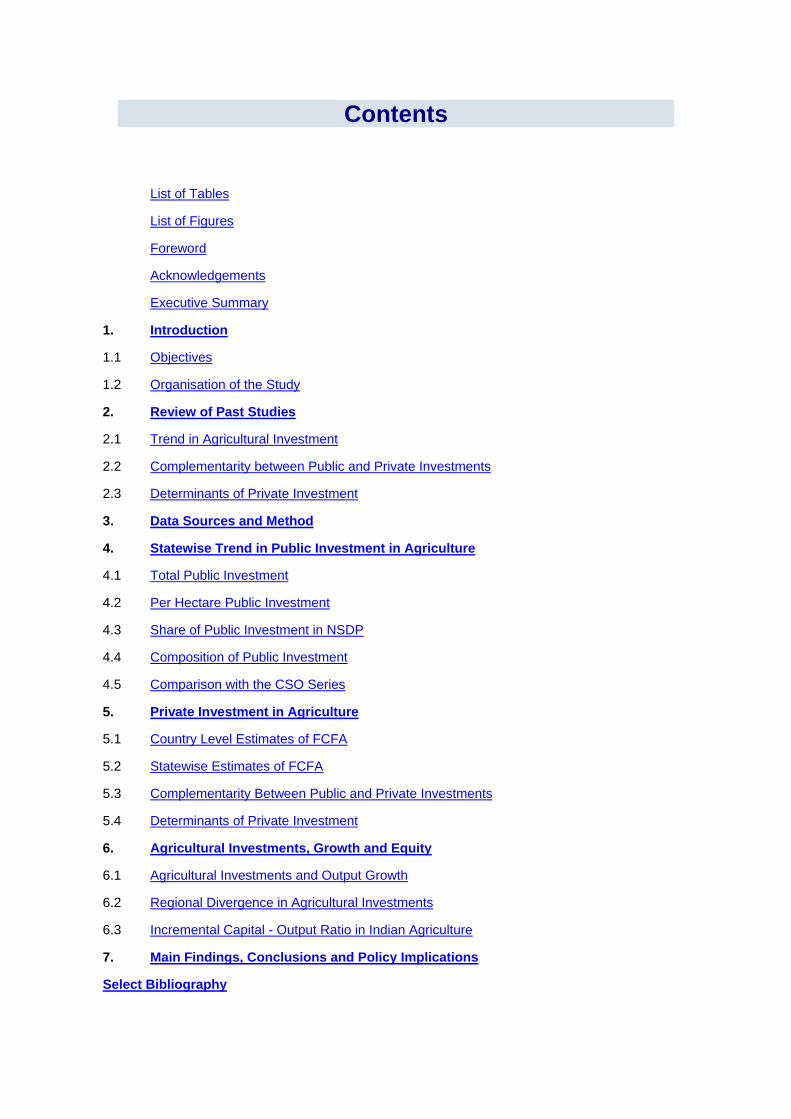
Contents
List of Tables
List of Figures
Foreword
Acknowledgements
Executive Summary
1. Introduction
1.1 Objectives
1.2 Organisation of the Study
2. Review of Past Studies
2.1 Trend in Agricultural Investment
2.2 Complementarity between Public and Private Investments
2.3 Determinants of Private Investment
3. Data Sources and Method
4. Statewise Trend in Public Investment in Agriculture
4.1 Total Public Investment
4.2 Per Hectare Public Investment
4.3 Share of Public Investment in NSDP
4.4 Composition of Public Investment
4.5 Comparison with the CSO Series
5. Private Investment in Agriculture
5.1 Country Level Estimates of FCFA
5.2 Statewise Estimates of FCFA
5.3 Complementarity Between Public and Private Investments
5.4 Determinants of Private Investment
6. Agricultural Investments, Growth and Equity
6.1 Agricultural Investments and Output Growth
6.2 Regional Divergence in Agricultural Investments
6.3 Incremental Capital - Output Ratio in Indian Agriculture
7. Main Findings, Conclusions and Policy Implications
Select Bibliography
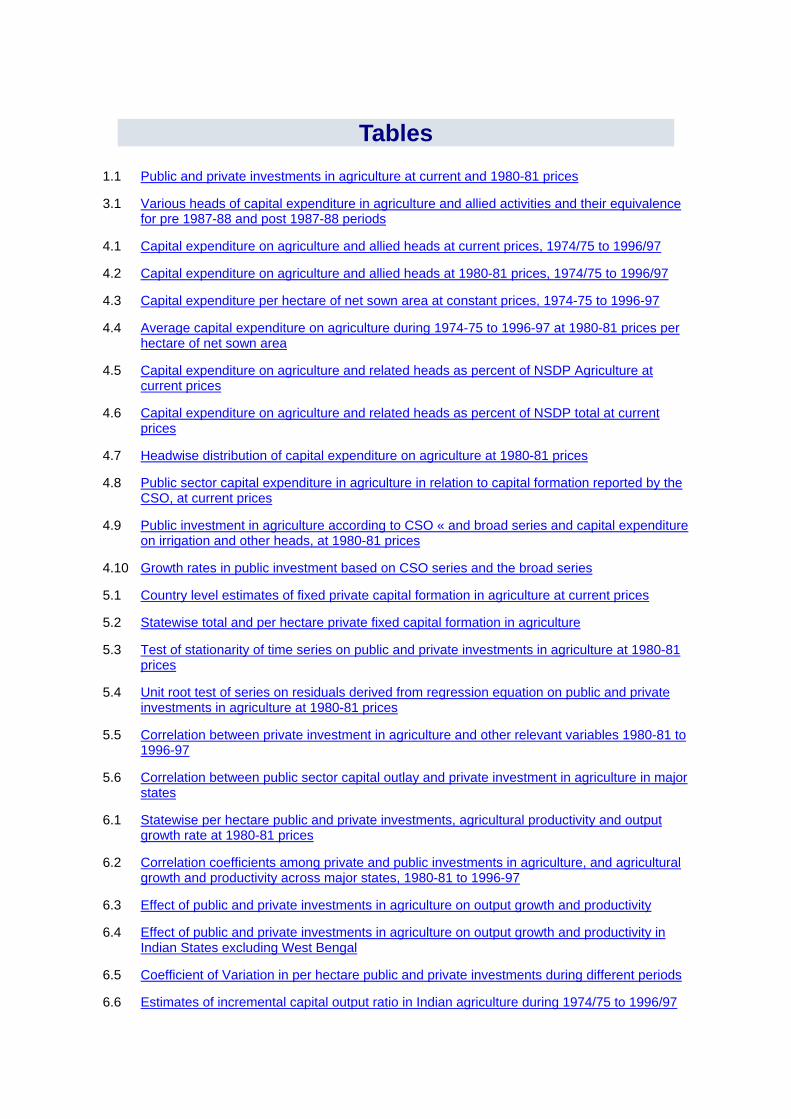
Tables 1.1 Public and private investments in agriculture at current and 1980-81 prices
3.1 Various heads of capital expenditure in agriculture and allied activities and their equivalence for pre 1987-88 and post 1987-88 periods
4.1 Capital expenditure on agriculture and allied heads at current prices, 1974/75 to 1996/97
4.2 Capital expenditure on agriculture and allied heads at 1980-81 prices, 1974/75 to 1996/97
4.3 Capital expenditure per hectare of net sown area at constant prices, 1974-75 to 1996-97
4.4 Average capital expenditure on agriculture during 1974-75 to 1996-97 at 1980-81 prices per hectare of net sown area
4.5 Capital expenditure on agriculture and related heads as percent of NSDP Agriculture at current prices
4.6 Capital expenditure on agriculture and related heads as percent of NSDP total at current prices
4.7 Headwise distribution of capital expenditure on agriculture at 1980-81 prices
4.8 Public sector capital expenditure in agriculture in relation to capital formation reported by the CSO, at current prices
4.9 Public investment in agriculture according to CSO « and broad series and capital expenditure on irrigation and other heads, at 1980-81 prices
4.10 Growth rates in public investment based on CSO series and the broad series
5.1 Country level estimates of fixed private capital formation in agriculture at current prices
5.2 Statewise total and per hectare private fixed capital formation in agriculture
5.3 Test of stationarity of time series on public and private investments in agriculture at 1980-81 prices
5.4 Unit root test of series on residuals derived from regression equation on public and private investments in agriculture at 1980-81 prices
5.5 Correlation between private investment in agriculture and other relevant variables 1980-81 to 1996-97
5.6 Correlation between public sector capital outlay and private investment in agriculture in major states
6.1 Statewise per hectare public and private investments, agricultural productivity and output growth rate at 1980-81 prices
6.2 Correlation coefficients among private and public investments in agriculture, and agricultural growth and productivity across major states, 1980-81 to 1996-97
6.3 Effect of public and private investments in agriculture on output growth and productivity
6.4 Effect of public and private investments in agriculture on output growth and productivity in Indian States excluding West Bengal
6.5 Coefficient of Variation in per hectare public and private investments during different periods
6.6 Estimates of incremental capital output ratio in Indian agriculture during 1974/75 to 1996/97

Appendices
4.1 Percent share of different states in All India capital expenditure on agriculture
5.1 Public and private capital formation in agriculture as per CSO and the broad series and other relevant variables.
5.2 Statewise private and public investment in agriculture and other relevant variables, Rs./hectare
Figures
1.1 Public, private and total investment in agriculture at 1980-81 prices based on CSO series
4.1 Per hectare public sector capital expenditure on agriculture public sector investment in agriculture as per CSO and as per the broad series at 1980-81 prices
4.2 Public investment in agriculture as per CSO and capital outlay on irrigation and other heads at 1980-81 prices
4.3 Public investment in agriculture as per CSO and capital expenditure on irrigation and other heads at 1980-81 prices
Foreword Public investment in Indian agriculture has generated considerable debate and interest. The debate lacks on two counts. One, most researchers have been using CSO series on public investment which consists largely of investments in irrigation and does not include such important heads like rural roads, rural electrification and several other items which are relevant and essential for growth and development of agriculture sector. The CSO series has inherent limitations, due to its restrictive coverage which affect further analysis. The present study constructs an alternative series on public investments for agriculture, which includes all major heads related to the development of agriculture. The new series reveals the true trend in investments made for agriculture sector and is more appropriate for studying the impact of public investment on private investments. Two, complete information on public investments in agriculture at state level has been missing. The present study constructs complete series on capital expenditure for agriculture for the last 23 years for each state of India.
The study explores determinants of private agricultural investment since 1980-81, which represent the phase of declining public investment in agriculture. The relationship between indicators of agricultural performance and investments has been analyzed and the implications of emerging trends in public and private investments on agriculture sector have been discussed. The findings of the study provide insights into the importance being accorded for development of infrastructure for 7agriculture and regional disparities in the same. I hope the paper would be useful to both researchers and policy planners as it addresses analytical issues and issues of policy relevance.
The study has been carried out by Dr Ramesh Chand and Ms Sonia Chauhan assisted him in data collection and report preparation. I thank and congratulate both of them for their painstaking effort in completing this work. I thank our peer reviewers Dr G K Chadhha and Dr C Ramasamy for their critical comments on the draft of the study which were immensely useful in improving the quality of the study.
March, 2000 New Delhi
Dayanatha Jha Director
Acknowledgements This study has been undertaken to fill certain gaps in the data and in the research on public and private investments in Indian agriculture. Attempt has been made to construct alternative series on public investment in agriculture for the past 23 years for the whole country and for each state based on capital expenditure incurred on almost all the items meant for agriculture sector. The new series is quite comprehensive and does not pertain to irrigation investment alone, as has been the case with the CSO series. Thus, the new series is more powerful to explore relationships between public and private investments and public investments and agricultural performance. State level series on public investment have been reported by grouping yearly data in Five Year Plan periods. However, yearly data at state level can be provided to interested researchers.
The new series on public investment has been used to address research questions, like, nature of relationship between public and private investments, determinants of private investment at country level and at state level, and impact of public and private investments on agricultural productivity and growth across states.
Most of the data for the study have been collected from the government publications available in the "Ministry of Finance Library" North Block, New Delhi. I am grateful to the staff in the library for their extended help during data collection. I would like to give my special thanks to Ms. Savitri Devi, , in particular, for her enthusiastic help in providing needed publications. We have also consulted NIPFP library and CGO library of Ministry of Finance for getting the research material.
Ms Sonia Chauhan has contributed immensely for the study for which I thank her. I am indebted to Dr Dayanatha Jha, Director, NCAP for the institutional support and facilities provided for this study. Dr Jha also took considerable interest in the progress and results of the study and offered innumerable suggestions for its improvement. Professors B D Dhawan, A Vaidyanathan, Bhupat M Desai and D P Chaudhri and Dr V N Misra offered critical and valuable comments on the study. Due to various limitations it has not been possible for me to address all the points raised by them. I express my deep gratitude to them for the pains they took to read the study results. Dr Nelson Perera provided statistical package and expertise to test relationship between public and private investments. The material in the policy paper format has been set by Ms Umeeta Ahuja and Linu M Philip. I thank both of them.
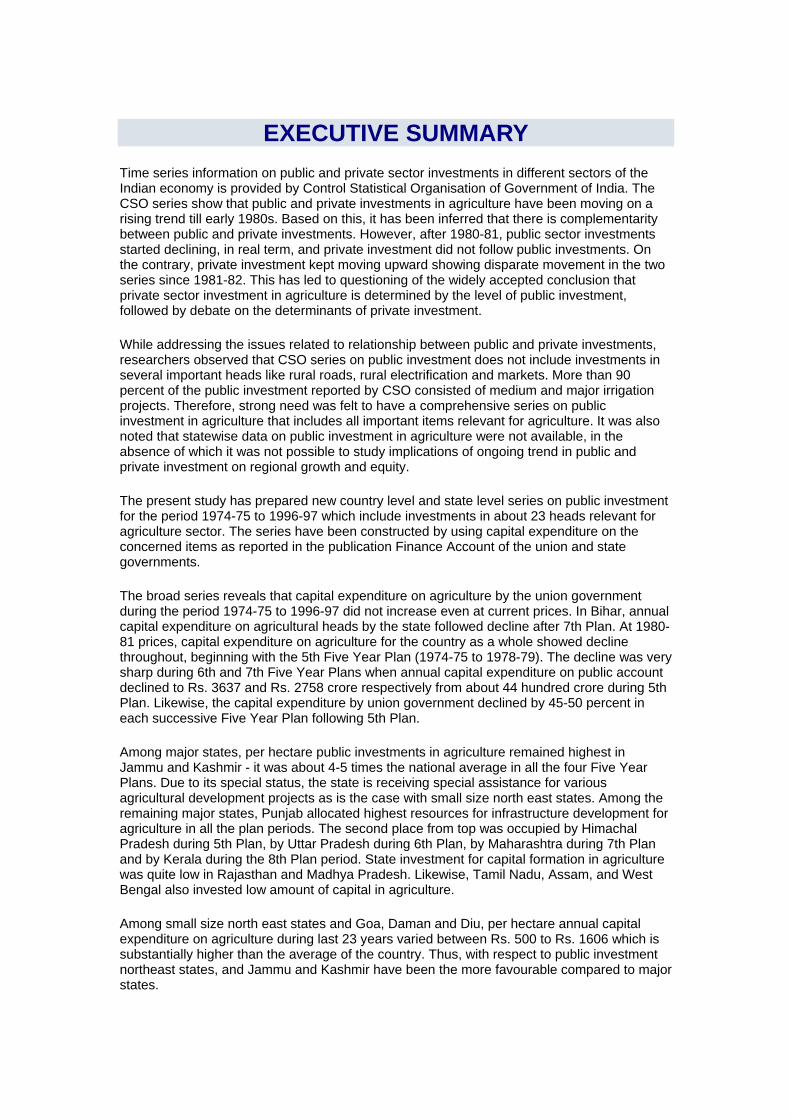
EXECUTIVE SUMMARY Time series information on public and private sector investments in different sectors of the Indian economy is provided by Control Statistical Organisation of Government of India. The CSO series show that public and private investments in agriculture have been moving on a rising trend till early 1980s. Based on this, it has been inferred that there is complementarity between public and private investments. However, after 1980-81, public sector investments started declining, in real term, and private investment did not follow public investments. On the contrary, private investment kept moving upward showing disparate movement in the two series since 1981-82. This has led to questioning of the widely accepted conclusion that private sector investment in agriculture is determined by the level of public investment, followed by debate on the determinants of private investment.
While addressing the issues related to relationship between public and private investments, researchers observed that CSO series on public investment does not include investments in several important heads like rural roads, rural electrification and markets. More than 90 percent of the public investment reported by CSO consisted of medium and major irrigation projects. Therefore, strong need was felt to have a comprehensive series on public investment in agriculture that includes all important items relevant for agriculture. It was also noted that statewise data on public investment in agriculture were not available, in the absence of which it was not possible to study implications of ongoing trend in public and private investment on regional growth and equity.
The present study has prepared new country level and state level series on public investment for the period 1974-75 to 1996-97 which include investments in about 23 heads relevant for agriculture sector. The series have been constructed by using capital expenditure on the concerned items as reported in the publication Finance Account of the union and state governments.
The broad series reveals that capital expenditure on agriculture by the union government during the period 1974-75 to 1996-97 did not increase even at current prices. In Bihar, annual capital expenditure on agricultural heads by the state followed decline after 7th Plan. At 1980- 81 prices, capital expenditure on agriculture for the country as a whole showed decline throughout, beginning with the 5th Five Year Plan (1974-75 to 1978-79). The decline was very sharp during 6th and 7th Five Year Plans when annual capital expenditure on public account declined to Rs. 3637 and Rs. 2758 crore respectively from about 44 hundred crore during 5th Plan. Likewise, the capital expenditure by union government declined by 45-50 percent in each successive Five Year Plan following 5th Plan.
Among major states, per hectare public investments in agriculture remained highest in Jammu and Kashmir - it was about 4-5 times the national average in all the four Five Year Plans. Due to its special status, the state is receiving special assistance for various agricultural development projects as is the case with small size north east states. Among the remaining major states, Punjab allocated highest resources for infrastructure development for agriculture in all the plan periods. The second place from top was occupied by Himachal Pradesh during 5th Plan, by Uttar Pradesh during 6th Plan, by Maharashtra during 7th Plan and by Kerala during the 8th Plan period. State investment for capital formation in agriculture was quite low in Rajasthan and Madhya Pradesh. Likewise, Tamil Nadu, Assam, and West Bengal also invested low amount of capital in agriculture.
Among small size north east states and Goa, Daman and Diu, per hectare annual capital expenditure on agriculture during last 23 years varied between Rs. 500 to Rs. 1606 which is substantially higher than the average of the country. Thus, with respect to public investment northeast states, and Jammu and Kashmir have been the more favourable compared to major states.
All major states and some of the small states show declining trends in the resources spent for infrastructure for agriculture. At country level the series declined annually by 3.16 percent over the chosen period.
A comparison of net domestic product (NDP) from agriculture sector invested for capital formation in agriculture during different Five Year Plan periods shows a steep decline. During early 1980s more than 9 percent of NDP from agriculture was invested back for infrastructure development. During the second half of 1980s resources spent for agricultural infrastructure declined to 7.40 percent of NDP from agriculture. The decline continued during 1990s and current share of resources for capital formation is around 1 /20th of the sectoral output. Contributions from union government for capital formation in agriculture constituted about 1.80 percent of NDP from agriculture during late 1970s which has dwindled to 0.25 percent during the 1990s. Among major states, capital expenditure on agriculture in J&K corresponds to about 1 /4th to 1 /5th of NSDP agriculture in different plan periods which is found highest. Among the remaining major states Maharashtra spent highest proportion of NSDP agriculture (10-18%) on agricultural infrastructure. Agricultural investments on public account in states of Uttar Pradesh and Gujarat exceeded 8 per cent of NSDP during 5th Five Year Plan period. Assam, Bihar, Haryana, Kearala, Rajasthan, Tamil Nadu and West Bengal invested less than 5 percent of agricultural NSDP in the public capital during 5th plan. West Bengal remained at the bottom throughout in respect of agricultural investment. In Bihar, share of public investment in agricultural NSDP dropped from around 6 percent during 1980s to less than 2 percent during the 8th Plan. Though Haryana is agriculturally progressive state, its proportionate allocation of NSDP agriculture for farm investment remained lower than the national average.
For the country as a whole, 4 percent of total national income was spent for infrastructure development for agriculture sector during 5th Plan period. This share kept falling over time and during 8th Plan period less than one and a half percent of national income was ploughed back for capital formation in agriculture.
In the series covering almost all heads of public investment relevant for agriculture, major and medium irrigation projects continued as the dominant item of capital expenditure. Investments in storage and warehousing were the second most important item of capital expenditure with 25-29 per cent share. These two heads account for about 2/3rd of the total capital expenditure on agriculture by states and union government in the country. Crop husbandry was the third important item of capital expenditure during 1974-75 to 1978-79 with about 15 percent share in total capital expenditure on agriculture, however, its importance diminished subsequently. Investment in district and other rural roads with an investment of around Rs. 200 crore turned out to be the third most important item during 7th and 8th Plan periods. Capital expenditure in rural electrification remained below Rs. 10 crore till 1989-90 and increased to Rs. 44 crore per year during 1990s. Importance accorded to create infrastructure for dairy development declined sharply after 5th Plan period. Public capital invested in fertilizer industry was around Rs. 266 crore per year during 5th Plan, Rs. 130 crore during 6th Plan and Rs. 71 crore during 7th Plan. Annual investment in fertilizer industry declined to around Rs. 20 crore during the 1990s. Combined capital expenditure on hill and north - east areas and on other special area programmes has been steadily increasing despite the decline in overall capital expenditure on agriculture.
A comparison of CSO series and the broad series constructed by us shows that the CSO series underestimated the public investment in agriculture to the tune of 52 percent. Capital expenditure on irrigation development consisting of major, medium and minor irrigation works, command area development and flood control comprise about 95 percent of the public investment in agriculture as per CSO during the last 23 years.
The trend in broad series vis a vis CSO series reveals that the decline in former started a little earlier then the latter series. Thus, it is not correct to say that public investment for agriculture which includes all major heads like rural roads, rural electrification, storage, warehousing etc. has not declined even-though CSO series has declined. Further, the rate of decline in capital
expenditure on irrigation and allied heads was lower compared to the rates of decline in capital expenditure on other agricultural heads and in CSO series.
Information on private fixed capital formation in agriculture at country level is furnished by CSO but this information at state level is not available on yearly basis, except for one or two states. State level information on private capital formation in agriculture can be derived from the nation wide surveys conducted at 10 years interval. We have used the information available for the years 1981-82 and 1991-92 from the nation wide surveys to estimate statewise private investments in agriculture. According to the nation wide surveys about 87 percent of fixed capital formation in agriculture (FCFA) came from cultivator households though there is variation in it across sates.
During 1981-82, Punjab ranked at number one in per hectare private investments, but it showed sharp decline in the following decade at constant prices. Kerala, Tamil Nadu, Himachal Pradesh and Haryana were among top states with respect to per hectare private fixed capital formation in agriculture during 1991-92. Private investment per hectare of net sown area was awfully low in Orissa, Bihar, West Bengal and Assam. Rajasthan and Madhya Pradesh recorded very high growth in private investment in agriculture during the decade following 1981-82. In sharp contrast to public investment, capital invested by private sector in agriculture in the smaller states was meager and lower than all major states.
Almost all the past studies have used raw time series to establish relationship between public and private investments. This can give spurious relationship if assumption of stationarity of the series is not satisfied. In this study we have proceeded by applying Augmented Dicky Fuller Test (ADF) to test the time series on public and private investment for their stationarity and then used Cointegration analysis to examine the relationship between public and private investments. The results show that raw series were not stationary. The series at first difference turned out to be stationary. Further analysis shows that there is no long term relationship between the two series. The positive or negative association observed by various researchers between the raw series of public and private investments in different periods is spurious as there is no true long term relationship between the two series.
Private investment in agriculture may be affected by several variables and their interactions. To see the impact of public investment on private investment in the presence of other relevant variables and to find out determinants of private investments the study used CSO series and broad series on public investment at national level. Country level data show that the terms of trade for agriculture and institutional term credit advanced to farmers have positive and significant impact on private capital formation in agriculture. Public investment, both as per CSO and as per the broad series which include all important heads of capital expenditure, did not show positive impact on private investment.
The results based on state level data show that during 1981-82, both public sector investments in agriculture as well as institutional term loans to farmers exerted positive and significant impact on private sector capital formation in agriculture. However, during 1991 -92 public sector capital expenditure ceased to cause significant influence on private sector capital formation.
The relationship of agricultural growth and agricultural productivity with public sector capital expenditure and private sector fixed capital formation has been studied using data for the major states. Both, the public and private investments in agriculture show positive and significant impact on agricultural productivity. However, the impact of public investment on the growth of agricultural output was not significant. On the other hand, impact of private investment on output growth turns out to be highly significant. The impact of total investment on public and private account was positive and significant on both, agricultural growth as well as productivity.
Among various states, West Bengal recorded highest output growth and productivity though agricultural investment in this state was lowest. This was attributed to factors such as

Operation Barga. This also shows that beside public and private investments there are other powerful instruments for agriculture development.
As the agricultural productivity and output growth are significantly affected by the level of fixed farm investment, one way to reduce large interstate inequalities in agricultural development in the country was through balanced allocation of capital expenditure for agriculture. The inequality in public capital expenditure per hectare of net sown area among major states followed decline during 1974-75 to 1991-92 but it showed a sharp increase during the recent years.
The ICOR based on CSO investment series and the broad series indicate that the marginal efficiency of capital in Indian agriculture improved till 1989-90 and deteriorated in the subsequent quinquennium. Compared to the estimates of ICOR obtained by this study the Planning Commission has been using quite lower estimates. Accordingly, sectoral needs for investment in agriculture by Planning commission to attain projected output level were highly on lower side.
The study shows that there is a widespread decline across the board in all the states in public sector capital expenditure for agriculture. The decline is not confined to investment in irrigation projects; it is rather more sharp in other heads related to agricultural development.
The lack of complementarity between private and public investment stands out prominently. Terms of trade for agriculture and flow of institutional credit are found to be the strong determinants of private investments in agriculture. Private investment is found to be more effective than public investment in promoting output growth.
There is a need to examine why public investments have non significant or even negative impact on private investments after early 1980s. It seems the impact of public investment on private investment would vary depending upon type of public investment in different regional settings. AH kind of public investment may not lead to or induce private investment. Some of the private investment in Indian agriculture may be induced by public investment and some may be autonomous. Misplaced priorities and leakages in public investments are the other reasons for lack of inducement effect on private investments.
Importance and role of public investment to create infrastructure and to promote long term agricultural growth should not be undermined by lack of complementarity between public and private investment. However, public investment would be effective in playing this role only if it serves the purpose for which it is created. There are instances when huge investment made in infrastructure in some areas soon ceased to serve its purpose due to lack of maintenance.
The declining trend in public sector agricultural investment should be reversed by increasing allocation in all the major states to check adverse impact on agricultural output. There is also a need to improve efficacy of public investment in agriculture so that it serves the purpose for which it is created. It would be prudent to encourage private investments through institutional credit support and favourable terms of trade for agriculture. In particular, flow of institutional credit should be increased to the states having low level of private investments, like eastern states.
1 INTRODUCTION The purpose of investments in any sector is to generate capital in the form of infrastructure, improvement in quality of natural resources and assets, and creation of productive assets. The importance of capital in economic progress has been recognised long back (Cairncross, 1955; Meir, 1964). Several development economists see investment as the most important single factor in the growth process (Rostow, 1960; Lewis, 1955).
Investment in any sector comes from two sources viz. public and private. While public investment is meant mainly to create infrastructure, private investment is used mainly for assets formation and for improvement in quality of existing assets. Traditional agriculture and agriculture in underdeveloped countries is generally starved of investment resources because private capital is deterred by the risk involved in agriculture (Schultz, 1964) and institutional investment has also been meagre (Shonfield, 1960). Therefore, special efforts and attention are required to direct and induce public and private investments in agriculture in underdeveloped countries. More so, because agriculture sector in such countries accounts for dominant share of economy, and, growth of other sectors and the overall economy depend to a large extent on the growth of agriculture sector (Timmer, 1988; Nicholas, 1964).
Given the importance of investment in economic growth, there has been a considerable interest in the factors affecting investment during different periods and stages of development. While public investment is determined largely as a matter of policy and by availability of funds from external sources like foreign economic aid and investment, private investment is affected by a variety of factors which differ over time and space.
Beginning with the seminal work of Ragnar Nurkse (Nurkse, 1953) in early 1950s, a large number of studies have been conducted in all the countries on capital formation and investments in agriculture sector to reflect the changing context. The foremost study in the area of capital formation in agriculture in India has been done by Tara Shukla (Shukla, 1960). This study prepared the estimates of value of durable physical assets, capital stock and capital formation for selective years during 1920-21 to 1960-61 at country level and for the selected states using data from Agricultural Statistics of India, Livestock Censuses and various other reports. The estimates pertain to capital in the private sector. After that, the theme had been discussed in several conferences and seminars and has received the attention of several researchers.
Subsequently, the work of estimation of capital formation in various sectors of the economy has been undertaken by Central Statistical Organisation (CSO) of government of India, and the estimates of public and private investments are a part of National Accounts Statistics. The estimates of public and private investments at the country level are available from 1950-51 onwards; the coverage and methodology used to prepare such estimates is described in CSO publication National Accounts Statistics: Sources and Methods (CSO 1989).
The CSO series has been widely used by several scholars to study investments and capital formation in Indian agriculture. This series shows that public investment in agriculture has been rising steadily till 1980-81 and thereafter it started moving downward. Serious concern has been expressed by various scholars over the declining trend in public investment (Shetty, 1990 Kumar, 1992) and it has generated a renewed interest in the area of agricultural investments in India. It has been asserted that decline in public investment is bad not only in itself but also because it would lead to decline in private investment due to complementarity between public and private investment.
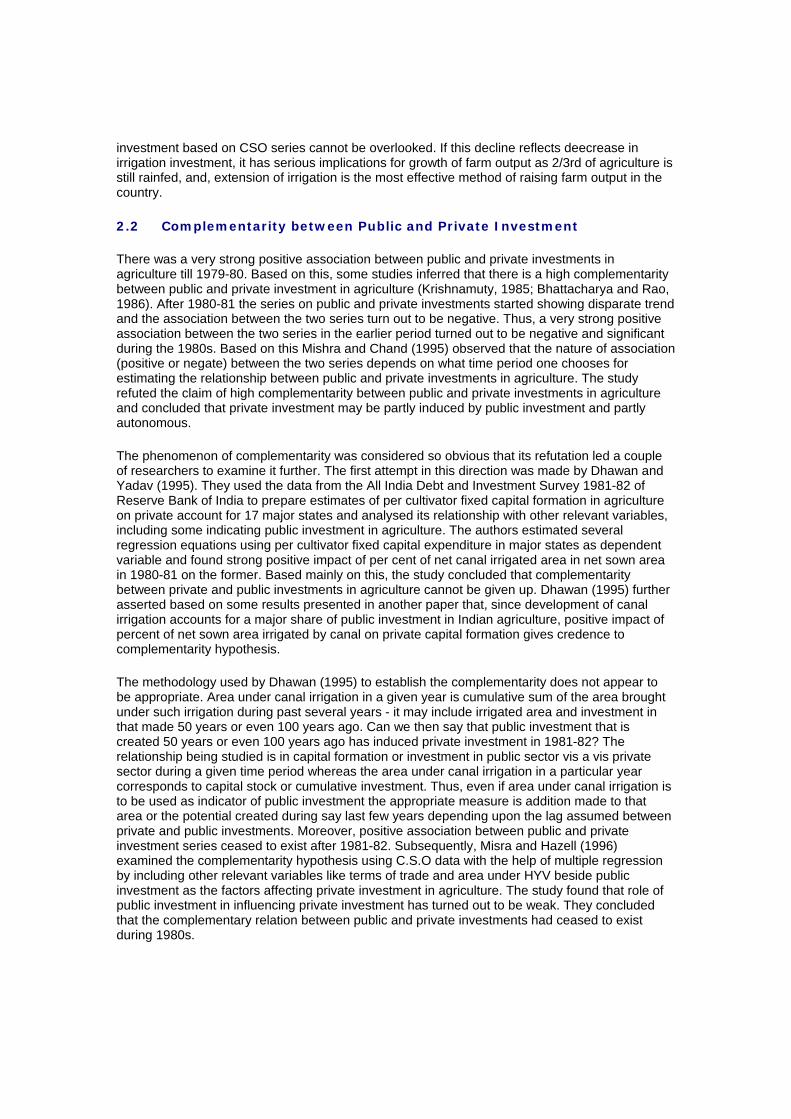
A cursory look at the CSO series at constant prices reveal that both public as well as private investments were moving on rising trends in tandem with each other till late 1970s (Table 1.1; Fig. 1.1). Based on this, some studies concluded that there is a high complementarity between the two types of investment (Krishnamurty, 1985; Bhattacharya and Hanumantha Rao, 1986; Shetty, 1990; Hanumantha Rao, 1994) while some scholars have described it as the inducement effect of public investments on private investments (Patnaik, 1987; Rath, 1989).However, actual behaviour of the two series shows that after reaching the peak in 1980-81, public investment started moving downward whereas private investment continued to rise. Thus, private investment since early 1980s did not follow the public investment, contrary to what has been asserted by the above mentioned studies on relationship between the two types of investments.
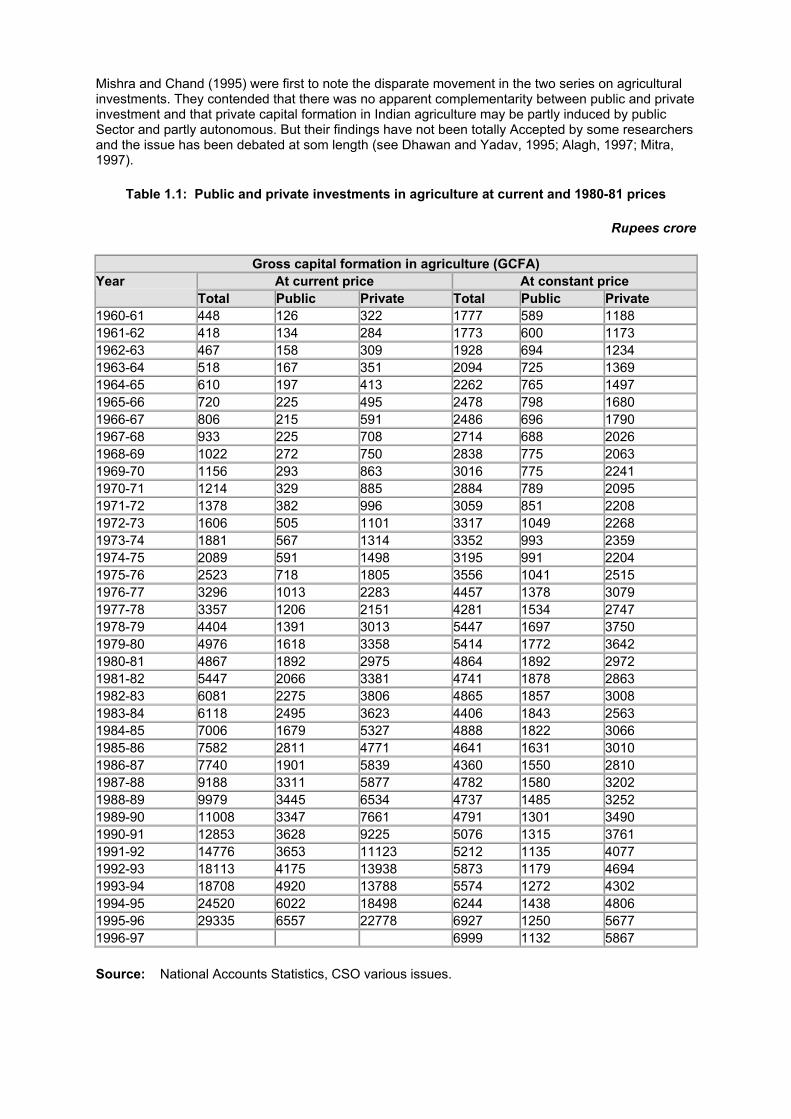
Mishra and Chand (1995) were first to note the disparate movement in the two series on agricultural investments. They contended that there was no apparent complementarity between public and private investment and that private capital formation in Indian agriculture may be partly induced by public Sector and partly autonomous. But their findings have not been totally Accepted by some researchers and the issue has been debated at som length (see Dhawan and Yadav, 1995; Alagh, 1997; Mitra, 1997).
Table 1.1: Public and private investments in agriculture at current and 1980-81 prices
Rupees crore
Gross capital formation in agriculture (GCFA) At current price At constant price Year
Total Public Private Total Public Private 1960-61 448 126 322 1777 589 1188 1961-62 418 134 284 1773 600 1173 1962-63 467 158 309 1928 694 1234 1963-64 518 167 351 2094 725 1369 1964-65 610 197 413 2262 765 1497 1965-66 720 225 495 2478 798 1680 1966-67 806 215 591 2486 696 1790 1967-68 933 225 708 2714 688 2026 1968-69 1022 272 750 2838 775 2063 1969-70 1156 293 863 3016 775 2241 1970-71 1214 329 885 2884 789 2095 1971-72 1378 382 996 3059 851 2208 1972-73 1606 505 1101 3317 1049 2268 1973-74 1881 567 1314 3352 993 2359 1974-75 2089 591 1498 3195 991 2204 1975-76 2523 718 1805 3556 1041 2515 1976-77 3296 1013 2283 4457 1378 3079 1977-78 3357 1206 2151 4281 1534 2747 1978-79 4404 1391 3013 5447 1697 3750 1979-80 4976 1618 3358 5414 1772 3642 1980-81 4867 1892 2975 4864 1892 2972 1981-82 5447 2066 3381 4741 1878 2863 1982-83 6081 2275 3806 4865 1857 3008 1983-84 6118 2495 3623 4406 1843 2563 1984-85 7006 1679 5327 4888 1822 3066 1985-86 7582 2811 4771 4641 1631 3010 1986-87 7740 1901 5839 4360 1550 2810 1987-88 9188 3311 5877 4782 1580 3202 1988-89 9979 3445 6534 4737 1485 3252 1989-90 11008 3347 7661 4791 1301 3490 1990-91 12853 3628 9225 5076 1315 3761 1991-92 14776 3653 11123 5212 1135 4077 1992-93 18113 4175 13938 5873 1179 4694 1993-94 18708 4920 13788 5574 1272 4302 1994-95 24520 6022 18498 6244 1438 4806 1995-96 29335 6557 22778 6927 1250 5677 1996-97 6999 1132 5867
Source: National Accounts Statistics, CSO various issues.
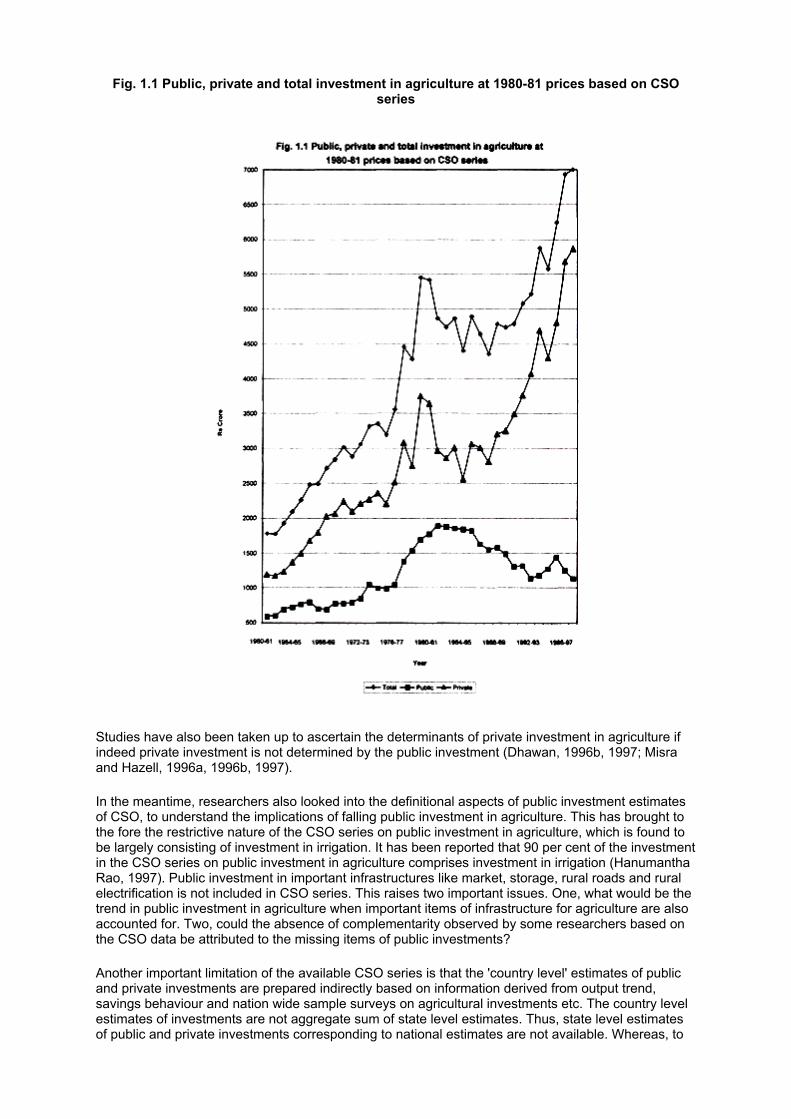
Fig. 1.1 Public, private and total investment in agriculture at 1980-81 prices based on CSO series
Studies have also been taken up to ascertain the determinants of private investment in agriculture if indeed private investment is not determined by the public investment (Dhawan, 1996b, 1997; Misra and Hazell, 1996a, 1996b, 1997).
In the meantime, researchers also looked into the definitional aspects of public investment estimates of CSO, to understand the implications of falling public investment in agriculture. This has brought to the fore the restrictive nature of the CSO series on public investment in agriculture, which is found to be largely consisting of investment in irrigation. It has been reported that 90 per cent of the investment in the CSO series on public investment in agriculture comprises investment in irrigation (Hanumantha Rao, 1997). Public investment in important infrastructures like market, storage, rural roads and rural electrification is not included in CSO series. This raises two important issues. One, what would be the trend in public investment in agriculture when important items of infrastructure for agriculture are also accounted for. Two, could the absence of complementarity observed by some researchers based on the CSO data be attributed to the missing items of public investments?
Another important limitation of the available CSO series is that the 'country level' estimates of public and private investments are prepared indirectly based on information derived from output trend, savings behaviour and nation wide sample surveys on agricultural investments etc. The country level estimates of investments are not aggregate sum of state level estimates. Thus, state level estimates of public and private investments corresponding to national estimates are not available. Whereas, to

understand the causes and implications of the observed macro trends there is a need to look at region/state wise data on public and private investments. The present study is an attempt to provide alternative series of public investment in agriculture that overcomes the limitations of the CSO series. The series is constructed both at national and state levels. While the CSO series on "Public Investment in Agriculture" has a very narrow coverage, the new series covers almost all important components of agricultural infrastructure. The new series on public investment has been constructed for all the states and for the country.
The questions attempted to be answered in the study are:
1. What is the exact relationship between public and private investments, and investments and growth of output?
2. What are the factors that determine private investment? 3. Does the decline in public sector capital formation during recent years imply that infrastructure
development in agriculture is receiving lower importance in the country? 4. Which region should be accorded higher priority in allocation of public investment in
agriculture? 5. Is it necessary to make public investments in each state/region every year to encourage
private investment there, or, public investment made at one time creates enabling conditions for private investments for many years to come, such that, private investment in those regions where high level of public investment has already been made would not be affected? Thus, when resources are limited, can public investment be diverted from the regions which have already received higher public investment to the neglected or less developed regions without affecting private investment and output growth in the former. The answer depends on whether the complementarity hypothesis holds or not.
1.1 Objectives
1. To construct a new and broad series on public investment in agriculture at country level and at the state level and to discuss the changes in composition of public investment during the last two decades.
2. To explore the nature of relationship between public and private investments in agriculture and to find the determinants of private investment.
3. To study the impact of private and public investments on agricultural growth and productivity. 4. To study regional divergence in agricultural investments and to analyze its implications for
balanced regional development. 5. To discuss the policy implications of current trends in public and private investments.
1.2 Organisation of the Study
The study is organized into seven chapters including Introduction. Chapter 2 presents the debate on complementarity between public and private investments and determinants of private investment. It also reviews important recent studies on trends in public and private agricultural investments, and causes and implications of these trends. Sources of data and method of inquiry are presented in Chapter 3. New estimates of public investment for the past two decades for each state and country are presented in Chapter 4. The new estimates are also compared with the CSO series. The Fifth chapter examines inter state variations in private investments and analyses determinants of private investment in agriculture. Relationship between agricultural investments and agricultural growth and productivity is investigated in Chapter 6. The Chapter also examines the divergence in inter state public and private investments and discusses its implications for regional equity. Sectoral ICOR analysis is also attempted in this Chapter. Conclusions and policy implications of the study are presented in Chapter 7.

2 REVIEW Of PAST STUDIES Quite a few studies have been undertaken during the last 10 years on public and private investments in Indian agriculture. These studies have mainly dealt with three aspects, namely (i) trend in public, private and total investments - the causes and implications, (ii) relationship between public and private investments, and (iii) determinants of private investments.
2.1 Trend in Agricultural Investment
The C.S.O series on public investment in agriculture available since 1960-61 showed a rising trend till 1980-81, stagnation at that level for 4-5 years and a decline thereafter. Attention to this fact has been drawn by several scholars (Rath, 1989; Shetty, 1990; Kumar, 1992; Hanumantha Rao, 1994; Alagh, 1994) and it has also been acknowledged by official sources (Economic Survey, 1993-94; Planning Commission, 1994).
This decline in public investment is attributed to various factors. One explanation for this is the diversion of resources from capital account to current account to meet mounting input subsidies in agriculture. As agricultural subsidies increased tremendously after! 980-81 (Gulati and Sharma, 1997) it put massive strain on fiscal resources. Accordingly, rise in subsidies is recognised as a major constraint for raising public sector investment in agriculture (Gulati and Sharma, 1997; Hanumantha Rao, 1994). Some scholars attributed decline in public investment in agriculture to the bias against agriculture in the policy (Kumar, 1992).
Another explanation for the observed behaviour of public investment in agriculture during the 1980s owes itself to political economy of agricultural policies. Under the pressure of farmers interest groups, public financing of private sector capital formation became the priority concern in the beginning of 1980s, (Mishra and £hand, 1995). Public financing of private investments rose from 35 percent in the green revolution period to 60 percent in the post green revolution period and this did not leave much room for the state for public investments. Extraneous forces like opposition to major and medium irrigation systems by environment groups and inter state disputes on water sharing also had adverse effect on public sector investment, which has been largely for irrigation development.
As the public investment is meant for infrastructural development and it augments productive capacity, the level of public investment is crucial for long term growth of output. Accordingly, it has been pointed out that the decline in public investment in agriculture that set in during early 1980s would have adverse impact on the growth of agricultural output (Rath, 1989). Kumar (1992) predicted that the decrease in share of agricultural investment in the total for the economy will cause a significant fall in agricultural GDP. Though, during the decade of 1980s, agricultural GDP and its growth rate did not fall following the decline in public investment, as predicted, there is no disagreement about the importance of public investment for long run output growth.
While acknowledging the importance of public investment for growth of output, some researchers have drawn attention to the distinction between Investment in agriculture and investment for agriculture. It is felt that the CSO series on public investment termed as investment in agriculture includes investment mainly under medium and major irrigation systems. The series does not include investment in rural roads, markets, godowns, storage, rural electrification etc. which are for agriculture, and which are quite important for growth and development of the sector. Therefore, it is said that if there is a decline in public investment in agriculture based on the CSO series, it may not necessarily imply a decline in investment for overall infrastructure for agriculture development. This underscores the need to examine the trend in public investment that includes all major items of investment related to the sector. At the same time the decline in public
investment based on CSO series cannot be overlooked. If this decline reflects deecrease in irrigation investment, it has serious implications for growth of farm output as 2/3rd of agriculture is still rainfed, and, extension of irrigation is the most effective method of raising farm output in the country.
2.2 Complementarity between Public and Private Investment
There was a very strong positive association between public and private investments in agriculture till 1979-80. Based on this, some studies inferred that there is a high complementarity between public and private investment in agriculture (Krishnamuty, 1985; Bhattacharya and Rao, 1986). After 1980-81 the series on public and private investments started showing disparate trend and the association between the two series turn out to be negative. Thus, a very strong positive association between the two series in the earlier period turned out to be negative and significant during the 1980s. Based on this Mishra and Chand (1995) observed that the nature of association (positive or negate) between the two series depends on what time period one chooses for estimating the relationship between public and private investments in agriculture. The study refuted the claim of high complementarity between public and private investments in agriculture and concluded that private investment may be partly induced by public investment and partly autonomous.
The phenomenon of complementarity was considered so obvious that its refutation led a couple of researchers to examine it further. The first attempt in this direction was made by Dhawan and Yadav (1995). They used the data from the All India Debt and Investment Survey 1981-82 of Reserve Bank of India to prepare estimates of per cultivator fixed capital formation in agriculture on private account for 17 major states and analysed its relationship with other relevant variables, including some indicating public investment in agriculture. The authors estimated several regression equations using per cultivator fixed capital expenditure in major states as dependent variable and found strong positive impact of per cent of net canal irrigated area in net sown area in 1980-81 on the former. Based mainly on this, the study concluded that complementarity between private and public investments in agriculture cannot be given up. Dhawan (1995) further asserted based on some results presented in another paper that, since development of canal irrigation accounts for a major share of public investment in Indian agriculture, positive impact of percent of net sown area irrigated by canal on private capital formation gives credence to complementarity hypothesis.
The methodology used by Dhawan (1995) to establish the complementarity does not appear to be appropriate. Area under canal irrigation in a given year is cumulative sum of the area brought under such irrigation during past several years - it may include irrigated area and investment in that made 50 years or even 100 years ago. Can we then say that public investment that is created 50 years or even 100 years ago has induced private investment in 1981-82? The relationship being studied is in capital formation or investment in public sector vis a vis private sector during a given time period whereas the area under canal irrigation in a particular year corresponds to capital stock or cumulative investment. Thus, even if area under canal irrigation is to be used as indicator of public investment the appropriate measure is addition made to that area or the potential created during say last few years depending upon the lag assumed between private and public investments. Moreover, positive association between public and private investment series ceased to exist after 1981-82. Subsequently, Misra and Hazell (1996) examined the complementarity hypothesis using C.S.O data with the help of multiple regression by including other relevant variables like terms of trade and area under HYV beside public investment as the factors affecting private investment in agriculture. The study found that role of public investment in influencing private investment has turned out to be weak. They concluded that the complementary relation between public and private investments had ceased to exist during 1980s.
Hanumantha Rao (1997) is of the view that the controversy over complementarity has arisen due to limitation of CSO data, more than 90 percent of which relate to investment in medium and major irrigation projects. He felt that if public investments made in agriculture are properly accounted for by including investment in rural electrification, rural roads, storage etc. then complementarity between public and private investments stands out prominently.
Dhawan also did not agree with the method and conclusion of the study by Mishra and Hazell (Dhawan 1996). Another critique of refutation of complementarity hypothesis appeared in Alagh (1997) where he asserted that the complementarity of public and private investments can be seen more strongly in project level data - the conclusion similar to that of Mishra and Chand (1995) as is evident from the following quote:
"Investment planning literature at micro level generally deals with competitive investment projects. However, there again, we come across cases of complementary projects. Investment in field-channels, for example is complementary to a canal irrigation project, because in the absence of the former, irrigation benefit from the latter cannot materialise".
Taking this case, it looks pertinent to point out that investment in field channels can come from private source or from public source. In case field channels are constructed using public funds, as has been done in some states, it is a case of crowding out effect.
The trend in public and private investments in agriculture since 1950-51 and phenomenon of complementarity has been examined thoroughly by Mitra (1997). The study observed that though, based on CSO series the complementarity hypothesis appears to stand refuted during 1980s, this did not imply that the relationship could be one of substitution or of independence between the two.
The debate shows that the serious disagreement on whether there is complementarity between public and private investments in Indian agriculture still persists. However, the debate has been quite useful to improve our understanding of the complex nature of relationship between the public and private investments in agriculture.
2.3 Determinants of Private Investment
Only a few studies during the last decade have studied the determinants of private investment in agriculture at macro level. Public investment was considered quite an important determinant of private investment whether termed as complementarity effect or inducement effect. Empirical model based on economic theory of investment was developed by Gandhi (1990) to analyse investment behaviour in Indian agriculture. The results based on the model show significant positive impact of government investment in agriculture on private investment. The model was run on C.S.O series for the period 1951-80. Gandhi further analysed determinants of private investment by extending the model to post 1980 period when trends in public and private investment started moving in opposite directions (Gandhi 1996). The study found that for the entire period 1952-53 to 1992-93 rural savings and co-operative credit to agriculture were the strongest determinants followed by HYV coverage, agricultural wages and commercial bank credit.
Rural savings emerged as a strong determinant of private investment in agriculture from 1980-81 to 1992-93.
Misra and Hazell (1996) observed that terms of trade and technology (measured by percent area under HYV) have significant positive impact on private investment. The impact of public investment turned out to be non significant which has also been confirmed by another study by Misra (1998).
3 DATA SOURCES AND METHOD As discussed earlier, CSO series on public and private investment is available separately since 1950-51 at the country level. The objective of this study was to construct a new series at the country and state levels that includes investments in all broad heads meant for agriculture. Various sources were explored from where state level data on investment on all the relevant items could be obtained. After a through survey it was found that the publication Finance Accounts of union government and the states provides detailed information on headwise and sub-headwise capital expenditure during each year. Therefore, this was used as the source of basic data for investment on public account.
The series has been constructed for the period 1974-75 to 1996-97, starting with the first year of Fifth Five Year Plan and ending with the last year of Eighth Five Year Plan. The classification of various heads of expenditure in Finance Accounts is the same as that followed in the "Budget documents". There was a change in classification of expenditure under various heads beginning 1986-87 when the system of accounting was shifted from three digits to four digits classification and uniformity was brought between development heads of expenditure and budgetary heads of expenditure. The items included in capital outlay on agriculture in our series and their correspondence between the two sub- periods i.e. up to 1986/87 and 1987/88 onwards are shown in Table 3.1. The series includes capital expenditure on more than 20 heads about half of which are not included in the C.S.O series.
Yearly data on capital expenditure, termed as public investment, by each state and union government have been compiled for the last 23 years. The series has also been prepared at constant (1980-81) prices by deflating the current price series by implicit price index of construction sector.
Time series data on private investment at state level is not available on annual basis. However, state level information for the study period is available from nation wide surveys like Debt and Rural Investment Survey 1981-82 by Reserve Bank of India and Household Capital Expenditure During 1.7.1991 to 30.6.92: Debt and Investment Survey of NSSO, 48th Round. The 1981-82 survey provides information for 17 major states while 1991-92 information is available for all the states. The NSSO survey covers 36425 rural and 20606 urban households, spread over all the states. Both these surveys give rich information on fixed capital expenditure by rural and urban households. The data on capital formation by household is furnished under three heads, viz. (a) residential plots and buildings, (b) farm business, and (c) non-farm business.
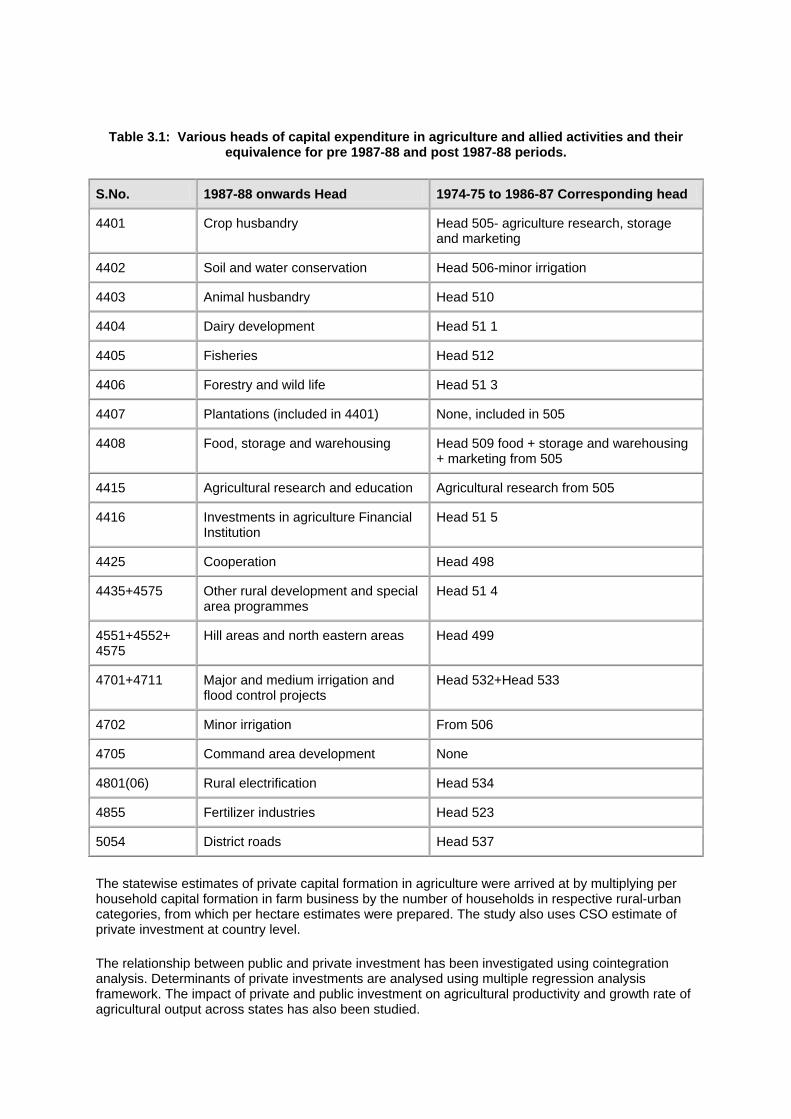
Table 3.1: Various heads of capital expenditure in agriculture and allied activities and their equivalence for pre 1987-88 and post 1987-88 periods.
S.No. 1987-88 onwards Head 1974-75 to 1986-87 Corresponding head
4401 Crop husbandry Head 505- agriculture research, storage and marketing
4402 Soil and water conservation Head 506-minor irrigation
4403 Animal husbandry Head 510
4404 Dairy development Head 51 1
4405 Fisheries Head 512
4406 Forestry and wild life Head 51 3
4407 Plantations (included in 4401) None, included in 505
4408 Food, storage and warehousing Head 509 food + storage and warehousing + marketing from 505
4415 Agricultural research and education Agricultural research from 505
4416 Investments in agriculture Financial Institution
Head 51 5
4425 Cooperation Head 498
4435+4575 Other rural development and special area programmes
Head 51 4
4551+4552+ 4575
Hill areas and north eastern areas Head 499
4701+4711 Major and medium irrigation and flood control projects
Head 532+Head 533
4702 Minor irrigation From 506
4705 Command area development None
4801(06) Rural electrification Head 534
4855 Fertilizer industries Head 523
5054 District roads Head 537
The statewise estimates of private capital formation in agriculture were arrived at by multiplying per household capital formation in farm business by the number of households in respective rural-urban categories, from which per hectare estimates were prepared. The study also uses CSO estimate of private investment at country level.
The relationship between public and private investment has been investigated using cointegration analysis. Determinants of private investments are analysed using multiple regression analysis framework. The impact of private and public investment on agricultural productivity and growth rate of agricultural output across states has also been studied.

4 STATEWISE TREND IN PUBLIC INVESTMENT IN AGRICULTURE
Public investment in agriculture in India is funded by state governments and the union government. Contributions of each state and the union government from 1974-75 were compiled headwise and their sum indicate the total public investment in agriculture. It may be noted that public investment in agriculture according to our series refer to capital expenditure on all the selected heads. Though we have prepared annual series for the period 1974-75 to 1996-97, for sake of brevity the information at state level is presented by grouping years according to the period of Five Year Plans. However, complete series is provided for the country as a whole. The reason for choosing Five Year Plan periods rather than any other grouping of years was that development resources in the country are mainly allocated according to Five Year Plans.
4.1 Total Public Investment
Trend in total public investment in each state at current prices is presented in Table 4.1 and the same at constant prices is presented in Table 4.2. Total public investment at country level at current prices steadily increased from Rs.2586 crore during 5th Five Year Plan to Rs.11964 crore during the 8th Five Year Plan. The capital expenditure on agriculture showed increase at current prices in all the states except Bihar and Punjab. In Bihar, annual investment in agriculture by the state government followed decline after 7th plan. The decline in Punjab set in after 6th Plan, however, there has been a substantial increase in public investment from 1992-93 to 1996-97. Like these two states, capital expenditure on agriculture sector by the union government also did not show rising trend. Agricultural investments by union government declined from Rs.654 crore/year during 6th plan to Rs.534 crore during Seventh plan. During the two years intervening 7th and 8th plan, union government invested very low amount in capital items.
Capital expenditure on agriculture at 1980-81 prices for the country as a whole showed decline throughout after 1974-75 to 1978-79. The decline was very sharp during Sixth and Seventh Five Year Plans when annual expenditure declined to Rs.3637 and Rs.2758 crore, respectively, from about 44 hundred crore during Fifth Plan. The decline continued during the 1990s though it was small (Table 4.2).
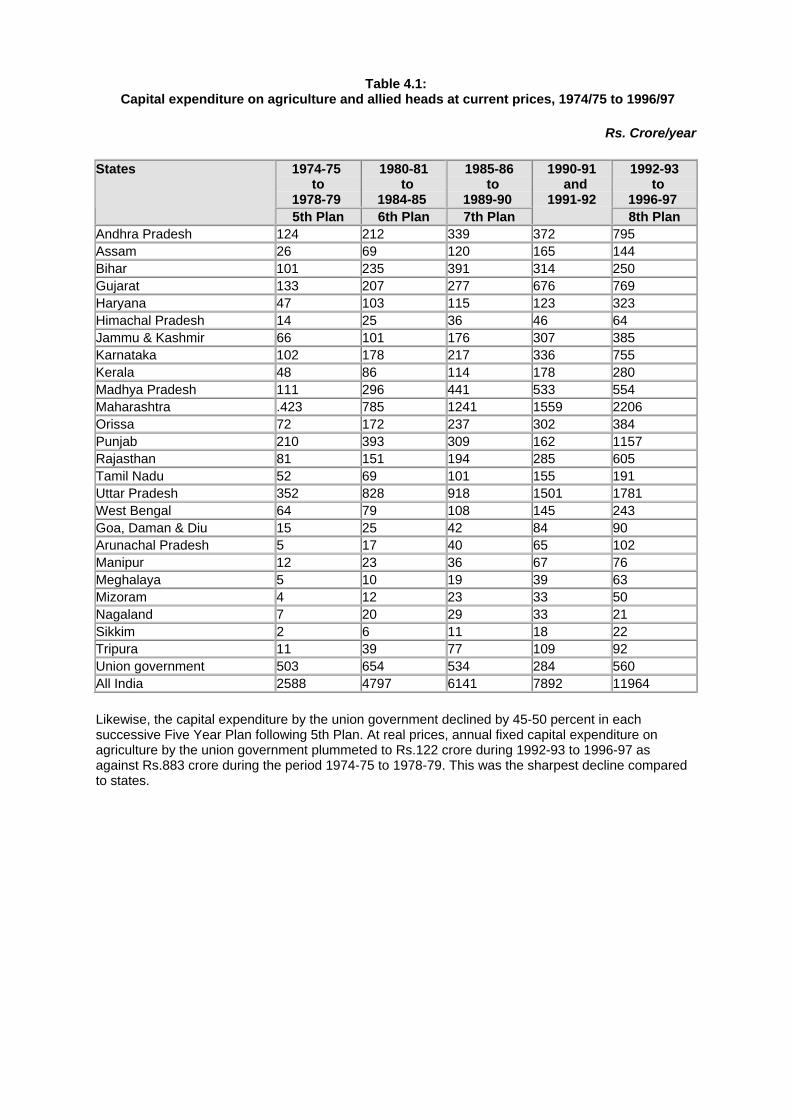
Table 4.1: Capital expenditure on agriculture and allied heads at current prices, 1974/75 to 1996/97
Rs. Crore/year
1974-75 to
1978-79
1980-81 to
1984-85
1985-86 to
1989-90
1992-93 to
1996-97
States
5th Plan 6th Plan 7th Plan
1990-91 and
1991-92 8th Plan
Andhra Pradesh 124 212 339 372 795 Assam 26 69 120 165 144 Bihar 101 235 391 314 250 Gujarat 133 207 277 676 769 Haryana 47 103 115 123 323 Himachal Pradesh 14 25 36 46 64 Jammu & Kashmir 66 101 176 307 385 Karnataka 102 178 217 336 755 Kerala 48 86 114 178 280 Madhya Pradesh 111 296 441 533 554 Maharashtra .423 785 1241 1559 2206 Orissa 72 172 237 302 384 Punjab 210 393 309 162 1157 Rajasthan 81 151 194 285 605 Tamil Nadu 52 69 101 155 191 Uttar Pradesh 352 828 918 1501 1781 West Bengal 64 79 108 145 243 Goa, Daman & Diu 15 25 42 84 90 Arunachal Pradesh 5 17 40 65 102 Manipur 12 23 36 67 76 Meghalaya 5 10 19 39 63 Mizoram 4 12 23 33 50 Nagaland 7 20 29 33 21 Sikkim 2 6 11 18 22 Tripura 11 39 77 109 92 Union government 503 654 534 284 560 All India 2588 4797 6141 7892 11964
Likewise, the capital expenditure by the union government declined by 45-50 percent in each successive Five Year Plan following 5th Plan. At real prices, annual fixed capital expenditure on agriculture by the union government plummeted to Rs.122 crore during 1992-93 to 1996-97 as against Rs.883 crore during the period 1974-75 to 1978-79. This was the sharpest decline compared to states.
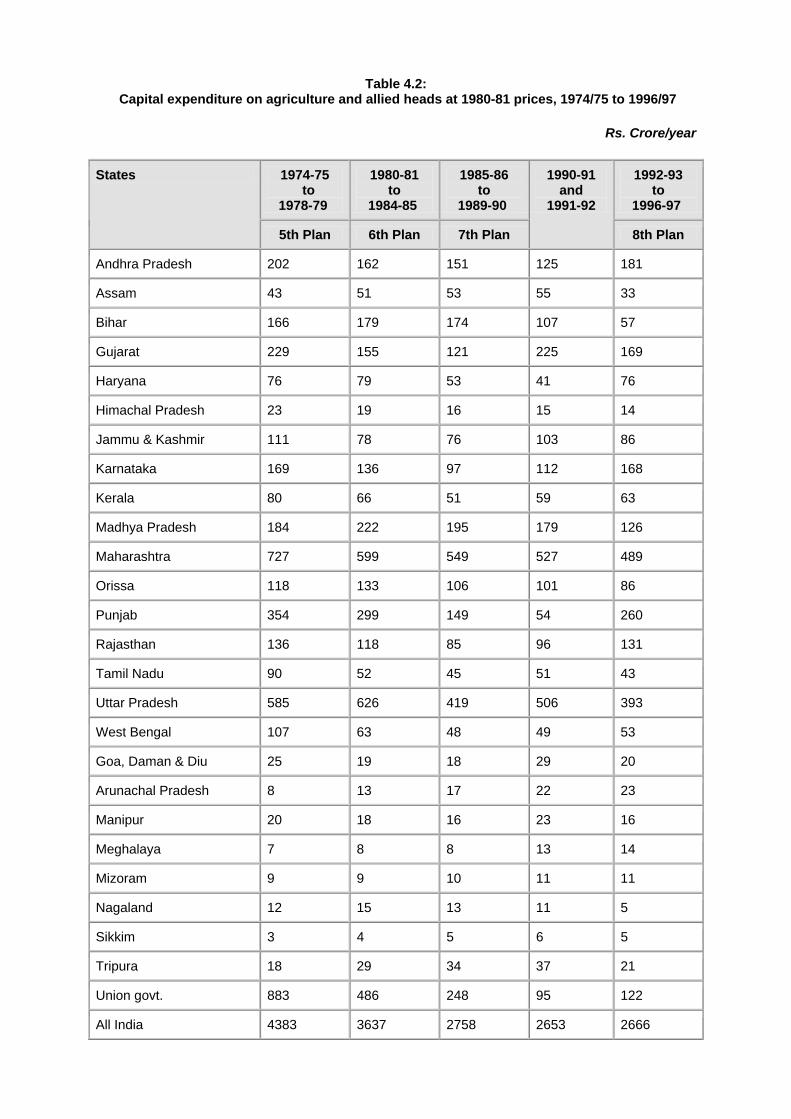
Table 4.2: Capital expenditure on agriculture and allied heads at 1980-81 prices, 1974/75 to 1996/97
Rs. Crore/year
1974-75 to
1978-79
1980-81 to
1984-85
1985-86 to
1989-90
1992-93 to
1996-97
States
5th Plan 6th Plan 7th Plan
1990-91 and
1991-92
8th Plan
Andhra Pradesh 202 162 151 125 181
Assam 43 51 53 55 33
Bihar 166 179 174 107 57
Gujarat 229 155 121 225 169
Haryana 76 79 53 41 76
Himachal Pradesh 23 19 16 15 14
Jammu & Kashmir 111 78 76 103 86
Karnataka 169 136 97 112 168
Kerala 80 66 51 59 63
Madhya Pradesh 184 222 195 179 126
Maharashtra 727 599 549 527 489
Orissa 118 133 106 101 86
Punjab 354 299 149 54 260
Rajasthan 136 118 85 96 131
Tamil Nadu 90 52 45 51 43
Uttar Pradesh 585 626 419 506 393
West Bengal 107 63 48 49 53
Goa, Daman & Diu 25 19 18 29 20
Arunachal Pradesh 8 13 17 22 23
Manipur 20 18 16 23 16
Meghalaya 7 8 8 13 14
Mizoram 9 9 10 11 11
Nagaland 12 15 13 11 5
Sikkim 3 4 5 6 5
Tripura 18 29 34 37 21
Union govt. 883 486 248 95 122
All India 4383 3637 2758 2653 2666

Barring small states, decline in capital expenditure on agriculture in real terms was observed to be widespread across states. Capital expenditure dropped sharply during 6th and 7th Plan periods in southern states, Gujarat, Rajasthan and West Bengal. Agricultural investments showed some improvement, during 1992-93 to 1996-97 in these states except in Tamil Nadu. In Assam, public capital expenditure showed rising trend till 1991-92 and declined thereafter. In Bihar, the decline is observed after mid 1980s. In Orissa and Maharashtra, agricultural investment by the states showed decline throughout after 5th Plan. In Punjab, annual investment by state declined from the level of 300 crore during first half of 1980s to 150 crore during the second half. It further reduced to 1/3rd during the first two years of 1990s after which it took a sharp upward turn. The investment pattern in Punjab seems to be highly affected by the rise of militancy movement in the state. Public investment in the state was severally curtailed during late 1980s and early 1990s with the rise of militancy, as more and more resources were diverted to control the militancy movement. As soon as the movement started fading and after the long pending election to state assembly in 1992, level of public investment was raised close to the level prevailing before beginning of militancy.
4.2 Per Hectare Public Investment
In order to compare the importance given by different states to agricultural infrastructure the series on capital outlay was computed on per hectare basis by dividing total capital expenditure by net sown area of the state. The estimates for different sub periods are presented in Table 4.3 while the movement in the entire series can be observed from the graphs in Fig. 4 1.
Among major states the capital expenditure on agriculture remained highest in Jammu and Kashmir - it was about 4-5 times the national average in all the four Plans. The magnitude of investment in Jammu and Kashmir was more close to smaller states than the major states. As the state enjoys special status in the Indian union, it has been receiving special assistance for various agricultural development projects. This has resulted in different pattern of public capital invested in agriculture compared to other major states. Among the remaining major states, Punjab allocated highest resources to infrastructure development for agriculture in all the Plan periods. Per hectare annual capital expenditure in Punjab was Rs.853 during 5th Plan, Rs.713 during 6th Plan, Rs.355 during 7th Plan and Rs.618 during the 8th Plan period. The second place from top was occupied by Himachal Pradesh during 5th Plan, by Uttar Pradesh during 6th Plan, and Maharashtra during 7th Plan. Kerala, with per hectare allocation of Rs.282 at constant prices, enjoyed 2nd position during the 8th Plan period.
Public capital invested in agriculture was the lowest in Rajasthan during 1974-75 to 1991-92; the amount at 1980-81 prices varied between Rs.60 to Rs.90 per hectare of net sown area. During 1992-93 to 1996-97, the state of Madhya Pradesh invested lowest in agriculture sector (Rs.65 per hectare). Other states which invested less than Rs.100 per hectare during 8th Plan period are Tamil Nadu, Assam, Rajasthan and West Bengal.
Union government spent Rs.63 per hectare of net sown area of the country during 5th Plan, which reduced to Rs.34 during 6th Plan and Rs.18 during 7th Plan. The amount spent on agricultural infrastructure during the 1990s was less than Rs.10 per hectare of area.
Per hectare capital expenditure for agriculture in small size north east states remained higher than national average. As against the national average of Rs.187 to 311 during different Plans, capital outlay on agriculture in north east states ranged between Rs.239 to 1744.
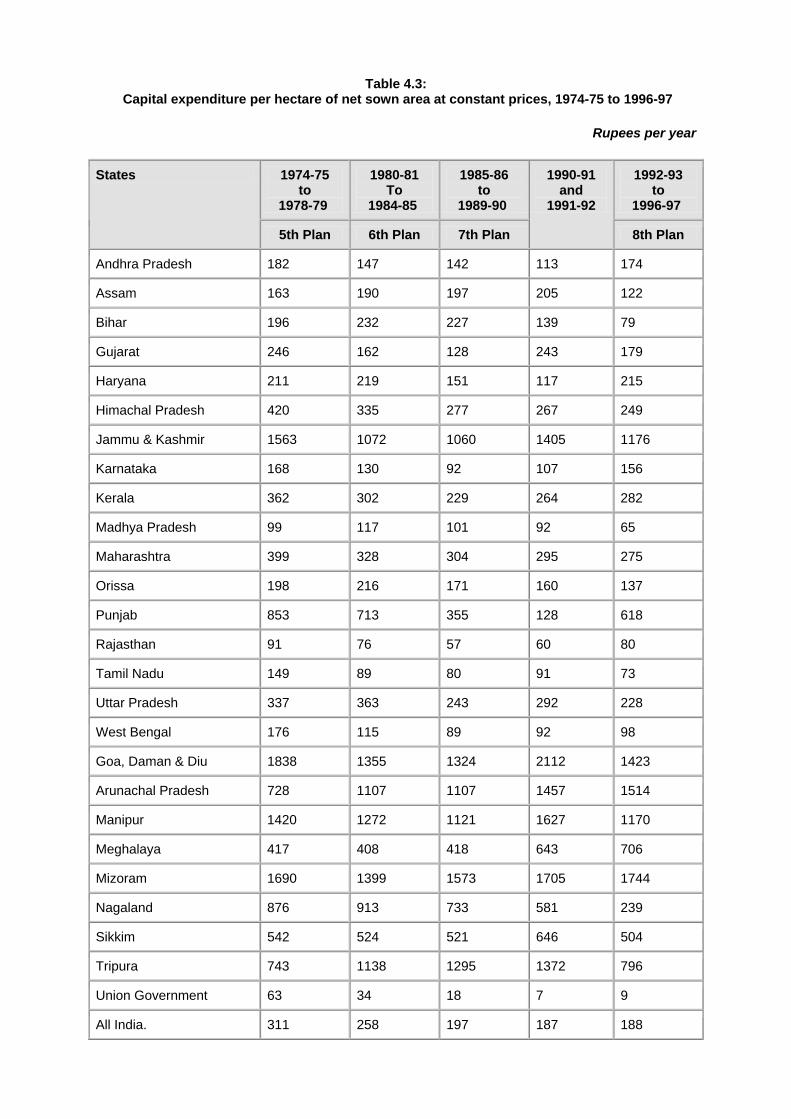
Table 4.3: Capital expenditure per hectare of net sown area at constant prices, 1974-75 to 1996-97
Rupees per year
1974-75 to
1978-79
1980-81 To
1984-85
1985-86 to
1989-90
1992-93 to
1996-97
States
5th Plan 6th Plan 7th Plan
1990-91 and
1991-92
8th Plan
Andhra Pradesh 182 147 142 113 174
Assam 163 190 197 205 122
Bihar 196 232 227 139 79
Gujarat 246 162 128 243 179
Haryana 211 219 151 117 215
Himachal Pradesh 420 335 277 267 249
Jammu & Kashmir 1563 1072 1060 1405 1176
Karnataka 168 130 92 107 156
Kerala 362 302 229 264 282
Madhya Pradesh 99 117 101 92 65
Maharashtra 399 328 304 295 275
Orissa 198 216 171 160 137
Punjab 853 713 355 128 618
Rajasthan 91 76 57 60 80
Tamil Nadu 149 89 80 91 73
Uttar Pradesh 337 363 243 292 228
West Bengal 176 115 89 92 98
Goa, Daman & Diu 1838 1355 1324 2112 1423
Arunachal Pradesh 728 1107 1107 1457 1514
Manipur 1420 1272 1121 1627 1170
Meghalaya 417 408 418 643 706
Mizoram 1690 1399 1573 1705 1744
Nagaland 876 913 733 581 239
Sikkim 542 524 521 646 504
Tripura 743 1138 1295 1372 796
Union Government 63 34 18 7 9
All India. 311 258 197 187 188
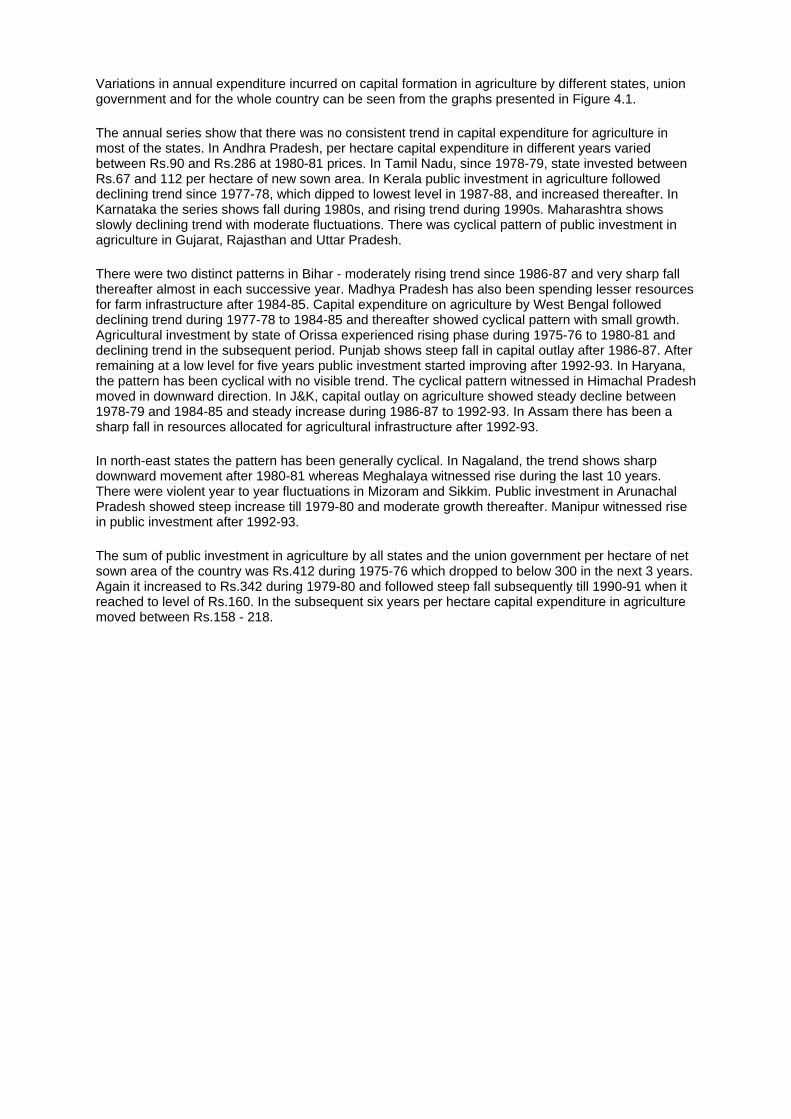
Variations in annual expenditure incurred on capital formation in agriculture by different states, union government and for the whole country can be seen from the graphs presented in Figure 4.1.
The annual series show that there was no consistent trend in capital expenditure for agriculture in most of the states. In Andhra Pradesh, per hectare capital expenditure in different years varied between Rs.90 and Rs.286 at 1980-81 prices. In Tamil Nadu, since 1978-79, state invested between Rs.67 and 112 per hectare of new sown area. In Kerala public investment in agriculture followed declining trend since 1977-78, which dipped to lowest level in 1987-88, and increased thereafter. In Karnataka the series shows fall during 1980s, and rising trend during 1990s. Maharashtra shows slowly declining trend with moderate fluctuations. There was cyclical pattern of public investment in agriculture in Gujarat, Rajasthan and Uttar Pradesh.
There were two distinct patterns in Bihar - moderately rising trend since 1986-87 and very sharp fall thereafter almost in each successive year. Madhya Pradesh has also been spending lesser resources for farm infrastructure after 1984-85. Capital expenditure on agriculture by West Bengal followed declining trend during 1977-78 to 1984-85 and thereafter showed cyclical pattern with small growth. Agricultural investment by state of Orissa experienced rising phase during 1975-76 to 1980-81 and declining trend in the subsequent period. Punjab shows steep fall in capital outlay after 1986-87. After remaining at a low level for five years public investment started improving after 1992-93. In Haryana, the pattern has been cyclical with no visible trend. The cyclical pattern witnessed in Himachal Pradesh moved in downward direction. In J&K, capital outlay on agriculture showed steady decline between 1978-79 and 1984-85 and steady increase during 1986-87 to 1992-93. In Assam there has been a sharp fall in resources allocated for agricultural infrastructure after 1992-93.
In north-east states the pattern has been generally cyclical. In Nagaland, the trend shows sharp downward movement after 1980-81 whereas Meghalaya witnessed rise during the last 10 years. There were violent year to year fluctuations in Mizoram and Sikkim. Public investment in Arunachal Pradesh showed steep increase till 1979-80 and moderate growth thereafter. Manipur witnessed rise in public investment after 1992-93.
The sum of public investment in agriculture by all states and the union government per hectare of net sown area of the country was Rs.412 during 1975-76 which dropped to below 300 in the next 3 years. Again it increased to Rs.342 during 1979-80 and followed steep fall subsequently till 1990-91 when it reached to level of Rs.160. In the subsequent six years per hectare capital expenditure in agriculture moved between Rs.158 - 218.
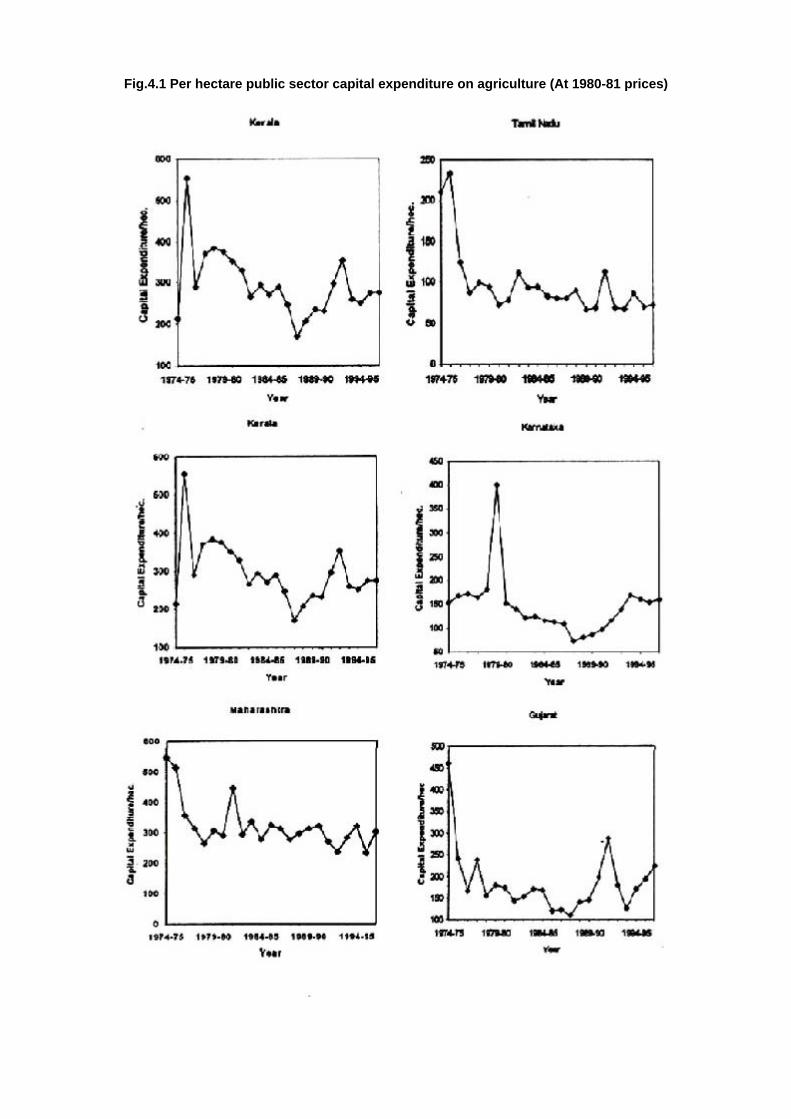
Fig.4.1 Per hectare public sector capital expenditure on agriculture (At 1980-81 prices)
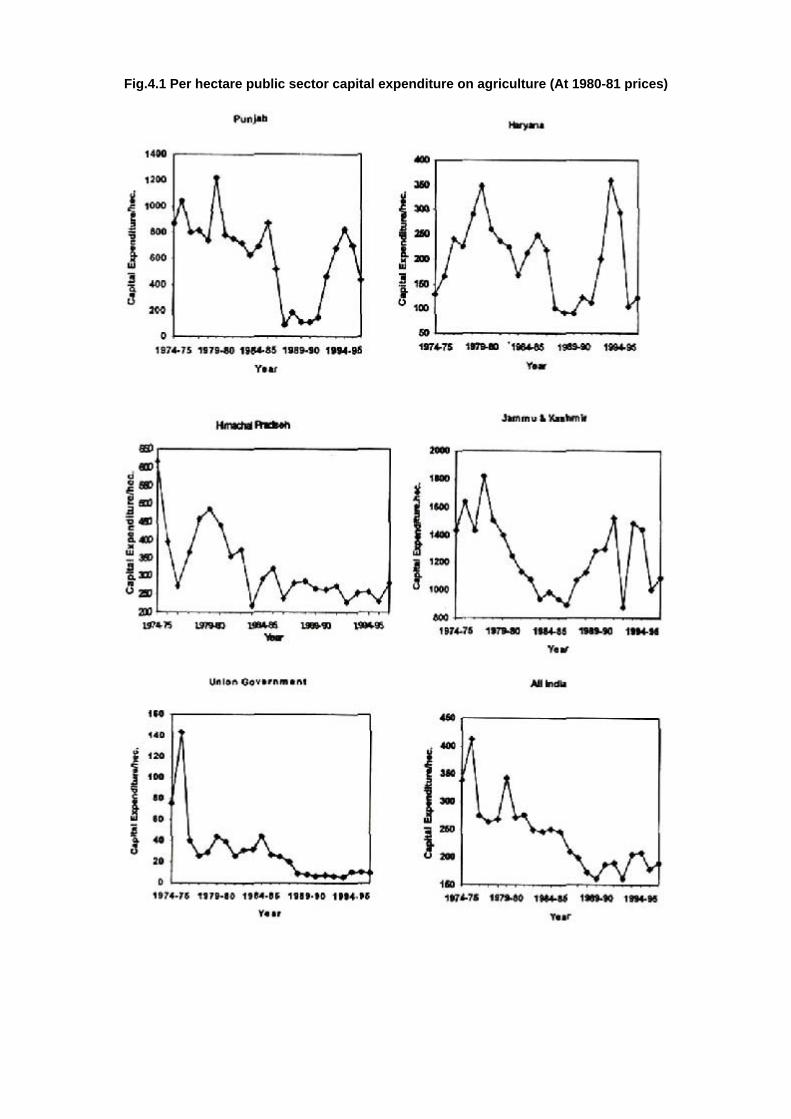
Fig.4.1 Per hectare public sector capital expenditure on agriculture (At 1980-81 prices)

Fig.4.1 Per hectare public sector capital expenditure on agriculture (At 1980-81 prices)
Fig.4.1 Per hectare public sector capital expenditure on agriculture (At 1980-81 prices)
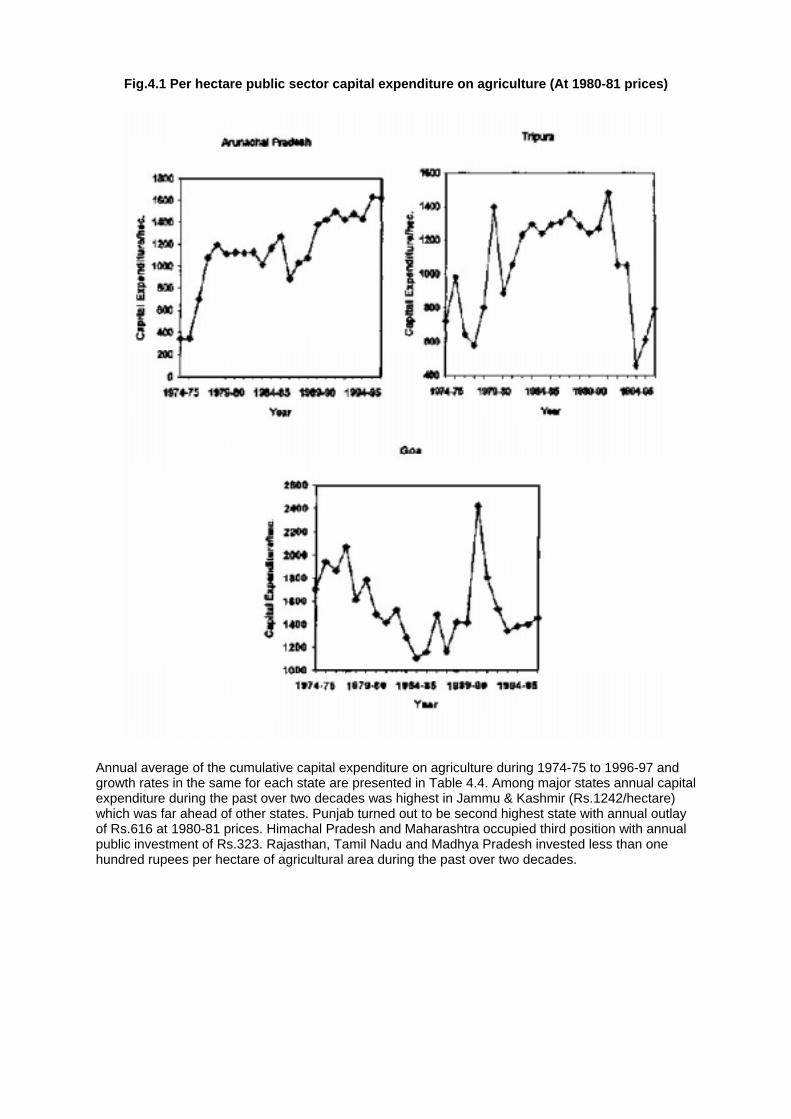
Fig.4.1 Per hectare public sector capital expenditure on agriculture (At 1980-81 prices)
Annual average of the cumulative capital expenditure on agriculture during 1974-75 to 1996-97 and growth rates in the same for each state are presented in Table 4.4. Among major states annual capital expenditure during the past over two decades was highest in Jammu & Kashmir (Rs.1242/hectare) which was far ahead of other states. Punjab turned out to be second highest state with annual outlay of Rs.616 at 1980-81 prices. Himachal Pradesh and Maharashtra occupied third position with annual public investment of Rs.323. Rajasthan, Tamil Nadu and Madhya Pradesh invested less than one hundred rupees per hectare of agricultural area during the past over two decades.
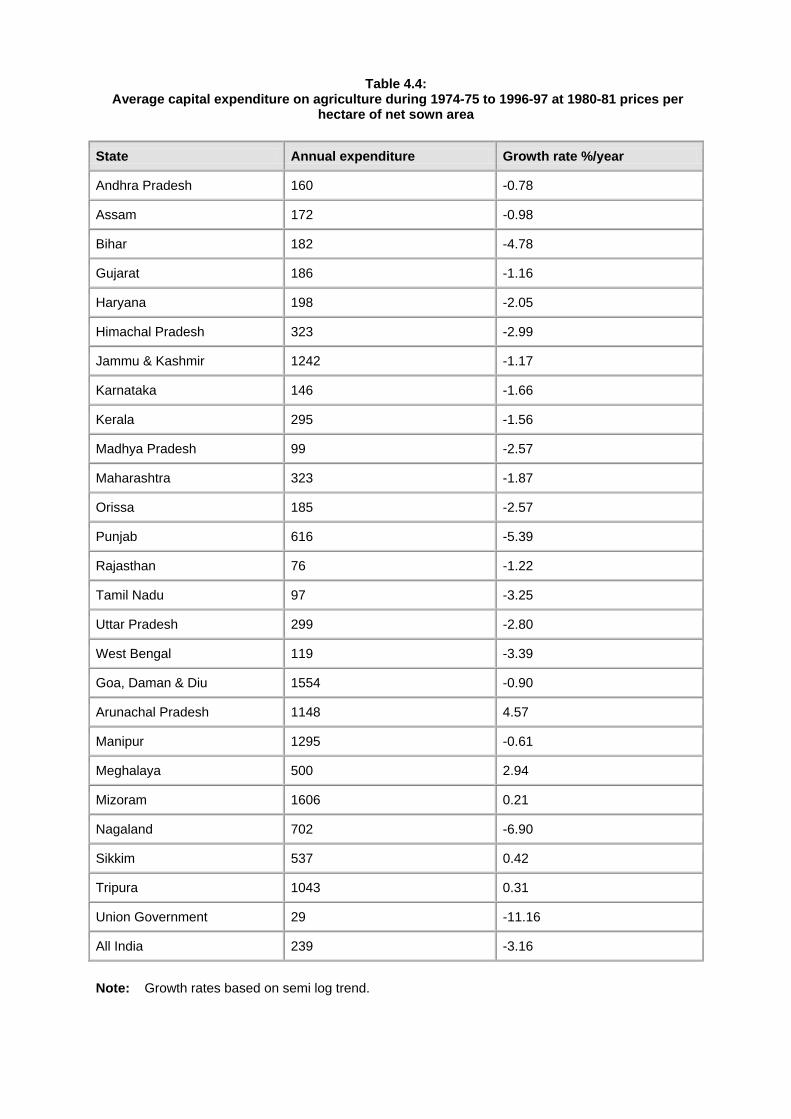
Table 4.4: Average capital expenditure on agriculture during 1974-75 to 1996-97 at 1980-81 prices per
hectare of net sown area
State Annual expenditure Growth rate %/year
Andhra Pradesh 160 -0.78
Assam 172 -0.98
Bihar 182 -4.78
Gujarat 186 -1.16
Haryana 198 -2.05
Himachal Pradesh 323 -2.99
Jammu & Kashmir 1242 -1.17
Karnataka 146 -1.66
Kerala 295 -1.56
Madhya Pradesh 99 -2.57
Maharashtra 323 -1.87
Orissa 185 -2.57
Punjab 616 -5.39
Rajasthan 76 -1.22
Tamil Nadu 97 -3.25
Uttar Pradesh 299 -2.80
West Bengal 119 -3.39
Goa, Daman & Diu 1554 -0.90
Arunachal Pradesh 1148 4.57
Manipur 1295 -0.61
Meghalaya 500 2.94
Mizoram 1606 0.21
Nagaland 702 -6.90
Sikkim 537 0.42
Tripura 1043 0.31
Union Government 29 -11.16
All India 239 -3.16
Note: Growth rates based on semi log trend.

The general perception is that the north east states are not given adequate attention in allocation of development resources because of which their level of economic development is low. The sum of capital expenditure on agriculture during past four Five Year Plans dispel this notion. As against the national average of Rs.239, per hectare capital expenditure on agriculture varied between Rs.500 to 1606 in the north-east states - Meghalaya being at the bottom and Mizoram at the top.
All major states and some of the small states show declining trends in the resources spent for infrastructure for agriculture (Table 4.4). Among major states the rate of decline has been highest in Punjab followed by Bihar. At the country level the series declined annually by 3.16 percent over the choosen period.
4.3 Share of Public Investment in NSDP
Proportion of net state domestic product in agriculture spent on capital formation in agriculture for each state is shown in Table 4.5 while the share in total NSDP is shown in Table 4.6.
Table 4.5 : Capital expenditure on agriculture and related heads as per cent of NSDP Agriculture at
current prices
1974-75 to 1978-79
1980-81 to 1984-85
1985-86 to 1989-90
1990-91 and 1991-92
1992-93 to 1996-97
States
5th Plan 6th Plan 7th Plan 8th Plan Andhra Pradesh 5.58 5.15 5.23 3.01 4.19 Assam 3.27 4.66 4.93 4.87 2.52 Bihar 4.42 6.40 5.88 3.27 1.84 Gujarat 8.86 6.25 6.41 10.17 6.38 Haryana 4.36 5.36 3.61 2.05 3.45 Himachal Pradesh
7.10 7.96 7.35 5.63 6.84
Jammu & Kashmir
25.82 19.80 23.14 27.76 20.52
Karnataka 6.59 5.91 4.51 4.10 5.55 Kerala 4.89 5.19 4.40 4.04 3.88 Madhya Pradesh
5.38 8.17 6.90 5.14 3.41
Maharashtra 16.84 18.12 16.66 13.33 9.69 Orissa 6.64 8.28 7.67 7.89 6.57 Punjab 13.49 14.36 6.16 1.92 8.11 Rajasthan 4.75 5.27 4.36 3.40 4.56 Tamil Nadu 3.79 3.05 2.58 2.62 1.81 Uttar Pradesh 8.08 10.27 6.90 6.70 5.04 West Bengal 2.78 2.17 1.66 1.38 1.40 Goa, Daman & Diu
44.52 36.87 41.12 51.93 39.88
Arunachal Pradesh
31.43 3,1.54 34.21 37.21 37.68
Manipur 22.18 18.79 17.41 23.93 16.60 Meghalaya 8.74 8.60 8.57 17.26 19.05 Mizoram 65.90 34.27 32.00 25.04 Nagaland 30.21 46.38 33.48 19.25 6.08 Sikkim 16.08 15.30 18.34 11.63 Tripura 10.40 25.15 30.58 28.49 18.17 All India 9.22 9.55 7.40 5.82 5.40
At all India level, 9.22 percent of net domestic product (NDP) from agriculture sector was invested for capital formation in agriculture by public sector during the first five years of decade of 1980s. However, during the second half of 1980s public resources spent for agricultural infrastructure
declined to 7.40 percent of NDP from agriculture. The decline continued during 1990s and current share of resources for capital formation is little more than 1/20th of the sectoral output.
Union government's contribution to capital formation in agriculture constituted about 1.80 percent of NDP from agriculture during late 1970s. The contribution has dwindled to 0.25 percent during the 1990s.
Among major states capital outlay on agriculture in J&K corresponds to about 1/4th to 1/5th of NSDP agriculture in different plan periods which is the highest. Among the remaining major states Maharashtra spent highest proportion of NSDP agriculture on agricultural infrastructure during 1974-75 to 1996-97. Though Punjab invested highest in agriculture capital on per hectare basis after J&K among major states, it did not occupy same position in respect of percent of NSDP agriculture spent on infrastructure.
Besides Maharashtra, Punjab and Jammu and Kashmir, agricultural investments on public account during 5th Plan exceeded 8 per cent of NSDP in states of Uttar Pradesh and Gujarat (Table 4.5). Assam, Bihar, Haryana, Kerala, Rajasthan, Tamil Nadu and West Bengal invested less than 5 percent of agricultural NSDP for capital formation in agriculture during 5th Plan. West Bengal remained at the bottom throughout in respect of agricultural investment.
In Bihar, share of public investment in agricultural NSDP dropped from around 6 percent during 1980s to less than 2 percent during 8th plan. Though Haryana is agriculturally progressive state, its allocation of NSDP agriculture to farm investment remained lower than the national average in percent term.
The information on percent of total NSDP spent for agricultural infrastructure is presented in Table 4.6. For the country as a whole, 4 percent of national income was spent for infrastructure development for agriculture sector during 5th Plan period. This share kept falling over time and during 8th Plan period less than one and a half percent of national income was ploughed back for capital formation in agriculture.
Share of each state and union government in All India capital expenditure on agriculture is given in Appendix Table 4.1.
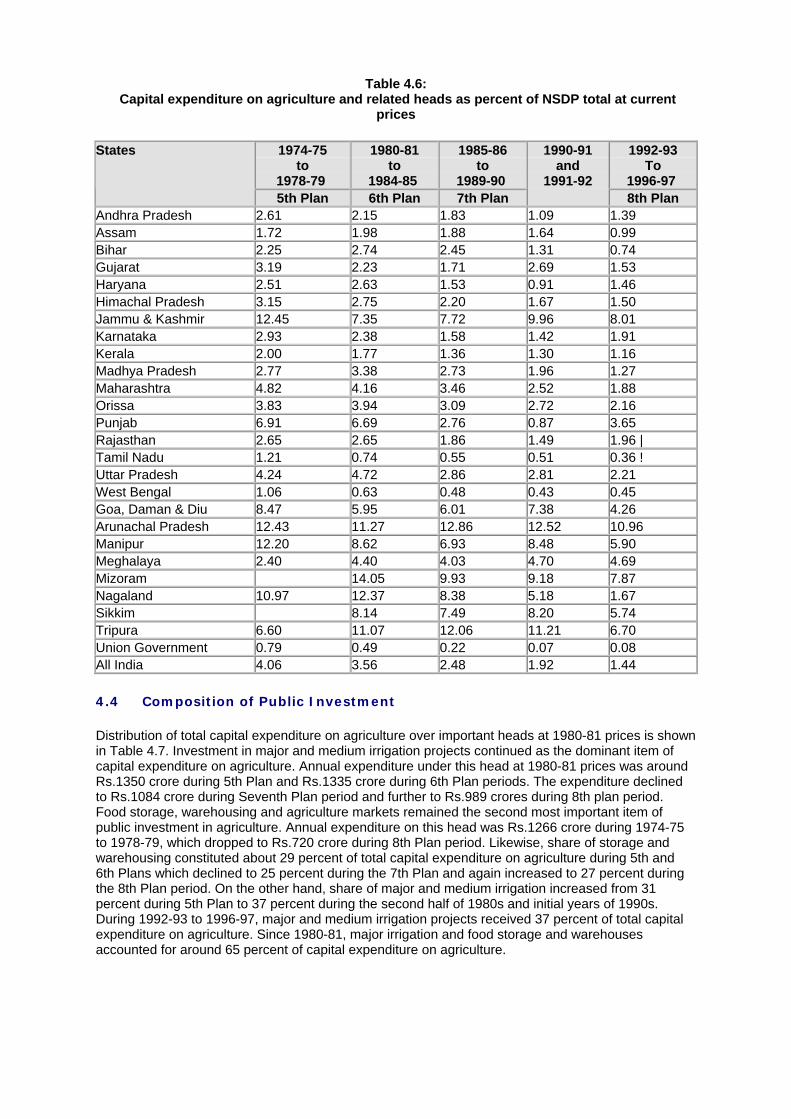
Table 4.6: Capital expenditure on agriculture and related heads as percent of NSDP total at current
prices
1974-75 to
1978-79
1980-81 to
1984-85
1985-86 to
1989-90
1992-93 To
1996-97
States
5th Plan 6th Plan 7th Plan
1990-91 and
1991-92 8th Plan
Andhra Pradesh 2.61 2.15 1.83 1.09 1.39 Assam 1.72 1.98 1.88 1.64 0.99 Bihar 2.25 2.74 2.45 1.31 0.74 Gujarat 3.19 2.23 1.71 2.69 1.53 Haryana 2.51 2.63 1.53 0.91 1.46 Himachal Pradesh 3.15 2.75 2.20 1.67 1.50 Jammu & Kashmir 12.45 7.35 7.72 9.96 8.01 Karnataka 2.93 2.38 1.58 1.42 1.91 Kerala 2.00 1.77 1.36 1.30 1.16 Madhya Pradesh 2.77 3.38 2.73 1.96 1.27 Maharashtra 4.82 4.16 3.46 2.52 1.88 Orissa 3.83 3.94 3.09 2.72 2.16 Punjab 6.91 6.69 2.76 0.87 3.65 Rajasthan 2.65 2.65 1.86 1.49 1.96 | Tamil Nadu 1.21 0.74 0.55 0.51 0.36 ! Uttar Pradesh 4.24 4.72 2.86 2.81 2.21 West Bengal 1.06 0.63 0.48 0.43 0.45 Goa, Daman & Diu 8.47 5.95 6.01 7.38 4.26 Arunachal Pradesh 12.43 11.27 12.86 12.52 10.96 Manipur 12.20 8.62 6.93 8.48 5.90 Meghalaya 2.40 4.40 4.03 4.70 4.69 Mizoram 14.05 9.93 9.18 7.87 Nagaland 10.97 12.37 8.38 5.18 1.67 Sikkim 8.14 7.49 8.20 5.74 Tripura 6.60 11.07 12.06 11.21 6.70 Union Government 0.79 0.49 0.22 0.07 0.08 All India 4.06 3.56 2.48 1.92 1.44
4.4 Composition of Public Investment
Distribution of total capital expenditure on agriculture over important heads at 1980-81 prices is shown in Table 4.7. Investment in major and medium irrigation projects continued as the dominant item of capital expenditure on agriculture. Annual expenditure under this head at 1980-81 prices was around Rs.1350 crore during 5th Plan and Rs.1335 crore during 6th Plan periods. The expenditure declined to Rs.1084 crore during Seventh Plan period and further to Rs.989 crores during 8th plan period. Food storage, warehousing and agriculture markets remained the second most important item of public investment in agriculture. Annual expenditure on this head was Rs.1266 crore during 1974-75 to 1978-79, which dropped to Rs.720 crore during 8th Plan period. Likewise, share of storage and warehousing constituted about 29 percent of total capital expenditure on agriculture during 5th and 6th Plans which declined to 25 percent during the 7th Plan and again increased to 27 percent during the 8th Plan period. On the other hand, share of major and medium irrigation increased from 31 percent during 5th Plan to 37 percent during the second half of 1980s and initial years of 1990s. During 1992-93 to 1996-97, major and medium irrigation projects received 37 percent of total capital expenditure on agriculture. Since 1980-81, major irrigation and food storage and warehouses accounted for around 65 percent of capital expenditure on agriculture.
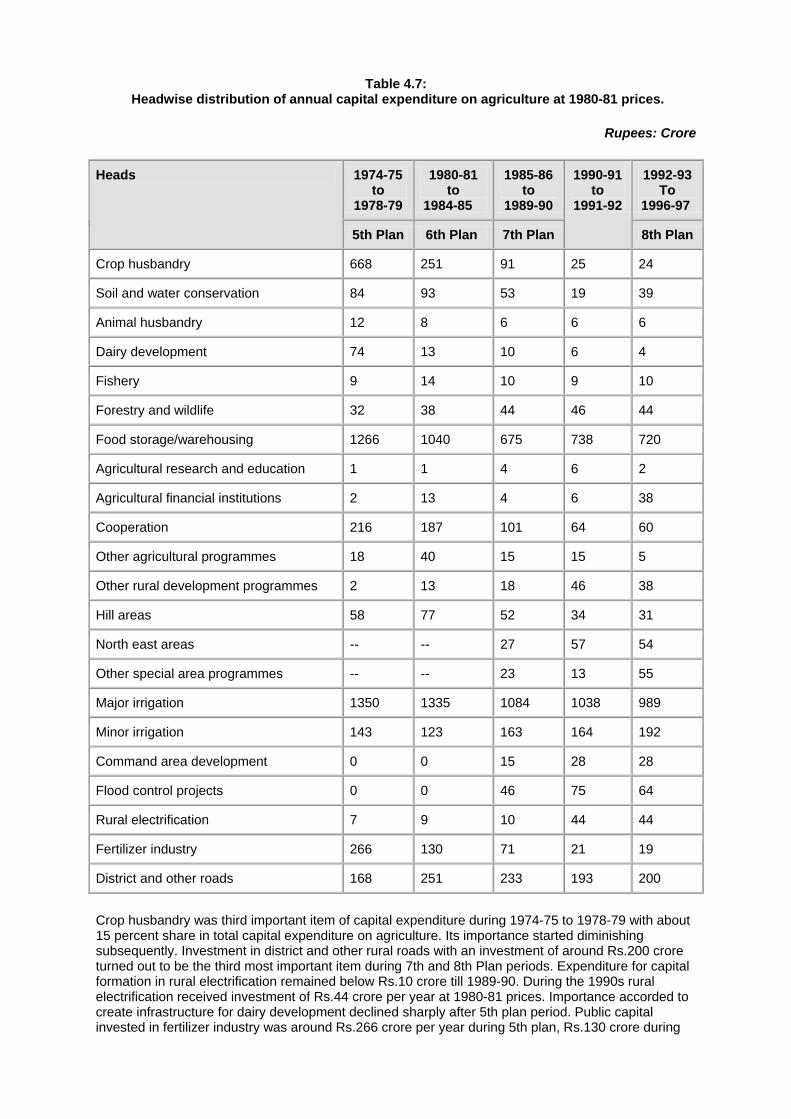
Table 4.7: Headwise distribution of annual capital expenditure on agriculture at 1980-81 prices.
Rupees: Crore
1974-75 to
1978-79
1980-81 to
1984-85
1985-86 to
1989-90
1992-93 To
1996-97
Heads
5th Plan 6th Plan 7th Plan
1990-91 to
1991-92
8th Plan
Crop husbandry 668 251 91 25 24
Soil and water conservation 84 93 53 19 39
Animal husbandry 12 8 6 6 6
Dairy development 74 13 10 6 4
Fishery 9 14 10 9 10
Forestry and wildlife 32 38 44 46 44
Food storage/warehousing 1266 1040 675 738 720
Agricultural research and education 1 1 4 6 2
Agricultural financial institutions 2 13 4 6 38
Cooperation 216 187 101 64 60
Other agricultural programmes 18 40 15 15 5
Other rural development programmes 2 13 18 46 38
Hill areas 58 77 52 34 31
North east areas -- -- 27 57 54
Other special area programmes -- -- 23 13 55
Major irrigation 1350 1335 1084 1038 989
Minor irrigation 143 123 163 164 192
Command area development 0 0 15 28 28
Flood control projects 0 0 46 75 64
Rural electrification 7 9 10 44 44
Fertilizer industry 266 130 71 21 19
District and other roads 168 251 233 193 200
Crop husbandry was third important item of capital expenditure during 1974-75 to 1978-79 with about 15 percent share in total capital expenditure on agriculture. Its importance started diminishing subsequently. Investment in district and other rural roads with an investment of around Rs.200 crore turned out to be the third most important item during 7th and 8th Plan periods. Expenditure for capital formation in rural electrification remained below Rs.10 crore till 1989-90. During the 1990s rural electrification received investment of Rs.44 crore per year at 1980-81 prices. Importance accorded to create infrastructure for dairy development declined sharply after 5th plan period. Public capital invested in fertilizer industry was around Rs.266 crore per year during 5th plan, Rs.130 crore during
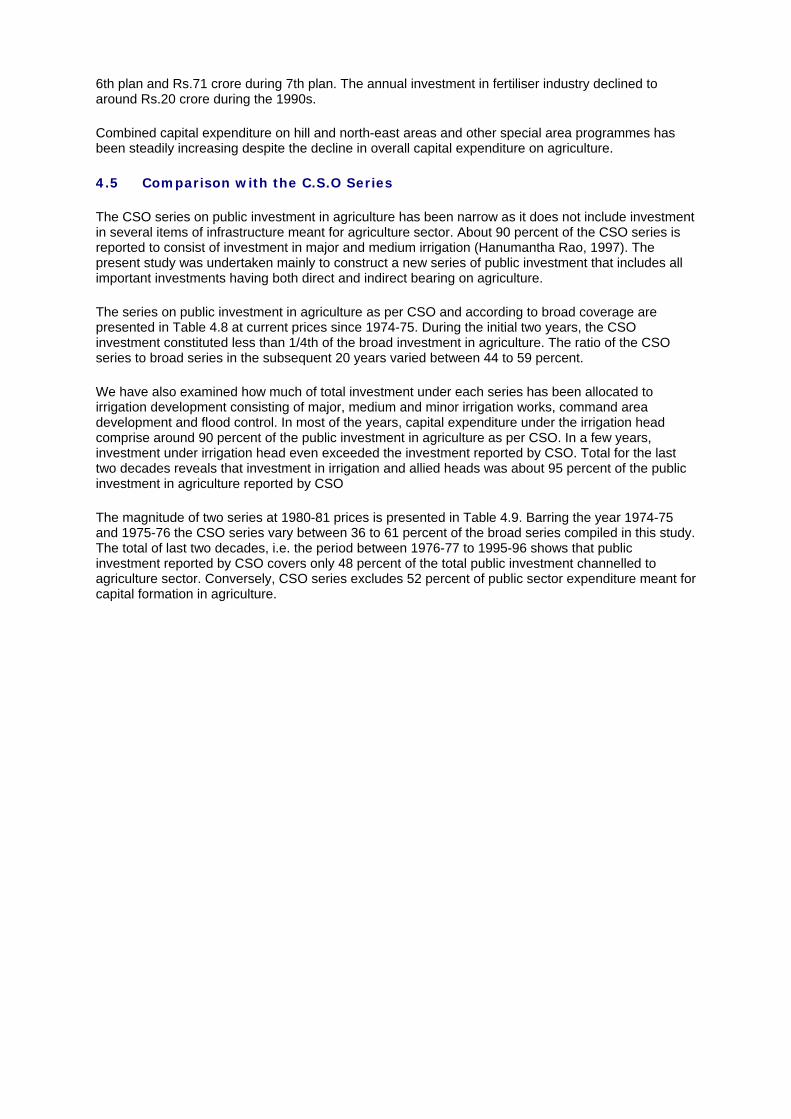
6th plan and Rs.71 crore during 7th plan. The annual investment in fertiliser industry declined to around Rs.20 crore during the 1990s.
Combined capital expenditure on hill and north-east areas and other special area programmes has been steadily increasing despite the decline in overall capital expenditure on agriculture.
4.5 Comparison with the C.S.O Series
The CSO series on public investment in agriculture has been narrow as it does not include investment in several items of infrastructure meant for agriculture sector. About 90 percent of the CSO series is reported to consist of investment in major and medium irrigation (Hanumantha Rao, 1997). The present study was undertaken mainly to construct a new series of public investment that includes all important investments having both direct and indirect bearing on agriculture.
The series on public investment in agriculture as per CSO and according to broad coverage are presented in Table 4.8 at current prices since 1974-75. During the initial two years, the CSO investment constituted less than 1/4th of the broad investment in agriculture. The ratio of the CSO series to broad series in the subsequent 20 years varied between 44 to 59 percent.
We have also examined how much of total investment under each series has been allocated to irrigation development consisting of major, medium and minor irrigation works, command area development and flood control. In most of the years, capital expenditure under the irrigation head comprise around 90 percent of the public investment in agriculture as per CSO. In a few years, investment under irrigation head even exceeded the investment reported by CSO. Total for the last two decades reveals that investment in irrigation and allied heads was about 95 percent of the public investment in agriculture reported by CSO
The magnitude of two series at 1980-81 prices is presented in Table 4.9. Barring the year 1974-75 and 1975-76 the CSO series vary between 36 to 61 percent of the broad series compiled in this study. The total of last two decades, i.e. the period between 1976-77 to 1995-96 shows that public investment reported by CSO covers only 48 percent of the total public investment channelled to agriculture sector. Conversely, CSO series excludes 52 percent of public sector expenditure meant for capital formation in agriculture.
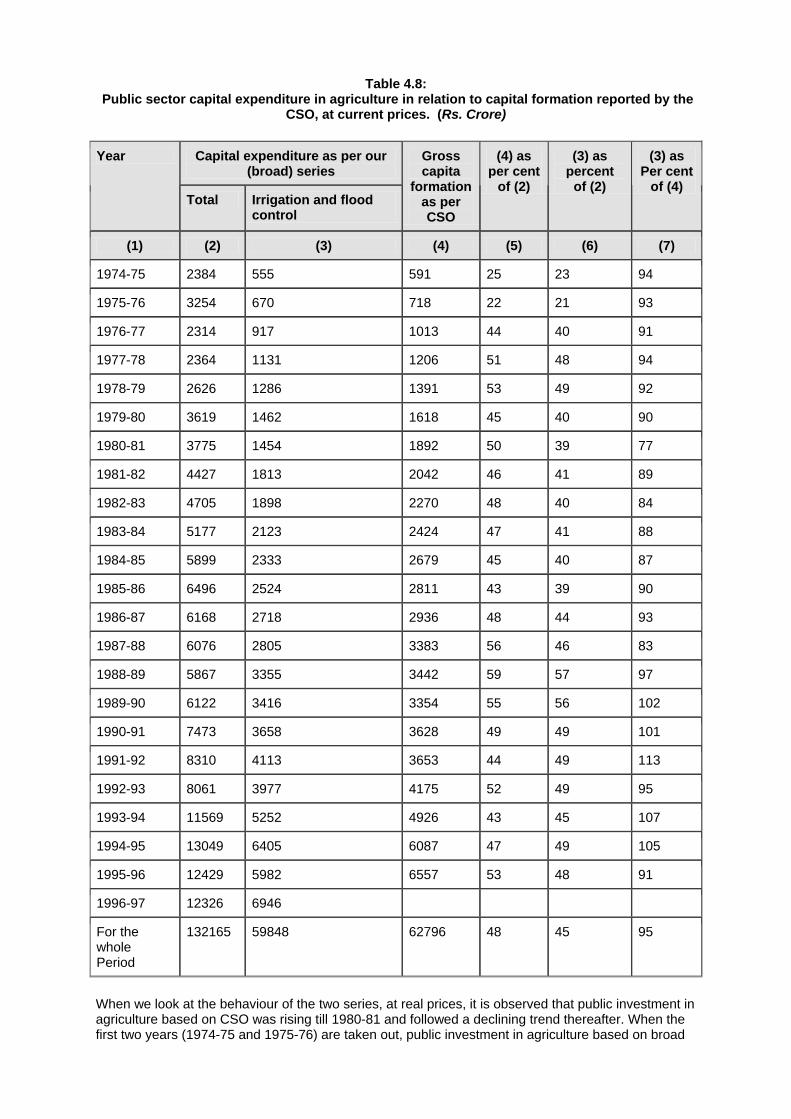
Table 4.8: Public sector capital expenditure in agriculture in relation to capital formation reported by the
CSO, at current prices. (Rs. Crore)
Capital expenditure as per our (broad) series
Year
Total Irrigation and flood control
Gross capita
formation as per CSO
(4) as per cent
of (2)
(3) as percent
of (2)
(3) as Per cent
of (4)
(1) (2) (3) (4) (5) (6) (7)
1974-75 2384 555 591 25 23 94
1975-76 3254 670 718 22 21 93
1976-77 2314 917 1013 44 40 91
1977-78 2364 1131 1206 51 48 94
1978-79 2626 1286 1391 53 49 92
1979-80 3619 1462 1618 45 40 90
1980-81 3775 1454 1892 50 39 77
1981-82 4427 1813 2042 46 41 89
1982-83 4705 1898 2270 48 40 84
1983-84 5177 2123 2424 47 41 88
1984-85 5899 2333 2679 45 40 87
1985-86 6496 2524 2811 43 39 90
1986-87 6168 2718 2936 48 44 93
1987-88 6076 2805 3383 56 46 83
1988-89 5867 3355 3442 59 57 97
1989-90 6122 3416 3354 55 56 102
1990-91 7473 3658 3628 49 49 101
1991-92 8310 4113 3653 44 49 113
1992-93 8061 3977 4175 52 49 95
1993-94 11569 5252 4926 43 45 107
1994-95 13049 6405 6087 47 49 105
1995-96 12429 5982 6557 53 48 91
1996-97 12326 6946
For the whole Period
132165 59848 62796 48 45 95
When we look at the behaviour of the two series, at real prices, it is observed that public investment in agriculture based on CSO was rising till 1980-81 and followed a declining trend thereafter. When the first two years (1974-75 and 1975-76) are taken out, public investment in agriculture based on broad
series reached peak level of Rs. 4747 crore in 1979-80, which is one year before the peak of CSO series. Thereafter, broad series also indicate declining trend like the CSO series. Thus, it is not correct to say that public investment for agriculture, which includes all major heads like rural It would be interesting to find whether public investment in irrigation has declined at a different rate compared to the public investment in other agricultural infrastructure. This has been done by computing trend growth rates in CSO series and capital expenditure on irrigation and allied heads and other heads as included in the broad series. Some inference regarding this can also be drawn by looking at the behaviour of the two series presented in Fig. 4.2.
Table 4.9: Public investment in agriculture according to CSO and broad series and capital expenditure
on irrigation and other heads, at 1980-81 prices
Rupees:crore
Year CSO Broad Series
(2) as per cent of (3)
Irrigation and allied
(5) as per cent of (2)
(1) (2) (3) (4) (5)
Other heads
(6) 1974-75 991 4672 21 1087 3586 110
1975-76 1041 5861 18 1207 4654 116
1976-77 1378 3833 36 1519 2314 110
1977-78 1534 3736 41 1787 1949 117
1978-79 1697 3812 45 1867 1945 110
1979-80 1772 4747 37 1917 2829 108
1980-81 1892 3775 50 1454 2321 77
1981-82 1878 3887 48 1592 2295 85
1982-83 1857 3503 53 1413 2089 76
1983-84 1843 3507 53 1438 2069 78
1984-85 1822 3523 52 1394 2130 76
1985-86 1631 3451 47 1341 2110 82
1986-87 1550 2934 53 1293 1641 83
1987-88 1580 2690 59 1242 1448 79
1988-89 1485 2431 61 1390 1041 94
1989-90 1301 2284 57 1274 1009 98
1990-91 1315 2644 50 1294 1350 98
1991-92 1135 2663 43 1318 1345 116
1992-93 1179 2239 53 1105 1134 94
1993-94 1272 2914 44 1323 1591 104
1994-95 1438 2959 49 1452 1506 101
1995-96 1250 2537 49 1221 1316 98
Sum of 1976/77 to 1995/96
30809 4067 48 28634 35433 93
During the period 1974-75 to 1981-82 public investment in agriculture as per the CSO series increased at the trend rate of about 10 percent whereas growth in broad series was negative but non significant. When total capital expenditure on agriculture as per the broad series was divided into two parts, namely expenditure on irrigation and expenditure on other heads, the former showed positive and the latter showed negative growth though both were statistically non significant (Table 4.10).
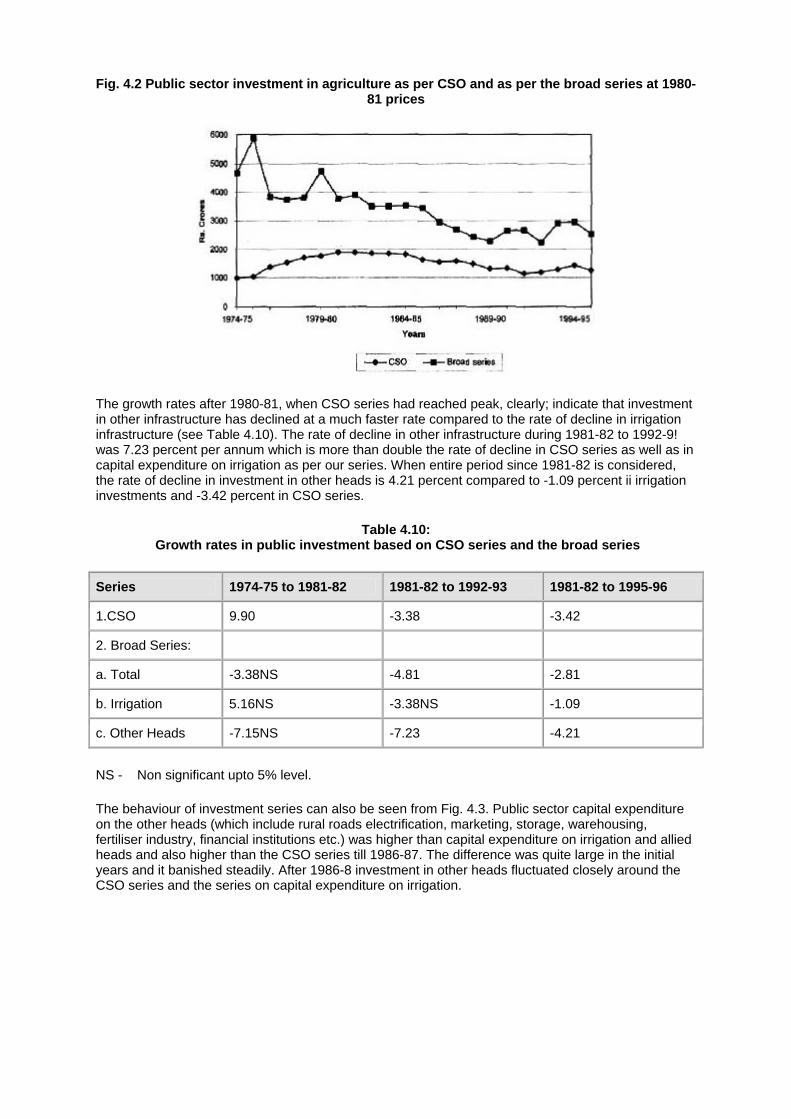
Fig. 4.2 Public sector investment in agriculture as per CSO and as per the broad series at 1980-81 prices
The growth rates after 1980-81, when CSO series had reached peak, clearly; indicate that investment in other infrastructure has declined at a much faster rate compared to the rate of decline in irrigation infrastructure (see Table 4.10). The rate of decline in other infrastructure during 1981-82 to 1992-9! was 7.23 percent per annum which is more than double the rate of decline in CSO series as well as in capital expenditure on irrigation as per our series. When entire period since 1981-82 is considered, the rate of decline in investment in other heads is 4.21 percent compared to -1.09 percent ii irrigation investments and -3.42 percent in CSO series.
Table 4.10: Growth rates in public investment based on CSO series and the broad series
Series 1974-75 to 1981-82 1981-82 to 1992-93 1981-82 to 1995-96
1.CSO 9.90 -3.38 -3.42
2. Broad Series:
a. Total -3.38NS -4.81 -2.81
b. Irrigation 5.16NS -3.38NS -1.09
c. Other Heads -7.15NS -7.23 -4.21
NS - Non significant upto 5% level.
The behaviour of investment series can also be seen from Fig. 4.3. Public sector capital expenditure on the other heads (which include rural roads electrification, marketing, storage, warehousing, fertiliser industry, financial institutions etc.) was higher than capital expenditure on irrigation and allied heads and also higher than the CSO series till 1986-87. The difference was quite large in the initial years and it banished steadily. After 1986-8 investment in other heads fluctuated closely around the CSO series and the series on capital expenditure on irrigation.
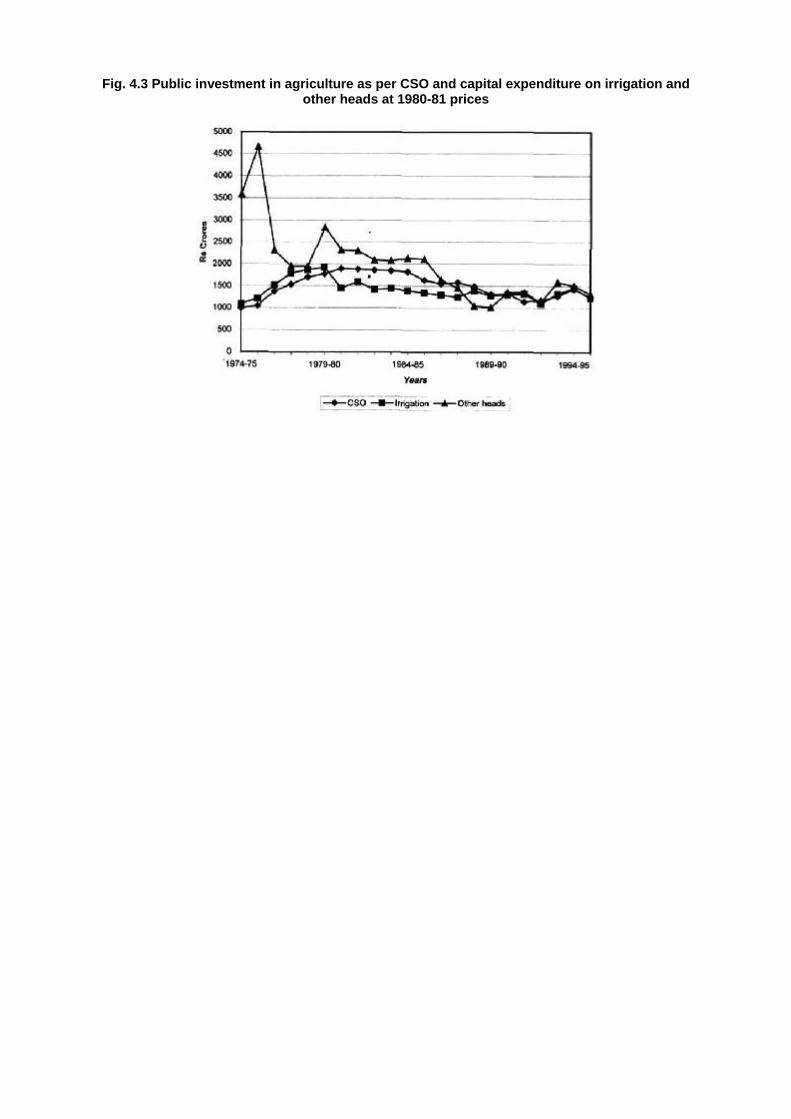
Fig. 4.3 Public investment in agriculture as per CSO and capital expenditure on irrigation and other heads at 1980-81 prices
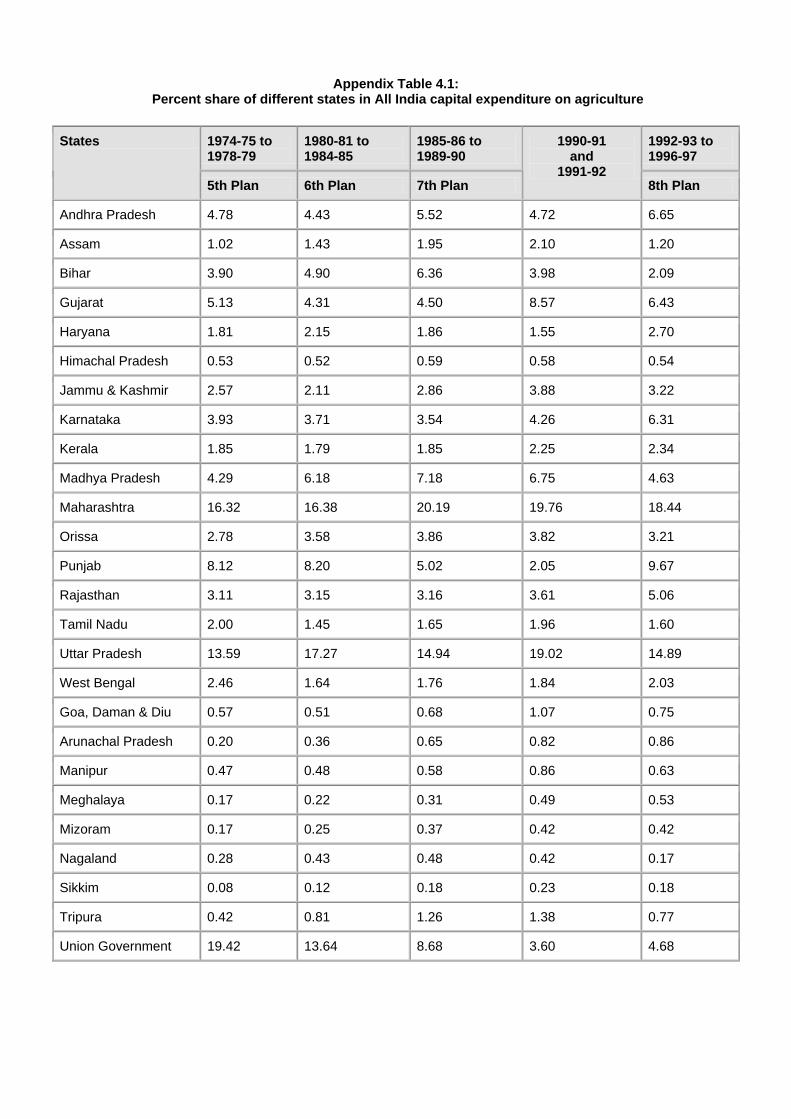
Appendix Table 4.1: Percent share of different states in All India capital expenditure on agriculture
1974-75 to 1978-79
1980-81 to 1984-85
1985-86 to 1989-90
1992-93 to 1996-97
States
5th Plan 6th Plan 7th Plan
1990-91 and
1991-92 8th Plan
Andhra Pradesh 4.78 4.43 5.52 4.72 6.65
Assam 1.02 1.43 1.95 2.10 1.20
Bihar 3.90 4.90 6.36 3.98 2.09
Gujarat 5.13 4.31 4.50 8.57 6.43
Haryana 1.81 2.15 1.86 1.55 2.70
Himachal Pradesh 0.53 0.52 0.59 0.58 0.54
Jammu & Kashmir 2.57 2.11 2.86 3.88 3.22
Karnataka 3.93 3.71 3.54 4.26 6.31
Kerala 1.85 1.79 1.85 2.25 2.34
Madhya Pradesh 4.29 6.18 7.18 6.75 4.63
Maharashtra 16.32 16.38 20.19 19.76 18.44
Orissa 2.78 3.58 3.86 3.82 3.21
Punjab 8.12 8.20 5.02 2.05 9.67
Rajasthan 3.11 3.15 3.16 3.61 5.06
Tamil Nadu 2.00 1.45 1.65 1.96 1.60
Uttar Pradesh 13.59 17.27 14.94 19.02 14.89
West Bengal 2.46 1.64 1.76 1.84 2.03
Goa, Daman & Diu 0.57 0.51 0.68 1.07 0.75
Arunachal Pradesh 0.20 0.36 0.65 0.82 0.86
Manipur 0.47 0.48 0.58 0.86 0.63
Meghalaya 0.17 0.22 0.31 0.49 0.53
Mizoram 0.17 0.25 0.37 0.42 0.42
Nagaland 0.28 0.43 0.48 0.42 0.17
Sikkim 0.08 0.12 0.18 0.23 0.18
Tripura 0.42 0.81 1.26 1.38 0.77
Union Government 19.42 13.64 8.68 3.60 4.68
5 PRIVATE INVESTMENT IN AGRICULTURE Time series information on private fixed capital formation in agriculture at country level is furnished by CSO However, neither CSO nor state level statistical departments provide this information except for one or two states. Some recent studies have used statewise estimates of private investment in agriculture reported in the nation-wide survey All India Debt and Investment Survey 1981-82, brought out by Reserve Bank of India, to find out the determinants of private capital formation (Dhawan and Yadav, 1995; Dhawan, 1996a, 1996b; Dhawan, 1997). Similar nation-wide survey for the year 1991-92 has been carried out by National Sample Survey Organisation of GOI, results of which are presented in the report Household Capital Expenditure During 1.7.91 to 30.6.92 - Debt and Investment Survey, report no. 437. This report has been published in September 1998. There are similarities in the two surveys and the concepts and definitions followed in the two are comparable.
Both these nation-wide surveys provide estimates of fixed capital formation by different categories of households in (i) farm business, (ii) non-farm business and (iii) residential plots and buildings. Information is also available for cultivators and non-cultivator households in rural areas, and self employed and non-self employed households in urban areas.
Using the information available in these two nation-wide surveys, estimates of fixed capital formation in agriculture (FCFA) by private sector have been arrived at by multiplying per households FCFA with the number of households (rural and urban).
5.1 Country Level Estimates of FCFA
Country level estimates of fixed capital formation in agriculture on private account according to the nation wide surveys and according to CSO are presented in Table 5.1.
According to CSO, private investment in agriculture was Rs. 3170 crore during 1981-82 which increased to Rs. 11123 crores during 1991-92. Private fixed investment in agriculture based on the RBI and NSSO survey was Rs. 1445 crore during 1981-82 and Rs. 4801 crore during 1991-92. The private investment according to nation wide surveys was around 46 percent of the CSO estimate. This is surprising because nation wide surveys are reported to be the basis for preparing the CSO estimates.
Table 5.1: Country level estimates of fixed private capital formation ii agriculture at current prices
Rs. crore
Source 1981-82 1991-92 1.CSO 3170 11123 2. Nation wide survey RBI N.S.S.O. All Households 1445 4801 By cultivators 1266 (87.61)* 4213 (87.46 )*
* Percent of FCFA by all households.
According to these nation wide surveys about 87 percent of FCFA cam from cultivator households. These estimates at state level show that in son-states non-cultivating households contributed as high as 25 percent of fixed investment in agriculture.
Similarly, in some states urban households contributed about 23 percent total private fixed investment in agriculture. Due to large contributions Made by rural non-cultivating households and urban households to FCFA in sort states, the statewise estimates of FCFA were prepared by taking in
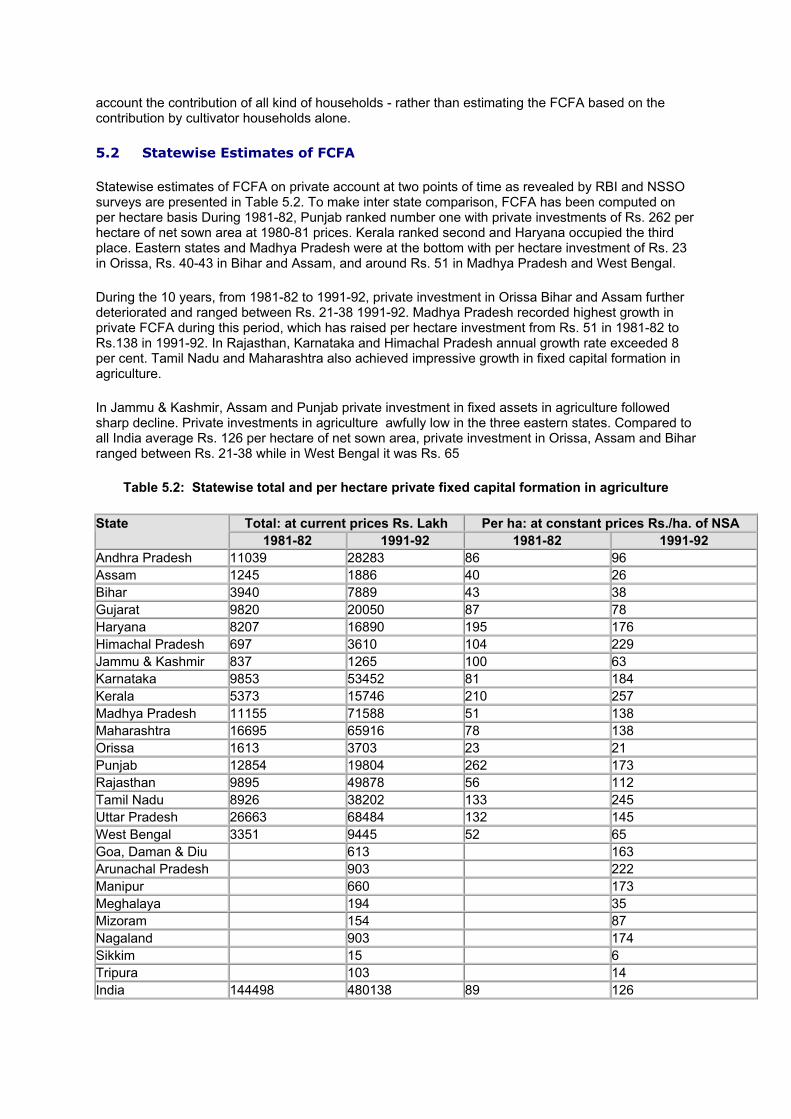
account the contribution of all kind of households - rather than estimating the FCFA based on the contribution by cultivator households alone.
5.2 Statewise Estimates of FCFA
Statewise estimates of FCFA on private account at two points of time as revealed by RBI and NSSO surveys are presented in Table 5.2. To make inter state comparison, FCFA has been computed on per hectare basis During 1981-82, Punjab ranked number one with private investments of Rs. 262 per hectare of net sown area at 1980-81 prices. Kerala ranked second and Haryana occupied the third place. Eastern states and Madhya Pradesh were at the bottom with per hectare investment of Rs. 23 in Orissa, Rs. 40-43 in Bihar and Assam, and around Rs. 51 in Madhya Pradesh and West Bengal.
During the 10 years, from 1981-82 to 1991-92, private investment in Orissa Bihar and Assam further deteriorated and ranged between Rs. 21-38 1991-92. Madhya Pradesh recorded highest growth in private FCFA during this period, which has raised per hectare investment from Rs. 51 in 1981-82 to Rs.138 in 1991-92. In Rajasthan, Karnataka and Himachal Pradesh annual growth rate exceeded 8 per cent. Tamil Nadu and Maharashtra also achieved impressive growth in fixed capital formation in agriculture.
In Jammu & Kashmir, Assam and Punjab private investment in fixed assets in agriculture followed sharp decline. Private investments in agriculture awfully low in the three eastern states. Compared to all India average Rs. 126 per hectare of net sown area, private investment in Orissa, Assam and Bihar ranged between Rs. 21-38 while in West Bengal it was Rs. 65
Table 5.2: Statewise total and per hectare private fixed capital formation in agriculture
Total: at current prices Rs. Lakh Per ha: at constant prices Rs./ha. of NSA State 1981-82 1991-92 1981-82 1991-92
Andhra Pradesh 11039 28283 86 96 Assam 1245 1886 40 26 Bihar 3940 7889 43 38 Gujarat 9820 20050 87 78 Haryana 8207 16890 195 176 Himachal Pradesh 697 3610 104 229 Jammu & Kashmir 837 1265 100 63 Karnataka 9853 53452 81 184 Kerala 5373 15746 210 257 Madhya Pradesh 11155 71588 51 138 Maharashtra 16695 65916 78 138 Orissa 1613 3703 23 21 Punjab 12854 19804 262 173 Rajasthan 9895 49878 56 112 Tamil Nadu 8926 38202 133 245 Uttar Pradesh 26663 68484 132 145 West Bengal 3351 9445 52 65 Goa, Daman & Diu 613 163 Arunachal Pradesh 903 222 Manipur 660 173 Meghalaya 194 35 Mizoram 154 87 Nagaland 903 174 Sikkim 15 6 Tripura 103 14 India 144498 480138 89 126
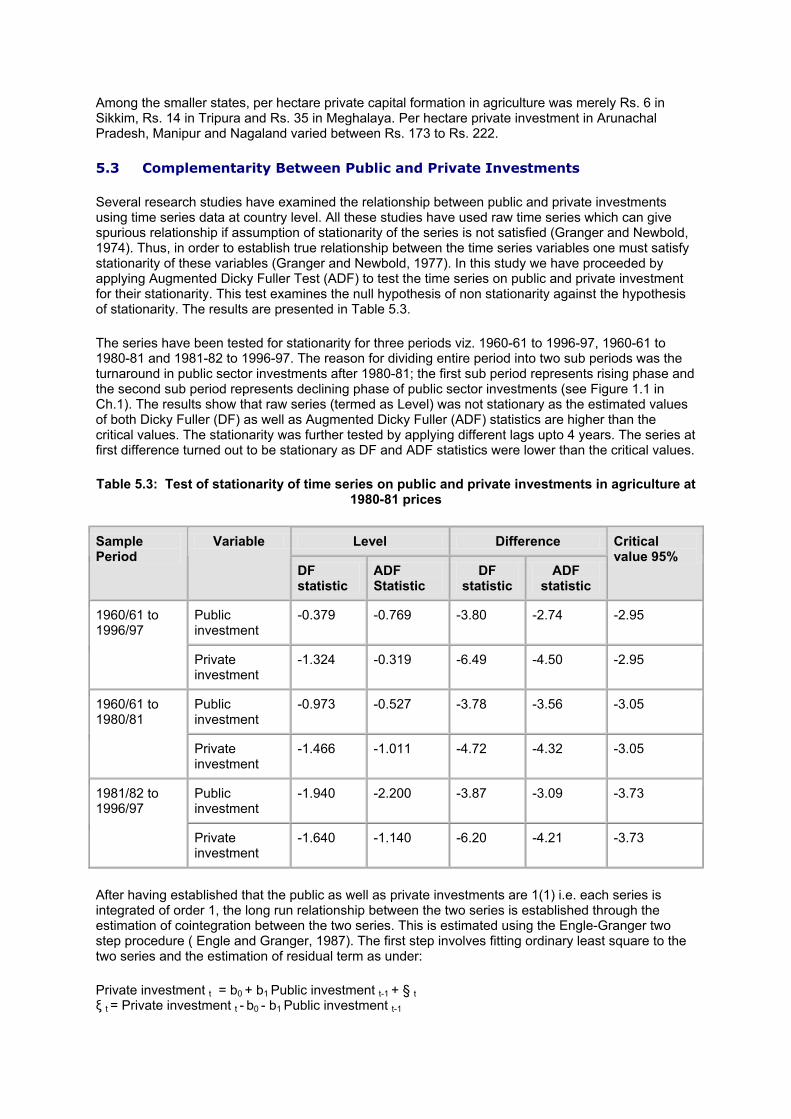
Among the smaller states, per hectare private capital formation in agriculture was merely Rs. 6 in Sikkim, Rs. 14 in Tripura and Rs. 35 in Meghalaya. Per hectare private investment in Arunachal Pradesh, Manipur and Nagaland varied between Rs. 173 to Rs. 222.
5.3 Complementarity Between Public and Private Investments
Several research studies have examined the relationship between public and private investments using time series data at country level. All these studies have used raw time series which can give spurious relationship if assumption of stationarity of the series is not satisfied (Granger and Newbold, 1974). Thus, in order to establish true relationship between the time series variables one must satisfy stationarity of these variables (Granger and Newbold, 1977). In this study we have proceeded by applying Augmented Dicky Fuller Test (ADF) to test the time series on public and private investment for their stationarity. This test examines the null hypothesis of non stationarity against the hypothesis of stationarity. The results are presented in Table 5.3.
The series have been tested for stationarity for three periods viz. 1960-61 to 1996-97, 1960-61 to 1980-81 and 1981-82 to 1996-97. The reason for dividing entire period into two sub periods was the turnaround in public sector investments after 1980-81; the first sub period represents rising phase and the second sub period represents declining phase of public sector investments (see Figure 1.1 in Ch.1). The results show that raw series (termed as Level) was not stationary as the estimated values of both Dicky Fuller (DF) as well as Augmented Dicky Fuller (ADF) statistics are higher than the critical values. The stationarity was further tested by applying different lags upto 4 years. The series at first difference turned out to be stationary as DF and ADF statistics were lower than the critical values.
Table 5.3: Test of stationarity of time series on public and private investments in agriculture at 1980-81 prices
Level Difference Sample Period
Variable
DF statistic
ADF Statistic
DF statistic
ADF statistic
Critical value 95%
Public investment
-0.379 -0.769 -3.80 -2.74 -2.95 1960/61 to 1996/97
Private investment
-1.324 -0.319 -6.49 -4.50 -2.95
Public investment
-0.973 -0.527 -3.78 -3.56 -3.05 1960/61 to 1980/81
Private investment
-1.466 -1.011 -4.72 -4.32 -3.05
Public investment
-1.940 -2.200 -3.87 -3.09 -3.73 1981/82 to 1996/97
Private investment
-1.640 -1.140 -6.20 -4.21 -3.73
After having established that the public as well as private investments are 1(1) i.e. each series is integrated of order 1, the long run relationship between the two series is established through the estimation of cointegration between the two series. This is estimated using the Engle-Granger two step procedure ( Engle and Granger, 1987). The first step involves fitting ordinary least square to the two series and the estimation of residual term as under:
Private investment t = b0 + b1 Public investment t-1 + § t ξ t = Private investment t - b0 - b1 Public investment t-1
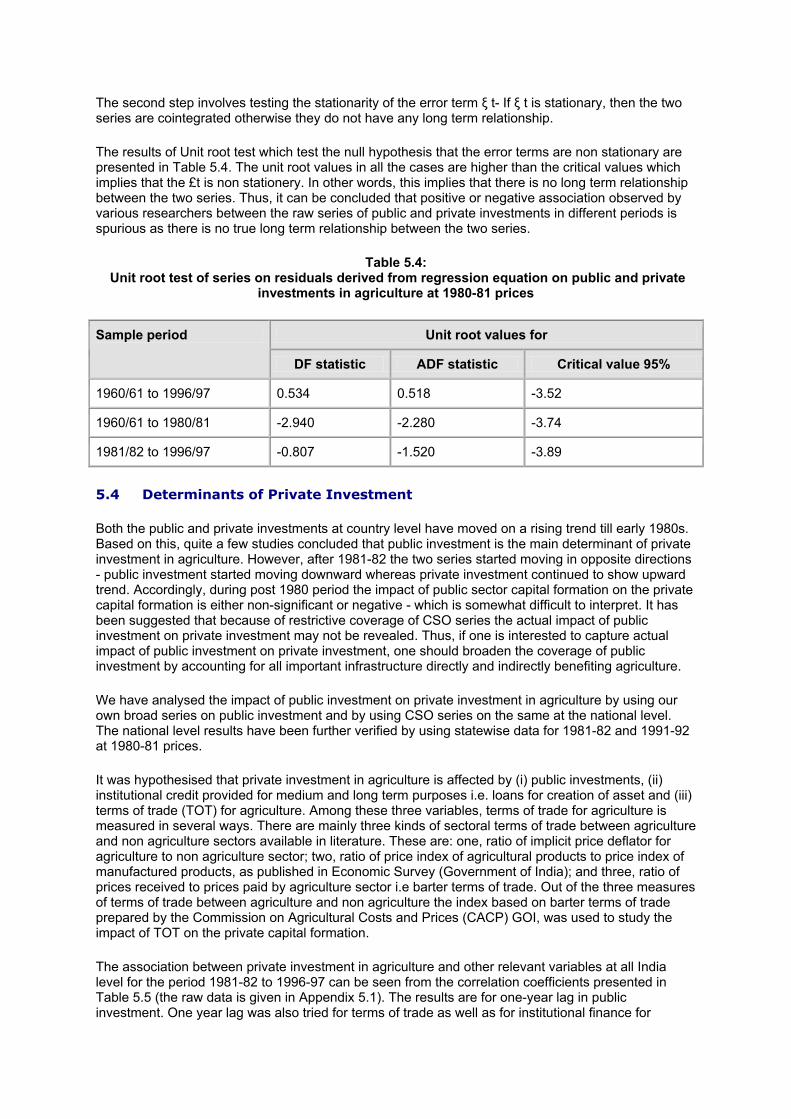
The second step involves testing the stationarity of the error term ξ t- If ξ t is stationary, then the two series are cointegrated otherwise they do not have any long term relationship.
The results of Unit root test which test the null hypothesis that the error terms are non stationary are presented in Table 5.4. The unit root values in all the cases are higher than the critical values which implies that the £t is non stationery. In other words, this implies that there is no long term relationship between the two series. Thus, it can be concluded that positive or negative association observed by various researchers between the raw series of public and private investments in different periods is spurious as there is no true long term relationship between the two series.
Table 5.4: Unit root test of series on residuals derived from regression equation on public and private
investments in agriculture at 1980-81 prices
Unit root values for Sample period
DF statistic ADF statistic Critical value 95%
1960/61 to 1996/97 0.534 0.518 -3.52
1960/61 to 1980/81 -2.940 -2.280 -3.74
1981/82 to 1996/97 -0.807 -1.520 -3.89
5.4 Determinants of Private Investment
Both the public and private investments at country level have moved on a rising trend till early 1980s. Based on this, quite a few studies concluded that public investment is the main determinant of private investment in agriculture. However, after 1981-82 the two series started moving in opposite directions - public investment started moving downward whereas private investment continued to show upward trend. Accordingly, during post 1980 period the impact of public sector capital formation on the private capital formation is either non-significant or negative - which is somewhat difficult to interpret. It has been suggested that because of restrictive coverage of CSO series the actual impact of public investment on private investment may not be revealed. Thus, if one is interested to capture actual impact of public investment on private investment, one should broaden the coverage of public investment by accounting for all important infrastructure directly and indirectly benefiting agriculture.
We have analysed the impact of public investment on private investment in agriculture by using our own broad series on public investment and by using CSO series on the same at the national level. The national level results have been further verified by using statewise data for 1981-82 and 1991-92 at 1980-81 prices.
It was hypothesised that private investment in agriculture is affected by (i) public investments, (ii) institutional credit provided for medium and long term purposes i.e. loans for creation of asset and (iii) terms of trade (TOT) for agriculture. Among these three variables, terms of trade for agriculture is measured in several ways. There are mainly three kinds of sectoral terms of trade between agriculture and non agriculture sectors available in literature. These are: one, ratio of implicit price deflator for agriculture to non agriculture sector; two, ratio of price index of agricultural products to price index of manufactured products, as published in Economic Survey (Government of India); and three, ratio of prices received to prices paid by agriculture sector i.e barter terms of trade. Out of the three measures of terms of trade between agriculture and non agriculture the index based on barter terms of trade prepared by the Commission on Agricultural Costs and Prices (CACP) GOI, was used to study the impact of TOT on the private capital formation.
The association between private investment in agriculture and other relevant variables at all India level for the period 1981-82 to 1996-97 can be seen from the correlation coefficients presented in Table 5.5 (the raw data is given in Appendix 5.1). The results are for one-year lag in public investment. One year lag was also tried for terms of trade as well as for institutional finance for
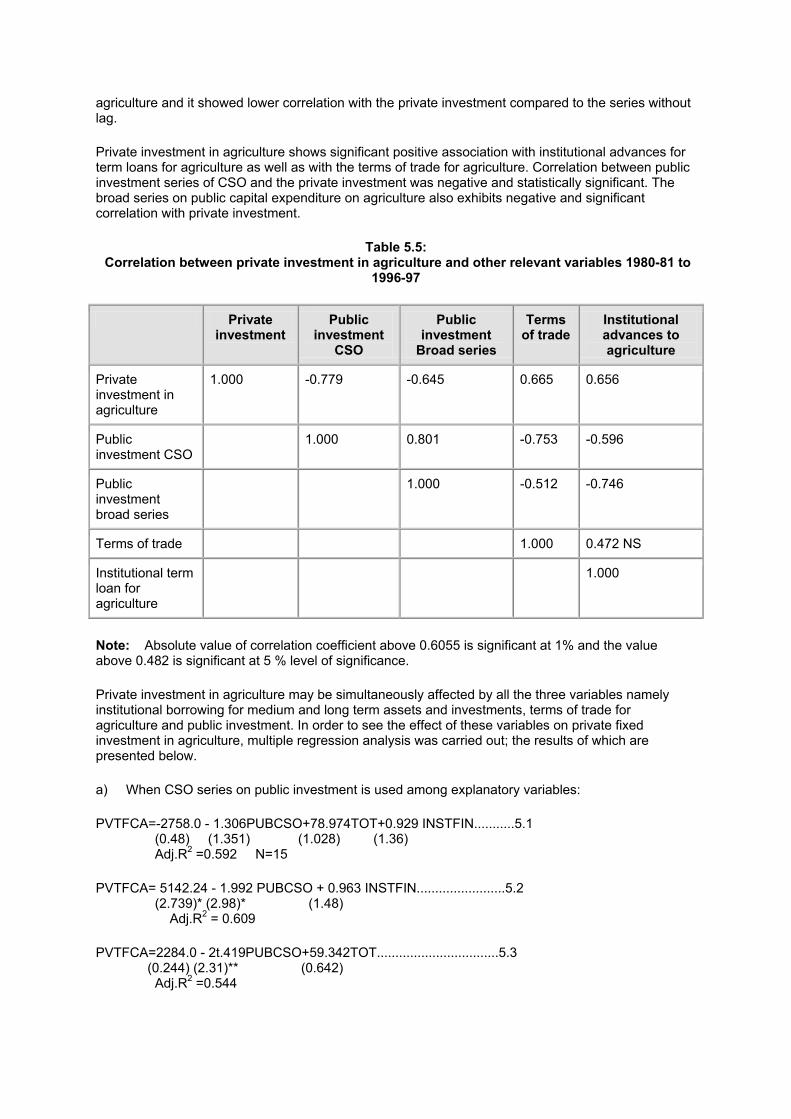
agriculture and it showed lower correlation with the private investment compared to the series without lag.
Private investment in agriculture shows significant positive association with institutional advances for term loans for agriculture as well as with the terms of trade for agriculture. Correlation between public investment series of CSO and the private investment was negative and statistically significant. The broad series on public capital expenditure on agriculture also exhibits negative and significant correlation with private investment.
Table 5.5: Correlation between private investment in agriculture and other relevant variables 1980-81 to
1996-97
Private investment
Public investment
CSO
Public investment
Broad series
Terms of trade
Institutional advances to agriculture
Private investment in agriculture
1.000 -0.779 -0.645 0.665 0.656
Public investment CSO
1.000 0.801 -0.753 -0.596
Public investment broad series
1.000 -0.512 -0.746
Terms of trade 1.000 0.472 NS
Institutional term loan for agriculture
1.000
Note: Absolute value of correlation coefficient above 0.6055 is significant at 1% and the value above 0.482 is significant at 5 % level of significance.
Private investment in agriculture may be simultaneously affected by all the three variables namely institutional borrowing for medium and long term assets and investments, terms of trade for agriculture and public investment. In order to see the effect of these variables on private fixed investment in agriculture, multiple regression analysis was carried out; the results of which are presented below.
a) When CSO series on public investment is used among explanatory variables:
PVTFCA=-2758.0 - 1.306PUBCSO+78.974TOT+0.929 INSTFIN...........5.1 (0.48) (1.351) (1.028) (1.36) Adj.R2 =0.592 N=15
PVTFCA= 5142.24 - 1.992 PUBCSO + 0.963 INSTFIN........................5.2 (2.739)* (2.98)* (1.48) Adj.R2 = 0.609
PVTFCA=2284.0 - 2t.419PUBCSO+59.342TOT.................................5.3 (0.244) (2.31)** (0.642) Adj.R2 =0.544
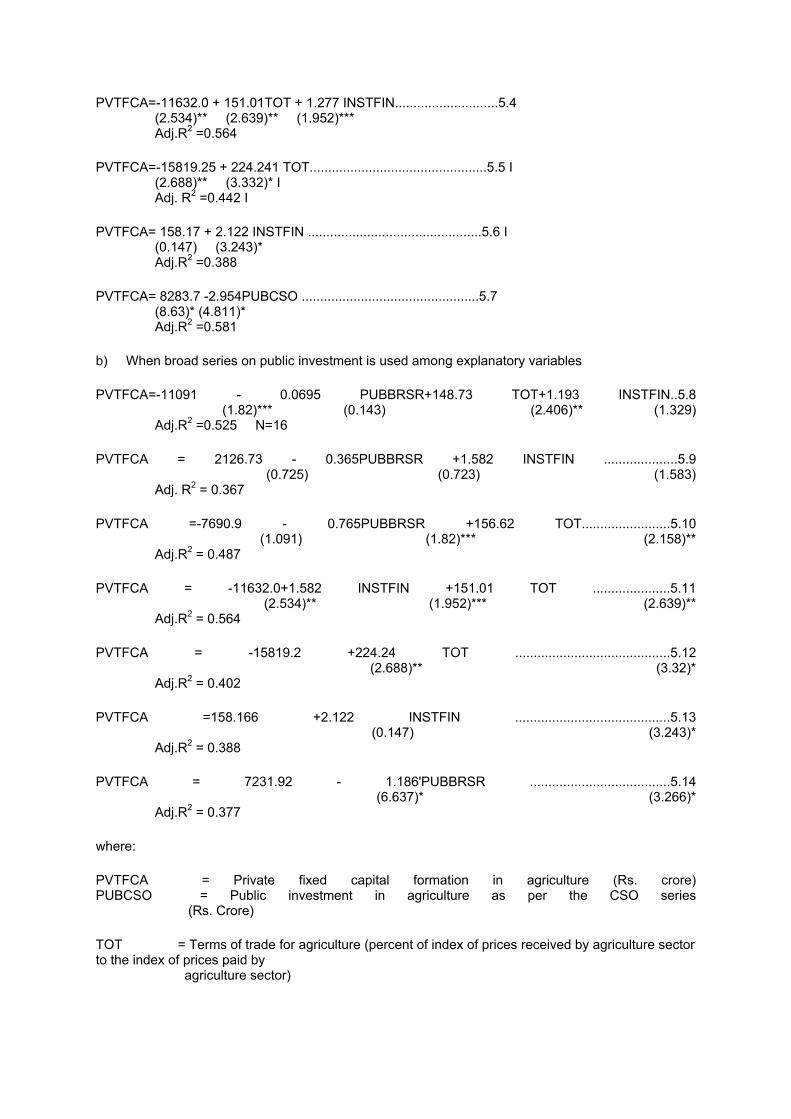
PVTFCA=-11632.0 + 151.01TOT + 1.277 INSTFIN............................5.4 (2.534)** (2.639)** (1.952)*** Adj.R2 =0.564
PVTFCA=-15819.25 + 224.241 TOT................................................5.5 I (2.688)** (3.332)* I Adj. R2 =0.442 I
PVTFCA= 158.17 + 2.122 INSTFIN ...............................................5.6 I (0.147) (3.243)* Adj.R2 =0.388
PVTFCA= 8283.7 -2.954PUBCSO ................................................5.7 (8.63)* (4.811)* Adj.R2 =0.581
b) When broad series on public investment is used among explanatory variables
PVTFCA=-11091 - 0.0695 PUBBRSR+148.73 TOT+1.193 INSTFIN..5.8 (1.82)*** (0.143) (2.406)** (1.329) Adj.R2 =0.525 N=16
PVTFCA = 2126.73 - 0.365PUBBRSR +1.582 INSTFIN ....................5.9 (0.725) (0.723) (1.583) Adj. R2 = 0.367
PVTFCA =-7690.9 - 0.765PUBBRSR +156.62 TOT........................5.10 (1.091) (1.82)*** (2.158)** Adj.R2 = 0.487
PVTFCA = -11632.0+1.582 INSTFIN +151.01 TOT .....................5.11 (2.534)** (1.952)*** (2.639)** Adj.R2 = 0.564
PVTFCA = -15819.2 +224.24 TOT ..........................................5.12 (2.688)** (3.32)* Adj.R2 = 0.402
PVTFCA =158.166 +2.122 INSTFIN ..........................................5.13 (0.147) (3.243)* Adj.R2 = 0.388
PVTFCA = 7231.92 - 1.186'PUBBRSR ......................................5.14 (6.637)* (3.266)* Adj.R2 = 0.377
where:
PVTFCA = Private fixed capital formation in agriculture (Rs. crore) PUBCSO = Public investment in agriculture as per the CSO series (Rs. Crore)
TOT = Terms of trade for agriculture (percent of index of prices received by agriculture sector to the index of prices paid by agriculture sector)
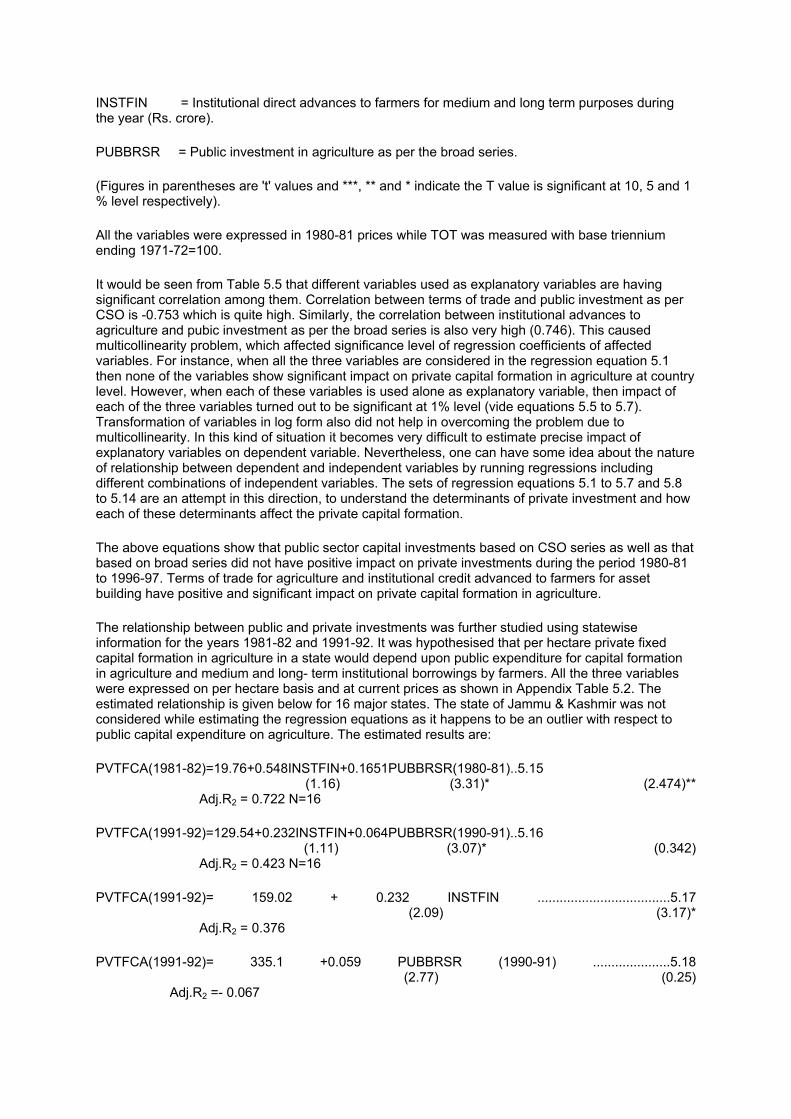
INSTFIN = Institutional direct advances to farmers for medium and long term purposes during the year (Rs. crore).
PUBBRSR = Public investment in agriculture as per the broad series.
(Figures in parentheses are 't' values and ***, ** and * indicate the T value is significant at 10, 5 and 1 % level respectively).
All the variables were expressed in 1980-81 prices while TOT was measured with base triennium ending 1971-72=100.
It would be seen from Table 5.5 that different variables used as explanatory variables are having significant correlation among them. Correlation between terms of trade and public investment as per CSO is -0.753 which is quite high. Similarly, the correlation between institutional advances to agriculture and pubic investment as per the broad series is also very high (0.746). This caused multicollinearity problem, which affected significance level of regression coefficients of affected variables. For instance, when all the three variables are considered in the regression equation 5.1 then none of the variables show significant impact on private capital formation in agriculture at country level. However, when each of these variables is used alone as explanatory variable, then impact of each of the three variables turned out to be significant at 1% level (vide equations 5.5 to 5.7). Transformation of variables in log form also did not help in overcoming the problem due to multicollinearity. In this kind of situation it becomes very difficult to estimate precise impact of explanatory variables on dependent variable. Nevertheless, one can have some idea about the nature of relationship between dependent and independent variables by running regressions including different combinations of independent variables. The sets of regression equations 5.1 to 5.7 and 5.8 to 5.14 are an attempt in this direction, to understand the determinants of private investment and how each of these determinants affect the private capital formation.
The above equations show that public sector capital investments based on CSO series as well as that based on broad series did not have positive impact on private investments during the period 1980-81 to 1996-97. Terms of trade for agriculture and institutional credit advanced to farmers for asset building have positive and significant impact on private capital formation in agriculture.
The relationship between public and private investments was further studied using statewise information for the years 1981-82 and 1991-92. It was hypothesised that per hectare private fixed capital formation in agriculture in a state would depend upon public expenditure for capital formation in agriculture and medium and long- term institutional borrowings by farmers. All the three variables were expressed on per hectare basis and at current prices as shown in Appendix Table 5.2. The estimated relationship is given below for 16 major states. The state of Jammu & Kashmir was not considered while estimating the regression equations as it happens to be an outlier with respect to public capital expenditure on agriculture. The estimated results are:
PVTFCA(1981-82)=19.76+0.548INSTFIN+0.1651PUBBRSR(1980-81)..5.15 (1.16) (3.31)* (2.474)** Adj.R2 = 0.722 N=16
PVTFCA(1991-92)=129.54+0.232INSTFIN+0.064PUBBRSR(1990-91)..5.16 (1.11) (3.07)* (0.342) Adj.R2 = 0.423 N=16
PVTFCA(1991-92)= 159.02 + 0.232 INSTFIN ....................................5.17 (2.09) (3.17)* Adj.R2 = 0.376
PVTFCA(1991-92)= 335.1 +0.059 PUBBRSR (1990-91) .....................5.18 (2.77) (0.25) Adj.R2 =- 0.067
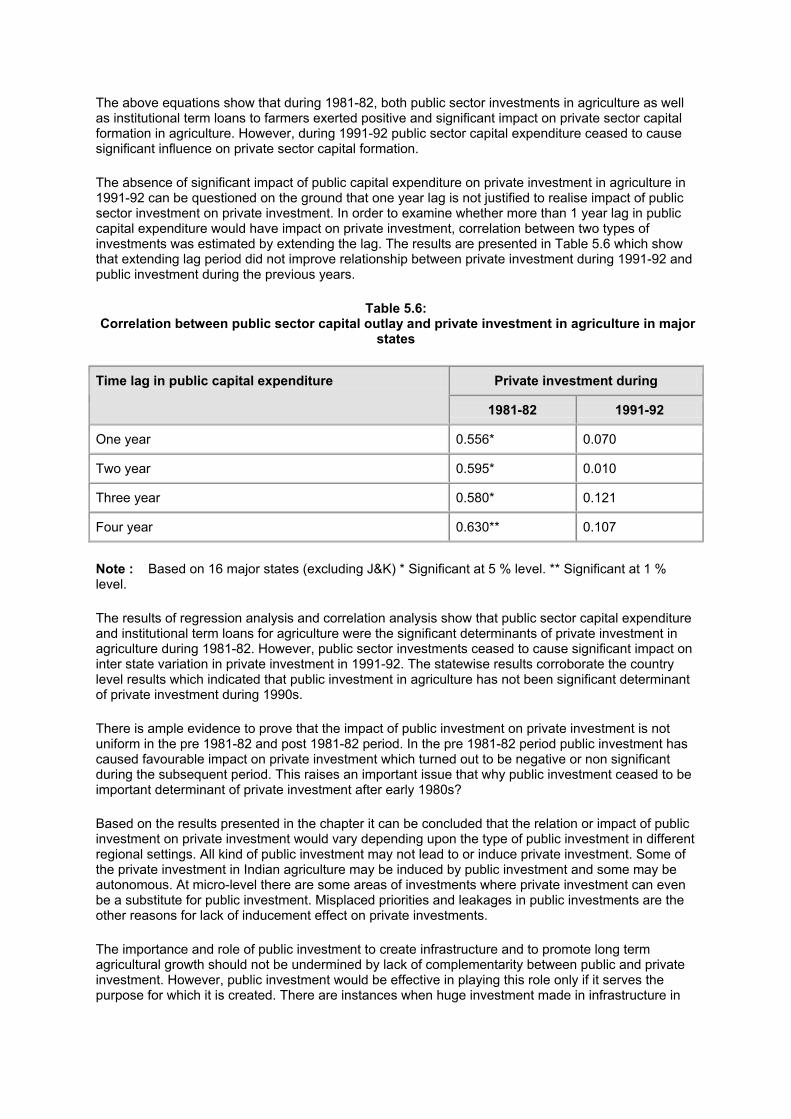
The above equations show that during 1981-82, both public sector investments in agriculture as well as institutional term loans to farmers exerted positive and significant impact on private sector capital formation in agriculture. However, during 1991-92 public sector capital expenditure ceased to cause significant influence on private sector capital formation.
The absence of significant impact of public capital expenditure on private investment in agriculture in 1991-92 can be questioned on the ground that one year lag is not justified to realise impact of public sector investment on private investment. In order to examine whether more than 1 year lag in public capital expenditure would have impact on private investment, correlation between two types of investments was estimated by extending the lag. The results are presented in Table 5.6 which show that extending lag period did not improve relationship between private investment during 1991-92 and public investment during the previous years.
Table 5.6: Correlation between public sector capital outlay and private investment in agriculture in major
states
Private investment during Time lag in public capital expenditure
1981-82 1991-92
One year 0.556* 0.070
Two year 0.595* 0.010
Three year 0.580* 0.121
Four year 0.630** 0.107
Note : Based on 16 major states (excluding J&K) * Significant at 5 % level. ** Significant at 1 % level.
The results of regression analysis and correlation analysis show that public sector capital expenditure and institutional term loans for agriculture were the significant determinants of private investment in agriculture during 1981-82. However, public sector investments ceased to cause significant impact on inter state variation in private investment in 1991-92. The statewise results corroborate the country level results which indicated that public investment in agriculture has not been significant determinant of private investment during 1990s.
There is ample evidence to prove that the impact of public investment on private investment is not uniform in the pre 1981-82 and post 1981-82 period. In the pre 1981-82 period public investment has caused favourable impact on private investment which turned out to be negative or non significant during the subsequent period. This raises an important issue that why public investment ceased to be important determinant of private investment after early 1980s?
Based on the results presented in the chapter it can be concluded that the relation or impact of public investment on private investment would vary depending upon the type of public investment in different regional settings. All kind of public investment may not lead to or induce private investment. Some of the private investment in Indian agriculture may be induced by public investment and some may be autonomous. At micro-level there are some areas of investments where private investment can even be a substitute for public investment. Misplaced priorities and leakages in public investments are the other reasons for lack of inducement effect on private investments.
The importance and role of public investment to create infrastructure and to promote long term agricultural growth should not be undermined by lack of complementarity between public and private investment. However, public investment would be effective in playing this role only if it serves the purpose for which it is created. There are instances when huge investment made in infrastructure in
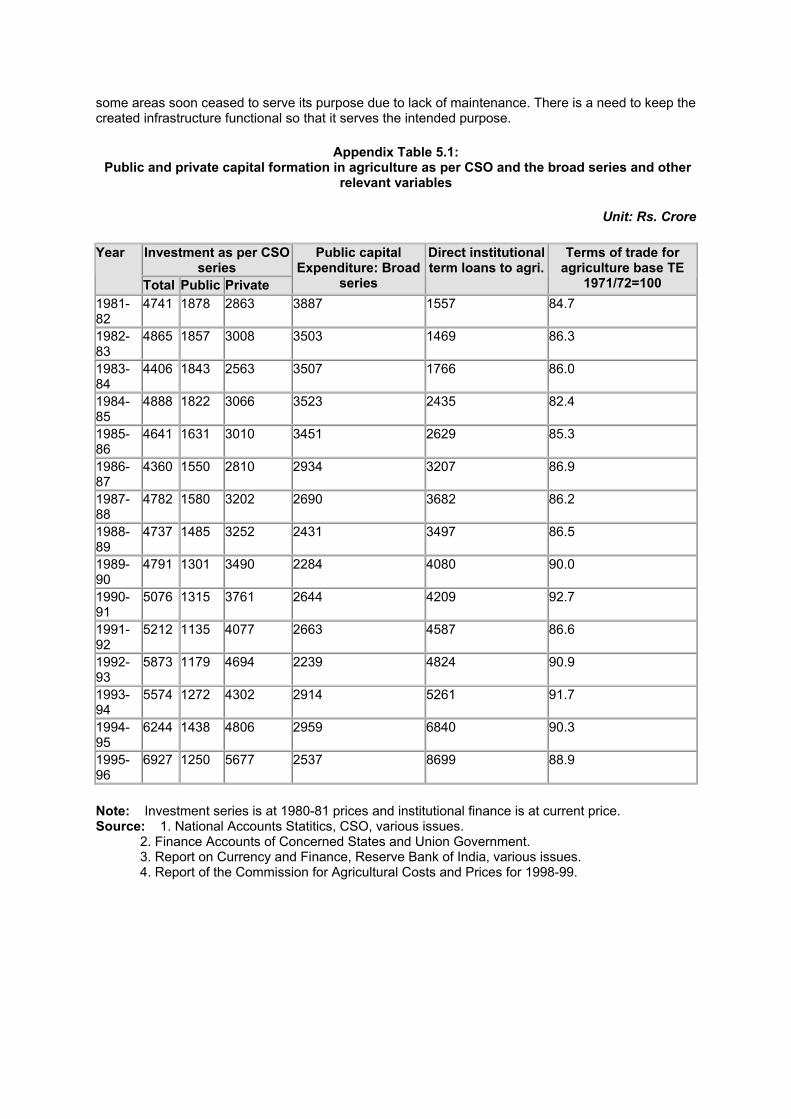
some areas soon ceased to serve its purpose due to lack of maintenance. There is a need to keep the created infrastructure functional so that it serves the intended purpose.
Appendix Table 5.1: Public and private capital formation in agriculture as per CSO and the broad series and other
relevant variables
Unit: Rs. Crore
Investment as per CSO series
Year
Total Public Private
Public capital Expenditure: Broad
series
Direct institutional term loans to agri.
Terms of trade for agriculture base TE
1971/72=100 1981-82
4741 1878 2863 3887 1557 84.7
1982-83
4865 1857 3008 3503 1469 86.3
1983-84
4406 1843 2563 3507 1766 86.0
1984-85
4888 1822 3066 3523 2435 82.4
1985-86
4641 1631 3010 3451 2629 85.3
1986-87
4360 1550 2810 2934 3207 86.9
1987-88
4782 1580 3202 2690 3682 86.2
1988-89
4737 1485 3252 2431 3497 86.5
1989-90
4791 1301 3490 2284 4080 90.0
1990-91
5076 1315 3761 2644 4209 92.7
1991-92
5212 1135 4077 2663 4587 86.6
1992-93
5873 1179 4694 2239 4824 90.9
1993-94
5574 1272 4302 2914 5261 91.7
1994-95
6244 1438 4806 2959 6840 90.3
1995-96
6927 1250 5677 2537 8699 88.9
Note: Investment series is at 1980-81 prices and institutional finance is at current price. Source: 1. National Accounts Statitics, CSO, various issues. 2. Finance Accounts of Concerned States and Union Government. 3. Report on Currency and Finance, Reserve Bank of India, various issues. 4. Report of the Commission for Agricultural Costs and Prices for 1998-99.
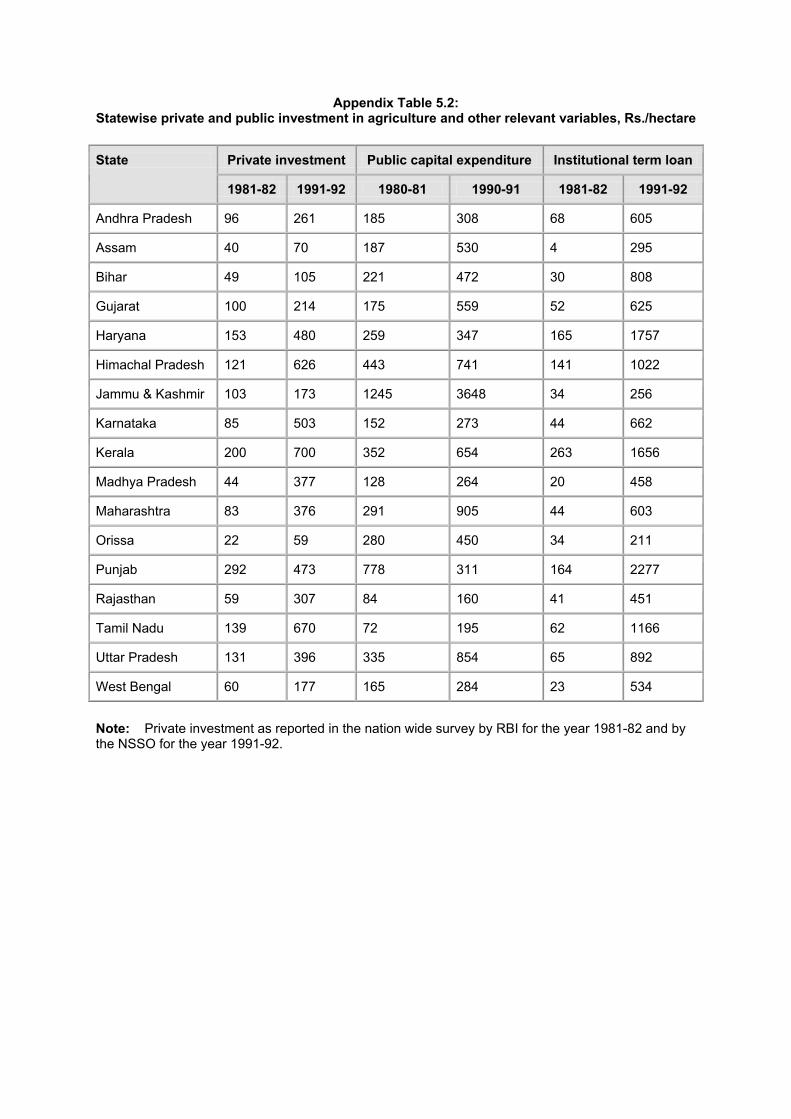
Appendix Table 5.2: Statewise private and public investment in agriculture and other relevant variables, Rs./hectare
Private investment Public capital expenditure Institutional term loan State
1981-82 1991-92 1980-81 1990-91 1981-82 1991-92
Andhra Pradesh 96 261 185 308 68 605
Assam 40 70 187 530 4 295
Bihar 49 105 221 472 30 808
Gujarat 100 214 175 559 52 625
Haryana 153 480 259 347 165 1757
Himachal Pradesh 121 626 443 741 141 1022
Jammu & Kashmir 103 173 1245 3648 34 256
Karnataka 85 503 152 273 44 662
Kerala 200 700 352 654 263 1656
Madhya Pradesh 44 377 128 264 20 458
Maharashtra 83 376 291 905 44 603
Orissa 22 59 280 450 34 211
Punjab 292 473 778 311 164 2277
Rajasthan 59 307 84 160 41 451
Tamil Nadu 139 670 72 195 62 1166
Uttar Pradesh 131 396 335 854 65 892
West Bengal 60 177 165 284 23 534
Note: Private investment as reported in the nation wide survey by RBI for the year 1981-82 and by the NSSO for the year 1991-92.
6 AGRICULTURAL INVESTMENTS, GROWTH AND EQUITY
The main aim of fixed investments in an economy is to provide impetus to growth process. Public investment achieve this goal by creating, improving and maintaining suitable infrastructure while private investment contributes by adding to stock of capital, durable assets, resource improvement etc, which augment productive capacity and also improves production efficiency. In a federal country like India balanced development of all regions and states is an important policy goal. This requires that resources for growth and development should be allocated in such a manner that it helps to achieve balanced growth of different states. In this Chapter, we first examine the relationship between agricultural growth, agricultural productivity and investments across states and then the changes in regional divergence in capital expenditure on agriculture sector on public account and on private account. Level of incremental capital output ratio (ICOR) for agriculture sector during the last 20 years has also been estimated based on CSO series and the broad series.
6.1 Agricultural Investments and Output Growth
Average annual public capital expenditure and private investment in agriculture at 1980-81 prices during the period 1974/75 to 1996/97 alongwith growth rate in agricultural output (NSDP agriculture) during the same period and agricultural productivity during the recent years and in early 1980s are presented in Table 6.1. The idea is to see the association between fixed investments made in agriculture during the past two decades and the indicators of agricultural development. During this period, annual public investment in agriculture in Jammu and Kashmir was Rs. 1242 per hectare, which was far higher than the next highest value. Thus J&K was not included in the equations estimated to establish relationship between agricultural development and fixed farm investments.
It would also be seen from the table that West Bengal recorded the highest growth rate in agricultural output and its agricultural productivity is also highest among all the states. But, with respect to public and private investment, West Bengal is among the bottom states. High agricultural productivity and growth in West Bengal seems to have resulted due to factors other than public and private fixed capital formation such as institutional reforms like Operation Barga.
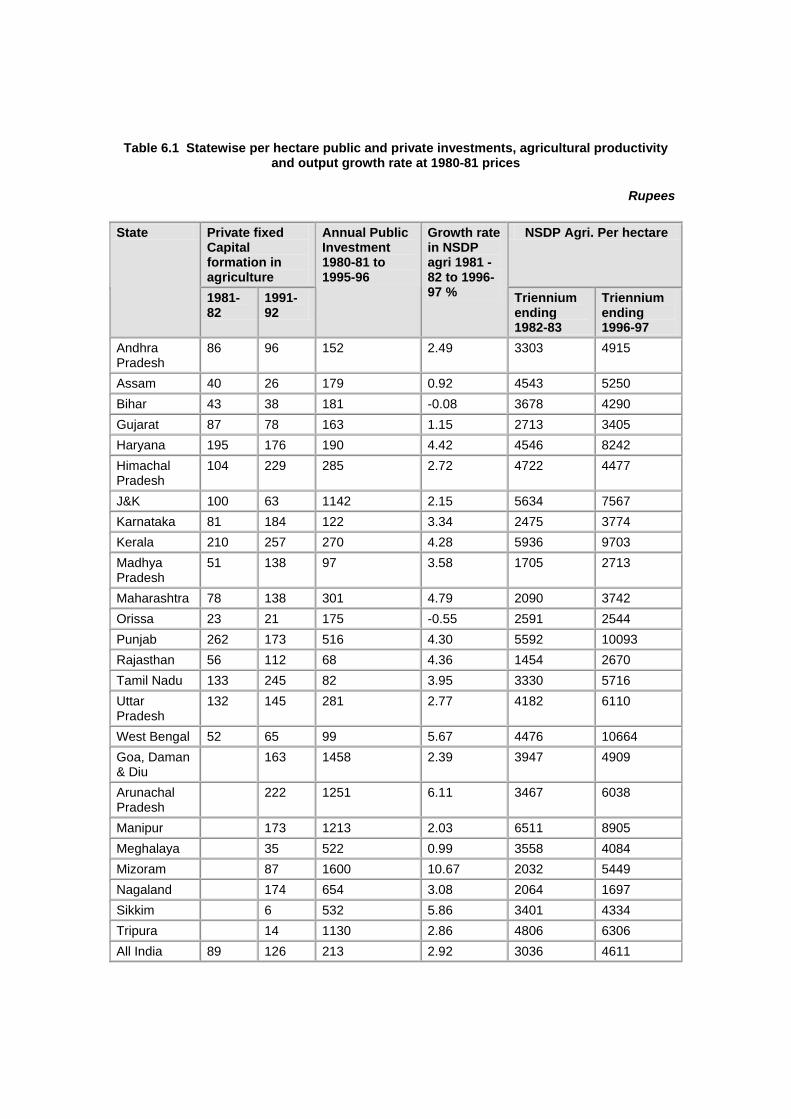
Table 6.1 Statewise per hectare public and private investments, agricultural productivity and output growth rate at 1980-81 prices
Rupees
Private fixed Capital formation in agriculture
NSDP Agri. Per hectare State
1981-82
1991-92
Annual Public Investment 1980-81 to 1995-96
Growth rate in NSDP agri 1981 -82 to 1996-97 % Triennium
ending 1982-83
Triennium ending 1996-97
Andhra Pradesh
86 96 152 2.49 3303 4915
Assam 40 26 179 0.92 4543 5250 Bihar 43 38 181 -0.08 3678 4290 Gujarat 87 78 163 1.15 2713 3405 Haryana 195 176 190 4.42 4546 8242 Himachal Pradesh
104 229 285 2.72 4722 4477
J&K 100 63 1142 2.15 5634 7567 Karnataka 81 184 122 3.34 2475 3774 Kerala 210 257 270 4.28 5936 9703 Madhya Pradesh
51 138 97 3.58 1705 2713
Maharashtra 78 138 301 4.79 2090 3742 Orissa 23 21 175 -0.55 2591 2544 Punjab 262 173 516 4.30 5592 10093 Rajasthan 56 112 68 4.36 1454 2670 Tamil Nadu 133 245 82 3.95 3330 5716 Uttar Pradesh
132 145 281 2.77 4182 6110
West Bengal 52 65 99 5.67 4476 10664 Goa, Daman & Diu
163 1458 2.39 3947 4909
Arunachal Pradesh
222 1251 6.11 3467 6038
Manipur 173 1213 2.03 6511 8905 Meghalaya 35 522 0.99 3558 4084 Mizoram 87 1600 10.67 2032 5449 Nagaland 174 654 3.08 2064 1697 Sikkim 6 532 5.86 3401 4334 Tripura 14 1130 2.86 4806 6306 All India 89 126 213 2.92 3036 4611
The nature of relationship between indicators of agricultural development and public investment, private investment and other relevant variables was studied through multiple regression analysis. NSDP agriculture per hectare during TE 1996-97 and growth in NSDP agriculture during 1981-82 to 1996-97 were used as dependent variables. The explanatory variables were measured as under:
1. Public investment in agriculture: Taken as annual average of public sector capital expenditure on agriculture per hectare of net sown area during 1980-81 to 1995-96 at 1980-81 prices.
2. Private investment in agriculture: Taken as per hectare fixed capital formation in farm business. While estimating the equation for agricultural productivity, per hectare PFCF during 1991-92 was used as an indicator of private investment. In the output growth equation, average of PFCF during 1981-82 and 1991-92 was used.
3. Base year productivity: This was measured as triennium average of NSDP agriculture per hectare of net sown area during 1980-81 to 1982-83. This variable was expected to capture inter state variations in resource endowments and productivity potential already realised by various states in the base period. It was hypothesised to have positive relationship with current level of productivity and negative relationship with the growth rate.
4. Dummy for West Bengal was used to represent other missing factors which have helped that State to attain high level of agricultural productivity and growth.
The correlation coefficients among agricultural productivity, agricultural growth and other relevant variables are presented in Table 6.2.
Two sets of regression equations were estimated to study the impact of public and private investments on agricultural productivity and growth. One set includes all major states excluding Jammu and Kashmir and the second set excludes West Bengal and Jammu & Kashmir. The results for the first set, including West Bengal, are presented in Table 6.3.
When all the four explanatory variables are considered simultaneously, then, private investment, base year productivity and dummy variable for West Bengal turned out to have significant and positive influence on agricultural productivity across states. The impact of public sector capital expenditure was positive but it was not significant, the reason for which seems to be its significant correlation with, base year productivity. When base year productivity was dropped then the impact of public investment on agricultural productivity turned out to be significant at 10% level.
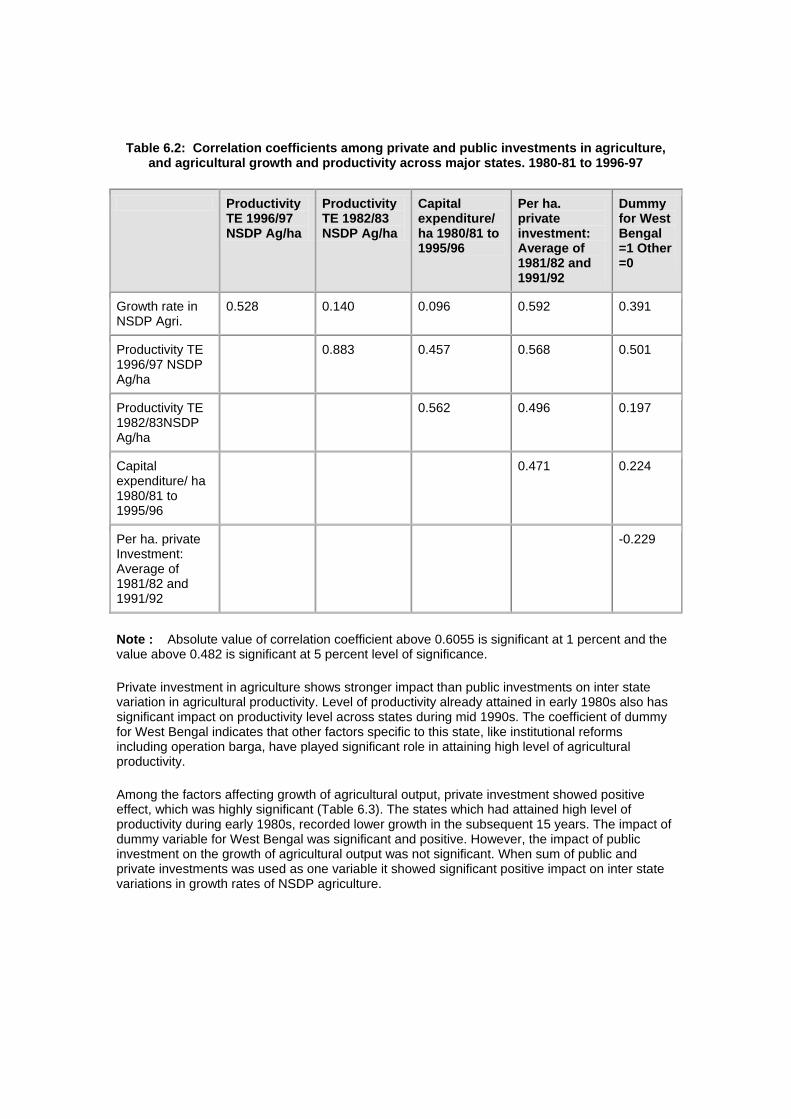
Table 6.2: Correlation coefficients among private and public investments in agriculture, and agricultural growth and productivity across major states. 1980-81 to 1996-97
Productivity TE 1996/97 NSDP Ag/ha
Productivity TE 1982/83 NSDP Ag/ha
Capital expenditure/ ha 1980/81 to 1995/96
Per ha. private investment: Average of 1981/82 and 1991/92
Dummy for West Bengal =1 Other =0
Growth rate in NSDP Agri.
0.528 0.140 0.096 0.592 0.391
Productivity TE 1996/97 NSDP Ag/ha
0.883 0.457 0.568 0.501
Productivity TE 1982/83NSDP Ag/ha
0.562 0.496 0.197
Capital expenditure/ ha 1980/81 to 1995/96
0.471 0.224
Per ha. private Investment: Average of 1981/82 and 1991/92
-0.229
Note : Absolute value of correlation coefficient above 0.6055 is significant at 1 percent and the value above 0.482 is significant at 5 percent level of significance.
Private investment in agriculture shows stronger impact than public investments on inter state variation in agricultural productivity. Level of productivity already attained in early 1980s also has significant impact on productivity level across states during mid 1990s. The coefficient of dummy for West Bengal indicates that other factors specific to this state, like institutional reforms including operation barga, have played significant role in attaining high level of agricultural productivity.
Among the factors affecting growth of agricultural output, private investment showed positive effect, which was highly significant (Table 6.3). The states which had attained high level of productivity during early 1980s, recorded lower growth in the subsequent 15 years. The impact of dummy variable for West Bengal was significant and positive. However, the impact of public investment on the growth of agricultural output was not significant. When sum of public and private investments was used as one variable it showed significant positive impact on inter state variations in growth rates of NSDP agriculture.
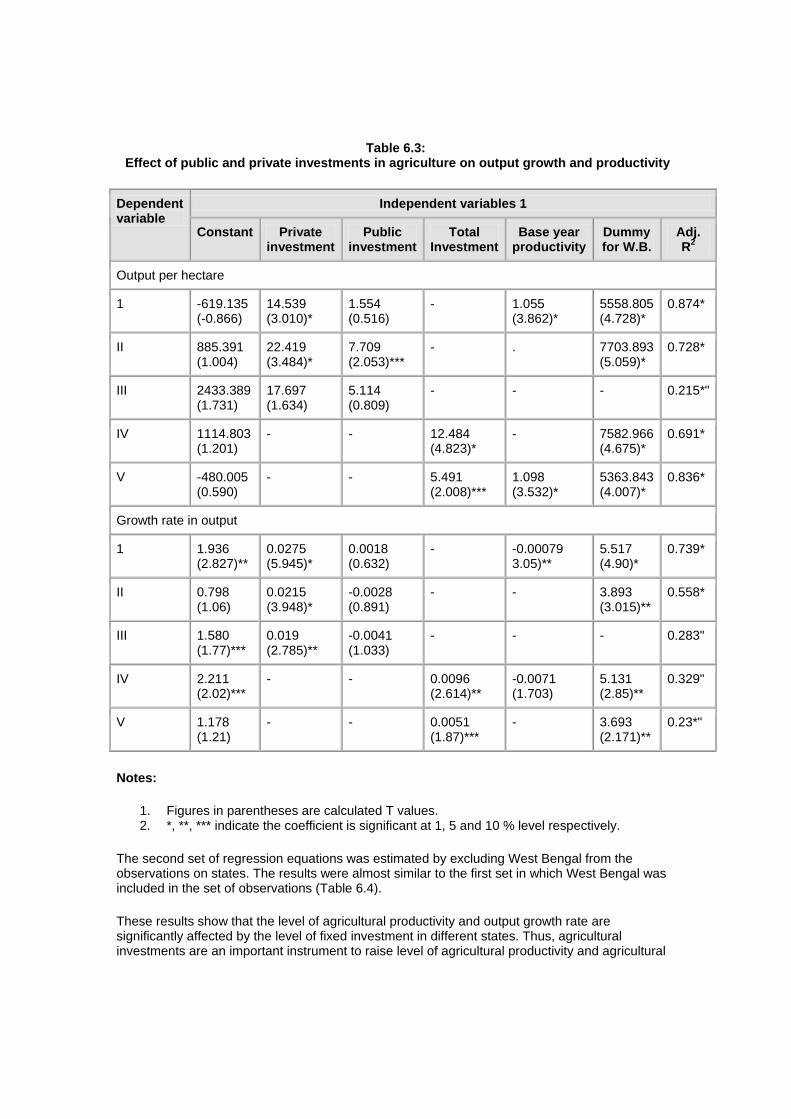
Table 6.3: Effect of public and private investments in agriculture on output growth and productivity
Independent variables 1 Dependent variable
Constant Private investment
Public investment
Total Investment
Base year productivity
Dummy for W.B.
Adj. R2
Output per hectare
1 -619.135 (-0.866)
14.539 (3.010)*
1.554 (0.516)
- 1.055 (3.862)*
5558.805 (4.728)*
0.874*
II 885.391 (1.004)
22.419 (3.484)*
7.709 (2.053)***
- . 7703.893 (5.059)*
0.728*
III 2433.389 (1.731)
17.697 (1.634)
5.114 (0.809)
- - - 0.215*"
IV 1114.803 (1.201)
- - 12.484 (4.823)*
- 7582.966 (4.675)*
0.691*
V -480.005 (0.590)
- - 5.491 (2.008)***
1.098 (3.532)*
5363.843 (4.007)*
0.836*
Growth rate in output
1 1.936 (2.827)**
0.0275 (5.945)*
0.0018 (0.632)
- -0.00079 3.05)**
5.517 (4.90)*
0.739*
II 0.798 (1.06)
0.0215 (3.948)*
-0.0028 (0.891)
- - 3.893 (3.015)**
0.558*
III 1.580 (1.77)***
0.019 (2.785)**
-0.0041 (1.033)
- - - 0.283"
IV 2.211 (2.02)***
- - 0.0096 (2.614)**
-0.0071 (1.703)
5.131 (2.85)**
0.329"
V 1.178 (1.21)
- - 0.0051 (1.87)***
- 3.693 (2.171)**
0.23*"
Notes:
1. Figures in parentheses are calculated T values. 2. *, **, *** indicate the coefficient is significant at 1, 5 and 10 % level respectively.
The second set of regression equations was estimated by excluding West Bengal from the observations on states. The results were almost similar to the first set in which West Bengal was included in the set of observations (Table 6.4).
These results show that the level of agricultural productivity and output growth rate are significantly affected by the level of fixed investment in different states. Thus, agricultural investments are an important instrument to raise level of agricultural productivity and agricultural
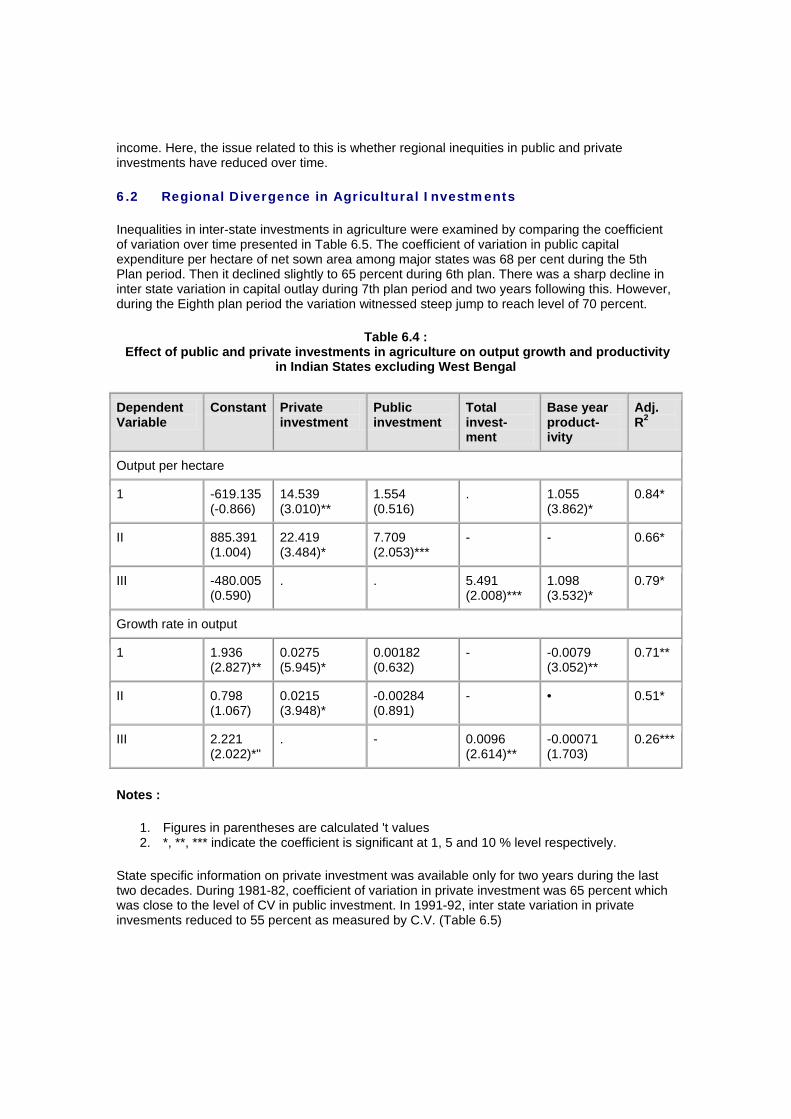
income. Here, the issue related to this is whether regional inequities in public and private investments have reduced over time.
6.2 Regional Divergence in Agricultural Investments
Inequalities in inter-state investments in agriculture were examined by comparing the coefficient of variation over time presented in Table 6.5. The coefficient of variation in public capital expenditure per hectare of net sown area among major states was 68 per cent during the 5th Plan period. Then it declined slightly to 65 percent during 6th plan. There was a sharp decline in inter state variation in capital outlay during 7th plan period and two years following this. However, during the Eighth plan period the variation witnessed steep jump to reach level of 70 percent.
Table 6.4 : Effect of public and private investments in agriculture on output growth and productivity
in Indian States excluding West Bengal
Dependent Variable
Constant Private investment
Public investment
Total invest-ment
Base year product-ivity
Adj. R2
Output per hectare
1 -619.135 (-0.866)
14.539 (3.010)**
1.554 (0.516)
. 1.055 (3.862)*
0.84*
II 885.391 (1.004)
22.419 (3.484)*
7.709 (2.053)***
- - 0.66*
III -480.005 (0.590)
. . 5.491 (2.008)***
1.098 (3.532)*
0.79*
Growth rate in output
1 1.936 (2.827)**
0.0275 (5.945)*
0.00182 (0.632)
- -0.0079 (3.052)**
0.71**
II 0.798 (1.067)
0.0215 (3.948)*
-0.00284 (0.891)
- • 0.51*
III 2.221 (2.022)*"
. - 0.0096 (2.614)**
-0.00071 (1.703)
0.26***
Notes :
1. Figures in parentheses are calculated 't values 2. *, **, *** indicate the coefficient is significant at 1, 5 and 10 % level respectively.
State specific information on private investment was available only for two years during the last two decades. During 1981-82, coefficient of variation in private investment was 65 percent which was close to the level of CV in public investment. In 1991-92, inter state variation in private invesments reduced to 55 percent as measured by C.V. (Table 6.5)
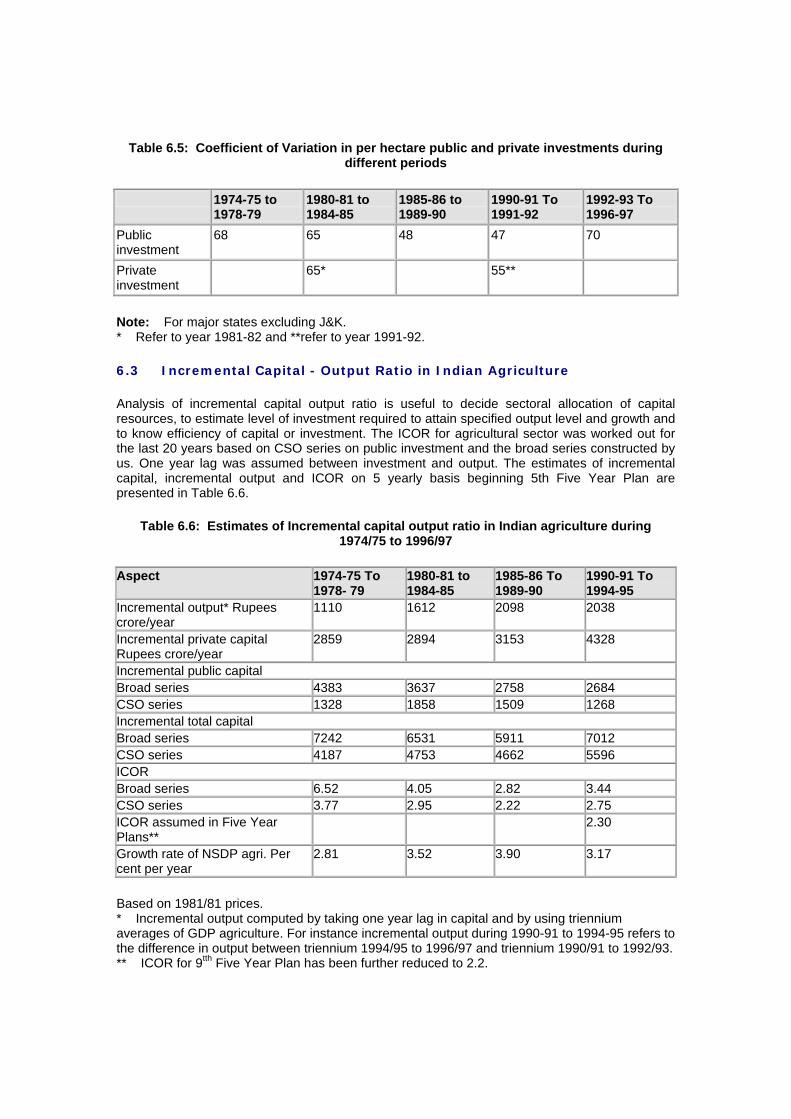
Table 6.5: Coefficient of Variation in per hectare public and private investments during different periods
1974-75 to 1978-79
1980-81 to 1984-85
1985-86 to 1989-90
1990-91 To 1991-92
1992-93 To 1996-97
Public investment
68 65 48 47 70
Private investment
65* 55**
Note: For major states excluding J&K. * Refer to year 1981-82 and **refer to year 1991-92.
6.3 Incremental Capital - Output Ratio in Indian Agriculture
Analysis of incremental capital output ratio is useful to decide sectoral allocation of capital resources, to estimate level of investment required to attain specified output level and growth and to know efficiency of capital or investment. The ICOR for agricultural sector was worked out for the last 20 years based on CSO series on public investment and the broad series constructed by us. One year lag was assumed between investment and output. The estimates of incremental capital, incremental output and ICOR on 5 yearly basis beginning 5th Five Year Plan are presented in Table 6.6.
Table 6.6: Estimates of Incremental capital output ratio in Indian agriculture during 1974/75 to 1996/97
Aspect 1974-75 To 1978- 79
1980-81 to 1984-85
1985-86 To 1989-90
1990-91 To 1994-95
Incremental output* Rupees crore/year
1110 1612 2098 2038
Incremental private capital Rupees crore/year
2859 2894 3153 4328
Incremental public capital Broad series 4383 3637 2758 2684 CSO series 1328 1858 1509 1268 Incremental total capital Broad series 7242 6531 5911 7012 CSO series 4187 4753 4662 5596 ICOR Broad series 6.52 4.05 2.82 3.44 CSO series 3.77 2.95 2.22 2.75 ICOR assumed in Five Year Plans**
2.30
Growth rate of NSDP agri. Per cent per year
2.81 3.52 3.90 3.17
Based on 1981/81 prices. * Incremental output computed by taking one year lag in capital and by using triennium averages of GDP agriculture. For instance incremental output during 1990-91 to 1994-95 refers to the difference in output between triennium 1994/95 to 1996/97 and triennium 1990/91 to 1992/93. ** ICOR for 9tth Five Year Plan has been further reduced to 2.2.
There is a huge difference in the ICOR based on CSO investment series and the broad series during 1974-75 to 1978-79. The difference slowly narrowed down over time. According to CSO series one rupee increase in output per year require one time capital investment worth Rs. 3.77 during late 1970s. The capital requirement based on broad series was Rs. 6.52. The ICOR based on broad series declined sharply during 6th and 7th plan but increased during the first five year period of 1990s. This implies that marginal efficiency of capital in agriculture improved till 1989-90 and deteriorated in the subsequent quinquennium. The same trend is witnessed in the ICOR based on CSO series.
Compared to the estimates of ICOR obtained by this study, the Planning Commission has been using quite lower estimates. The Eighth Five Year Plan put ICOR for agriculture sector at 2.3 which has been further reduced to the level of 2.2 for the Ninth Five Year Plan (Ninth Five Year Plan 1997-2002, Draft Vol. 1 p.74). Accordingly, sectoral needs for investment in agriculture considered by Planning Commission to attain projected output level have been substantially under-estimated.
7 MAIN FINDINGS, CONCLUSIONS AND POLICY IMPLICATIONS
Time series information on public and private sector investments in different sectors of the Indian economy is provided by Control Statistical Organisation of Government of India. According to the CSO series both public and private investments in agriculture have been moving on a rising trend till 1980-81, based on which it was inferred that there is complementarity between public and private investments. However, after 1980-81, public sector capital formation started declining, in real term, whereas private investment kept moving upward. The disparate movement in two series since 1981-82 put a question mark on the widely accepted conclusion that private sector investment in agriculture is determined by the level of public investment. This has further generated lot of interest in understanding real relationship between public and private investments and in knowing implications of falling public investment in agriculture.
In the urge to find answer to such questions the researchers observed that CSO series on public investment does not include investments in several important heads like rural roads, rural electrification, markets etc., and that more than 90 percent of the public investment reported by CSO consisted of medium and major irrigation projects. Therefore, strong need was felt to have a comprehensive series on public investment in agriculture that includes all important items relevant for agriculture. It was also noted that statewise data on public investment in agriculture were not available, in the absence of which it was not possible to study implications of ongoing trend in public and private investment on regional growth and equity.
The present study has identified about 23 heads relevant for agriculture sector and has prepared country level and state level series on public investment for the period 1974-75 to 1996-97. The series have been constructed by using capital expenditure on the concerned items as reported in the publication Finance Account of the union and state governments. The broad series reveals that during 1974-75 to 1996-97 the capital expenditure on agriculture at current prices increased in all the states except Bihar and Punjab. In Bihar, annual capital expenditure on agricultural heads by the state followed decline after 7th Plan while the decline in Punjab set in after 6th Plan. Like these two states, capital expenditure on agriculture sector by union government also did not show rising trend at current prices.
At 1980-81 prices capital expenditure on agriculture for the country as a whole showed decline throughout, beginning with the 5th Five Year Plan (1974-75 to 1978-79). The decline was very sharp during 6th and 7th Five Year Plans when annual capital expenditure on public account declined Rs. 3637 and Rs. 2758 crore respectively from about 44 hundred era during 5th Plan. Likewise, the capital expenditure by union government declined by 45-50 percent in each successive Five Year Plan following 5 Plan.
Among major states, per hectare public investments in agriculture remained highest in Jammu and Kashmir - it was about 4-5 times the national average in all the four Five Year Plans. Due to its special status, the state is receiving special assistance for various agricultural development projects as is the case with small size north east states. Among the remaining major state Punjab allocated highest resources for infrastructure development for agriculture in all the plan periods. The second place from top was occupied by Himachal Pradesh during 5th Plan, by Uttar Pradesh during 6th Plan, and Maharashtra during 7th Plan and by Kerala during the 8th Plan period.
State investment for capital formation in agriculture was quite low in Rajasthan and Madhya Pradesh. Other states which invested low amount in agriculture are Tamil Nadu, Assam, and West Bengal.
Among small size north east states and Goa, Daman and Diu, per hectare annual capital expenditure on agriculture during last 23 years varied between Rs. 500 to Rs. 1606 which is substantially higher than the average of the country. Thus, with respect to public investment north-east states, a Jammu and Kashmir have been the more favorable compared to major states.
All major states and some of the small states show declining trends in the resources spent for infrastructure for agriculture. Among major states the rate of decline has been highest in Punjab followed by Bihar. At country & the series declined annually by 3.16 percent over the chosen period.
At all India level 9.22 percent of net domestic product (NDP) from agriculture sector was invested for capital formation in agriculture during the first five years of decade of 1980s. However, during the second half of 198 resources spent for agricultural infrastructure development declined to 7. percent of NDP from agriculture. The decline continued during 1990s a current share of resources for capital formation is around 1/20th of t sectoral output.
Union government's contribution to capital formation in agriculture. constituted about 1.80 percent of NDP from agriculture during late 1970s. The contribution has dwindled to 0.25 percent during the 1990s.
Among major states, capital expenditure on agriculture in J&K corresponds to about 1/4th to 1/5th of NSDP agriculture in different plan periods which the highest. Among the remaining major states Maharashtra spent highest proportion of NSDP agriculture on agricultural infrastructure. The state invested about 13-18 percent of NSDP agriculture on capital formation in agriculture during 1974-75 to 1991-92. The allocation declined to below 10 per cent during the 8th Five Year Plan. Though Punjab invested highest in agriculture capital on per hectare basis after J&K among major states, it did not occupy same position in respect of percent of NSDP agriculture spent on infrastructure in most of the period.
During 5th Plan, agricultural investments on public account exceeded 8 per cent of NSDP in states of Uttar Pradesh and Gujarat beside the three states mentioned above. Assam, Bihar, Haryana, Kearala, Rajasthan, Tamil Nadu and West Bengal invested less than 5 percent of agricultural NSDP in the public capital during 5th plan. West Bengal remained at the bottom throughout in respect of agricultural investment. In Bihar, share of public investment in agricultural NSDP dropped from around 6 percent during 1980s to less than 2 percent during the 8th Plan. Though Haryana is agriculturally progressive state, its allocation of NSDP agriculture for farm investment remained lower than the national average in percent term.
The decline in share of capital outlay on agriculture in NSDP agriculture at current prices is less conspicuous and less widespread compared to per hectare and the total investment at constant prices. One reason for this is that price index of capital item (construction sector) has risen at a faster rate compared to general prices.
Among north-east states (other than Assam), public investment in agriculture constituted highest share (more than 30 percent) of NSDP agriculture in Arunachal Pradesh.
For the country as a whole, 4 percent of total national income was spent for infrastructure development for agriculture sector during 5th Plan period. This share kept falling over time and during 8th Plan period less than one and a half percent of national income was ploughed back for capital formation in agriculture.
Investment in major and medium irrigation projects continued as the dominant item of capital expenditure on agriculture. Investments in storage and warehousing were the second most important item of capital expenditure with 25 - 29 per cent share. These two heads account for about 2/3rd of the total capital expenditure on agriculture by states and union government in the country. Crop husbandry was the third important item of capital expenditure during 1974-75 to 1978-79 with about 15 percent share in total capital expenditure on agriculture. Its
importance diminished subsequently. Investment in district and other rural roads With an investment of around Rs. 200 crore turned out to be the third most important item during 7th and 8th Plan period. Capital expenditure in rural electrification remained below Rs. 10 crore till 1989-90 and increased to Rs. 44 crore per year during 1990s. Importance accorded to create infrastructure for dairy development declined sharply after 5th Plan period. Public capital invested in fertiliser industry was around Rs. 266 crore per year during 5th Plan, Rs. 130 crore during 6th Plan and Rs. 71 crore during 7th Plan. Annual investment in fertilizer industry declined to around Rs. 20 crore during the 1990s.
Combined capital expenditure on hill and north - east areas and on other special area programmes has been steadily increasing despite the decline in overall capital expenditure on agriculture.
A comparison of CSO series and the broad series constructed by us shows that the public investment according to CSO constitutes 48 percent of the total public investment channelled to agriculture sector. Conversely, CSO series underestimated the public investment in agriculture to the tune of 52 percent. It was also examined how much of total investment under each series has been allocated to irrigation development consisting of major, medium and minor irrigation works, command area development and flood control. In most of the years investment under the irrigation head, as measured by capital expenditure, comprise around 90 percent of the public investment in agriculture as per CSO and average for the last 23 years was about 95 per cent.
Regarding the trend in public investment, the decline in it based on broad series started a little earlier then the decline in the CSO series. Thus, it is not correct to say that public investment for agriculture which includes all major heads like rural roads, rural electrification, storage, warehousing etc. has not declined even-though CSO series has declined. Further, the rate of decline in capital outlay on irrigation and allied heads was lower compared to the rates of decline in capital expenditure on other agricultural heads and in CSO series.
Time series information on private fixed capital formation in agriculture at country level is furnished by CSO but neither CSO nor state level statistics departments provide this information at state level on yearly basis, except for one or two states. This information at state level can be derived from the nation wide surveys for the year 1981-82 conducted by Reserve Bank of India, and for the year 1991-92 by the NSSO. According to the nation wide surveys about 87 percent of fixed capital formation in agriculture (FCFA) came from cultivator households though there is variation in it across sates.
During 1981-82, Punjab ranked at number one in per hectare private investments, but it showed sharp decline in the following decade at constant prices. Kerala, Tamil Nadu, Himachal Pradesh and Haryana were among top states with respect to per hectare private fixed capital formation in agriculture during 1991-92. Private investment per hectare of net sown area was awfully low in Orissa, Bihar, West Bengal and Assam. Rajasthan and Madhya Pradesh recorded very high growth in private investment in agriculture during the decade following 1981-82.
In sharp contrast to public investment, capital invested by private sector in agriculture in the smaller states was meager. Per hectare public investments in all the smaller states in north east region was higher than that in any other major state barring Jammu and Kashmir, whereas, private capital formation in agriculture in north - east states was lower than that in all major state.
Based on the positive association between public and private investments that continued till 1980-81, it was concluded by some researchers that public investment is the main determinant of private investment in agriculture. However, the divergent trend in the two series since 1981-82 forced the researchers to have a fresh look at the relationship between public and private investment and to explore what could be the determinant of private investments in agriculture.
We have studied the impact of public investment on private investment using CSO series and broad series on public investment at national level and by using statewise data for the years 1981-82 and 1991-92 at real prices. As the private investment in agriculture may be simultaneously affected by several variables, the effect of these variables was studied using multiple regression analysis.
Country level data show that the terms of trade for agriculture and institutional term credit advanced to farmers have positive and significant impact on private capital formation in agriculture. Public investment, both as per CSO and as per the broad series which include all important heads of capital expenditure, did not show positive impact on private investment.
The state level results show that during 1981-82, both public sector investments in agriculture as well as institutional term loans to farmers exerted positive and significant impact on private sector capital formation in agriculture. However, during 1991-92 public sector capital expenditure ceased to cause significant influence on private sector capital formation.
There is ample evidence that impact of public investment on private investment is not uniform in the pre 1981-82 and post 1981-82 period. In the pre 1981-82 period public investment was increasing which also caused favourable impact on private investment. However, the decline in public investment in agriculture, observed since 1980-81, did not cause the private investment to decline, contrary to what would be expected if there was complementarity between the two types of investments.
The relationship between public and private investment was further investigated using Cointegration analysis. Almost all the past studies have used raw time series to establish relationship between public and private investments. This can give spurious relationship if assumption of stationarity of the series is not satisfied. In this study we have proceeded by applying Augmented Dicky Fuller Test (ADF) to test the time series on public and private investment for their stationarity. The results show that raw series was not stationary. The series at first difference turned out to be stationary. After having established that the public as well as private investments each are integrated of order 1, the long run relationship between the two series was established through the estimation of cointegration between the two series. The results show that there is no long term relationship between the two series. From this it was concluded that positive or negative association observed by various researchers between the raw series of public and private investments in different periods is spurious as there is no true long term relationship between the two series.
The relationship of agricultural growth and agricultural productivity with public sector capital expenditure and private sector fixed capital formation has been studied using data for the major states. Both, the public as well as private investment in agriculture show positive and significant impact on agricultural productivity.
Though agricultural productivity is strongly affected by it, the impact of public investment on the growth of agricultural output was not significant. On the other hand, impact of private investment on output growth turns out to be highly significant. The impact of total investment on public and private account turned out to be positive and significant on both, agricultural growth as well as productivity.
Among various states, West Bengal recorded highest output growth and productivity though agricultural investment in this state was lowest. The coefficient of Dummy variable for West Bengal was positive and highly significant indicating that other factors, such as Operation Barga, have contributed significantly to agricultural growth and productivity in West Bengal. This also shows that beside public and private investments there are other powerful instruments for agricultural development.
Given that agricultural productivity and output growth are significantly affected by the level of fixed farm investment in different states, one way to reduce large inter- state inequalities in agricultural development in the country is through balanced allocation of capital expenditure
for agriculture. The coefficient of variation in public capital expenditure per hectare of net sown area among major states was 68 per cent during the 5th Plan period. Then it declined slightly to 65 percent during 6th Plan. There was a sharp decline in inter state variation in capital expenditure during 7th Plan period and two years following this. However, during the Eighth plan period the variation witnessed steep jump to reach level of 70 percent.
There was a huge difference in the ICOR based on CSO investment series and the broad series during 1975-75 to 1978-79. The difference slowly narrowed down over time. According to both the series marginal efficiency of capital in agriculture improved till 1989-90 and deteriorated in the subsequent quinquennium. Compared to the estimates of ICOR obtained by this study the Planning Commission has been using quite lower estimates. Accordingly, sectoral needs for investment in agriculture by Planning Commission to attain projected output level were highly on lower side.
The lack of complementarity between private and public investments stands out prominently. Terms of trade for agriculture and flow of institutional credit have turned out to be the strong determinants of private investments in agriculture. As private investment is found to be more effective than public investment in promoting output growth, it would be prudent to encourage private investments through institutional credit support and favourable terms of trade for agriculture. In particular, flow of institutional credit should be increased in low investment states like eastern states.
There could be several reasons for public investments to show non significant or even negative impact on private investments after early 1980s. Impact of public investment on private investment would vary depending upon type of public investment in different regional settings. All kind of public investment may not lead to or induce private investment. Some of the private investment in Indian agriculture may be induced by public investment and some may be autonomous. At micro-level there are some areas of investments where private investment can even be substitute for public investment. Misplaced priorities and leakages in public investments are the other reasons for lack of inducement effect on private investments.
Importance and role of public investment to create infrastructure and to promote long term agricultural growth should not be undermined by lack of complementarity between public and private investment. However, public investment would be effective in playing this role only if it serves the purpose for which it is created. There are instances when huge investment made in infrastructure in some areas soon ceased to serve its purpose due to lack of maintenance. '
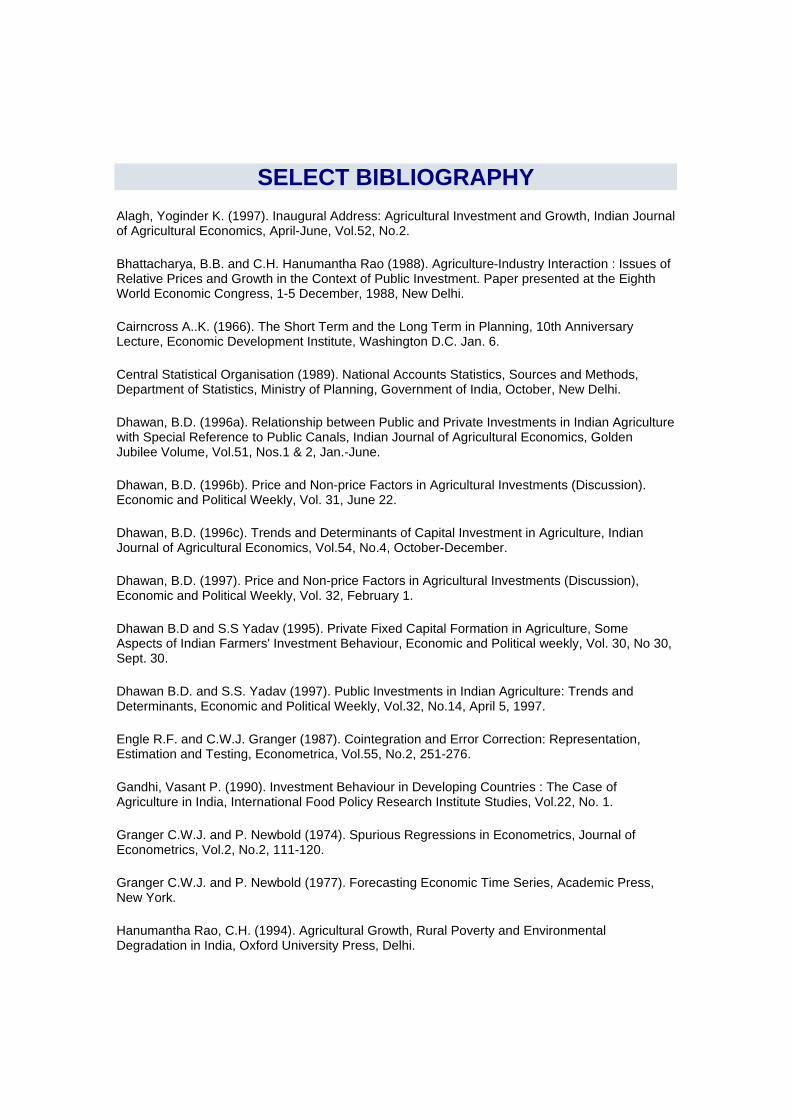
SELECT BIBLIOGRAPHY Alagh, Yoginder K. (1997). Inaugural Address: Agricultural Investment and Growth, Indian Journal of Agricultural Economics, April-June, Vol.52, No.2.
Bhattacharya, B.B. and C.H. Hanumantha Rao (1988). Agriculture-Industry Interaction : Issues of Relative Prices and Growth in the Context of Public Investment. Paper presented at the Eighth World Economic Congress, 1-5 December, 1988, New Delhi.
Cairncross A..K. (1966). The Short Term and the Long Term in Planning, 10th Anniversary Lecture, Economic Development Institute, Washington D.C. Jan. 6.
Central Statistical Organisation (1989). National Accounts Statistics, Sources and Methods, Department of Statistics, Ministry of Planning, Government of India, October, New Delhi.
Dhawan, B.D. (1996a). Relationship between Public and Private Investments in Indian Agriculture with Special Reference to Public Canals, Indian Journal of Agricultural Economics, Golden Jubilee Volume, Vol.51, Nos.1 & 2, Jan.-June.
Dhawan, B.D. (1996b). Price and Non-price Factors in Agricultural Investments (Discussion). Economic and Political Weekly, Vol. 31, June 22.
Dhawan, B.D. (1996c). Trends and Determinants of Capital Investment in Agriculture, Indian Journal of Agricultural Economics, Vol.54, No.4, October-December.
Dhawan, B.D. (1997). Price and Non-price Factors in Agricultural Investments (Discussion), Economic and Political Weekly, Vol. 32, February 1.
Dhawan B.D and S.S Yadav (1995). Private Fixed Capital Formation in Agriculture, Some Aspects of Indian Farmers' Investment Behaviour, Economic and Political weekly, Vol. 30, No 30, Sept. 30.
Dhawan B.D. and S.S. Yadav (1997). Public Investments in Indian Agriculture: Trends and Determinants, Economic and Political Weekly, Vol.32, No.14, April 5, 1997.
Engle R.F. and C.W.J. Granger (1987). Cointegration and Error Correction: Representation, Estimation and Testing, Econometrica, Vol.55, No.2, 251-276.
Gandhi, Vasant P. (1990). Investment Behaviour in Developing Countries : The Case of Agriculture in India, International Food Policy Research Institute Studies, Vol.22, No. 1.
Granger C.W.J. and P. Newbold (1974). Spurious Regressions in Econometrics, Journal of Econometrics, Vol.2, No.2, 111-120.
Granger C.W.J. and P. Newbold (1977). Forecasting Economic Time Series, Academic Press, New York.
Hanumantha Rao, C.H. (1994). Agricultural Growth, Rural Poverty and Environmental Degradation in India, Oxford University Press, Delhi.

Hanumantha Rao, C.H. (1997). Agricultural Growth, Sustainability and Poverty Alleviation in India: Recent Trends and Major Issues of Reform, International Food Policy Research Institute, Washington, D.C.
Jairath, M.S. and Brijesh C. Purohit (1996). Trends in Capital Formation in Agriculture - A Case of Arid India, Indian Journal of Agricultural Economics, Vol.51, No.4, October-December.
Krishnamurty, K. (1985). Inflation and Growth: A Model for India, in K. Krishnamurty and V.N. Pandit eds. Macroeconomic Modelling of the Indian Economy: Studies in Inflation and Growth, Hindustan Publishing Corporation, Delhi.
Kumar, A. Ganesh (1992). Falling Agricultural Investment and Its Consequences, Economic and Political Weekly, Vol 27, No 42, Oct 17.
Lewis, Author W. (1955). The Theory of Economic Growth Alien and Unwin, London.
Meir, Gerald M. (1984). Leading Issues in Economic Development, ch. 4, Oxford University Press, Bombay, 4th edn.
Mishra, S.N. and Ramesh Chand (1995). Public and Private Capital Formation in Indian Agriculture: Comments on the Complementarity Hypothesis and others, Economic and Political Weekly, Review of Agriculture, Vol.30, June.
Misra, V.N. (1998). Economic Reforms, Terms of Trade, Aggregate Supply and Private Investment in Agriculture: Indian Experience, Economic and Political Weekly, Vol.33, August!.
Misra, V.N. and B.R. Peter Hazell (1996a). Terms of Trade, Rural Poverty, Technology and Investment: The Indian Experience 1952-53 to 1990-91, Economic and Political Weekly, Vol. 31, March 30.
Misra, V.N. and B.R. Peter Hazell (1996b). Price and Non-Price Factors in Agricultural Investments (Discussion), Economic and Political Weekly, Vol. 31, 20 October.
Misra, V.N. and B.R. Peter Hazell (1997c). Price and Non-Price Factors in Agricultural Investments (Discussion). Economic and Political Weekly, Vol. 32, August 2-8.
Mitra, Ashok (1997). Public and Private Investments in Agriculture, in Bhupat M. Desai ed. Agricultural Development Paradigm for the Ninth Plan Under New Economic Environment, Oxford and IBH Pub. Co. Pvt. Ltd. New Delhi.
Nicholas William H. (1964). The Place of Agriculture in Economic Development, in Carl Eicher and Lawrence Witt ed, Agriculture in Economic Development, Vora and Co. Publishers Pvt. Limited, Bombay.
Nurkse Ragnar (1953). Problems of Capital Formation in Underdeveloped Countries, Oxford.
N.S.S.O. (1988). Household Capital Expenditure during 1.7.91 to 30.6.92: Debt and Investment Survey, 48th Round, Ministry of Planning & Programme Implementation, Government of India.
Patnaik, Prabhat (1987). Recent Growth Experience of the Indian Economy: Some Comments, Economic and Political Weekly, Vol.22, No. 19-21, May.
Rath, Nilakantha (1989). Agricultural Growth and Investment in India, Journal of Indian School of Political Economy, Vol.1, No.1, January-June.
Reserve Bank of India (1988). All India Debt and Investment Survey 1981-82: Statistical Tables Relating to Capital Expenditure and Capital Formation of Households during the year ended 30th June 1982. RBI, Bombay.
Rostow, W. W. (1960). The Stages of Economic Growth, Cambridge University Press, London.
Schultz, T.W. (1964). Transforming Traditional Agriculture, Yale University Press, New Haven, CT.
Shetty, S.L. (1990). Investment in Agriculture: Brief Review of Recent Trends, Economic and Political Weekly, Vol. 25, February 17-24.
Shonfield, A. (1960). Attack on World Poverty, Random House, New York, 1960.
Shukla, Tara (1965). Capital Formation in Indian Agriculture, Vora & Co. Pub. Bombay.
Timmer, C. Peter (1988). The Agricultural Transformation, in Hollis Chenery and T.N. Srinivasan ed., Handbook of Development Economics, Vol.1, North Holland Pub. Co., Amsterdam.