Embed Size (px)
Citation preview
Morningstar® Document Research℠
FORM 10-KCOGNIZANT TECHNOLOGY SOLUTIONS CORP - CTSH
Filed: February 25, 2016 (period: December 31, 2015)
Annual report with a comprehensive overview of the company
The information contained herein may not be copied, adapted or distributed and is not warranted to be accurate, complete or timely. The userassumes all risks for any damages or losses arising from any use of this information, except to the extent such damages or losses cannot belimited or excluded by applicable law. Past financial performance is no guarantee of future results.
Table of Contents
UNITED STATESSECURITIES AND EXCHANGE COMMISSION
Washington, D.C. 20549
FORM 10-K
FOR ANNUAL AND TRANSITION REPORTSPURSUANT TO SECTIONS 13 OR 15(d) OF THE
SECURITIES EXCHANGE ACT OF 1934(Mark One)
ý ANNUAL REPORT PURSUANT TO SECTION 13 OR 15(d) OF THE SECURITIES EXCHANGE ACT OF 1934
For the fiscal year ended December 31, 2015 OR
¨ TRANSITION REPORT PURSUANT TO SECTION 13 OR 15(d) OF THE SECURITIES EXCHANGE ACT OF 1934
For the transition period from to Commission File Number 0-24429
COGNIZANT TECHNOLOGY SOLUTIONS CORPORATION
(Exact Name of Registrant as Specified in Its Charter)
Delaware 13-3728359
(State or Other Jurisdiction ofIncorporation or Organization)
(I.R.S. EmployerIdentification No.)
Glenpointe Centre West
500 Frank W. Burr Blvd.Teaneck, New Jersey 07666
(Address of Principal Executive Offices) (Zip Code)Registrant’s telephone number, including area code: (201) 801-0233
Securities registered pursuant to Section 12(b) of the Act:
Title of each class
Name of each exchange on which registered
Class A Common Stock, $0.01 par value per share The NASDAQ Stock Market LLCSecurities registered pursuant to Section 12(g) of the Act: None
Indicate by check mark if the registrant is a well-known seasoned issuer, as defined in Rule 405 of the Securities Act. x Yes ¨ NoIndicate by check mark if the registrant is not required to file reports pursuant to Section 13 or Section 15(d) of the Act. ¨ Yes x NoIndicate by check mark whether the registrant (1) has filed all reports required to be filed by Section 13 or 15(d) of the Securities Exchange Act of 1934 during the preceding 12 months (or for such shorter period that
the registrant was required to file such reports), and (2) has been subject to such filing requirements for the past 90 days. x Yes ¨ NoIndicate by check mark whether the registrant has submitted electronically and posted on its corporate Website, if any, every Interactive Data File required to be submitted and posted pursuant to Rule 405 of
Regulation S-T (§232.405 of this chapter) during the preceding 12 months (or for such shorter period that the registrant was required to submit and post such files). x Yes ¨ NoIndicate by check mark if disclosure of delinquent filers pursuant to Item 405 of Regulation S-K (§229.405 of this chapter) is not contained herein, and will not be contained, to the best of registrant’s knowledge, in
definitive proxy or information statements incorporated by reference in Part III of this Form 10-K or any amendment to this Form 10-K. xIndicate by check mark whether the registrant is a large accelerated filer, an accelerated filer, a non-accelerated filer, or a smaller reporting company. See definitions of “large accelerated filer,” “accelerated filer” and
“smaller reporting company” in Rule 12b-2 of the Exchange Act. (Check one):
Large accelerated filer ý Accelerated filer ¨
Non-accelerated filer ¨ (Do not check if a smaller reporting company) Smaller reporting company ¨
Indicate by check mark whether the registrant is a shell company (as defined in Rule 12b-2 of the Act). ¨ Yes x NoThe aggregate market value of the registrant’s voting shares of common stock held by non-affiliates of the registrant on June 30, 2015, based on $61.09 per share, the last reported sale price on the NASDAQ Global
Select Market of the NASDAQ Stock Market LLC on that date, was $37.0 billion.The number of shares of Class A common stock, $0.01 par value, of the registrant outstanding as of February 19, 2016 was 609,120,446 shares.
DOCUMENTS INCORPORATED BY REFERENCE
The following documents are incorporated by reference into the Annual Report on Form 10-K: Portions of the registrant’s definitive Proxy Statement for its 2016 Annual Meeting of Stockholders are incorporated byreference into Part III of this Report.
Source: COGNIZANT TECHNOLOGY SOLUTIONS CORP, 10-K, February 25, 2016 Powered by Morningstar® Document Research℠The information contained herein may not be copied, adapted or distributed and is not warranted to be accurate, complete or timely. The user assumes all risks for any damages or losses arising from any use of this information,except to the extent such damages or losses cannot be limited or excluded by applicable law. Past financial performance is no guarantee of future results.
TABLE OF CONTENTS
Item Page
PART I 1 1. Business 1 1A. Risk Factors 16
1B. Unresolved Staff Comments 30
2. Properties 31
3. Legal Proceedings 31 4. Mine Safety Disclosures 31 PART II 32 5. Market for Registrant's Common Equity, Related Stockholder Matters and Issuer Purchases of Equity Securities 32 6. Selected Financial Data 34 7. Management's Discussion and Analysis of Financial Condition and Results of Operations 35 7A. Quantitative and Qualitative Disclosures About Market Risk 51 8. Financial Statements and Supplementary Data 52 9. Changes in and Disagreements with Accountants on Accounting and Financial Disclosure 52 9A. Controls and Procedures 53 9B. Other Information 54 PART III 55 10. Directors, Executive Officers and Corporate Governance 55 11. Executive Compensation 55 12. Security Ownership of Certain Beneficial Owners and Management and Related Stockholder Matters 55 13. Certain Relationships and Related Transactions, and Director Independence 55 14. Principal Accountant Fees and Services 55 PART IV 56 15. Exhibits, Financial Statements Schedules 56SIGNATURES 57EXHIBIT INDEX 58INDEX TO CONSOLIDATED FINANCIAL STATEMENTS AND FINANCIAL STATEMENT SCHEDULE F-1
Source: COGNIZANT TECHNOLOGY SOLUTIONS CORP, 10-K, February 25, 2016 Powered by Morningstar® Document Research℠The information contained herein may not be copied, adapted or distributed and is not warranted to be accurate, complete or timely. The user assumes all risks for any damages or losses arising from any use of this information,except to the extent such damages or losses cannot be limited or excluded by applicable law. Past financial performance is no guarantee of future results.
Table of Contents
PART I
Item 1. Business
Overview
We are a leading provider of information technology (IT), consulting and business process services, dedicated to helping the world’s leadingcompanies build stronger businesses. Our clients engage us to help them operate more efficiently, provide solutions for critical business and technologyproblems, and to help them drive technology-based innovation and growth. Our core competencies include: business, process, operations and IT consulting,application development and systems integration, enterprise information management, application testing, application maintenance, IT infrastructureservices, and business process services. We tailor our services to specific industries and utilize an integrated global delivery model. This seamless globalsourcing model combines industry-specific expertise, client service teams based on-site at the client locations and delivery teams located at dedicated near-shore and offshore global delivery centers.
Industry Background
In today’s complex business environment, many companies face intense competitive pressure and rapidly changing market dynamics, driven by suchfactors as changes in the economy, government regulations, globalization, virtualization and other technological innovations. Companies must also evaluatethe effect of emerging digital technologies, including social networks, mobile devices, advanced analytics and cloud computing, on their businessoperations. These technologies represent a new IT infrastructure that continues to transform the way companies relate to their customers, engage withemployees, and bring innovative products and services to market. In response to these challenges, many companies are focused on improving efficiencies andenhancing effectiveness while also driving innovation through technology to favorably impact both the bottom-line and the top-line. Companiesincreasingly view a global sourcing model as a key to their efforts to operate more cost-effectively and productively. At the same time, companies areconfronting secular industry shifts, changing customer requirements and new technologies that require them to innovate by building new and differentcapabilities with emerging technologies to ensure their businesses stay competitive.
Companies increasingly seek to meet a dual mandate of achieving more efficient and effective operations, including cost reductions, while developingtechnology-based innovation and business transformation in a comprehensive, integrated manner. Achieving these objectives presents major challenges andrequires companies to have highly skilled professionals trained in many diverse and new technologies combined with industry-specific expertise.Increasingly, companies are relying on service providers operating with global delivery models, like Cognizant, to help them meet these ever-changingobjectives.
Global demand for high quality, cost-effective technology services from outside providers has created a significant opportunity for IT service providersthat can successfully leverage the benefits of and address the challenges in using a global talent pool. The effective use of personnel from across the globecan offer a variety of benefits, including deep industry expertise, lower costs, faster delivery of new IT solutions and innovations in industry-specificsolutions, processes and technologies. Certain countries have large talent pools of highly qualified technical professionals who can provide high quality ITand business process services at a lower cost. India is a leader in IT services and is regarded as having one of the largest and highest quality pools of talent inthe world. Historically, IT service providers have used offshore labor pools primarily to supplement the internal staffing needs of customers. However,evolving customer demands have led to the increasing acceptance and use of offshore resources for higher value-added services. These services includeapplication design, development, testing and systems integration, technology and industry-specific consulting and infrastructure management.
The Cognizant Approach
Our approach is built on a global network of delivery centers, deep domain expertise and a robust portfolio of industry-specific services.
Global Delivery Model. Our geographic reach extends across the globe, with more than 100 delivery centers worldwide. We have a four-tiered globalarchitecture for service delivery and operations, consisting of employees co-located at clients’ sites, at local or in-country delivery centers, at regionaldelivery centers and at global delivery centers. We are continuously expanding global delivery capacity at our centers throughout the world. We use ourproprietary Cognizant 2.0 knowledge-sharing and project-management platform to unite all of our operations around the globe, access capabilities across theCompany and streamline workflow. Our extensive facilities, technology and communications infrastructure facilitates the seamless integration of our globalworkforces.
1
Source: COGNIZANT TECHNOLOGY SOLUTIONS CORP, 10-K, February 25, 2016 Powered by Morningstar® Document Research℠The information contained herein may not be copied, adapted or distributed and is not warranted to be accurate, complete or timely. The user assumes all risks for any damages or losses arising from any use of this information,except to the extent such damages or losses cannot be limited or excluded by applicable law. Past financial performance is no guarantee of future results.
Table of Contents
Domain Expertise. Our business is organized and managed primarily around our four industry-oriented business segments:• Financial Services;• Healthcare;• Manufacturing, Retail and Logistics; and• Other, which includes Communications, Information, Media and Entertainment, and High Technology.
This industry focus has been central to our revenue growth and high client satisfaction. As the IT services industry continues to mature, clients arelooking for service providers with a deep understanding of their businesses, industry initiatives, customers, markets and cultures who can create solutionstailored to meet their customers’ individual business needs. To strengthen our industry practices, we hire professionals with in-depth experience in theindustries we serve. We continually invest in industry training for our staff and build out industry-specific services and solutions. This approach is central toour high levels of on-time delivery and client satisfaction, as we understand the full context of our clients’ challenges and have deep experience inaddressing them.
Portfolio of Services. We offer a broad range of services designed to help clients address business challenges and enhance their ability to pursue growthopportunities. Our key service areas, consulting and technology services and outsourcing services, are delivered to our clients across our four businesssegments in a standardized, high-quality manner through our global delivery model. We continually invest in the expansion of our service portfolio toanticipate and meet clients’ evolving needs. Our current service areas include:
• Consulting and Technology Services• Business, process, operations and IT consulting• Application development and systems integration• Enterprise information management• Application testing• Digital technologies services• Software solutions and related services
• Outsourcing Services• Application maintenance• IT infrastructure services• Business process services
Business Segments
We are organized around and report the operations of our business according to our four industry-oriented business segments:
Financial Services Healthcare Manufacturing/Retail/Logistics Other
-Banking-Insurance
-Healthcare-Life Sciences
-Manufacturing and Logistics-Retail, Travel and Hospitality-Consumer Goods
-Communications-Information, Media and Entertainment-High Technology
For the year ended December 31, 2015, the distribution of our revenues across our business segments was as follows: 40.3% from Financial Services,29.5% from Healthcare, 18.9% from Manufacturing/Retail/Logistics and 11.3% from Other. See Note 15 to our consolidated financial statements foradditional information related to our business segments, including the disclosure of segment operating profit and financial information by geographic area.
Financial Services
Our Financial Services business segment serves leading financial institutions throughout the world. Our clients include banks, investment firms andinsurance companies. This business segment provides services to our customers operating in the following industries:
• Banking. We serve traditional retail and commercial banks, diversified financial enterprises, broker-dealers, asset management firms, depositories,clearing organizations and exchanges. We assist these clients in such areas as retail banking, wholesale banking, consumer lending, cards andpayments, risk management, investment banking and
2
Source: COGNIZANT TECHNOLOGY SOLUTIONS CORP, 10-K, February 25, 2016 Powered by Morningstar® Document Research℠The information contained herein may not be copied, adapted or distributed and is not warranted to be accurate, complete or timely. The user assumes all risks for any damages or losses arising from any use of this information,except to the extent such damages or losses cannot be limited or excluded by applicable law. Past financial performance is no guarantee of future results.
Table of Contents
brokerage, asset and wealth management, and securities services. The demand for our services in the banking sector is being driven by severalsignificant changes in the industry. In response to the current global economic environment, central banks and government bodies have adoptedpolicies designed to manage interest rates, raise capital requirements, impose new regulations, and institute risk-mitigation measures, such asrestricting proprietary trading. Such actions have the effect of curtailing some revenue sources and increasing compliance costs for most financialinstitutions. In addition, financial institutions are considering adopting new digital technologies to change the way they interface with customersand employees and manage their operations.
• Insurance. We serve global property and casualty insurers, life insurers, reinsurance firms and insurance brokers. We focus on such aspects of ourclients’ operations as business acquisition, policy administration, claims processing, management reporting, regulatory compliance, andreinsurance. One of the factors driving the need for our services in the insurance industry is a desire to improve the sales and marketing process,both by deepening direct retail customer relationships and strengthening interactions with networks of independent and captive insurance agents,often through the use of digital technologies. Insurers also seek to enhance their profitability by differentiating their products and services,resulting in a need for specialized underwriting models and systems. Additionally, many insurers seek to improve business effectiveness byreducing expense ratios and exiting non-core lines of business and operations.
Healthcare
Our Healthcare business segment serves many leading healthcare and life sciences companies. This business segment provides services to our clientsoperating in the following industries:
• Healthcare. We serve many leading global healthcare organizations, including healthcare payers, providers and pharmacy benefit managers. Thehealthcare industry is facing the dual challenge of improving the quality of care while lowering the cost of care. A key factor driving transformationin this industry has been the Affordable Care Act. In 2014, we acquired TZ US Parent, Inc., or TriZetto, to enhance our competitive position in thehealthcare sector. TriZetto delivers world-class, healthcare IT solutions that enable healthcare organizations to work more efficiently andcollaboratively. Our Healthcare business focuses on providing a broad range of services and solutions that address regulatory requirements andemerging industry trends such as regulatory compliance, integrated health management, enterprise information management, claims investigativeservices and operational improvement in areas such as claims processing, enrollment, membership and billing. We also help our clients to enabletheir systems and processes to deal with the retail orientation of health care, such as the support of individual mandates and the adoption of digitalsolutions to improve access to health information and decision making by end consumers. Through our 2014 acquisition of TriZetto, we develop,license, implement and support proprietary and third-party software products for the healthcare industry.
• Life Sciences. We serve leading pharmaceutical, biotech, and medical device companies, as well as providers of generic, animal health and consumerhealth products. Some of the factors driving demand for our services are financial pressures caused by payer and government pricing pressures,patent expiry and competition from generics, the drive to expand into new geographic markets, the need for more targeted or personalized therapiesleading to research and development innovation, continued diversification of product portfolios and the related high cost of product development,and a dynamic regulatory environment with greater emphasis on product safety, ethics and compliance, transparency of pricing and promotionalactivity. Our life sciences solutions help transform many of the business processes in the life sciences value chain (research, clinical development,manufacturing and supply chain, sales and marketing) as well as regulatory and administrative functions and general IT. Life sciences companiesaround the world have significantly increased their emphasis on digital engagement with all of their stakeholders while increasingly leveragingenterprise-level analytics to drive a customer-centric approach to marketing and sales.
Manufacturing/Retail/Logistics
Our Manufacturing, Retail and Logistics business segment provides services for global leaders in a range of sub-sectors, including industrial,automotive, process logistics, energy and utilities, and retail. This business segment services customers in the following industry groups:
• Manufacturing and Logistics. Clients in this sector include manufacturers of automotive and industrial products as well as processors of naturalresources, chemicals and raw materials. In logistics, our clients include rail, truck, marine and other transportation and distribution companies. Wealso serve many leading energy utilities, as well as oil and gas producers. Some of our manufacturing and logistics solutions for automotive andindustrial clients include warranty management, dealer systems integration, supply chain management, sales and operations planning, andmobility. For transportation and distribution clients, our service areas include warehouse and yard management, transportation asset management,transportation network design, global trade management and analytics. Industry
3
Source: COGNIZANT TECHNOLOGY SOLUTIONS CORP, 10-K, February 25, 2016 Powered by Morningstar® Document Research℠The information contained herein may not be copied, adapted or distributed and is not warranted to be accurate, complete or timely. The user assumes all risks for any damages or losses arising from any use of this information,except to the extent such damages or losses cannot be limited or excluded by applicable law. Past financial performance is no guarantee of future results.
Table of Contents
trends that influence the demand for our services in this sector include the increasing globalization of sourcing and the desire of clients to furtherpenetrate emerging markets, leading to longer and more complex supply chains. In the power generation sector, industry trends include thecontinued energy conservation efforts, including “smart meter” installations, the need for better grid reliability and security, regulatory changesand the need to relieve cost pressures through better asset performance and web-based customer care systems. Clients also are optimizing theirsupply chains to better manage inventory, support growing ecommerce operations and improve customer-supplier collaboration. They are applyingintelligent systems to manufacturing and logistics operations, enabling mobile platforms to support field sales and are using data analytics to makebetter informed decisions.
• Retail, Travel and Hospitality. We serve a wide spectrum of retailers and distributors, including supermarkets, specialty premium retailers,department stores and large mass-merchandise discounters. Current trends affecting demand in the retail industry include a need for greater cost-efficiency to combat the industry’s traditionally narrow profit margins, changes in supply chain management to facilitate direct store delivery, theability to accommodate multi-channel (in-store and on-line) models, and the impact of digital technologies on customer and employee interaction.We also serve the travel and hospitality industry, including airlines, hotels, restaurants, online and retail travel, global distribution systems andintermediaries and real estate companies.
• Consumer Goods. We serve many of the world’s premier consumer goods manufacturers, creating innovative solutions and strategies that help thembuild and sustain strong brands while enhancing their price-competitiveness, category leadership and consumer loyalty. Principal segments servedinclude consumer durables, food and beverage, footwear and apparel, and home and personal care products. Our expertise in these areas includesdemand-driven supply chains, revenue-creating trade promotion management systems, analytics systems and mobility solutions that anticipate andserve ever-changing customer needs. The demand for our services in this sector is driven by the need of consumer goods companies to accelerateproduct innovation to remain competitive and deliver top-line growth, the continuing drive to optimize global sourcing and supply chainmanagement, the impact of digital technologies on consumer interaction, marketing and sales processes, the use of data analytics to increase theeffectiveness of product development and marketing, as well as ongoing pressures to curtail IT costs.
Other
The Other business segment includes the Communications, Information, Media and Entertainment, and High Technology operating segments. TheOther business segment is an aggregation of operating segments each of which, individually, represents less than 10.0% of consolidated revenues andsegment operating profit. Descriptions of the key operating segments included in the Other business segment are as follows:
• Communications. We serve some of the world’s leading communications (cable, wireless and wireline) service providers, equipment vendors, andsoftware vendors. We help our clients address the important trends in the communications industry, such as transitioning to new networktechnologies, designing, developing, testing and introducing new products and channels, improving customer service and increasing customersatisfaction, transforming business support systems and operations support systems, transitioning to agile development methodologies andenabling applications for cloud deployment.
• Information, Media and Entertainment. We serve some of the world’s largest media and entertainment companies, including information serviceproviders, publishers, broadcasters, and movie, music and video game companies. The growth of digital platforms is causing significant change inthese industries and we are working with clients to help them meet these challenges and transform their businesses. Additional trends affecting theindustry include a decline in traditional print publishing, the need for digital asset management and the increasing role of digital technologies onthe consumption of entertainment content. We provide solutions in critical areas such as the digital content supply chain and media assetmanagement. Some of our other services include business solutions, such as advertising management, online media, and e-business, digitaldistribution, workflow automation, intellectual property management, anti-piracy initiatives and operational systems (advertising sales, studiomanagement, billing and payments, content management and delivery).
• High Technology. We serve some of the world’s leading independent software vendors, or ISVs, technology equipment manufacturers, and onlineservice providers. We assist the ISVs with their transitions to new business models (such as software-as-a-service, or SaaS, models) and facilitatetheir license management and sales processes. We help the high-technology manufacturers take on complex, transformational business process andproduct engineering initiatives. The technology sector is largely driven by product development. This creates demand for analytical, engineering,testing, and content management services and go-to-market strategies.
4
Source: COGNIZANT TECHNOLOGY SOLUTIONS CORP, 10-K, February 25, 2016 Powered by Morningstar® Document Research℠The information contained herein may not be copied, adapted or distributed and is not warranted to be accurate, complete or timely. The user assumes all risks for any damages or losses arising from any use of this information,except to the extent such damages or losses cannot be limited or excluded by applicable law. Past financial performance is no guarantee of future results.
Table of Contents
Across our business segments, we are highly dependent upon our foreign operations. Our development and delivery centers and technical professionalsare positioned globally, with the majority located in India. Our operations in India and the rest of the world expose us to various risks, including regulatory,economic and political instability, potentially unfavorable tax, import and export policies, fluctuations in foreign exchange and inflation rates, internationaland civil hostilities, terrorism, natural disasters and pandemics.
Our Solutions and Services
Across each of our business segments, we provide a broad and expanding range of consulting, information technology and outsourcing services,including:
Consulting and Technology Services
• Business, Process, Operations and IT Consulting. Our global consulting team, Cognizant Business Consulting, or CBC, helps clients re-imagineand transform their businesses to gain competitive advantage. CBC works with clients to improve business performance and operationalproductivity in order to exceed business goals. We also provide assistance with strategy consulting, business and operations consulting, ITstrategy and change management, and program management consulting.
Key factors driving the demand for CBC’s services are the following:• The need to run the business better while increasing operational flexibility and reducing time to market;• Optimizing big data and predictive analytics to gain competitive insight;• Large business transformations, impacting business and IT operating models;• Increased demands to collaborate and compete in the market for customers, capabilities and talent;• Readiness to embrace virtualization capabilities, including greater infrastructure outsourcing and cloud solutions, with a focus on
identifying and managing risk and cost; and• Ongoing regulatory shifts, which require enhanced risk management and compliance frameworks as well as greater organizational
resilience.
In this environment, the services currently provided by CBC include:• IT strategy consulting to define new IT target operating and delivery models, and to optimize IT-to-business alignment, sourcing
strategies and IT costs;• Program management consulting, including post-acquisition integration, business and IT integration, business transformation, and
large scale business transformation;• Operations improvement consulting for business process management, operations strategy, global sourcing and supply chain
management, and change management;• Strategy consulting with respect to re-imagining new business and operating models, market growth, mergers and acquisitions, product
innovation and sustainability initiatives; and• Business consulting related to finance, risk advisory, human resources, marketing and analytics functions.
• Application Development and Systems Integration. We offer a full range of application design, application development and systems integrationservices, which ensures that customer IT functions operate in the most efficient, responsive and cost-effective manner. We have particular depth ofskills in implementing large, complex, business-critical IT development and integration programs. Demand for our application development andsystems integration services is being driven by our customers' growing need to access outside capabilities to respond to the impact of changes inmarkets, regulation, competition and digital technologies on their businesses.
As part of our application development services, we define customer requirements, document specifications and design, develop, test and integratesoftware across multiple platforms, including Internet technologies. We modify and test applications to enable systems to function in newoperating environments. In addition, these services include enterprise resource planning and customer relationship management implementationservices. We follow one of two alternative approaches to application development and systems integration:• Full life-cycle application development, in which we assume start-to-finish responsibility for analysis, design, implementation, testing and
integration of systems; or• Cooperative development, in which our employees work with a customer’s in-house IT personnel to jointly analyze, design, implement, test
and integrate new systems.
5
Source: COGNIZANT TECHNOLOGY SOLUTIONS CORP, 10-K, February 25, 2016 Powered by Morningstar® Document Research℠The information contained herein may not be copied, adapted or distributed and is not warranted to be accurate, complete or timely. The user assumes all risks for any damages or losses arising from any use of this information,except to the extent such damages or losses cannot be limited or excluded by applicable law. Past financial performance is no guarantee of future results.
Table of Contents
In both of these approaches, our on-site team members work closely and collaboratively with our clients. Detailed design, implementation andtesting are generally performed at dedicated near-shore and offshore development and delivery centers. In addition, we maintain an on-site presenceat each customer location in order to address evolving client needs and resulting changes to the project. A key part of our application developmentand systems integration offering is a suite of services to help organizations build and integrate business applications with the rest of theiroperations. Using this suite of services we build and deploy robust, scalable and extensible architectures for use in a wide range of industries. Wemaintain competency centers specializing in various areas such as: Microsoft solutions; IBM, SAP, Oracle and Java applications; and cloudcomputing and mobile solutions. These competency centers enable us to provide application development and integration services to a broadspectrum of clients. Our re-engineering service offerings automate many of the processes required to implement advanced technology platforms.We believe that this automation substantially reduces the time and cost to perform re-engineering services. These tools also enable us to performsource code analysis and to re-design target databases and convert certain programming languages. Our programmers also help clients re-designand convert user interfaces.
• Enterprise Information Management. Our enterprise information management practice focuses on helping clients harness the vast amounts of dataavailable on their operations, customers and markets, and convert that data into information and insights that are valuable to their businesses andcan be used to drive management decisions. We help clients identify the types of data available both within their organizations and from outsidesources, including social media, and work to bring that data together in a meaningful “data to foresight” continuum. Among the trends driving thisbusiness are the desire of companies to better understand consumer demands and market opportunities in order to create new products and services,the need to manage reporting requirements in regulated industries such as healthcare and financial services, and the pressures to manage operationsmore efficiently and cost-effectively through the use of analytical tools. Among the services we provide in the enterprise information managementarea are the following:
• Strategic, advisory and management consulting services across information management, business intelligence & analytics;
• Enterprise data management, including the creation of data warehouses, data marts, operational stores, enterprise master data managementplatforms, enterprise metadata platforms and enterprise data governance;
• Descriptive analytics / business intelligence that involves the strategy, design, build and management of information assets that drive day-to-day decision making;
• Strategic corporate performance management, which enables clients to create executive dashboards or scorecards to better manage operations;
• Packaged analytics designed to provide solutions to specific business problems leveraging technologies such as mobile and cloud; and
• Big data services that assist clients in managing and deriving actionable insights from the explosion in the volume, variety, velocity andcomplexity of data.
• Application Testing. Our application testing practice offers a comprehensive suite of services in testing, consulting and engineering. Our qualityassurance, or QA, transformation services help clients develop deep, agile QA capabilities that create or extend their competitive advantage. QA isdriven by six strategic themes: integrated automation, user advocacy, intellectual property-based intelligent platform, a factory model, end-to-endquality focus, and an on-demand infrastructure model. Our business-aligned services in the areas of system and integration testing, package testing,user acceptance, automation, performance testing and test data management address our clients’ critical quality needs. Consulting andinfrastructure solutions in quality management, test tools and test infrastructure enable our clients to capitalize on emerging opportunities. Factorsdriving the demand for our testing services include the adoption of digital technologies, the need for testing of new regulatory complianceprocesses, and the desire of clients for more cost-effective and nimble “on-demand” testing. Accordingly, among the functions we provide aretesting related to integration of SAP, Seibel and other systems, IT process and quality consulting, testing of customized mobile and cloud-basedapplications, and Testing-as-a-Service. We focus our managed test centers on specific domains (e.g., specific industries and software solutions),ensuring we tailor our testing solutions to the particular needs of clients. We help our clients achieve significant reduction in time to market as wellas cost of quality, and realize significant improvements in the maturity of their quality processes.
• Digital Technologies Services. We help clients implement digital technologies in their businesses. These technologies are now fundamentalcomponents of the enterprise IT architecture. These technologies are profoundly changing the
6
Source: COGNIZANT TECHNOLOGY SOLUTIONS CORP, 10-K, February 25, 2016 Powered by Morningstar® Document Research℠The information contained herein may not be copied, adapted or distributed and is not warranted to be accurate, complete or timely. The user assumes all risks for any damages or losses arising from any use of this information,except to the extent such damages or losses cannot be limited or excluded by applicable law. Past financial performance is no guarantee of future results.
Table of Contents
way companies bring products and services to market and relate to and interact with their customers, employees and others. As such, thesetechnologies may help companies achieve innovation-driven top line growth and efficiencies that improve the bottom line. As part of our services,we help clients analyze social media sentiment and build those insights into their customer relationship management process, as well as enablingclients to manage and analyze vast accumulations of data and use that data to drive management decisions. We also offer end-to-end services toenable cloud-based processes, from consulting and implementation to ongoing support activities.
• Software Solutions and Related Services. Through our 2014 acquisition of TriZetto, we develop, license, implement and support proprietary andthird-party software products for the healthcare industry, including solutions for health insurance plans, third party benefit administrators, or TPAs,and healthcare providers that enable healthcare organizations to work more efficiently and collaboratively to deliver better healthcare services. Oursolutions help health plans and TPAs increase administrative efficiency, improve the cost and quality of care, and succeed in the retail healthcaremarket. Our solutions help physicians and healthcare organizations simplify business processes and execute strategies for population healthmanagement, accountable care, and value-based initiatives.
Outsourcing Services
• Application Maintenance. Our application maintenance service offering supports some or all of a client’s applications, ensuring that systemsremain operational and responsive to changing user requirements and provide on-going enhancements as required by the client. Beyond thetraditional view of IT outsourcing as a cost-saving measure, our application maintenance services enable clients to improve the overall agility,responsiveness, productivity and efficiency of their IT infrastructure. Increasingly, we are also assisting clients in adapting their IT systems todigital technologies. As part of this process, we are often able to introduce product and process enhancements and improve service levels tocustomers requesting modifications and on-going support. We also provide application value management solutions that can help balance cost,complexity and capacity and can help clients reduce cost of ownership, improve service levels and create new operational efficiencies. Our globaldelivery business model enables us to provide a range of rapid response and cost-effective support services to our clients. Our on-site personneloften provide help-desk services at the client’s facility. These employees typically are available in the event of an emergency service request andare also able to quickly resolve customer problems from remote locations. In the case of more complex maintenance services, includingmodifications, enhancements and documentation, which typically take a longer amount of time, we utilize our offshore resources to developsolutions more cost-effectively than would be possible locally. As part of our application maintenance services, we assist clients in renovating theircore systems to meet the requirements imposed by new regulations, new standards or other external events. We anticipate the operationalenvironment of our clients’ IT systems as we design and develop such systems. We also offer diagnostic services to assist clients in identifyingissues in their IT systems and optimizing the performance of their systems.
• IT Infrastructure Services. We provide end-to-end IT Infrastructure management outsourcing services. We have service capability in redundantglobal operating centers worldwide, through which we provide significant scale, quality and cost savings to our clients. Clients are increasinglyutilizing IT infrastructure services to sharpen their focus on core business operations, reallocate overhead costs to growth investments, enablebusinesses to respond more quickly to changing demands, decrease time to market, ensure that the IT infrastructure can scale as the businessevolves and access skill sets outside the organization. The major services we provide include data center, infrastructure security, network andconvergence, end-user computing services and mobility. We also have cloud services offerings that utilize virtualization technologies acrossdelivery solutions for private cloud, enterprise multi-tenant cloud and public cloud models.
• Business Process Services. We provide business process services through unique industry-aligned solutions that integrate process, domain andtechnology expertise to enable our clients to respond in an agile manner to market opportunities and challenges, while also creating variable coststructures to drive greater effectiveness and cost-efficiency. We have extensive domain-specific expertise in core front office, middle office andback office functions including finance and accounting, procurement, data administration, data management, and research and analytics. Ourindustry-specific solutions include clinical data management, pharmacovigilance, equity research support, commercial operations and ordermanagement. In addition to business process services, related services include consulting to ensure process excellence and a range of platform-based services. Our goals for our client relationships are customer satisfaction, operational productivity, strategic value and businesstransformation. Among the factors driving growth in our services are the desire to improve cost-effectiveness, the emergence of digital technologies,and the need for clients to access capabilities beyond their organizations to adapt to rapid changes in technologies, markets and customer demands.
7
Source: COGNIZANT TECHNOLOGY SOLUTIONS CORP, 10-K, February 25, 2016 Powered by Morningstar® Document Research℠The information contained herein may not be copied, adapted or distributed and is not warranted to be accurate, complete or timely. The user assumes all risks for any damages or losses arising from any use of this information,except to the extent such damages or losses cannot be limited or excluded by applicable law. Past financial performance is no guarantee of future results.
Table of Contents
Business Strategies
Our objectives are to maximize shareholder value and enhance our position as a leading provider of information technology, consulting and businessprocess services. We implement the following core strategies to achieve these objectives:
Growth through Reinvestment. We aim to invest our profits above the 19% to 20% non-GAAP operating margin level, excluding stock-based compensationexpense and acquisition-related charges, back into our business. We believe this is a significant contributing factor to our strong revenue growth. Thisinvestment is primarily focused in the areas of: strengthening and expanding our portfolio of services; continuing to expand our geographic presence forboth sales and delivery; hiring client partners and relationship personnel with specific industry experience or domain expertise; training our technical staff ina broader range of service offerings; recognizing and rewarding exceptional performance by our employees; and maintaining a level of resources, trained in abroad range of service offerings, to be well positioned to respond to our client requests, as described below.
• Expand Service Offerings and Solutions: We have several teams dedicated to creating innovative technology-based solutions and developing new,high value services. The teams collaborate with customers to develop these services. We are currently developing new offerings in business and ITconsulting and industry-oriented IT solutions utilizing innovative technologies. We also continue to enhance our capabilities and service offeringsin the areas of customer relationship management, enterprise resource planning, enterprise information management, software testing, infrastructuremanagement, industry-oriented business process services and digital technologies. We believe that the continued expansion of our service offeringswill provide new sources of revenue, reduce our reliance on any one technology initiative and foster long-term relationships with our customers byallowing us to better serve their needs. Additionally, as part of our vision to continue our growth and anticipate our clients’ and the markets’rapidly changing demands, we are investing in emerging digital opportunities which will transform client and user platforms to Internet, cloud andmobile-based experiences.
• Expand Domestic and International Geographic Presence: We have established sales and marketing offices in various metropolitan areas in theUnited States and internationally. As we expand our customer base, we plan to open additional sales and marketing offices globally to support thedemands of our clients and markets. This expansion is expected to facilitate sales and services to existing and new customers.
• Research and Development and Competency Centers: We have project experience and expertise across multiple architectures and technologies,and have made significant investments in our competency centers and in research and development around the latest technology developments.Most of our technical staff is trained in multiple technologies and architectures. As a result, we are able to react to clients’ needs quickly andefficiently redeploy our technical staff to support a variety of technologies. Also, to develop and maintain this flexibility, we have made asubstantial investment in our competency centers so that the experience gained from particular projects and research and development efforts isleveraged across our entire organization. Through our investment in research and development activities and the continuing education of ourtechnical personnel, we enlarge our knowledge base and develop the necessary skills to keep pace with emerging technologies. We believe that ourability to work in new technologies allows us to foster long-term relationships by having the capacity to continually address the needs of bothexisting and new clients.
• Enhance Processes, Methodologies and Productivity Toolsets: We have a comprehensive process framework that addresses the entire softwareengineering life cycle and support activities, which are scalable for projects of different sizes and complexities. This proprietary framework, whichwe refer to as “Process Space”, is supported by in-house project management, metrics management and workflow tools and is available to all ourprogrammers globally. Our Delivery Excellence Group facilitates process implementation from project inception and audits the projectsperiodically to ensure that the implementation is effective and the risks are being managed. With the globalization of business, we are committed toimproving and enhancing our proprietary Process Space software engineering process and other methodologies and toolsets. We are constantlydesigning and developing additional productivity software tools to automate testing processes and improve project estimation and risk assessmenttechniques. We have invested considerably in automation to improve process institutionalization across the organization. For example, we havebuilt and deployed “Cognizant 2.0,” an intelligent delivery ecosystem which orchestrates processes, methodologies and best practices drivingeffective usage of knowledge, while providing a collaborative framework for our world-wide client service personnel. Our process framework hasbeen extensively adapted to cater to different types of projects managed by the organization across different service lines.
8
Source: COGNIZANT TECHNOLOGY SOLUTIONS CORP, 10-K, February 25, 2016 Powered by Morningstar® Document Research℠The information contained herein may not be copied, adapted or distributed and is not warranted to be accurate, complete or timely. The user assumes all risks for any damages or losses arising from any use of this information,except to the extent such damages or losses cannot be limited or excluded by applicable law. Past financial performance is no guarantee of future results.
Table of Contents
Global Delivery Model. We have a four-tiered global architecture for service delivery and operations, consisting of employees co-located at clients’ sites, atlocal facilities or in-country delivery centers, at regional delivery centers and at global delivery centers. Our extensive facilities, technology andcommunications infrastructure facilitate the seamless integration of our global workforces. This is accomplished by permitting team members in differentlocations to access common project information and to work directly on client projects. This infrastructure allows for rapid completion of projects, highestlevel of quality, efficient use of clients’ technological resources and real-time access to project information by the on-site account manager or the client. Inaddition, for large projects with short time frames, our offshore facilities allow for parallel processing of various development phases to accelerate deliverytime. Key aspects of our global delivery model include:
• Two-in-a-Box Engagement Model: Our proprietary, trademarked client engagement model, called Two-in-a-Box, or TIB, represents our commitmentto providing superior service to help clients reduce IT operational costs, embrace best practices and undergo sustainable business transformation.Centered on the needs of the client’s organization, TIB is designed specifically to help clients quickly reduce IT budgets, revamp IT operations andre-deploy freed-up assets to more strategic initiatives that generate business value. The TIB model includes a relationship management team, led bythe Client Partner, or CP, with deep industry expertise, working onsite to absorb the client’s culture, operational processes, challenges and businessgoals and to assist with strategic planning. Another critical TIB team member is the dedicated global delivery manager, or DM. The relationshipbetween the CP and DM is essential to ensure that our IT services are delivered with precision and that they are tailored to each client’s uniqueneeds.
• Highly-Skilled Workforce: Our managers and senior technical personnel provide in-depth project management expertise to clients. To maintain thislevel of expertise, we place significant emphasis on recruiting and training our workforce of highly-skilled professionals including projectmanagers and senior service delivery staff around the world, many of whom have significant work experience in North America, Europe and Asia.We also maintain programs and personnel to hire and train the best available technical professionals in both legacy systems and emergingtechnologies. We provide extensive combined classroom and on-the-job training to newly-hired technical staff, as well as additional annualtraining programs designed to enhance the business practices, tools, technology and consulting skills of our professional staff.
• Initiatives to Remain an Employer of Choice: As a growing professional services firm, a key attribute of our continued success is the ability tocontinually hire, assimilate, motivate and retain the best talent possible in the industry. We have developed strong relationships with keyuniversities around the world, particularly in India, to provide a continual pipeline of talented staff from top-ranked schools. In addition, we haveestablished an active lateral recruiting program in North America, Europe and India and an on-campus recruiting program in North America. Wecontinue to expand our presence and brand in our key supply markets, further enhancing our ability to hire experienced professionals fromcompeting IT services firms and industry to support our client needs and growth. We invest heavily in training programs, motivational programsand career development to ensure personal professional growth for each of our employees.
Further Development of Long-Term Client Relationships. We have strong long-term strategic relationships with our clients and business partners. We seek toestablish long-term relationships that present recurring revenue opportunities, frequently trying to establish relationships with our clients’ chief informationofficers, or other IT and business decision makers, by offering a wide array of cost-effective high quality services. Approximately 98.4% of our revenues forthe year ended December 31, 2015 were derived from clients who had been using our services at the end of 2014. We also seek to leverage our experiencewith a client’s IT systems into new business opportunities. A successful track record and in-depth knowledge of a client’s processes and IT systems gainedduring the performance of application maintenance services can provide us with a competitive advantage in securing additional maintenance, developmentand other projects.
Pursuit of Selective Strategic Acquisitions, Joint Ventures and Strategic Alliances. We believe that opportunities continue to exist in the fragmented marketin which we operate to expand our business through selective strategic acquisitions, joint ventures and strategic alliances. We believe that acquisition andjoint venture candidates may enable us to expand our geographic presence, service offering and capabilities more rapidly.
Sales and Marketing
We market and sell our services directly through our professional staff, senior management and direct sales personnel operating out of our globalheadquarters and business development offices which are strategically located in various metropolitan areas around the world. The sales and marketing groupworks with our client delivery team as the sales process moves closer to the customer’s selection of a services provider. The duration of the sales process mayvary widely depending on the type and complexity of services.
9
Source: COGNIZANT TECHNOLOGY SOLUTIONS CORP, 10-K, February 25, 2016 Powered by Morningstar® Document Research℠The information contained herein may not be copied, adapted or distributed and is not warranted to be accurate, complete or timely. The user assumes all risks for any damages or losses arising from any use of this information,except to the extent such damages or losses cannot be limited or excluded by applicable law. Past financial performance is no guarantee of future results.
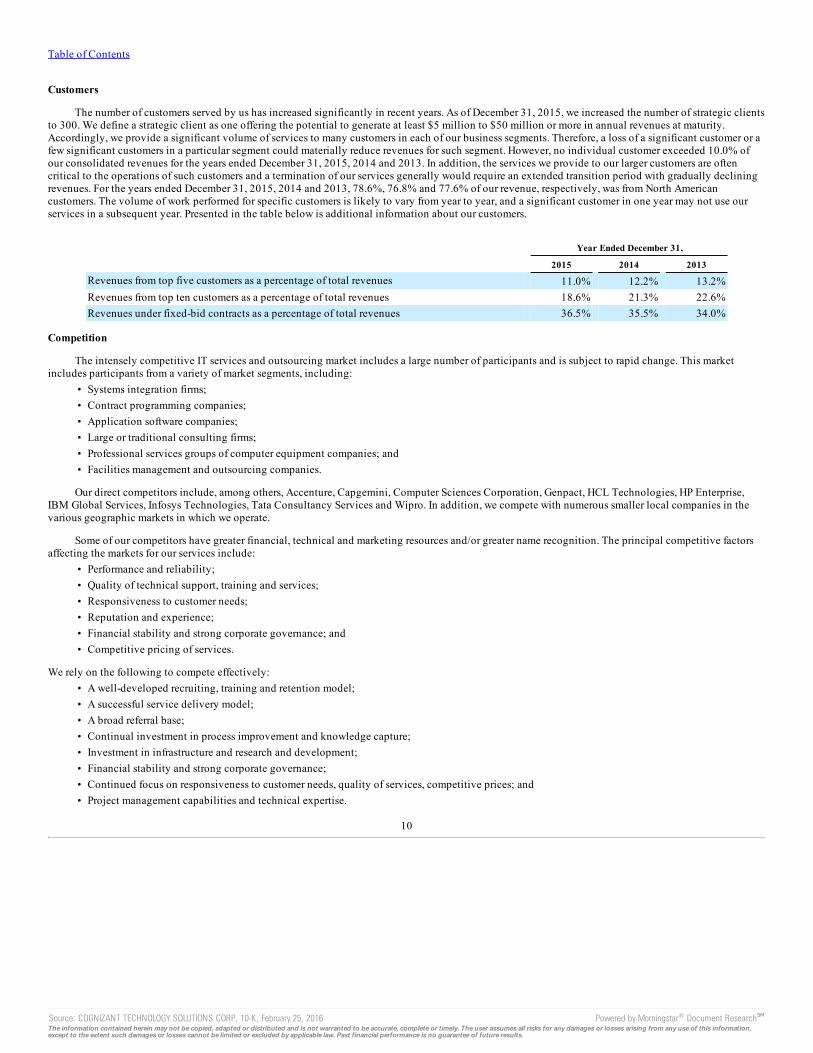
Table of Contents
Customers
The number of customers served by us has increased significantly in recent years. As of December 31, 2015, we increased the number of strategic clientsto 300. We define a strategic client as one offering the potential to generate at least $5 million to $50 million or more in annual revenues at maturity.Accordingly, we provide a significant volume of services to many customers in each of our business segments. Therefore, a loss of a significant customer or afew significant customers in a particular segment could materially reduce revenues for such segment. However, no individual customer exceeded 10.0% ofour consolidated revenues for the years ended December 31, 2015, 2014 and 2013. In addition, the services we provide to our larger customers are oftencritical to the operations of such customers and a termination of our services generally would require an extended transition period with gradually decliningrevenues. For the years ended December 31, 2015, 2014 and 2013, 78.6%, 76.8% and 77.6% of our revenue, respectively, was from North Americancustomers. The volume of work performed for specific customers is likely to vary from year to year, and a significant customer in one year may not use ourservices in a subsequent year. Presented in the table below is additional information about our customers.
Year Ended December 31,
2015 2014 2013
Revenues from top five customers as a percentage of total revenues 11.0% 12.2% 13.2%Revenues from top ten customers as a percentage of total revenues 18.6% 21.3% 22.6%Revenues under fixed-bid contracts as a percentage of total revenues 36.5% 35.5% 34.0%
Competition
The intensely competitive IT services and outsourcing market includes a large number of participants and is subject to rapid change. This marketincludes participants from a variety of market segments, including:
• Systems integration firms;• Contract programming companies;• Application software companies;• Large or traditional consulting firms;• Professional services groups of computer equipment companies; and• Facilities management and outsourcing companies.
Our direct competitors include, among others, Accenture, Capgemini, Computer Sciences Corporation, Genpact, HCL Technologies, HP Enterprise,IBM Global Services, Infosys Technologies, Tata Consultancy Services and Wipro. In addition, we compete with numerous smaller local companies in thevarious geographic markets in which we operate.
Some of our competitors have greater financial, technical and marketing resources and/or greater name recognition. The principal competitive factorsaffecting the markets for our services include:
• Performance and reliability;• Quality of technical support, training and services;• Responsiveness to customer needs;• Reputation and experience;• Financial stability and strong corporate governance; and• Competitive pricing of services.
We rely on the following to compete effectively:• A well-developed recruiting, training and retention model;• A successful service delivery model;• A broad referral base;• Continual investment in process improvement and knowledge capture;• Investment in infrastructure and research and development;• Financial stability and strong corporate governance;• Continued focus on responsiveness to customer needs, quality of services, competitive prices; and• Project management capabilities and technical expertise.
10
Source: COGNIZANT TECHNOLOGY SOLUTIONS CORP, 10-K, February 25, 2016 Powered by Morningstar® Document Research℠The information contained herein may not be copied, adapted or distributed and is not warranted to be accurate, complete or timely. The user assumes all risks for any damages or losses arising from any use of this information,except to the extent such damages or losses cannot be limited or excluded by applicable law. Past financial performance is no guarantee of future results.
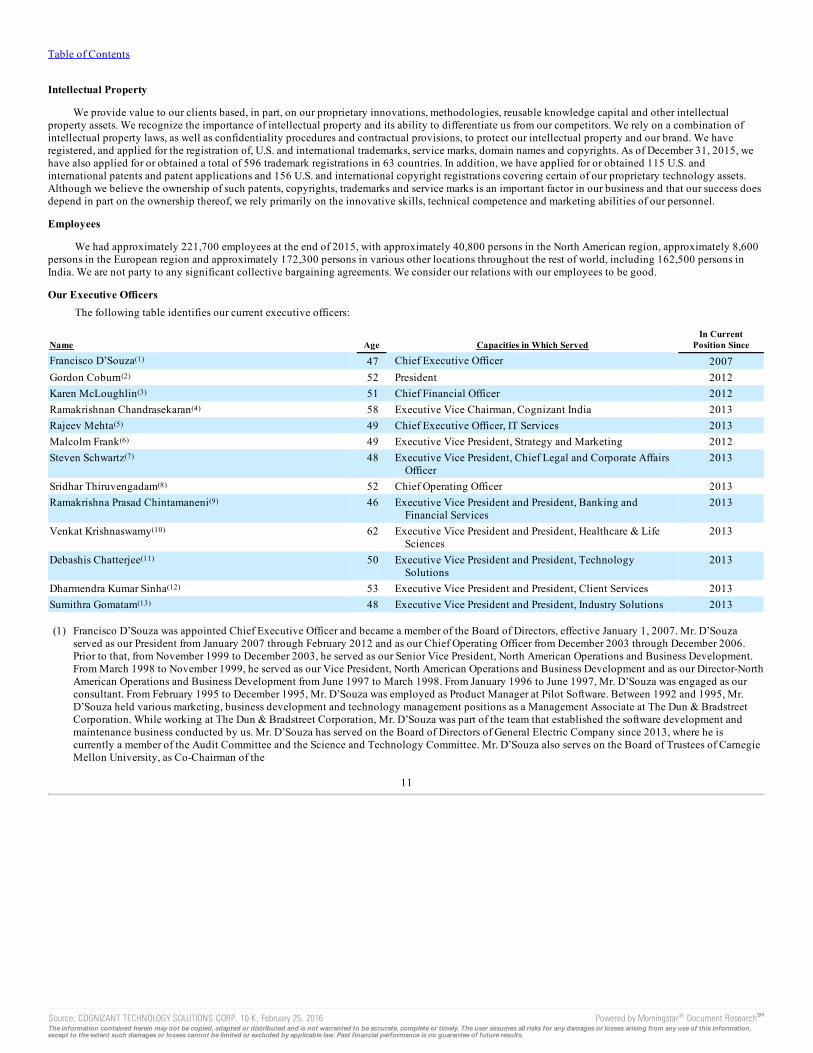
Table of Contents
Intellectual Property
We provide value to our clients based, in part, on our proprietary innovations, methodologies, reusable knowledge capital and other intellectualproperty assets. We recognize the importance of intellectual property and its ability to differentiate us from our competitors. We rely on a combination ofintellectual property laws, as well as confidentiality procedures and contractual provisions, to protect our intellectual property and our brand. We haveregistered, and applied for the registration of, U.S. and international trademarks, service marks, domain names and copyrights. As of December 31, 2015, wehave also applied for or obtained a total of 596 trademark registrations in 63 countries. In addition, we have applied for or obtained 115 U.S. andinternational patents and patent applications and 156 U.S. and international copyright registrations covering certain of our proprietary technology assets.Although we believe the ownership of such patents, copyrights, trademarks and service marks is an important factor in our business and that our success doesdepend in part on the ownership thereof, we rely primarily on the innovative skills, technical competence and marketing abilities of our personnel.
Employees
We had approximately 221,700 employees at the end of 2015, with approximately 40,800 persons in the North American region, approximately 8,600persons in the European region and approximately 172,300 persons in various other locations throughout the rest of world, including 162,500 persons inIndia. We are not party to any significant collective bargaining agreements. We consider our relations with our employees to be good.
Our Executive OfficersThe following table identifies our current executive officers:
Name Age Capacities in Which Served In Current
Position Since
Francisco D’Souza(1) 47 Chief Executive Officer 2007Gordon Coburn(2) 52 President 2012Karen McLoughlin(3) 51 Chief Financial Officer 2012Ramakrishnan Chandrasekaran(4) 58 Executive Vice Chairman, Cognizant India 2013Rajeev Mehta(5) 49 Chief Executive Officer, IT Services 2013Malcolm Frank(6) 49 Executive Vice President, Strategy and Marketing 2012Steven Schwartz(7)
48
Executive Vice President, Chief Legal and Corporate Affairs
Officer 2013
Sridhar Thiruvengadam(8) 52 Chief Operating Officer 2013Ramakrishna Prasad Chintamaneni(9)
46
Executive Vice President and President, Banking and
Financial Services 2013
Venkat Krishnaswamy(10)
62
Executive Vice President and President, Healthcare & Life
Sciences 2013
Debashis Chatterjee(11)
50
Executive Vice President and President, Technology
Solutions 2013
Dharmendra Kumar Sinha(12) 53 Executive Vice President and President, Client Services 2013Sumithra Gomatam(13) 48 Executive Vice President and President, Industry Solutions 2013 (1) Francisco D’Souza was appointed Chief Executive Officer and became a member of the Board of Directors, effective January 1, 2007. Mr. D’Souza
served as our President from January 2007 through February 2012 and as our Chief Operating Officer from December 2003 through December 2006.Prior to that, from November 1999 to December 2003, he served as our Senior Vice President, North American Operations and Business Development.From March 1998 to November 1999, he served as our Vice President, North American Operations and Business Development and as our Director-NorthAmerican Operations and Business Development from June 1997 to March 1998. From January 1996 to June 1997, Mr. D’Souza was engaged as ourconsultant. From February 1995 to December 1995, Mr. D’Souza was employed as Product Manager at Pilot Software. Between 1992 and 1995, Mr.D’Souza held various marketing, business development and technology management positions as a Management Associate at The Dun & BradstreetCorporation. While working at The Dun & Bradstreet Corporation, Mr. D’Souza was part of the team that established the software development andmaintenance business conducted by us. Mr. D’Souza has served on the Board of Directors of General Electric Company since 2013, where he iscurrently a member of the Audit Committee and the Science and Technology Committee. Mr. D’Souza also serves on the Board of Trustees of CarnegieMellon University, as Co-Chairman of the
11
Source: COGNIZANT TECHNOLOGY SOLUTIONS CORP, 10-K, February 25, 2016 Powered by Morningstar® Document Research℠The information contained herein may not be copied, adapted or distributed and is not warranted to be accurate, complete or timely. The user assumes all risks for any damages or losses arising from any use of this information,except to the extent such damages or losses cannot be limited or excluded by applicable law. Past financial performance is no guarantee of future results.
Table of Contents
Board of Trustees of The New York Hall of Science and on the Board of Directors of the U.S.-India Business Council. Mr. D’Souza holds a Bachelor ofBusiness Administration degree from the University of Macau (formerly known as the University of East Asia) and a Master of Business Administrationdegree from Carnegie Mellon University.
(2) Gordon Coburn was appointed President of the Company, effective February 6, 2012. From March 1998 until February 6, 2012, Mr. Coburn served asthe Company’s Chief Financial Officer and Treasurer and from January 2007 until February 2012, Mr. Coburn also held the position of Chief OperatingOfficer. Mr. Coburn also served as the Company’s Executive Vice President from December 2003 through December 2006. From November 1999 toDecember 2003, he served as our Senior Vice President. He previously was our Vice President from 1996 to November 1999. Mr. Coburn served asSenior Director-Group Finance and Operations for Cognizant Corporation from November 1996 to December 1997. From 1990 to October 1996, Mr.Coburn held key financial positions with The Dun & Bradstreet Corporation. Mr. Coburn serves on the Board of Directors of The Corporate ExecutiveBoard Company. He also served on the Board of Directors of ICT Group, Inc. until its acquisition on February 2, 2010. Mr. Coburn holds a Bachelor ofArts degree from Wesleyan University and a Master of Business Administration degree from the Amos Tuck School at Dartmouth College, where heserves as a member of its MBA Advisory Board.
(3) Karen McLoughlin was appointed Chief Financial Officer of the Company, effective February 6, 2012. She previously served as the Company’s SeniorVice President of Finance and Enterprise Transformation, a role she held since January 2010. In such role, Ms. McLoughlin was responsible for theCompany’s worldwide financial planning and analysis, enterprise risk management and enterprise transformation functions, including the facilitationand execution of various internal reengineering and transformation initiatives designed to enable the Company’s strategic vision. From August 2008 toJanuary 2010, Ms. McLoughlin served as the Company’s Senior Vice President of Finance, responsible for overseeing the Company’s global financialplanning and analysis team and enterprise risk management, and from October 2003 until August 2008, Ms. McLoughlin served as the Company’s VicePresident of Global Financial Planning and Analysis. Prior to joining Cognizant in October 2003, Ms. McLoughlin held various financial managementpositions at Spherion Corporation from August 1997 to October 2003 and at Ryder System Inc. from July 1994 to August 1997. Prior to joining Ryder,she spent six years in the South Florida Practice of Price Waterhouse (now PricewaterhouseCoopers). Ms. McLoughlin has served on the Board ofDirectors of Best Buy Co., Inc. since 2015. Ms. McLoughlin has a Bachelor of Arts degree in Economics from Wellesley College and a Master ofBusiness Administration degree from Columbia University.
(4) Ramakrishnan Chandrasekaran was appointed Executive Vice Chairman, Cognizant India, effective December 4, 2013. In this role, Mr. Chandrasekaranfocuses on strengthening our strong relationship with industry bodies, driving strategic initiatives that strengthen outreach to the government, andfurther enhancing our brand equity through public relations in India. From February 2012 to December 2013, Mr. Chandrasekaran served as GroupChief Executive-Technology and Operations. In this role, Mr. Chandrasekaran was responsible for leading our solutions and delivery teams world-wide.From August 2006 to February 2012, he served as our President and Managing Director, Global Delivery, responsible for leading our global deliveryorganization, spearheading new solutions, and championing process improvements. Mr. Chandrasekaran served as our Executive Vice President andManaging Director from January 2004 through July 2006. Prior to that, from November 1999 to January 2004, he served as our Senior Vice Presidentresponsible for Independent Software Vendor relationships, key alliances, capacity growth, process initiatives, business development and offshoredelivery. Mr. Chandrasekaran joined us as Assistant Vice President in December 1994, before being promoted to Vice President in January 1997. Priorto joining us, Mr. Chandrasekaran worked with Tata Consultancy Services. Mr. Chandrasekaran holds a Mechanical Engineering degree and Master ofBusiness Administration degree from the Indian Institute of Management.
(5) Rajeev Mehta was appointed Chief Executive Officer, IT Services, effective December 4, 2013. In this role, Mr. Mehta is responsible for market facingactivities across the Company as well as for delivery across our IT Services business. From February 2012 to December 2013, Mr. Mehta served asGroup Chief Executive-Industries and Markets. In this role, Mr. Mehta was responsible for leading our industry vertical and geographic marketoperations on a global basis. From August 2006 to February 2012, he served as our Chief Operating Officer, Global Client Services, responsible for oursales, business development and client relationship management organizations. Mr. Mehta served as Senior Vice President and General Manager of ourFinancial Services business segment from June 2005 to August 2006. From November 2001 to June 2005, he served as our Vice President and GeneralManager of our Financial Services business segment. From January 1998 to November 2001, Mr. Mehta served as our Director of the U.S. CentralRegion. Mr. Mehta served as our Senior Manager of Business Development from January 1997 to January 1998. Prior to joining Cognizant in 1997, Mr.Mehta was involved in implementing GE Information Services offshore outsourcing program and also held consulting positions at Deloitte & Toucheand Andersen Consulting. Mr. Mehta holds a Bachelor of Science degree from the University of Maryland and a Master of Business Administrationdegree from Carnegie Mellon University.
(6) Malcolm Frank was appointed Executive Vice President, Strategy and Marketing, effective February 6, 2012. Mr. Frank served as our Senior VicePresident of Strategy and Marketing from August 2005 to February 2012. In both these roles, Mr. Frank’s responsibilities have included, and continueto include, directing all aspects of our corporate marketing
12
Source: COGNIZANT TECHNOLOGY SOLUTIONS CORP, 10-K, February 25, 2016 Powered by Morningstar® Document Research℠The information contained herein may not be copied, adapted or distributed and is not warranted to be accurate, complete or timely. The user assumes all risks for any damages or losses arising from any use of this information,except to the extent such damages or losses cannot be limited or excluded by applicable law. Past financial performance is no guarantee of future results.

Table of Contents
function, including strategy and branding, industry and media relations, corporate communications and corporate marketing. From August 2005 untilJune 2009, Mr. Frank was also responsible for leading our field marketing function. Prior to joining Cognizant in August 2005, Mr. Frank was co-founder, President and Chief Executive Officer of CXO Systems, Inc., an independent software vendor providing dashboard solutions for seniormanagers, from March 2002 to July 2005. From June 1999 to September 2002, Mr. Frank was the founder, President, Chief Executive Officer andChairman of Nervewire Inc. (“Nervewire”), a management consulting and systems integration firm. Prior to founding Nervewire, Mr. Frank was a co-founder, executive officer, and Senior Vice President at Cambridge Technology Partners, where he ran Worldwide Marketing, Business Development,and several business units, from January 1990 to June 1999. Mr. Frank graduated from Yale University with a degree in Economics.
(7) Steven Schwartz was appointed Executive Vice President, Chief Legal and Corporate Affairs Officer on December 4, 2013. In this role, Mr. Schwartz isresponsible for our global legal teams, our global government affairs efforts and our global security team. From July 2007 to December 2013, Mr.Schwartz served as Senior Vice President, General Counsel and Secretary, having global responsibility for managing Cognizant’s legal function. Mr.Schwartz, who joined Cognizant in 2001, previously served as Vice President and General Counsel, a position he held from March 2003 to July 2007.From April 2002 to March 2003, he served as our Vice President and Chief Corporate Counsel. From October 2001 to December 2002, he served as ourChief Corporate Counsel. Mr. Schwartz serves on the Board of Directors of Information Technology Industry Council. Mr. Schwartz holds a Bachelor ofBusiness Administration degree from the University of Miami, a Juris Doctor degree from Fordham University School of Law and a Master of Law (inTaxation) degree from the New York University School of Law.
(8) Sridhar Thiruvengadam was appointed Chief Operating Officer of the Company, effective May 8, 2013. Previously, from January 2012 to May 2013,Mr. Thiruvengadam served as an Executive Vice President of the Company, leading the global delivery operations for several of the Company’sindustry verticals, and head of the Company’s Business Process Services (BPS) practice. From January 2010 to January 2012, Mr. Thiruvengadamserved as a Senior Vice President and global head of BPS, infrastructure and testing services. From April 2007 to January 2010, Mr. Thiruvengadamserved as the Company’s Chief People Officer in charge of talent acquisition, management, training and staffing. From March 2001 to March 2007, Mr.Thiruvengadam held several positions in the Company’s banking, financial services, healthcare and insurance practices, including Vice President andhead of the Company’s insurance industry vertical. Mr. Thiruvengadam joined the Company as a project manager in November 1994. Mr.Thiruvengadam holds a Masters in Technology degree from the Indian Institute of Technology, Madras.
(9) Ramakrishna Prasad Chintamaneni was appointed Executive Vice President and President, Banking and Financial Services (BFS), effective December 4,2013. In this role, Mr. Chintamaneni is responsible for leading the BFS practice. From 2011 to December 2013, Mr. Chintamaneni served as our GlobalHead of BFS Practice and was responsible for the practice’s sales, business development, consulting, client relationships, management and delivery, andglobal profit and loss. Previously, from 2010 to 2011, Mr. Chintamaneni served as our Global Head of Markets for the BFS Practice. From 2006 to 2009,he served as our Head of BFS Practice for North America. From 1999 through 2006, Mr. Chintamaneni served as our Client Partner, managing therelationships with several of our key BFS clients, and also led our U.S. Eastern Region’s BFS Practice. Prior to joining Cognizant in 1999, Mr.Chintamaneni spent seven years in the investment banking and financial services industry, including working at Merrill Lynch and its affiliates for fiveyears as an Investment Banker and a member of Merrill’s business strategy committee in India. Mr. Chintamaneni serves on the Board of Directors ofNPower, a nonprofit that helps nonprofits, schools and individuals build technology skills by harnessing the power of the technology community. Mr.Chintamaneni obtained his Bachelor of Technology degree in Chemical Engineering from the Indian Institute of Technology, Kanpur and aPostgraduate Diploma in Business Management from XLRI School of Management in India.
(10) Venkat Krishnaswamy was appointed President, Healthcare & Life Sciences, effective December 4, 2013. In this role, Mr. Krishnaswamy is focused ondelivering solutions and services to the healthcare industry. From February 2012 to December 2013, Mr. Krishnaswamy served as Executive VicePresident of Healthcare and Life Sciences. From April 2007 to February 2012, Mr. Krishnaswamy served as Senior Vice President and General Managerof Healthcare and Life Sciences. Mr. Krishnaswamy served as Vice President - Projects from January 2003 to April 2007 and as Director of Projects fromApril 1999 to January 2003. Upon joining Cognizant in 1997, Mr. Krishnaswamy served as Senior Manager until April 1999. Between 1997 and 2003,Mr. Krishnaswamy served in our BFS Practice. Prior to joining Cognizant in 1997, Mr. Krishnaswamy spent over ten years in retail and commercialbanking with Colonial State Bank (now Commonwealth Bank of Australia). Mr. Krishnaswamy holds a Bachelor of Engineering degree from theUniversity of Madras and a Masters degree in Electrical Engineering from the Indian Institute of Technology New Delhi.
(11) Debashis Chatterjee was appointed Executive Vice President and President, Technology Solutions, effective December 4, 2013. In this role, Mr.Chatterjee has responsibility for all of our horizontal practices within IT Services and is responsible for implementing best practices in service deliveryand creating solutions across our horizontal practices. From May 2013 until his current appointment, Mr. Chatterjee served as Senior Vice President andGlobal Head, Technology and Information Services. From March 2012 to April 2013, he was Senior Vice President, Transformational Services.
13
Source: COGNIZANT TECHNOLOGY SOLUTIONS CORP, 10-K, February 25, 2016 Powered by Morningstar® Document Research℠The information contained herein may not be copied, adapted or distributed and is not warranted to be accurate, complete or timely. The user assumes all risks for any damages or losses arising from any use of this information,except to the extent such damages or losses cannot be limited or excluded by applicable law. Past financial performance is no guarantee of future results.
Table of Contents
Previously, from April 2011 to January 2012, Mr. Chatterjee served as Vice President and Sectors Leader, Global Business Services, Global Delivery atIBM, a multinational technology and consulting company. From January 2010 to March 2011, Mr. Chatterjee was Senior Vice President and GlobalHead of Cognizant’s BFS Practice, from April 2007 to December 2009, he was Senior Vice President and Global Delivery Head of BFS, and from April2004 to March 2007, he was Vice President and Global Delivery Head of BFS. Prior to that, Mr. Chatterjee held various key management roles atCognizant since joining us in 1996. Mr. Chatterjee has a Bachelor of Engineering in Mechanical Engineering from Jadavpur University in India.
(12) Dharmendra Kumar Sinha was appointed Executive Vice President and President, Client Services, effective December 4, 2013. In this role, Mr. Sinhaleads our global sales, field marketing and intermediary relations teams. He is also responsible for our strategic partnerships and alliances organization.From 2007 to December 2013, Mr. Sinha served as Senior Vice President and General Manager, Global Sales and Field Marketing. From 2004 to 2007,Mr. Sinha served as our Vice President, responsible for our Manufacturing, Logistics, Retail, Hospitality, and Technology verticals. In addition, heassumed the role of Head of Sales and managed our Field Marketing function. From January 2008 to December 2008, Mr. Sinha additionally managedthe Insurance business unit. Prior to that, from 1998 to 2004, Mr. Sinha served as Director and subsequently as Vice President of the U.S. WesternRegion. From 1997 to 1998, Mr. Sinha served in various operational and business development positions. Prior to joining Cognizant in 1997, Mr.Sinha worked with Tata Consultancy Services and CMC Limited, an end-to-end IT solutions provider. Mr. Sinha has a Bachelor of Science Degree fromPatna Science college, Patna and a Master’s Degree in Business Administration from Birla Institute of Technology, Mesra.
(13) Sumithra Gomatam was appointed Executive Vice President and President, Industry Solutions, effective December 4, 2013. In this role, Ms. Gomatamoversees global delivery for all of our industry verticals and our BPS unit, and is responsible for implementing best practices in services delivery and forcreating solutions across our industry practices. Ms. Gomatam also leads our Communications and High Technology business units. From July 2008 toDecember 2013, Ms. Gomatam served as Senior Vice President, Projects. In this role, Ms. Gomatam served initially as our Global Delivery Head andthen as Global Practice Leader for our testing practice. From March 2006 to July 2008, Ms. Gomatam served as Vice President, Projects, leading globaldelivery and building out the testing practice. From 2001 to March 2006, Ms. Gomatam served as an Account Relationship Manager and as part of ourCore Delivery Leadership Team in our BFS Practice. From 1995, when Ms. Gomatam joined us, until 2001, she held various key positions within TheDun & Bradstreet Corporation and Cognizant, including serving our BFS clients on application development and application maintenance projects.Ms. Gomatam received her B.E. in Electronics and Communication from Anna University.
None of our executive officers is related to any other executive officer or to any of our Directors. Our executive officers are elected annually by theBoard of Directors and serve until their successors are duly elected and qualified.
Corporate History
We began our IT development and maintenance services business in early 1994, as an in-house technology development center for The Dun &Bradstreet Corporation and its operating units. In 1996, we, along with certain other entities, were spun-off from The Dun & Bradstreet Corporation to form anew company, Cognizant Corporation. On June 24, 1998, we completed an initial public offering of our Class A common stock. On June 30, 1998, a majorityinterest in us, and certain other entities were spun-off from Cognizant Corporation to form IMS Health. Subsequently, Cognizant Corporation was renamedNielsen Media Research, Incorporated.
On January 30, 2003, we filed a tender offer in which IMS Health stockholders could exchange IMS Health shares held by them for our Class Bcommon stock held by IMS Health. On February 13, 2003, IMS Health distributed all of our Class B common stock that IMS Health owned in an exchangeoffer to its stockholders. On February 21, 2003, pursuant to the terms of our Restated Certificate of Incorporation, all of the shares of Class B common stockautomatically converted into shares of Class A common stock. Since February 21, 2003, there have been no outstanding shares of Class B common stock.Effective May 26, 2004, pursuant to our Certificate of Incorporation, there are no authorized shares of Class B common stock.
Available Information
We make available the following public filings with the Securities and Exchange Commission, or the SEC, free of charge through our website atwww.cognizant.com as soon as reasonably practicable after we electronically file such material with, or furnish such material to, the SEC:
• our Annual Reports on Form 10-K and any amendments thereto;• our Quarterly Reports on Form 10-Q and any amendments thereto; and• our Current Reports on Form 8-K and any amendments thereto.
14
Source: COGNIZANT TECHNOLOGY SOLUTIONS CORP, 10-K, February 25, 2016 Powered by Morningstar® Document Research℠The information contained herein may not be copied, adapted or distributed and is not warranted to be accurate, complete or timely. The user assumes all risks for any damages or losses arising from any use of this information,except to the extent such damages or losses cannot be limited or excluded by applicable law. Past financial performance is no guarantee of future results.

Table of Contents
In addition, we make available our code of business conduct and ethics entitled “Cognizant’s Core Values and Standards of Business Conduct” free ofcharge through our website. We intend to disclose any amendments to, or waivers from, our code of business conduct and ethics that are required to bepublicly disclosed pursuant to rules of the SEC and the NASDAQ Global Select Market by posting it on our website.
No information on our website is incorporated by reference into this Form 10-K or any other public filing made by us with the SEC.
15
Source: COGNIZANT TECHNOLOGY SOLUTIONS CORP, 10-K, February 25, 2016 Powered by Morningstar® Document Research℠The information contained herein may not be copied, adapted or distributed and is not warranted to be accurate, complete or timely. The user assumes all risks for any damages or losses arising from any use of this information,except to the extent such damages or losses cannot be limited or excluded by applicable law. Past financial performance is no guarantee of future results.
Table of Contents
Item 1A. Risk FactorsFactors That May Affect Future Results
We face various important risks and uncertainties, including those described below, that could adversely affect our business, results of operationsand financial condition and, as a result, cause a decline in the trading price of our common stock.
Risks Relating to our Business
We face intense competition from other service providers.
We operate in intensely competitive industries that experience rapid technological developments, changes in industry standards, and changes incustomer requirements. The intensely competitive information technology, consulting and business process services markets include a large number ofparticipants and are subject to rapid change. These markets include participants from a variety of market segments, including:
• systems integration firms;• contract programming companies;• application software companies;• internet solutions providers;• large or traditional consulting companies;• professional services groups of computer equipment companies; and• infrastructure management and outsourcing companies.
These markets also include numerous smaller local competitors in the various geographic markets in which we operate which may be able to provideservices and solutions at lower costs or on terms more attractive to clients than we can. Our direct competitors include, among others, Accenture, Capgemini,Computer Sciences Corporation, Genpact, HCL Technologies, HP Enterprise, IBM Global Services, Infosys Technologies, Tata Consultancy Services andWipro. In certain markets, our competitors may have greater financial, technical and marketing resources and greater name recognition and, therefore, may bebetter able to compete for new work and skilled professionals. There is a risk that increased competition could put downward pressure on the prices we cancharge for our services and, in turn, our operating margins. Similarly, if our competitors develop and implement processes and methodologies that yieldgreater efficiency and productivity, they may be able to offer services similar to ours at lower prices without adversely affecting their profit margins. If we areunable to provide our clients with superior services and solutions at competitive prices or successfully market those services to current and prospectiveclients, our business, results of operations and financial condition may suffer.
Our international expansion plans may not be successful if we are unable to compete effectively in other countries. We may face competition in othercountries from companies that may have more experience with operations in such countries or with international operations. Additionally, such companiesmay have long-standing or well-established relationships with desired clients, which may put us at a competitive disadvantage. If we fail to competeeffectively in the new markets we enter, our ability to continue to grow our business could be adversely affected. In addition, if we cannot competeeffectively, we may be required to reconsider our strategy to expand internationally as well as our intent not to repatriate our non-U.S. earnings.
We may also face competition from companies that increase in size or scope as the result of strategic mergers or acquisitions. These transactions mayinclude consolidation activity among hardware manufacturers, software companies and vendors, and service providers, which could result in the convergenceof products and services. If buyers of products and services in the markets we serve favor using a single provider of integrated products and services, suchbuyers may direct more business to such providers, which could have a variety of negative effects on our competitive position and, in turn, adversely affectour business, results of operations and financial condition.
Our operating margin may decline and we may not be able to sustain our current level of profitability.
Our operating margin may decline if we experience declines in demand and pricing for our services, an increase in our operating costs, includingimposition of new non-income related taxes, or adverse fluctuations in foreign currency exchange rates. In addition, wages in India have historicallyincreased at a faster rate than in the United States, which has in the past and may in the future put pressure on our operating margins due to our offshoredelivery model. Additionally, the number and type of equity-based compensation awards and the assumptions used in valuing equity-based compensationawards may change resulting in increased stock-based compensation expense and lower margins.
16
Source: COGNIZANT TECHNOLOGY SOLUTIONS CORP, 10-K, February 25, 2016 Powered by Morningstar® Document Research℠The information contained herein may not be copied, adapted or distributed and is not warranted to be accurate, complete or timely. The user assumes all risks for any damages or losses arising from any use of this information,except to the extent such damages or losses cannot be limited or excluded by applicable law. Past financial performance is no guarantee of future results.
Table of Contents
Further, our operating margin, and therefore our profitability, is dependent on the rates we are able to recover for our services. If we are not able tomaintain favorable pricing for our services, our operating margin and our profitability could suffer. The rates we are able to recover for our services areaffected by a number of factors, including:
• our clients’ perceptions of our ability to add value through our services;• introduction of new services or products by us or our competitors;• our competitors’ pricing policies;• our ability to accurately estimate, attain and sustain contract revenues, margins and cash flows over increasingly longer contract periods;• bid practices of clients and their use of third-party advisors;• the use by our competitors and our clients of offshore resources to provide lower-cost service delivery capabilities;• our ability to charge premium prices when justified by market demand or the type of service; and• general economic and political conditions.
In addition, if we are not able to maintain an appropriate utilization rate for our professionals, our profitability may suffer. Our utilization rates areaffected by a number of factors, including:
• our ability to efficiently transition employees from completed projects to new assignments;• our ability to hire and assimilate new employees;• our ability to accurately forecast demand for our services and thereby maintain an appropriate headcount in each of our geographies and
workforces;• our ability to effectively manage attrition; and• our need to devote time and resources to training, professional development and other non-chargeable activities.
If we are unable to control our costs and operate our business in an efficient manner, our operating margin, and therefore our profitability, may decline.
We could be held liable for damages or our reputation could suffer from security breaches or disclosure of confidential information or personaldata.
We are dependent on information technology networks and systems to process, transmit and securely store electronic information and tocommunicate among our locations around the world and with our clients. Security breaches of this infrastructure could lead to shutdowns or disruptions ofour systems and potential unauthorized disclosure of confidential information or data, including personal data. In addition, many of our engagementsinvolve projects that are critical to the operations of our customers’ businesses. The theft and/or unauthorized use or publication of our, or our clients’,confidential information or other proprietary business information as a result of such an incident could adversely affect our competitive position and reducemarketplace acceptance of our services. Any failure in the networks or computer systems used by us or our customers could result in a claim for substantialdamages against us and significant reputational harm, regardless of our responsibility for the failure.
In addition, we often have access to or are required to manage, utilize, collect and store sensitive or confidential client or employee data, includingpersonal data. As a result, we are subject to numerous U.S. and non-U.S. laws and regulations designed to protect this information, such as the EuropeanUnion Directive on Data Protection and various U.S. federal and state laws governing the protection of personal data. If any person, including any of ouremployees, negligently disregards or intentionally breaches controls or procedures with which we are responsible for complying with respect to such data orotherwise mismanages or misappropriates that data, or if unauthorized access to or disclosure of data in our possession or control occurs, we could be subjectto liability and penalties in connection with any violation of applicable privacy laws and/or criminal prosecution, as well as significant liability to ourclients or our clients’ customers for breaching contractual confidentiality and security provisions or privacy laws. These risks will increase as we continue togrow our cloud-based offerings and services and store and process increasingly large amounts of our customers’ confidential information and data and host ormanage parts of our customers’ businesses, especially in industries involving particularly sensitive data such as the financial services industry and thehealthcare industry. Unauthorized disclosure of sensitive or confidential client or employee data, including personal data, whether through breach ofcomputer systems, systems failure, employee negligence, fraud or misappropriation, or otherwise, could damage our reputation and cause us to lose clients.Similarly, unauthorized access to or through our information systems and networks or those we develop or manage for our clients, whether by our employeesor third parties, could result in negative publicity, legal liability and damage to our reputation, which could in turn have a material adverse effect on ourbusiness, results of operations and financial condition.
17
Source: COGNIZANT TECHNOLOGY SOLUTIONS CORP, 10-K, February 25, 2016 Powered by Morningstar® Document Research℠The information contained herein may not be copied, adapted or distributed and is not warranted to be accurate, complete or timely. The user assumes all risks for any damages or losses arising from any use of this information,except to the extent such damages or losses cannot be limited or excluded by applicable law. Past financial performance is no guarantee of future results.
Table of Contents
Healthcare-related data protection, privacy and similar laws restrict access, use, and disclosure of information, and failure to comply with oradapt to changes in these laws could materially adversely affect our business, results of operations and financial condition.
As a service provider in the healthcare industry, we are subject to data privacy and security regulation by both the federal government and the states inwhich we conduct our business, including the Health Insurance Portability and Accountability Act of 1996, or HIPAA, and the Health InformationTechnology for Economic and Clinical Health Act, or HITECH, which are federal laws that apply to firms that provide services to certain entities in thehealthcare industry.
A portion of the data that we obtain and handle for or on behalf of our healthcare clients is subject to HIPAA, and we are required to maintain theprivacy and security of individually identifiable health information in accordance with HIPAA and the terms of our agreements with clients. HITECHincreased the civil and criminal penalties that may be imposed against us, and gave state attorneys general new authority to file civil actions for damages orinjunctions in federal court to enforce HIPAA’s requirements. We have incurred, and will continue to incur, significant costs to establish and maintainHIPAA-required safeguards and, if additional safeguards are required to comply with HIPAA or our healthcare clients' requirements, our costs could increasefurther, which would negatively affect our results of operations. Furthermore, if we fail to maintain adequate safeguards, or we inappropriately use or discloseindividually identifiable health information, we could be subject to significant liabilities and consequences, including, without limitation:
• breach of our contractual obligations to our healthcare clients, which may cause these clients to terminate their relationship with us and may resultin potentially significant financial obligations to them;
• investigation by the federal regulatory authorities empowered to enforce HIPAA and by the state attorneys general empowered to enforcecomparable state laws, and the possible imposition of civil and criminal penalties;
• private litigation by individuals adversely affected by any violation of HIPAA, HITECH or comparable state laws to which we are subject; and• negative publicity, which may decrease the willingness of current and potential future clients in the healthcare industry to work with us.
Laws and expectations relating to privacy, security and data protection continue to evolve, and we continue to adapt to changing needs. Nevertheless,changes in these laws may limit our data access, use, and disclosure, and may require increased expenditures by us or may dictate that we not offer certaintypes of services. Any of the foregoing may have a material adverse effect on our ability to provide services to our healthcare clients and, in turn, on ourbusiness, results of operations and financial condition.
Our revenues and operating results may experience significant quarterly fluctuations.
We may experience significant quarterly fluctuations in our revenues and results of operations. Among the factors that could cause these variationsare:
• the nature, number, timing, scope and contractual terms of the projects in which we are engaged;• delays incurred in the performance of those projects;• the accuracy of estimates of resources and time required to complete ongoing projects;• changes to the financial condition of our clients;• changes in pricing in response to customer demand and competitive pressures;• longer sales cycles and ramp-up periods for our larger, more complex projects;• volatility and seasonality of our software sales;• the mix of on-site and offshore staffing;• the ratio of fixed-price contracts versus time-and-materials contracts;• employee wage levels and utilization rates;• changes in foreign exchange rates, including the Indian rupee versus the U.S. dollar;• the timing of collection of accounts receivable;• enactment of new taxes;• changes in domestic and international income tax rates and regulations;• changes to levels and types of stock-based compensation awards and assumptions used to determine the fair value of such awards; and• general economic conditions.
18
Source: COGNIZANT TECHNOLOGY SOLUTIONS CORP, 10-K, February 25, 2016 Powered by Morningstar® Document Research℠The information contained herein may not be copied, adapted or distributed and is not warranted to be accurate, complete or timely. The user assumes all risks for any damages or losses arising from any use of this information,except to the extent such damages or losses cannot be limited or excluded by applicable law. Past financial performance is no guarantee of future results.
Table of Contents
As a result of these factors, it is possible that in some future periods, our revenues and results of operations may be significantly below the expectationsof public market analysts and investors. In such an event, the price of our common stock would likely be materially and adversely affected.
We rely on a few customers for a large portion of our revenues.
Our top five and top ten customers generated approximately 11.0% and 18.6%, respectively, of our revenues for the year ended December 31, 2015.The volume of work performed for specific customers is likely to vary from year to year, and a major customer in one year may not use our services in asubsequent year. The loss of one of our large customers could have a material adverse effect on our business, results of operations and financial condition.
Our business, results of operations and financial condition will suffer if we fail to enhance our existing services and solutions and develop newservices and solutions that allow us to keep pace with rapidly evolving technological developments.
The information technology, consulting and business process services markets are characterized by rapid technological change, evolving industrystandards, changing customer preferences and new product and service introductions. Our future success will depend on our ability to develop services andsolutions that keep pace with changes in the markets in which we operate. We cannot be sure that we will be successful in developing new services andsolutions addressing evolving technologies in a timely or cost-effective manner or that any services and solutions we do develop will be successful in themarketplace. Our failure to address the demands of the rapidly evolving technological environment could have a material adverse effect on our ability toretain and attract clients and our competitive position, which could in turn have a material adverse effect on our business, results of operations and financialcondition.
Our business, results of operations and financial condition may be affected by the rate of growth in the use of technology in business and the typeand level of technology spending by our clients.
Our business depends, in part, upon continued growth in the use of technology in business by our clients and prospective clients as well as theircustomers and suppliers. In challenging economic environments, our clients may reduce or defer their spending on new technologies in order to focus onother priorities, or may choose to use their own internal resources rather than engage an outside firm to perform the types of services and solutions weprovide. In addition, many companies have already invested substantial resources in their current means of conducting commerce and exchanginginformation, and they may be reluctant or slow to adopt new approaches that could disrupt existing personnel, processes and infrastructures. If the growth oftechnology usage in business, or our clients’ spending on technology in business, declines, or if we cannot convince our clients or potential clients toembrace new technological solutions, our business, results of operations and financial condition could be adversely affected.
Most of our contracts with our customers are short-term, and our business, results of operations and financial condition could be adverselyaffected if our clients terminate their contracts on short notice.
Consistent with industry practice, most of our contracts with our customers are short-term. A majority of our contracts can be terminated by our clientswith short notice and without significant early termination cost. Terminations may result from factors that are beyond our control and unrelated to our workproduct or the progress of the project, including the business or financial condition of a client, changes in ownership, management or the strategy of a clientor economic or market conditions generally or specific to a client’s industry. When contracts are terminated, we lose the anticipated revenues and might notbe able to eliminate our associated costs in a timely manner. Consequently, our operating margins in subsequent periods could be lower than expected. If weare unable to replace the lost revenue with other work on terms we find acceptable or effectively eliminate costs, our business, results of operations andfinancial condition could be adversely affected.
If our pricing structures are based on inaccurate expectations and assumptions regarding the cost and complexity of performing our work, thenour contracts could be unprofitable.
We negotiate pricing terms with our clients utilizing a range of pricing structures and conditions. We predominantly contract to provide services eitheron a time-and-materials basis or on a fixed-price basis. Fixed-price contracts accounted for approximately 36.5% of our revenues for the year endedDecember 31, 2015, and we expect that an increasing number of our future projects will be contracted on a fixed-price basis. Our pricing is highly dependenton our internal forecasts and predictions about our projects and the marketplace, which might be based on limited data and could turn out to be inaccurate.We face a number of risks when pricing our contracts, as many of our projects entail the coordination of operations and workforces in multiple locations andutilizing workforces with different skill sets and competencies across geographically diverse service locations. Our pricing, cost and operating marginestimates for the work that we perform frequently include anticipated long-term cost savings from transformational and other initiatives that we expect toachieve and sustain over the life
19
Source: COGNIZANT TECHNOLOGY SOLUTIONS CORP, 10-K, February 25, 2016 Powered by Morningstar® Document Research℠The information contained herein may not be copied, adapted or distributed and is not warranted to be accurate, complete or timely. The user assumes all risks for any damages or losses arising from any use of this information,except to the extent such damages or losses cannot be limited or excluded by applicable law. Past financial performance is no guarantee of future results.
Table of Contents
of the contract. There is a risk that we will underprice our projects, fail to accurately estimate the costs of performing the work or fail to accurately assess therisks associated with potential contracts. In particular, any increased or unexpected costs, delays, failures to achieve anticipated cost savings, or unexpectedrisks we encounter in connection with the performance of this work, including those caused by factors outside our control, could make these contracts lessprofitable or unprofitable, which could have an adverse effect on our business, results of operations and financial condition.
If we fail to maintain appropriate internal controls in the future, we may not be able to report our financial results accurately, which mayadversely affect our stock price and our business.
Section 404 of the Sarbanes-Oxley Act of 2002 and the related regulations require our management to report on, and our independent registered publicaccounting firm to attest to, the effectiveness of our internal control over financial reporting. We have committed and will be required to continue to commitsignificant financial and managerial resources in order to comply with these requirements.
Further, we are required to integrate any acquired businesses into our system of disclosure controls and procedures and internal control over financialreporting. Companies we acquire may not be required to implement or maintain the disclosure controls and procedures or internal control over financialreporting that are required of public companies, prior to being acquired by us and we cannot provide assurance as to how long the integration process maytake.
Internal control over financial reporting has inherent limitations, including human error, the possibility that controls could be circumvented orbecome inadequate because of changed conditions, and fraud. If we are unable to maintain effective internal controls, we may not have adequate, accurate ortimely financial information, and we may be unable to meet our reporting obligations as a publicly traded company or comply with the requirements of theSEC or the Sarbanes-Oxley Act of 2002. This could result in a restatement of our financial statements, the imposition of sanctions, or investigation byregulatory authorities, and could cause investors to lose confidence in our reported financial information. Any such consequence or other negative effect ofour inability to meet our reporting requirements or comply with legal and regulatory requirements, as well as any disclosure of an accounting, reporting orcontrol issue, could adversely affect the trading price of our common stock and our business.
We may not be able to successfully acquire target companies or integrate acquired companies or technologies into our company, and we maybecome subject to certain liabilities assumed or incurred in connection with our acquisitions that could harm our business, results of operations andfinancial condition.
If we are unable to complete the number and kind of acquisitions for which we plan, or if we are inefficient or unsuccessful at integrating any acquiredbusinesses, including TriZetto, into our operations, we may not be able to achieve our planned rates of growth or improve our market share, profitability orcompetitive position in specific markets or services. The process of integrating an acquired company, business, or technology has created, and will continueto create, operating difficulties. The risks we face include:
• Diversion of management time and focus from operating our core business to acquisition integration challenges;• Failure to successfully integrate the acquired business into our operations, including cultural challenges associated with integrating and retaining
employees; and• Failure to achieve anticipated efficiencies and/or benefits, realize our strategic objectives or further develop the acquired business.
Although we conduct due diligence in connection with each of our acquisitions, there may be liabilities that we fail to discover, that we inadequatelyassess or that are not properly disclosed to us. In particular, to the extent that any acquired business (or any assets thereof) (i) failed to comply with orotherwise violated applicable laws or regulations, (ii) failed to fulfill contractual obligations to customers or (iii) incurred material liabilities or obligations tocustomers that are not identified during the diligence process, we, as the successor owner, may be financially responsible for these violations, failures andliabilities and may suffer financial and/or reputational harm or otherwise be adversely affected. In addition, as part of an acquisition, we may assumeresponsibilities and obligations of the acquired business pursuant to the terms and conditions of agreements entered by the acquired entity that are notconsistent with the terms and conditions that we typically accept and require. We also have been and may in the future be subject to litigation or other claimsin connection with an acquired company, including claims from terminated employees, customers, former stockholders, or other third parties. Any materialliabilities associated with our acquisitions could harm our business, results of operations and financial condition.
We cannot predict or guarantee that we will successfully identify suitable acquisition candidates, consummate any acquisition or integrate anyacquired business. Any failure to do so could have an adverse impact on our business, results of operations and financial condition.
20
Source: COGNIZANT TECHNOLOGY SOLUTIONS CORP, 10-K, February 25, 2016 Powered by Morningstar® Document Research℠The information contained herein may not be copied, adapted or distributed and is not warranted to be accurate, complete or timely. The user assumes all risks for any damages or losses arising from any use of this information,except to the extent such damages or losses cannot be limited or excluded by applicable law. Past financial performance is no guarantee of future results.
Table of Contents
System failures, system outages or operational disruptions in our communications or information technology systems and infrastructure couldnegatively impact our operations and ability to provide our services and solutions, which would have an adverse effect on our business, results ofoperations and financial condition.
To deliver our services and solutions to our customers, we must maintain a high speed network of satellite, fiber optic and land lines and active voiceand data communications 24 hours a day between our main operating offices in India, our other development and delivery centers and the offices of ourcustomers worldwide. Any systems failure or outage or a significant disruption in our ability to transmit voice and data through satellite and telephonecommunications or in our information technology systems and infrastructure could result in curtailed operations and a loss of customers, which would havean adverse effect on our business, results of operations and financial condition.
Our business, results of operations and financial condition could be impaired if we lose key members of our management team.
Our future performance depends upon the continued service of the key members of our management team. Competition for experienced executiveofficers and other key employees in the industries in which we compete is intense, and there can be no assurance that we will be able to retain key persons, orthat we will be successful in attracting and retaining replacements in the future. The loss of any one or more of our executive officers or significantemployees, or the failure to attract, integrate and retain additional talent, could have a material adverse effect on our business, results of operations andfinancial condition. We do not maintain key man life insurance on any of our executive officers or significant employees.
In addition, our business could be harmed if any key member of our management team leaves our employment and joins one of our competitors.Currently we have entered into non-competition agreements with the majority of our executive officers. We cannot be certain, however, that the restrictionsin these agreements prohibiting such executive officers from engaging in competitive activities are enforceable. Any defection by a key member of ourmanagement team could have a material adverse effect on our business, results of operations and financial condition.
Competition for highly-skilled technical personnel is intense, and our ability to compete for and manage client engagements depends on ourability to attract and retain such personnel.
Our ability to maintain and renew existing client engagements and obtain new business depends to a significant extent on our ability to attract, trainand retain highly-skilled technical personnel so as to keep our supply of skills and resources in balance with client demand. In particular, in order to serveclient needs and grow our business, we must attract, train and retain appropriate numbers of talented people, including project managers, IT engineers andother senior technical personnel, who are able to keep pace with continuing changes in information technology, evolving industry standards and changingcustomer preferences. We cannot guarantee that we will be able to train and assimilate new employees successfully. In addition, we believe there is a shortageof, and significant competition for, professionals with the advanced technological skills necessary to perform the services we offer. We have subcontracted inthe past, and may continue to subcontract in the future, with other service providers in order to meet our obligations to our customers. If we are unable toattract and retain highly-skilled technical personnel, our ability to effectively lead our current projects and develop new business could be jeopardized, andour business, results of operations and financial condition could be adversely affected.
Our business could be negatively affected if we incur legal liability in connection with providing our services and solutions.
If we fail to meet our contractual obligations or otherwise breach obligations to our clients, we could be subject to legal liability. We may enter intonon-standard agreements because we perceive an important financial opportunity by doing so or because our personnel did not adequately adhere to ourguidelines. In addition, the contracting practices of our competitors may cause contract terms and conditions that are unfavorable to us to become standard inthe marketplace. If we cannot, or do not, meet our contractual obligations to provide services and solutions, and if our exposure is not adequately limitedthrough the enforceable terms of our agreements, we might face significant legal liability and our business, results of operations and financial conditioncould be adversely affected.
In the normal course of business and in conjunction with certain client engagements, we have entered into contractual arrangements through which wemay be obligated to indemnify clients or other parties with whom we conduct business with respect to certain matters. These arrangements can includeprovisions whereby we agree to hold the indemnified party and certain of their affiliated entities harmless with respect to third-party claims, including matterssuch as our breach of certain representations or covenants, our infringement of the intellectual property of others or our gross negligence or willfulmisconduct. Payments by us under any of these arrangements are generally conditioned on the client making a claim and providing us with full control overthe defense and settlement of such claim. It is not possible to determine our maximum potential exposure under these indemnification agreements due to theunique facts and circumstances involved in each
21
Source: COGNIZANT TECHNOLOGY SOLUTIONS CORP, 10-K, February 25, 2016 Powered by Morningstar® Document Research℠The information contained herein may not be copied, adapted or distributed and is not warranted to be accurate, complete or timely. The user assumes all risks for any damages or losses arising from any use of this information,except to the extent such damages or losses cannot be limited or excluded by applicable law. Past financial performance is no guarantee of future results.
Table of Contents
particular agreement. If events arise requiring us to make payment for indemnification claims under our contractual indemnification obligations, suchpayments could have a material impact on our business, results of operations and financial condition.
Additionally, our clients may perform audits or require us to perform audits and provide audit reports with respect to the controls and procedures thatwe use in the performance of services for such clients, especially when we process data belonging to them. Our ability to acquire new clients and retainexisting clients may be adversely affected and our reputation could be harmed if we receive a qualified opinion, or if we cannot obtain an unqualifiedopinion, with respect to our controls and procedures in connection with any such audit in a timely manner. We could also incur liability if our controls andprocedures, or the controls and procedures we manage for a client, were to result in an internal control failure or impair our client’s ability to comply with itsown internal control requirements.
We may face difficulties in providing end-to-end business solutions or delivering complex and large projects for our clients that could causeclients to discontinue their work with us, which in turn could harm our business, results of operations and financial condition.
We have been expanding the nature and scope of our engagements and have added new service offerings, such as consulting, business processservices, systems integration and outsourcing of entire portions of IT infrastructure across the industries we serve. The success of these service offeringsdepends, in part, upon continued demand for such services by our existing and prospective clients and our ability to meet this demand in a cost-competitiveand effective manner. To obtain engagements for such end-to-end solutions, we also are more likely to compete with large, well-established internationalconsulting firms, resulting in increased competition and pricing pressure. Accordingly, we cannot be certain that our new service offerings will effectivelymeet client needs or that we will be able to attract existing and prospective clients to these service offerings.
The increased breadth of our service offerings has resulted and may continue to result in larger and more complex projects with our clients. Thisrequires us to establish closer relationships with our clients and achieve a thorough understanding of their operations. Our ability to establish suchrelationships depends on a number of factors, including the proficiency of our professionals and our management personnel. Our failure to understand ourclient requirements or our failure to deliver services that meet the requirements specified by our clients could result in termination of client contracts, and wecould be liable to our clients for significant penalties or damages, which could have a material adverse effect on our business, results of operations andfinancial condition.
Larger projects often involve multiple engagements or stages, and there is a risk that a client may choose not to retain us for additional stages or maycancel or delay additional planned engagements. These terminations, cancellations or delays may result from factors that have little or nothing to do with thequality of our services, such as the business or financial condition of our clients or the economy generally. Such cancellations or delays make it difficult toplan for project resource requirements and inaccuracies in such resource planning and allocation may have a negative impact on our business, results ofoperations and financial condition.
If we are unable to collect our receivables from, or bill our unbilled services to, our clients, our business, results of operations and financialcondition could be adversely affected.
Our business depends on our ability to successfully obtain payment from our clients of the amounts they owe us for work performed. We evaluate thefinancial condition of our clients and usually bill and collect on relatively short cycles. We maintain allowances against receivables and unbilled services.Actual losses on client balances could differ from those that we currently anticipate and, as a result, we might need to adjust our allowances. There is noguarantee that we will accurately assess the creditworthiness of our clients. Macroeconomic conditions could also result in financial difficulties for ourclients, including limited access to the credit markets, insolvency or bankruptcy, and, as a result, could cause clients to delay payments to us, requestmodifications to their payment arrangements that could increase our receivables balance, or default on their payment obligations to us. Timely collection ofclient balances also depends on our ability to complete our contractual commitments and bill and collect our contracted revenues. If we are unable to meetour contractual requirements, we might experience delays in collection of and/or be unable to collect our client balances, and if this occurs, our results ofoperations and cash flows could be adversely affected. In addition, if we experience an increase in the time to bill and collect for our services, our cash flowscould be adversely affected.
If our clients are not satisfied with our services and solutions or if our reputation in the marketplace is damaged, our business, results ofoperations and financial condition could be adversely affected.
Our business model depends in large part on our ability to attract additional work from our base of existing clients. Our business model also dependson our account teams’ ability to develop relationships with our clients that enable us to understand
22
Source: COGNIZANT TECHNOLOGY SOLUTIONS CORP, 10-K, February 25, 2016 Powered by Morningstar® Document Research℠The information contained herein may not be copied, adapted or distributed and is not warranted to be accurate, complete or timely. The user assumes all risks for any damages or losses arising from any use of this information,except to the extent such damages or losses cannot be limited or excluded by applicable law. Past financial performance is no guarantee of future results.
Table of Contents
our clients’ needs and deliver services and solutions that are tailored to those needs. If a client is not satisfied with the quality of work performed by us, orwith the type of services or solutions delivered, then we could incur additional costs to address the situation, the profitability of that work might be impaired,and the client’s dissatisfaction with our services could damage our ability to obtain additional work from that client. In particular, clients that are not satisfiedmight seek to terminate existing contracts prior to their scheduled expiration date and could direct future business to our competitors.
In addition, negative publicity related to our client services or relationships, regardless of its accuracy, could adversely affect our business byinhibiting our ability to compete for new contracts with current and prospective clients. Our corporate reputation is potentially susceptible to damage due toactions or statements made by current or former clients that are dissatisfied with our services or work product, as well as competitors, vendors, adversaries inlegal proceedings, government regulators, former and current employees, members of the investment community and the media. Damage to our reputationcould be difficult and time-consuming to repair, make potential or existing clients reluctant to select us for new engagements and, in turn, result in a loss ofbusiness, adversely affect our recruitment and retention efforts, reduce the value and effectiveness of the Cognizant brand name and reduce investorconfidence in us, any one of which could adversely affecting our business, results of operations and financial condition.
We rely on third parties for certain software products.
Certain of our software products contain components that are developed by third parties. In addition, we resell certain software products of third partiesand we use third-party software products to deliver our services and solutions. We may not be able to replace the functions provided by these third-partysoftware components or products if they become obsolete, defective, or incompatible with future versions of our products or with our services and solutions,or if they are not adequately maintained or updated. Any defects in or significant interruption in the availability of these third-party software products orcomponents could harm the sale of our products and our delivery of services and solutions to our clients unless and until we can secure or develop analternative source. In addition, third-party suppliers of software or other intellectual property assets could be unwilling to permit us to use their intellectualproperty and this could impede or disrupt use of their products or services by us and our clients. If our ability to provide services and solutions to our clientsis impaired as a result of any such denial, our business, results of operations and financial condition could be adversely affected.
Alternate sources for the technology currently licensed to us may not be available to us in a timely manner, may not provide us with the samefunctions as currently provided to us or may be more expensive than products we currently use. Further, our success depends on our ability to maintain ourexisting relationships with third-party software providers and build new relationships with other providers in order to enhance our services and remaincompetitive. If we are unable to maintain such existing relationships or successfully build new relationships, our business, results of operations, and financialcondition could suffer.
We are exposed to credit risk and fluctuations in the market values of our investment portfolio.
Any deterioration of the credit and capital markets in the United States, Europe or other regions of the world could result in volatility of ourinvestment earnings and impairments to our investment portfolio, which could negatively impact our financial condition and reported income. Any declinein economic activity could adversely affect the ability of counterparties to use certain financial instruments such as marketable securities and derivatives tomeet their obligations to us.
Our revenues are highly dependent on clients concentrated in certain industries, including the financial services and healthcare industries.Consolidation and factors that negatively affect these industries may adversely affect our business, results of operations and financial condition.
During the year ended December 31, 2015, we earned approximately 40.3% of our revenues from the financial services industry, which includesinsurance, and 29.5% from the healthcare industry. Significant consolidation or a decrease in growth in the financial services industry or the healthcareindustry may reduce the demand for our services and negatively affect our business, financial condition and results of operations. For example, two or more ofour current clients may merge or consolidate and combine their operations, which may cause us to lose work or lose the opportunity to gain additional work.The increased market power of larger companies may also increase pricing and competitive pressures on us. Any of these possible results of industryconsolidation could adversely affect our business, financial condition and results of operations. In addition, if we are unable to successfully anticipatechanging regulatory, economic and political conditions affecting the industries in which we operate, we may be unable to effectively plan for or respond tothose changes, and our business, results of operations and financial condition could be negatively affected.
23
Source: COGNIZANT TECHNOLOGY SOLUTIONS CORP, 10-K, February 25, 2016 Powered by Morningstar® Document Research℠The information contained herein may not be copied, adapted or distributed and is not warranted to be accurate, complete or timely. The user assumes all risks for any damages or losses arising from any use of this information,except to the extent such damages or losses cannot be limited or excluded by applicable law. Past financial performance is no guarantee of future results.
Table of Contents
Our revenues are highly dependent on clients located in the United States and Europe. Any weakening of economic conditions in these marketsmay adversely affect our business, results of operations and financial condition.
Approximately 78.6% of our revenues during the year ended December 31, 2015 were derived from clients located in North America. In the sameperiod, approximately 16.2% of our revenues were derived from clients located in Europe. Any weakening of economic conditions in the United States orEuropean economies could depress the pricing for our services and cause our customers to reduce or postpone their technology spending significantly, whichmay in turn lower the demand for our services and negatively affect our business, results of operations and financial condition.
If we do not continue to improve our operational, financial and other internal controls and systems to manage our rapid growth and size, ourbusiness, results of operations and financial condition could be adversely affected.
Our recent and anticipated growth, including our acquisition of TriZetto, will continue to place significant demands on our management and otherresources, and will require us to continue to develop and improve our operational, financial and other internal controls. In particular, our growth will increasethe challenges involved in:
• recruiting, training and retaining technical, finance, marketing and management personnel with the knowledge, skills and experience that ourbusiness model requires;
• maintaining high levels of client satisfaction;• developing and improving our internal administrative infrastructure, particularly our financial, operational, communications and other internal
systems;• preserving our culture, values and entrepreneurial environment; and• effectively managing our personnel and operations and effectively communicating to our personnel worldwide our core values, strategies and
goals.
In addition, the increasing size and scope of our operations increase the possibility that a member of our personnel will engage in unlawful or fraudulentactivity, breach our contractual obligations, or otherwise expose us to unacceptable business risks, despite our efforts to train our people and maintaininternal controls to prevent such instances. If we do not continue to develop and implement the right processes and tools to manage our enterprise, ourbusiness, results of operations and financial condition could be adversely affected.
There can be no assurance that our business, results of operations and financial condition will not be adversely affected by our incurrence ofindebtedness.
On November 20, 2014, in conjunction with our acquisition of TriZetto, we entered into a credit agreement with a bank syndicate providing for a $1.0billion unsecured term loan and a $750.0 million unsecured revolving credit facility, both of which mature on November 20, 2019. We may incur additionalindebtedness in the future, which may be significant. We will be required to have sufficient cash available in the United States to pay scheduled installmentsof principal, accrued interest and fees from time to time and at maturity. If we do not have sufficient cash available in the United States, we may be required torepatriate earnings held by our foreign subsidiaries. Any such repatriation would cause us to accrue the applicable amount of taxes associated with suchearnings at that time, which could have a material adverse effect on our results of operations. In addition, we may not have sufficient cash in the United Statesor abroad to make payments on our debt obligations, which could cause us to seek additional debt or equity capital or restructure or refinance our existingindebtedness. We may not be able to effect any such alternative measures, if necessary, on commercially reasonable terms or at all and, even if successful,those alternative actions may not allow us to meet our scheduled debt service obligations.
In addition, the credit agreement contains certain covenants including a requirement that we maintain a debt to total stockholders' equity ratio not inexcess of 0.40 to 1.00 as of the last day of any fiscal quarter. Failure to comply with this covenant or other provisions of the credit agreement could result in adefault under the credit agreement, requiring us to either cure such default, receive a waiver, or in the absence of such cure or waiver, refinance anyoutstanding indebtedness under the credit agreement. There is no assurance that we would be able to refinance our debt on acceptable terms and conditions.
Risks Relating to our International Operations
Our global operations are subject to complex risks, some of which might be beyond our control.
We have offices and operations in various countries around the world and provide services to clients globally. In 2015, approximately 78.6% of ourrevenues were attributable to the North American region, 16.2% were attributable to the European region, and the remainder was attributable to the rest of theworld, primarily the Asia Pacific region. We anticipate that revenues from customers outside North America will continue to account for a material portion ofour revenues in the
24
Source: COGNIZANT TECHNOLOGY SOLUTIONS CORP, 10-K, February 25, 2016 Powered by Morningstar® Document Research℠The information contained herein may not be copied, adapted or distributed and is not warranted to be accurate, complete or timely. The user assumes all risks for any damages or losses arising from any use of this information,except to the extent such damages or losses cannot be limited or excluded by applicable law. Past financial performance is no guarantee of future results.
Table of Contents
foreseeable future and may increase as we expand our international presence, particularly in Europe, the Asia Pacific region and the Latin America region.
In addition, the majority of our employees, along with our development and delivery centers, are located in India. As a result, we may be subject torisks inherently associated with international operations, including risks associated with foreign currency exchange rate fluctuations, difficulties in enforcingintellectual property and/or contractual rights, the burdens of complying with a wide variety of foreign laws and regulations, potentially adverse taxconsequences, tariffs, quotas and other barriers, potential difficulties in collecting accounts receivable, international hostilities, terrorism and naturaldisasters. We may also face difficulties integrating new facilities in different countries into our existing operations, as well as integrating employees that wehire in different countries into our existing corporate culture. If we are unable to manage the risks of our global operations, our business, results of operationsand financial condition could be adversely affected.
A substantial portion of our assets and operations are located in India and we are subject to regulatory, economic, political and otheruncertainties in India.
We intend to continue to develop and expand our offshore facilities in India where a majority of our technical professionals are located. While wagecosts are lower in India than in the United States and other developed countries for comparably skilled professionals, wages in India have historicallyincreased at a faster rate than in the United States and other countries in which we operate. If this trend continues in the future, it would result in increasedcosts for our skilled professionals and thereby potentially reduce our operating margins. Also, there is no assurance that, in future periods, competition forskilled professionals will not drive salaries higher in India, thereby resulting in increased costs for our technical professionals and reduced operating margins.
India has also recently experienced civil unrest and terrorism and has been involved in conflicts with neighboring countries. In recent years, there havebeen military confrontations between India and Pakistan that have occurred in the region of Kashmir and along the India-Pakistan border. The potential forhostilities between the two countries has been high in light of tensions related to recent terrorist incidents in India and the unsettled nature of the regionalgeopolitical environment, including events in and related to Afghanistan, Iraq and Syria. If India becomes engaged in armed hostilities, particularly if thesehostilities are protracted or involve the threat of or use of weapons of mass destruction, it is likely that our business, results of operations and financialcondition would be materially adversely affected.
In the past, the Indian economy has experienced many of the problems that commonly confront the economies of developing countries, including highinflation, erratic gross domestic product growth and shortages of foreign exchange. The Indian government has exercised, and continues to exercise,significant influence over many aspects of the Indian economy and Indian government actions concerning the economy could have a material adverse effecton private sector entities like us. In the past, the Indian government has provided significant tax incentives and relaxed certain regulatory restrictions in orderto encourage foreign investment in specified sectors of the economy, including the software development services industry. Changes in governmentleadership in India or a change in policies of the existing government in India that results in the elimination of any of the benefits realized by us from ourIndian operations or the imposition of new taxes applicable to such operations could have a material adverse effect on our business, results of operations andfinancial condition.
Our operating results may be adversely affected by fluctuations in the Indian rupee and other foreign currency exchange rates, restrictions on thedeployment of cash across our global operations and our use of derivative financial instruments.
Although we report our operating results in U.S. dollars, a portion of our revenues and expenses are denominated in currencies other than the U.S.dollar. Fluctuations in foreign currency exchange rates can have a number of adverse effects on us. Because our consolidated financial statements arepresented in U.S. dollars, we must translate revenues, expenses and income, as well as assets and liabilities, into U.S. dollars at exchange rates in effect duringor at the end of each reporting period. Therefore, changes in the value of the U.S. dollar against other currencies will affect our revenues, income fromoperations, net income and the value of balance sheet items originally denominated in other currencies. There is no guarantee that our financial results willnot be adversely affected by currency exchange rate fluctuations. In addition, in some countries we could be subject to strict restrictions on the movement ofcash and the exchange of foreign currencies, which could limit our ability to use these funds across our global operations. Further, as we continue to leverageour global delivery model, more of our expenses are incurred in currencies other than those in which we bill for the related services. An increase in the valueof certain currencies, such as the Indian rupee, against the U.S. dollar could increase costs for delivery of services at offshore sites by increasing labor andother costs that are denominated in local currency.
We have entered into a series of foreign exchange forward contracts that are designated as cash flow hedges of certain rupee denominated payments inIndia. These contracts are intended to partially offset the impact of the movement of the exchange rates on future operating costs. In addition, we have alsoentered into foreign exchange forward contracts in order to
25
Source: COGNIZANT TECHNOLOGY SOLUTIONS CORP, 10-K, February 25, 2016 Powered by Morningstar® Document Research℠The information contained herein may not be copied, adapted or distributed and is not warranted to be accurate, complete or timely. The user assumes all risks for any damages or losses arising from any use of this information,except to the extent such damages or losses cannot be limited or excluded by applicable law. Past financial performance is no guarantee of future results.
Table of Contents
mitigate foreign currency risk on foreign currency denominated net monetary assets. The hedging strategies that we have implemented, or may in the futureimplement, to mitigate foreign currency exchange rate risks may not reduce or completely offset our exposure to foreign exchange rate fluctuations and mayexpose our business to unexpected market, operational and counterparty credit risks. Accordingly, we may incur losses from our use of derivative financialinstruments that could have a material adverse effect on our business, results of operations and financial condition.
Our global operations expose us to numerous and sometimes conflicting legal and regulatory requirements, and violations of these regulationscould harm our business, results of operations and financial condition.
Because we provide services to clients throughout the world, we are subject to numerous, and sometimes conflicting, legal rules on matters as diverseas import/export controls, content requirements, trade restrictions, tariffs, taxation, sanctions, government affairs, internal and disclosure control obligations,data privacy and labor relations. Violations of these laws or regulations in the conduct of our business could result in fines, criminal sanctions against us orour officers, prohibitions on doing business, damage to our reputation and other unintended consequences such as liability for monetary damages, finesand/or criminal prosecution, unfavorable publicity, restrictions on our ability to process information and allegations by our clients that we have notperformed our contractual obligations. Due to the varying degrees of development of the legal systems of the countries in which we operate, local laws mightbe insufficient to protect our rights. Our failure to comply with applicable legal and regulatory requirements could have a material adverse effect on ourbusiness, results of operations and financial condition.
Among other anti-corruption laws and regulations, we are subject to the United States Foreign Corrupt Practices Act, or FCPA, which prohibitsimproper payments or offers of improper payments to foreign officials to obtain business or any other benefit, and the U.K. Bribery Act. Violations of theselaws or regulations could subject us to criminal or civil enforcement actions, including fines and suspension or disqualification from government contractingor contracting with private entities in certain highly regulated industries, any of which could have a material adverse effect on our business, results ofoperations and financial condition.
International hostilities, terrorist activities, other violence or war, natural disasters, pandemics and infrastructure disruptions, could delay orreduce the number of new service orders we receive and impair our ability to service our customers, thereby adversely affecting our business, results ofoperations and financial condition.
Hostilities involving acts of terrorism, violence or war, natural disasters, global health risks or pandemics or the threat or perceived potential for theseevents could materially adversely affect our operations and our ability to provide services to our customers. Such events may cause customers to delay theirdecisions on spending for information technology, consulting, and business process services and give rise to sudden significant changes in regional andglobal economic conditions and cycles. These events also pose significant risks to our personnel and to our and our clients’ physical facilities and operationsaround the world. Additionally, by disrupting communications and travel, giving rise to travel restrictions, and increasing the difficulty of obtaining andretaining highly-skilled and qualified personnel, these events could make it difficult or impossible for us to deliver services to some or all of our clients. Themajority of our employees are located in India, and the vast majority of our technical professionals in the United States and Europe are Indian nationals whoare able to work in the United States and Europe only because they hold current visas and work permits. Any inability to travel could cause us to incuradditional unexpected costs and expenses or could impair our ability to retain the skilled professionals we need for our operations. In addition, any extendeddisruptions of electricity, other public utilities or network services at our facilities could also adversely affect our ability to serve our clients.
Hostilities involving the United States, the United Kingdom, India and other countries in which we provide services to our clients, and other acts ofterrorism, violence or war, natural disasters, global health risks or pandemics may reduce the demand for our services and negatively affect our revenues. If wefail to defend against any of these occurrences, we might be unable to protect our people, facilities and systems. If these disruptions prevent us fromeffectively serving our clients, our business, results of operations and financial condition could be adversely affected.
Risks Relating to Taxes
Our earnings and financial condition may be negatively impacted by certain tax related matters.
We are subject to income taxes in the United States and numerous foreign jurisdictions. Our provision for income taxes and cash tax liability could beadversely affected by numerous factors including, but not limited to, income before taxes being lower than anticipated in countries with lower statutory taxrates and higher than anticipated in countries with higher statutory tax rates, changes in the valuation of deferred tax assets and liabilities, and changes in taxlaws, regulations, accounting principles or interpretations thereof, which could adversely impact our results of operations and financial condition in futureperiods. In addition, our income tax returns are subject to examination in the jurisdictions in which we operate. We regularly assess the likelihood of adverseoutcomes resulting from these examinations to determine the adequacy of our provision for
26
Source: COGNIZANT TECHNOLOGY SOLUTIONS CORP, 10-K, February 25, 2016 Powered by Morningstar® Document Research℠The information contained herein may not be copied, adapted or distributed and is not warranted to be accurate, complete or timely. The user assumes all risks for any damages or losses arising from any use of this information,except to the extent such damages or losses cannot be limited or excluded by applicable law. Past financial performance is no guarantee of future results.
Table of Contents
income taxes. An unfavorable outcome of one or more of these examinations may have an adverse effect on our business, results of operations and financialcondition.
Our earnings may be adversely affected if we change our intent not to repatriate foreign earnings or if such earnings become subject to U.S. taxon a current basis.
We earn a significant amount of our earnings outside of the United States. Other than amounts for which we have already accrued U.S. taxes, weconsider foreign earnings to be indefinitely reinvested outside of the United States. While we have no plans to do so, events may occur that could effectivelyforce us to change our intent not to repatriate such earnings. If such earnings are repatriated in the future or are no longer deemed to be indefinitely reinvestedoutside of the United States, or if legislation is enacted in the United States providing for a tax on foreign earnings or profits prior to their repatriation, wemay have to accrue taxes associated with such earnings or profits at a substantially higher rate, which could have a material adverse effect on our business,results of operations and financial condition.
Our earnings may be negatively impacted by the loss of certain tax benefits provided by India to companies in our industry as well as by possiblechanges in Indian tax laws.
Our Indian subsidiaries, collectively referred to as Cognizant India, are primarily export-oriented and are eligible for certain income tax holidaybenefits granted by the Indian government for export activities conducted within Special Economic Zones, or SEZs, for periods of up to 15 years. Recently,the Indian government announced a proposal which includes, among other items, phasing out of certain tax exemptions and deductions, discontinuation oftax holiday for new SEZs commencing activity from April 1, 2017, and a phased reduction of the current Indian corporate income tax rate. If enacted, thesechanges or any changes that would reduce or deny SEZ tax benefits could have a material adverse effect on our business, results of operations and financialcondition. In addition, all Indian profits, including those generated within SEZs, are subject to the Minimum Alternative Tax, or MAT, at the rate of 21.3%.Any MAT paid is creditable against future corporate income tax, subject to limitations. Currently, we anticipate utilizing our existing MAT balances againstfuture corporate income tax. Our ability to fully do so may be influenced by possible changes to the Indian tax laws as well as the future financial results ofCognizant India. Our potential inability to fully utilize our deferred income tax assets related to the MAT could have a material adverse effect on ourbusiness, results of operations and financial condition.
Risks Relating to Intellectual Property
We may not be able to enforce or protect our intellectual property rights, which may harm our ability to compete and harm our business.
Our future success will depend, in part, on our ability to protect our proprietary methodologies and other valuable intellectual property. We presentlyhold a limited number of issued patents, and we have filed and intend to file patent applications. There is no guarantee that any patents will issue in theUnited States or in any other country we may seek protection or that they will serve as a barrier from competition from other organizations. Additionally, theprotection afforded by international patent laws as well as the enforcement actions differ from country to country. There is no guarantee that we will be ableto maintain adequate protection or enforcement of our intellectual property rights.
We also rely upon a combination of copyright and trade secret laws, non-disclosure and related contractual arrangements, and other security measuresto protect our intellectual property rights. We believe that laws, rules, regulations and treaties in effect in the United States, India and other countries in whichwe operate are adequate to protect us from misappropriation or unauthorized use of our intellectual property. However, there can be no assurance that theselaws will not change in ways that may prevent or restrict the transfer of software components, libraries, toolsets and other technology or data we use in theperformance of our services, and existing laws of some countries in which we provide services, such as China, might offer only limited protection of ourintellectual property rights. There also can be no assurance that the steps we have taken to protect our intellectual property rights will be adequate to determisappropriation, or that we will be able to detect unauthorized use of our intellectual property.
Unauthorized use of our intellectual property may result in development of technology, products or services that compete with our products andservices and unauthorized parties may infringe upon or misappropriate our products, services or proprietary information. If we are unable to protect ourintellectual property, our business may be adversely affected and our ability to compete may be impaired.
Depending on the circumstances, we might need to grant a specific client greater rights in intellectual property developed or used in connection with acontract than we normally do. In certain situations, we might forego all rights to the use of intellectual property we create and intend to reuse across multipleclient engagements, which would limit our ability to reuse that intellectual property for other clients. Any limitation on our ability to provide a service orsolution could cause us to lose
27
Source: COGNIZANT TECHNOLOGY SOLUTIONS CORP, 10-K, February 25, 2016 Powered by Morningstar® Document Research℠The information contained herein may not be copied, adapted or distributed and is not warranted to be accurate, complete or timely. The user assumes all risks for any damages or losses arising from any use of this information,except to the extent such damages or losses cannot be limited or excluded by applicable law. Past financial performance is no guarantee of future results.
Table of Contents
revenue-generating opportunities and require us to incur additional expenses to develop new or modified solutions for future projects.
Our ability to enforce our software license agreements, service agreements, and other intellectual property rights is subject to general litigation risks, aswell as uncertainty as to the enforceability of our intellectual property rights in various countries. To the extent that we seek to enforce our rights, we couldbe subject to claims that an intellectual property right is invalid, otherwise not enforceable, or is licensed to the party against whom we are pursuing a claim.In addition, our assertion of intellectual property rights may result in the other party seeking to assert alleged intellectual property rights or assert otherclaims against us, which could harm our business. If we are not successful in defending such claims in litigation, we may not be able to sell or license aparticular service or solution due to an injunction, or we may have to pay damages that could, in turn, harm our results of operations. In addition,governments may adopt regulations, or courts may render decisions, requiring compulsory licensing of intellectual property to others, or governments mayrequire that products meet specified standards that serve to favor local companies. Our inability to enforce our intellectual property rights under thesecircumstances may harm our competitive position and our business.
Our services or solutions could infringe upon the intellectual property rights of others and we may be subject to claims of infringement of third-party intellectual property rights.
We cannot be sure that our services and solutions, or the solutions of others that we offer to our clients, do not infringe on the intellectual propertyrights of others. Third parties may assert against us or our customers claims alleging infringement of patent, copyright, trademark, or other intellectualproperty rights to technologies or services that are important to our business. Infringement claims could harm our reputation, cost us money and prevent usfrom offering some services or solutions. In our contracts, we generally agree to indemnify our clients for certain expenses or liabilities resulting frompotential infringement of the intellectual property rights of third parties. In some instances, the amount of our liability under these indemnities could besubstantial. Any claims that our products, services or processes infringe the intellectual property rights of others, regardless of the merit or resolution of suchclaims, may result in significant costs in defending and resolving such claims, and may divert the efforts and attention of our management and technicalpersonnel from our business. In addition, as a result of such intellectual property infringement claims, we could be required or otherwise decide that it isappropriate to:
• pay third-party infringement claims;• discontinue using, licensing, or selling particular products subject to infringement claims;• discontinue using the technology or processes subject to infringement claims;• develop other technology not subject to infringement claims, which could be costly or may not be possible; and/or• license technology from the third party claiming infringement, which license may not be available on commercially reasonable terms.
The occurrence of any of the foregoing could result in unexpected expenses or require us to recognize an impairment of our assets, which would reducethe value of our assets and increase expenses. In addition, if we alter or discontinue our offering of affected items or services, our revenue could be affected. Ifa claim of infringement were successful against us or our clients, an injunction might be ordered against our client or our own services or operations, causingfurther damages.
We expect that the risk of infringement claims against us will increase if our competitors are able to obtain patents or other intellectual property rightsfor software products and methods, technological solutions, and processes. We may be subject to intellectual property infringement claims from certainindividuals or companies that have acquired patent portfolios for the primary purpose of asserting such claims against other companies. The risk ofinfringement claims against us may also increase as we continue to develop and license our intellectual property to our clients and other third parties. Anyinfringement claim or litigation against us could have a material adverse effect on our business, results of operations and financial condition.
Risks Relating to Legislation and Government Regulation
Anti-outsourcing legislation, if adopted, and negative perceptions associated with offshore outsourcing could impair our ability to service ourcustomers and adversely affect our business, results of operations and financial condition.
The issue of companies outsourcing services to organizations operating in other countries is a topic of political discussion in the United States, whichis our largest market, as well as in Europe, the Asia Pacific and other regions in which we have clients. For example, measures aimed at limiting or restrictingoutsourcing by United States companies are periodically considered in the U.S. Congress and in numerous state legislatures to address concerns over theperceived association between offshore outsourcing and the loss of jobs domestically. If enacted, such measures may broaden existing restrictions onoutsourcing by federal and state government agencies and on government contracts with firms that outsource
28
Source: COGNIZANT TECHNOLOGY SOLUTIONS CORP, 10-K, February 25, 2016 Powered by Morningstar® Document Research℠The information contained herein may not be copied, adapted or distributed and is not warranted to be accurate, complete or timely. The user assumes all risks for any damages or losses arising from any use of this information,except to the extent such damages or losses cannot be limited or excluded by applicable law. Past financial performance is no guarantee of future results.
Table of Contents
services directly or indirectly, or impact private industry with measures that include, but are not limited to, tax disincentives, fees or penalties, intellectualproperty transfer restrictions, mandatory government audit requirements, and new standards that have the effect of restricting the use of certain businessand/or work visas. In the event that any of these measures become law, our ability to provide services to our customers could be impaired, which couldadversely affect our business, results of operations and financial condition. Existing and future legislative and administrative/regulatory policies restrictingthe performance of business process services from an offshore location in jurisdictions in Europe, the Asia Pacific or any other region in which we haveclients could also have a material adverse effect on our business, results of operations and financial condition.
In addition, from time to time there has been publicity about negative experiences associated with offshore outsourcing, such as domestic job loss andtheft and misappropriation of sensitive client data, particularly involving service providers in India. Current or prospective clients may elect to performcertain services themselves or may be discouraged from utilizing global service delivery providers due to negative perceptions that may be associated withusing global service delivery models or firms. Any slowdown or reversal of existing industry trends toward global service delivery would seriously harm ourability to compete effectively with competitors that provide the majority of their services from within the country in which our clients operate.
Restrictions on immigration may affect our ability to compete for and provide services to clients, which could hamper our growth and cause ourrevenue to decline.
Our future success continues to depend on our ability to attract and retain employees with technical and project management skills, including thosefrom developing countries, especially India. The ability of foreign nationals to work in the United States, Europe, the Asia Pacific and other regions in whichwe have clients depends on their and our ability to obtain the necessary visas and work permits for our personnel who need to travel internationally. If we areunable to obtain such visas or work permits, or if their issuance is delayed or if their length is shortened, we may not be able to provide services to our clientsor to continue to provide services on a timely and cost-effective basis, receive revenues as early as expected or manage our delivery centers as efficiently aswe otherwise could, any of which could have a material adverse effect on our business, results of operations and financial condition.
Immigration and work permit laws and regulations in the countries in which we have clients are subject to legislative and administrative changes aswell as changes in the application of standards and enforcement. For example, the United States Congress has recently considered and may consider in thefuture extensive changes to U.S. immigration laws regarding the admission of high-skilled temporary and permanent workers. If such provisions are signedinto law, our cost of doing business in the United States would increase and that may discourage customers from seeking our services. Our internationalexpansion strategy and our business, results of operations and financial condition may be materially adversely affected if changes in immigration and workpermit laws and regulations or the administration or enforcement of such laws or regulations impair our ability to staff projects with professionals who are notcitizens of the country where the work is to be performed.
Increased regulation of the financial services industry, healthcare industry or other industries in which our clients operate could harm ourbusiness, results of operations and financial condition.
The industries in which our clients are concentrated, such as the financial services industry and the healthcare industry, are, or may be, increasinglysubject to governmental regulation and intervention. For instance, the financial services industry is subject to extensive and complex federal and stateregulation. As a provider of services to financial institutions, portions of our operations are examined by a number of regulatory agencies. These agenciesregulate the services we provide and manner in which we operate. For example, some financial services regulators have imposed guidelines for use of cloudcomputing services that mandate specific controls or require financial services enterprises to obtain regulatory approval prior to outsourcing certainfunctions. If we are unable to comply with these guidelines or controls, or if our customers are unable to obtain regulatory approval to use our services whererequired, our business may be harmed. In addition, clients in the financial services sector have been subject to increased regulation following the enactmentof the Dodd-Frank Wall Street Reform and Consumer Protection Act in the United States. New or changing regulations under Dodd-Frank, as well as otherregulations or legislation affecting our customers in the financial services industry, may reduce demand for our services or cause us to incur costly changes inour processes or personnel, thereby negatively affecting our business, results of operations and financial condition.
The healthcare industry is highly regulated at the federal, state and local levels and is subject to changing legislative, regulatory, political and otherinfluences. Many healthcare laws, such as the Affordable Care Act, are complex, subject to frequent change, and dependent on interpretation and enforcementdecisions from government agencies with broad discretion. The application of these laws to us, our clients or the specific services and relationships we havewith our clients is not always clear. Our failure to anticipate accurately the application of the Affordable Care Act and similar or future laws and regulations,
29
Source: COGNIZANT TECHNOLOGY SOLUTIONS CORP, 10-K, February 25, 2016 Powered by Morningstar® Document Research℠The information contained herein may not be copied, adapted or distributed and is not warranted to be accurate, complete or timely. The user assumes all risks for any damages or losses arising from any use of this information,except to the extent such damages or losses cannot be limited or excluded by applicable law. Past financial performance is no guarantee of future results.
Table of Contents
or our failure to comply with them, could create liability for us, result in adverse publicity and negatively affect our business, results of operations andfinancial condition. Further, the growth of our business, results of operations and financial condition rely, in part, on clients in the healthcare industry thatreceive substantial revenues from governmental and other third-party payor programs. A reduction or less than expected increase in government funding forthese programs, a change in allocation methodologies or the termination of our clients’ government contracts could negatively affect our clients’ businessesand, in turn, negatively impact our business, results of operations and financial condition. In addition, as a service provider to clients who are governmentcontractors, we may in the future become involved in governmental investigations to evaluate our or our clients’ compliance with government healthcareprograms, which could result in the assessment of damages, civil or criminal fines or penalties, or other sanctions, any of which could have a material adverseeffect on our business, results of operations and financial condition.
Increased regulation, changes in existing regulation or increased government intervention in the other industries in which our clients operate also mayadversely affect the growth of their respective businesses and therefore negatively impact our business, results of operations and financial condition.
Risks Relating to our Common Stock and Governing Documents
Our stock price continues to be volatile.
Our stock has at times experienced substantial price volatility as a result of variations between our actual and anticipated financial results,announcements by us and our competitors, projections or speculation about our business or that of our competitors by the media or investment analysts oruncertainty about current global economic conditions. The stock market, as a whole, also has experienced extreme price and volume fluctuations that haveaffected the market price of many technology companies in ways that may have been unrelated to these companies’ operating performance. Furthermore, webelieve our stock price should reflect future growth and profitability expectations and, if we fail to meet these expectations, our stock price may significantlydecline.
Provisions in our charter and by-laws and provisions under Delaware law may discourage unsolicited takeover proposals.
Provisions in our charter and by-laws, each as amended, and Delaware General Corporate Law, or DGCL, may have the effect of deterring unsolicitedtakeover proposals or delaying or preventing changes in our control or management, including transactions in which stockholders might otherwise receive apremium for their shares over then-current market prices. These provisions include:
• Authority of the board of directors, without further action by the stockholders, to fix the rights and preferences, and issue shares of preferred stock;• The classification of our board of directors until the 2016 annual meeting of stockholders, at which point the board of directors will be
declassified and each director will be elected on an annual basis. While our board of directors remains classified, a change of control of our boardof directors cannot occur at a single meeting of stockholders;
• The inability of our stockholders to act by written consent and the restrictions imposed on our stockholders’ ability to call a special meeting. As aresult, any action by our stockholders may be delayed until annual meetings or until a special meeting is called by our chairman or chiefexecutive officer or our board of directors;
• The supermajority-voting requirement for specified amendments to our charter and by-laws, which allows a minority of our stockholders to blockthose amendments; and
• Provisions in the DGCL preventing stockholders from engaging in business combinations with us, subject to certain exceptions.
These provisions could also discourage bids for our common stock at a premium as well as create a depressive effect on the market price of the shares of ourcommon stock.
Item 1B. Unresolved Staff Comments
None.
30
Source: COGNIZANT TECHNOLOGY SOLUTIONS CORP, 10-K, February 25, 2016 Powered by Morningstar® Document Research℠The information contained herein may not be copied, adapted or distributed and is not warranted to be accurate, complete or timely. The user assumes all risks for any damages or losses arising from any use of this information,except to the extent such damages or losses cannot be limited or excluded by applicable law. Past financial performance is no guarantee of future results.
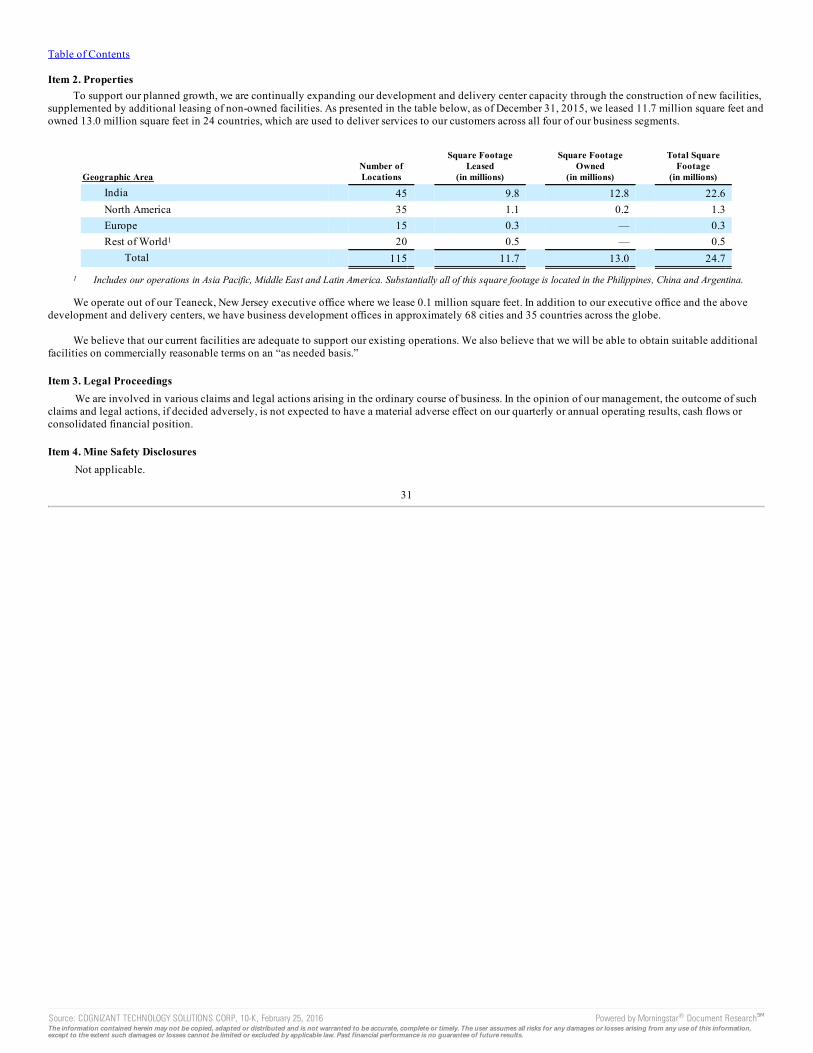
Table of Contents
Item 2. PropertiesTo support our planned growth, we are continually expanding our development and delivery center capacity through the construction of new facilities,
supplemented by additional leasing of non-owned facilities. As presented in the table below, as of December 31, 2015, we leased 11.7 million square feet andowned 13.0 million square feet in 24 countries, which are used to deliver services to our customers across all four of our business segments.
Geographic Area Number ofLocations
Square FootageLeased
(in millions)
Square FootageOwned
(in millions)
Total SquareFootage
(in millions)
India 45 9.8 12.8 22.6North America 35 1.1 0.2 1.3Europe 15 0.3 — 0.3Rest of World1 20 0.5 — 0.5
Total 115 11.7 13.0 24.7
1 Includes our operations in Asia Pacific, Middle East and Latin America. Substantially all of this square footage is located in the Philippines, China and Argentina.
We operate out of our Teaneck, New Jersey executive office where we lease 0.1 million square feet. In addition to our executive office and the abovedevelopment and delivery centers, we have business development offices in approximately 68 cities and 35 countries across the globe.
We believe that our current facilities are adequate to support our existing operations. We also believe that we will be able to obtain suitable additionalfacilities on commercially reasonable terms on an “as needed basis.”
Item 3. Legal ProceedingsWe are involved in various claims and legal actions arising in the ordinary course of business. In the opinion of our management, the outcome of such
claims and legal actions, if decided adversely, is not expected to have a material adverse effect on our quarterly or annual operating results, cash flows orconsolidated financial position.
Item 4. Mine Safety DisclosuresNot applicable.
31
Source: COGNIZANT TECHNOLOGY SOLUTIONS CORP, 10-K, February 25, 2016 Powered by Morningstar® Document Research℠The information contained herein may not be copied, adapted or distributed and is not warranted to be accurate, complete or timely. The user assumes all risks for any damages or losses arising from any use of this information,except to the extent such damages or losses cannot be limited or excluded by applicable law. Past financial performance is no guarantee of future results.
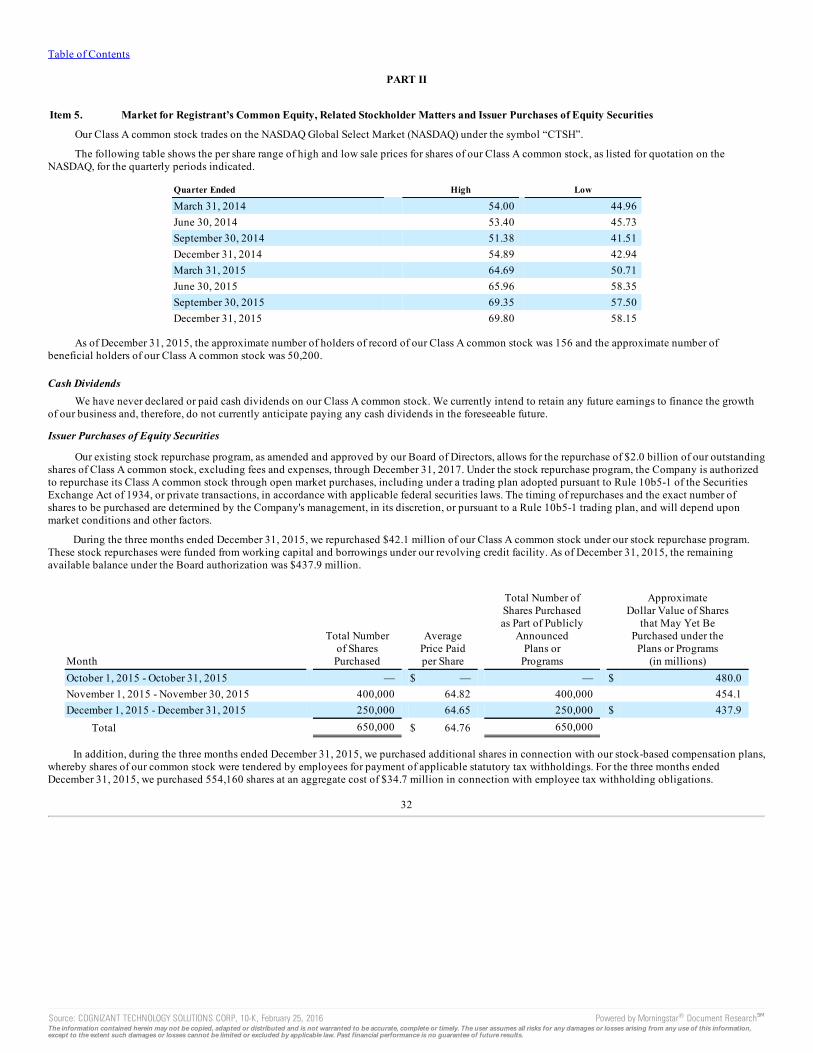
Table of Contents
PART II
Item 5. Market for Registrant’s Common Equity, Related Stockholder Matters and Issuer Purchases of Equity Securities
Our Class A common stock trades on the NASDAQ Global Select Market (NASDAQ) under the symbol “CTSH”.
The following table shows the per share range of high and low sale prices for shares of our Class A common stock, as listed for quotation on theNASDAQ, for the quarterly periods indicated.
Quarter Ended High Low
March 31, 2014 54.00 44.96June 30, 2014 53.40 45.73September 30, 2014 51.38 41.51December 31, 2014 54.89 42.94March 31, 2015 64.69 50.71June 30, 2015 65.96 58.35September 30, 2015 69.35 57.50December 31, 2015 69.80 58.15
As of December 31, 2015, the approximate number of holders of record of our Class A common stock was 156 and the approximate number ofbeneficial holders of our Class A common stock was 50,200.
Cash DividendsWe have never declared or paid cash dividends on our Class A common stock. We currently intend to retain any future earnings to finance the growth
of our business and, therefore, do not currently anticipate paying any cash dividends in the foreseeable future.
Issuer Purchases of Equity Securities
Our existing stock repurchase program, as amended and approved by our Board of Directors, allows for the repurchase of $2.0 billion of our outstandingshares of Class A common stock, excluding fees and expenses, through December 31, 2017. Under the stock repurchase program, the Company is authorizedto repurchase its Class A common stock through open market purchases, including under a trading plan adopted pursuant to Rule 10b5-1 of the SecuritiesExchange Act of 1934, or private transactions, in accordance with applicable federal securities laws. The timing of repurchases and the exact number ofshares to be purchased are determined by the Company's management, in its discretion, or pursuant to a Rule 10b5-1 trading plan, and will depend uponmarket conditions and other factors.
During the three months ended December 31, 2015, we repurchased $42.1 million of our Class A common stock under our stock repurchase program.These stock repurchases were funded from working capital and borrowings under our revolving credit facility. As of December 31, 2015, the remainingavailable balance under the Board authorization was $437.9 million.
Month
Total Numberof SharesPurchased
AveragePrice Paidper Share
Total Number ofShares Purchasedas Part of Publicly
AnnouncedPlans or
Programs
ApproximateDollar Value of Shares
that May Yet BePurchased under the
Plans or Programs(in millions)
October 1, 2015 - October 31, 2015 — $ — — $ 480.0November 1, 2015 - November 30, 2015 400,000 64.82 400,000 454.1December 1, 2015 - December 31, 2015 250,000 64.65 250,000 $ 437.9 Total 650,000 $ 64.76 650,000
In addition, during the three months ended December 31, 2015, we purchased additional shares in connection with our stock-based compensation plans,whereby shares of our common stock were tendered by employees for payment of applicable statutory tax withholdings. For the three months endedDecember 31, 2015, we purchased 554,160 shares at an aggregate cost of $34.7 million in connection with employee tax withholding obligations.
32
Source: COGNIZANT TECHNOLOGY SOLUTIONS CORP, 10-K, February 25, 2016 Powered by Morningstar® Document Research℠The information contained herein may not be copied, adapted or distributed and is not warranted to be accurate, complete or timely. The user assumes all risks for any damages or losses arising from any use of this information,except to the extent such damages or losses cannot be limited or excluded by applicable law. Past financial performance is no guarantee of future results.
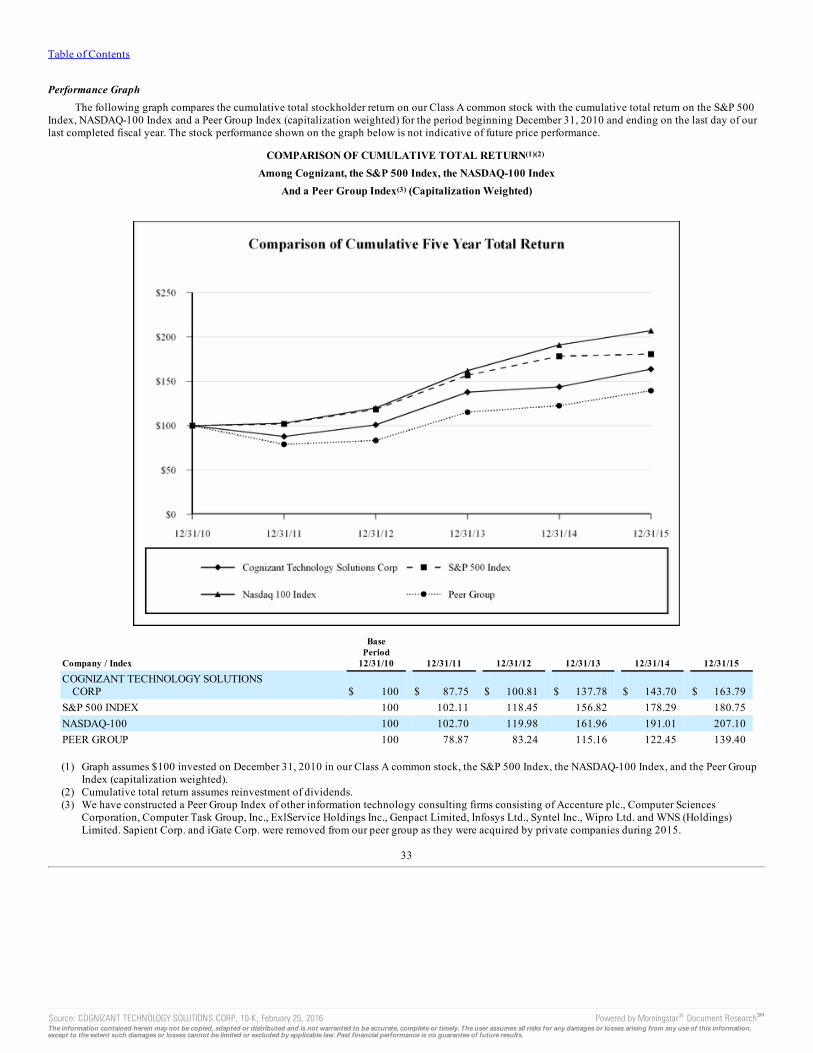
Table of Contents
Performance GraphThe following graph compares the cumulative total stockholder return on our Class A common stock with the cumulative total return on the S&P 500
Index, NASDAQ-100 Index and a Peer Group Index (capitalization weighted) for the period beginning December 31, 2010 and ending on the last day of ourlast completed fiscal year. The stock performance shown on the graph below is not indicative of future price performance.
COMPARISON OF CUMULATIVE TOTAL RETURN(1)(2) Among Cognizant, the S&P 500 Index, the NASDAQ-100 Index
And a Peer Group Index(3) (Capitalization Weighted)
Company / Index
BasePeriod
12/31/10 12/31/11 12/31/12 12/31/13 12/31/14 12/31/15
COGNIZANT TECHNOLOGY SOLUTIONSCORP $ 100 $ 87.75 $ 100.81 $ 137.78 $ 143.70 $ 163.79
S&P 500 INDEX 100 102.11 118.45 156.82 178.29 180.75NASDAQ-100 100 102.70 119.98 161.96 191.01 207.10PEER GROUP 100 78.87 83.24 115.16 122.45 139.40
(1) Graph assumes $100 invested on December 31, 2010 in our Class A common stock, the S&P 500 Index, the NASDAQ-100 Index, and the Peer Group
Index (capitalization weighted).(2) Cumulative total return assumes reinvestment of dividends.(3) We have constructed a Peer Group Index of other information technology consulting firms consisting of Accenture plc., Computer Sciences
Corporation, Computer Task Group, Inc., ExlService Holdings Inc., Genpact Limited, Infosys Ltd., Syntel Inc., Wipro Ltd. and WNS (Holdings)Limited. Sapient Corp. and iGate Corp. were removed from our peer group as they were acquired by private companies during 2015.
33
Source: COGNIZANT TECHNOLOGY SOLUTIONS CORP, 10-K, February 25, 2016 Powered by Morningstar® Document Research℠The information contained herein may not be copied, adapted or distributed and is not warranted to be accurate, complete or timely. The user assumes all risks for any damages or losses arising from any use of this information,except to the extent such damages or losses cannot be limited or excluded by applicable law. Past financial performance is no guarantee of future results.
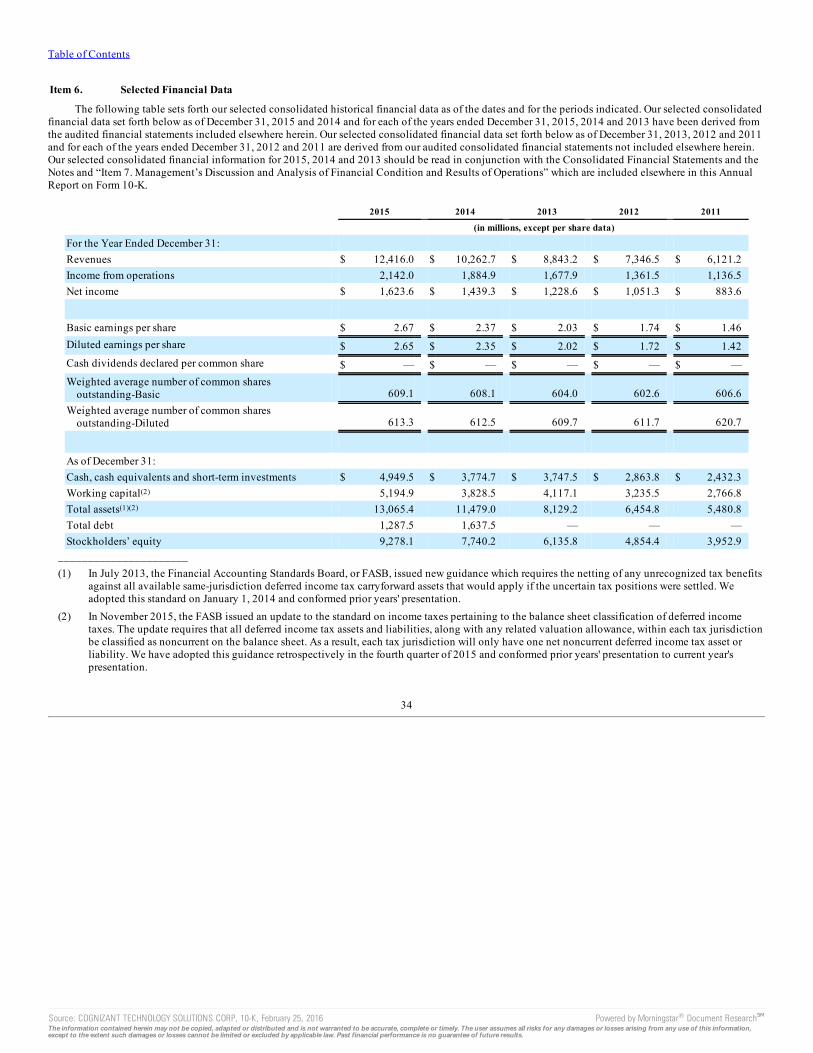
Table of Contents
Item 6. Selected Financial Data
The following table sets forth our selected consolidated historical financial data as of the dates and for the periods indicated. Our selected consolidatedfinancial data set forth below as of December 31, 2015 and 2014 and for each of the years ended December 31, 2015, 2014 and 2013 have been derived fromthe audited financial statements included elsewhere herein. Our selected consolidated financial data set forth below as of December 31, 2013, 2012 and 2011and for each of the years ended December 31, 2012 and 2011 are derived from our audited consolidated financial statements not included elsewhere herein.Our selected consolidated financial information for 2015, 2014 and 2013 should be read in conjunction with the Consolidated Financial Statements and theNotes and “Item 7. Management’s Discussion and Analysis of Financial Condition and Results of Operations” which are included elsewhere in this AnnualReport on Form 10-K.
2015 2014 2013 2012 2011
(in millions, except per share data)
For the Year Ended December 31: Revenues $ 12,416.0 $ 10,262.7 $ 8,843.2 $ 7,346.5 $ 6,121.2Income from operations 2,142.0 1,884.9 1,677.9 1,361.5 1,136.5Net income $ 1,623.6 $ 1,439.3 $ 1,228.6 $ 1,051.3 $ 883.6
Basic earnings per share $ 2.67 $ 2.37 $ 2.03 $ 1.74 $ 1.46Diluted earnings per share $ 2.65 $ 2.35 $ 2.02 $ 1.72 $ 1.42Cash dividends declared per common share $ — $ — $ — $ — $ —Weighted average number of common shares
outstanding-Basic 609.1 608.1 604.0 602.6 606.6Weighted average number of common shares
outstanding-Diluted 613.3 612.5 609.7 611.7 620.7
As of December 31: Cash, cash equivalents and short-term investments $ 4,949.5 $ 3,774.7 $ 3,747.5 $ 2,863.8 $ 2,432.3Working capital(2) 5,194.9 3,828.5 4,117.1 3,235.5 2,766.8Total assets(1)(2) 13,065.4 11,479.0 8,129.2 6,454.8 5,480.8Total debt 1,287.5 1,637.5 — — —Stockholders’ equity 9,278.1 7,740.2 6,135.8 4,854.4 3,952.9
______________________(1) In July 2013, the Financial Accounting Standards Board, or FASB, issued new guidance which requires the netting of any unrecognized tax benefits
against all available same-jurisdiction deferred income tax carryforward assets that would apply if the uncertain tax positions were settled. Weadopted this standard on January 1, 2014 and conformed prior years' presentation.
(2) In November 2015, the FASB issued an update to the standard on income taxes pertaining to the balance sheet classification of deferred incometaxes. The update requires that all deferred income tax assets and liabilities, along with any related valuation allowance, within each tax jurisdictionbe classified as noncurrent on the balance sheet. As a result, each tax jurisdiction will only have one net noncurrent deferred income tax asset orliability. We have adopted this guidance retrospectively in the fourth quarter of 2015 and conformed prior years' presentation to current year'spresentation.
34
Source: COGNIZANT TECHNOLOGY SOLUTIONS CORP, 10-K, February 25, 2016 Powered by Morningstar® Document Research℠The information contained herein may not be copied, adapted or distributed and is not warranted to be accurate, complete or timely. The user assumes all risks for any damages or losses arising from any use of this information,except to the extent such damages or losses cannot be limited or excluded by applicable law. Past financial performance is no guarantee of future results.
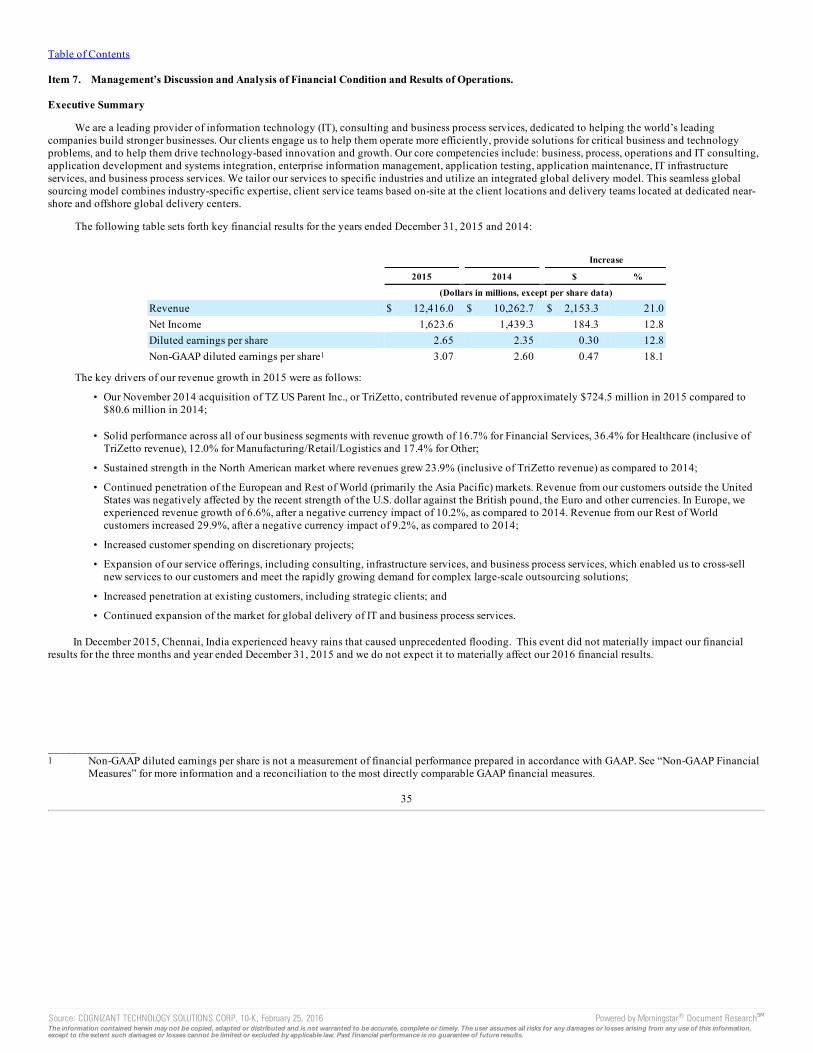
Table of Contents
Item 7. Management’s Discussion and Analysis of Financial Condition and Results of Operations.
Executive Summary
We are a leading provider of information technology (IT), consulting and business process services, dedicated to helping the world’s leadingcompanies build stronger businesses. Our clients engage us to help them operate more efficiently, provide solutions for critical business and technologyproblems, and to help them drive technology-based innovation and growth. Our core competencies include: business, process, operations and IT consulting,application development and systems integration, enterprise information management, application testing, application maintenance, IT infrastructureservices, and business process services. We tailor our services to specific industries and utilize an integrated global delivery model. This seamless globalsourcing model combines industry-specific expertise, client service teams based on-site at the client locations and delivery teams located at dedicated near-shore and offshore global delivery centers.
The following table sets forth key financial results for the years ended December 31, 2015 and 2014:
Increase
2015 2014 $ %
(Dollars in millions, except per share data)
Revenue $ 12,416.0 $ 10,262.7 $ 2,153.3 21.0Net Income 1,623.6 1,439.3 184.3 12.8Diluted earnings per share 2.65 2.35 0.30 12.8Non-GAAP diluted earnings per share1 3.07 2.60 0.47 18.1
The key drivers of our revenue growth in 2015 were as follows:
• Our November 2014 acquisition of TZ US Parent Inc., or TriZetto, contributed revenue of approximately $724.5 million in 2015 compared to$80.6 million in 2014;
• Solid performance across all of our business segments with revenue growth of 16.7% for Financial Services, 36.4% for Healthcare (inclusive ofTriZetto revenue), 12.0% for Manufacturing/Retail/Logistics and 17.4% for Other;
• Sustained strength in the North American market where revenues grew 23.9% (inclusive of TriZetto revenue) as compared to 2014;
• Continued penetration of the European and Rest of World (primarily the Asia Pacific) markets. Revenue from our customers outside the UnitedStates was negatively affected by the recent strength of the U.S. dollar against the British pound, the Euro and other currencies. In Europe, weexperienced revenue growth of 6.6%, after a negative currency impact of 10.2%, as compared to 2014. Revenue from our Rest of Worldcustomers increased 29.9%, after a negative currency impact of 9.2%, as compared to 2014;
• Increased customer spending on discretionary projects;
• Expansion of our service offerings, including consulting, infrastructure services, and business process services, which enabled us to cross-sellnew services to our customers and meet the rapidly growing demand for complex large-scale outsourcing solutions;
• Increased penetration at existing customers, including strategic clients; and
• Continued expansion of the market for global delivery of IT and business process services.
In December 2015, Chennai, India experienced heavy rains that caused unprecedented flooding. This event did not materially impact our financialresults for the three months and year ended December 31, 2015 and we do not expect it to materially affect our 2016 financial results.
_______________1 Non-GAAP diluted earnings per share is not a measurement of financial performance prepared in accordance with GAAP. See “Non-GAAP Financial
Measures” for more information and a reconciliation to the most directly comparable GAAP financial measures.
35
Source: COGNIZANT TECHNOLOGY SOLUTIONS CORP, 10-K, February 25, 2016 Powered by Morningstar® Document Research℠The information contained herein may not be copied, adapted or distributed and is not warranted to be accurate, complete or timely. The user assumes all risks for any damages or losses arising from any use of this information,except to the extent such damages or losses cannot be limited or excluded by applicable law. Past financial performance is no guarantee of future results.
Table of Contents
We saw a continued demand from our customers for a broad range of services, including IT strategy and business consulting, application developmentand systems integration, enterprise information management, application testing, application maintenance, infrastructure services, and business processservices. In addition, we are seeing continued customer interest in digital solutions, including our social, mobile, analytics and cloud-based services andincreased demand for mobility, data and security services. We are also seeing an increase in demand for larger, more complex projects that aretransformational for our customers. Such contracts may have longer sales cycles and ramp-up periods and could lead to greater variability in our period-to-period operating results. We increased the number of strategic clients by 29 during the year, bringing the total number of our strategic clients to 300. Wedefine a strategic client as one offering the potential to generate at least $5 million to $50 million or more in annual revenues at maturity.
In 2015, our operating margin decreased to 17.3% from 18.4% in 2014. The decrease in our operating margin was due to increases in compensation andbenefit costs (inclusive of the impact of higher incentive-based compensation) and increases in depreciation and amortization due to recent acquisitions,partially offset by the impact of the depreciation of the Indian rupee against the U.S. dollar, lower realized losses on our cash flow hedges and decreases incertain operating expenses, including travel, in 2015 compared to 2014.
Our non-GAAP operating margin in 2015 decreased to 19.7%2 from 20.2%2 in 2014. The decrease in our non-GAAP operating margin was due toincreases in compensation and benefit costs (inclusive of the impact of higher incentive-based compensation), partially offset by the impact of thedepreciation of the Indian rupee against the U.S. dollar, lower realized losses on our cash flow hedges and decreases in certain operating expenses, includingtravel, in 2015 compared to 2014. Historically, we have invested our profitability above the 19% to 20% non-GAAP operating margin level back into ourbusiness, which we believe is a significant contributing factor to our strong revenue growth. This investment is primarily focused in the areas of hiring clientpartners and relationship personnel with specific industry experience or domain expertise, training our technical staff in a broader range of service offerings,strengthening our business analytics and digital technology capabilities, strengthening and expanding our portfolio of services, continuing to expand ourgeographic presence for both sales and delivery, as well as recognizing and rewarding employee performance by means of enhanced incentive-basedcompensation. In addition, this investment includes maintaining a level of resources, trained in a broad range of service offerings, to be well positioned torespond to our customer requests to take on additional projects. We expect to continue to invest amounts in excess of our targeted operating margin levelsback into the business.
We finished the year with approximately 221,700 employees, which is an increase of approximately 10,200 over the prior year. The increase in thenumber of our service delivery staff and the related infrastructure costs to meet the demand for our services is the primary driver of the increase in ouroperating expenses in 2015. Annualized turnover, including both voluntary and involuntary, was approximately 19.1% for the three months ended December31, 2015. The majority of our turnover occurs in India. As a result, annualized attrition rates on-site at clients are below our global attrition rate. In addition,attrition is weighted towards the more junior members of our staff. We have experienced increases in compensation and benefit costs, including incentive-based compensation costs, in India, which may continue in the future; however, historically, this has not had a material impact on our results of operations aswe have been able to absorb such cost increases through price increases or cost management strategies such as managing discretionary costs, the mix of ourprofessional staff as well as utilization levels, and achieving other operating efficiencies.
At December 31, 2015, we had cash, cash equivalents and short-term investments of $4,949.5 million, working capital of $5,194.9 million and debtoutstanding of $1,287.5 million. We believe our cash from operations and capital resources on hand provide sufficient liquidity to continue to makeinvestments to expand and grow our business, and meet our debt repayment obligations.
_______________2 Non-GAAP operating margin is not a measurement of financial performance prepared in accordance with GAAP. See “Non-GAAP Financial
Measures” for more information and a reconciliation to the most directly comparable GAAP financial measures.
36
Source: COGNIZANT TECHNOLOGY SOLUTIONS CORP, 10-K, February 25, 2016 Powered by Morningstar® Document Research℠The information contained herein may not be copied, adapted or distributed and is not warranted to be accurate, complete or timely. The user assumes all risks for any damages or losses arising from any use of this information,except to the extent such damages or losses cannot be limited or excluded by applicable law. Past financial performance is no guarantee of future results.
Table of Contents
During 2016, barring any unforeseen events, we expect the following factors to affect our business and our operating results:• Demand from our customers to help them meet their dual mandate of achieving cost savings while investing in transformation and innovation;• Continued focus by customers on directing IT spending towards cost containment projects, such as application maintenance, infrastructure services
and business process services;• Secular changes driven by evolving digital technologies and regulatory changes;• Volatility in foreign currency rates; and• Continued uncertainty in the world economy.
In response to this environment, we plan to:• Continue to invest in our talent base and new service offerings including digital technologies and new delivery models;• Partner with our existing customers to garner an increased portion of our customers’ overall IT spend by providing innovative solutions;• Focus on growing our business in Europe, the Middle East, the Asia Pacific and Latin America regions, where we believe there are opportunities to
gain market share;• Increase our strategic customer base across all of our business segments;• Opportunistically look for acquisitions that may improve our overall service delivery capabilities, expand our geographic presence and/or enable us
to enter new areas of technology;• Focus on operating discipline in order to appropriately manage our cost structure; and• Locate most of our new development center facilities in tax incentivized areas.
Business SegmentsOur four reportable business segments are:
• Financial Services, which includes customers providing banking/transaction processing, capital markets and insurance services;
• Healthcare, which includes healthcare providers and payers as well as life sciences customers including pharmaceutical, biotech and medical devicecompanies;
• Manufacturing/Retail/Logistics, which includes consumer goods manufacturers, retailers, travel and other hospitality customers, as well ascustomers providing logistics services; and
• Other, which is an aggregation of industry operating segments each of which, individually, represents less than 10.0% of consolidated revenues andsegment operating profit. The Other segment includes information, media and entertainment services, communications, and high technologyoperating customers.
Our chief operating decision maker evaluates Cognizant’s performance and allocates resources based on segment revenues and operating profit.Segment operating profit is defined as income from operations before unallocated costs. Generally, operating expenses for each operating segment havesimilar characteristics and are subject to the same factors, pressures and challenges. However, the economic environment and its effects on industries servedby our operating groups may affect revenue and operating expenses to different degrees. Expenses included in segment operating profit consist principally ofdirect selling and delivery costs as well as a per seat charge for use of the development and delivery centers. Certain selling, general and administrativeexpenses, excess or shortfall of incentive compensation for delivery personnel as compared to target, stock-based compensation expense, a portion ofdepreciation and amortization and the impact of the settlements of our cash flow hedges are not allocated to individual segments in internal managementreports used by the chief operating decision maker. Accordingly, such expenses are excluded from segment operating profit.
We provide a significant volume of services to many customers in each of our business segments. Therefore, a loss of a significant customer or a fewsignificant customers in a particular segment could materially reduce revenues for that segment. However, no individual customer accounted for sales inexcess of 10% of our consolidated revenues during 2015, 2014 or 2013. In addition, the services we provide to our larger customers are often critical to theoperations of such customers and we believe that a termination of our services would require an extended transition period with gradually decliningrevenues.
37
Source: COGNIZANT TECHNOLOGY SOLUTIONS CORP, 10-K, February 25, 2016 Powered by Morningstar® Document Research℠The information contained herein may not be copied, adapted or distributed and is not warranted to be accurate, complete or timely. The user assumes all risks for any damages or losses arising from any use of this information,except to the extent such damages or losses cannot be limited or excluded by applicable law. Past financial performance is no guarantee of future results.
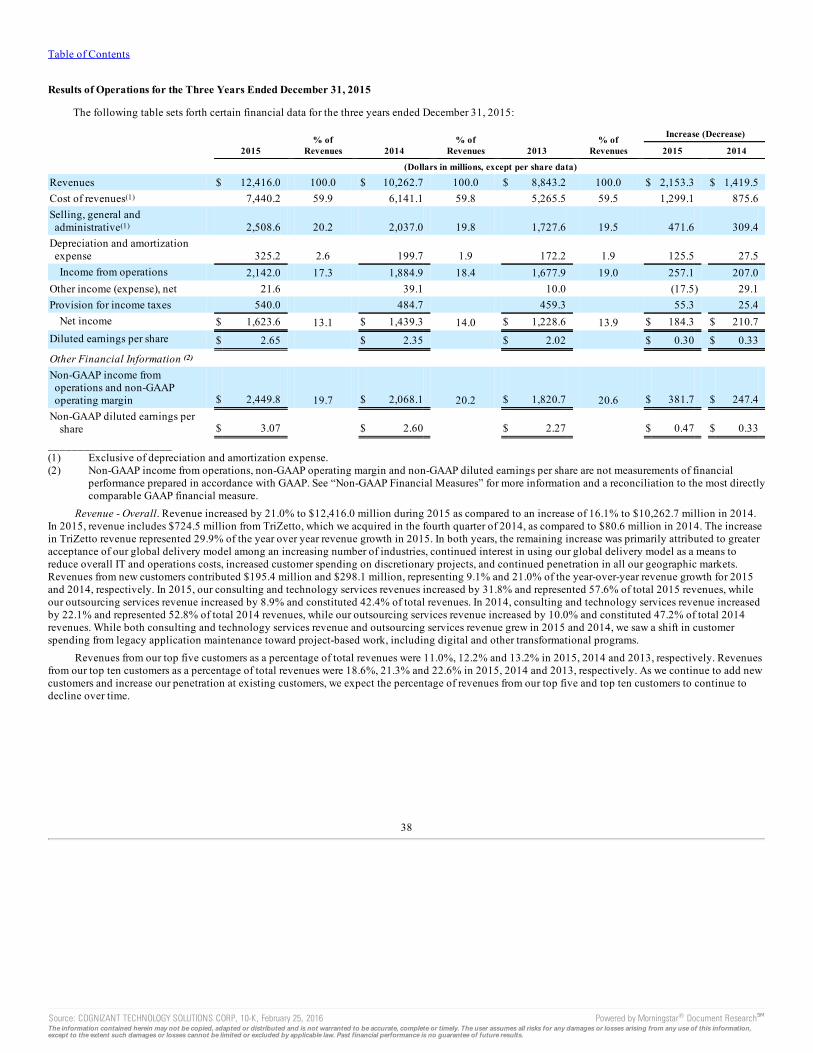
Table of Contents
Results of Operations for the Three Years Ended December 31, 2015
The following table sets forth certain financial data for the three years ended December 31, 2015:
2015 % of
Revenues 2014 % of
Revenues 2013 % of
Revenues Increase (Decrease)
2015 2014
(Dollars in millions, except per share data)
Revenues $ 12,416.0 100.0 $ 10,262.7 100.0 $ 8,843.2 100.0 $ 2,153.3 $ 1,419.5Cost of revenues(1) 7,440.2 59.9 6,141.1 59.8 5,265.5 59.5 1,299.1 875.6Selling, general andadministrative(1) 2,508.6 20.2 2,037.0 19.8 1,727.6 19.5 471.6 309.4
Depreciation and amortizationexpense 325.2 2.6 199.7 1.9 172.2 1.9 125.5 27.5Income from operations 2,142.0 17.3 1,884.9 18.4 1,677.9 19.0 257.1 207.0
Other income (expense), net 21.6 39.1 10.0 (17.5) 29.1Provision for income taxes 540.0 484.7 459.3 55.3 25.4
Net income $ 1,623.6 13.1 $ 1,439.3 14.0 $ 1,228.6 13.9 $ 184.3 $ 210.7Diluted earnings per share $ 2.65 $ 2.35 $ 2.02 $ 0.30 $ 0.33
Other Financial Information (2) Non-GAAP income fromoperations and non-GAAPoperating margin $ 2,449.8 19.7 $ 2,068.1 20.2 $ 1,820.7 20.6 $ 381.7 $ 247.4
Non-GAAP diluted earnings pershare $ 3.07 $ 2.60 $ 2.27 $ 0.47 $ 0.33
_____________________(1) Exclusive of depreciation and amortization expense.(2) Non-GAAP income from operations, non-GAAP operating margin and non-GAAP diluted earnings per share are not measurements of financial
performance prepared in accordance with GAAP. See “Non-GAAP Financial Measures” for more information and a reconciliation to the most directlycomparable GAAP financial measure.
Revenue - Overall. Revenue increased by 21.0% to $12,416.0 million during 2015 as compared to an increase of 16.1% to $10,262.7 million in 2014.In 2015, revenue includes $724.5 million from TriZetto, which we acquired in the fourth quarter of 2014, as compared to $80.6 million in 2014. The increasein TriZetto revenue represented 29.9% of the year over year revenue growth in 2015. In both years, the remaining increase was primarily attributed to greateracceptance of our global delivery model among an increasing number of industries, continued interest in using our global delivery model as a means toreduce overall IT and operations costs, increased customer spending on discretionary projects, and continued penetration in all our geographic markets.Revenues from new customers contributed $195.4 million and $298.1 million, representing 9.1% and 21.0% of the year-over-year revenue growth for 2015and 2014, respectively. In 2015, our consulting and technology services revenues increased by 31.8% and represented 57.6% of total 2015 revenues, whileour outsourcing services revenue increased by 8.9% and constituted 42.4% of total revenues. In 2014, consulting and technology services revenue increasedby 22.1% and represented 52.8% of total 2014 revenues, while our outsourcing services revenue increased by 10.0% and constituted 47.2% of total 2014revenues. While both consulting and technology services revenue and outsourcing services revenue grew in 2015 and 2014, we saw a shift in customerspending from legacy application maintenance toward project-based work, including digital and other transformational programs.
Revenues from our top five customers as a percentage of total revenues were 11.0%, 12.2% and 13.2% in 2015, 2014 and 2013, respectively. Revenuesfrom our top ten customers as a percentage of total revenues were 18.6%, 21.3% and 22.6% in 2015, 2014 and 2013, respectively. As we continue to add newcustomers and increase our penetration at existing customers, we expect the percentage of revenues from our top five and top ten customers to continue todecline over time.
38
Source: COGNIZANT TECHNOLOGY SOLUTIONS CORP, 10-K, February 25, 2016 Powered by Morningstar® Document Research℠The information contained herein may not be copied, adapted or distributed and is not warranted to be accurate, complete or timely. The user assumes all risks for any damages or losses arising from any use of this information,except to the extent such damages or losses cannot be limited or excluded by applicable law. Past financial performance is no guarantee of future results.
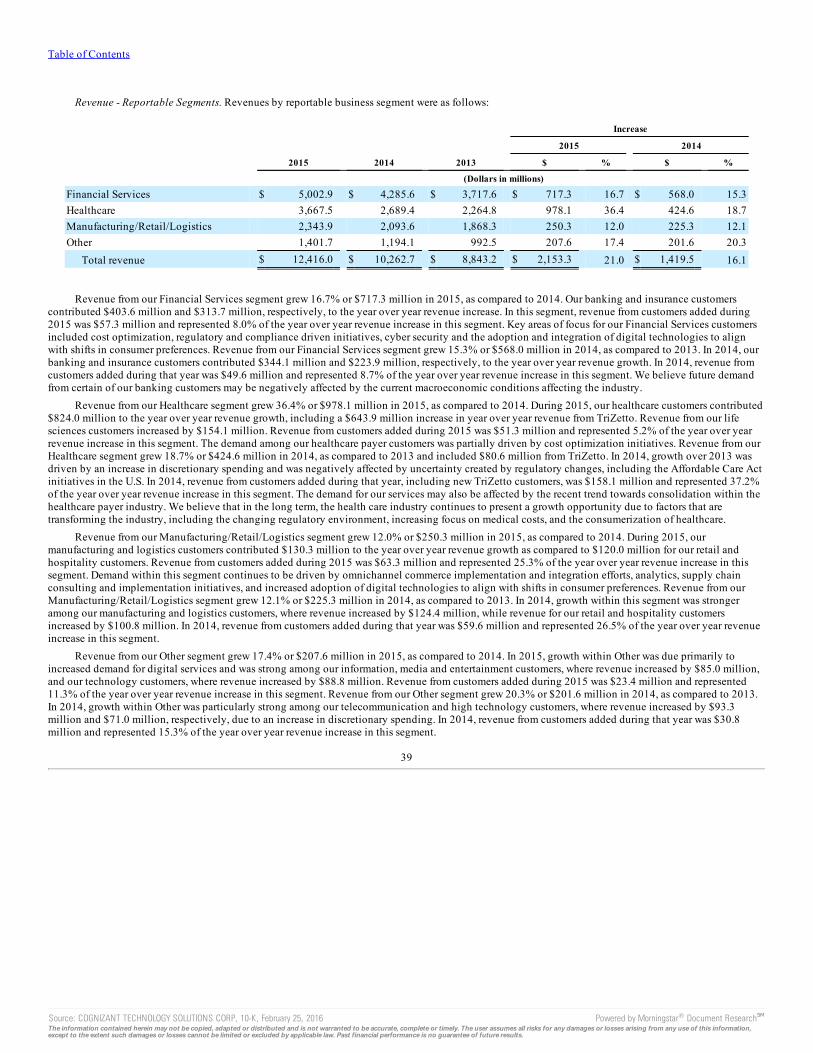
Table of Contents
Revenue - Reportable Segments. Revenues by reportable business segment were as follows:
2015 2014 2013
Increase
2015 2014
$ % $ %
(Dollars in millions)
Financial Services $ 5,002.9 $ 4,285.6 $ 3,717.6 $ 717.3 16.7 $ 568.0 15.3Healthcare 3,667.5 2,689.4 2,264.8 978.1 36.4 424.6 18.7Manufacturing/Retail/Logistics 2,343.9 2,093.6 1,868.3 250.3 12.0 225.3 12.1Other 1,401.7 1,194.1 992.5 207.6 17.4 201.6 20.3
Total revenue $ 12,416.0 $ 10,262.7 $ 8,843.2 $ 2,153.3 21.0 $ 1,419.5 16.1
Revenue from our Financial Services segment grew 16.7% or $717.3 million in 2015, as compared to 2014. Our banking and insurance customerscontributed $403.6 million and $313.7 million, respectively, to the year over year revenue increase. In this segment, revenue from customers added during2015 was $57.3 million and represented 8.0% of the year over year revenue increase in this segment. Key areas of focus for our Financial Services customersincluded cost optimization, regulatory and compliance driven initiatives, cyber security and the adoption and integration of digital technologies to alignwith shifts in consumer preferences. Revenue from our Financial Services segment grew 15.3% or $568.0 million in 2014, as compared to 2013. In 2014, ourbanking and insurance customers contributed $344.1 million and $223.9 million, respectively, to the year over year revenue growth. In 2014, revenue fromcustomers added during that year was $49.6 million and represented 8.7% of the year over year revenue increase in this segment. We believe future demandfrom certain of our banking customers may be negatively affected by the current macroeconomic conditions affecting the industry.
Revenue from our Healthcare segment grew 36.4% or $978.1 million in 2015, as compared to 2014. During 2015, our healthcare customers contributed$824.0 million to the year over year revenue growth, including a $643.9 million increase in year over year revenue from TriZetto. Revenue from our lifesciences customers increased by $154.1 million. Revenue from customers added during 2015 was $51.3 million and represented 5.2% of the year over yearrevenue increase in this segment. The demand among our healthcare payer customers was partially driven by cost optimization initiatives. Revenue from ourHealthcare segment grew 18.7% or $424.6 million in 2014, as compared to 2013 and included $80.6 million from TriZetto. In 2014, growth over 2013 wasdriven by an increase in discretionary spending and was negatively affected by uncertainty created by regulatory changes, including the Affordable Care Actinitiatives in the U.S. In 2014, revenue from customers added during that year, including new TriZetto customers, was $158.1 million and represented 37.2%of the year over year revenue increase in this segment. The demand for our services may also be affected by the recent trend towards consolidation within thehealthcare payer industry. We believe that in the long term, the health care industry continues to present a growth opportunity due to factors that aretransforming the industry, including the changing regulatory environment, increasing focus on medical costs, and the consumerization of healthcare.
Revenue from our Manufacturing/Retail/Logistics segment grew 12.0% or $250.3 million in 2015, as compared to 2014. During 2015, ourmanufacturing and logistics customers contributed $130.3 million to the year over year revenue growth as compared to $120.0 million for our retail andhospitality customers. Revenue from customers added during 2015 was $63.3 million and represented 25.3% of the year over year revenue increase in thissegment. Demand within this segment continues to be driven by omnichannel commerce implementation and integration efforts, analytics, supply chainconsulting and implementation initiatives, and increased adoption of digital technologies to align with shifts in consumer preferences. Revenue from ourManufacturing/Retail/Logistics segment grew 12.1% or $225.3 million in 2014, as compared to 2013. In 2014, growth within this segment was strongeramong our manufacturing and logistics customers, where revenue increased by $124.4 million, while revenue for our retail and hospitality customersincreased by $100.8 million. In 2014, revenue from customers added during that year was $59.6 million and represented 26.5% of the year over year revenueincrease in this segment.
Revenue from our Other segment grew 17.4% or $207.6 million in 2015, as compared to 2014. In 2015, growth within Other was due primarily toincreased demand for digital services and was strong among our information, media and entertainment customers, where revenue increased by $85.0 million,and our technology customers, where revenue increased by $88.8 million. Revenue from customers added during 2015 was $23.4 million and represented11.3% of the year over year revenue increase in this segment. Revenue from our Other segment grew 20.3% or $201.6 million in 2014, as compared to 2013.In 2014, growth within Other was particularly strong among our telecommunication and high technology customers, where revenue increased by $93.3million and $71.0 million, respectively, due to an increase in discretionary spending. In 2014, revenue from customers added during that year was $30.8million and represented 15.3% of the year over year revenue increase in this segment.
39
Source: COGNIZANT TECHNOLOGY SOLUTIONS CORP, 10-K, February 25, 2016 Powered by Morningstar® Document Research℠The information contained herein may not be copied, adapted or distributed and is not warranted to be accurate, complete or timely. The user assumes all risks for any damages or losses arising from any use of this information,except to the extent such damages or losses cannot be limited or excluded by applicable law. Past financial performance is no guarantee of future results.
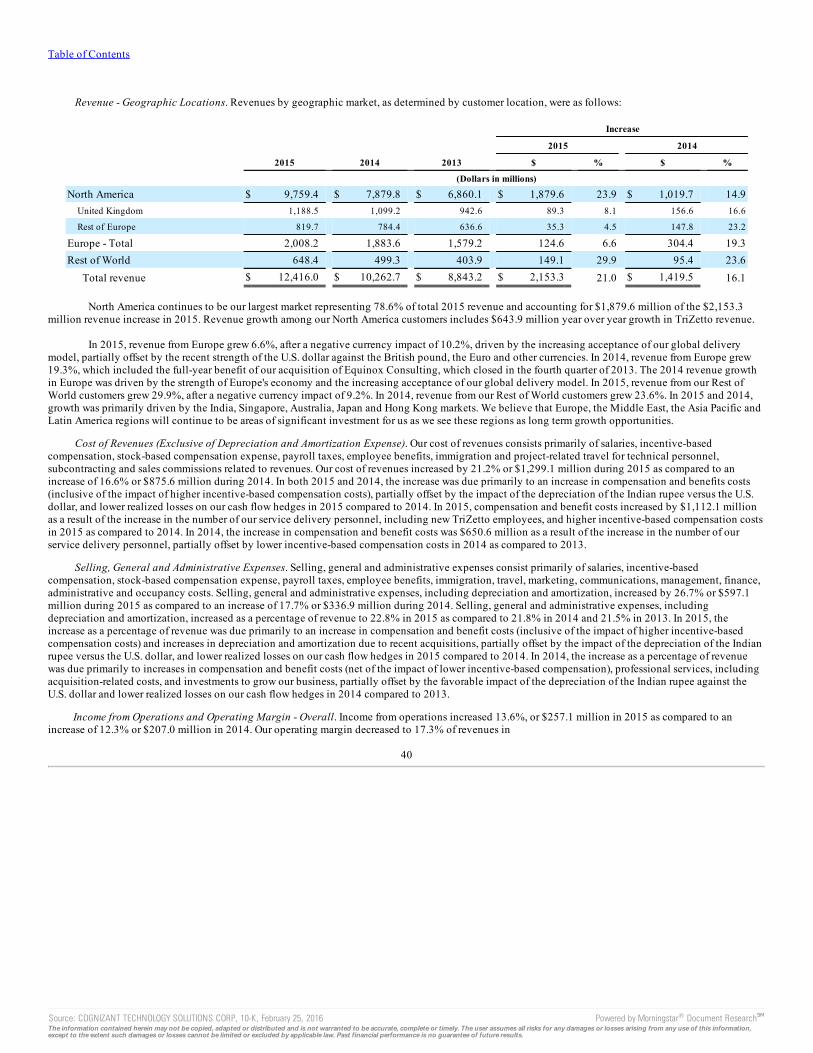
Table of Contents
Revenue - Geographic Locations. Revenues by geographic market, as determined by customer location, were as follows:
2015 2014 2013
Increase
2015 2014
$ % $ %
(Dollars in millions)
North America $ 9,759.4 $ 7,879.8 $ 6,860.1 $ 1,879.6 23.9 $ 1,019.7 14.9United Kingdom 1,188.5 1,099.2 942.6 89.3 8.1 156.6 16.6
Rest of Europe 819.7 784.4 636.6 35.3 4.5 147.8 23.2
Europe - Total 2,008.2 1,883.6 1,579.2 124.6 6.6 304.4 19.3Rest of World 648.4 499.3 403.9 149.1 29.9 95.4 23.6
Total revenue $ 12,416.0 $ 10,262.7 $ 8,843.2 $ 2,153.3 21.0 $ 1,419.5 16.1 North America continues to be our largest market representing 78.6% of total 2015 revenue and accounting for $1,879.6 million of the $2,153.3
million revenue increase in 2015. Revenue growth among our North America customers includes $643.9 million year over year growth in TriZetto revenue. In 2015, revenue from Europe grew 6.6%, after a negative currency impact of 10.2%, driven by the increasing acceptance of our global delivery
model, partially offset by the recent strength of the U.S. dollar against the British pound, the Euro and other currencies. In 2014, revenue from Europe grew19.3%, which included the full-year benefit of our acquisition of Equinox Consulting, which closed in the fourth quarter of 2013. The 2014 revenue growthin Europe was driven by the strength of Europe's economy and the increasing acceptance of our global delivery model. In 2015, revenue from our Rest ofWorld customers grew 29.9%, after a negative currency impact of 9.2%. In 2014, revenue from our Rest of World customers grew 23.6%. In 2015 and 2014,growth was primarily driven by the India, Singapore, Australia, Japan and Hong Kong markets. We believe that Europe, the Middle East, the Asia Pacific andLatin America regions will continue to be areas of significant investment for us as we see these regions as long term growth opportunities.
Cost of Revenues (Exclusive of Depreciation and Amortization Expense). Our cost of revenues consists primarily of salaries, incentive-basedcompensation, stock-based compensation expense, payroll taxes, employee benefits, immigration and project-related travel for technical personnel,subcontracting and sales commissions related to revenues. Our cost of revenues increased by 21.2% or $1,299.1 million during 2015 as compared to anincrease of 16.6% or $875.6 million during 2014. In both 2015 and 2014, the increase was due primarily to an increase in compensation and benefits costs(inclusive of the impact of higher incentive-based compensation costs), partially offset by the impact of the depreciation of the Indian rupee versus the U.S.dollar, and lower realized losses on our cash flow hedges in 2015 compared to 2014. In 2015, compensation and benefit costs increased by $1,112.1 millionas a result of the increase in the number of our service delivery personnel, including new TriZetto employees, and higher incentive-based compensation costsin 2015 as compared to 2014. In 2014, the increase in compensation and benefit costs was $650.6 million as a result of the increase in the number of ourservice delivery personnel, partially offset by lower incentive-based compensation costs in 2014 as compared to 2013.
Selling, General and Administrative Expenses. Selling, general and administrative expenses consist primarily of salaries, incentive-basedcompensation, stock-based compensation expense, payroll taxes, employee benefits, immigration, travel, marketing, communications, management, finance,administrative and occupancy costs. Selling, general and administrative expenses, including depreciation and amortization, increased by 26.7% or $597.1million during 2015 as compared to an increase of 17.7% or $336.9 million during 2014. Selling, general and administrative expenses, includingdepreciation and amortization, increased as a percentage of revenue to 22.8% in 2015 as compared to 21.8% in 2014 and 21.5% in 2013. In 2015, theincrease as a percentage of revenue was due primarily to an increase in compensation and benefit costs (inclusive of the impact of higher incentive-basedcompensation costs) and increases in depreciation and amortization due to recent acquisitions, partially offset by the impact of the depreciation of the Indianrupee versus the U.S. dollar, and lower realized losses on our cash flow hedges in 2015 compared to 2014. In 2014, the increase as a percentage of revenuewas due primarily to increases in compensation and benefit costs (net of the impact of lower incentive-based compensation), professional services, includingacquisition-related costs, and investments to grow our business, partially offset by the favorable impact of the depreciation of the Indian rupee against theU.S. dollar and lower realized losses on our cash flow hedges in 2014 compared to 2013.
Income from Operations and Operating Margin - Overall. Income from operations increased 13.6%, or $257.1 million in 2015 as compared to anincrease of 12.3% or $207.0 million in 2014. Our operating margin decreased to 17.3% of revenues in
40
Source: COGNIZANT TECHNOLOGY SOLUTIONS CORP, 10-K, February 25, 2016 Powered by Morningstar® Document Research℠The information contained herein may not be copied, adapted or distributed and is not warranted to be accurate, complete or timely. The user assumes all risks for any damages or losses arising from any use of this information,except to the extent such damages or losses cannot be limited or excluded by applicable law. Past financial performance is no guarantee of future results.
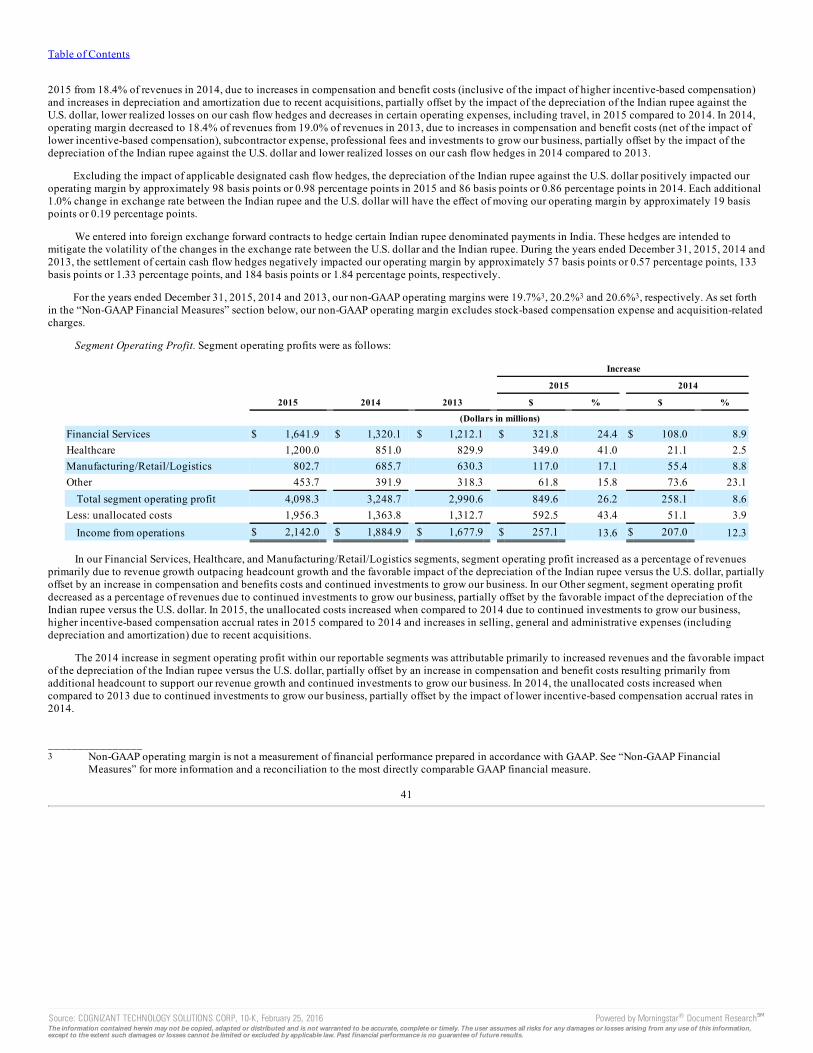
Table of Contents
2015 from 18.4% of revenues in 2014, due to increases in compensation and benefit costs (inclusive of the impact of higher incentive-based compensation)and increases in depreciation and amortization due to recent acquisitions, partially offset by the impact of the depreciation of the Indian rupee against theU.S. dollar, lower realized losses on our cash flow hedges and decreases in certain operating expenses, including travel, in 2015 compared to 2014. In 2014,operating margin decreased to 18.4% of revenues from 19.0% of revenues in 2013, due to increases in compensation and benefit costs (net of the impact oflower incentive-based compensation), subcontractor expense, professional fees and investments to grow our business, partially offset by the impact of thedepreciation of the Indian rupee against the U.S. dollar and lower realized losses on our cash flow hedges in 2014 compared to 2013.
Excluding the impact of applicable designated cash flow hedges, the depreciation of the Indian rupee against the U.S. dollar positively impacted ouroperating margin by approximately 98 basis points or 0.98 percentage points in 2015 and 86 basis points or 0.86 percentage points in 2014. Each additional1.0% change in exchange rate between the Indian rupee and the U.S. dollar will have the effect of moving our operating margin by approximately 19 basispoints or 0.19 percentage points.
We entered into foreign exchange forward contracts to hedge certain Indian rupee denominated payments in India. These hedges are intended tomitigate the volatility of the changes in the exchange rate between the U.S. dollar and the Indian rupee. During the years ended December 31, 2015, 2014 and2013, the settlement of certain cash flow hedges negatively impacted our operating margin by approximately 57 basis points or 0.57 percentage points, 133basis points or 1.33 percentage points, and 184 basis points or 1.84 percentage points, respectively.
For the years ended December 31, 2015, 2014 and 2013, our non-GAAP operating margins were 19.7%3, 20.2%3 and 20.6%3, respectively. As set forthin the “Non-GAAP Financial Measures” section below, our non-GAAP operating margin excludes stock-based compensation expense and acquisition-relatedcharges.
Segment Operating Profit. Segment operating profits were as follows:
Increase
2015 2014
2015 2014 2013 $ % $ %
(Dollars in millions)
Financial Services $ 1,641.9 $ 1,320.1 $ 1,212.1 $ 321.8 24.4 $ 108.0 8.9Healthcare 1,200.0 851.0 829.9 349.0 41.0 21.1 2.5Manufacturing/Retail/Logistics 802.7 685.7 630.3 117.0 17.1 55.4 8.8Other 453.7 391.9 318.3 61.8 15.8 73.6 23.1
Total segment operating profit 4,098.3 3,248.7 2,990.6 849.6 26.2 258.1 8.6Less: unallocated costs 1,956.3 1,363.8 1,312.7 592.5 43.4 51.1 3.9
Income from operations $ 2,142.0 $ 1,884.9 $ 1,677.9 $ 257.1 13.6 $ 207.0 12.3
In our Financial Services, Healthcare, and Manufacturing/Retail/Logistics segments, segment operating profit increased as a percentage of revenuesprimarily due to revenue growth outpacing headcount growth and the favorable impact of the depreciation of the Indian rupee versus the U.S. dollar, partiallyoffset by an increase in compensation and benefits costs and continued investments to grow our business. In our Other segment, segment operating profitdecreased as a percentage of revenues due to continued investments to grow our business, partially offset by the favorable impact of the depreciation of theIndian rupee versus the U.S. dollar. In 2015, the unallocated costs increased when compared to 2014 due to continued investments to grow our business,higher incentive-based compensation accrual rates in 2015 compared to 2014 and increases in selling, general and administrative expenses (includingdepreciation and amortization) due to recent acquisitions.
The 2014 increase in segment operating profit within our reportable segments was attributable primarily to increased revenues and the favorable impactof the depreciation of the Indian rupee versus the U.S. dollar, partially offset by an increase in compensation and benefit costs resulting primarily fromadditional headcount to support our revenue growth and continued investments to grow our business. In 2014, the unallocated costs increased whencompared to 2013 due to continued investments to grow our business, partially offset by the impact of lower incentive-based compensation accrual rates in2014.
________________3 Non-GAAP operating margin is not a measurement of financial performance prepared in accordance with GAAP. See “Non-GAAP Financial
Measures” for more information and a reconciliation to the most directly comparable GAAP financial measure.
41
Source: COGNIZANT TECHNOLOGY SOLUTIONS CORP, 10-K, February 25, 2016 Powered by Morningstar® Document Research℠The information contained herein may not be copied, adapted or distributed and is not warranted to be accurate, complete or timely. The user assumes all risks for any damages or losses arising from any use of this information,except to the extent such damages or losses cannot be limited or excluded by applicable law. Past financial performance is no guarantee of future results.
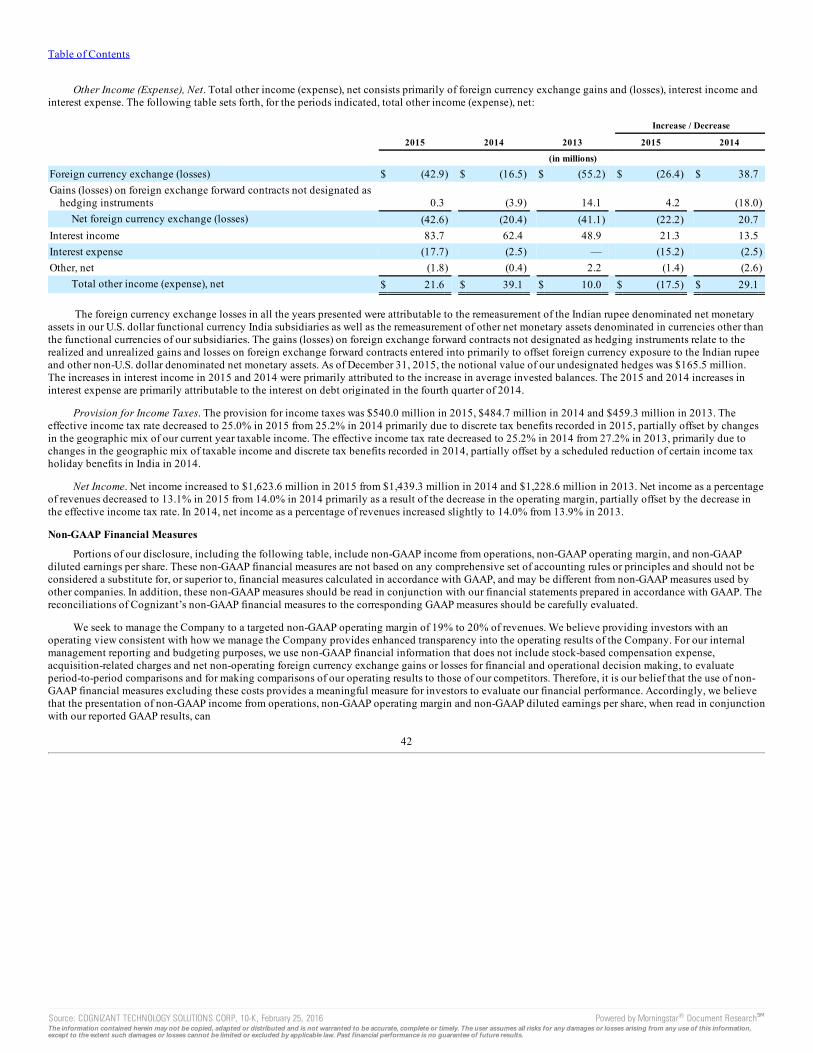
Table of Contents
Other Income (Expense), Net. Total other income (expense), net consists primarily of foreign currency exchange gains and (losses), interest income andinterest expense. The following table sets forth, for the periods indicated, total other income (expense), net:
Increase / Decrease
2015 2014 2013 2015 2014
(in millions)
Foreign currency exchange (losses) $ (42.9) $ (16.5) $ (55.2) $ (26.4) $ 38.7Gains (losses) on foreign exchange forward contracts not designated as
hedging instruments 0.3 (3.9) 14.1 4.2 (18.0)Net foreign currency exchange (losses) (42.6) (20.4) (41.1) (22.2) 20.7
Interest income 83.7 62.4 48.9 21.3 13.5Interest expense (17.7) (2.5) — (15.2) (2.5)Other, net (1.8) (0.4) 2.2 (1.4) (2.6)
Total other income (expense), net $ 21.6 $ 39.1 $ 10.0 $ (17.5) $ 29.1
The foreign currency exchange losses in all the years presented were attributable to the remeasurement of the Indian rupee denominated net monetaryassets in our U.S. dollar functional currency India subsidiaries as well as the remeasurement of other net monetary assets denominated in currencies other thanthe functional currencies of our subsidiaries. The gains (losses) on foreign exchange forward contracts not designated as hedging instruments relate to therealized and unrealized gains and losses on foreign exchange forward contracts entered into primarily to offset foreign currency exposure to the Indian rupeeand other non-U.S. dollar denominated net monetary assets. As of December 31, 2015, the notional value of our undesignated hedges was $165.5 million.The increases in interest income in 2015 and 2014 were primarily attributed to the increase in average invested balances. The 2015 and 2014 increases ininterest expense are primarily attributable to the interest on debt originated in the fourth quarter of 2014.
Provision for Income Taxes. The provision for income taxes was $540.0 million in 2015, $484.7 million in 2014 and $459.3 million in 2013. Theeffective income tax rate decreased to 25.0% in 2015 from 25.2% in 2014 primarily due to discrete tax benefits recorded in 2015, partially offset by changesin the geographic mix of our current year taxable income. The effective income tax rate decreased to 25.2% in 2014 from 27.2% in 2013, primarily due tochanges in the geographic mix of taxable income and discrete tax benefits recorded in 2014, partially offset by a scheduled reduction of certain income taxholiday benefits in India in 2014.
Net Income. Net income increased to $1,623.6 million in 2015 from $1,439.3 million in 2014 and $1,228.6 million in 2013. Net income as a percentageof revenues decreased to 13.1% in 2015 from 14.0% in 2014 primarily as a result of the decrease in the operating margin, partially offset by the decrease inthe effective income tax rate. In 2014, net income as a percentage of revenues increased slightly to 14.0% from 13.9% in 2013.
Non-GAAP Financial Measures
Portions of our disclosure, including the following table, include non-GAAP income from operations, non-GAAP operating margin, and non-GAAPdiluted earnings per share. These non-GAAP financial measures are not based on any comprehensive set of accounting rules or principles and should not beconsidered a substitute for, or superior to, financial measures calculated in accordance with GAAP, and may be different from non-GAAP measures used byother companies. In addition, these non-GAAP measures should be read in conjunction with our financial statements prepared in accordance with GAAP. Thereconciliations of Cognizant’s non-GAAP financial measures to the corresponding GAAP measures should be carefully evaluated.
We seek to manage the Company to a targeted non-GAAP operating margin of 19% to 20% of revenues. We believe providing investors with anoperating view consistent with how we manage the Company provides enhanced transparency into the operating results of the Company. For our internalmanagement reporting and budgeting purposes, we use non-GAAP financial information that does not include stock-based compensation expense,acquisition-related charges and net non-operating foreign currency exchange gains or losses for financial and operational decision making, to evaluateperiod-to-period comparisons and for making comparisons of our operating results to those of our competitors. Therefore, it is our belief that the use of non-GAAP financial measures excluding these costs provides a meaningful measure for investors to evaluate our financial performance. Accordingly, we believethat the presentation of non-GAAP income from operations, non-GAAP operating margin and non-GAAP diluted earnings per share, when read in conjunctionwith our reported GAAP results, can
42
Source: COGNIZANT TECHNOLOGY SOLUTIONS CORP, 10-K, February 25, 2016 Powered by Morningstar® Document Research℠The information contained herein may not be copied, adapted or distributed and is not warranted to be accurate, complete or timely. The user assumes all risks for any damages or losses arising from any use of this information,except to the extent such damages or losses cannot be limited or excluded by applicable law. Past financial performance is no guarantee of future results.
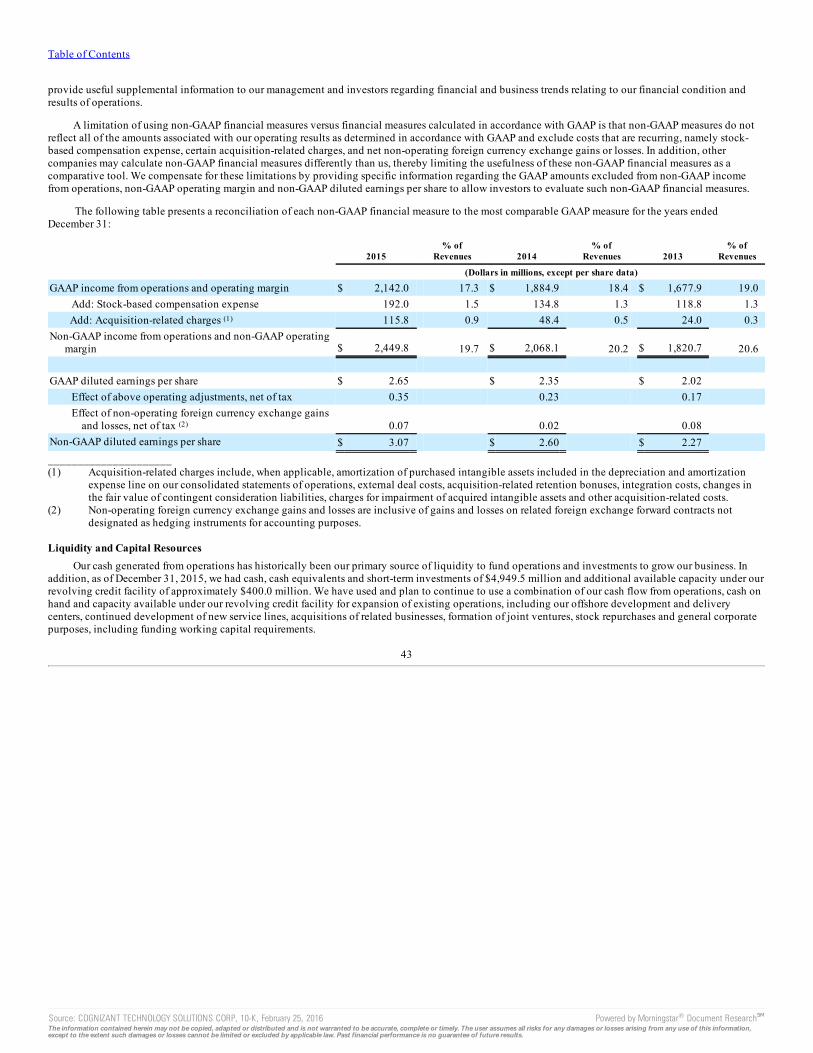
Table of Contents
provide useful supplemental information to our management and investors regarding financial and business trends relating to our financial condition andresults of operations.
A limitation of using non-GAAP financial measures versus financial measures calculated in accordance with GAAP is that non-GAAP measures do notreflect all of the amounts associated with our operating results as determined in accordance with GAAP and exclude costs that are recurring, namely stock-based compensation expense, certain acquisition-related charges, and net non-operating foreign currency exchange gains or losses. In addition, othercompanies may calculate non-GAAP financial measures differently than us, thereby limiting the usefulness of these non-GAAP financial measures as acomparative tool. We compensate for these limitations by providing specific information regarding the GAAP amounts excluded from non-GAAP incomefrom operations, non-GAAP operating margin and non-GAAP diluted earnings per share to allow investors to evaluate such non-GAAP financial measures.
The following table presents a reconciliation of each non-GAAP financial measure to the most comparable GAAP measure for the years endedDecember 31:
2015 % of
Revenues 2014 % of
Revenues 2013% of
Revenues
(Dollars in millions, except per share data)
GAAP income from operations and operating margin $ 2,142.0 17.3 $ 1,884.9 18.4 $ 1,677.9 19.0Add: Stock-based compensation expense 192.0 1.5 134.8 1.3 118.8 1.3Add: Acquisition-related charges (1) 115.8 0.9 48.4 0.5 24.0 0.3
Non-GAAP income from operations and non-GAAP operatingmargin $ 2,449.8 19.7 $ 2,068.1 20.2 $ 1,820.7 20.6
GAAP diluted earnings per share $ 2.65 $ 2.35 $ 2.02
Effect of above operating adjustments, net of tax 0.35 0.23 0.17 Effect of non-operating foreign currency exchange gains
and losses, net of tax (2) 0.07 0.02 0.08 Non-GAAP diluted earnings per share $ 3.07 $ 2.60 $ 2.27 _____________________(1) Acquisition-related charges include, when applicable, amortization of purchased intangible assets included in the depreciation and amortization
expense line on our consolidated statements of operations, external deal costs, acquisition-related retention bonuses, integration costs, changes inthe fair value of contingent consideration liabilities, charges for impairment of acquired intangible assets and other acquisition-related costs.
(2) Non-operating foreign currency exchange gains and losses are inclusive of gains and losses on related foreign exchange forward contracts notdesignated as hedging instruments for accounting purposes.
Liquidity and Capital ResourcesOur cash generated from operations has historically been our primary source of liquidity to fund operations and investments to grow our business. In
addition, as of December 31, 2015, we had cash, cash equivalents and short-term investments of $4,949.5 million and additional available capacity under ourrevolving credit facility of approximately $400.0 million. We have used and plan to continue to use a combination of our cash flow from operations, cash onhand and capacity available under our revolving credit facility for expansion of existing operations, including our offshore development and deliverycenters, continued development of new service lines, acquisitions of related businesses, formation of joint ventures, stock repurchases and general corporatepurposes, including funding working capital requirements.
43
Source: COGNIZANT TECHNOLOGY SOLUTIONS CORP, 10-K, February 25, 2016 Powered by Morningstar® Document Research℠The information contained herein may not be copied, adapted or distributed and is not warranted to be accurate, complete or timely. The user assumes all risks for any damages or losses arising from any use of this information,except to the extent such damages or losses cannot be limited or excluded by applicable law. Past financial performance is no guarantee of future results.
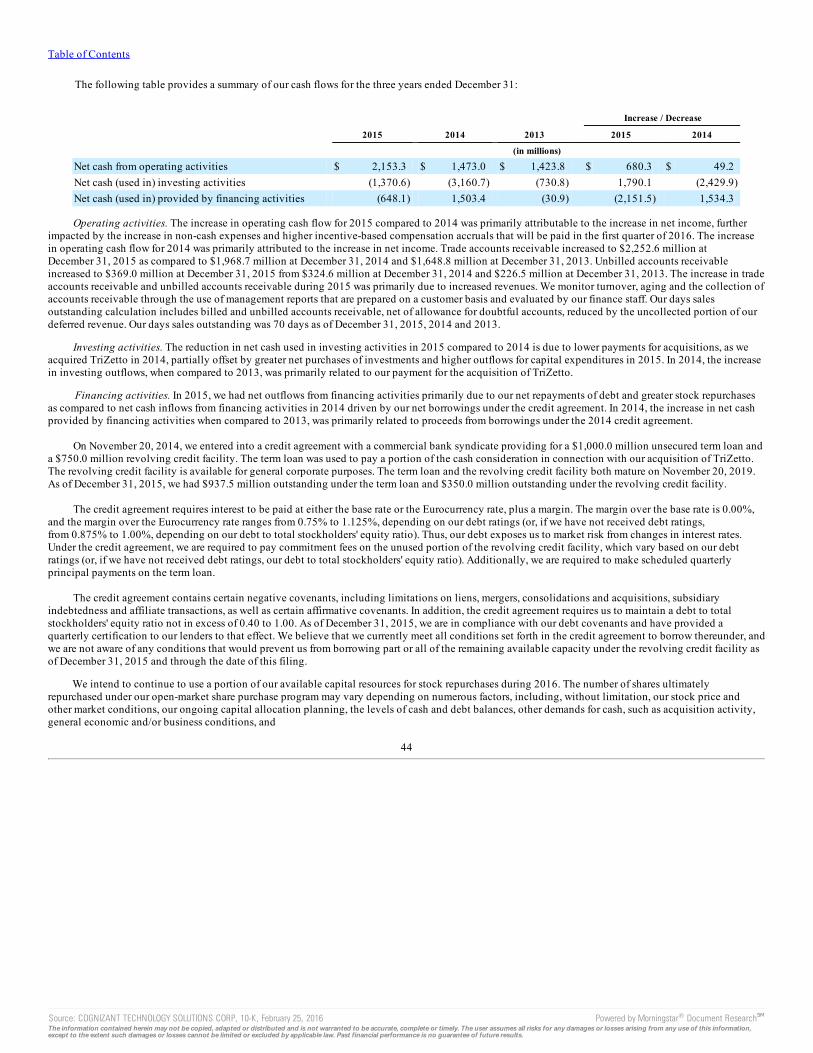
Table of Contents
The following table provides a summary of our cash flows for the three years ended December 31:
Increase / Decrease
2015 2014 2013 2015 2014
(in millions)
Net cash from operating activities $ 2,153.3 $ 1,473.0 $ 1,423.8 $ 680.3 $ 49.2Net cash (used in) investing activities (1,370.6) (3,160.7) (730.8) 1,790.1 (2,429.9)Net cash (used in) provided by financing activities (648.1) 1,503.4 (30.9) (2,151.5) 1,534.3
Operating activities. The increase in operating cash flow for 2015 compared to 2014 was primarily attributable to the increase in net income, furtherimpacted by the increase in non-cash expenses and higher incentive-based compensation accruals that will be paid in the first quarter of 2016. The increasein operating cash flow for 2014 was primarily attributed to the increase in net income. Trade accounts receivable increased to $2,252.6 million atDecember 31, 2015 as compared to $1,968.7 million at December 31, 2014 and $1,648.8 million at December 31, 2013. Unbilled accounts receivableincreased to $369.0 million at December 31, 2015 from $324.6 million at December 31, 2014 and $226.5 million at December 31, 2013. The increase in tradeaccounts receivable and unbilled accounts receivable during 2015 was primarily due to increased revenues. We monitor turnover, aging and the collection ofaccounts receivable through the use of management reports that are prepared on a customer basis and evaluated by our finance staff. Our days salesoutstanding calculation includes billed and unbilled accounts receivable, net of allowance for doubtful accounts, reduced by the uncollected portion of ourdeferred revenue. Our days sales outstanding was 70 days as of December 31, 2015, 2014 and 2013.
Investing activities. The reduction in net cash used in investing activities in 2015 compared to 2014 is due to lower payments for acquisitions, as weacquired TriZetto in 2014, partially offset by greater net purchases of investments and higher outflows for capital expenditures in 2015. In 2014, the increasein investing outflows, when compared to 2013, was primarily related to our payment for the acquisition of TriZetto.
Financing activities. In 2015, we had net outflows from financing activities primarily due to our net repayments of debt and greater stock repurchasesas compared to net cash inflows from financing activities in 2014 driven by our net borrowings under the credit agreement. In 2014, the increase in net cashprovided by financing activities when compared to 2013, was primarily related to proceeds from borrowings under the 2014 credit agreement.
On November 20, 2014, we entered into a credit agreement with a commercial bank syndicate providing for a $1,000.0 million unsecured term loan anda $750.0 million revolving credit facility. The term loan was used to pay a portion of the cash consideration in connection with our acquisition of TriZetto.The revolving credit facility is available for general corporate purposes. The term loan and the revolving credit facility both mature on November 20, 2019.As of December 31, 2015, we had $937.5 million outstanding under the term loan and $350.0 million outstanding under the revolving credit facility.
The credit agreement requires interest to be paid at either the base rate or the Eurocurrency rate, plus a margin. The margin over the base rate is 0.00%,and the margin over the Eurocurrency rate ranges from 0.75% to 1.125%, depending on our debt ratings (or, if we have not received debt ratings,from 0.875% to 1.00%, depending on our debt to total stockholders' equity ratio). Thus, our debt exposes us to market risk from changes in interest rates.Under the credit agreement, we are required to pay commitment fees on the unused portion of the revolving credit facility, which vary based on our debtratings (or, if we have not received debt ratings, our debt to total stockholders' equity ratio). Additionally, we are required to make scheduled quarterlyprincipal payments on the term loan.
The credit agreement contains certain negative covenants, including limitations on liens, mergers, consolidations and acquisitions, subsidiaryindebtedness and affiliate transactions, as well as certain affirmative covenants. In addition, the credit agreement requires us to maintain a debt to totalstockholders' equity ratio not in excess of 0.40 to 1.00. As of December 31, 2015, we are in compliance with our debt covenants and have provided aquarterly certification to our lenders to that effect. We believe that we currently meet all conditions set forth in the credit agreement to borrow thereunder, andwe are not aware of any conditions that would prevent us from borrowing part or all of the remaining available capacity under the revolving credit facility asof December 31, 2015 and through the date of this filing.
We intend to continue to use a portion of our available capital resources for stock repurchases during 2016. The number of shares ultimatelyrepurchased under our open-market share purchase program may vary depending on numerous factors, including, without limitation, our stock price andother market conditions, our ongoing capital allocation planning, the levels of cash and debt balances, other demands for cash, such as acquisition activity,general economic and/or business conditions, and
44
Source: COGNIZANT TECHNOLOGY SOLUTIONS CORP, 10-K, February 25, 2016 Powered by Morningstar® Document Research℠The information contained herein may not be copied, adapted or distributed and is not warranted to be accurate, complete or timely. The user assumes all risks for any damages or losses arising from any use of this information,except to the extent such damages or losses cannot be limited or excluded by applicable law. Past financial performance is no guarantee of future results.
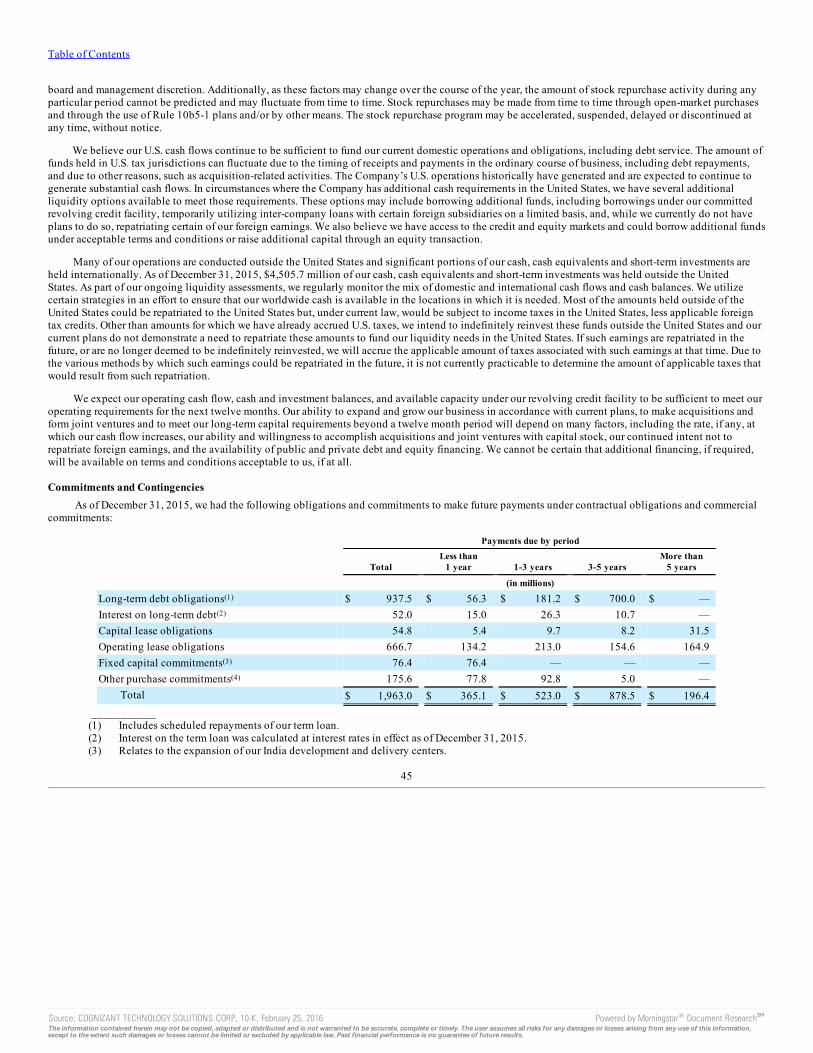
Table of Contents
board and management discretion. Additionally, as these factors may change over the course of the year, the amount of stock repurchase activity during anyparticular period cannot be predicted and may fluctuate from time to time. Stock repurchases may be made from time to time through open-market purchasesand through the use of Rule 10b5-1 plans and/or by other means. The stock repurchase program may be accelerated, suspended, delayed or discontinued atany time, without notice.
We believe our U.S. cash flows continue to be sufficient to fund our current domestic operations and obligations, including debt service. The amount offunds held in U.S. tax jurisdictions can fluctuate due to the timing of receipts and payments in the ordinary course of business, including debt repayments,and due to other reasons, such as acquisition-related activities. The Company’s U.S. operations historically have generated and are expected to continue togenerate substantial cash flows. In circumstances where the Company has additional cash requirements in the United States, we have several additionalliquidity options available to meet those requirements. These options may include borrowing additional funds, including borrowings under our committedrevolving credit facility, temporarily utilizing inter-company loans with certain foreign subsidiaries on a limited basis, and, while we currently do not haveplans to do so, repatriating certain of our foreign earnings. We also believe we have access to the credit and equity markets and could borrow additional fundsunder acceptable terms and conditions or raise additional capital through an equity transaction.
Many of our operations are conducted outside the United States and significant portions of our cash, cash equivalents and short-term investments areheld internationally. As of December 31, 2015, $4,505.7 million of our cash, cash equivalents and short-term investments was held outside the UnitedStates. As part of our ongoing liquidity assessments, we regularly monitor the mix of domestic and international cash flows and cash balances. We utilizecertain strategies in an effort to ensure that our worldwide cash is available in the locations in which it is needed. Most of the amounts held outside of theUnited States could be repatriated to the United States but, under current law, would be subject to income taxes in the United States, less applicable foreigntax credits. Other than amounts for which we have already accrued U.S. taxes, we intend to indefinitely reinvest these funds outside the United States and ourcurrent plans do not demonstrate a need to repatriate these amounts to fund our liquidity needs in the United States. If such earnings are repatriated in thefuture, or are no longer deemed to be indefinitely reinvested, we will accrue the applicable amount of taxes associated with such earnings at that time. Due tothe various methods by which such earnings could be repatriated in the future, it is not currently practicable to determine the amount of applicable taxes thatwould result from such repatriation.
We expect our operating cash flow, cash and investment balances, and available capacity under our revolving credit facility to be sufficient to meet ouroperating requirements for the next twelve months. Our ability to expand and grow our business in accordance with current plans, to make acquisitions andform joint ventures and to meet our long-term capital requirements beyond a twelve month period will depend on many factors, including the rate, if any, atwhich our cash flow increases, our ability and willingness to accomplish acquisitions and joint ventures with capital stock, our continued intent not torepatriate foreign earnings, and the availability of public and private debt and equity financing. We cannot be certain that additional financing, if required,will be available on terms and conditions acceptable to us, if at all.
Commitments and ContingenciesAs of December 31, 2015, we had the following obligations and commitments to make future payments under contractual obligations and commercial
commitments:
Payments due by period
Total Less than
1 year 1-3 years 3-5 years More than
5 years
(in millions)
Long-term debt obligations(1) $ 937.5 $ 56.3 $ 181.2 $ 700.0 $ —Interest on long-term debt(2) 52.0 15.0 26.3 10.7 —Capital lease obligations 54.8 5.4 9.7 8.2 31.5Operating lease obligations 666.7 134.2 213.0 154.6 164.9Fixed capital commitments(3) 76.4 76.4 — — —Other purchase commitments(4) 175.6 77.8 92.8 5.0 —
Total $ 1,963.0 $ 365.1 $ 523.0 $ 878.5 $ 196.4 ___________(1) Includes scheduled repayments of our term loan.(2) Interest on the term loan was calculated at interest rates in effect as of December 31, 2015.(3) Relates to the expansion of our India development and delivery centers.
45
Source: COGNIZANT TECHNOLOGY SOLUTIONS CORP, 10-K, February 25, 2016 Powered by Morningstar® Document Research℠The information contained herein may not be copied, adapted or distributed and is not warranted to be accurate, complete or timely. The user assumes all risks for any damages or losses arising from any use of this information,except to the extent such damages or losses cannot be limited or excluded by applicable law. Past financial performance is no guarantee of future results.
Table of Contents
(4) Other purchase commitments include, among other things, communications and information technology obligations, as well as otherobligations in the ordinary course of business that we cannot cancel or where we would be required to pay a termination fee in the event ofcancellation.
As of December 31, 2015, we had $138.7 million of unrecognized tax benefits. This represents the tax benefits associated with certain tax positions onour domestic and international tax returns that have not been recognized on our financial statements due to uncertainty regarding their resolution. Theresolution of these income tax positions with the relevant taxing authorities is at various stages and therefore we are unable to make a reliable estimate of theeventual cash flows by period that may be required to settle these matters.
We have entered into a series of foreign exchange forward contracts that are designated as cash flow hedges of certain Indian rupee denominatedpayments in India. As of December 31, 2015, these contracts were in a net unrealized loss position of $14.4 million and have settlement dates in 2016, 2017and 2018. The actual amounts at which these contracts will be settled may be significantly impacted by fluctuations in the Indian rupee to U.S. dollar foreigncurrency exchange rate prior to settlement. Therefore, we are unable to make a reliable estimate of the eventual cash flows by period related to the settlementof these foreign exchange forward contracts.
We are involved in various claims and legal actions arising in the ordinary course of business. We accrue a liability when a loss is considered probableand the amount can be reasonably estimated. In the opinion of management, the outcome of any existing claims and legal or regulatory proceedings, ifdecided adversely, is not expected to have a material adverse effect on our business, financial condition, results of operations and cash flows. Additionally,many of our engagements involve projects that are critical to the operations of our customers’ business and provide benefits that are difficult to quantify. Anyfailure in a customer’s systems or our failure to meet our contractual obligations to our clients, including any breach involving a customer’s confidentialinformation or sensitive data, or our obligations under applicable laws or regulations could result in a claim for substantial damages against us, regardless ofour responsibility for such failure. Although we attempt to contractually limit our liability for damages arising from negligent acts, errors, mistakes, oromissions in rendering our services, there can be no assurance that the limitations of liability set forth in our contracts will be enforceable in all instances orwill otherwise protect us from liability for damages. Although we have general liability insurance coverage, including coverage for errors or omissions, therecan be no assurance that such coverage will cover all types of claims, continue to be available on reasonable terms or will be available in sufficient amountsto cover one or more large claims, or that the insurer will not disclaim coverage as to any future claim. The successful assertion of one or more large claimsagainst us that exceed or are not covered by our insurance coverage or changes in our insurance policies, including premium increases or the imposition oflarge deductible or co-insurance requirements, could have a material adverse effect on our business, results of operations, financial condition and cash flows.
Foreign Currency RiskOverall, we believe that we have limited revenue risk resulting from movement in foreign currency exchange rates as 78.6% of our revenues during
2015 were generated from customers located in North America. Revenue from our customers in the United Kingdom, Rest of Europe and Rest of Worldrepresented 9.6%, 6.6% and 5.2%, respectively, of our 2015 revenues. Accordingly, our operating results outside the United States may be affected byfluctuations in the exchange rates, primarily the British pound and the Euro, as compared to the U.S. dollar.
A portion of our costs in India, representing approximately 23.5% of our global operating costs during 2015, are denominated in the Indian rupee andare subject to foreign currency exchange rate fluctuations. These foreign currency exchange rate fluctuations have an impact on our results of operations. Inaddition, a portion of our balance sheet is exposed to foreign currency exchange rate fluctuations, which may result in non-operating foreign currencyexchange gains or losses upon remeasurement. In 2015, we reported foreign currency exchange losses, exclusive of hedging gains or losses, of approximately$42.9 million, which were attributable to the remeasurement of the Indian rupee denominated net monetary assets in our U.S. dollar functional currency Indiasubsidiaries as well as the remeasurement of other net monetary assets denominated in currencies other than the functional currencies of our subsidiaries. Onan ongoing basis, we manage a portion of this risk by limiting our net monetary asset exposure to certain currencies, primarily the Indian rupee, in our foreignsubsidiaries.
46
Source: COGNIZANT TECHNOLOGY SOLUTIONS CORP, 10-K, February 25, 2016 Powered by Morningstar® Document Research℠The information contained herein may not be copied, adapted or distributed and is not warranted to be accurate, complete or timely. The user assumes all risks for any damages or losses arising from any use of this information,except to the extent such damages or losses cannot be limited or excluded by applicable law. Past financial performance is no guarantee of future results.
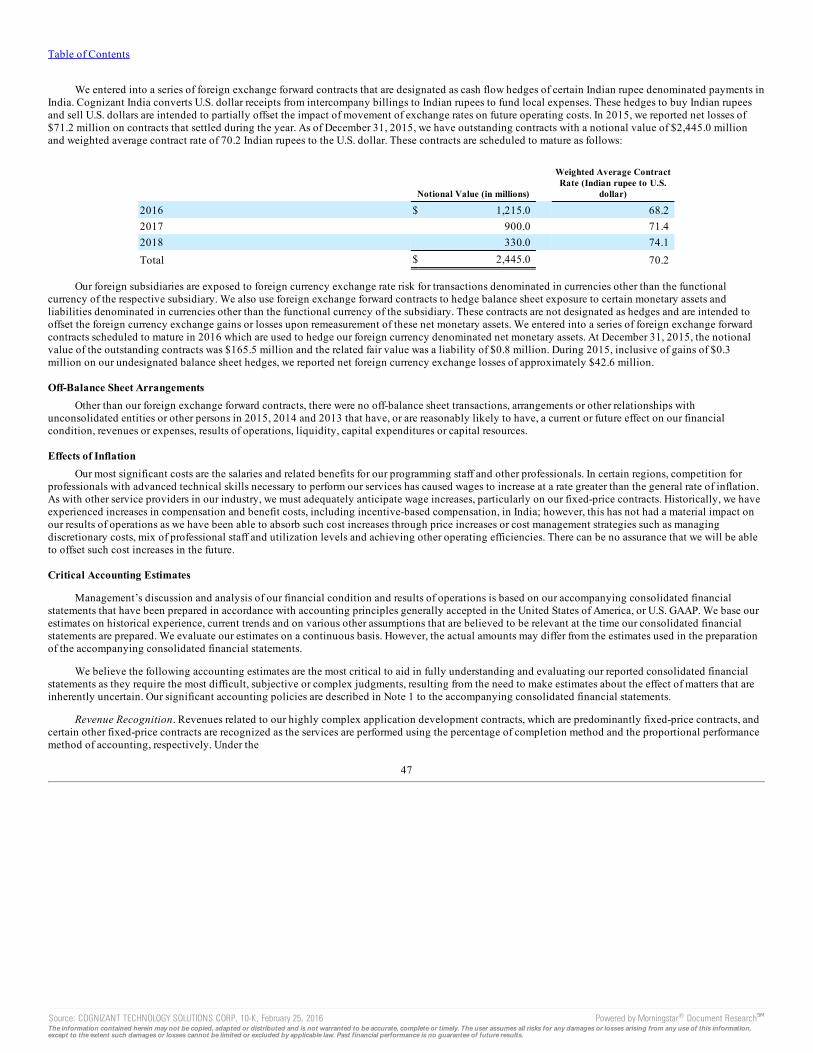
Table of Contents
We entered into a series of foreign exchange forward contracts that are designated as cash flow hedges of certain Indian rupee denominated payments inIndia. Cognizant India converts U.S. dollar receipts from intercompany billings to Indian rupees to fund local expenses. These hedges to buy Indian rupeesand sell U.S. dollars are intended to partially offset the impact of movement of exchange rates on future operating costs. In 2015, we reported net losses of$71.2 million on contracts that settled during the year. As of December 31, 2015, we have outstanding contracts with a notional value of $2,445.0 millionand weighted average contract rate of 70.2 Indian rupees to the U.S. dollar. These contracts are scheduled to mature as follows:
Notional Value (in millions)
Weighted Average ContractRate (Indian rupee to U.S.
dollar)
2016 $ 1,215.0 68.22017 900.0 71.42018 330.0 74.1Total $ 2,445.0 70.2
Our foreign subsidiaries are exposed to foreign currency exchange rate risk for transactions denominated in currencies other than the functionalcurrency of the respective subsidiary. We also use foreign exchange forward contracts to hedge balance sheet exposure to certain monetary assets andliabilities denominated in currencies other than the functional currency of the subsidiary. These contracts are not designated as hedges and are intended tooffset the foreign currency exchange gains or losses upon remeasurement of these net monetary assets. We entered into a series of foreign exchange forwardcontracts scheduled to mature in 2016 which are used to hedge our foreign currency denominated net monetary assets. At December 31, 2015, the notionalvalue of the outstanding contracts was $165.5 million and the related fair value was a liability of $0.8 million. During 2015, inclusive of gains of $0.3million on our undesignated balance sheet hedges, we reported net foreign currency exchange losses of approximately $42.6 million.
Off-Balance Sheet ArrangementsOther than our foreign exchange forward contracts, there were no off-balance sheet transactions, arrangements or other relationships with
unconsolidated entities or other persons in 2015, 2014 and 2013 that have, or are reasonably likely to have, a current or future effect on our financialcondition, revenues or expenses, results of operations, liquidity, capital expenditures or capital resources.
Effects of InflationOur most significant costs are the salaries and related benefits for our programming staff and other professionals. In certain regions, competition for
professionals with advanced technical skills necessary to perform our services has caused wages to increase at a rate greater than the general rate of inflation.As with other service providers in our industry, we must adequately anticipate wage increases, particularly on our fixed-price contracts. Historically, we haveexperienced increases in compensation and benefit costs, including incentive-based compensation, in India; however, this has not had a material impact onour results of operations as we have been able to absorb such cost increases through price increases or cost management strategies such as managingdiscretionary costs, mix of professional staff and utilization levels and achieving other operating efficiencies. There can be no assurance that we will be ableto offset such cost increases in the future.
Critical Accounting Estimates
Management’s discussion and analysis of our financial condition and results of operations is based on our accompanying consolidated financialstatements that have been prepared in accordance with accounting principles generally accepted in the United States of America, or U.S. GAAP. We base ourestimates on historical experience, current trends and on various other assumptions that are believed to be relevant at the time our consolidated financialstatements are prepared. We evaluate our estimates on a continuous basis. However, the actual amounts may differ from the estimates used in the preparationof the accompanying consolidated financial statements.
We believe the following accounting estimates are the most critical to aid in fully understanding and evaluating our reported consolidated financialstatements as they require the most difficult, subjective or complex judgments, resulting from the need to make estimates about the effect of matters that areinherently uncertain. Our significant accounting policies are described in Note 1 to the accompanying consolidated financial statements.
Revenue Recognition. Revenues related to our highly complex application development contracts, which are predominantly fixed-price contracts, andcertain other fixed-price contracts are recognized as the services are performed using the percentage of completion method and the proportional performancemethod of accounting, respectively. Under the
47
Source: COGNIZANT TECHNOLOGY SOLUTIONS CORP, 10-K, February 25, 2016 Powered by Morningstar® Document Research℠The information contained herein may not be copied, adapted or distributed and is not warranted to be accurate, complete or timely. The user assumes all risks for any damages or losses arising from any use of this information,except to the extent such damages or losses cannot be limited or excluded by applicable law. Past financial performance is no guarantee of future results.
Table of Contents
percentage of completion method, total contract revenue during the term of an agreement is recognized based on the percentage that each contract’s totallabor cost to date bears to the total expected labor cost (cost to cost method). Under the proportional performance method, total contract revenue isrecognized based on the level of effort to date in relation to total expected efforts provided to the customer. Management reviews the assumptions related tothese methods on an ongoing basis. Revisions to our estimates may result in increases or decreases to revenues and income and are reflected in theconsolidated financial statements in the periods in which they are first identified. If our estimates indicate that a contract loss will be incurred, a lossprovision is recorded in the period in which the loss first becomes probable and reasonably estimable. Contract losses are determined to be the amount bywhich the estimated costs of the contract exceed the estimated total revenues that will be generated by the contract and such losses are included in cost ofrevenues in our consolidated statement of operations. Changes in estimates related to our revenue contracts and contract losses were immaterial for theperiods presented.
Allowance for Doubtful Accounts. We maintain an allowance for doubtful accounts for estimated losses resulting from the inability of our customers tomake required payments. We estimate an allowance for doubtful accounts by evaluating the financial condition and relative credit-worthiness of eachcustomer, historical collections experience and other information, including the aging of the receivables.
Income Taxes. Determining the consolidated provision for income tax expense, deferred income tax assets (and related valuation allowance, if any) andliabilities requires significant judgment. We are required to calculate and provide for income taxes in each of the jurisdictions where we operate. Changes inthe geographic mix of income before taxes or estimated level of annual pre-tax income can affect our overall effective income tax rate. The consolidatedprovision for income taxes may also change period to period based on non-recurring events, such as the settlement of income tax audits and changes in taxlaws, regulations, or accounting principles.
Our provision for income taxes also includes the impact of reserves established for uncertain income tax positions, as well as the related interest, whichmay require us to apply judgment to complex issues and may require an extended period of time to resolve. Although we believe we have adequatelyreserved for our uncertain tax positions, no assurance can be given that the final outcome of these matters will not differ from our recorded amounts. Weadjust these reserves in light of changing facts and circumstances, such as the closing of a tax audit. To the extent that the final outcome of these mattersdiffers from the amounts recorded, such differences will impact the provision for income taxes in the period in which such determination is made.
Significant judgment is also required in determining any valuation allowance recorded against deferred income tax assets. In assessing the need for avaluation allowance, we consider all available evidence for each jurisdiction including past operating results, estimates of future taxable income and thefeasibility of tax planning strategies. If it is determined that it is more likely than not that future tax benefits associated with a deferred income tax asset willnot be realized, a valuation allowance is provided. In the event we change our determination as to the amount of deferred income tax assets that can berealized, we will adjust the valuation allowance with a corresponding impact recorded to our provision for income taxes in the period in which suchdetermination is made.
Our Indian subsidiaries, collectively referred to as Cognizant India, are primarily export-oriented companies and are eligible for certain income taxholiday benefits granted by the government of India for export activities conducted within SEZs for periods of up to 15 years. A majority of our SEZ incometax holiday benefits are currently scheduled to expire in whole or in part during the years 2016 to 2025 and may be extended on a limited basis for anadditional five years per unit if certain reinvestment criteria are met. We have constructed and expect to continue to operate most of our newer developmentfacilities in SEZs. Our Indian profits ineligible for SEZ benefits are subject to corporate income tax at the rate of 34.6%. In addition, all Indian profits,including those generated within SEZs, are subject to the MAT, at the rate of 21.3%. Any MAT paid is creditable against future Indian corporate income tax,subject to limitations. Currently, we anticipate utilizing our existing MAT balances against our future corporate income tax obligations in India. However,our ability to do so could be impacted by possible changes to the Indian tax laws as well as the future financial results of Cognizant India. Additionally, theIndian government recently announced a proposal which includes, among other items, phasing out of certain tax exemptions and deductions,discontinuation of tax holidays for new SEZs commencing activity from April 1, 2017, and a phased reduction of the current Indian corporate income taxrate. Upon enactment, we will evaluate the impact of these proposals on our effective income tax rate.
Stock-Based Compensation. Stock-based compensation cost is measured at the grant date fair value of the award and is recognized as expense over thevesting period. Determining the fair value of stock-based awards at the grant date requires judgment, including estimating the expected term over which thestock awards will be outstanding before they are exercised, the expected volatility of our stock and the number of stock-based awards that are expected to beforfeited. In addition, for performance stock units, we are required to estimate the most probable outcome of the performance conditions in order to
48
Source: COGNIZANT TECHNOLOGY SOLUTIONS CORP, 10-K, February 25, 2016 Powered by Morningstar® Document Research℠The information contained herein may not be copied, adapted or distributed and is not warranted to be accurate, complete or timely. The user assumes all risks for any damages or losses arising from any use of this information,except to the extent such damages or losses cannot be limited or excluded by applicable law. Past financial performance is no guarantee of future results.
Table of Contents
determine the amount of stock compensation costs to be recorded over the vesting period. To the extent that actual results differ significantly from ourestimates, stock-based compensation expense and our results of operations could be materially impacted.
Derivative Financial Instruments. Derivative financial instruments are accounted for in accordance with the authoritative guidance which requires thateach derivative instrument be recorded on the balance sheet as either an asset or liability measured at its fair value as of the reporting date. Our derivativefinancial instruments consist of foreign exchange forward contracts. We estimate the fair value of each foreign exchange forward contract by using a presentvalue of expected cash flows model. This model utilizes various assumptions, including, but not limited to timing and amounts of cash flows, discount rates,and credit risk factors. The use of different assumptions could have a positive or negative effect on our results of operations and financial condition.
Investments. Our investment portfolio is comprised primarily of time deposits, mutual funds invested in fixed income securities and U.S. dollardenominated corporate bonds, municipal bonds, certificates of deposit, commercial paper, debt issuances by the U.S. government, U.S. government agencies,foreign governments and supranational entities and asset-backed securities. The asset-backed securities included Government National MortgageAssociation (GNMA) mortgage backed securities and securities backed by auto loans, credit card receivables, and other receivables. The years of issuance ofour asset-backed securities fall in the 2005 to 2015 range.
We utilize various inputs to determine the fair value of our investment portfolio. To the extent they exist, unadjusted quoted market prices for identicalassets in active markets (Level 1) or quoted prices on similar assets (Level 2) are utilized to determine the fair value of each investment in our portfolio. In theabsence of quoted prices or liquid markets, valuation techniques would be used to determine fair value of any investments that require inputs that are bothsignificant to the fair value measurement and unobservable (Level 3). Valuation techniques are based on various assumptions, including, but not limited totiming and amounts of cash flows, discount rates, rate of return, and adjustments for nonperformance and liquidity. A significant degree of judgment isinvolved in valuing investments using Level 3 inputs. The use of different assumptions could have a positive or negative effect on our results of operationsand financial condition. See Note 10 to our consolidated financial statements for additional information related to our security valuation methodologies.
We periodically evaluate if unrealized losses, as determined based on the security valuation methodologies discussed above, on individual securitiesclassified as available-for-sale in the investment portfolio are considered to be other-than-temporary. The analysis of other-than-temporary impairmentrequires the use of various assumptions, including, but not limited to, the length of time an investment’s book value is greater than fair value, the severity ofthe investment’s decline, any credit deterioration of the investment, whether management intends to sell the security and whether it is more likely than notthat we will be required to sell the security prior to recovery of its amortized cost basis. Once a decline in fair value is determined to be other-than-temporary,an impairment charge is generally recorded to income and a new cost basis in the investment is established.
Business Combinations. Accounting for business combinations requires the use of significant estimates and assumptions. We account for businesscombinations using the acquisition method which requires us to estimate the fair value of identifiable assets acquired, liabilities assumed and anynoncontrolling interest in the acquiree to properly allocate purchase price consideration to the individual assets acquired and liabilities assumed. Theallocation of the purchase price utilizes significant estimates in determining the fair values of identifiable assets acquired and liabilities assumed, especiallywith respect to intangible assets. The significant estimates and assumptions include, but are not limited to, the timing and amount of future revenue and cashflows based on, among other things, anticipated growth rates and customer attrition rates and the discount rate reflecting the risk inherent in future cash flowsas well as the determination of useful lives for finite-lived assets.
Long-lived Assets and Finite-lived Intangibles. We review long-lived assets and certain finite-lived identifiable intangibles for impairment wheneverevents or changes in circumstances indicate that the carrying amount of an asset may not be recoverable. We recognize an impairment loss when the sum ofthe undiscounted expected future cash flows is less than the carrying amount of such assets. The impairment loss would equal the amount by which thecarrying amount of the asset exceeds the fair value of the asset. Assessing the fair value of assets involves significant estimates and assumptions includingestimation of future cash flows, the timing of such cash flows and discount rates reflecting the risk inherent in future cash flows. If such assets weredetermined to be impaired, it could have a material adverse effect on our business, results of operations and financial condition.
Goodwill and Indefinite-lived Intangibles. We allocate goodwill to reporting units based on the reporting unit expected to benefit from the businesscombination. Reporting units are our operating segments or one level below the operating segments. Goodwill is tested for impairment at the reporting unitlevel on an annual basis and between annual tests if an event occurs or circumstances change that would more likely than not reduce the fair value of areporting unit below its carrying value. These events or circumstances could include a significant change in the business climate, regulatory environment,established
49
Source: COGNIZANT TECHNOLOGY SOLUTIONS CORP, 10-K, February 25, 2016 Powered by Morningstar® Document Research℠The information contained herein may not be copied, adapted or distributed and is not warranted to be accurate, complete or timely. The user assumes all risks for any damages or losses arising from any use of this information,except to the extent such damages or losses cannot be limited or excluded by applicable law. Past financial performance is no guarantee of future results.
Table of Contents
business plans, operating performance indicators or competition. Evaluation of goodwill for impairment requires judgment, including the identification ofreporting units, assignment of assets, liabilities and goodwill to reporting units and determination of the fair value of each reporting unit.
We estimate the fair value of our reporting units using a combination of an income approach, utilizing a discounted cash flow analysis, and a marketapproach, using market multiples. Under the income approach, we need to estimate projected future cash flows, the timing of such cash flows and long termgrowth rates, and determine the appropriate discount rate that reflects the risk inherent in the projected future cash flows. The discount rate used is based onour weighted-average cost of capital and may be adjusted for the relevant risk associated with business-specific characteristics and the uncertainty related tothe reporting unit’s ability to execute on the projected future cash flows. Under the market approach, we estimate fair value based on market multiples ofrevenue and earnings derived from comparable publicly-traded companies with characteristics similar to the reporting unit.
The estimates used to calculate the fair value of a reporting unit change from year to year based on operating results, market conditions, and otherfactors. Changes in these estimates and assumptions could materially affect the determination of fair value for each reporting unit.
We also evaluate indefinite-lived intangible assets for impairment at least annually, or as circumstances warrant. Our 2015 qualitative assessmentincluded the review of relevant macroeconomic factors and entity-specific qualitative factors to determine if it was more-likely-than-not that the fair value ofour indefinite-lived intangible assets was below carrying value.
Based on our most recent evaluation of goodwill and indefinite-lived intangible assets, which was performed as of December 31, 2015, none of ourreporting units or indefinite-lived intangible assets was considered to be at risk of impairment. As of December 31, 2015, our goodwill and indefinite-livedintangible asset balances were $2,404.7 million and $63.0 million, respectively.
Recently Adopted and New Accounting Pronouncements
See Note 1 to our audited consolidated financial statements for additional information.
Forward Looking StatementsThe statements contained in this Annual Report on Form 10-K that are not historical facts are forward-looking statements (within the meaning of
Section 21E of the Securities Exchange Act of 1934, as amended) that involve risks and uncertainties. Such forward-looking statements may be identified by,among other things, the use of forward-looking terminology such as “believe,” “expect,” “may,” “could,” “would,” “plan,” “intend,” “estimate,” “predict,”“potential,” “continue,” “should” or “anticipate” or the negative thereof or other variations thereon or comparable terminology, or by discussions of strategythat involve risks and uncertainties. From time to time, we or our representatives have made or may make forward-looking statements, orally or in writing.
Such forward-looking statements may be included in various filings made by us with the Securities and Exchange Commission, or press releases or oralstatements made by or with the approval of one of our authorized executive officers. These forward-looking statements, such as statements regardinganticipated future revenues or operating margins, contract percentage completions, earnings, capital expenditures, liquidity, plans, objectives and otherstatements regarding matters that are not historical facts, are based on our current expectations, estimates and projections, management’s beliefs and certainassumptions made by management, many of which, by their nature, are inherently uncertain and beyond our control. Our actual results, performance orachievements could differ materially from the results expressed in, or implied by, these forward-looking statements. There are a number of important factorsthat could cause our results to differ materially from those indicated by such forward-looking statements, including, but not limited to:
• Competition from other service providers;• The risk that our operating margin may decline and we may not be able to sustain our current level of profitability;• The risk of liability or damage to our reputation resulting from security breaches;• Any possible failure to comply with or adapt to changes in healthcare-related data protection and privacy laws;• The loss of customers, especially as a few customers account for a large portion of our revenues;• The risk that we may not be able to keep pace with the rapidly evolving technological environment;• The rate of growth in the use of technology in business and the type and level of technology spending by our clients;• Mispricing of our services, especially as an increasing percentage of our revenues are derived from fixed-price contracts;
50
Source: COGNIZANT TECHNOLOGY SOLUTIONS CORP, 10-K, February 25, 2016 Powered by Morningstar® Document Research℠The information contained herein may not be copied, adapted or distributed and is not warranted to be accurate, complete or timely. The user assumes all risks for any damages or losses arising from any use of this information,except to the extent such damages or losses cannot be limited or excluded by applicable law. Past financial performance is no guarantee of future results.
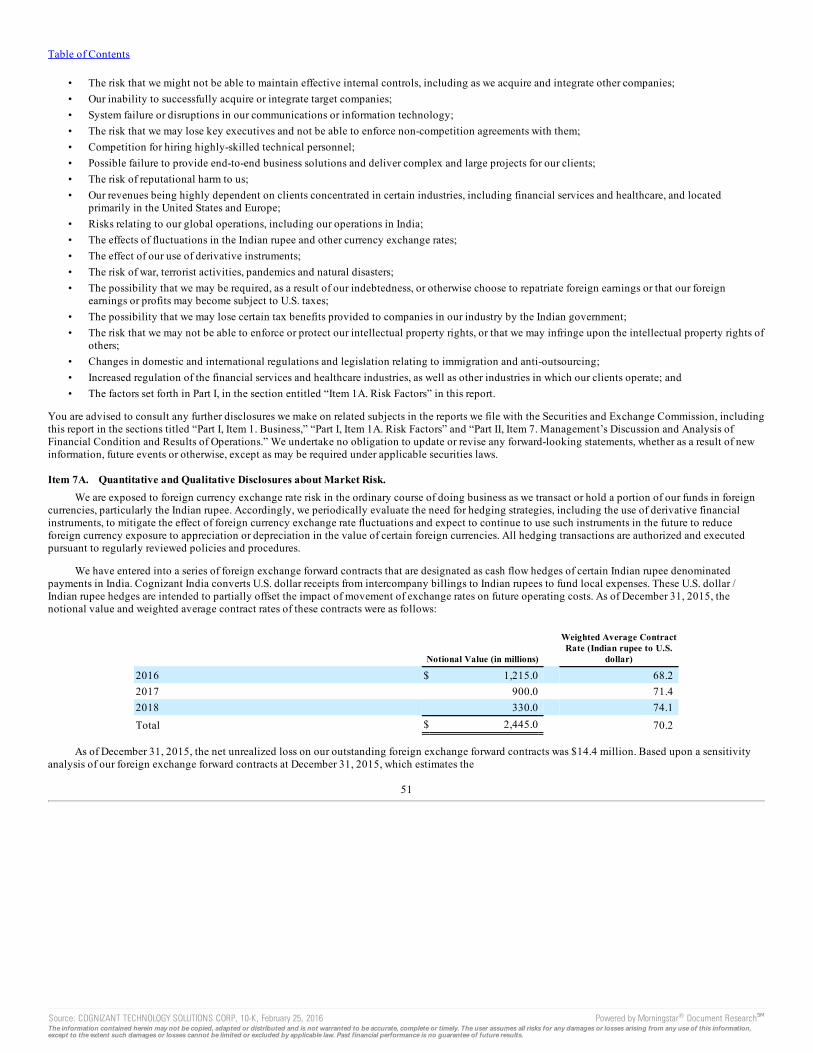
Table of Contents
• The risk that we might not be able to maintain effective internal controls, including as we acquire and integrate other companies;• Our inability to successfully acquire or integrate target companies;• System failure or disruptions in our communications or information technology;• The risk that we may lose key executives and not be able to enforce non-competition agreements with them;• Competition for hiring highly-skilled technical personnel;• Possible failure to provide end-to-end business solutions and deliver complex and large projects for our clients;• The risk of reputational harm to us;• Our revenues being highly dependent on clients concentrated in certain industries, including financial services and healthcare, and located
primarily in the United States and Europe;• Risks relating to our global operations, including our operations in India;• The effects of fluctuations in the Indian rupee and other currency exchange rates;• The effect of our use of derivative instruments;• The risk of war, terrorist activities, pandemics and natural disasters;• The possibility that we may be required, as a result of our indebtedness, or otherwise choose to repatriate foreign earnings or that our foreign
earnings or profits may become subject to U.S. taxes;• The possibility that we may lose certain tax benefits provided to companies in our industry by the Indian government;• The risk that we may not be able to enforce or protect our intellectual property rights, or that we may infringe upon the intellectual property rights of
others;• Changes in domestic and international regulations and legislation relating to immigration and anti-outsourcing;• Increased regulation of the financial services and healthcare industries, as well as other industries in which our clients operate; and• The factors set forth in Part I, in the section entitled “Item 1A. Risk Factors” in this report.
You are advised to consult any further disclosures we make on related subjects in the reports we file with the Securities and Exchange Commission, includingthis report in the sections titled “Part I, Item 1. Business,” “Part I, Item 1A. Risk Factors” and “Part II, Item 7. Management’s Discussion and Analysis ofFinancial Condition and Results of Operations.” We undertake no obligation to update or revise any forward-looking statements, whether as a result of newinformation, future events or otherwise, except as may be required under applicable securities laws.
Item 7A. Quantitative and Qualitative Disclosures about Market Risk.We are exposed to foreign currency exchange rate risk in the ordinary course of doing business as we transact or hold a portion of our funds in foreign
currencies, particularly the Indian rupee. Accordingly, we periodically evaluate the need for hedging strategies, including the use of derivative financialinstruments, to mitigate the effect of foreign currency exchange rate fluctuations and expect to continue to use such instruments in the future to reduceforeign currency exposure to appreciation or depreciation in the value of certain foreign currencies. All hedging transactions are authorized and executedpursuant to regularly reviewed policies and procedures.
We have entered into a series of foreign exchange forward contracts that are designated as cash flow hedges of certain Indian rupee denominatedpayments in India. Cognizant India converts U.S. dollar receipts from intercompany billings to Indian rupees to fund local expenses. These U.S. dollar /Indian rupee hedges are intended to partially offset the impact of movement of exchange rates on future operating costs. As of December 31, 2015, thenotional value and weighted average contract rates of these contracts were as follows:
Notional Value (in millions)
Weighted Average ContractRate (Indian rupee to U.S.
dollar)
2016 $ 1,215.0 68.22017 900.0 71.42018 330.0 74.1Total $ 2,445.0 70.2
As of December 31, 2015, the net unrealized loss on our outstanding foreign exchange forward contracts was $14.4 million. Based upon a sensitivityanalysis of our foreign exchange forward contracts at December 31, 2015, which estimates the
51
Source: COGNIZANT TECHNOLOGY SOLUTIONS CORP, 10-K, February 25, 2016 Powered by Morningstar® Document Research℠The information contained herein may not be copied, adapted or distributed and is not warranted to be accurate, complete or timely. The user assumes all risks for any damages or losses arising from any use of this information,except to the extent such damages or losses cannot be limited or excluded by applicable law. Past financial performance is no guarantee of future results.
Table of Contents
fair value of the contracts based upon market exchange rate fluctuations, a 10.0% change in the foreign currency exchange rate against the U.S. dollar with allother variables held constant would have resulted in a change in the fair value of approximately $227.7 million.
Our foreign subsidiaries are exposed to foreign currency exchange rate risk for transactions denominated in currencies other than the functionalcurrency of the respective subsidiary. We also use foreign exchange forward contracts to hedge balance sheet exposure to certain monetary assets andliabilities denominated in currencies other than the functional currency of the subsidiary. These contracts are not designated as hedges and are intended tooffset the foreign currency exchange gains or losses upon remeasurement of these net monetary assets. We entered into a series of foreign exchange forwardcontracts scheduled to mature in 2016 which are used to hedge our foreign currency denominated net monetary assets. At December 31, 2015, the notionalvalue of the outstanding contracts was $165.5 million and the related fair value was a liability of $0.8 million. Based upon a sensitivity analysis of ourforeign exchange forward contracts at December 31, 2015, which estimates the fair value of the contracts based upon market exchange rate fluctuations, a10.0% change in the foreign currency exchange rate against the U.S. dollar with all other variables held constant would have resulted in a change in the fairvalue of approximately $16.5 million.
In the fourth quarter of 2014, we entered into a credit agreement providing for a $1,000 million unsecured term loan and a $750.0 million unsecuredrevolving credit facility. The term loan and the revolving credit facility both mature on November 20, 2019. As of December 31, 2015, we have $350.0million outstanding under the revolving credit facility. The credit agreement requires interest to be paid at either the base rate or the Eurocurrency rate, plus amargin. The margin over the base rate is 0.00%, and the margin over the Eurocurrency rate ranges from 0.75% to 1.125%, depending on our debt ratings (or, ifwe have not received debt ratings, from 0.875% to 1.00%, depending on our debt to total stockholders' equity ratio). Thus, our debt exposes us to market riskfrom changes in interest rates. We performed a sensitivity analysis to determine the effect of interest rate fluctuations on our interest expense. A 10% changein interest rates, with all other variables held constant, would have resulted in an approximately $0.3 million change to our reported interest expense for2015.
In addition, our cash, cash equivalents and short-term investments are subject to market risk from changes in interest rates. As of December 31, 2015, a10% change in interest rates, with all other variables held constant, would result in a change in the fair market value of our available-for-sale investmentsecurities of approximately $2.5 million.
Information provided by the sensitivity analysis does not necessarily represent the actual changes that would occur under normal market conditions.
We typically invest in highly-rated securities and our policy generally limits the amount of credit exposure to any one issuer. Our investment policyrequires investments to be investment grade with the objective of minimizing the potential risk of principal loss. We may sell our investments prior to theirstated maturities for strategic purposes, in anticipation of credit deterioration, or for duration management. As of December 31, 2015, our short-terminvestments totaled $2,824.3 million. Our investment portfolio is comprised primarily of time deposits, mutual funds invested in fixed income securities andU.S. dollar denominated corporate bonds, municipal bonds, certificates of deposit, commercial paper, debt issuances by the U.S. government, U.S.government agencies, foreign governments and supranational entities and asset-backed securities. The asset-backed securities included Government NationalMortgage Association (GNMA) mortgage backed securities and securities backed by auto loans, credit card receivables, and other receivables.
Item 8. Financial Statements and Supplementary Data
The financial statements required to be filed pursuant to this Item 8 are appended to this Annual Report on Form 10-K. A list of the financial statementsfiled herewith is found in Part IV, “Item 15. Exhibits, Financial Statements and Financial Statement Schedule”.
Item 9. Changes in and Disagreements with Accountants on Accounting and Financial Disclosure
Not applicable.
52
Source: COGNIZANT TECHNOLOGY SOLUTIONS CORP, 10-K, February 25, 2016 Powered by Morningstar® Document Research℠The information contained herein may not be copied, adapted or distributed and is not warranted to be accurate, complete or timely. The user assumes all risks for any damages or losses arising from any use of this information,except to the extent such damages or losses cannot be limited or excluded by applicable law. Past financial performance is no guarantee of future results.
Table of Contents
Item 9A. Controls and Procedures
Evaluation of Disclosure Controls and ProceduresOur management, under the supervision and with the participation of our chief executive officer and our chief financial officer, evaluated the
effectiveness of our disclosure controls and procedures (as defined in Rules 13a-15(e) and 15d-15(e) under the Securities Exchange Act of 1934, as amended,or the Exchange Act) as of December 31, 2015. Based on this evaluation, our chief executive officer and our chief financial officer concluded that, as ofDecember 31, 2015, our disclosure controls and procedures were effective to ensure that information required to be disclosed by us in our reports that we fileor submit under the Exchange Act is (i) recorded, processed, summarized and reported within the time periods specified in the SEC’s rules and forms and(ii) accumulated and communicated to our management, including our chief executive officer and our chief financial officer, as appropriate, to allow timelydecisions regarding required disclosure.Changes in Internal Control over Financial Reporting
Our internal control over financial reporting in 2015 includes certain additional internal controls relating to TriZetto, which we acquired in the fourthquarter of 2014. Other than such changes with respect to TriZetto, no changes in our internal control over financial reporting (as defined in Rules 13a-15(f)and 15d-15(f) under the Exchange Act) occurred during the fiscal quarter ended December 31, 2015 that have materially affected, or are reasonably likely tomaterially affect, our internal control over financial reporting.
Management’s Responsibility for Financial StatementsOur management is responsible for the integrity and objectivity of all information presented in this annual report. The consolidated financial
statements were prepared in conformity with accounting principles generally accepted in the United States of America and include amounts based onmanagement’s best estimates and judgments. Management believes the consolidated financial statements fairly reflect the form and substance of transactionsand that the financial statements fairly represent the Company’s financial position and results of operations.
The Audit Committee of the Board of Directors, which is composed solely of independent directors, meets regularly with the Company’s independentregistered public accounting firm and representatives of management to review accounting, financial reporting, internal control and audit matters, as well asthe nature and extent of the audit effort. The Audit Committee is responsible for the engagement of the independent registered public accounting firm. Theindependent registered public accounting firm has free access to the Audit Committee.
Management’s Report on Internal Control Over Financial ReportingOur management is responsible for establishing and maintaining adequate internal control over financial reporting. Internal control over financial
reporting is defined in Rule 13a-15(f) and 15d-15(f) of the Exchange Act and is a process designed by, or under the supervision of, our chief executive andchief financial officers and effected by our Board of Directors, management and other personnel, to provide reasonable assurance regarding the reliability offinancial reporting and the preparation of financial statements for external purposes in accordance with generally accepted accounting principles andincludes those policies and procedures that:
• Pertain to the maintenance of records that, in reasonable detail, accurately and fairly reflect the transactions and dispositions of our assets;• Provide reasonable assurance that transactions are recorded as necessary to permit preparation of financial statements in accordance with generally
accepted accounting principles, and that receipts and expenditures of the Company are being made only in accordance with authorizations of ourmanagement and directors; and
• Provide reasonable assurance regarding prevention or timely detection of unauthorized acquisition, use or disposition of the Company’s assets thatcould have a material effect on the financial statements.
Our management assessed the effectiveness of the Company’s internal control over financial reporting as of December 31, 2015. In making thisassessment, the Company’s management used the criteria set forth by the Committee of Sponsoring Organizations of the Treadway Commission (COSO)in Internal Control-Integrated Framework (2013).
Based on its evaluation, our management has concluded that, as of December 31, 2015, our internal control over financial reporting was effective.PricewaterhouseCoopers LLP, the independent registered public accounting firm that audited the financial statements included in this annual report, hasissued an attestation report on our internal control over financial reporting, as stated in their report which is included on page F-2.
53
Source: COGNIZANT TECHNOLOGY SOLUTIONS CORP, 10-K, February 25, 2016 Powered by Morningstar® Document Research℠The information contained herein may not be copied, adapted or distributed and is not warranted to be accurate, complete or timely. The user assumes all risks for any damages or losses arising from any use of this information,except to the extent such damages or losses cannot be limited or excluded by applicable law. Past financial performance is no guarantee of future results.

Table of Contents
Inherent Limitations of Internal Controls
Because of its inherent limitations, internal control over financial reporting may not prevent or detect all misstatements. Projections of any evaluationof effectiveness to future periods are subject to the risk that controls may become inadequate because of changes in conditions, or that the degree ofcompliance with the policies or procedures may deteriorate.
Item 9B. Other Information
None.
54
Source: COGNIZANT TECHNOLOGY SOLUTIONS CORP, 10-K, February 25, 2016 Powered by Morningstar® Document Research℠The information contained herein may not be copied, adapted or distributed and is not warranted to be accurate, complete or timely. The user assumes all risks for any damages or losses arising from any use of this information,except to the extent such damages or losses cannot be limited or excluded by applicable law. Past financial performance is no guarantee of future results.
Table of Contents
PART III
Item 10. Directors, Executive Officers and Corporate Governance
The information relating to our executive officers in response to this item is contained in part under the caption “Our Executive Officers” in Part I ofthis Annual Report on Form 10-K.
We have adopted a written code of business conduct and ethics, entitled “Cognizant’s Core Values and Standards of Business Conduct,” that applies toall of our employees, including our principal executive officer, principal financial officer, principal accounting officer and controller, or persons performingsimilar functions. We make available our code of business conduct and ethics free of charge through our website which is located at www.cognizant.com. Weintend to post on our website all disclosures that are required by law or NASDAQ Stock Market listing standards concerning any amendments to, or waiversfrom, any provision of our code of business conduct and ethics.
The remaining information required by this item will be included in our definitive proxy statement for the 2016 Annual Meeting of Stockholders and isincorporated herein by reference to such proxy statement.
Item 11. Executive Compensation
The information required by this item will be included in our definitive proxy statement for the 2016 Annual Meeting of Stockholders and isincorporated herein by reference to such proxy statement.
Item 12. Security Ownership of Certain Beneficial Owners and Management and Related Stockholder Matters
The information required by this item will be included in our definitive proxy statement for the 2016 Annual Meeting of Stockholders and isincorporated herein by reference to such proxy statement.
Item 13. Certain Relationships and Related Transactions, and Director Independence
The information required by this item will be included in our definitive proxy statement for the 2016 Annual Meeting of Stockholders and isincorporated herein by reference to such proxy statement.
Item 14. Principal Accountant Fees and Services
The information required by this item will be included in our definitive proxy statement for the 2016 Annual Meeting of Stockholders and isincorporated herein by reference to such proxy statement.
55
Source: COGNIZANT TECHNOLOGY SOLUTIONS CORP, 10-K, February 25, 2016 Powered by Morningstar® Document Research℠The information contained herein may not be copied, adapted or distributed and is not warranted to be accurate, complete or timely. The user assumes all risks for any damages or losses arising from any use of this information,except to the extent such damages or losses cannot be limited or excluded by applicable law. Past financial performance is no guarantee of future results.
Table of Contents
PART IV
Item 15. Exhibits, Financial Statement Schedules
(a) (1) Consolidated Financial Statements. Reference is made to the Index to Consolidated Financial Statements on Page F-1.
(2) Consolidated Financial Statement Schedule. Reference is made to the Index to Financial Statement Schedule on Page F-1.
(3) Exhibits. Reference is made to the Index to Exhibits on Page 58.
Schedules other than as listed above are omitted as not required or inapplicable or because the required information is provided in the consolidatedfinancial statements, including the notes thereto.
56
Source: COGNIZANT TECHNOLOGY SOLUTIONS CORP, 10-K, February 25, 2016 Powered by Morningstar® Document Research℠The information contained herein may not be copied, adapted or distributed and is not warranted to be accurate, complete or timely. The user assumes all risks for any damages or losses arising from any use of this information,except to the extent such damages or losses cannot be limited or excluded by applicable law. Past financial performance is no guarantee of future results.
Table of Contents
SIGNATURES
Pursuant to the requirements of Section 13 or 15(d) of the Securities Exchange Act of 1934, the Registrant has duly caused this report to be signed onits behalf by the undersigned, thereunto duly authorized.
COGNIZANT TECHNOLOGY SOLUTIONSCORPORATION
By: /S/ FRANCISCO D’SOUZA
Francisco D’Souza, Chief Executive Officer (Principal Executive Officer)
Date: February 25, 2016
Pursuant to the requirements of the Securities Exchange Act of 1934, this report has been signed below by the following persons on behalf of theRegistrant and in the capacities and on the dates indicated.
Signature Title Date
/s/ FRANCISCO D’SOUZA Chief Executive Officer and Director
(Principal Executive Officer) February 25, 2016
Francisco D’Souza
/s/ KAREN MCLOUGHLIN Chief Financial Officer
(Principal Financial and Accounting Officer) February 25, 2016
Karen McLoughlin
/s/ JOHN E. KLEIN Chairman of the Board and Director February 25, 2016
John E. Klein
/s/ LAKSHMI NARAYANAN Vice Chairman of the Board and Director February 25, 2016
Lakshmi Narayanan
/s/ THOMAS M. WENDEL Director February 25, 2016Thomas M. Wendel
/s/ ROBERT E. WEISSMAN Director February 25, 2016
Robert E. Weissman
/s/ JOHN N. FOX, JR. Director February 25, 2016John N. Fox, Jr.
/s/ MAUREEN BREAKIRON-EVANS Director February 25, 2016
Maureen Breakiron-Evans
/s/ MICHAEL PATSALOS-FOX Director February 25, 2016Michael Patsalos-Fox
/s/ LEO S. MACKAY, JR. Director February 25, 2016
Leo S. Mackay, Jr.
/s/ ZEIN ABDALLA Director February 25, 2016Zein Abdalla
57
Source: COGNIZANT TECHNOLOGY SOLUTIONS CORP, 10-K, February 25, 2016 Powered by Morningstar® Document Research℠The information contained herein may not be copied, adapted or distributed and is not warranted to be accurate, complete or timely. The user assumes all risks for any damages or losses arising from any use of this information,except to the extent such damages or losses cannot be limited or excluded by applicable law. Past financial performance is no guarantee of future results.
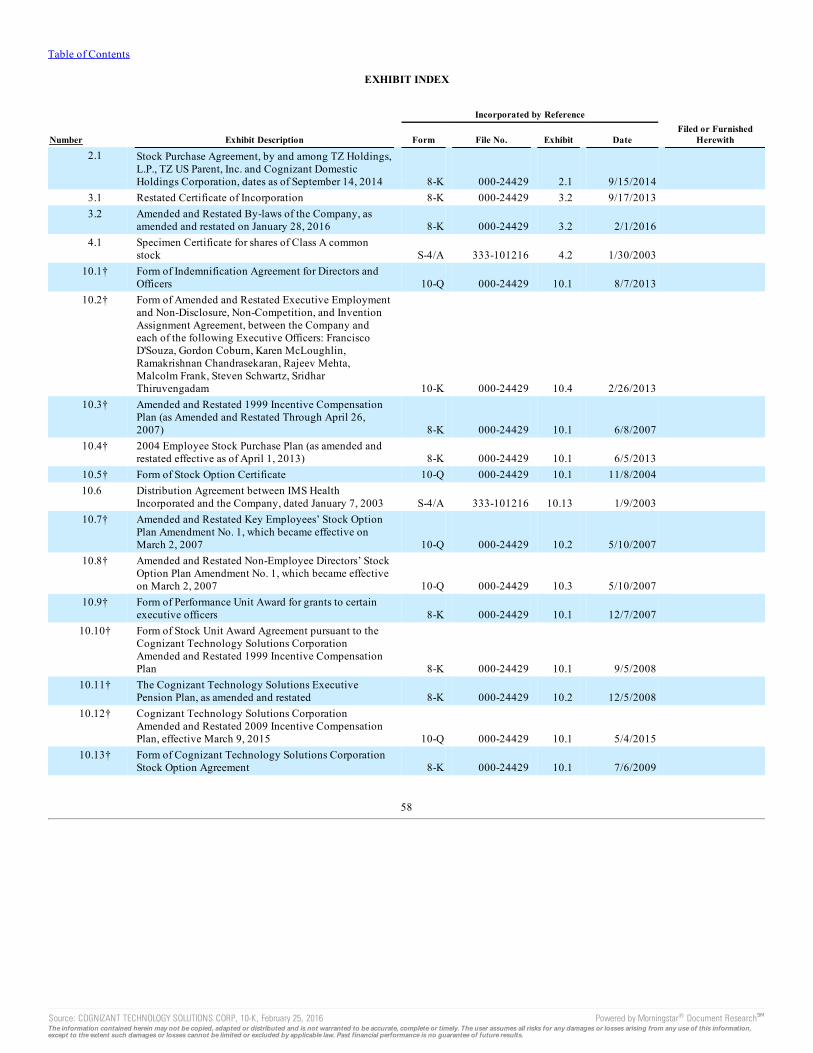
Table of Contents
EXHIBIT INDEX
Incorporated by Reference
Number Exhibit Description Form File No. Exhibit Date Filed or Furnished
Herewith
2.1
Stock Purchase Agreement, by and among TZ Holdings,L.P., TZ US Parent, Inc. and Cognizant DomesticHoldings Corporation, dates as of September 14, 2014 8-K 000-24429 2.1 9/15/2014
3.1 Restated Certificate of Incorporation 8-K 000-24429 3.2 9/17/2013 3.2
Amended and Restated By-laws of the Company, asamended and restated on January 28, 2016 8-K 000-24429 3.2 2/1/2016
4.1
Specimen Certificate for shares of Class A commonstock S-4/A 333-101216 4.2 1/30/2003
10.1†
Form of Indemnification Agreement for Directors andOfficers 10-Q 000-24429 10.1 8/7/2013
10.2†
Form of Amended and Restated Executive Employmentand Non-Disclosure, Non-Competition, and InventionAssignment Agreement, between the Company andeach of the following Executive Officers: FranciscoD'Souza, Gordon Coburn, Karen McLoughlin,Ramakrishnan Chandrasekaran, Rajeev Mehta,Malcolm Frank, Steven Schwartz, SridharThiruvengadam 10-K 000-24429 10.4 2/26/2013
10.3†
Amended and Restated 1999 Incentive CompensationPlan (as Amended and Restated Through April 26,2007) 8-K 000-24429 10.1 6/8/2007
10.4†
2004 Employee Stock Purchase Plan (as amended andrestated effective as of April 1, 2013) 8-K 000-24429 10.1 6/5/2013
10.5† Form of Stock Option Certificate 10-Q 000-24429 10.1 11/8/2004 10.6
Distribution Agreement between IMS HealthIncorporated and the Company, dated January 7, 2003 S-4/A 333-101216 10.13 1/9/2003
10.7†
Amended and Restated Key Employees’ Stock OptionPlan Amendment No. 1, which became effective onMarch 2, 2007 10-Q 000-24429 10.2 5/10/2007
10.8†
Amended and Restated Non-Employee Directors’ StockOption Plan Amendment No. 1, which became effectiveon March 2, 2007 10-Q 000-24429 10.3 5/10/2007
10.9†
Form of Performance Unit Award for grants to certainexecutive officers 8-K 000-24429 10.1 12/7/2007
10.10†
Form of Stock Unit Award Agreement pursuant to theCognizant Technology Solutions CorporationAmended and Restated 1999 Incentive CompensationPlan 8-K 000-24429 10.1 9/5/2008
10.11†
The Cognizant Technology Solutions ExecutivePension Plan, as amended and restated 8-K 000-24429 10.2 12/5/2008
10.12†
Cognizant Technology Solutions CorporationAmended and Restated 2009 Incentive CompensationPlan, effective March 9, 2015 10-Q 000-24429 10.1 5/4/2015
10.13†
Form of Cognizant Technology Solutions CorporationStock Option Agreement 8-K 000-24429 10.1 7/6/2009
58
Source: COGNIZANT TECHNOLOGY SOLUTIONS CORP, 10-K, February 25, 2016 Powered by Morningstar® Document Research℠The information contained herein may not be copied, adapted or distributed and is not warranted to be accurate, complete or timely. The user assumes all risks for any damages or losses arising from any use of this information,except to the extent such damages or losses cannot be limited or excluded by applicable law. Past financial performance is no guarantee of future results.
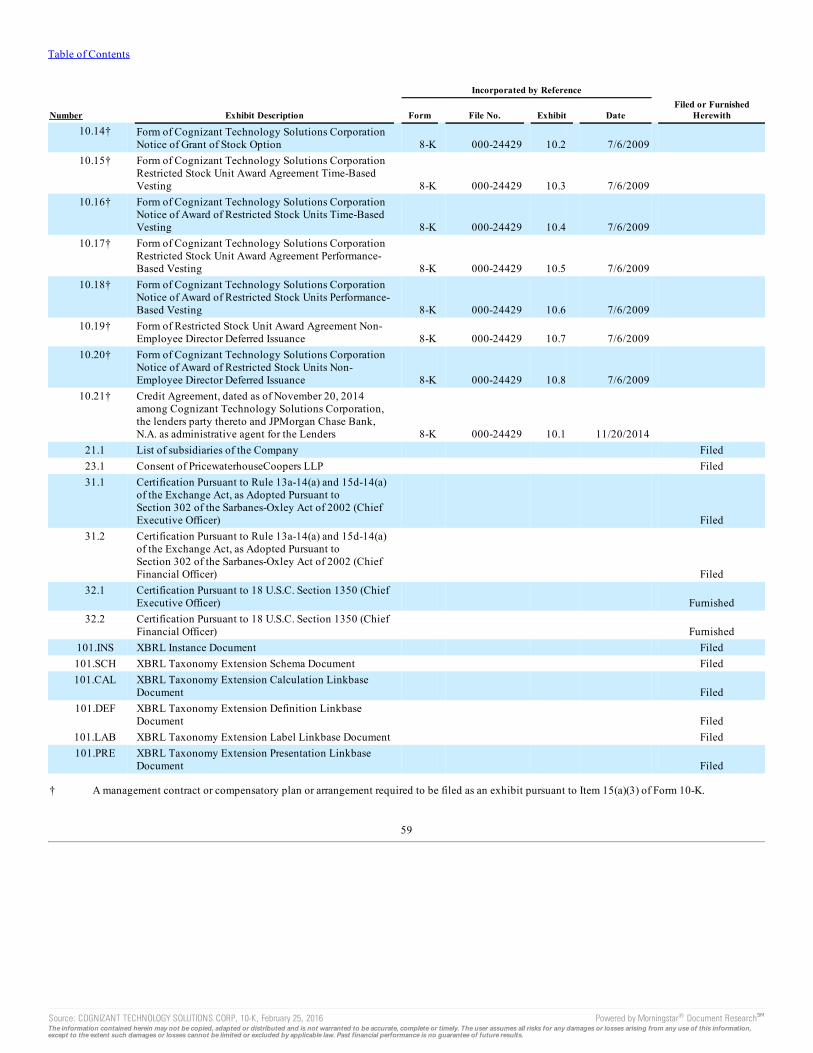
Table of Contents
Incorporated by Reference
Number Exhibit Description Form File No. Exhibit Date Filed or Furnished
Herewith
10.14†
Form of Cognizant Technology Solutions CorporationNotice of Grant of Stock Option 8-K 000-24429 10.2 7/6/2009
10.15†
Form of Cognizant Technology Solutions CorporationRestricted Stock Unit Award Agreement Time-BasedVesting 8-K 000-24429 10.3 7/6/2009
10.16†
Form of Cognizant Technology Solutions CorporationNotice of Award of Restricted Stock Units Time-BasedVesting 8-K 000-24429 10.4 7/6/2009
10.17†
Form of Cognizant Technology Solutions CorporationRestricted Stock Unit Award Agreement Performance-Based Vesting 8-K 000-24429 10.5 7/6/2009
10.18†
Form of Cognizant Technology Solutions CorporationNotice of Award of Restricted Stock Units Performance-Based Vesting 8-K 000-24429 10.6 7/6/2009
10.19†
Form of Restricted Stock Unit Award Agreement Non-Employee Director Deferred Issuance 8-K 000-24429 10.7 7/6/2009
10.20†
Form of Cognizant Technology Solutions CorporationNotice of Award of Restricted Stock Units Non-Employee Director Deferred Issuance 8-K 000-24429 10.8 7/6/2009
10.21†
Credit Agreement, dated as of November 20, 2014among Cognizant Technology Solutions Corporation,the lenders party thereto and JPMorgan Chase Bank,N.A. as administrative agent for the Lenders 8-K 000-24429 10.1 11/20/2014
21.1 List of subsidiaries of the Company Filed23.1 Consent of PricewaterhouseCoopers LLP Filed31.1
Certification Pursuant to Rule 13a-14(a) and 15d-14(a)of the Exchange Act, as Adopted Pursuant toSection 302 of the Sarbanes-Oxley Act of 2002 (ChiefExecutive Officer) Filed
31.2
Certification Pursuant to Rule 13a-14(a) and 15d-14(a)of the Exchange Act, as Adopted Pursuant toSection 302 of the Sarbanes-Oxley Act of 2002 (ChiefFinancial Officer) Filed
32.1
Certification Pursuant to 18 U.S.C. Section 1350 (ChiefExecutive Officer) Furnished
32.2
Certification Pursuant to 18 U.S.C. Section 1350 (ChiefFinancial Officer) Furnished
101.INS XBRL Instance Document Filed101.SCH XBRL Taxonomy Extension Schema Document Filed101.CAL
XBRL Taxonomy Extension Calculation LinkbaseDocument Filed
101.DEF
XBRL Taxonomy Extension Definition LinkbaseDocument Filed
101.LAB XBRL Taxonomy Extension Label Linkbase Document Filed101.PRE
XBRL Taxonomy Extension Presentation LinkbaseDocument Filed
† A management contract or compensatory plan or arrangement required to be filed as an exhibit pursuant to Item 15(a)(3) of Form 10-K.
59
Source: COGNIZANT TECHNOLOGY SOLUTIONS CORP, 10-K, February 25, 2016 Powered by Morningstar® Document Research℠The information contained herein may not be copied, adapted or distributed and is not warranted to be accurate, complete or timely. The user assumes all risks for any damages or losses arising from any use of this information,except to the extent such damages or losses cannot be limited or excluded by applicable law. Past financial performance is no guarantee of future results.
Table of Contents
COGNIZANT TECHNOLOGY SOLUTIONS CORPORATIONINDEX TO CONSOLIDATED FINANCIAL STATEMENTS
AND FINANCIAL STATEMENT SCHEDULE
Page
Consolidated Financial Statements: Report of Independent Registered Public Accounting Firm F-2Consolidated Statements of Financial Position as of December 31, 2015 and 2014 F-3Consolidated Statements of Operations for the years ended December 31, 2015, 2014 and 2013 F-4Consolidated Statements of Comprehensive Income for the years ended December 31, 2015, 2014 and 2013 F-5Consolidated Statements of Stockholders’ Equity for the years ended December 31, 2015, 2014 and 2013 F-6Consolidated Statements of Cash Flows for the years ended December 31, 2015, 2014 and 2013 F-7Notes to Consolidated Financial Statements F-8
Financial Statement Schedule: Schedule of Valuation and Qualifying Accounts F-37
F-1
Source: COGNIZANT TECHNOLOGY SOLUTIONS CORP, 10-K, February 25, 2016 Powered by Morningstar® Document Research℠The information contained herein may not be copied, adapted or distributed and is not warranted to be accurate, complete or timely. The user assumes all risks for any damages or losses arising from any use of this information,except to the extent such damages or losses cannot be limited or excluded by applicable law. Past financial performance is no guarantee of future results.
Table of Contents
Report of Independent Registered Public Accounting Firm
To the Board of Directors and Stockholders of Cognizant Technology Solutions Corporation:
In our opinion, the consolidated financial statements listed in the accompanying index appearing under Item 15(a)(1) present fairly, in all materialrespects, the financial position of Cognizant Technology Solutions Corporation (the "Company") and its subsidiaries at December 31, 2015 and December31, 2014, and the results of their operations and their cash flows for each of the three years in the period ended December 31, 2015 in conformity withaccounting principles generally accepted in the United States of America. In addition, in our opinion, the financial statement schedule listed in theaccompanying index presents fairly, in all material respects, the information set forth therein when read in conjunction with the related consolidated financialstatements. Also in our opinion, the Company maintained, in all material respects, effective internal control over financial reporting as of December 31, 2015,based on criteria established in Internal Control - Integrated Framework (2013) issued by the Committee of Sponsoring Organizations of the TreadwayCommission (COSO). The Company's management is responsible for these financial statements and financial statement schedule, for maintaining effectiveinternal control over financial reporting and for its assessment of the effectiveness of internal control over financial reporting, included in Management’sReport on Internal Control over Financial Reporting appearing under Item 9A. Our responsibility is to express opinions on these financial statements, on thefinancial statement schedule, and on the Company's internal control over financial reporting based on our integrated audits. We conducted our audits inaccordance with the standards of the Public Company Accounting Oversight Board (United States). Those standards require that we plan and perform theaudits to obtain reasonable assurance about whether the financial statements are free of material misstatement and whether effective internal control overfinancial reporting was maintained in all material respects. Our audits of the financial statements included examining, on a test basis, evidence supporting theamounts and disclosures in the financial statements, assessing the accounting principles used and significant estimates made by management, and evaluatingthe overall financial statement presentation. Our audit of internal control over financial reporting included obtaining an understanding of internal controlover financial reporting, assessing the risk that a material weakness exists, and testing and evaluating the design and operating effectiveness of internalcontrol based on the assessed risk. Our audits also included performing such other procedures as we considered necessary in the circumstances. We believethat our audits provide a reasonable basis for our opinions.
As discussed in Note 1 to the consolidated financial statements, the Company changed the manner in which it presents deferred income taxes in2015.
A company’s internal control over financial reporting is a process designed to provide reasonable assurance regarding the reliability of financialreporting and the preparation of financial statements for external purposes in accordance with generally accepted accounting principles. A company’sinternal control over financial reporting includes those policies and procedures that (i) pertain to the maintenance of records that, in reasonable detail,accurately and fairly reflect the transactions and dispositions of the assets of the company; (ii) provide reasonable assurance that transactions are recorded asnecessary to permit preparation of financial statements in accordance with generally accepted accounting principles, and that receipts and expenditures of thecompany are being made only in accordance with authorizations of management and directors of the company; and (iii) provide reasonable assuranceregarding prevention or timely detection of unauthorized acquisition, use, or disposition of the company’s assets that could have a material effect on thefinancial statements.
Because of its inherent limitations, internal control over financial reporting may not prevent or detect misstatements. Also, projections of anyevaluation of effectiveness to future periods are subject to the risk that controls may become inadequate because of changes in conditions, or that the degreeof compliance with the policies or procedures may deteriorate.
PricewaterhouseCoopers LLP
New York, New YorkFebruary 25, 2016
F-2
Source: COGNIZANT TECHNOLOGY SOLUTIONS CORP, 10-K, February 25, 2016 Powered by Morningstar® Document Research℠The information contained herein may not be copied, adapted or distributed and is not warranted to be accurate, complete or timely. The user assumes all risks for any damages or losses arising from any use of this information,except to the extent such damages or losses cannot be limited or excluded by applicable law. Past financial performance is no guarantee of future results.
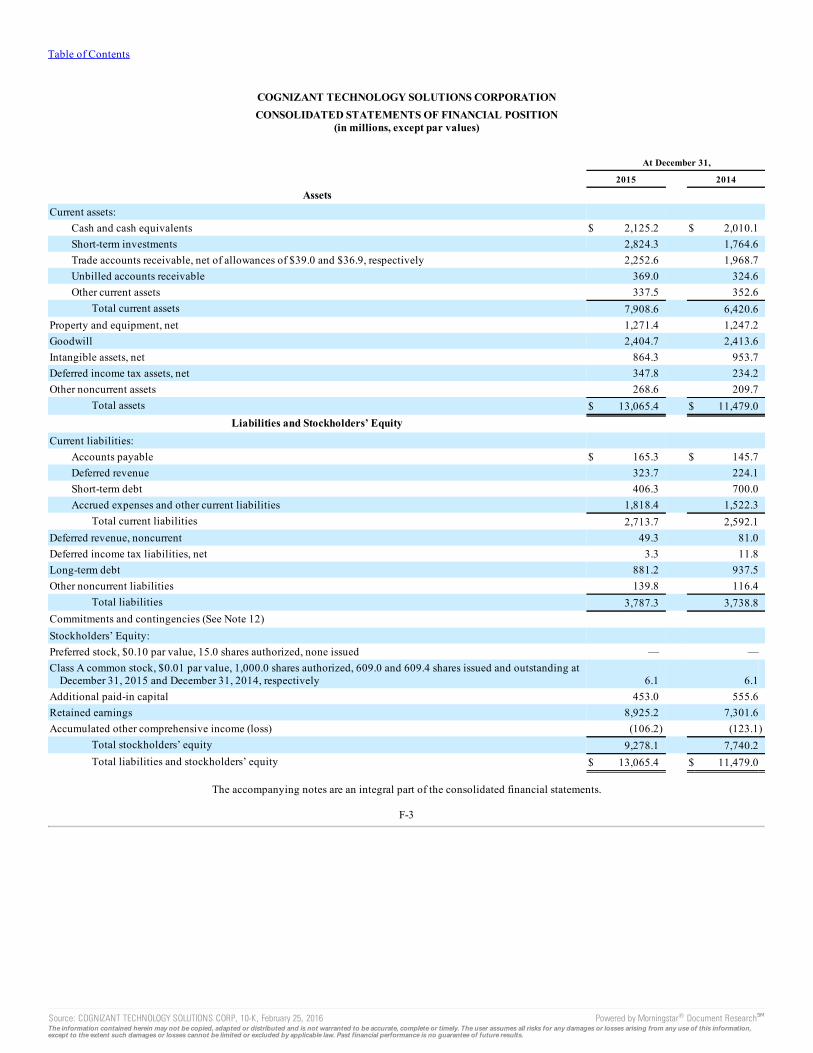
Table of Contents
COGNIZANT TECHNOLOGY SOLUTIONS CORPORATIONCONSOLIDATED STATEMENTS OF FINANCIAL POSITION
(in millions, except par values)
At December 31,
2015 2014
Assets Current assets:
Cash and cash equivalents $ 2,125.2 $ 2,010.1Short-term investments 2,824.3 1,764.6Trade accounts receivable, net of allowances of $39.0 and $36.9, respectively 2,252.6 1,968.7Unbilled accounts receivable 369.0 324.6Other current assets 337.5 352.6
Total current assets 7,908.6 6,420.6Property and equipment, net 1,271.4 1,247.2Goodwill 2,404.7 2,413.6Intangible assets, net 864.3 953.7Deferred income tax assets, net 347.8 234.2Other noncurrent assets 268.6 209.7
Total assets $ 13,065.4 $ 11,479.0Liabilities and Stockholders’ Equity
Current liabilities: Accounts payable $ 165.3 $ 145.7Deferred revenue 323.7 224.1Short-term debt 406.3 700.0Accrued expenses and other current liabilities 1,818.4 1,522.3
Total current liabilities 2,713.7 2,592.1Deferred revenue, noncurrent 49.3 81.0Deferred income tax liabilities, net 3.3 11.8Long-term debt 881.2 937.5Other noncurrent liabilities 139.8 116.4
Total liabilities 3,787.3 3,738.8Commitments and contingencies (See Note 12) Stockholders’ Equity: Preferred stock, $0.10 par value, 15.0 shares authorized, none issued — —Class A common stock, $0.01 par value, 1,000.0 shares authorized, 609.0 and 609.4 shares issued and outstanding at
December 31, 2015 and December 31, 2014, respectively 6.1 6.1Additional paid-in capital 453.0 555.6Retained earnings 8,925.2 7,301.6Accumulated other comprehensive income (loss) (106.2) (123.1)
Total stockholders’ equity 9,278.1 7,740.2Total liabilities and stockholders’ equity $ 13,065.4 $ 11,479.0
The accompanying notes are an integral part of the consolidated financial statements.
F-3
Source: COGNIZANT TECHNOLOGY SOLUTIONS CORP, 10-K, February 25, 2016 Powered by Morningstar® Document Research℠The information contained herein may not be copied, adapted or distributed and is not warranted to be accurate, complete or timely. The user assumes all risks for any damages or losses arising from any use of this information,except to the extent such damages or losses cannot be limited or excluded by applicable law. Past financial performance is no guarantee of future results.
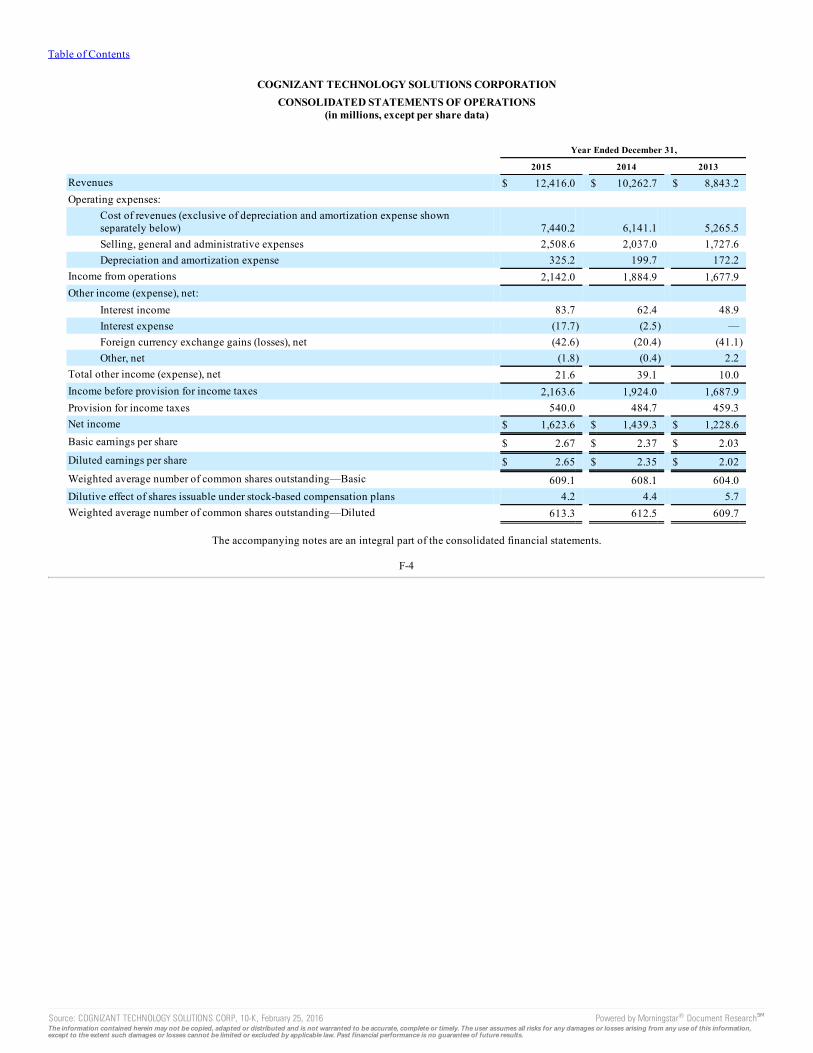
Table of Contents
COGNIZANT TECHNOLOGY SOLUTIONS CORPORATIONCONSOLIDATED STATEMENTS OF OPERATIONS
(in millions, except per share data)
Year Ended December 31,
2015 2014 2013
Revenues $ 12,416.0 $ 10,262.7 $ 8,843.2Operating expenses:
Cost of revenues (exclusive of depreciation and amortization expense shownseparately below) 7,440.2 6,141.1 5,265.5Selling, general and administrative expenses 2,508.6 2,037.0 1,727.6Depreciation and amortization expense 325.2 199.7 172.2
Income from operations 2,142.0 1,884.9 1,677.9Other income (expense), net:
Interest income 83.7 62.4 48.9Interest expense (17.7) (2.5) —Foreign currency exchange gains (losses), net (42.6) (20.4) (41.1)Other, net (1.8) (0.4) 2.2
Total other income (expense), net 21.6 39.1 10.0Income before provision for income taxes 2,163.6 1,924.0 1,687.9Provision for income taxes 540.0 484.7 459.3Net income $ 1,623.6 $ 1,439.3 $ 1,228.6Basic earnings per share $ 2.67 $ 2.37 $ 2.03Diluted earnings per share $ 2.65 $ 2.35 $ 2.02Weighted average number of common shares outstanding—Basic 609.1 608.1 604.0Dilutive effect of shares issuable under stock-based compensation plans 4.2 4.4 5.7Weighted average number of common shares outstanding—Diluted 613.3 612.5 609.7
The accompanying notes are an integral part of the consolidated financial statements.
F-4
Source: COGNIZANT TECHNOLOGY SOLUTIONS CORP, 10-K, February 25, 2016 Powered by Morningstar® Document Research℠The information contained herein may not be copied, adapted or distributed and is not warranted to be accurate, complete or timely. The user assumes all risks for any damages or losses arising from any use of this information,except to the extent such damages or losses cannot be limited or excluded by applicable law. Past financial performance is no guarantee of future results.
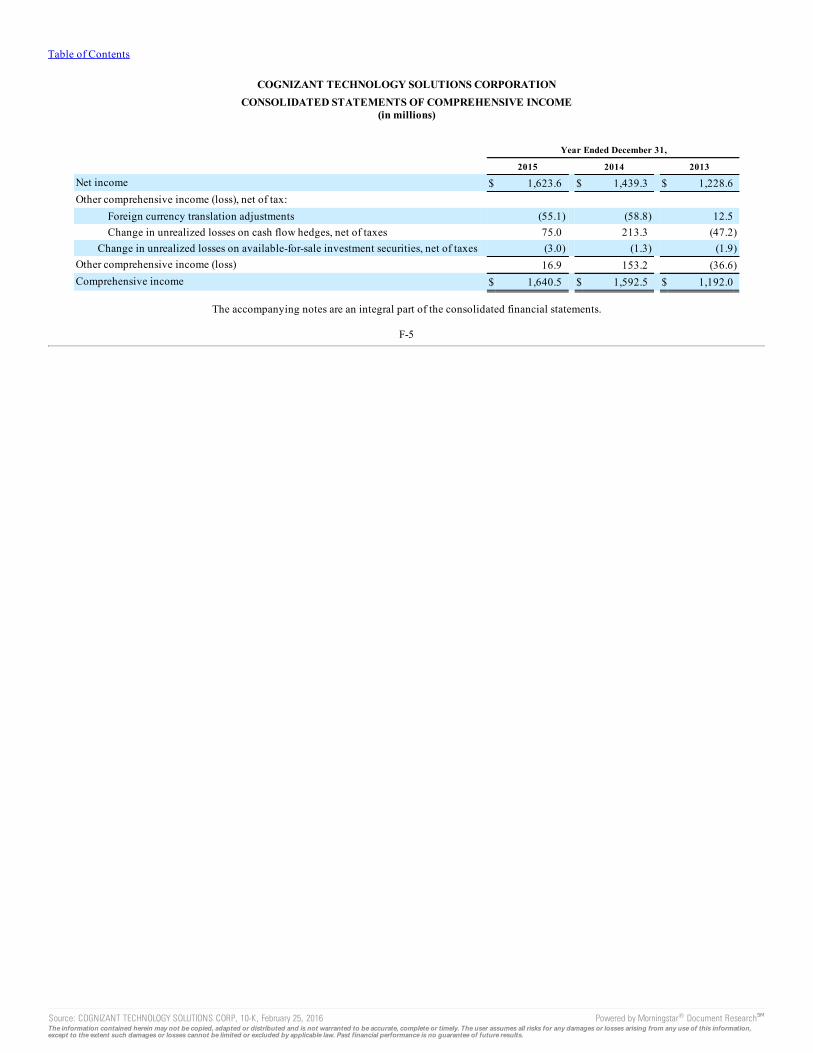
Table of Contents
COGNIZANT TECHNOLOGY SOLUTIONS CORPORATIONCONSOLIDATED STATEMENTS OF COMPREHENSIVE INCOME
(in millions)
Year Ended December 31,
2015 2014 2013
Net income $ 1,623.6 $ 1,439.3 $ 1,228.6Other comprehensive income (loss), net of tax:
Foreign currency translation adjustments (55.1) (58.8) 12.5Change in unrealized losses on cash flow hedges, net of taxes 75.0 213.3 (47.2)
Change in unrealized losses on available-for-sale investment securities, net of taxes (3.0) (1.3) (1.9)Other comprehensive income (loss) 16.9 153.2 (36.6)Comprehensive income $ 1,640.5 $ 1,592.5 $ 1,192.0
The accompanying notes are an integral part of the consolidated financial statements.
F-5
Source: COGNIZANT TECHNOLOGY SOLUTIONS CORP, 10-K, February 25, 2016 Powered by Morningstar® Document Research℠The information contained herein may not be copied, adapted or distributed and is not warranted to be accurate, complete or timely. The user assumes all risks for any damages or losses arising from any use of this information,except to the extent such damages or losses cannot be limited or excluded by applicable law. Past financial performance is no guarantee of future results.
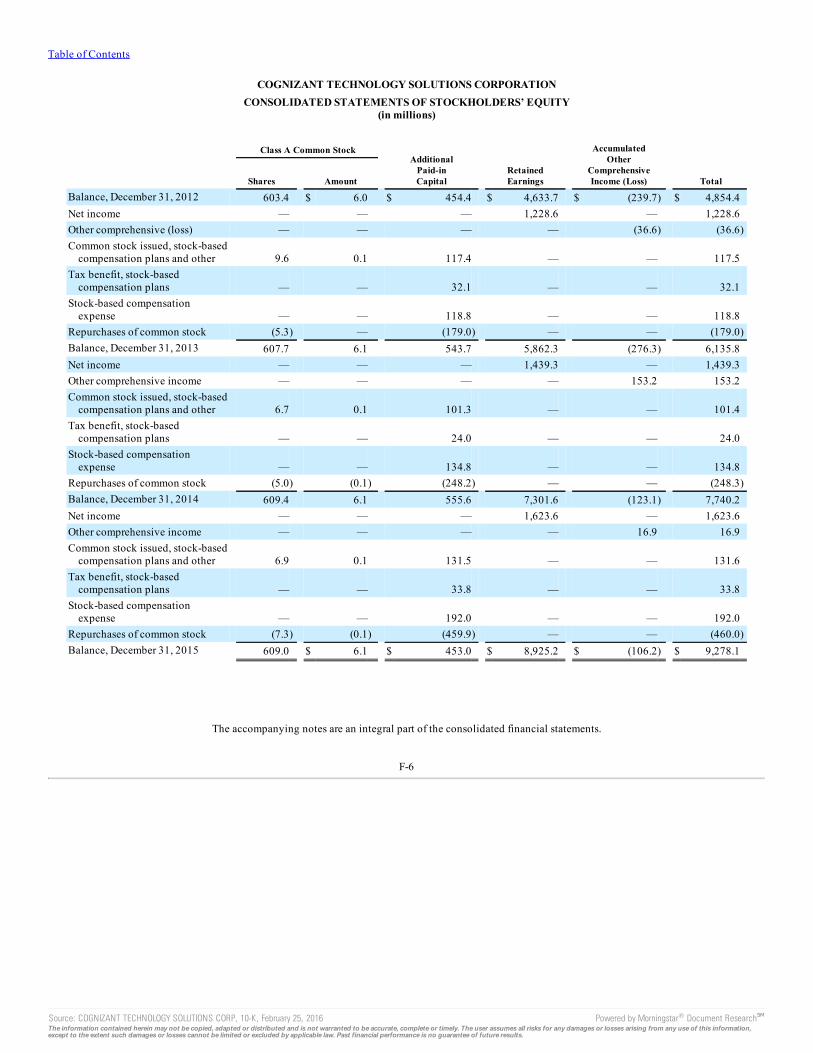
Table of Contents
COGNIZANT TECHNOLOGY SOLUTIONS CORPORATIONCONSOLIDATED STATEMENTS OF STOCKHOLDERS’ EQUITY
(in millions)
Class A Common Stock Additional
Paid-inCapital
RetainedEarnings
AccumulatedOther
ComprehensiveIncome (Loss) Total Shares Amount
Balance, December 31, 2012 603.4 $ 6.0 $ 454.4 $ 4,633.7 $ (239.7) $ 4,854.4Net income — — — 1,228.6 — 1,228.6Other comprehensive (loss) — — — — (36.6) (36.6)Common stock issued, stock-based
compensation plans and other 9.6 0.1 117.4 — — 117.5Tax benefit, stock-based
compensation plans — — 32.1 — — 32.1Stock-based compensation
expense — — 118.8 — — 118.8Repurchases of common stock (5.3) — (179.0) — — (179.0)Balance, December 31, 2013 607.7 6.1 543.7 5,862.3 (276.3) 6,135.8Net income — — — 1,439.3 — 1,439.3Other comprehensive income — — — — 153.2 153.2Common stock issued, stock-based
compensation plans and other 6.7 0.1 101.3 — — 101.4Tax benefit, stock-based
compensation plans — — 24.0 — — 24.0Stock-based compensation
expense — — 134.8 — — 134.8Repurchases of common stock (5.0) (0.1) (248.2) — — (248.3)Balance, December 31, 2014 609.4 6.1 555.6 7,301.6 (123.1) 7,740.2Net income — — — 1,623.6 — 1,623.6Other comprehensive income — — — — 16.9 16.9Common stock issued, stock-based
compensation plans and other 6.9 0.1 131.5 — — 131.6Tax benefit, stock-based
compensation plans — — 33.8 — — 33.8Stock-based compensation
expense — — 192.0 — — 192.0Repurchases of common stock (7.3) (0.1) (459.9) — — (460.0)Balance, December 31, 2015 609.0 $ 6.1 $ 453.0 $ 8,925.2 $ (106.2) $ 9,278.1
The accompanying notes are an integral part of the consolidated financial statements.
F-6
Source: COGNIZANT TECHNOLOGY SOLUTIONS CORP, 10-K, February 25, 2016 Powered by Morningstar® Document Research℠The information contained herein may not be copied, adapted or distributed and is not warranted to be accurate, complete or timely. The user assumes all risks for any damages or losses arising from any use of this information,except to the extent such damages or losses cannot be limited or excluded by applicable law. Past financial performance is no guarantee of future results.
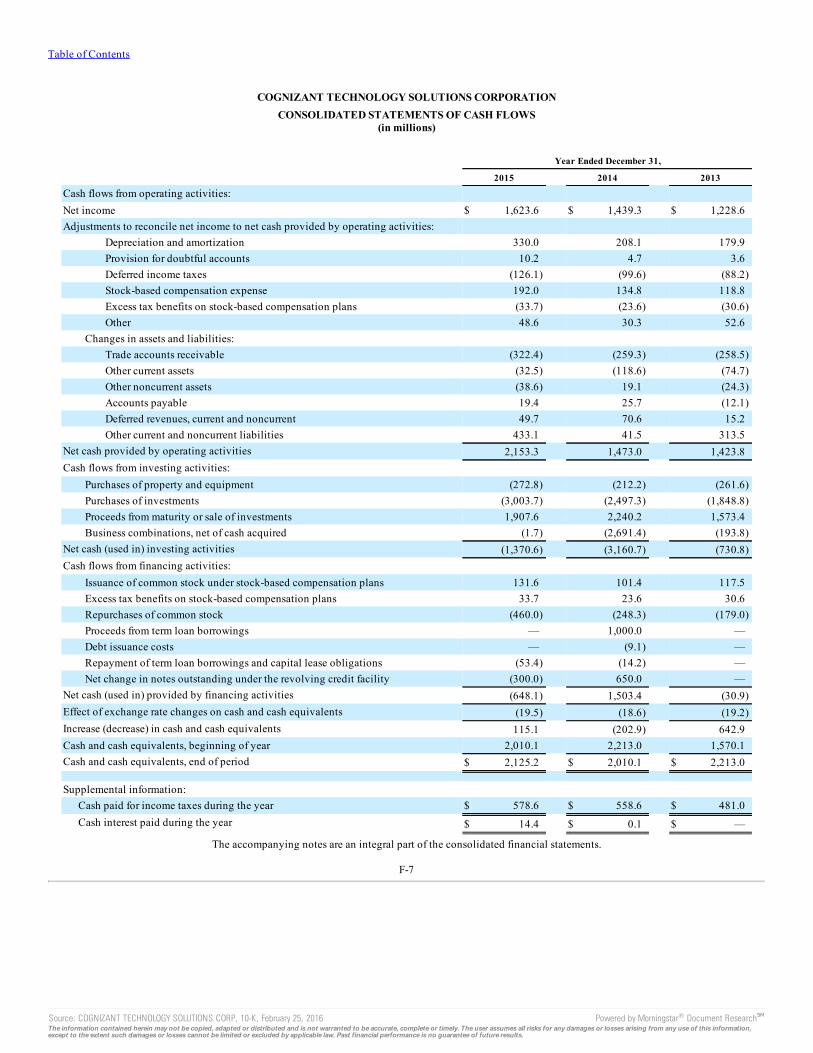
Table of Contents
COGNIZANT TECHNOLOGY SOLUTIONS CORPORATIONCONSOLIDATED STATEMENTS OF CASH FLOWS
(in millions)
Year Ended December 31,
2015 2014 2013
Cash flows from operating activities: Net income $ 1,623.6 $ 1,439.3 $ 1,228.6Adjustments to reconcile net income to net cash provided by operating activities:
Depreciation and amortization 330.0 208.1 179.9Provision for doubtful accounts 10.2 4.7 3.6Deferred income taxes (126.1) (99.6) (88.2)Stock-based compensation expense 192.0 134.8 118.8Excess tax benefits on stock-based compensation plans (33.7) (23.6) (30.6)Other 48.6 30.3 52.6
Changes in assets and liabilities: Trade accounts receivable (322.4) (259.3) (258.5)Other current assets (32.5) (118.6) (74.7)Other noncurrent assets (38.6) 19.1 (24.3)Accounts payable 19.4 25.7 (12.1)Deferred revenues, current and noncurrent 49.7 70.6 15.2Other current and noncurrent liabilities 433.1 41.5 313.5
Net cash provided by operating activities 2,153.3 1,473.0 1,423.8Cash flows from investing activities:
Purchases of property and equipment (272.8) (212.2) (261.6)Purchases of investments (3,003.7) (2,497.3) (1,848.8)Proceeds from maturity or sale of investments 1,907.6 2,240.2 1,573.4Business combinations, net of cash acquired (1.7) (2,691.4) (193.8)
Net cash (used in) investing activities (1,370.6) (3,160.7) (730.8)Cash flows from financing activities:
Issuance of common stock under stock-based compensation plans 131.6 101.4 117.5Excess tax benefits on stock-based compensation plans 33.7 23.6 30.6Repurchases of common stock (460.0) (248.3) (179.0)Proceeds from term loan borrowings — 1,000.0 —Debt issuance costs — (9.1) —Repayment of term loan borrowings and capital lease obligations (53.4) (14.2) —Net change in notes outstanding under the revolving credit facility (300.0) 650.0 —
Net cash (used in) provided by financing activities (648.1) 1,503.4 (30.9)Effect of exchange rate changes on cash and cash equivalents (19.5) (18.6) (19.2)Increase (decrease) in cash and cash equivalents 115.1 (202.9) 642.9Cash and cash equivalents, beginning of year 2,010.1 2,213.0 1,570.1Cash and cash equivalents, end of period $ 2,125.2 $ 2,010.1 $ 2,213.0
Supplemental information:
Cash paid for income taxes during the year $ 578.6 $ 558.6 $ 481.0Cash interest paid during the year $ 14.4 $ 0.1 $ —
The accompanying notes are an integral part of the consolidated financial statements.
F-7
Source: COGNIZANT TECHNOLOGY SOLUTIONS CORP, 10-K, February 25, 2016 Powered by Morningstar® Document Research℠The information contained herein may not be copied, adapted or distributed and is not warranted to be accurate, complete or timely. The user assumes all risks for any damages or losses arising from any use of this information,except to the extent such damages or losses cannot be limited or excluded by applicable law. Past financial performance is no guarantee of future results.
Table of Contents
Notes to Consolidated Financial Statements(Dollars in millions, except share data)
Note 1 — Business Description and Summary of Significant Accounting PoliciesThe terms “Cognizant,” “we,” “our,” “us” and “the Company” refer to Cognizant Technology Solutions Corporation and its subsidiaries unless the
context indicates otherwise.
Description of Business. We are a leading provider of information technology (IT), consulting and business process services, dedicated to helping theworld’s leading companies build stronger businesses. Our clients engage us to help them operate more efficiently, provide solutions to critical business andtechnology problems, and help them drive technology-based innovation and growth. Our core competencies include: business, process, operations and ITconsulting, application development and systems integration, enterprise information management, application testing, application maintenance,infrastructure services, and business process services. We tailor our services to specific industries and utilize an integrated global delivery model. Thisseamless global sourcing model combines industry-specific expertise, client service teams based on-site at the client locations and delivery teams located atdedicated near-shore and offshore global delivery centers.
Basis of Presentation and Principles of Consolidation. The consolidated financial statements are presented in accordance with generally acceptedaccounting principles in the United States of America, or U.S. GAAP, and reflect the consolidated financial position, results of operations, comprehensiveincome and cash flows of our consolidated subsidiaries for all periods presented. All intercompany balances and transactions have been eliminated inconsolidation.
Cash and Cash Equivalents and Investments. Cash and cash equivalents consist of all cash balances, including money market funds and liquidinstruments. Liquid instruments are classified as cash equivalents when their maturities at the date of purchase are three months or less and as short-terminvestments when their maturities at the date of purchase are greater than three months.
We determine the appropriate classification of our investments in marketable securities at the date of purchase and reevaluate such designation at eachbalance sheet date. We have classified and accounted for our marketable securities as available-for-sale. After consideration of our risk versus rewardobjectives, as well as our liquidity requirements, we may sell these securities prior to their stated maturities. As we view these marketable securities asavailable to support current operations, we classify such securities with maturities at the date of purchase beyond twelve months as short-term investmentsbecause such investments represent an investment in cash that is available for current operations.
Available-for-sale securities are reported at fair value with changes in unrealized gains and losses recorded as a separate component of accumulatedother comprehensive income (loss) until realized. We determine the cost of the securities sold based on the specific identification method. Time deposits withfinancial institutions are valued at cost, which approximates fair value.
Interest and amortization of premiums and discounts for debt securities are included in interest income. We also evaluate our available-for-saleinvestments periodically for possible other-than-temporary impairment by reviewing factors such as the length of time and extent to which fair value hasbeen below cost basis, the financial condition of the issuer, whether we intend to sell the security and whether it is more likely than not that we will berequired to sell the security prior to recovery of its amortized cost basis. Once a decline in fair value is determined to be other-than-temporary, an impairmentcharge is generally recorded to income and a new cost basis in the investment is established.
Allowance for Doubtful Accounts. We maintain an allowance for doubtful accounts for estimated losses resulting from the inability of our customers tomake required payments. The allowance for doubtful accounts is determined by evaluating the relative credit-worthiness of each customer, historicalcollections experience and other information, including the aging of the receivables. We evaluate the collectibility of our accounts receivable on an on-going basis and write-off accounts when they are deemed to be uncollectible.
Unbilled Accounts Receivable. Unbilled accounts receivable represent revenues recognized on contracts to be billed, in subsequent periods, as per theterms of the related contracts.
Short-term Financial Assets and Liabilities. Cash and certain cash equivalents, trade receivables, accounts payable and other accrued liabilities areshort-term in nature and, accordingly, their carrying values approximate fair value.
Property and Equipment. Property and equipment are stated at cost, net of accumulated depreciation. Depreciation is calculated on a straight-line basisover the estimated useful lives of the assets. Leasehold improvements are amortized on a straight-line basis over the shorter of the term of the lease or theestimated useful life of the improvement. In India, leasehold
F-8
Source: COGNIZANT TECHNOLOGY SOLUTIONS CORP, 10-K, February 25, 2016 Powered by Morningstar® Document Research℠The information contained herein may not be copied, adapted or distributed and is not warranted to be accurate, complete or timely. The user assumes all risks for any damages or losses arising from any use of this information,except to the extent such damages or losses cannot be limited or excluded by applicable law. Past financial performance is no guarantee of future results.
Table of Contents
land is leased by us from the government of India with lease terms ranging up to 99 years. Lease payments are made at the inception of the lease agreementand amortized over the lease term. Maintenance and repairs are expensed as incurred, while renewals and betterments are capitalized. Deposits paid towardsacquisition of long-lived assets and the cost of assets not put in use before the balance sheet date are disclosed under the caption “capital work-in-progress”in Note 4.
Internal Use Software. We capitalize certain costs that are incurred to purchase, develop and implement internal-use software during the applicationdevelopment phase, which primarily include coding, testing and certain data conversion activities. Capitalized costs are amortized on a straight-line basisover the useful life of the software. Costs incurred in performing activities associated with the preliminary project phase and the post-implementation phaseare expensed as incurred.
Business Combinations. We account for business combinations using the acquisition method, which requires the identification of the acquirer, thedetermination of the acquisition date and the allocation of the purchase price paid by the acquirer to the identifiable tangible and intangible assets acquired,the liabilities assumed and any noncontrolling interest in the acquiree at their acquisition date fair values. Goodwill represents the excess of the purchaseprice over the fair value of net assets acquired, including the amount assigned to identifiable intangible assets. Identifiable intangible assets with finite livesare amortized over their useful lives. Acquisition-related costs are expensed in the periods in which the costs are incurred. The results of operations ofacquired businesses are included in our consolidated financial statements from the acquisition date.
Long-lived Assets and Finite-lived Intangibles. We review long-lived assets and certain finite-lived identifiable intangibles for impairment wheneverevents or changes in circumstances indicate that the carrying amount of an asset may not be recoverable. We recognize an impairment loss when the sum ofundiscounted expected future cash flows is less than the carrying amount of such assets. The impairment loss would equal the amount by which the carryingamount of the asset exceeds the fair value of the asset. Intangible assets consist primarily of customer relationships and developed technology, which arebeing amortized on a straight-line basis over their estimated useful lives.
Goodwill and Indefinite-lived Intangibles. We evaluate goodwill and indefinite-lived intangible assets for impairment at least annually, or ascircumstances warrant. Goodwill is evaluated at the reporting unit level by comparing the fair value of the reporting unit with its carrying amount. Forindefinite-lived intangible assets, if our annual qualitative assessment indicates possible impairment, we test the assets for impairment by comparing the fairvalue of such assets to their carrying value. In determining the fair value, we utilize various estimates and assumptions, including discount rates andprojections of future cash flows. If an impairment is indicated, a write down to the implied fair value of goodwill or fair value of indefinite-lived intangibleasset is recorded.
Stock Repurchase Program. Our existing stock repurchase program, as amended and approved by our Board of Directors, allows for the repurchase of$2,000.0 million of our outstanding shares of Class A common stock and expires on December 31, 2017. Through December 31, 2015, we completed stockrepurchases of 41.2 million shares for $1,562.4 million, inclusive of fees and expenses, under this program. During 2015, 2014 and 2013, we repurchased 6.0million, 3.8 million and 4.1 million shares respectively, at an aggregate cost of $376.0 million, $188.2 million and $131.6 million, respectively. Additionalstock repurchases were made in connection with our stock-based compensation plans, whereby Company shares were tendered by employees for payment ofapplicable statutory tax withholdings. During 2015, 2014 and 2013 such repurchases totaled 1.3 million, 1.2 million and 1.2 million shares, respectively, atan aggregate cost of $84.0 million, $60.1 million and $47.4 million, respectively. At the time of repurchase, shares are returned to the status of authorized andunissued shares. We account for the repurchases as constructively retired and record such repurchases as a reduction of Class A common stock and additionalpaid-in capital.
Revenue Recognition. Revenues related to time-and-material contracts are recognized as the service is performed and amounts are earned. Revenuesfrom transaction-priced contracts are recognized as transactions are processed and amounts are earned. Revenues related to fixed-price contracts for highlycomplex application development and systems integration services are recognized as the service is performed using the percentage of completion method ofaccounting, under which the total value of revenue is recognized on the basis of the percentage that each contract’s total labor cost to date bears to the totalexpected labor costs (cost to cost method). Revenues related to fixed price outsourcing services are recognized on a straight-line basis unless revenues areearned and obligations are fulfilled in a different pattern. Revenues related to fixed-price contracts for consulting or other IT services are recognized asservices are performed on a proportional performance basis based upon the level of effort.
For all services, revenue is earned and recognized only when all of the following criteria are met: evidence of an arrangement exists, the price is fixed ordeterminable, the services have been rendered and collectibility is reasonably assured. Contingent or incentive revenues are recognized when thecontingency is satisfied and we conclude the amounts are earned.
F-9
Source: COGNIZANT TECHNOLOGY SOLUTIONS CORP, 10-K, February 25, 2016 Powered by Morningstar® Document Research℠The information contained herein may not be copied, adapted or distributed and is not warranted to be accurate, complete or timely. The user assumes all risks for any damages or losses arising from any use of this information,except to the extent such damages or losses cannot be limited or excluded by applicable law. Past financial performance is no guarantee of future results.
Table of Contents
Volume discounts are recorded as a reduction of revenue over the contract period as services are provided. Revenues also include the reimbursement of out-of-pocket expenses.
Costs to deliver services are expensed as incurred with the exception of specific costs directly related to transition or set-up activities for outsourcingcontracts. Transition costs are deferred and expensed ratably over the period of service. Generally, deferred amounts are protected by collected cash or earlytermination penalty clauses and are monitored regularly for impairment. Impairment losses are recorded when projected remaining undiscounted operatingcash flows of the related contract are not sufficient to recover the carrying amount of the contract assets. Deferred transition costs were approximately $137.4million and $98.2 million as of December 31, 2015 and 2014, respectively, and are included in other noncurrent assets in our consolidated statements offinancial position. Costs related to warranty provisions are accrued at the time the related revenues are recorded.
We may enter into arrangements that consist of multiple elements. Such arrangements may include any combination of our consulting and technologyservices and outsourcing services. For arrangements with multiple deliverables, we evaluate at the inception of each new arrangement all deliverables todetermine whether they represent separate units of accounting. For arrangements with multiple units of accounting, other than arrangements that containsoftware licenses and software-related services, we allocate consideration among the units of accounting, where separable, based on their relative sellingprice. Relative selling price is determined based on vendor-specific objective evidence, or VSOE, if it exists. Otherwise, third-party evidence of selling priceis used, when it is available, and in circumstances when neither VSOE nor third-party evidence of selling price is available, management’s best estimate ofselling price is used. Revenue is recognized for each unit of accounting based on our revenue recognition policy described above.
Fixed-price contracts are generally cancelable subject to a specified notice period. All services provided by us through the date of cancellation are dueand payable under the contract terms. We issue invoices related to fixed-price contracts based upon achievement of milestones during a project or othercontractual terms. Differences between the timing of billing, based on contract milestones or other contractual terms, and the recognition of revenue arerecognized as either unbilled receivables or deferred revenue. Estimates of certain fixed-price contracts are subject to adjustment as a project progresses toreflect changes in expected completion costs or efforts. The cumulative impact of any revision in estimates is reflected in the financial reporting period inwhich the change in estimate becomes known and any anticipated losses on contracts are recognized immediately.
We also generate product revenue from licensing our software. For perpetual software license arrangements that do not require significant modificationor customization of the underlying software, revenue is recognized when the software is delivered and all other software revenue recognition criteria are met.For software license arrangements that require significant functionality enhancements or modification of the software, revenue for the software license andthose services is recognized as those services are performed. For software license arrangements that include a right to use the product for a defined period oftime, we recognize revenue ratably over the term of the license.
We may enter into arrangements with customers that purchase both software licenses and software-related services from us at the same time, or withinclose proximity of one another (referred to as software-related multiple-element arrangements). Such software related multiple-element arrangements mayinclude software licenses, software license updates, product support contracts and other software-related services. For those software related multiple-elementarrangements, we apply the residual method to determine the amount of software license revenue. Under the residual method, if VSOE of fair value exists forundelivered elements in a multiple-element arrangement, revenue equal to the fair value of the undelivered elements is deferred with the remaining portion ofthe arrangement consideration generally recognized upon delivery of the software license. For arrangements in which VSOE of fair value does not exist foreach software-related undelivered element, revenue for the software license is deferred and not recognized until VSOE of fair value is available for theundelivered element or delivery of each element has occurred. If the only undelivered element is a service, revenue from the delivered element is recognizedover the service period.
We also enter into multiple-element arrangements that may include a combination of software licenses and various software-related and non-software-related services. In such arrangements, we first allocate the total arrangement consideration, based on relative selling prices, between the software group ofelements and the non-software group of elements. We then further allocate consideration within the software group to the respective elements within thatgroup following the software-related multiple-element arrangements policies described above. For the non-software group of elements, we further allocateconsideration to the respective elements based on relative selling prices. After the arrangement consideration has been allocated to the individual elements,we account for each respective element in the arrangement as described above.
F-10
Source: COGNIZANT TECHNOLOGY SOLUTIONS CORP, 10-K, February 25, 2016 Powered by Morningstar® Document Research℠The information contained herein may not be copied, adapted or distributed and is not warranted to be accurate, complete or timely. The user assumes all risks for any damages or losses arising from any use of this information,except to the extent such damages or losses cannot be limited or excluded by applicable law. Past financial performance is no guarantee of future results.
Table of Contents
Stock-Based Compensation. Stock-based compensation expense for awards of equity instruments to employees and non-employee directors isdetermined based on the grant-date fair value of those awards. We recognize these compensation costs net of an estimated forfeiture rate over the requisiteservice period of the award. Forfeitures are estimated on the date of grant and revised if actual or expected forfeiture activity differs materially from originalestimates.
Foreign Currency. The assets and liabilities of our foreign subsidiaries whose functional currency is not the U.S. dollar are translated into U.S. dollarsfrom local currencies at current exchange rates and revenues and expenses are translated from local currencies at average monthly exchange rates. Theresulting translation adjustments are recorded in accumulated other comprehensive income (loss) on the accompanying consolidated statements of financialposition.
Foreign currency transactions and balances are those that are denominated in a currency other than the subsidiary’s functional currency. The U.S. dollaris the functional currency for certain foreign subsidiaries who conduct business predominantly in U.S. dollars. For these subsidiaries, transactions andbalances denominated in the local currency are foreign currency transactions. Foreign currency transactions and balances related to non-monetary assets andliabilities are remeasured to the functional currency of the subsidiary at historical exchange rates while monetary assets and liabilities are remeasured to thefunctional currency of the subsidiary at current exchange rates. Foreign currency exchange gains or losses from remeasurement are included in the "Foreigncurrency exchange gain (losses), net" line on our consolidated statement of operations together with gains or losses on our undesignated foreign currencyhedges.
Derivative Financial Instruments. Derivative financial instruments are accounted for in accordance with the authoritative guidance which requires thateach derivative instrument be recorded on the balance sheet as either an asset or liability measured at its fair value as of the reporting date. Our derivativefinancial instruments consist of foreign exchange forward contracts. For derivative financial instruments to qualify for hedge accounting, the followingcriteria must be met: (1) the hedging instrument must be designated as a hedge; (2) the hedged exposure must be specifically identifiable and must expose usto risk; and (3) it is expected that a change in fair value of the derivative financial instrument and an opposite change in the fair value of the hedged exposurewill have a high degree of correlation. The authoritative guidance requires that changes in our derivatives’ fair values be recognized in income unlessspecific hedge accounting and documentation criteria are met (i.e., the instruments are accounted for as hedges). We record the effective portion of theunrealized gains and losses on our derivative financial instruments that are designated as cash flow hedges in accumulated other comprehensive income(loss) in the accompanying consolidated statements of financial position. Any ineffectiveness or excluded portion of a designated cash flow hedge isrecognized in income. Upon settlement or maturity of the cash flow hedge contracts, the realized gains and losses are recognized in income.
Use of Estimates. The preparation of financial statements requires management to make estimates and assumptions that affect the reported amounts ofassets and liabilities, including the recoverability of tangible and intangible assets, disclosure of contingent assets and liabilities as of the date of thefinancial statements, and the reported amounts of revenues and expenses during the period. The most significant estimates relate to the recognition ofrevenue and profits based on the percentage of completion method of accounting for certain fixed-bid contracts, the allowance for doubtful accounts, incometaxes, assumptions used in valuing stock-based compensation arrangements, valuation of derivative financial instruments and investments, businesscombinations, intangible assets and other long-lived assets, valuation of goodwill, contingencies and litigation. We evaluate our estimates on a continuousbasis. We base our estimates on historical experience and on various other assumptions that are believed to be reasonable under the circumstances. The actualamounts may vary from the estimates used in the preparation of the accompanying consolidated financial statements.
Risks and Uncertainties. The majority of our development and delivery centers and employees are located in India. As a result, we may be subject tocertain risks associated with international operations, including risks associated with foreign currency exchange rate fluctuations and risks associated withthe application and imposition of protective legislation and regulations relating to import and export or otherwise resulting from foreign policy or thevariability of foreign economic or political conditions. Additional risks associated with international operations include difficulties in enforcing intellectualproperty rights, the burdens of complying with a wide variety of foreign laws, potential geo-political and other risks associated with terrorist activities andlocal or cross border conflicts and potentially adverse tax consequences, tariffs, quotas and other barriers.
Concentration of Credit Risk. Financial instruments that potentially subject us to significant concentrations of credit risk consist primarily of cash andcash equivalents, time deposits, investments in securities, derivative financial instruments and billed and unbilled accounts receivable. We maintain our cashand cash equivalents, investments and derivative financial instruments with high credit quality financial institutions, invest in investment-grade debtsecurities and limit the amount of credit exposure to any one commercial issuer. Our accounts receivable are dispersed across many customers operating indifferent industries; therefore, concentration of credit risk is limited.
F-11
Source: COGNIZANT TECHNOLOGY SOLUTIONS CORP, 10-K, February 25, 2016 Powered by Morningstar® Document Research℠The information contained herein may not be copied, adapted or distributed and is not warranted to be accurate, complete or timely. The user assumes all risks for any damages or losses arising from any use of this information,except to the extent such damages or losses cannot be limited or excluded by applicable law. Past financial performance is no guarantee of future results.
Table of Contents
Income Taxes. We provide for income taxes utilizing the asset and liability method of accounting. Under this method, deferred income taxes arerecorded to reflect the tax consequences in future years of differences between the tax basis of assets and liabilities and their financial reporting amounts ateach balance sheet date, based on enacted tax laws and statutory tax rates applicable to the periods in which the differences are expected to affect taxableincome. If it is determined that it is more likely than not that future tax benefits associated with a deferred income tax asset will not be realized, a valuationallowance is provided. The effect on deferred income tax assets and liabilities of a change in the tax rates is recognized in income in the period that includesthe enactment date. Tax benefits earned on exercise of employee stock options in excess of compensation charged to income are credited to additional paid-in capital. Our provision for income taxes also includes the impact of provisions established for uncertain income tax positions, as well as the related interest.
Earnings Per Share, or EPS. Basic EPS excludes dilution and is computed by dividing earnings available to common stockholders by the weighted-average number of common shares outstanding for the period. Diluted EPS includes all potential dilutive common stock in the weighted average sharesoutstanding. For purposes of computing diluted earnings per share for the years ended December 31, 2015, 2014 and 2013, respectively, 4.2 million, 4.4million and 5.7 million shares were assumed to have been outstanding related to common share equivalents. We exclude from the calculation of diluted EPSoptions with exercise prices that are greater than the average market price and shares related to stock-based awards whose combined exercise price,unamortized fair value and excess tax benefits were greater in each of those periods than the average market price of our common stock for the period,because their effect would be anti-dilutive. We excluded 0.1 million of anti-dilutive shares in 2015, 2014 and 2013 from our diluted EPS calculation. Weinclude performance stock unit awards in the dilutive potential common shares when they become contingently issuable per the authoritative guidance andexclude the awards when they are not contingently issuable.
Recently Adopted Accounting Pronouncement.
In November 2015, the Financial Accounting Standards Board, or FASB, issued an update to the standard on income taxes pertaining to the balancesheet classification of deferred income taxes. The update requires that all deferred income tax assets and liabilities, along with any related valuationallowance, within each tax jurisdiction be classified as noncurrent on the balance sheet. As a result, each tax jurisdiction will only have one net noncurrentdeferred income tax asset or liability. This guidance is effective on either a prospective or retrospective basis for fiscal years, and interim periods within thoseyears, beginning on or after January 1, 2017 with early adoption permitted. We elected to early adopt this guidance retrospectively in the fourth quarter of2015. We conformed prior years' presentation to current year's presentation on our consolidated statement of financial position. There is no impact on ourconsolidated statement of operations.
New Accounting Pronouncements.
In May 2014, the FASB issued a standard on revenue from contracts with customers. The new standard sets forth a single comprehensive model forrecognizing and reporting revenue. The standard also requires additional financial statement disclosures that will enable users to understand the nature,amount, timing and uncertainty of revenue and cash flows relating to customer contracts. In July 2015, the FASB deferred the effective date of the standardby one year to periods beginning on or after January 1, 2018. Early adoption is permitted but not before the original effective date of periods beginning on orafter January 1, 2017. The standard allows for two methods of adoption: the full retrospective adoption, which requires the standard to be applied to eachprior period presented, or the modified retrospective adoption, which requires the cumulative effect of adoption to be recognized as an adjustment to openingretained earnings in the period of adoption. We are currently evaluating the effect the new standard will have on our consolidated financial statements andrelated disclosures.
In April 2015, the FASB issued an update to the standard on interest related to the presentation of debt issuance costs. The standard requires debtissuance costs, other than costs incurred to secure lines of credit, be presented in the balance sheet as a direct deduction from the carrying value of that debtliability. The recognition and measurement guidance for debt issuance costs are not affected by this standard. The standard is effective on a retrospectivebasis for fiscal years, and interim periods within those years, beginning on or after January 1, 2016. The adoption of this standard will affect financialstatement presentation only and will have no effect on our financial condition or results of operations.
In April 2015, the FASB issued an update to the standard on internal-use software providing guidance to customers in evaluating whether a cloudcomputing arrangement includes a software license. If a cloud computing arrangement includes a software license, the standard requires the customer toaccount for the software license element of the arrangement consistent with the acquisition of other software licenses. If a cloud computing arrangement doesnot include a software license, the customer is required to account for the arrangement as a service contract. The standard is effective for fiscal years, andinterim periods within those years, beginning on or after January 1, 2016. A company can elect to adopt the amendments either prospectively to allarrangements entered into or materially modified after the effective date or retrospectively. We plan to adopt
F-12
Source: COGNIZANT TECHNOLOGY SOLUTIONS CORP, 10-K, February 25, 2016 Powered by Morningstar® Document Research℠The information contained herein may not be copied, adapted or distributed and is not warranted to be accurate, complete or timely. The user assumes all risks for any damages or losses arising from any use of this information,except to the extent such damages or losses cannot be limited or excluded by applicable law. Past financial performance is no guarantee of future results.
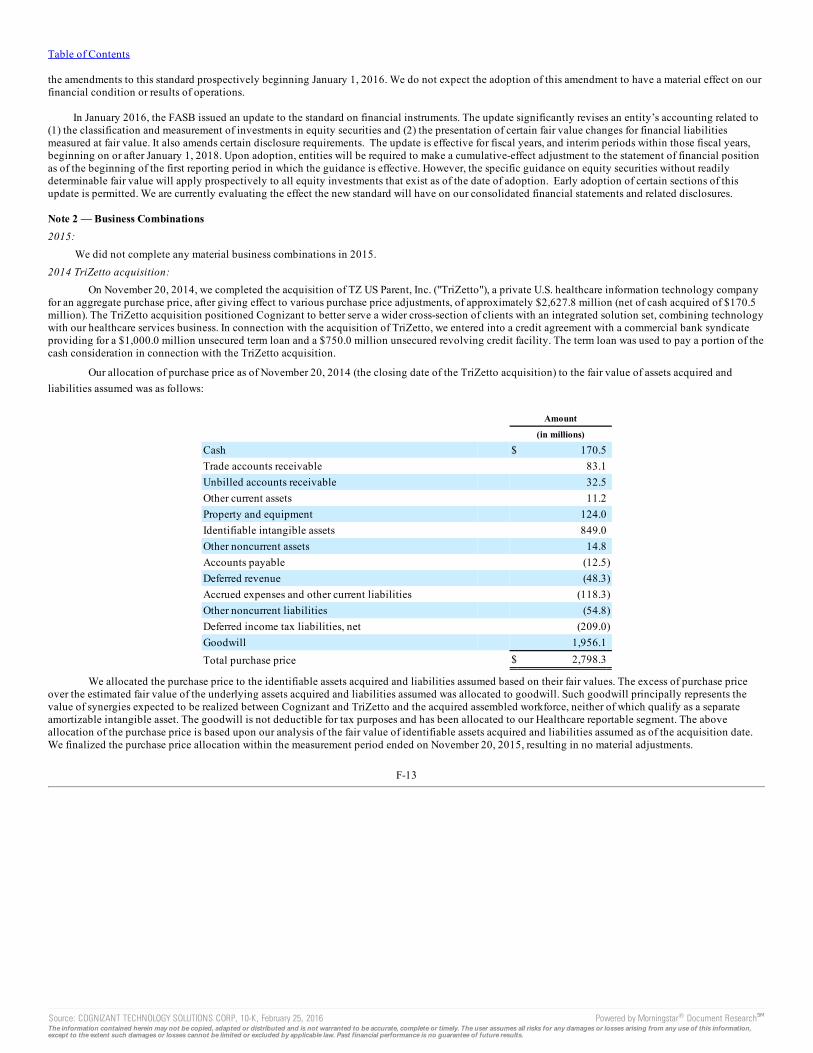
Table of Contents
the amendments to this standard prospectively beginning January 1, 2016. We do not expect the adoption of this amendment to have a material effect on ourfinancial condition or results of operations.
In January 2016, the FASB issued an update to the standard on financial instruments. The update significantly revises an entity’s accounting related to(1) the classification and measurement of investments in equity securities and (2) the presentation of certain fair value changes for financial liabilitiesmeasured at fair value. It also amends certain disclosure requirements. The update is effective for fiscal years, and interim periods within those fiscal years,beginning on or after January 1, 2018. Upon adoption, entities will be required to make a cumulative-effect adjustment to the statement of financial positionas of the beginning of the first reporting period in which the guidance is effective. However, the specific guidance on equity securities without readilydeterminable fair value will apply prospectively to all equity investments that exist as of the date of adoption. Early adoption of certain sections of thisupdate is permitted. We are currently evaluating the effect the new standard will have on our consolidated financial statements and related disclosures.
Note 2 — Business Combinations2015:
We did not complete any material business combinations in 2015.2014 TriZetto acquisition:
On November 20, 2014, we completed the acquisition of TZ US Parent, Inc. ("TriZetto"), a private U.S. healthcare information technology companyfor an aggregate purchase price, after giving effect to various purchase price adjustments, of approximately $2,627.8 million (net of cash acquired of $170.5million). The TriZetto acquisition positioned Cognizant to better serve a wider cross-section of clients with an integrated solution set, combining technologywith our healthcare services business. In connection with the acquisition of TriZetto, we entered into a credit agreement with a commercial bank syndicateproviding for a $1,000.0 million unsecured term loan and a $750.0 million unsecured revolving credit facility. The term loan was used to pay a portion of thecash consideration in connection with the TriZetto acquisition.
Our allocation of purchase price as of November 20, 2014 (the closing date of the TriZetto acquisition) to the fair value of assets acquired andliabilities assumed was as follows:
Amount
(in millions)
Cash $ 170.5Trade accounts receivable 83.1Unbilled accounts receivable 32.5Other current assets 11.2Property and equipment 124.0Identifiable intangible assets 849.0Other noncurrent assets 14.8Accounts payable (12.5)Deferred revenue (48.3)Accrued expenses and other current liabilities (118.3)Other noncurrent liabilities (54.8)Deferred income tax liabilities, net (209.0)Goodwill 1,956.1Total purchase price $ 2,798.3
We allocated the purchase price to the identifiable assets acquired and liabilities assumed based on their fair values. The excess of purchase priceover the estimated fair value of the underlying assets acquired and liabilities assumed was allocated to goodwill. Such goodwill principally represents thevalue of synergies expected to be realized between Cognizant and TriZetto and the acquired assembled workforce, neither of which qualify as a separateamortizable intangible asset. The goodwill is not deductible for tax purposes and has been allocated to our Healthcare reportable segment. The aboveallocation of the purchase price is based upon our analysis of the fair value of identifiable assets acquired and liabilities assumed as of the acquisition date.We finalized the purchase price allocation within the measurement period ended on November 20, 2015, resulting in no material adjustments.
F-13
Source: COGNIZANT TECHNOLOGY SOLUTIONS CORP, 10-K, February 25, 2016 Powered by Morningstar® Document Research℠The information contained herein may not be copied, adapted or distributed and is not warranted to be accurate, complete or timely. The user assumes all risks for any damages or losses arising from any use of this information,except to the extent such damages or losses cannot be limited or excluded by applicable law. Past financial performance is no guarantee of future results.
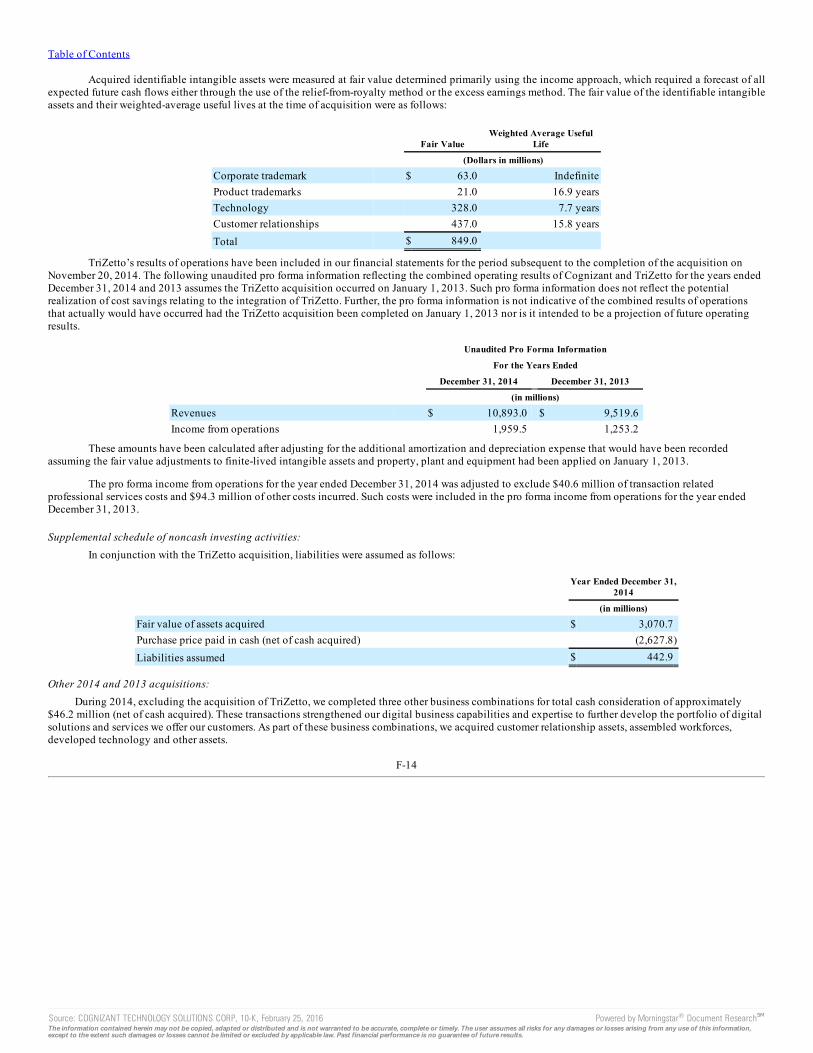
Table of Contents
Acquired identifiable intangible assets were measured at fair value determined primarily using the income approach, which required a forecast of allexpected future cash flows either through the use of the relief-from-royalty method or the excess earnings method. The fair value of the identifiable intangibleassets and their weighted-average useful lives at the time of acquisition were as follows:
Fair ValueWeighted Average Useful
Life
(Dollars in millions)
Corporate trademark $ 63.0 IndefiniteProduct trademarks 21.0 16.9 yearsTechnology 328.0 7.7 yearsCustomer relationships 437.0 15.8 yearsTotal $ 849.0
TriZetto’s results of operations have been included in our financial statements for the period subsequent to the completion of the acquisition onNovember 20, 2014. The following unaudited pro forma information reflecting the combined operating results of Cognizant and TriZetto for the years endedDecember 31, 2014 and 2013 assumes the TriZetto acquisition occurred on January 1, 2013. Such pro forma information does not reflect the potentialrealization of cost savings relating to the integration of TriZetto. Further, the pro forma information is not indicative of the combined results of operationsthat actually would have occurred had the TriZetto acquisition been completed on January 1, 2013 nor is it intended to be a projection of future operatingresults.
Unaudited Pro Forma Information
For the Years Ended
December 31, 2014 December 31, 2013
(in millions)
Revenues $ 10,893.0 $ 9,519.6Income from operations 1,959.5 1,253.2
These amounts have been calculated after adjusting for the additional amortization and depreciation expense that would have been recordedassuming the fair value adjustments to finite-lived intangible assets and property, plant and equipment had been applied on January 1, 2013.
The pro forma income from operations for the year ended December 31, 2014 was adjusted to exclude $40.6 million of transaction relatedprofessional services costs and $94.3 million of other costs incurred. Such costs were included in the pro forma income from operations for the year endedDecember 31, 2013.
Supplemental schedule of noncash investing activities:In conjunction with the TriZetto acquisition, liabilities were assumed as follows:
Year Ended December 31,
2014
(in millions)
Fair value of assets acquired $ 3,070.7Purchase price paid in cash (net of cash acquired) (2,627.8)Liabilities assumed $ 442.9
Other 2014 and 2013 acquisitions:During 2014, excluding the acquisition of TriZetto, we completed three other business combinations for total cash consideration of approximately
$46.2 million (net of cash acquired). These transactions strengthened our digital business capabilities and expertise to further develop the portfolio of digitalsolutions and services we offer our customers. As part of these business combinations, we acquired customer relationship assets, assembled workforces,developed technology and other assets.
F-14
Source: COGNIZANT TECHNOLOGY SOLUTIONS CORP, 10-K, February 25, 2016 Powered by Morningstar® Document Research℠The information contained herein may not be copied, adapted or distributed and is not warranted to be accurate, complete or timely. The user assumes all risks for any damages or losses arising from any use of this information,except to the extent such damages or losses cannot be limited or excluded by applicable law. Past financial performance is no guarantee of future results.
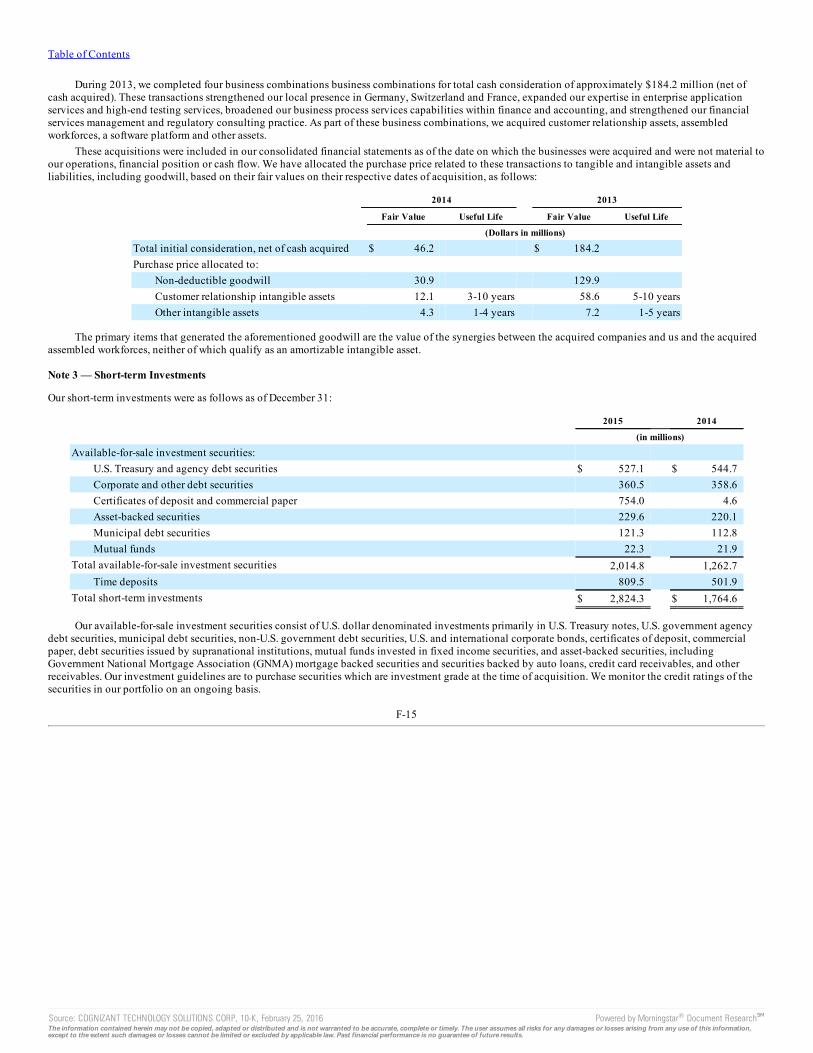
Table of Contents
During 2013, we completed four business combinations business combinations for total cash consideration of approximately $184.2 million (net ofcash acquired). These transactions strengthened our local presence in Germany, Switzerland and France, expanded our expertise in enterprise applicationservices and high-end testing services, broadened our business process services capabilities within finance and accounting, and strengthened our financialservices management and regulatory consulting practice. As part of these business combinations, we acquired customer relationship assets, assembledworkforces, a software platform and other assets.
These acquisitions were included in our consolidated financial statements as of the date on which the businesses were acquired and were not material toour operations, financial position or cash flow. We have allocated the purchase price related to these transactions to tangible and intangible assets andliabilities, including goodwill, based on their fair values on their respective dates of acquisition, as follows:
2014 2013
Fair Value Useful Life Fair Value Useful Life
(Dollars in millions)
Total initial consideration, net of cash acquired $ 46.2 $ 184.2 Purchase price allocated to:
Non-deductible goodwill 30.9 129.9 Customer relationship intangible assets 12.1 3-10 years 58.6 5-10 yearsOther intangible assets 4.3 1-4 years 7.2 1-5 years
The primary items that generated the aforementioned goodwill are the value of the synergies between the acquired companies and us and the acquiredassembled workforces, neither of which qualify as an amortizable intangible asset.
Note 3 — Short-term Investments
Our short-term investments were as follows as of December 31:
2015 2014
(in millions)
Available-for-sale investment securities: U.S. Treasury and agency debt securities $ 527.1 $ 544.7Corporate and other debt securities 360.5 358.6Certificates of deposit and commercial paper 754.0 4.6Asset-backed securities 229.6 220.1Municipal debt securities 121.3 112.8Mutual funds 22.3 21.9
Total available-for-sale investment securities 2,014.8 1,262.7Time deposits 809.5 501.9
Total short-term investments $ 2,824.3 $ 1,764.6
Our available-for-sale investment securities consist of U.S. dollar denominated investments primarily in U.S. Treasury notes, U.S. government agencydebt securities, municipal debt securities, non-U.S. government debt securities, U.S. and international corporate bonds, certificates of deposit, commercialpaper, debt securities issued by supranational institutions, mutual funds invested in fixed income securities, and asset-backed securities, includingGovernment National Mortgage Association (GNMA) mortgage backed securities and securities backed by auto loans, credit card receivables, and otherreceivables. Our investment guidelines are to purchase securities which are investment grade at the time of acquisition. We monitor the credit ratings of thesecurities in our portfolio on an ongoing basis.
F-15
Source: COGNIZANT TECHNOLOGY SOLUTIONS CORP, 10-K, February 25, 2016 Powered by Morningstar® Document Research℠The information contained herein may not be copied, adapted or distributed and is not warranted to be accurate, complete or timely. The user assumes all risks for any damages or losses arising from any use of this information,except to the extent such damages or losses cannot be limited or excluded by applicable law. Past financial performance is no guarantee of future results.
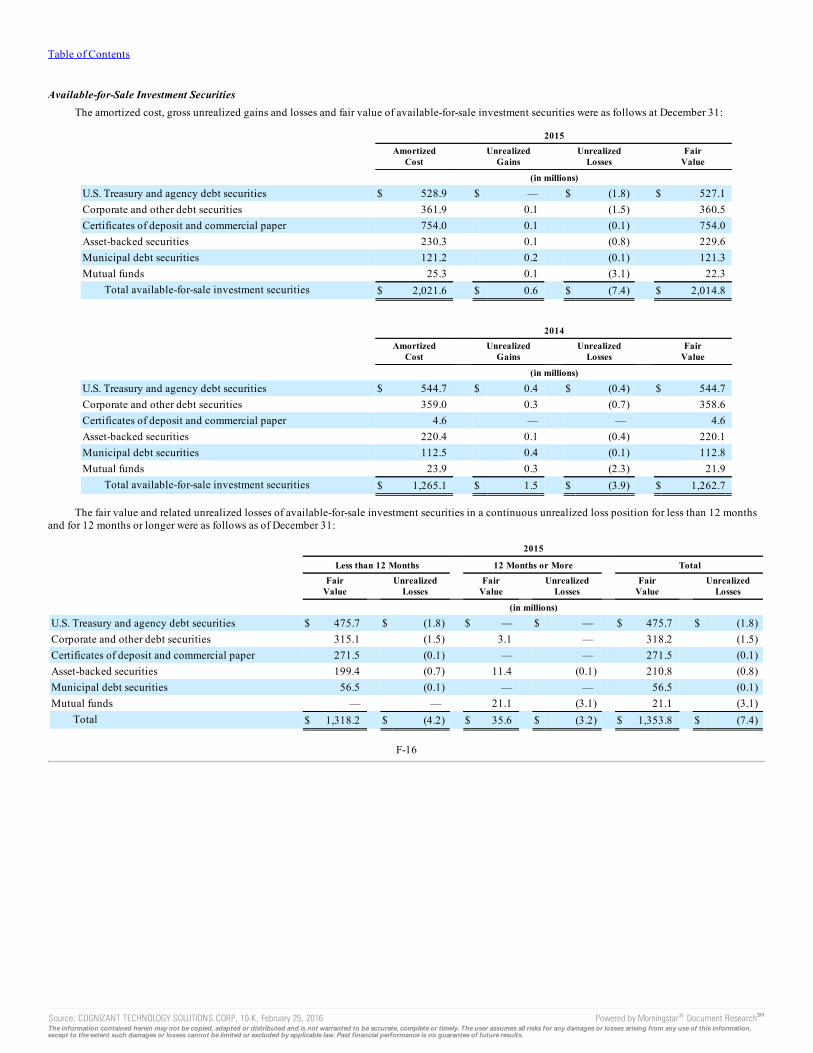
Table of Contents
Available-for-Sale Investment SecuritiesThe amortized cost, gross unrealized gains and losses and fair value of available-for-sale investment securities were as follows at December 31:
2015
Amortized
Cost Unrealized
Gains Unrealized
Losses Fair
Value
(in millions)
U.S. Treasury and agency debt securities $ 528.9 $ — $ (1.8) $ 527.1Corporate and other debt securities 361.9 0.1 (1.5) 360.5Certificates of deposit and commercial paper 754.0 0.1 (0.1) 754.0Asset-backed securities 230.3 0.1 (0.8) 229.6Municipal debt securities 121.2 0.2 (0.1) 121.3Mutual funds 25.3 0.1 (3.1) 22.3
Total available-for-sale investment securities $ 2,021.6 $ 0.6 $ (7.4) $ 2,014.8
2014
Amortized
Cost Unrealized
Gains Unrealized
Losses Fair
Value
(in millions)
U.S. Treasury and agency debt securities $ 544.7 $ 0.4 $ (0.4) $ 544.7Corporate and other debt securities 359.0 0.3 (0.7) 358.6Certificates of deposit and commercial paper 4.6 — — 4.6Asset-backed securities 220.4 0.1 (0.4) 220.1Municipal debt securities 112.5 0.4 (0.1) 112.8Mutual funds 23.9 0.3 (2.3) 21.9
Total available-for-sale investment securities $ 1,265.1 $ 1.5 $ (3.9) $ 1,262.7
The fair value and related unrealized losses of available-for-sale investment securities in a continuous unrealized loss position for less than 12 monthsand for 12 months or longer were as follows as of December 31:
2015
Less than 12 Months 12 Months or More Total
Fair
Value Unrealized
Losses Fair
Value Unrealized
Losses Fair
Value Unrealized
Losses
(in millions)
U.S. Treasury and agency debt securities $ 475.7 $ (1.8) $ — $ — $ 475.7 $ (1.8)Corporate and other debt securities 315.1 (1.5) 3.1 — 318.2 (1.5)Certificates of deposit and commercial paper 271.5 (0.1) — — 271.5 (0.1)Asset-backed securities 199.4 (0.7) 11.4 (0.1) 210.8 (0.8)Municipal debt securities 56.5 (0.1) — — 56.5 (0.1)Mutual funds — — 21.1 (3.1) 21.1 (3.1)
Total $ 1,318.2 $ (4.2) $ 35.6 $ (3.2) $ 1,353.8 $ (7.4)
F-16
Source: COGNIZANT TECHNOLOGY SOLUTIONS CORP, 10-K, February 25, 2016 Powered by Morningstar® Document Research℠The information contained herein may not be copied, adapted or distributed and is not warranted to be accurate, complete or timely. The user assumes all risks for any damages or losses arising from any use of this information,except to the extent such damages or losses cannot be limited or excluded by applicable law. Past financial performance is no guarantee of future results.
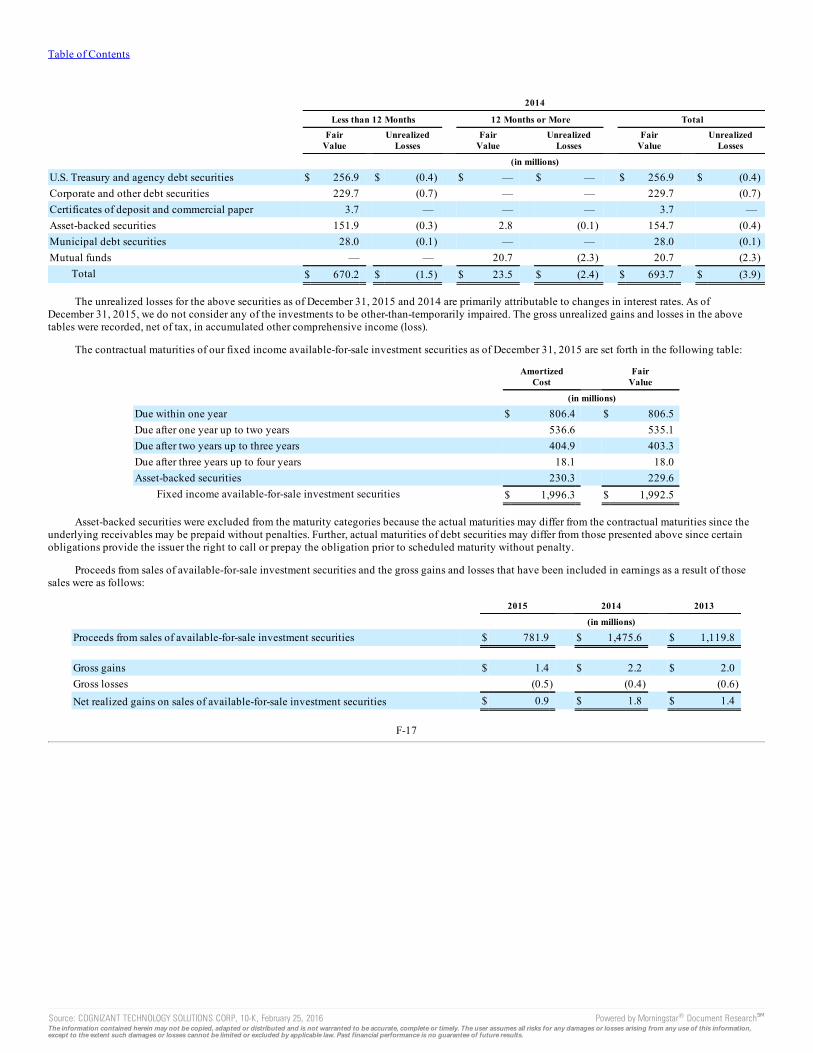
Table of Contents
2014
Less than 12 Months 12 Months or More Total
Fair
Value Unrealized
Losses Fair
Value Unrealized
Losses Fair
Value Unrealized
Losses
(in millions)
U.S. Treasury and agency debt securities $ 256.9 $ (0.4) $ — $ — $ 256.9 $ (0.4)Corporate and other debt securities 229.7 (0.7) — — 229.7 (0.7)Certificates of deposit and commercial paper 3.7 — — — 3.7 —Asset-backed securities 151.9 (0.3) 2.8 (0.1) 154.7 (0.4)Municipal debt securities 28.0 (0.1) — — 28.0 (0.1)Mutual funds — — 20.7 (2.3) 20.7 (2.3)
Total $ 670.2 $ (1.5) $ 23.5 $ (2.4) $ 693.7 $ (3.9)
The unrealized losses for the above securities as of December 31, 2015 and 2014 are primarily attributable to changes in interest rates. As ofDecember 31, 2015, we do not consider any of the investments to be other-than-temporarily impaired. The gross unrealized gains and losses in the abovetables were recorded, net of tax, in accumulated other comprehensive income (loss).
The contractual maturities of our fixed income available-for-sale investment securities as of December 31, 2015 are set forth in the following table:
Amortized
Cost Fair
Value
(in millions)
Due within one year $ 806.4 $ 806.5Due after one year up to two years 536.6 535.1Due after two years up to three years 404.9 403.3Due after three years up to four years 18.1 18.0Asset-backed securities 230.3 229.6
Fixed income available-for-sale investment securities $ 1,996.3 $ 1,992.5
Asset-backed securities were excluded from the maturity categories because the actual maturities may differ from the contractual maturities since theunderlying receivables may be prepaid without penalties. Further, actual maturities of debt securities may differ from those presented above since certainobligations provide the issuer the right to call or prepay the obligation prior to scheduled maturity without penalty.
Proceeds from sales of available-for-sale investment securities and the gross gains and losses that have been included in earnings as a result of thosesales were as follows:
2015 2014 2013
(in millions)
Proceeds from sales of available-for-sale investment securities $ 781.9 $ 1,475.6 $ 1,119.8
Gross gains $ 1.4 $ 2.2 $ 2.0Gross losses (0.5) (0.4) (0.6)Net realized gains on sales of available-for-sale investment securities $ 0.9 $ 1.8 $ 1.4
F-17
Source: COGNIZANT TECHNOLOGY SOLUTIONS CORP, 10-K, February 25, 2016 Powered by Morningstar® Document Research℠The information contained herein may not be copied, adapted or distributed and is not warranted to be accurate, complete or timely. The user assumes all risks for any damages or losses arising from any use of this information,except to the extent such damages or losses cannot be limited or excluded by applicable law. Past financial performance is no guarantee of future results.
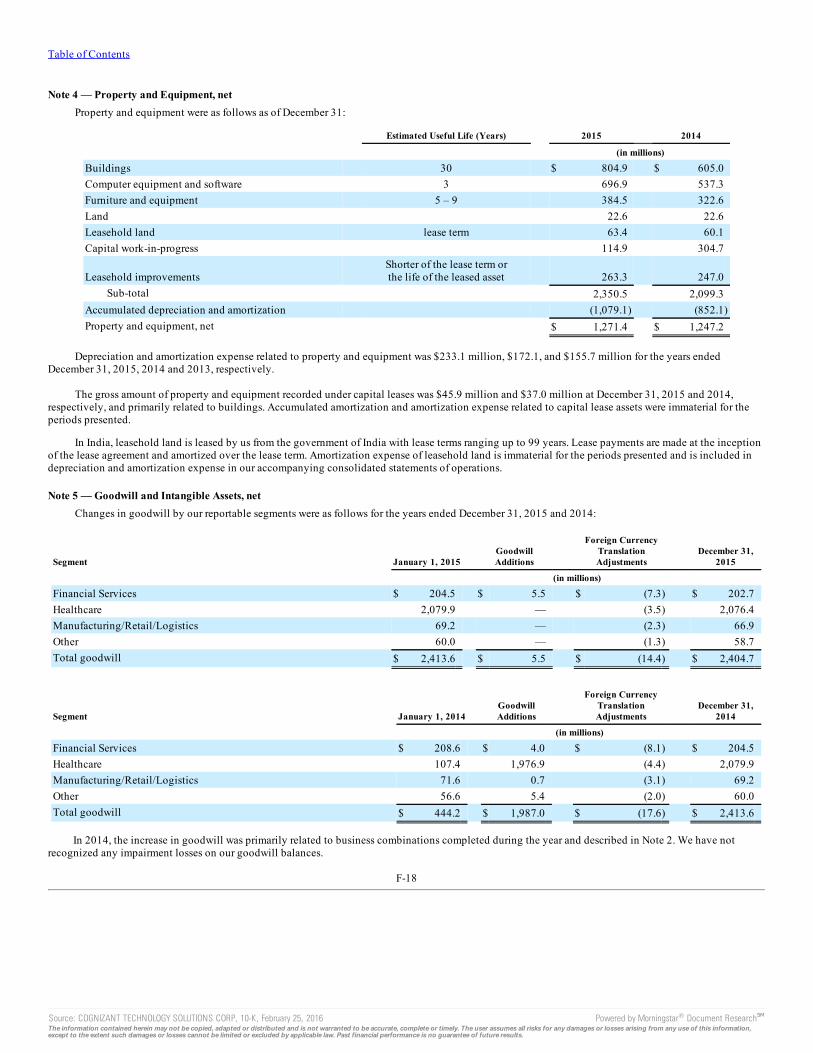
Table of Contents
Note 4 — Property and Equipment, netProperty and equipment were as follows as of December 31:
Estimated Useful Life (Years) 2015 2014
(in millions)
Buildings 30 $ 804.9 $ 605.0Computer equipment and software 3 696.9 537.3Furniture and equipment 5 – 9 384.5 322.6Land 22.6 22.6Leasehold land lease term 63.4 60.1Capital work-in-progress 114.9 304.7
Leasehold improvements Shorter of the lease term orthe life of the leased asset 263.3 247.0
Sub-total 2,350.5 2,099.3Accumulated depreciation and amortization (1,079.1) (852.1)Property and equipment, net $ 1,271.4 $ 1,247.2
Depreciation and amortization expense related to property and equipment was $233.1 million, $172.1, and $155.7 million for the years endedDecember 31, 2015, 2014 and 2013, respectively.
The gross amount of property and equipment recorded under capital leases was $45.9 million and $37.0 million at December 31, 2015 and 2014,respectively, and primarily related to buildings. Accumulated amortization and amortization expense related to capital lease assets were immaterial for theperiods presented.
In India, leasehold land is leased by us from the government of India with lease terms ranging up to 99 years. Lease payments are made at the inceptionof the lease agreement and amortized over the lease term. Amortization expense of leasehold land is immaterial for the periods presented and is included indepreciation and amortization expense in our accompanying consolidated statements of operations.
Note 5 — Goodwill and Intangible Assets, netChanges in goodwill by our reportable segments were as follows for the years ended December 31, 2015 and 2014:
Segment January 1, 2015 GoodwillAdditions
Foreign CurrencyTranslationAdjustments
December 31,2015
(in millions)
Financial Services $ 204.5 $ 5.5 $ (7.3) $ 202.7Healthcare 2,079.9 — (3.5) 2,076.4Manufacturing/Retail/Logistics 69.2 — (2.3) 66.9Other 60.0 — (1.3) 58.7Total goodwill $ 2,413.6 $ 5.5 $ (14.4) $ 2,404.7
Segment January 1, 2014 GoodwillAdditions
Foreign CurrencyTranslationAdjustments
December 31,2014
(in millions)
Financial Services $ 208.6 $ 4.0 $ (8.1) $ 204.5Healthcare 107.4 1,976.9 (4.4) 2,079.9Manufacturing/Retail/Logistics 71.6 0.7 (3.1) 69.2Other 56.6 5.4 (2.0) 60.0Total goodwill $ 444.2 $ 1,987.0 $ (17.6) $ 2,413.6
In 2014, the increase in goodwill was primarily related to business combinations completed during the year and described in Note 2. We have notrecognized any impairment losses on our goodwill balances.
F-18
Source: COGNIZANT TECHNOLOGY SOLUTIONS CORP, 10-K, February 25, 2016 Powered by Morningstar® Document Research℠The information contained herein may not be copied, adapted or distributed and is not warranted to be accurate, complete or timely. The user assumes all risks for any damages or losses arising from any use of this information,except to the extent such damages or losses cannot be limited or excluded by applicable law. Past financial performance is no guarantee of future results.
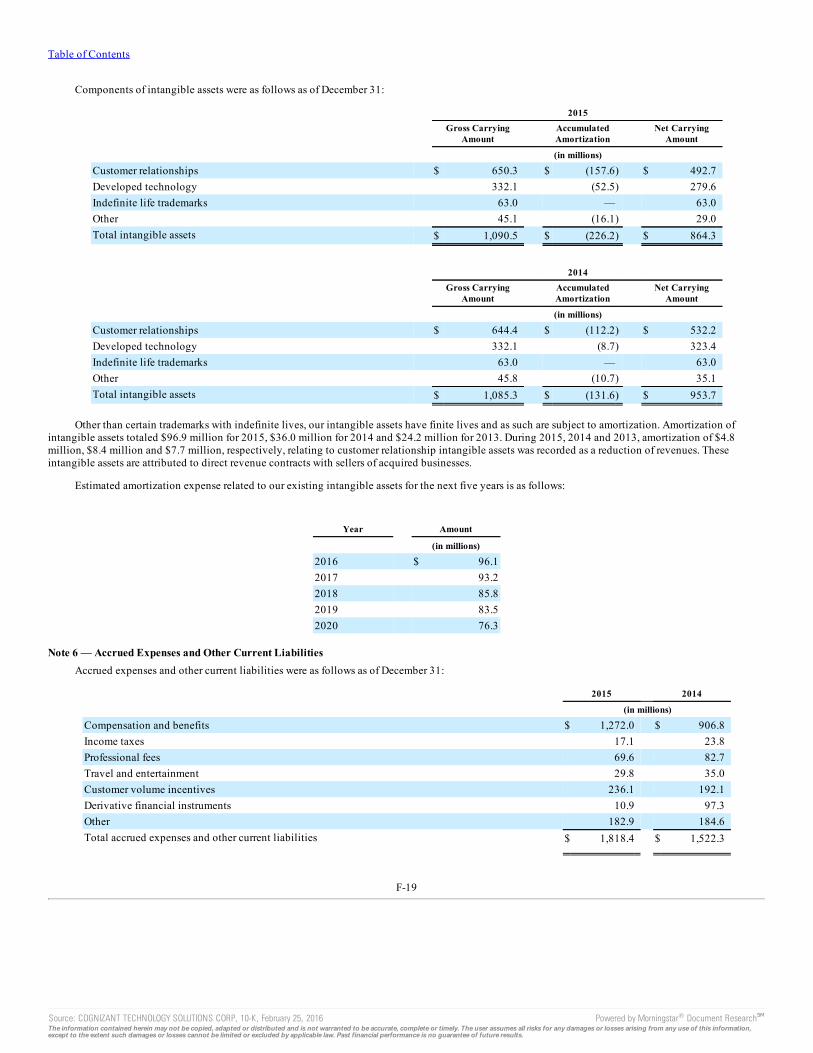
Table of Contents
Components of intangible assets were as follows as of December 31:
2015
Gross Carrying
Amount AccumulatedAmortization
Net CarryingAmount
(in millions)
Customer relationships $ 650.3 $ (157.6) $ 492.7Developed technology 332.1 (52.5) 279.6Indefinite life trademarks 63.0 — 63.0Other 45.1 (16.1) 29.0Total intangible assets $ 1,090.5 $ (226.2) $ 864.3
2014
Gross Carrying
Amount AccumulatedAmortization
Net CarryingAmount
(in millions)
Customer relationships $ 644.4 $ (112.2) $ 532.2Developed technology 332.1 (8.7) 323.4Indefinite life trademarks 63.0 — 63.0Other 45.8 (10.7) 35.1Total intangible assets $ 1,085.3 $ (131.6) $ 953.7
Other than certain trademarks with indefinite lives, our intangible assets have finite lives and as such are subject to amortization. Amortization ofintangible assets totaled $96.9 million for 2015, $36.0 million for 2014 and $24.2 million for 2013. During 2015, 2014 and 2013, amortization of $4.8million, $8.4 million and $7.7 million, respectively, relating to customer relationship intangible assets was recorded as a reduction of revenues. Theseintangible assets are attributed to direct revenue contracts with sellers of acquired businesses.
Estimated amortization expense related to our existing intangible assets for the next five years is as follows:
Year Amount
(in millions)
2016 $ 96.12017 93.22018 85.82019 83.52020 76.3
Note 6 — Accrued Expenses and Other Current LiabilitiesAccrued expenses and other current liabilities were as follows as of December 31:
2015 2014
(in millions)
Compensation and benefits $ 1,272.0 $ 906.8Income taxes 17.1 23.8Professional fees 69.6 82.7Travel and entertainment 29.8 35.0Customer volume incentives 236.1 192.1Derivative financial instruments 10.9 97.3Other 182.9 184.6Total accrued expenses and other current liabilities $ 1,818.4 $ 1,522.3
F-19
Source: COGNIZANT TECHNOLOGY SOLUTIONS CORP, 10-K, February 25, 2016 Powered by Morningstar® Document Research℠The information contained herein may not be copied, adapted or distributed and is not warranted to be accurate, complete or timely. The user assumes all risks for any damages or losses arising from any use of this information,except to the extent such damages or losses cannot be limited or excluded by applicable law. Past financial performance is no guarantee of future results.
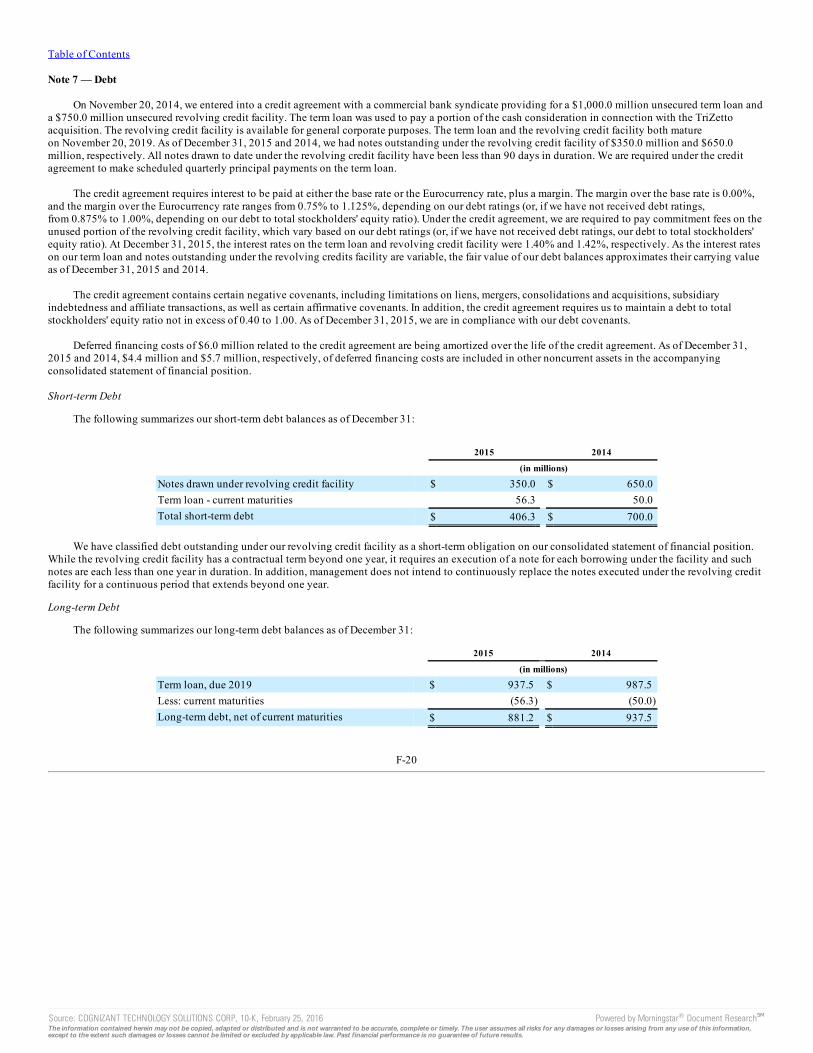
Table of Contents
Note 7 — Debt
On November 20, 2014, we entered into a credit agreement with a commercial bank syndicate providing for a $1,000.0 million unsecured term loan anda $750.0 million unsecured revolving credit facility. The term loan was used to pay a portion of the cash consideration in connection with the TriZettoacquisition. The revolving credit facility is available for general corporate purposes. The term loan and the revolving credit facility both matureon November 20, 2019. As of December 31, 2015 and 2014, we had notes outstanding under the revolving credit facility of $350.0 million and $650.0million, respectively. All notes drawn to date under the revolving credit facility have been less than 90 days in duration. We are required under the creditagreement to make scheduled quarterly principal payments on the term loan.
The credit agreement requires interest to be paid at either the base rate or the Eurocurrency rate, plus a margin. The margin over the base rate is 0.00%,and the margin over the Eurocurrency rate ranges from 0.75% to 1.125%, depending on our debt ratings (or, if we have not received debt ratings,from 0.875% to 1.00%, depending on our debt to total stockholders' equity ratio). Under the credit agreement, we are required to pay commitment fees on theunused portion of the revolving credit facility, which vary based on our debt ratings (or, if we have not received debt ratings, our debt to total stockholders'equity ratio). At December 31, 2015, the interest rates on the term loan and revolving credit facility were 1.40% and 1.42%, respectively. As the interest rateson our term loan and notes outstanding under the revolving credits facility are variable, the fair value of our debt balances approximates their carrying valueas of December 31, 2015 and 2014.
The credit agreement contains certain negative covenants, including limitations on liens, mergers, consolidations and acquisitions, subsidiaryindebtedness and affiliate transactions, as well as certain affirmative covenants. In addition, the credit agreement requires us to maintain a debt to totalstockholders' equity ratio not in excess of 0.40 to 1.00. As of December 31, 2015, we are in compliance with our debt covenants.
Deferred financing costs of $6.0 million related to the credit agreement are being amortized over the life of the credit agreement. As of December 31,2015 and 2014, $4.4 million and $5.7 million, respectively, of deferred financing costs are included in other noncurrent assets in the accompanyingconsolidated statement of financial position.
Short-term Debt
The following summarizes our short-term debt balances as of December 31:
2015 2014
(in millions)
Notes drawn under revolving credit facility $ 350.0 $ 650.0Term loan - current maturities 56.3 50.0Total short-term debt $ 406.3 $ 700.0
We have classified debt outstanding under our revolving credit facility as a short-term obligation on our consolidated statement of financial position.While the revolving credit facility has a contractual term beyond one year, it requires an execution of a note for each borrowing under the facility and suchnotes are each less than one year in duration. In addition, management does not intend to continuously replace the notes executed under the revolving creditfacility for a continuous period that extends beyond one year.
Long-term Debt
The following summarizes our long-term debt balances as of December 31:
2015 2014
(in millions)
Term loan, due 2019 $ 937.5 $ 987.5Less: current maturities (56.3) (50.0)Long-term debt, net of current maturities $ 881.2 $ 937.5
F-20
Source: COGNIZANT TECHNOLOGY SOLUTIONS CORP, 10-K, February 25, 2016 Powered by Morningstar® Document Research℠The information contained herein may not be copied, adapted or distributed and is not warranted to be accurate, complete or timely. The user assumes all risks for any damages or losses arising from any use of this information,except to the extent such damages or losses cannot be limited or excluded by applicable law. Past financial performance is no guarantee of future results.
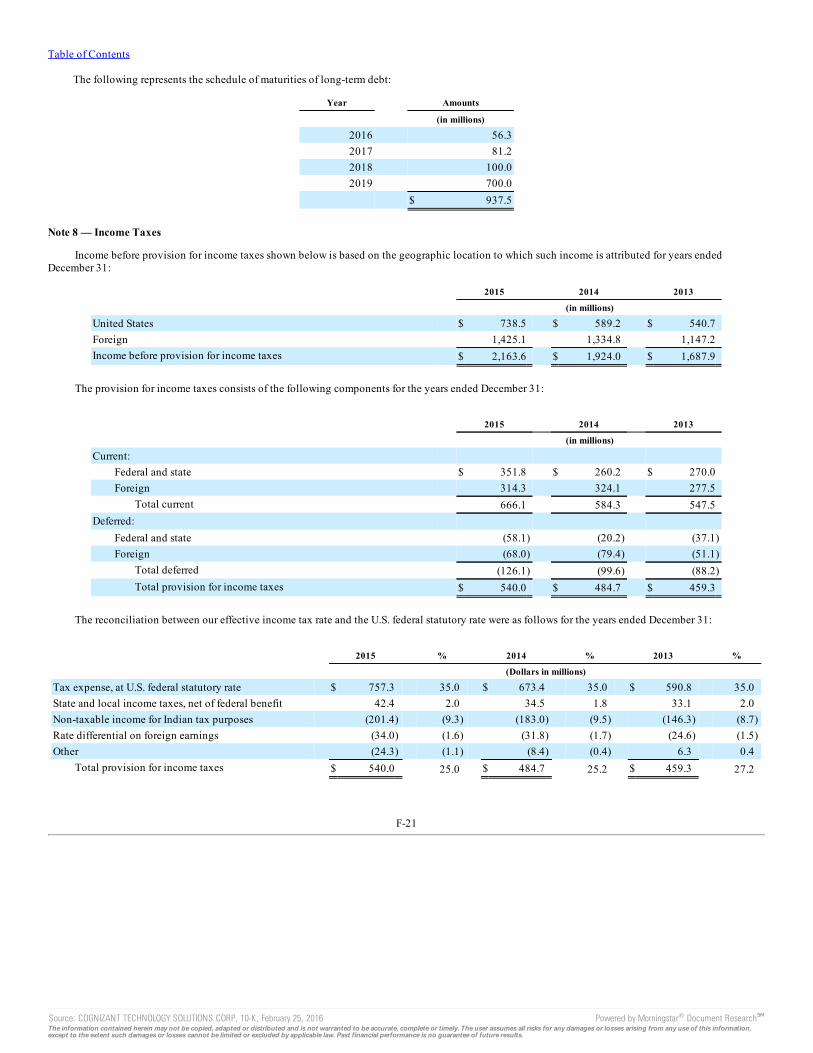
Table of Contents
The following represents the schedule of maturities of long-term debt:
Year Amounts
(in millions)
2016 56.32017 81.22018 100.02019 700.0
$ 937.5
Note 8 — Income Taxes
Income before provision for income taxes shown below is based on the geographic location to which such income is attributed for years endedDecember 31:
2015 2014 2013
(in millions)
United States $ 738.5 $ 589.2 $ 540.7Foreign 1,425.1 1,334.8 1,147.2Income before provision for income taxes $ 2,163.6 $ 1,924.0 $ 1,687.9
The provision for income taxes consists of the following components for the years ended December 31:
2015 2014 2013
(in millions)
Current: Federal and state $ 351.8 $ 260.2 $ 270.0Foreign 314.3 324.1 277.5
Total current 666.1 584.3 547.5Deferred:
Federal and state (58.1) (20.2) (37.1)Foreign (68.0) (79.4) (51.1)
Total deferred (126.1) (99.6) (88.2)Total provision for income taxes $ 540.0 $ 484.7 $ 459.3
The reconciliation between our effective income tax rate and the U.S. federal statutory rate were as follows for the years ended December 31:
2015 % 2014 % 2013 %
(Dollars in millions)
Tax expense, at U.S. federal statutory rate $ 757.3 35.0 $ 673.4 35.0 $ 590.8 35.0State and local income taxes, net of federal benefit 42.4 2.0 34.5 1.8 33.1 2.0Non-taxable income for Indian tax purposes (201.4) (9.3) (183.0) (9.5) (146.3) (8.7)Rate differential on foreign earnings (34.0) (1.6) (31.8) (1.7) (24.6) (1.5)Other (24.3) (1.1) (8.4) (0.4) 6.3 0.4
Total provision for income taxes $ 540.0 25.0 $ 484.7 25.2 $ 459.3 27.2
F-21
Source: COGNIZANT TECHNOLOGY SOLUTIONS CORP, 10-K, February 25, 2016 Powered by Morningstar® Document Research℠The information contained herein may not be copied, adapted or distributed and is not warranted to be accurate, complete or timely. The user assumes all risks for any damages or losses arising from any use of this information,except to the extent such damages or losses cannot be limited or excluded by applicable law. Past financial performance is no guarantee of future results.
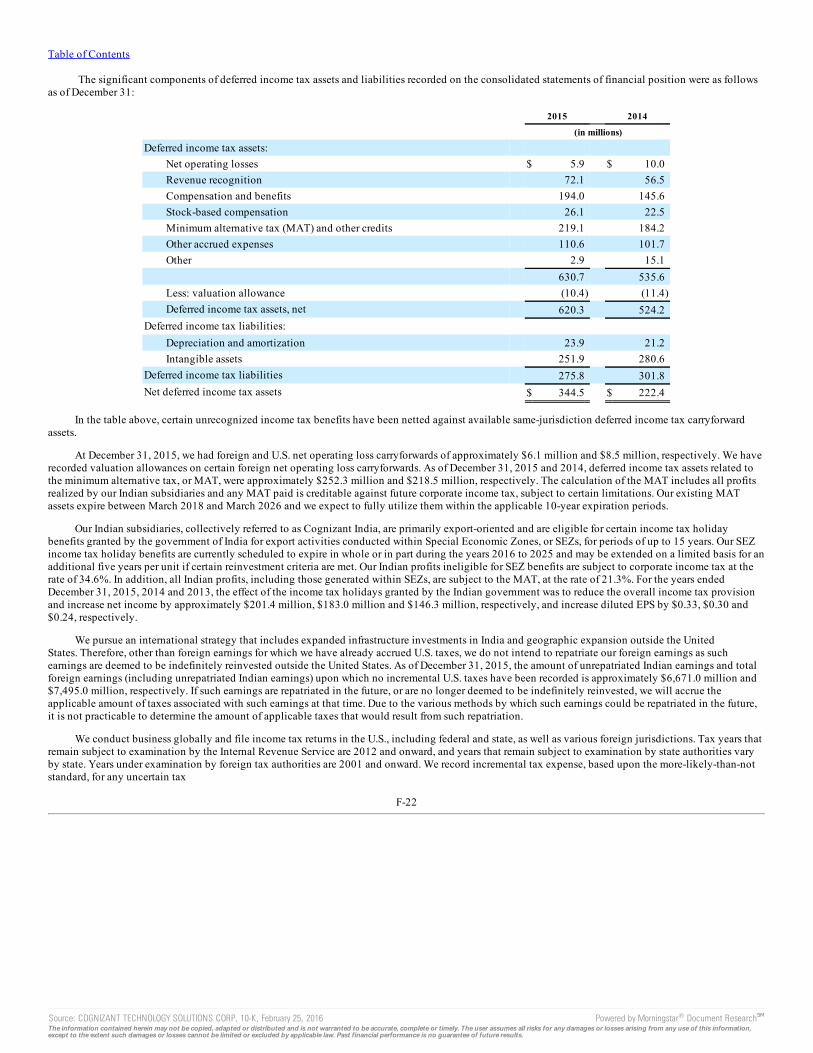
Table of Contents
The significant components of deferred income tax assets and liabilities recorded on the consolidated statements of financial position were as followsas of December 31:
2015 2014
(in millions)
Deferred income tax assets: Net operating losses $ 5.9 $ 10.0Revenue recognition 72.1 56.5Compensation and benefits 194.0 145.6Stock-based compensation 26.1 22.5Minimum alternative tax (MAT) and other credits 219.1 184.2Other accrued expenses 110.6 101.7Other 2.9 15.1
630.7 535.6Less: valuation allowance (10.4) (11.4)Deferred income tax assets, net 620.3 524.2
Deferred income tax liabilities: Depreciation and amortization 23.9 21.2Intangible assets 251.9 280.6
Deferred income tax liabilities 275.8 301.8Net deferred income tax assets $ 344.5 $ 222.4
In the table above, certain unrecognized income tax benefits have been netted against available same-jurisdiction deferred income tax carryforwardassets.
At December 31, 2015, we had foreign and U.S. net operating loss carryforwards of approximately $6.1 million and $8.5 million, respectively. We haverecorded valuation allowances on certain foreign net operating loss carryforwards. As of December 31, 2015 and 2014, deferred income tax assets related tothe minimum alternative tax, or MAT, were approximately $252.3 million and $218.5 million, respectively. The calculation of the MAT includes all profitsrealized by our Indian subsidiaries and any MAT paid is creditable against future corporate income tax, subject to certain limitations. Our existing MATassets expire between March 2018 and March 2026 and we expect to fully utilize them within the applicable 10-year expiration periods.
Our Indian subsidiaries, collectively referred to as Cognizant India, are primarily export-oriented and are eligible for certain income tax holidaybenefits granted by the government of India for export activities conducted within Special Economic Zones, or SEZs, for periods of up to 15 years. Our SEZincome tax holiday benefits are currently scheduled to expire in whole or in part during the years 2016 to 2025 and may be extended on a limited basis for anadditional five years per unit if certain reinvestment criteria are met. Our Indian profits ineligible for SEZ benefits are subject to corporate income tax at therate of 34.6%. In addition, all Indian profits, including those generated within SEZs, are subject to the MAT, at the rate of 21.3%. For the years endedDecember 31, 2015, 2014 and 2013, the effect of the income tax holidays granted by the Indian government was to reduce the overall income tax provisionand increase net income by approximately $201.4 million, $183.0 million and $146.3 million, respectively, and increase diluted EPS by $0.33, $0.30 and$0.24, respectively.
We pursue an international strategy that includes expanded infrastructure investments in India and geographic expansion outside the UnitedStates. Therefore, other than foreign earnings for which we have already accrued U.S. taxes, we do not intend to repatriate our foreign earnings as suchearnings are deemed to be indefinitely reinvested outside the United States. As of December 31, 2015, the amount of unrepatriated Indian earnings and totalforeign earnings (including unrepatriated Indian earnings) upon which no incremental U.S. taxes have been recorded is approximately $6,671.0 million and$7,495.0 million, respectively. If such earnings are repatriated in the future, or are no longer deemed to be indefinitely reinvested, we will accrue theapplicable amount of taxes associated with such earnings at that time. Due to the various methods by which such earnings could be repatriated in the future,it is not practicable to determine the amount of applicable taxes that would result from such repatriation.
We conduct business globally and file income tax returns in the U.S., including federal and state, as well as various foreign jurisdictions. Tax years thatremain subject to examination by the Internal Revenue Service are 2012 and onward, and years that remain subject to examination by state authorities varyby state. Years under examination by foreign tax authorities are 2001 and onward. We record incremental tax expense, based upon the more-likely-than-notstandard, for any uncertain tax
F-22
Source: COGNIZANT TECHNOLOGY SOLUTIONS CORP, 10-K, February 25, 2016 Powered by Morningstar® Document Research℠The information contained herein may not be copied, adapted or distributed and is not warranted to be accurate, complete or timely. The user assumes all risks for any damages or losses arising from any use of this information,except to the extent such damages or losses cannot be limited or excluded by applicable law. Past financial performance is no guarantee of future results.
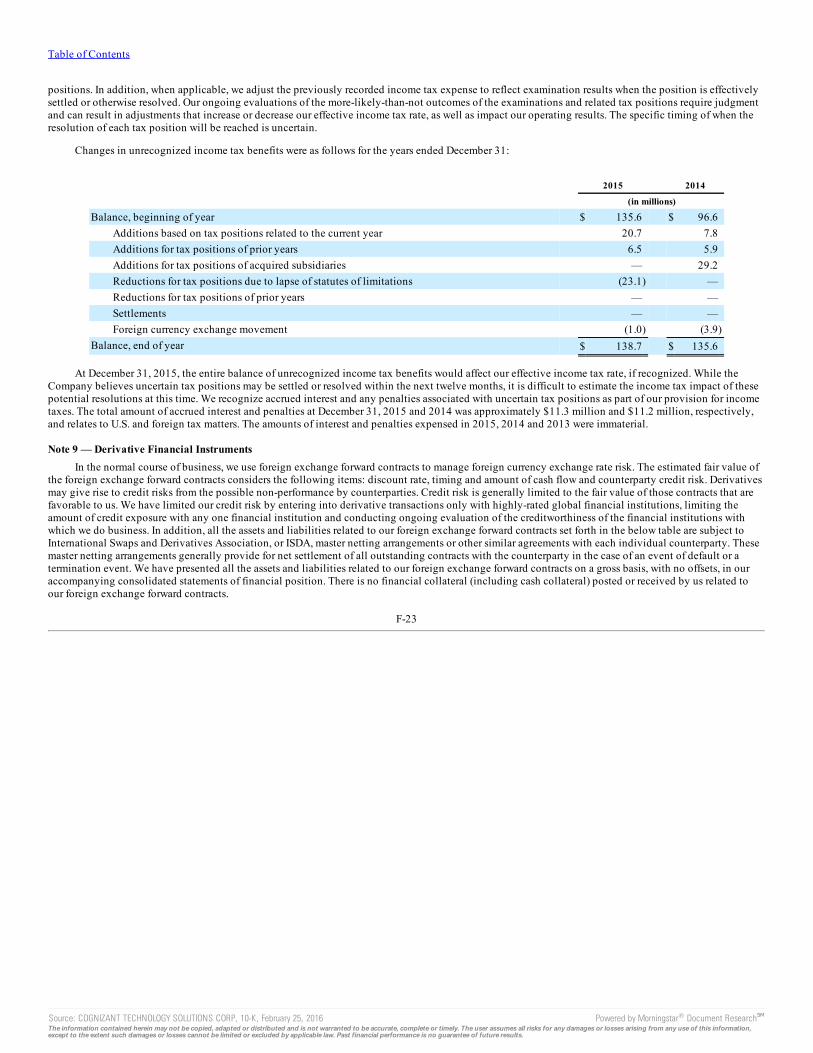
Table of Contents
positions. In addition, when applicable, we adjust the previously recorded income tax expense to reflect examination results when the position is effectivelysettled or otherwise resolved. Our ongoing evaluations of the more-likely-than-not outcomes of the examinations and related tax positions require judgmentand can result in adjustments that increase or decrease our effective income tax rate, as well as impact our operating results. The specific timing of when theresolution of each tax position will be reached is uncertain.
Changes in unrecognized income tax benefits were as follows for the years ended December 31:
2015 2014
(in millions)
Balance, beginning of year $ 135.6 $ 96.6Additions based on tax positions related to the current year 20.7 7.8Additions for tax positions of prior years 6.5 5.9Additions for tax positions of acquired subsidiaries — 29.2Reductions for tax positions due to lapse of statutes of limitations (23.1) —Reductions for tax positions of prior years — —Settlements — —Foreign currency exchange movement (1.0) (3.9)
Balance, end of year $ 138.7 $ 135.6
At December 31, 2015, the entire balance of unrecognized income tax benefits would affect our effective income tax rate, if recognized. While theCompany believes uncertain tax positions may be settled or resolved within the next twelve months, it is difficult to estimate the income tax impact of thesepotential resolutions at this time. We recognize accrued interest and any penalties associated with uncertain tax positions as part of our provision for incometaxes. The total amount of accrued interest and penalties at December 31, 2015 and 2014 was approximately $11.3 million and $11.2 million, respectively,and relates to U.S. and foreign tax matters. The amounts of interest and penalties expensed in 2015, 2014 and 2013 were immaterial.
Note 9 — Derivative Financial InstrumentsIn the normal course of business, we use foreign exchange forward contracts to manage foreign currency exchange rate risk. The estimated fair value of
the foreign exchange forward contracts considers the following items: discount rate, timing and amount of cash flow and counterparty credit risk. Derivativesmay give rise to credit risks from the possible non-performance by counterparties. Credit risk is generally limited to the fair value of those contracts that arefavorable to us. We have limited our credit risk by entering into derivative transactions only with highly-rated global financial institutions, limiting theamount of credit exposure with any one financial institution and conducting ongoing evaluation of the creditworthiness of the financial institutions withwhich we do business. In addition, all the assets and liabilities related to our foreign exchange forward contracts set forth in the below table are subject toInternational Swaps and Derivatives Association, or ISDA, master netting arrangements or other similar agreements with each individual counterparty. Thesemaster netting arrangements generally provide for net settlement of all outstanding contracts with the counterparty in the case of an event of default or atermination event. We have presented all the assets and liabilities related to our foreign exchange forward contracts on a gross basis, with no offsets, in ouraccompanying consolidated statements of financial position. There is no financial collateral (including cash collateral) posted or received by us related toour foreign exchange forward contracts.
F-23
Source: COGNIZANT TECHNOLOGY SOLUTIONS CORP, 10-K, February 25, 2016 Powered by Morningstar® Document Research℠The information contained herein may not be copied, adapted or distributed and is not warranted to be accurate, complete or timely. The user assumes all risks for any damages or losses arising from any use of this information,except to the extent such damages or losses cannot be limited or excluded by applicable law. Past financial performance is no guarantee of future results.
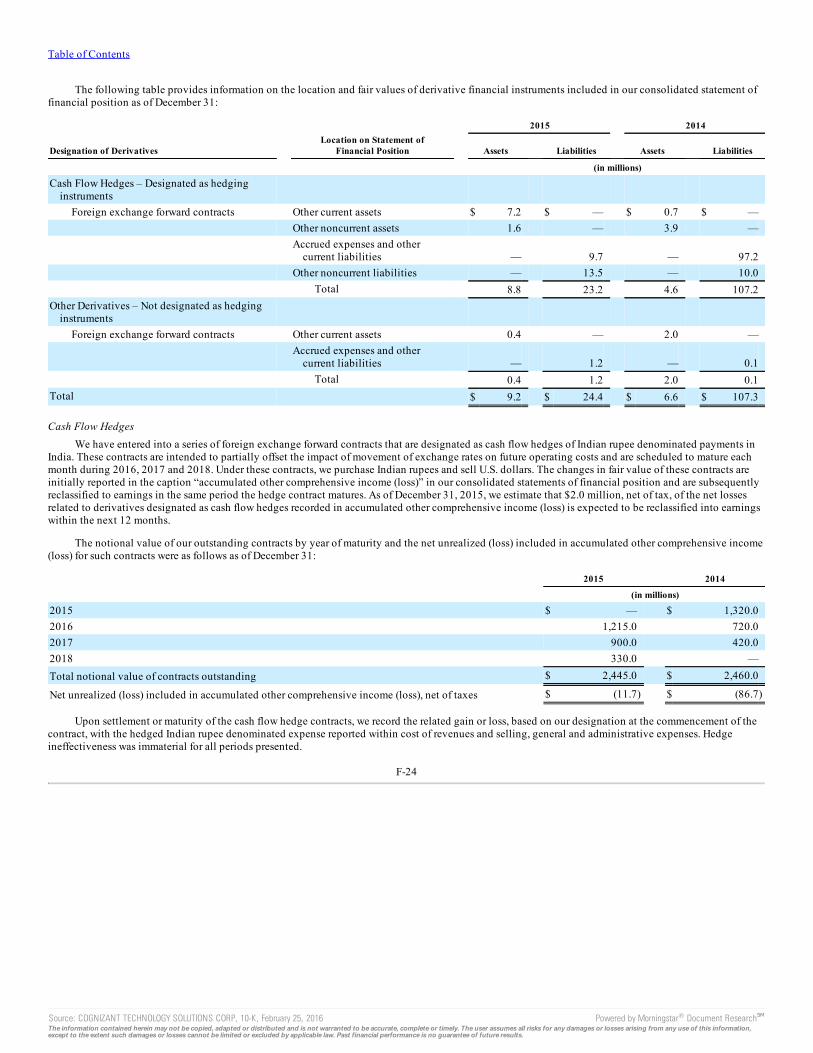
Table of Contents
The following table provides information on the location and fair values of derivative financial instruments included in our consolidated statement offinancial position as of December 31:
2015 2014
Designation of Derivatives Location on Statement of
Financial Position Assets Liabilities Assets Liabilities
(in millions)
Cash Flow Hedges – Designated as hedginginstruments
Foreign exchange forward contracts Other current assets $ 7.2 $ — $ 0.7 $ — Other noncurrent assets 1.6 — 3.9 —
Accrued expenses and other
current liabilities — 9.7 — 97.2 Other noncurrent liabilities — 13.5 — 10.0 Total 8.8 23.2 4.6 107.2Other Derivatives – Not designated as hedging
instruments Foreign exchange forward contracts Other current assets 0.4 — 2.0 —
Accrued expenses and other
current liabilities — 1.2 — 0.1 Total 0.4 1.2 2.0 0.1Total $ 9.2 $ 24.4 $ 6.6 $ 107.3
Cash Flow HedgesWe have entered into a series of foreign exchange forward contracts that are designated as cash flow hedges of Indian rupee denominated payments in
India. These contracts are intended to partially offset the impact of movement of exchange rates on future operating costs and are scheduled to mature eachmonth during 2016, 2017 and 2018. Under these contracts, we purchase Indian rupees and sell U.S. dollars. The changes in fair value of these contracts areinitially reported in the caption “accumulated other comprehensive income (loss)” in our consolidated statements of financial position and are subsequentlyreclassified to earnings in the same period the hedge contract matures. As of December 31, 2015, we estimate that $2.0 million, net of tax, of the net lossesrelated to derivatives designated as cash flow hedges recorded in accumulated other comprehensive income (loss) is expected to be reclassified into earningswithin the next 12 months.
The notional value of our outstanding contracts by year of maturity and the net unrealized (loss) included in accumulated other comprehensive income(loss) for such contracts were as follows as of December 31:
2015 2014
(in millions)
2015 $ — $ 1,320.02016 1,215.0 720.02017 900.0 420.02018 330.0 —Total notional value of contracts outstanding $ 2,445.0 $ 2,460.0
Net unrealized (loss) included in accumulated other comprehensive income (loss), net of taxes $ (11.7) $ (86.7)
Upon settlement or maturity of the cash flow hedge contracts, we record the related gain or loss, based on our designation at the commencement of thecontract, with the hedged Indian rupee denominated expense reported within cost of revenues and selling, general and administrative expenses. Hedgeineffectiveness was immaterial for all periods presented.
F-24
Source: COGNIZANT TECHNOLOGY SOLUTIONS CORP, 10-K, February 25, 2016 Powered by Morningstar® Document Research℠The information contained herein may not be copied, adapted or distributed and is not warranted to be accurate, complete or timely. The user assumes all risks for any damages or losses arising from any use of this information,except to the extent such damages or losses cannot be limited or excluded by applicable law. Past financial performance is no guarantee of future results.
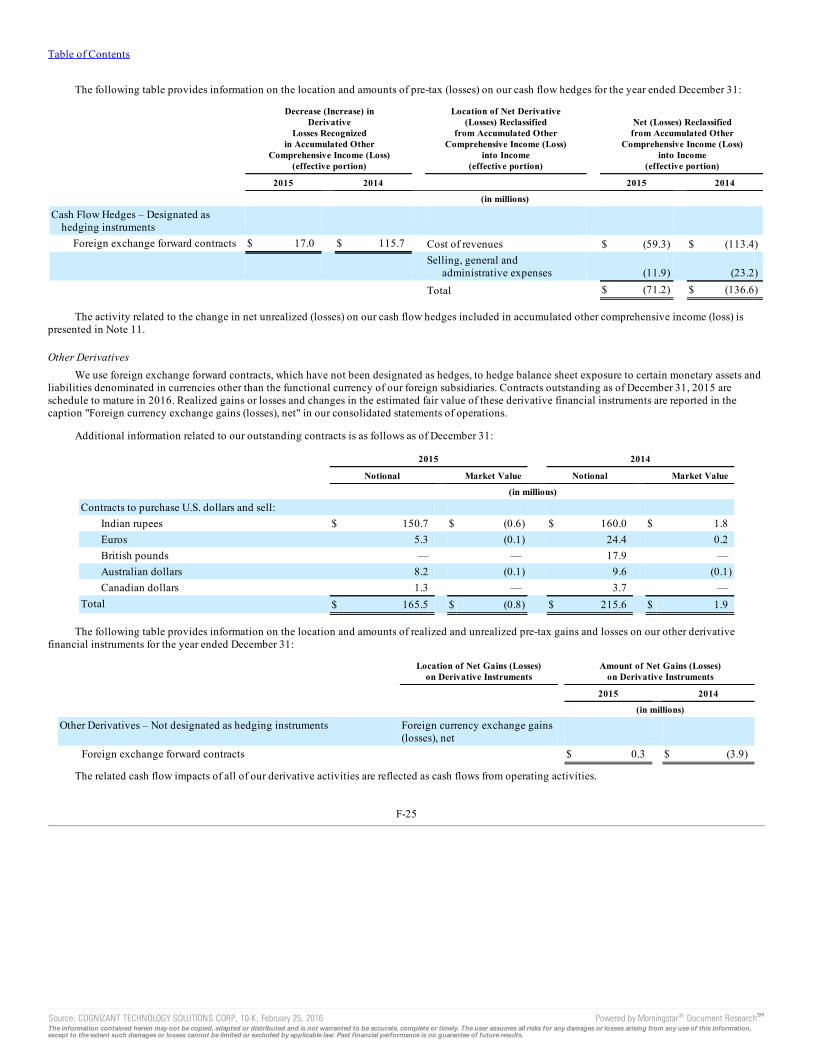
Table of Contents
The following table provides information on the location and amounts of pre-tax (losses) on our cash flow hedges for the year ended December 31:
Decrease (Increase) inDerivative
Losses Recognizedin Accumulated Other
Comprehensive Income (Loss)(effective portion)
Location of Net Derivative(Losses) Reclassified
from Accumulated OtherComprehensive Income (Loss)
into Income(effective portion)
Net (Losses) Reclassifiedfrom Accumulated Other
Comprehensive Income (Loss)into Income
(effective portion)
2015 2014 2015 2014
(in millions)
Cash Flow Hedges – Designated ashedging instruments
Foreign exchange forward contracts $ 17.0 $ 115.7 Cost of revenues $ (59.3) $ (113.4)
Selling, general and
administrative expenses (11.9) (23.2) Total $ (71.2) $ (136.6)
The activity related to the change in net unrealized (losses) on our cash flow hedges included in accumulated other comprehensive income (loss) ispresented in Note 11.
Other DerivativesWe use foreign exchange forward contracts, which have not been designated as hedges, to hedge balance sheet exposure to certain monetary assets and
liabilities denominated in currencies other than the functional currency of our foreign subsidiaries. Contracts outstanding as of December 31, 2015 areschedule to mature in 2016. Realized gains or losses and changes in the estimated fair value of these derivative financial instruments are reported in thecaption "Foreign currency exchange gains (losses), net" in our consolidated statements of operations.
Additional information related to our outstanding contracts is as follows as of December 31:
2015 2014
Notional Market Value Notional Market Value
(in millions)
Contracts to purchase U.S. dollars and sell: Indian rupees $ 150.7 $ (0.6) $ 160.0 $ 1.8Euros 5.3 (0.1) 24.4 0.2British pounds — — 17.9 —Australian dollars 8.2 (0.1) 9.6 (0.1)Canadian dollars 1.3 — 3.7 —
Total $ 165.5 $ (0.8) $ 215.6 $ 1.9
The following table provides information on the location and amounts of realized and unrealized pre-tax gains and losses on our other derivativefinancial instruments for the year ended December 31:
Location of Net Gains (Losses)
on Derivative Instruments Amount of Net Gains (Losses)
on Derivative Instruments
2015 2014
(in millions)
Other Derivatives – Not designated as hedging instruments
Foreign currency exchange gains(losses), net
Foreign exchange forward contracts $ 0.3 $ (3.9)
The related cash flow impacts of all of our derivative activities are reflected as cash flows from operating activities.
F-25
Source: COGNIZANT TECHNOLOGY SOLUTIONS CORP, 10-K, February 25, 2016 Powered by Morningstar® Document Research℠The information contained herein may not be copied, adapted or distributed and is not warranted to be accurate, complete or timely. The user assumes all risks for any damages or losses arising from any use of this information,except to the extent such damages or losses cannot be limited or excluded by applicable law. Past financial performance is no guarantee of future results.
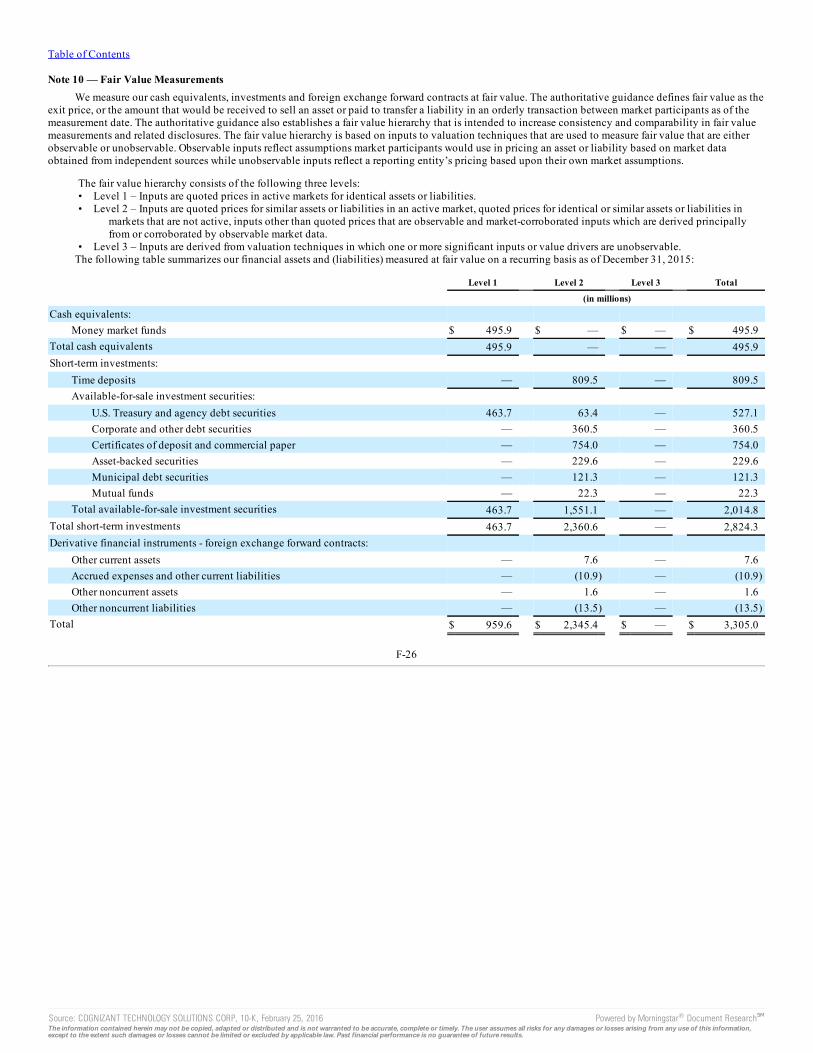
Table of Contents
Note 10 — Fair Value MeasurementsWe measure our cash equivalents, investments and foreign exchange forward contracts at fair value. The authoritative guidance defines fair value as the
exit price, or the amount that would be received to sell an asset or paid to transfer a liability in an orderly transaction between market participants as of themeasurement date. The authoritative guidance also establishes a fair value hierarchy that is intended to increase consistency and comparability in fair valuemeasurements and related disclosures. The fair value hierarchy is based on inputs to valuation techniques that are used to measure fair value that are eitherobservable or unobservable. Observable inputs reflect assumptions market participants would use in pricing an asset or liability based on market dataobtained from independent sources while unobservable inputs reflect a reporting entity’s pricing based upon their own market assumptions.
The fair value hierarchy consists of the following three levels:• Level 1 – Inputs are quoted prices in active markets for identical assets or liabilities.• Level 2 – Inputs are quoted prices for similar assets or liabilities in an active market, quoted prices for identical or similar assets or liabilities in
markets that are not active, inputs other than quoted prices that are observable and market-corroborated inputs which are derived principallyfrom or corroborated by observable market data.
• Level 3 – Inputs are derived from valuation techniques in which one or more significant inputs or value drivers are unobservable.The following table summarizes our financial assets and (liabilities) measured at fair value on a recurring basis as of December 31, 2015:
Level 1 Level 2 Level 3 Total
(in millions)
Cash equivalents: Money market funds $ 495.9 $ — $ — $ 495.9
Total cash equivalents 495.9 — — 495.9Short-term investments:
Time deposits — 809.5 — 809.5Available-for-sale investment securities:
U.S. Treasury and agency debt securities 463.7 63.4 — 527.1Corporate and other debt securities — 360.5 — 360.5Certificates of deposit and commercial paper — 754.0 — 754.0Asset-backed securities — 229.6 — 229.6Municipal debt securities — 121.3 — 121.3Mutual funds — 22.3 — 22.3
Total available-for-sale investment securities 463.7 1,551.1 — 2,014.8Total short-term investments 463.7 2,360.6 — 2,824.3Derivative financial instruments - foreign exchange forward contracts:
Other current assets — 7.6 — 7.6Accrued expenses and other current liabilities — (10.9) — (10.9)Other noncurrent assets — 1.6 — 1.6Other noncurrent liabilities — (13.5) — (13.5)
Total $ 959.6 $ 2,345.4 $ — $ 3,305.0
F-26
Source: COGNIZANT TECHNOLOGY SOLUTIONS CORP, 10-K, February 25, 2016 Powered by Morningstar® Document Research℠The information contained herein may not be copied, adapted or distributed and is not warranted to be accurate, complete or timely. The user assumes all risks for any damages or losses arising from any use of this information,except to the extent such damages or losses cannot be limited or excluded by applicable law. Past financial performance is no guarantee of future results.
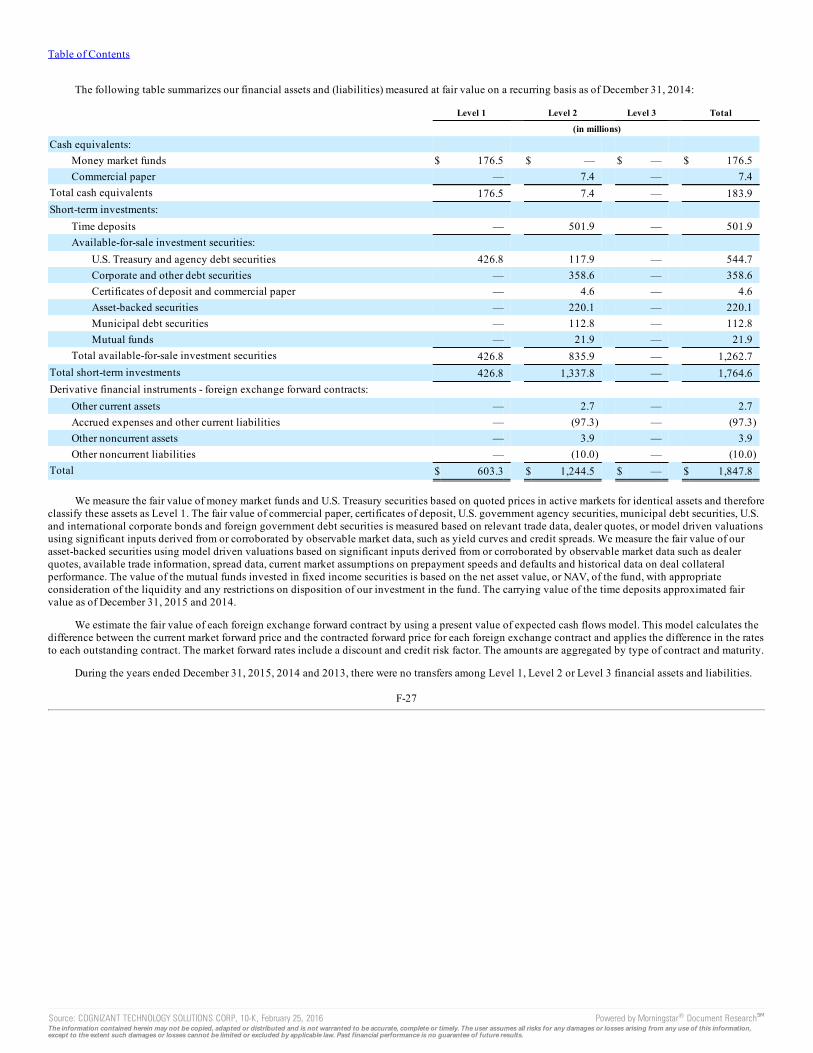
Table of Contents
The following table summarizes our financial assets and (liabilities) measured at fair value on a recurring basis as of December 31, 2014:
Level 1 Level 2 Level 3 Total
(in millions)
Cash equivalents: Money market funds $ 176.5 $ — $ — $ 176.5Commercial paper — 7.4 — 7.4
Total cash equivalents 176.5 7.4 — 183.9Short-term investments:
Time deposits — 501.9 — 501.9Available-for-sale investment securities:
U.S. Treasury and agency debt securities 426.8 117.9 — 544.7Corporate and other debt securities — 358.6 — 358.6Certificates of deposit and commercial paper — 4.6 — 4.6Asset-backed securities — 220.1 — 220.1Municipal debt securities — 112.8 — 112.8Mutual funds — 21.9 — 21.9
Total available-for-sale investment securities 426.8 835.9 — 1,262.7Total short-term investments 426.8 1,337.8 — 1,764.6Derivative financial instruments - foreign exchange forward contracts:
Other current assets — 2.7 — 2.7Accrued expenses and other current liabilities — (97.3) — (97.3)Other noncurrent assets — 3.9 — 3.9Other noncurrent liabilities — (10.0) — (10.0)
Total $ 603.3 $ 1,244.5 $ — $ 1,847.8
We measure the fair value of money market funds and U.S. Treasury securities based on quoted prices in active markets for identical assets and thereforeclassify these assets as Level 1. The fair value of commercial paper, certificates of deposit, U.S. government agency securities, municipal debt securities, U.S.and international corporate bonds and foreign government debt securities is measured based on relevant trade data, dealer quotes, or model driven valuationsusing significant inputs derived from or corroborated by observable market data, such as yield curves and credit spreads. We measure the fair value of ourasset-backed securities using model driven valuations based on significant inputs derived from or corroborated by observable market data such as dealerquotes, available trade information, spread data, current market assumptions on prepayment speeds and defaults and historical data on deal collateralperformance. The value of the mutual funds invested in fixed income securities is based on the net asset value, or NAV, of the fund, with appropriateconsideration of the liquidity and any restrictions on disposition of our investment in the fund. The carrying value of the time deposits approximated fairvalue as of December 31, 2015 and 2014.
We estimate the fair value of each foreign exchange forward contract by using a present value of expected cash flows model. This model calculates thedifference between the current market forward price and the contracted forward price for each foreign exchange contract and applies the difference in the ratesto each outstanding contract. The market forward rates include a discount and credit risk factor. The amounts are aggregated by type of contract and maturity.
During the years ended December 31, 2015, 2014 and 2013, there were no transfers among Level 1, Level 2 or Level 3 financial assets and liabilities.
F-27
Source: COGNIZANT TECHNOLOGY SOLUTIONS CORP, 10-K, February 25, 2016 Powered by Morningstar® Document Research℠The information contained herein may not be copied, adapted or distributed and is not warranted to be accurate, complete or timely. The user assumes all risks for any damages or losses arising from any use of this information,except to the extent such damages or losses cannot be limited or excluded by applicable law. Past financial performance is no guarantee of future results.
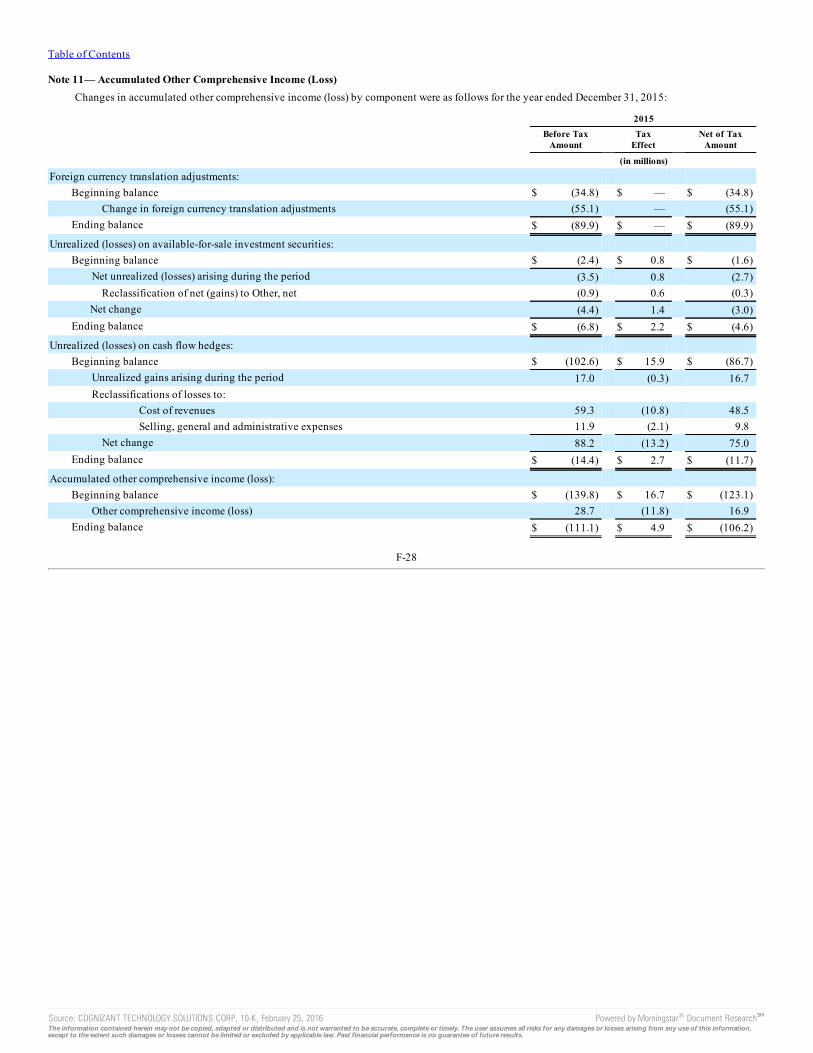
Table of Contents
Note 11— Accumulated Other Comprehensive Income (Loss)Changes in accumulated other comprehensive income (loss) by component were as follows for the year ended December 31, 2015:
2015
Before Tax
Amount Tax
Effect Net of Tax
Amount
(in millions)
Foreign currency translation adjustments: Beginning balance $ (34.8) $ — $ (34.8)
Change in foreign currency translation adjustments (55.1) — (55.1)Ending balance $ (89.9) $ — $ (89.9)
Unrealized (losses) on available-for-sale investment securities: Beginning balance $ (2.4) $ 0.8 $ (1.6)
Net unrealized (losses) arising during the period (3.5) 0.8 (2.7)Reclassification of net (gains) to Other, net (0.9) 0.6 (0.3)
Net change (4.4) 1.4 (3.0)Ending balance $ (6.8) $ 2.2 $ (4.6)
Unrealized (losses) on cash flow hedges: Beginning balance $ (102.6) $ 15.9 $ (86.7)
Unrealized gains arising during the period 17.0 (0.3) 16.7Reclassifications of losses to:
Cost of revenues 59.3 (10.8) 48.5Selling, general and administrative expenses 11.9 (2.1) 9.8
Net change 88.2 (13.2) 75.0Ending balance $ (14.4) $ 2.7 $ (11.7)
Accumulated other comprehensive income (loss): Beginning balance $ (139.8) $ 16.7 $ (123.1)
Other comprehensive income (loss) 28.7 (11.8) 16.9Ending balance $ (111.1) $ 4.9 $ (106.2)
F-28
Source: COGNIZANT TECHNOLOGY SOLUTIONS CORP, 10-K, February 25, 2016 Powered by Morningstar® Document Research℠The information contained herein may not be copied, adapted or distributed and is not warranted to be accurate, complete or timely. The user assumes all risks for any damages or losses arising from any use of this information,except to the extent such damages or losses cannot be limited or excluded by applicable law. Past financial performance is no guarantee of future results.
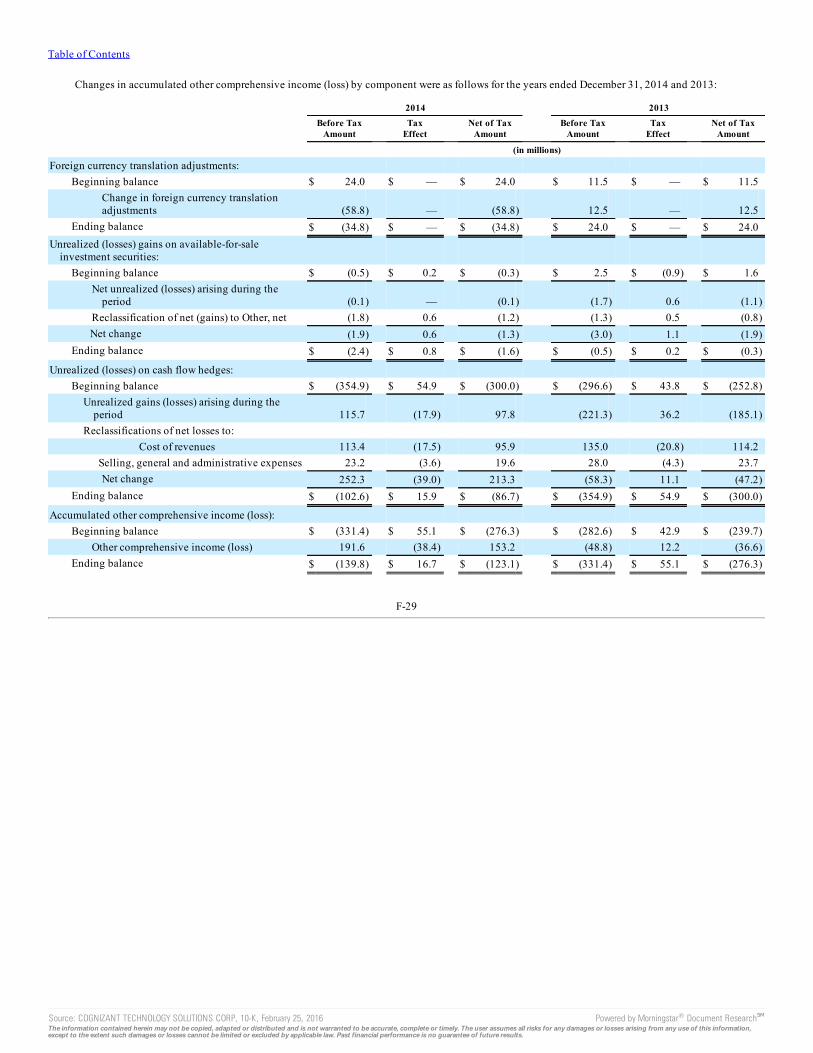
Table of Contents
Changes in accumulated other comprehensive income (loss) by component were as follows for the years ended December 31, 2014 and 2013:
2014 2013
Before Tax
Amount Tax
Effect Net of Tax
Amount Before Tax
Amount Tax
Effect Net of Tax
Amount
(in millions)
Foreign currency translation adjustments: Beginning balance $ 24.0 $ — $ 24.0 $ 11.5 $ — $ 11.5
Change in foreign currency translationadjustments (58.8) — (58.8) 12.5 — 12.5
Ending balance $ (34.8) $ — $ (34.8) $ 24.0 $ — $ 24.0Unrealized (losses) gains on available-for-sale
investment securities: Beginning balance $ (0.5) $ 0.2 $ (0.3) $ 2.5 $ (0.9) $ 1.6
Net unrealized (losses) arising during theperiod (0.1) — (0.1) (1.7) 0.6 (1.1)
Reclassification of net (gains) to Other, net (1.8) 0.6 (1.2) (1.3) 0.5 (0.8)Net change (1.9) 0.6 (1.3) (3.0) 1.1 (1.9)
Ending balance $ (2.4) $ 0.8 $ (1.6) $ (0.5) $ 0.2 $ (0.3)
Unrealized (losses) on cash flow hedges: Beginning balance $ (354.9) $ 54.9 $ (300.0) $ (296.6) $ 43.8 $ (252.8)
Unrealized gains (losses) arising during theperiod 115.7 (17.9) 97.8 (221.3) 36.2 (185.1)
Reclassifications of net losses to: Cost of revenues 113.4 (17.5) 95.9 135.0 (20.8) 114.2
Selling, general and administrative expenses 23.2 (3.6) 19.6 28.0 (4.3) 23.7Net change 252.3 (39.0) 213.3 (58.3) 11.1 (47.2)
Ending balance $ (102.6) $ 15.9 $ (86.7) $ (354.9) $ 54.9 $ (300.0)
Accumulated other comprehensive income (loss): Beginning balance $ (331.4) $ 55.1 $ (276.3) $ (282.6) $ 42.9 $ (239.7)
Other comprehensive income (loss) 191.6 (38.4) 153.2 (48.8) 12.2 (36.6)Ending balance $ (139.8) $ 16.7 $ (123.1) $ (331.4) $ 55.1 $ (276.3)
F-29
Source: COGNIZANT TECHNOLOGY SOLUTIONS CORP, 10-K, February 25, 2016 Powered by Morningstar® Document Research℠The information contained herein may not be copied, adapted or distributed and is not warranted to be accurate, complete or timely. The user assumes all risks for any damages or losses arising from any use of this information,except to the extent such damages or losses cannot be limited or excluded by applicable law. Past financial performance is no guarantee of future results.
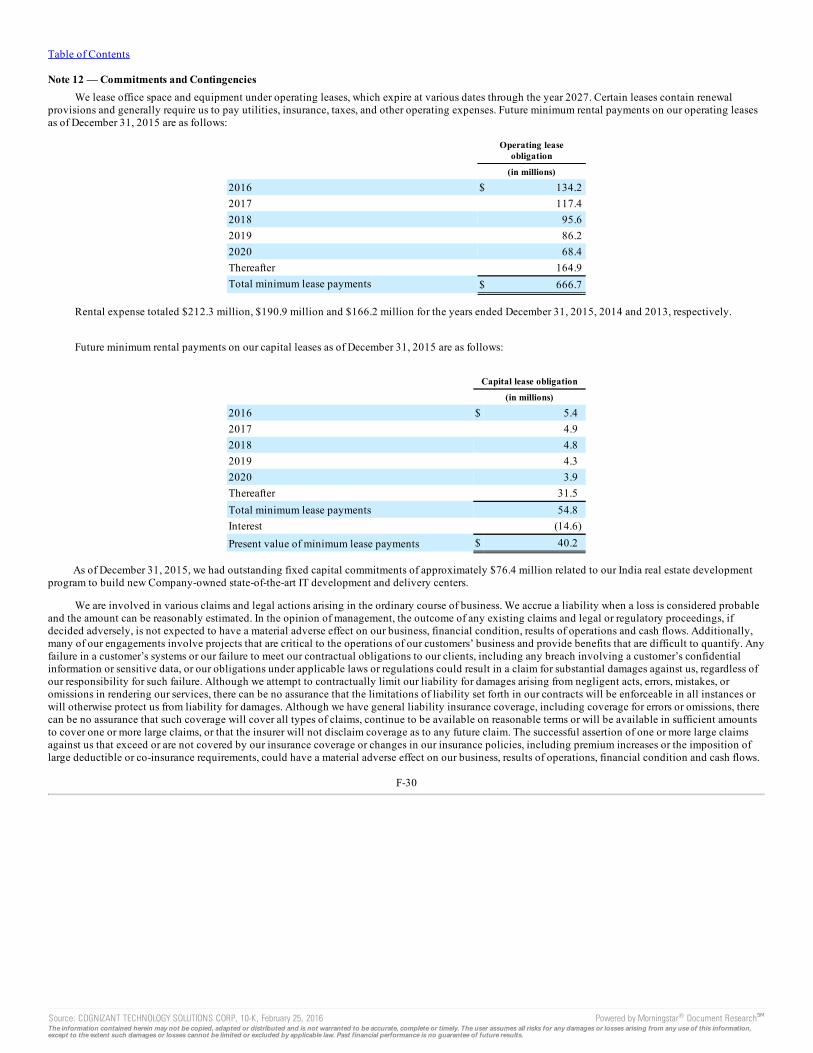
Table of Contents
Note 12 — Commitments and ContingenciesWe lease office space and equipment under operating leases, which expire at various dates through the year 2027. Certain leases contain renewal
provisions and generally require us to pay utilities, insurance, taxes, and other operating expenses. Future minimum rental payments on our operating leasesas of December 31, 2015 are as follows:
Operating lease
obligation
(in millions)
2016 $ 134.22017 117.42018 95.62019 86.22020 68.4Thereafter 164.9Total minimum lease payments $ 666.7
Rental expense totaled $212.3 million, $190.9 million and $166.2 million for the years ended December 31, 2015, 2014 and 2013, respectively.
Future minimum rental payments on our capital leases as of December 31, 2015 are as follows:
Capital lease obligation
(in millions)
2016 $ 5.42017 4.92018 4.82019 4.32020 3.9Thereafter 31.5Total minimum lease payments 54.8Interest (14.6)Present value of minimum lease payments $ 40.2
As of December 31, 2015, we had outstanding fixed capital commitments of approximately $76.4 million related to our India real estate developmentprogram to build new Company-owned state-of-the-art IT development and delivery centers.
We are involved in various claims and legal actions arising in the ordinary course of business. We accrue a liability when a loss is considered probableand the amount can be reasonably estimated. In the opinion of management, the outcome of any existing claims and legal or regulatory proceedings, ifdecided adversely, is not expected to have a material adverse effect on our business, financial condition, results of operations and cash flows. Additionally,many of our engagements involve projects that are critical to the operations of our customers’ business and provide benefits that are difficult to quantify. Anyfailure in a customer’s systems or our failure to meet our contractual obligations to our clients, including any breach involving a customer’s confidentialinformation or sensitive data, or our obligations under applicable laws or regulations could result in a claim for substantial damages against us, regardless ofour responsibility for such failure. Although we attempt to contractually limit our liability for damages arising from negligent acts, errors, mistakes, oromissions in rendering our services, there can be no assurance that the limitations of liability set forth in our contracts will be enforceable in all instances orwill otherwise protect us from liability for damages. Although we have general liability insurance coverage, including coverage for errors or omissions, therecan be no assurance that such coverage will cover all types of claims, continue to be available on reasonable terms or will be available in sufficient amountsto cover one or more large claims, or that the insurer will not disclaim coverage as to any future claim. The successful assertion of one or more large claimsagainst us that exceed or are not covered by our insurance coverage or changes in our insurance policies, including premium increases or the imposition oflarge deductible or co-insurance requirements, could have a material adverse effect on our business, results of operations, financial condition and cash flows.
F-30
Source: COGNIZANT TECHNOLOGY SOLUTIONS CORP, 10-K, February 25, 2016 Powered by Morningstar® Document Research℠The information contained herein may not be copied, adapted or distributed and is not warranted to be accurate, complete or timely. The user assumes all risks for any damages or losses arising from any use of this information,except to the extent such damages or losses cannot be limited or excluded by applicable law. Past financial performance is no guarantee of future results.
Table of Contents
In the normal course of business and in conjunction with certain client engagements, we have entered into contractual arrangements through which wemay be obligated to indemnify clients or other parties with whom we conduct business with respect to certain matters. These arrangements can includeprovisions whereby we agree to hold the indemnified party and certain of their affiliated entities harmless with respect to third-party claims related to suchmatters as our breach of certain representations or covenants, or out of our intellectual property infringement, our gross negligence or willful misconduct orcertain other claims made against certain parties. Payments by us under any of these arrangements are generally conditioned on the client making a claim andproviding us with full control over the defense and settlement of such claim. It is not possible to determine the maximum potential amount of loss under theseindemnification agreements due to the unique facts and circumstances involved in each particular agreement. Historically, we have not made payments underthese indemnification agreements and therefore they have not had any impact on our operating results, financial position, or cash flows. However, if eventsarise requiring us to make payment for indemnification claims under our indemnification obligations in contracts we have entered, such payments could havematerial adverse impacts on our business, results of operations, financial condition and cash flows.
Note 13 — Employee BenefitsWe contribute to defined contribution plans in the United States and Europe, including 401(k) savings and supplemental retirement plans in the United
States. Total expenses for Company contributions to these plans were $62.0 million, $45.1 million and $34.6 million for the years ended December 31, 2015,2014 and 2013, respectively.
We maintain employee benefit plans that cover substantially all India-based employees. The employees’ provident fund, pension and family pensionplans are statutorily defined contribution retirement benefit plans. Under the plans, employees contribute up to 12% of their base compensation, which ismatched by an equal contribution by the Company. For these plans, we recognized a contribution expense of $71.4 million, $63.4 million and $56.1 millionfor the years ended December 31, 2015, 2014 and 2013, respectively.
We also maintain a gratuity plan in India that is a statutory post-employment benefit plan providing defined lump sum benefits. We make annualcontributions to the employees’ gratuity fund established with a government-owned insurance corporation to fund a portion of the estimated obligation.Accordingly, our liability for the gratuity plan reflects the undiscounted benefit obligation payable as of the balance sheet date which was based upon theemployees’ salary and years of service. As of December 31, 2015 and 2014, the amount accrued under the gratuity plan was $98.2 million and $90.8 million,which is net of fund assets of $77.6 million and $66.7 million, respectively. Expense recognized by us was $30.0 million, $36.4 million and $31.0 million forthe years ended December 31, 2015, 2014 and 2013, respectively.
Note 14 — Stock-Based Compensation PlansOn June 5, 2009, our stockholders approved the adoption of the Cognizant Technology Solutions Corporation 2009 Incentive Compensation Plan (as
amended and restated, the “2009 Incentive Plan”). Under the 2009 Incentive Plan, 48.0 million shares of our Class A common stock were reserved forissuance. The 2009 Incentive Plan is the successor plan to our Amended and Restated 1999 Incentive Compensation Plan which terminated on April 13,2009 in accordance with its terms, our Amended and Restated Non-Employee Directors’ Stock Option Plan and our Amended and Restated Key Employees’Stock Option Plan which terminated in July 2009 (collectively, the “Predecessor Plans”). The 2009 Incentive Plan will not affect any options or stockissuances outstanding under the Predecessor Plans. No further awards will be made under the Predecessor Plans. As of December 31, 2015, we have 12.9million shares available for grant under the 2009 Incentive Plan.
Stock options granted to employees under our plans have a life ranging from seven to ten years, vest proportionally over four years, unless specifiedotherwise, and have an exercise price equal to the fair market value of the common stock on the date of grant. Grants to non-employee directors vestproportionally over two years. Stock-based compensation expense relating to stock options is recognized on a straight-line basis over the requisite serviceperiod.
Restricted stock units vest proportionately in quarterly or annual installments over three to four years. Stock-based compensation expense relating torestricted stock units is recognized on a straight-line basis over the requisite service period.
We granted performance stock units that vest over periods ranging from one to three years to employees, including our executive officers. The vestingof performance stock units is contingent on both meeting certain financial performance targets and continued service. Stock-based compensation costs forperformance stock units that vest proportionally are recognized on a graded-vesting basis over the vesting period based on the most probable outcome of theperformance conditions. If the minimum performance targets are not met, no compensation cost is recognized and any recognized compensation cost isreversed.
F-31
Source: COGNIZANT TECHNOLOGY SOLUTIONS CORP, 10-K, February 25, 2016 Powered by Morningstar® Document Research℠The information contained herein may not be copied, adapted or distributed and is not warranted to be accurate, complete or timely. The user assumes all risks for any damages or losses arising from any use of this information,except to the extent such damages or losses cannot be limited or excluded by applicable law. Past financial performance is no guarantee of future results.
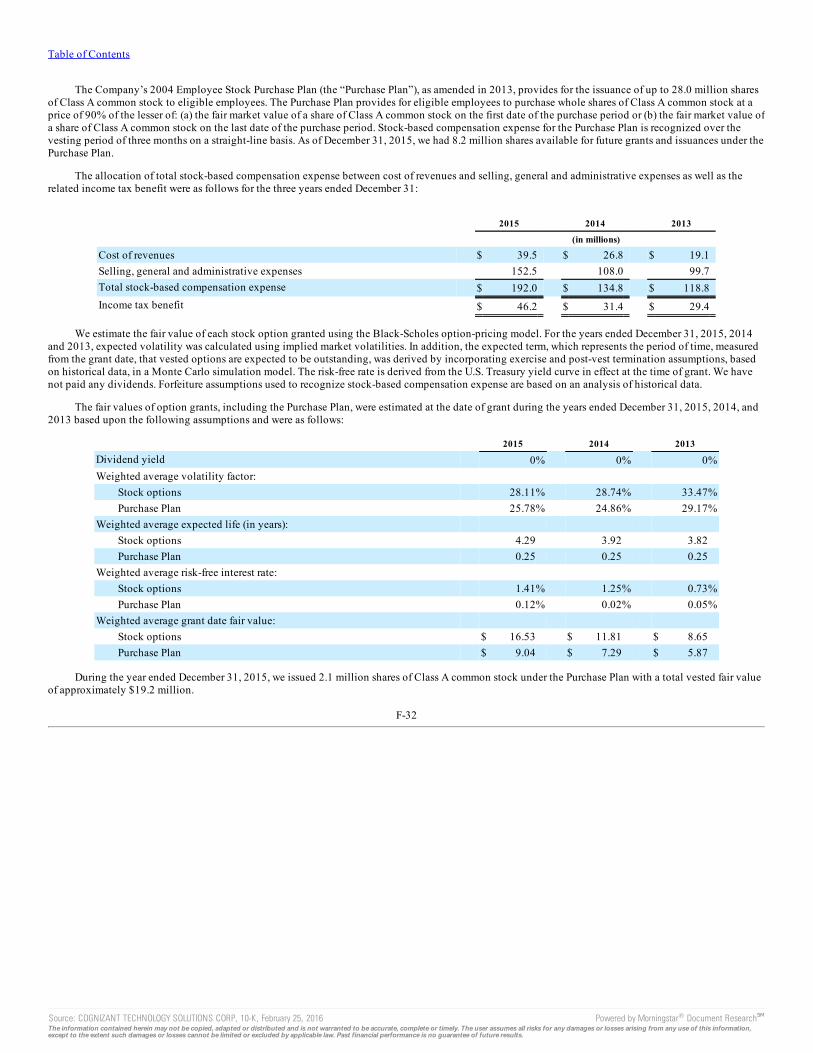
Table of Contents
The Company’s 2004 Employee Stock Purchase Plan (the “Purchase Plan”), as amended in 2013, provides for the issuance of up to 28.0 million sharesof Class A common stock to eligible employees. The Purchase Plan provides for eligible employees to purchase whole shares of Class A common stock at aprice of 90% of the lesser of: (a) the fair market value of a share of Class A common stock on the first date of the purchase period or (b) the fair market value ofa share of Class A common stock on the last date of the purchase period. Stock-based compensation expense for the Purchase Plan is recognized over thevesting period of three months on a straight-line basis. As of December 31, 2015, we had 8.2 million shares available for future grants and issuances under thePurchase Plan.
The allocation of total stock-based compensation expense between cost of revenues and selling, general and administrative expenses as well as therelated income tax benefit were as follows for the three years ended December 31:
2015 2014 2013
(in millions)
Cost of revenues $ 39.5 $ 26.8 $ 19.1Selling, general and administrative expenses 152.5 108.0 99.7Total stock-based compensation expense $ 192.0 $ 134.8 $ 118.8Income tax benefit $ 46.2 $ 31.4 $ 29.4
We estimate the fair value of each stock option granted using the Black-Scholes option-pricing model. For the years ended December 31, 2015, 2014and 2013, expected volatility was calculated using implied market volatilities. In addition, the expected term, which represents the period of time, measuredfrom the grant date, that vested options are expected to be outstanding, was derived by incorporating exercise and post-vest termination assumptions, basedon historical data, in a Monte Carlo simulation model. The risk-free rate is derived from the U.S. Treasury yield curve in effect at the time of grant. We havenot paid any dividends. Forfeiture assumptions used to recognize stock-based compensation expense are based on an analysis of historical data.
The fair values of option grants, including the Purchase Plan, were estimated at the date of grant during the years ended December 31, 2015, 2014, and2013 based upon the following assumptions and were as follows:
2015 2014 2013
Dividend yield 0% 0% 0%Weighted average volatility factor:
Stock options 28.11% 28.74% 33.47%Purchase Plan 25.78% 24.86% 29.17%
Weighted average expected life (in years): Stock options 4.29 3.92 3.82Purchase Plan 0.25 0.25 0.25
Weighted average risk-free interest rate: Stock options 1.41% 1.25% 0.73%Purchase Plan 0.12% 0.02% 0.05%
Weighted average grant date fair value: Stock options $ 16.53 $ 11.81 $ 8.65Purchase Plan $ 9.04 $ 7.29 $ 5.87
During the year ended December 31, 2015, we issued 2.1 million shares of Class A common stock under the Purchase Plan with a total vested fair valueof approximately $19.2 million.
F-32
Source: COGNIZANT TECHNOLOGY SOLUTIONS CORP, 10-K, February 25, 2016 Powered by Morningstar® Document Research℠The information contained herein may not be copied, adapted or distributed and is not warranted to be accurate, complete or timely. The user assumes all risks for any damages or losses arising from any use of this information,except to the extent such damages or losses cannot be limited or excluded by applicable law. Past financial performance is no guarantee of future results.
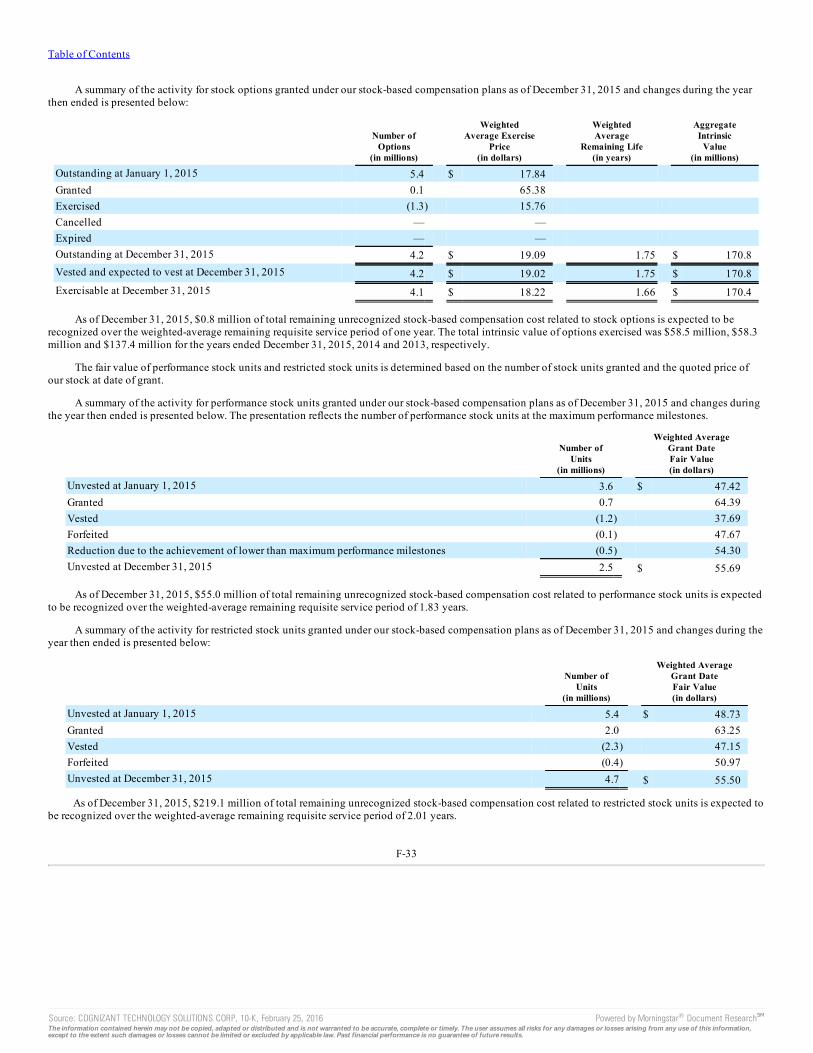
Table of Contents
A summary of the activity for stock options granted under our stock-based compensation plans as of December 31, 2015 and changes during the yearthen ended is presented below:
Number ofOptions
(in millions)
WeightedAverage Exercise
Price(in dollars)
WeightedAverage
Remaining Life(in years)
AggregateIntrinsic
Value(in millions)
Outstanding at January 1, 2015 5.4 $ 17.84 Granted 0.1 65.38 Exercised (1.3) 15.76 Cancelled — — Expired — — Outstanding at December 31, 2015 4.2 $ 19.09 1.75 $ 170.8Vested and expected to vest at December 31, 2015 4.2 $ 19.02 1.75 $ 170.8Exercisable at December 31, 2015 4.1 $ 18.22 1.66 $ 170.4
As of December 31, 2015, $0.8 million of total remaining unrecognized stock-based compensation cost related to stock options is expected to berecognized over the weighted-average remaining requisite service period of one year. The total intrinsic value of options exercised was $58.5 million, $58.3million and $137.4 million for the years ended December 31, 2015, 2014 and 2013, respectively.
The fair value of performance stock units and restricted stock units is determined based on the number of stock units granted and the quoted price ofour stock at date of grant.
A summary of the activity for performance stock units granted under our stock-based compensation plans as of December 31, 2015 and changes duringthe year then ended is presented below. The presentation reflects the number of performance stock units at the maximum performance milestones.
Number ofUnits
(in millions)
Weighted AverageGrant DateFair Value(in dollars)
Unvested at January 1, 2015 3.6 $ 47.42Granted 0.7 64.39Vested (1.2) 37.69Forfeited (0.1) 47.67Reduction due to the achievement of lower than maximum performance milestones (0.5) 54.30Unvested at December 31, 2015 2.5 $ 55.69
As of December 31, 2015, $55.0 million of total remaining unrecognized stock-based compensation cost related to performance stock units is expectedto be recognized over the weighted-average remaining requisite service period of 1.83 years.
A summary of the activity for restricted stock units granted under our stock-based compensation plans as of December 31, 2015 and changes during theyear then ended is presented below:
Number ofUnits
(in millions)
Weighted AverageGrant DateFair Value(in dollars)
Unvested at January 1, 2015 5.4 $ 48.73Granted 2.0 63.25Vested (2.3) 47.15Forfeited (0.4) 50.97Unvested at December 31, 2015 4.7 $ 55.50
As of December 31, 2015, $219.1 million of total remaining unrecognized stock-based compensation cost related to restricted stock units is expected tobe recognized over the weighted-average remaining requisite service period of 2.01 years.
F-33
Source: COGNIZANT TECHNOLOGY SOLUTIONS CORP, 10-K, February 25, 2016 Powered by Morningstar® Document Research℠The information contained herein may not be copied, adapted or distributed and is not warranted to be accurate, complete or timely. The user assumes all risks for any damages or losses arising from any use of this information,except to the extent such damages or losses cannot be limited or excluded by applicable law. Past financial performance is no guarantee of future results.
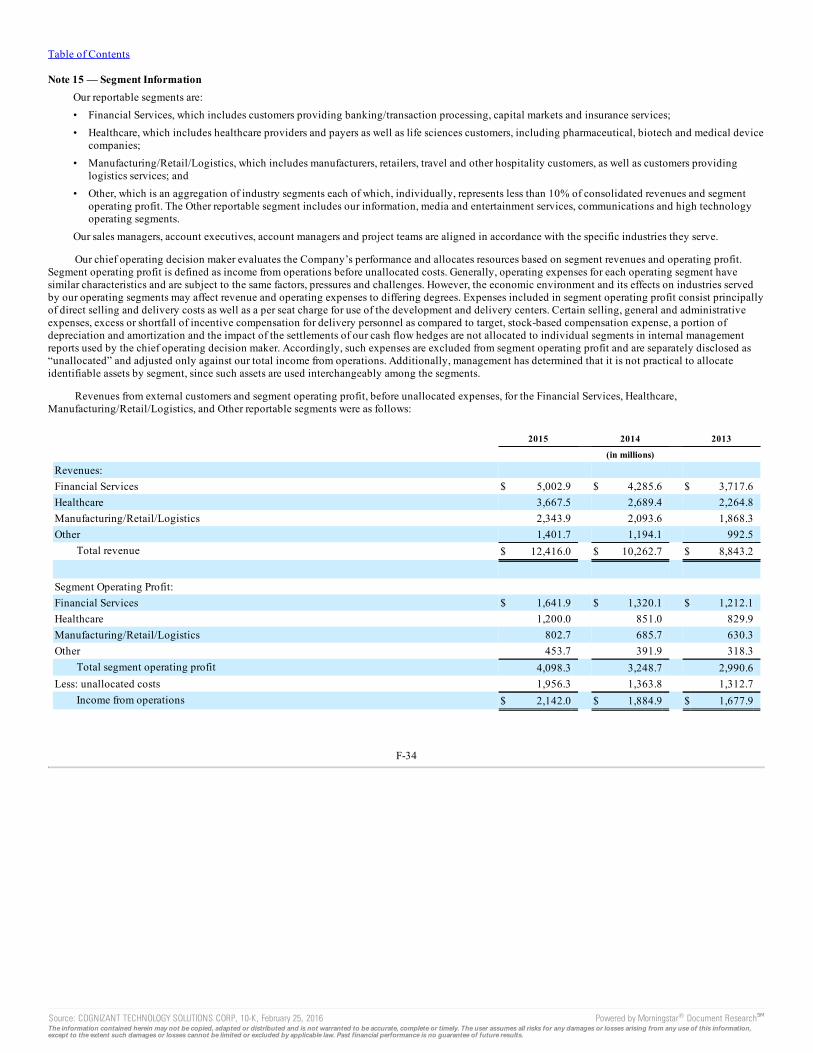
Table of Contents
Note 15 — Segment InformationOur reportable segments are:• Financial Services, which includes customers providing banking/transaction processing, capital markets and insurance services;• Healthcare, which includes healthcare providers and payers as well as life sciences customers, including pharmaceutical, biotech and medical device
companies;• Manufacturing/Retail/Logistics, which includes manufacturers, retailers, travel and other hospitality customers, as well as customers providing
logistics services; and• Other, which is an aggregation of industry segments each of which, individually, represents less than 10% of consolidated revenues and segment
operating profit. The Other reportable segment includes our information, media and entertainment services, communications and high technologyoperating segments.
Our sales managers, account executives, account managers and project teams are aligned in accordance with the specific industries they serve.
Our chief operating decision maker evaluates the Company’s performance and allocates resources based on segment revenues and operating profit.Segment operating profit is defined as income from operations before unallocated costs. Generally, operating expenses for each operating segment havesimilar characteristics and are subject to the same factors, pressures and challenges. However, the economic environment and its effects on industries servedby our operating segments may affect revenue and operating expenses to differing degrees. Expenses included in segment operating profit consist principallyof direct selling and delivery costs as well as a per seat charge for use of the development and delivery centers. Certain selling, general and administrativeexpenses, excess or shortfall of incentive compensation for delivery personnel as compared to target, stock-based compensation expense, a portion ofdepreciation and amortization and the impact of the settlements of our cash flow hedges are not allocated to individual segments in internal managementreports used by the chief operating decision maker. Accordingly, such expenses are excluded from segment operating profit and are separately disclosed as“unallocated” and adjusted only against our total income from operations. Additionally, management has determined that it is not practical to allocateidentifiable assets by segment, since such assets are used interchangeably among the segments.
Revenues from external customers and segment operating profit, before unallocated expenses, for the Financial Services, Healthcare,Manufacturing/Retail/Logistics, and Other reportable segments were as follows:
2015 2014 2013
(in millions)
Revenues: Financial Services $ 5,002.9 $ 4,285.6 $ 3,717.6Healthcare 3,667.5 2,689.4 2,264.8Manufacturing/Retail/Logistics 2,343.9 2,093.6 1,868.3Other 1,401.7 1,194.1 992.5
Total revenue $ 12,416.0 $ 10,262.7 $ 8,843.2
Segment Operating Profit: Financial Services $ 1,641.9 $ 1,320.1 $ 1,212.1Healthcare 1,200.0 851.0 829.9Manufacturing/Retail/Logistics 802.7 685.7 630.3Other 453.7 391.9 318.3
Total segment operating profit 4,098.3 3,248.7 2,990.6Less: unallocated costs 1,956.3 1,363.8 1,312.7
Income from operations $ 2,142.0 $ 1,884.9 $ 1,677.9
F-34
Source: COGNIZANT TECHNOLOGY SOLUTIONS CORP, 10-K, February 25, 2016 Powered by Morningstar® Document Research℠The information contained herein may not be copied, adapted or distributed and is not warranted to be accurate, complete or timely. The user assumes all risks for any damages or losses arising from any use of this information,except to the extent such damages or losses cannot be limited or excluded by applicable law. Past financial performance is no guarantee of future results.
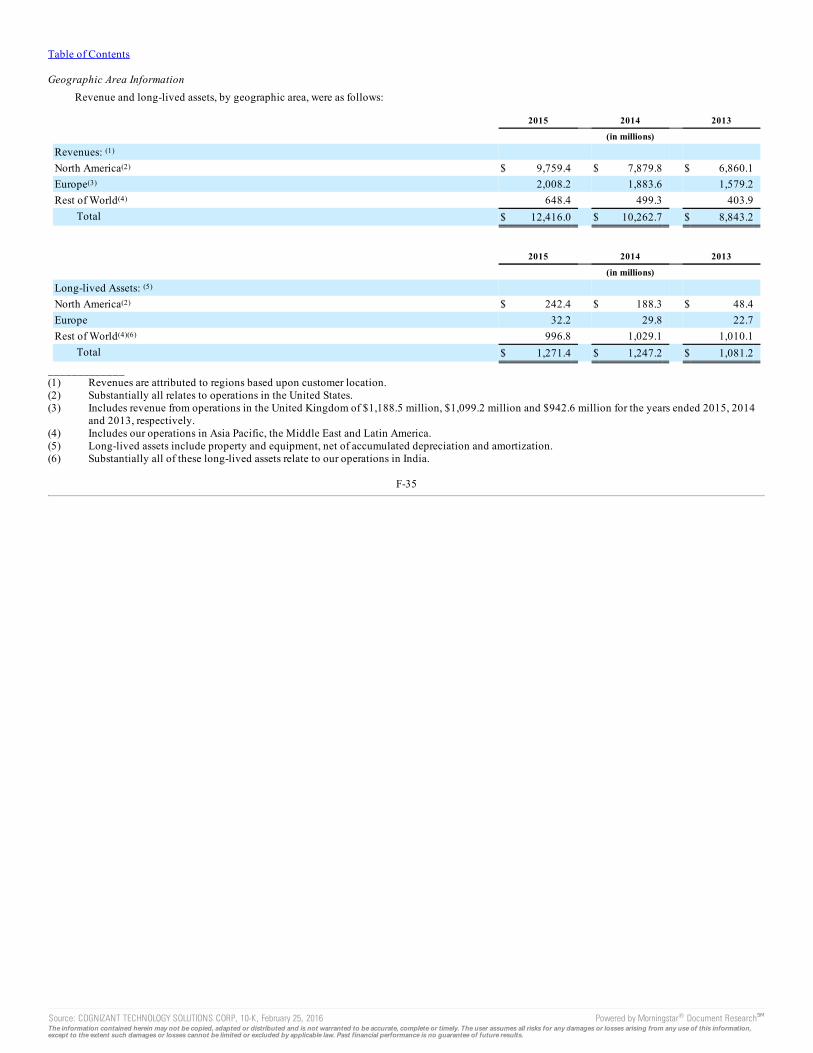
Table of Contents
Geographic Area InformationRevenue and long-lived assets, by geographic area, were as follows:
2015 2014 2013
(in millions)
Revenues: (1) North America(2) $ 9,759.4 $ 7,879.8 $ 6,860.1Europe(3) 2,008.2 1,883.6 1,579.2Rest of World(4) 648.4 499.3 403.9
Total $ 12,416.0 $ 10,262.7 $ 8,843.2
2015 2014 2013
(in millions)
Long-lived Assets: (5) North America(2) $ 242.4 $ 188.3 $ 48.4Europe 32.2 29.8 22.7Rest of World(4)(6) 996.8 1,029.1 1,010.1
Total $ 1,271.4 $ 1,247.2 $ 1,081.2_____________(1) Revenues are attributed to regions based upon customer location.(2) Substantially all relates to operations in the United States.(3) Includes revenue from operations in the United Kingdom of $1,188.5 million, $1,099.2 million and $942.6 million for the years ended 2015, 2014
and 2013, respectively.(4) Includes our operations in Asia Pacific, the Middle East and Latin America.(5) Long-lived assets include property and equipment, net of accumulated depreciation and amortization.(6) Substantially all of these long-lived assets relate to our operations in India.
F-35
Source: COGNIZANT TECHNOLOGY SOLUTIONS CORP, 10-K, February 25, 2016 Powered by Morningstar® Document Research℠The information contained herein may not be copied, adapted or distributed and is not warranted to be accurate, complete or timely. The user assumes all risks for any damages or losses arising from any use of this information,except to the extent such damages or losses cannot be limited or excluded by applicable law. Past financial performance is no guarantee of future results.
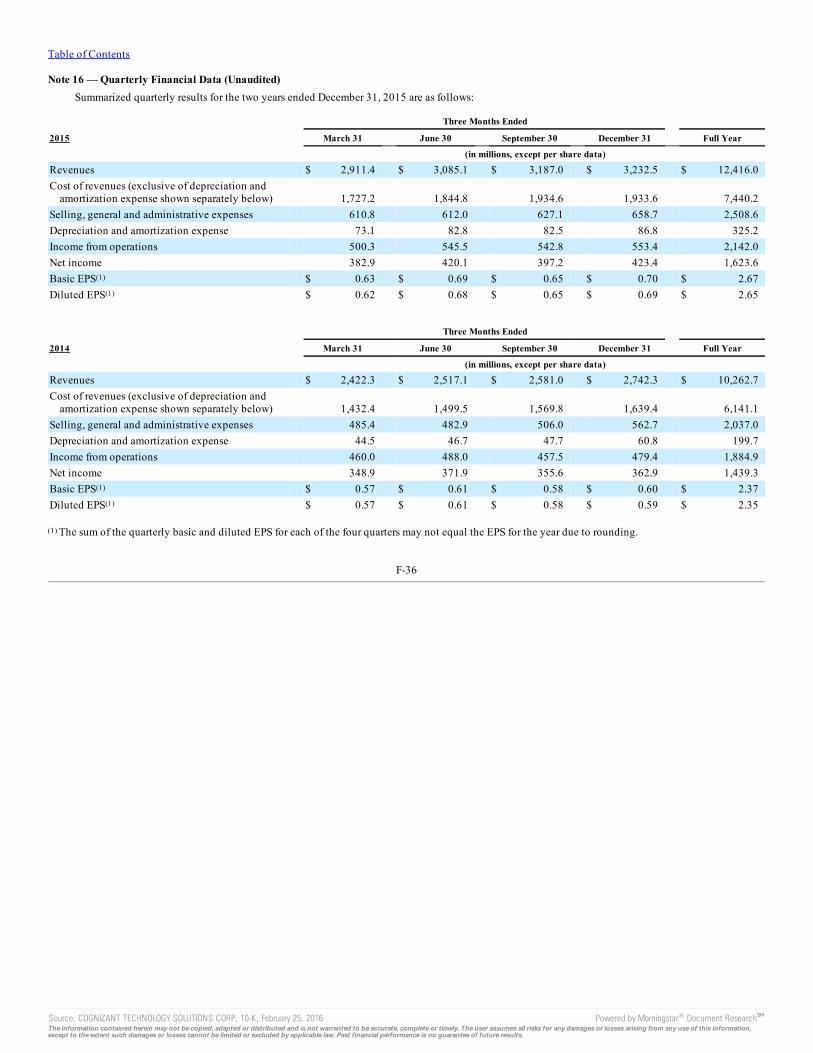
Table of Contents
Note 16 — Quarterly Financial Data (Unaudited)Summarized quarterly results for the two years ended December 31, 2015 are as follows:
Three Months Ended
2015 March 31 June 30 September 30 December 31 Full Year
(in millions, except per share data)
Revenues $ 2,911.4 $ 3,085.1 $ 3,187.0 $ 3,232.5 $ 12,416.0Cost of revenues (exclusive of depreciation and
amortization expense shown separately below) 1,727.2 1,844.8 1,934.6 1,933.6 7,440.2Selling, general and administrative expenses 610.8 612.0 627.1 658.7 2,508.6Depreciation and amortization expense 73.1 82.8 82.5 86.8 325.2Income from operations 500.3 545.5 542.8 553.4 2,142.0Net income 382.9 420.1 397.2 423.4 1,623.6Basic EPS(1) $ 0.63 $ 0.69 $ 0.65 $ 0.70 $ 2.67Diluted EPS(1) $ 0.62 $ 0.68 $ 0.65 $ 0.69 $ 2.65
Three Months Ended 2014 March 31 June 30 September 30 December 31 Full Year
(in millions, except per share data)
Revenues $ 2,422.3 $ 2,517.1 $ 2,581.0 $ 2,742.3 $ 10,262.7Cost of revenues (exclusive of depreciation and
amortization expense shown separately below) 1,432.4 1,499.5 1,569.8 1,639.4 6,141.1Selling, general and administrative expenses 485.4 482.9 506.0 562.7 2,037.0Depreciation and amortization expense 44.5 46.7 47.7 60.8 199.7Income from operations 460.0 488.0 457.5 479.4 1,884.9Net income 348.9 371.9 355.6 362.9 1,439.3Basic EPS(1) $ 0.57 $ 0.61 $ 0.58 $ 0.60 $ 2.37Diluted EPS(1) $ 0.57 $ 0.61 $ 0.58 $ 0.59 $ 2.35
(1) The sum of the quarterly basic and diluted EPS for each of the four quarters may not equal the EPS for the year due to rounding.
F-36
Source: COGNIZANT TECHNOLOGY SOLUTIONS CORP, 10-K, February 25, 2016 Powered by Morningstar® Document Research℠The information contained herein may not be copied, adapted or distributed and is not warranted to be accurate, complete or timely. The user assumes all risks for any damages or losses arising from any use of this information,except to the extent such damages or losses cannot be limited or excluded by applicable law. Past financial performance is no guarantee of future results.
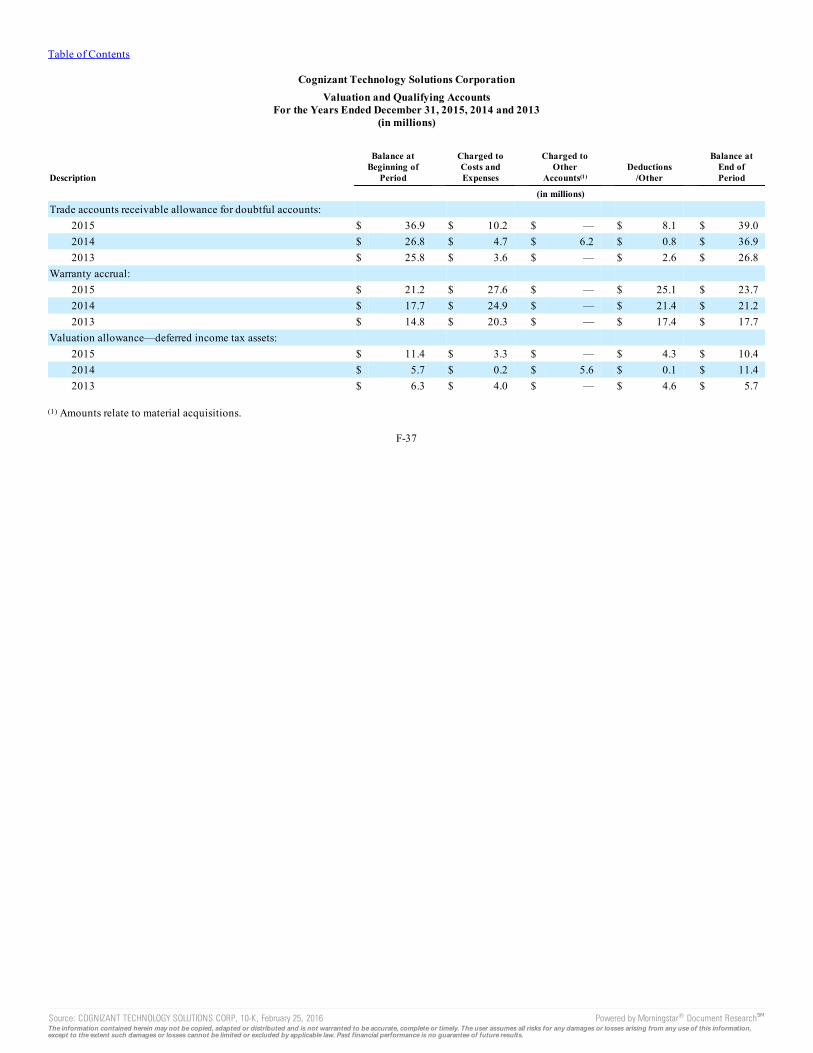
Table of Contents
Cognizant Technology Solutions CorporationValuation and Qualifying Accounts
For the Years Ended December 31, 2015, 2014 and 2013(in millions)
Description
Balance atBeginning of
Period
Charged toCosts andExpenses
Charged toOther
Accounts(1) Deductions
/Other
Balance atEnd ofPeriod
(in millions)
Trade accounts receivable allowance for doubtful accounts: 2015 $ 36.9 $ 10.2 $ — $ 8.1 $ 39.02014 $ 26.8 $ 4.7 $ 6.2 $ 0.8 $ 36.92013 $ 25.8 $ 3.6 $ — $ 2.6 $ 26.8
Warranty accrual: 2015 $ 21.2 $ 27.6 $ — $ 25.1 $ 23.72014 $ 17.7 $ 24.9 $ — $ 21.4 $ 21.22013 $ 14.8 $ 20.3 $ — $ 17.4 $ 17.7
Valuation allowance—deferred income tax assets: 2015 $ 11.4 $ 3.3 $ — $ 4.3 $ 10.42014 $ 5.7 $ 0.2 $ 5.6 $ 0.1 $ 11.42013 $ 6.3 $ 4.0 $ — $ 4.6 $ 5.7
(1) Amounts relate to material acquisitions.
F-37
Source: COGNIZANT TECHNOLOGY SOLUTIONS CORP, 10-K, February 25, 2016 Powered by Morningstar® Document Research℠The information contained herein may not be copied, adapted or distributed and is not warranted to be accurate, complete or timely. The user assumes all risks for any damages or losses arising from any use of this information,except to the extent such damages or losses cannot be limited or excluded by applicable law. Past financial performance is no guarantee of future results.
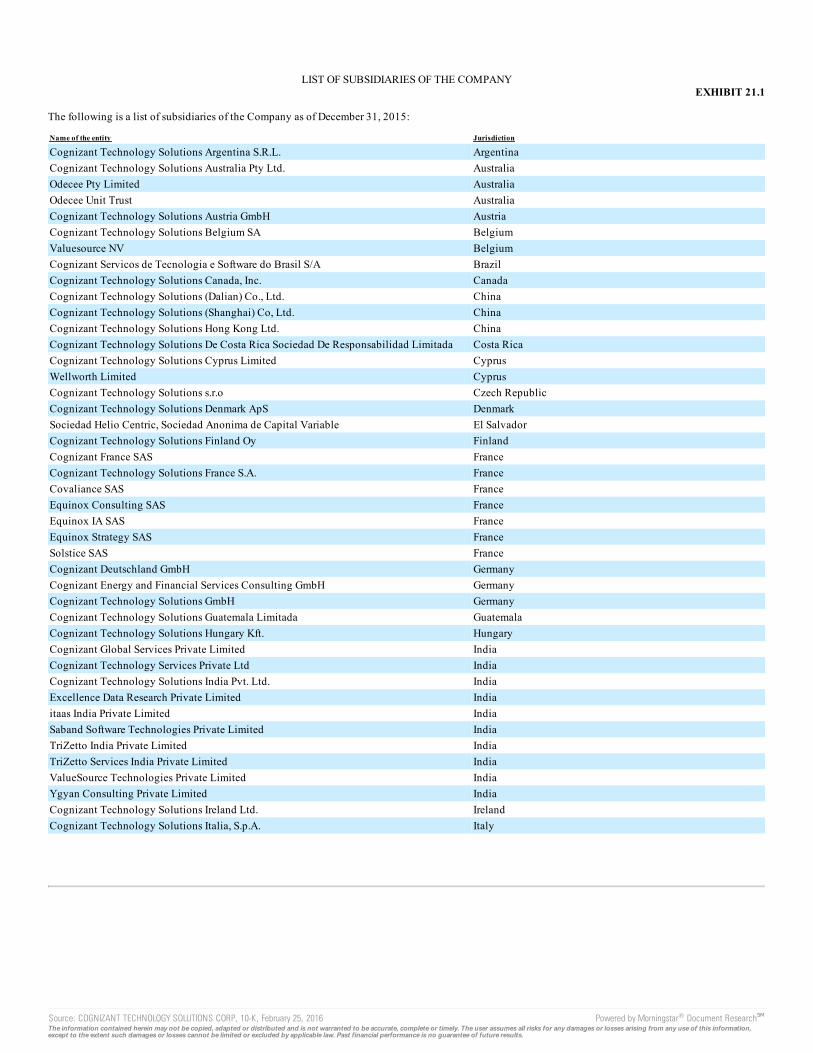
LIST OF SUBSIDIARIES OF THE COMPANYEXHIBIT 21.1
The following is a list of subsidiaries of the Company as of December 31, 2015:
Name of the entity Jurisdiction
Cognizant Technology Solutions Argentina S.R.L. ArgentinaCognizant Technology Solutions Australia Pty Ltd. AustraliaOdecee Pty Limited AustraliaOdecee Unit Trust AustraliaCognizant Technology Solutions Austria GmbH AustriaCognizant Technology Solutions Belgium SA BelgiumValuesource NV BelgiumCognizant Servicos de Tecnologia e Software do Brasil S/A BrazilCognizant Technology Solutions Canada, Inc. CanadaCognizant Technology Solutions (Dalian) Co., Ltd. ChinaCognizant Technology Solutions (Shanghai) Co, Ltd. ChinaCognizant Technology Solutions Hong Kong Ltd. ChinaCognizant Technology Solutions De Costa Rica Sociedad De Responsabilidad Limitada Costa RicaCognizant Technology Solutions Cyprus Limited CyprusWellworth Limited CyprusCognizant Technology Solutions s.r.o Czech RepublicCognizant Technology Solutions Denmark ApS DenmarkSociedad Helio Centric, Sociedad Anonima de Capital Variable El SalvadorCognizant Technology Solutions Finland Oy FinlandCognizant France SAS FranceCognizant Technology Solutions France S.A. FranceCovaliance SAS FranceEquinox Consulting SAS FranceEquinox IA SAS FranceEquinox Strategy SAS FranceSolstice SAS FranceCognizant Deutschland GmbH GermanyCognizant Energy and Financial Services Consulting GmbH GermanyCognizant Technology Solutions GmbH GermanyCognizant Technology Solutions Guatemala Limitada GuatemalaCognizant Technology Solutions Hungary Kft. HungaryCognizant Global Services Private Limited IndiaCognizant Technology Services Private Ltd IndiaCognizant Technology Solutions India Pvt. Ltd. IndiaExcellence Data Research Private Limited Indiaitaas India Private Limited IndiaSaband Software Technologies Private Limited IndiaTriZetto India Private Limited IndiaTriZetto Services India Private Limited IndiaValueSource Technologies Private Limited IndiaYgyan Consulting Private Limited IndiaCognizant Technology Solutions Ireland Ltd. IrelandCognizant Technology Solutions Italia, S.p.A. Italy
Source: COGNIZANT TECHNOLOGY SOLUTIONS CORP, 10-K, February 25, 2016 Powered by Morningstar® Document Research℠The information contained herein may not be copied, adapted or distributed and is not warranted to be accurate, complete or timely. The user assumes all risks for any damages or losses arising from any use of this information,except to the extent such damages or losses cannot be limited or excluded by applicable law. Past financial performance is no guarantee of future results.
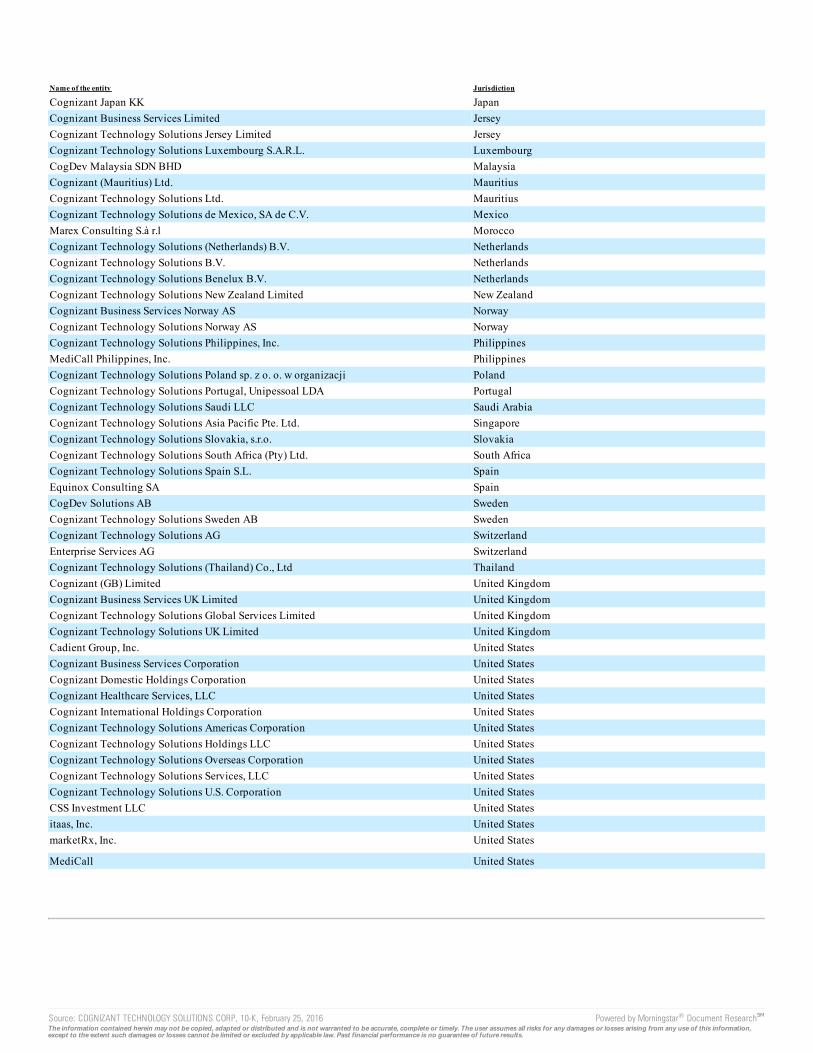
Name of the entity Jurisdiction
Cognizant Japan KK JapanCognizant Business Services Limited JerseyCognizant Technology Solutions Jersey Limited JerseyCognizant Technology Solutions Luxembourg S.A.R.L. LuxembourgCogDev Malaysia SDN BHD MalaysiaCognizant (Mauritius) Ltd. MauritiusCognizant Technology Solutions Ltd. MauritiusCognizant Technology Solutions de Mexico, SA de C.V. MexicoMarex Consulting S.à r.l MoroccoCognizant Technology Solutions (Netherlands) B.V. NetherlandsCognizant Technology Solutions B.V. NetherlandsCognizant Technology Solutions Benelux B.V. NetherlandsCognizant Technology Solutions New Zealand Limited New ZealandCognizant Business Services Norway AS NorwayCognizant Technology Solutions Norway AS NorwayCognizant Technology Solutions Philippines, Inc. PhilippinesMediCall Philippines, Inc. PhilippinesCognizant Technology Solutions Poland sp. z o. o. w organizacji PolandCognizant Technology Solutions Portugal, Unipessoal LDA PortugalCognizant Technology Solutions Saudi LLC Saudi ArabiaCognizant Technology Solutions Asia Pacific Pte. Ltd. SingaporeCognizant Technology Solutions Slovakia, s.r.o. SlovakiaCognizant Technology Solutions South Africa (Pty) Ltd. South AfricaCognizant Technology Solutions Spain S.L. SpainEquinox Consulting SA SpainCogDev Solutions AB SwedenCognizant Technology Solutions Sweden AB SwedenCognizant Technology Solutions AG SwitzerlandEnterprise Services AG SwitzerlandCognizant Technology Solutions (Thailand) Co., Ltd ThailandCognizant (GB) Limited United KingdomCognizant Business Services UK Limited United KingdomCognizant Technology Solutions Global Services Limited United KingdomCognizant Technology Solutions UK Limited United KingdomCadient Group, Inc. United StatesCognizant Business Services Corporation United StatesCognizant Domestic Holdings Corporation United StatesCognizant Healthcare Services, LLC United StatesCognizant International Holdings Corporation United StatesCognizant Technology Solutions Americas Corporation United StatesCognizant Technology Solutions Holdings LLC United StatesCognizant Technology Solutions Overseas Corporation United StatesCognizant Technology Solutions Services, LLC United StatesCognizant Technology Solutions U.S. Corporation United StatesCSS Investment LLC United Statesitaas, Inc. United StatesmarketRx, Inc. United States
MediCall United States
Source: COGNIZANT TECHNOLOGY SOLUTIONS CORP, 10-K, February 25, 2016 Powered by Morningstar® Document Research℠The information contained herein may not be copied, adapted or distributed and is not warranted to be accurate, complete or timely. The user assumes all risks for any damages or losses arising from any use of this information,except to the extent such damages or losses cannot be limited or excluded by applicable law. Past financial performance is no guarantee of future results.
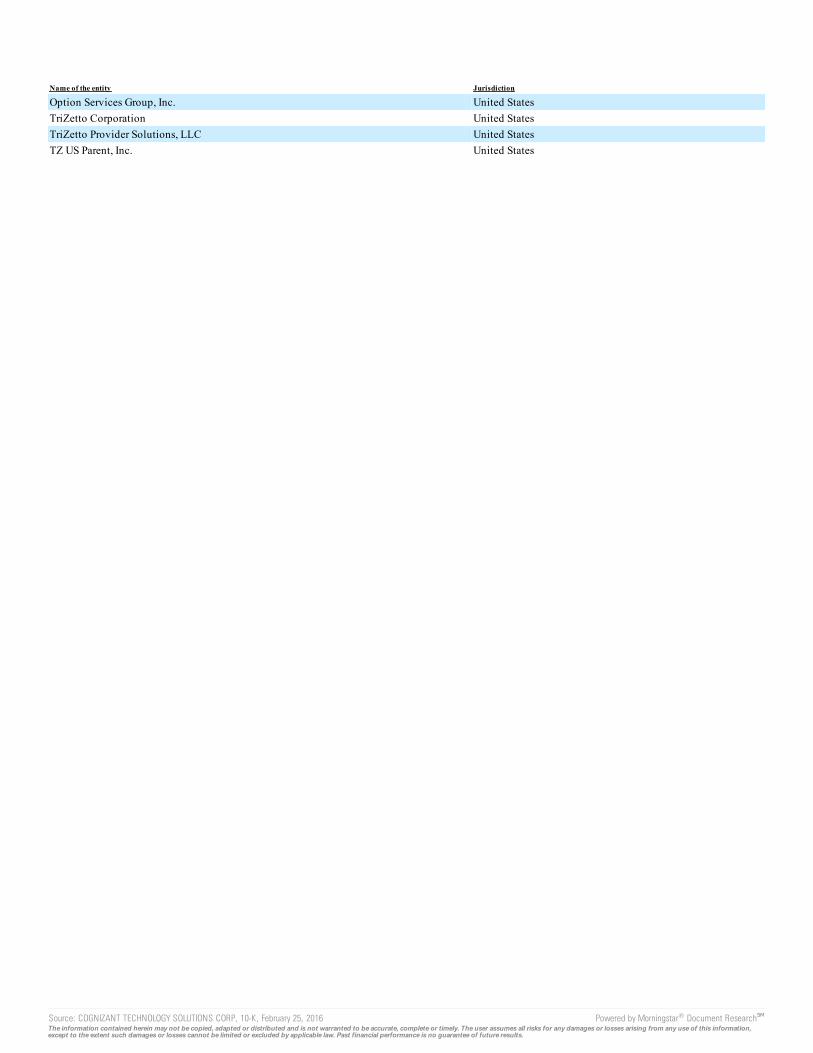
Name of the entity Jurisdiction
Option Services Group, Inc. United StatesTriZetto Corporation United StatesTriZetto Provider Solutions, LLC United StatesTZ US Parent, Inc. United States
Source: COGNIZANT TECHNOLOGY SOLUTIONS CORP, 10-K, February 25, 2016 Powered by Morningstar® Document Research℠The information contained herein may not be copied, adapted or distributed and is not warranted to be accurate, complete or timely. The user assumes all risks for any damages or losses arising from any use of this information,except to the extent such damages or losses cannot be limited or excluded by applicable law. Past financial performance is no guarantee of future results.

EXHIBIT 23.1
Consent of Independent Registered Public Accounting Firm
We hereby consent to the incorporation by reference in the Registration Statements on Form S-8 (Nos. 333-59439, 333-86909, 333-43402, 333-68772,333-114464, 333-127308, 333-144125, 333-160450, 333-169534, and 333-191249) of Cognizant Technology Solutions Corporation of our report datedFebruary 25, 2016, relating to the financial statements, financial statement schedule and the effectiveness of internal control over financial reporting, whichappears in this Form 10-K.
PricewaterhouseCoopers LLPNew York, New YorkFebruary 25, 2016
Source: COGNIZANT TECHNOLOGY SOLUTIONS CORP, 10-K, February 25, 2016 Powered by Morningstar® Document Research℠The information contained herein may not be copied, adapted or distributed and is not warranted to be accurate, complete or timely. The user assumes all risks for any damages or losses arising from any use of this information,except to the extent such damages or losses cannot be limited or excluded by applicable law. Past financial performance is no guarantee of future results.
EXHIBIT 31.1
CERTIFICATION
I, Francisco D’Souza, certify that:
1. I have reviewed this Annual Report on Form 10-K of Cognizant Technology Solutions Corporation;
2. Based on my knowledge, this report does not contain any untrue statement of a material fact or omit to state a material fact necessary to make thestatements made, in light of the circumstances under which such statements were made, not misleading with respect to the period covered by thisreport;
3. Based on my knowledge, the financial statements, and other financial information included in this report, fairly present in all material respects thefinancial condition, results of operations and cash flows of the registrant as of, and for, the periods presented in this report;
4. The registrant’s other certifying officer and I are responsible for establishing and maintaining disclosure controls and procedures (as defined inExchange Act Rules 13a-15(e) and 15d-15(e)) and internal control over financial reporting (as defined in Exchange Act Rules 13a-15(f) and 15d-15(f)) for the registrant and have:
a) Designed such disclosure controls and procedures, or caused such disclosure controls and procedures to be designed under our supervision,to ensure that material information relating to the registrant, including its consolidated subsidiaries, is made known to us by others withinthose entities, particularly during the period in which this report is being prepared;
b) Designed such internal control over financial reporting, or caused such internal control over financial reporting to be designed under oursupervision, to provide reasonable assurance regarding the reliability of financial reporting and the preparation of financial statements forexternal purposes in accordance with generally accepted accounting principles;
c) Evaluated the effectiveness of the registrant’s disclosure controls and procedures and presented in this report our conclusions about theeffectiveness of the disclosure controls and procedures, as of the end of the period covered by this report based on such evaluation; and
d) Disclosed in this report any change in the registrant’s internal control over financial reporting that occurred during the registrant’s mostrecent fiscal quarter (the registrant’s fourth fiscal quarter in the case of an annual report) that has materially affected, or is reasonably likelyto materially affect, the registrant’s internal control over financial reporting; and
5. The registrant’s other certifying officer and I have disclosed, based on our most recent evaluation of internal control over financial reporting, to theregistrant’s auditors and the audit committee of the registrant’s board of directors (or persons performing the equivalent function):
a) All significant deficiencies and material weaknesses in the design or operation of internal control over financial reporting which arereasonably likely to adversely affect the registrant’s ability to record, process, summarize and report financial information; and
b) Any fraud, whether or not material, that involves management or other employees who have a significant role in the registrant’s internalcontrol over financial reporting.
Dated: February 25, 2016 /s/ Francisco D'Souza
Francisco D'SouzaChief Executive Officer(Principal Executive Officer)
Source: COGNIZANT TECHNOLOGY SOLUTIONS CORP, 10-K, February 25, 2016 Powered by Morningstar® Document Research℠The information contained herein may not be copied, adapted or distributed and is not warranted to be accurate, complete or timely. The user assumes all risks for any damages or losses arising from any use of this information,except to the extent such damages or losses cannot be limited or excluded by applicable law. Past financial performance is no guarantee of future results.
EXHIBIT 31.2
CERTIFICATION
I, Karen McLoughlin, certify that:
1. I have reviewed this Annual Report on Form 10-K of Cognizant Technology Solutions Corporation;
2. Based on my knowledge, this report does not contain any untrue statement of a material fact or omit to state a material fact necessary to make thestatements made, in light of the circumstances under which such statements were made, not misleading with respect to the period covered by thisreport;
3. Based on my knowledge, the financial statements, and other financial information included in this report, fairly present in all material respects thefinancial condition, results of operations and cash flows of the registrant as of, and for, the periods presented in this report;
4. The registrant’s other certifying officer and I are responsible for establishing and maintaining disclosure controls and procedures (as defined inExchange Act Rules 13a-15(e) and 15d-15(e)) and internal control over financial reporting (as defined in Exchange Act Rules 13a-15(f) and 15d-15(f)) for the registrant and have:
a) Designed such disclosure controls and procedures, or caused such disclosure controls and procedures to be designed under our supervision,to ensure that material information relating to the registrant, including its consolidated subsidiaries, is made known to us by others withinthose entities, particularly during the period in which this report is being prepared;
b) Designed such internal control over financial reporting, or caused such internal control over financial reporting to be designed under oursupervision, to provide reasonable assurance regarding the reliability of financial reporting and the preparation of financial statements forexternal purposes in accordance with generally accepted accounting principles;
c) Evaluated the effectiveness of the registrant’s disclosure controls and procedures and presented in this report our conclusions about theeffectiveness of the disclosure controls and procedures, as of the end of the period covered by this report based on such evaluation; and
d) Disclosed in this report any change in the registrant’s internal control over financial reporting that occurred during the registrant’s mostrecent fiscal quarter (the registrant’s fourth fiscal quarter in the case of an annual report) that has materially affected, or is reasonably likelyto materially affect, the registrant’s internal control over financial reporting; and
5. The registrant’s other certifying officer and I have disclosed, based on our most recent evaluation of internal control over financial reporting, to theregistrant’s auditors and the audit committee of the registrant’s board of directors (or persons performing the equivalent function):
a) All significant deficiencies and material weaknesses in the design or operation of internal control over financial reporting which arereasonably likely to adversely affect the registrant’s ability to record, process, summarize and report financial information; and
b) Any fraud, whether or not material, that involves management or other employees who have a significant role in the registrant’s internalcontrol over financial reporting.
Dated: February 25, 2016 /s/ Karen McLoughlin
Karen McLoughlinChief Financial Officer(Principal Financial and Accounting Officer)
Source: COGNIZANT TECHNOLOGY SOLUTIONS CORP, 10-K, February 25, 2016 Powered by Morningstar® Document Research℠The information contained herein may not be copied, adapted or distributed and is not warranted to be accurate, complete or timely. The user assumes all risks for any damages or losses arising from any use of this information,except to the extent such damages or losses cannot be limited or excluded by applicable law. Past financial performance is no guarantee of future results.
EXHIBIT 32.1CERTIFICATION PURSUANT TO 18 U.S.C. SECTION 1350,
AS ADOPTED PURSUANT TOSECTION 906 OF THE SARBANES-OXLEY ACT OF 2002*
In connection with the Annual Report on Form 10-K of Cognizant Technology Solutions Corporation (the “Company”) for the period endedDecember 31, 2015 as filed with the Securities and Exchange Commission on the date hereof (the “Report”), the undersigned, Francisco D’Souza, ChiefExecutive Officer of the Company, hereby certifies, pursuant to 18 U.S.C. Section 1350, that:
(1) The Report fully complies with the requirements of Section 13(a) or 15(d) of the Securities Exchange Act of 1934; and
(2) The information contained in the Report fairly presents, in all material respects, the financial condition and results of operations of theCompany.
Dated: February 25, 2016 /s/ Francisco D'Souza
Francisco D'SouzaChief Executive Officer(Principal Executive Officer)
_____________________* A signed original of this written statement required by Section 906 has been provided to Cognizant Technology Solutions Corporation and will be
retained by Cognizant Technology Solutions Corporation and furnished to the Securities and Exchange Commission or its staff upon request.
Source: COGNIZANT TECHNOLOGY SOLUTIONS CORP, 10-K, February 25, 2016 Powered by Morningstar® Document Research℠The information contained herein may not be copied, adapted or distributed and is not warranted to be accurate, complete or timely. The user assumes all risks for any damages or losses arising from any use of this information,except to the extent such damages or losses cannot be limited or excluded by applicable law. Past financial performance is no guarantee of future results.
EXHIBIT 32.2CERTIFICATION PURSUANT TO 18 U.S.C. SECTION 1350,
AS ADOPTED PURSUANT TOSECTION 906 OF THE SARBANES-OXLEY ACT OF 2002*
In connection with the Annual Report on Form 10-K of Cognizant Technology Solutions Corporation (the “Company”) for the period endedDecember 31, 2015 as filed with the Securities and Exchange Commission on the date hereof (the “Report”), the undersigned, Karen McLoughlin, ChiefFinancial Officer of the Company, hereby certifies, pursuant to 18 U.S.C. Section 1350, that:
(1) The Report fully complies with the requirements of Section 13(a) or 15(d) of the Securities Exchange Act of 1934; and
(2) The information contained in the Report fairly presents, in all material respects, the financial condition and results of operations of theCompany.
Dated: February 25, 2016 /s/ Karen McLoughlin
Karen McLoughlinChief Financial Officer(Principal Financial and Accounting Officer)
_____________________* A signed original of this written statement required by Section 906 has been provided to Cognizant Technology Solutions Corporation and will be
retained by Cognizant Technology Solutions Corporation and furnished to the Securities and Exchange Commission or its staff upon request.
Source: COGNIZANT TECHNOLOGY SOLUTIONS CORP, 10-K, February 25, 2016 Powered by Morningstar® Document Research℠The information contained herein may not be copied, adapted or distributed and is not warranted to be accurate, complete or timely. The user assumes all risks for any damages or losses arising from any use of this information,except to the extent such damages or losses cannot be limited or excluded by applicable law. Past financial performance is no guarantee of future results.

Source: COGNIZANT TECHNOLOGY SOLUTIONS CORP, 10-K, February 25, 2016 Powered by Morningstar® Document Research℠The information contained herein may not be copied, adapted or distributed and is not warranted to be accurate, complete or timely. The user assumes all risks for any damages or losses arising from any use of this information,except to the extent such damages or losses cannot be limited or excluded by applicable law. Past financial performance is no guarantee of future results.