Embed Size (px)
Citation preview

•
.'
ARNO'-O I
~ ~I ------~----~--------~~~~~ I 1~4'iOI
- I
...,.'
--j ....
-, --
.. ,
.'- ... ....,.
'" ..... , "-- .
.,
1 I
I I
J
ADULT PROBATION AND PAROLE REVOCATION PROCESS RESEARCH REPORT
final report january 26.1988
If you have issues viewing or accessing this file contact us at NCJRS.gov.
U.S. Department of Justice National Institute of Justice
124807
This document has been reproduced exactly as received from the person or organization originating it. Points of view or opinions stated in this document are those of the authors and do not necessarily represent the official position or policies of the National Institute of Justice.
Permission to reproduce this copyrighted material has been granted by
of CQr:r:e..c.tions
to the National Criminal Justice Reference Service (NCJRS).
Further reproduction outside of the NCJRS system requires permission of the copyright owner.
•
•
• TABLE OF CONTENTS
Executive Summary. 1
Section I
Introduction ........................................... . 6
Me thodo logy. . . . . . . 0 • • • • • • • It • • • .. • • • • • • • • • .. • • • • .. .. .. • • • • .. • • • • • .. • • • • • • • 8
Section II
Data Analysis. 10
Case Review • 10
• Probation Officer Questionnaire •.•••..• 31
Probation and Parole Case load Analysis. 58
Conclusions and Recommen~ations. 59
Conclusions Based on Case Reviews................................. 59
Conclusions Based on Questionnaires •.•••••••••• 60 ,
Conclusion of the Revocation'Caseload Analysis. 61
Recornrnendations ............................................. " . .. . . .. . • . .. . . .. . . . •. 61
Sect~on III
Appendices ................... III ••••••••••• it ........... " ... III .......... " .. • .. .. • • .. •• 64

•
•
•
EXECUTIVE SUMMARY
The Florida Department of Corrections, with grant funding from the National Institute of Corrections and consultant assistance from the National Council on Crime and Delinquency, conducted an extensive study of the adult probation and parole revocation process as a result of distinguishing several unique areas of concern.
As a result of the data analysis of the case reviews, officer questionnaires and revocation caseload data, the following conclusions and recommendations were reached:
CONCLUSIONS .
case Reviews Analysis
1.
2.
3.
4.
5.
The revocation process and system response is con·sistent statewide. It is believed that those few deviations from the norm are a result of variables that were not controlled for in the case reviews, i. e. prior record and prior violations.
Correctional Probation Officers (CPO) consistently ·and routinely notify the sentencing authority for Group I violations (the most serious violations) .
.. Correctional Probation .Officers routinely notify the sentencing authority for Group II violations. Circuit 15 appears to have interpreted Group II violations as unauthorized moves and not actual absconding .
. All 5 Circuits consistently response of "No Action" for and V.
utilize the system violation Groups IV
Four of the 5 Circuits system response. of II No violations.
consistently utilize Action" for ·Group
the III
6. The most consistent response statewide for all violations of probation with warrant is either probation terminated or probation modified (64% of
-1-

•
•
•
7.
8.
9.
10.
the time). (The category of probation terminated includes those responses which indicated probation terminated or revoked, meaning either discharge from supervision and/or sentencing on a new/different charge with new sanctions.)
The system response of "Sentenced to a Probation Restitution Center" is not reported by any circuit at the time of the case reviews.
Numerically, the greatest system response overall (not by group) is "No Action." "No Action" as a system response decreases as the seriousness of the violation increases.
Only 4. 5% of the time, when the dispos i tionwas known and a violation report with warrant is issued, is an offender sentenced to state prison for violation Group III (monetary matters).
In 74% of the time, when a violation is committed, the system response is either "No Action" or "Documentation".
11. . Of known dispositions, state prison is utilized in 17% of the cases, county jail in 11% and Cornrnunity Control in 8%. Therefore, overall probation diversionary measures are utilized more than had been anticipated. Incarceration is the last resort.
12. More offenders commit technical violations rather
13.
than new felonies. More than half of the technical violations are for monetary reasons.
Blacks are sentenced to state prison than whites. Whites are sentenced to more often than blacks. However, studies support the hypothesis that when for prior offense then race is not a factor for incarceration.
more often county jail independent you control determining
14. Blacks and whites are treated equally for violations in violation Groups III, IV and V.
15. For a Group V violation, (the least serious type) the most serious system response was "probatiQn modified".
16. sentencing data indicates that the Criminal Justice System is favorably biased towards females when they violate Groups I, II and III .
-2-
•
•
•
17. seventy-four percent of offenders are 35 years old or. younger. younger offenders commit the violations.
with violation Overall, these
more serious
18. Of the 507 VOP with warrants, 352 or 69% were still awaiting disposition at the time of the case reviews. This reflects a backlog in the Criminal Justice System.
Officer Questionnaires Analysis
1. Responses to the questionnaire indicate that as the number of times an offender commits a violation
. increases the more often a violation of probation with warrant is issued.
2. Officers recommend sentencing to Probation Restitution Centers, Community Control and state Prison more often than the case review showed this was actually done.
3. . Responses officers
indicate that the submit fewer numbers
less of
experienced violation of
probation repo=ts recommending warrants be issued .
4. Responses indicate that officers would like to document violations more often than is actually
, being done. Larger case loads appear to be preventing time for documentation.
5. . ,Judicial policies and procedures are reported to be the major contributor to both consistency and inconsistency in the revocation process.
6. Region IV has the least 'experienced officers with . the average number of years experience statewide being 5 years.
7. Case reviews showed that the disposition of violations is not consistant with what the officers said they would recommend in the questionnaire .
-3-
'.
•
•
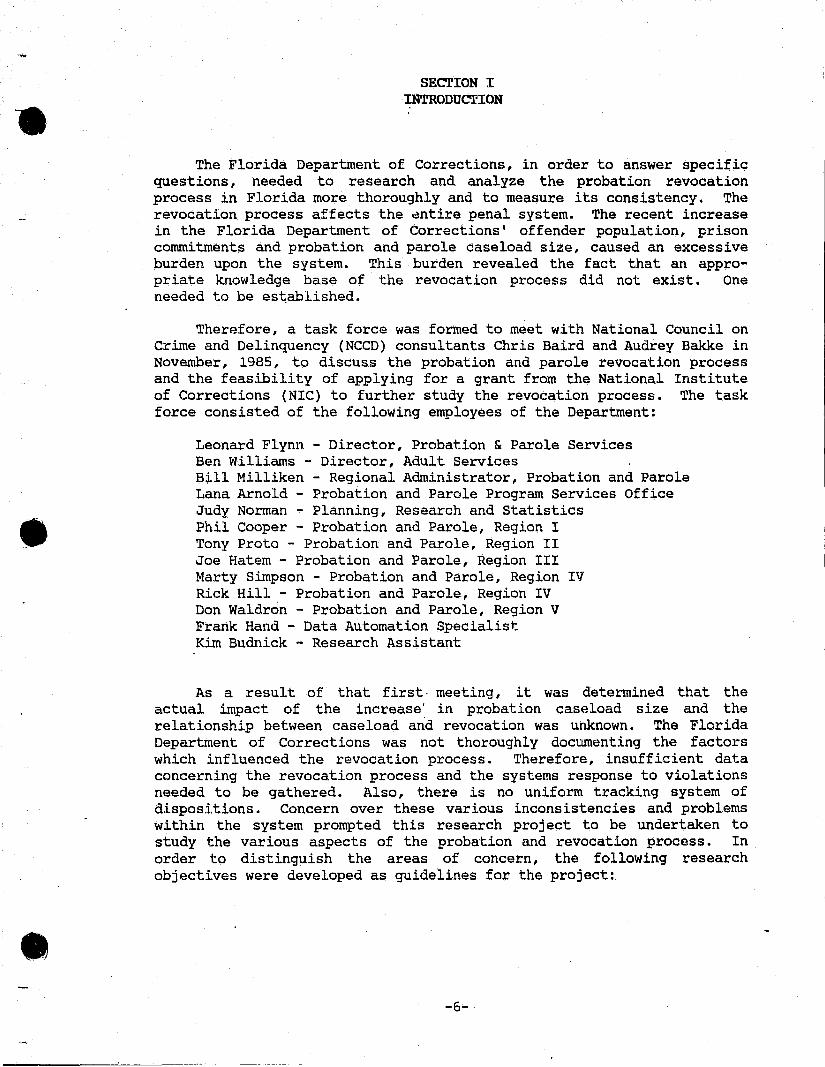
Revocation case load Analysis
1. As adult offender caseload size increases, the revocation rate and the violation report rate increases dramatically in each region statewide (see Appendix H). It is obvious as a result of the correlation between the increase in officer caseload sizes and revocation and violation report rates that the effectiveness of supervision is greatly diminished. When officer caseload size increased 31.5% in the sample time frames, the revocation rates and violation report rates increased ~ staggering 55.2% and 41.2% respectively.
RECOMMENDATIONS
Administrative:
1. Change the revocation reporting system to identify the actual disposition of violation reports to create a more thorough tracking system.
2 . Determine why there was not a system response of 18Sentencing to Probation Restitution Center" in the case reviews.
3. Determine why Circuits 13, 17, 18, and 19 issued twice as many violation reports. than all the other circuits.
4. Survey judiciary for attitudes using sample cases and a questionnaire to clarify officers' op~n~ons regarding judiciary contribution to revocation consistancy.
SUpervision:
1. Reduce adult probation and parole caseload levels to at lease the size they were prior to the implementation of commUnity control and sentencing guidelines in order to return to more effective supervision and therefore lower revocation and violation report rates.
2. Study the classification system of offenders to determine if variables such as age need to be given more consideration •
-4-

•
•
•
3. Document in separate section of the field sheet all violations .
4. Further study of the impact of community control on adult probation 'and parole supervision caseloads.
s. Test and implement procedures for regulating officer action to technical violations other than monetary violations for systematic response. (Appendix J) •
-s-
•
•
•
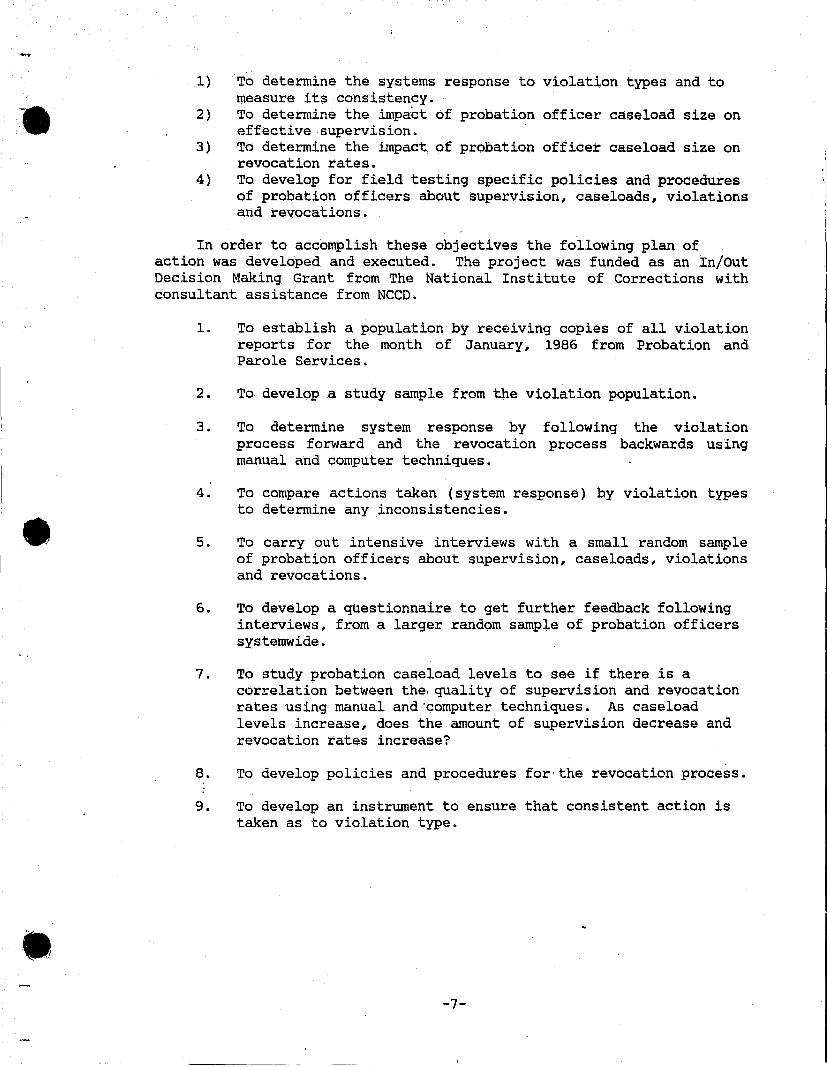
SECTION I INTRODUCTION
The Florida Department of Corrections, in order to answer specific questions, needed to research and analyze the probation revocation process in Florida more thoroughly and to measure its consistency. The revocation process affects the ~ntire penal system. The recent increase in the Florida Department of Corrections I offender population, prison commitments and probation and parole caseload size, caused an excessive burden upon the system. This burden revealed the fact that an appropriate knowledge base of the revocation process did not exist. One needed to be es~ablished.
Therefore, a task force was formed to meet with National Council on Crime and Delinquency (NCCD) consultants Chris Baird and Audrey Bakke in November, 1985, to discuss the probation and parole revocation process and the feasibility of applying for a grant from the National Institute of Corrections (NIC) to further study the revocation process. The task force consisted of the following employees of the Department:
Leonard Flynn - Director, Probation & Parole Services Ben Williams - Director, Adult Services B~ll Milliken - Regional Administrator, Probation and Parole Lana Arnold - Probation and Parole Program Services Office Judy Norman - Planning, Research and Statistics Phil Cooper - Probation and Parole, Region I Tony Proto - Probation and Parole, Region II Joe Hatem - Probation and Parole, Region III Marty Simpson - Probation and Parole, Region IV Rick Hill - Probation and Parole, Region IV Don Waldron - Probation and Parole, Region V Frank Hand - Data Automation Specialist Kim Budnick - Research Assistant
As a result of that first· meeting, it was determined that the actual impact of the increase' in probation caseload size and the relationship between case load and revocation was unknown. The Florida Department of Corrections was not thoroughly documenting the factors which influenced the revocation process. Therefore, insufficient data concerning the revocation process and the systems response to violations needed to be gathered. Also, there is no uniform tracking system of dispositions. Concern over these various inconsistencies and problems within the system prompted this research project to be undertaken to study the various aspects of the probation and revocation process. In order to distinguish the areas of concern, the following research objectives were developed as guidelines for the project:
-6-
•
•
•
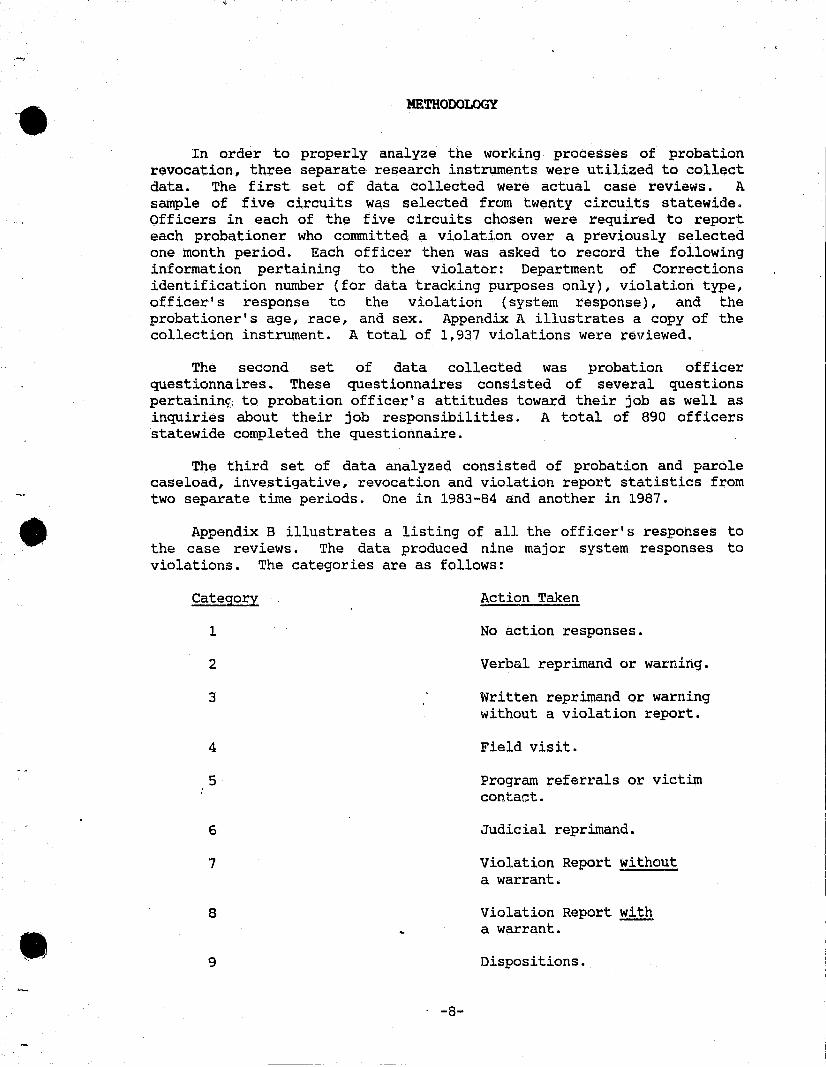
1)
2)
3)
4)
To determine the systems response to violation types and to measure its consistency . To determine the impact of probation officer caseload size on effective supervision. To determine the impact of probation officer caseload size on revocation rates. To develop for field testing specific policies and procedures of probation officers about supervision, caseloads, violations and revocations.
In order to accomplish these objectives the following plan of action was developed and executed. The project was funded as an In/Out Decision Making Grant from The National Institute of Corrections with consultant assistance from NCCD.
1. To establish a population by rece~v~ng copies of all violation reports for the month of January, 1986 from Probation and Parole Services.
2. To develop a study sample from the violation population.
3. To determine system response by following the violation process forward and the revocation process backwards using manual and computer techniques.
4. To compare actions taken (system response) by violation types to determine any inconsistencies .
5. To carry out intensive interviews with a small random sample of probation officers about supervision, caseloads, violations and revocations.
6. To develop a qUestionnaire to get further feedback following interviews, from a larger random sample of probation officers systemwide.
7. To study probation caseload levels to see if there is a correlation between the, quality of supervision and revocation rates using manual and 'computer techniques. As caseload levels increase, does the amount of supervision decrease and revocation rates increase?
8. To develop policies and procedures for-the revocation process.
9. To develop an instrument to ensure that consistent action is taken as to violation type .
-7-
_ .•
•
•
METHODOLOGY
In order to properly analyze the working processes of probation revocation., three separate research instruments were utilized to collect data. The first set of data collected were actual case reviews. A sample of five circuits was selected from twenty circuits statewide. officers in each of the five circuits chosen were required to report each probationer who committed a violati.on over a previously selected one month period. Each officer then was asked to record the following information pertaining to the violator: Department of Corrections identification number (for data tracking purposes only), violation type, officer's response to the violation (system response), and the probationer's age, race, and sex. Appendix A illustrates a copy of the collection instrument. A total of 1,937 violations were reviewed.
The second set of data collected was probation officer questionnaires. These questionnaires consisted of several questions pertaining; to probation officer's attitudes toward their job as well as inqu~r~es about their job responsibilities. A total of 890 officers statewide completed the questionnaire.
The third set of data analyzed consisted of probation and parole caseload, investigative, revocation and violation report statistics from two separate time periods. One in 1983-84 and another in 1987 •
Appendix B illustrates a listing of all the officer'S responses to the case reviews. The data produced nine major system responses to violations. The categories are as follows:
Cate~
1
2
3
4
5
6
7
8
9
. -8-
Action Taken
No action responses.
Verbal reprimand or warning.
Written reprimand or warning without a violation report.
Field visit.
Program referrals or victim contact.
Judicial reprimand.
Violation Report ~ithout a warrant.
Violation Report with a warrant .
Dispositions.
•
•
-.
However, nine codes for one variable, system response, became statistically cumbersome. The~efore, the system response (response by a probation officer to a type 6f violation) codes were regrouped into three categories: no action, documentation, and violation report with warrant. Appendix C illustrates how the original nine categories were regrouped into three categories. The alphabetical values for category nine were changed to numerical values for computation reasons.
The case review instrument, as earlier described, also indicated the type of violation committed by the probationer. Originally, seventeen different types of conditions violated existed (See Appendix D). However, for statistical reasons, the violation codes were recoded into five groups. Group 1 was considered the most serious offens~ category, and each group: decreased in seriousness until reaching Group 5, the least serious category. Group 1 referred to new offenses or the possession of a firearm, Group 2 referred to employment, movement and absconding, Group 3 referred to monetary matters, Group 4 referred to special programs and victim contacts and Group 5 referred to all other minor technical violations. Appendix E illustrates how the original codes for violations that were recoded. The variables; sex, age, and race, did not have to be recoded for the case review instrument analysis.
The results of the 14 question probation officer questionnaire required only minor recoding. The answers to questions l.through 7, 12, 13 and 14 did not have to be recoded. Questions 10 and 11 had to be disregarded due to confusion over the directions for completing the questilJns . Only the answers to questions 8 and 9 required recoding similar to the recoding for the case review instrument. Appendix F offers an illustration of the probation officer questionnaire.
The answers to questions 8 and 9 were recoded in the sarne fashion as the case review instrument. The nine system responses (see page 2 and 3 of Appendix F) were recoded into three categories: no action, documentation, and violation report with a warrant. The seventeen conditions violated (see pages 2 and 3 of Appendix F) were recoded into the sarne five groups as the case reviews. Group I the most serious and Group V was the least serious. This was done in order to establish continuity between the two data ~ollection instruments.
The following analysis consists of four parts. Part I consists of data analysis from the case review research instrument. Part II consists of data analysis for the probation officer questionnaire. Part III consists of the analysis of probation and parole caseloads and compares the case review results with the probation officer questionnaire. Part IV includes the recommendations and conclusions.
-9-

•
SECTION II
•
• -10-

•
.'
•
•
SECTION II DATA ANALysts
PART I CASE REVIEW
Probation Officer case reviews were conducted for five circuits of the twenty statewide circuits. The following circuits were chosen from the five state regions. Circuit 02, Tallahassee, Florida, represents Region I. Circuit 08, Gainesville, Florida, represents Region II. Circuit 09, 9rlando, Florida, represents Region III. Circuit 15, West Palm Beach, Florida represents Region IV. Finally, Circuit 10, Bartow, Florida, represents Region V. See Appendix G for a breakdown of all Florida circuits and regions.
ALL CIRCUITS:
The total percentages from all five circuits were calculated in order to establish an average percentage rate, for comparison purposes, between circuits. The following chart demonstra~es the average percentage of occurrences for each violation.group:
Violation Group
Group I (most serious)
Group II
Group III
Group IV
Gr~up V (least serious)
ALL CIRCUITS
New Arrest or Firearm Violation
Movement (change of address/absconding)
Monetary Violations
Special Programs (Alcohol/Drug)
Minor Technicalities
Percentage of Occurrences
13% (248)
13% (244)
45% (867)
2% ( 42)
-ill. (536)
100% (1937)
The most conunon violation occurrance is Group III. Appendix E indicates that Greu:;? I!! 'concerns violations of monetary matters. The least common violation occurrence is Group IV which is concerned with alcohol ,and drug use, self-improvement, public service hours and victim contact (see Appendix E). Meaningful analysis of Group IV is difficult because this group only represents two percent of those violations committed.
-11-
,. •-
•
"
•
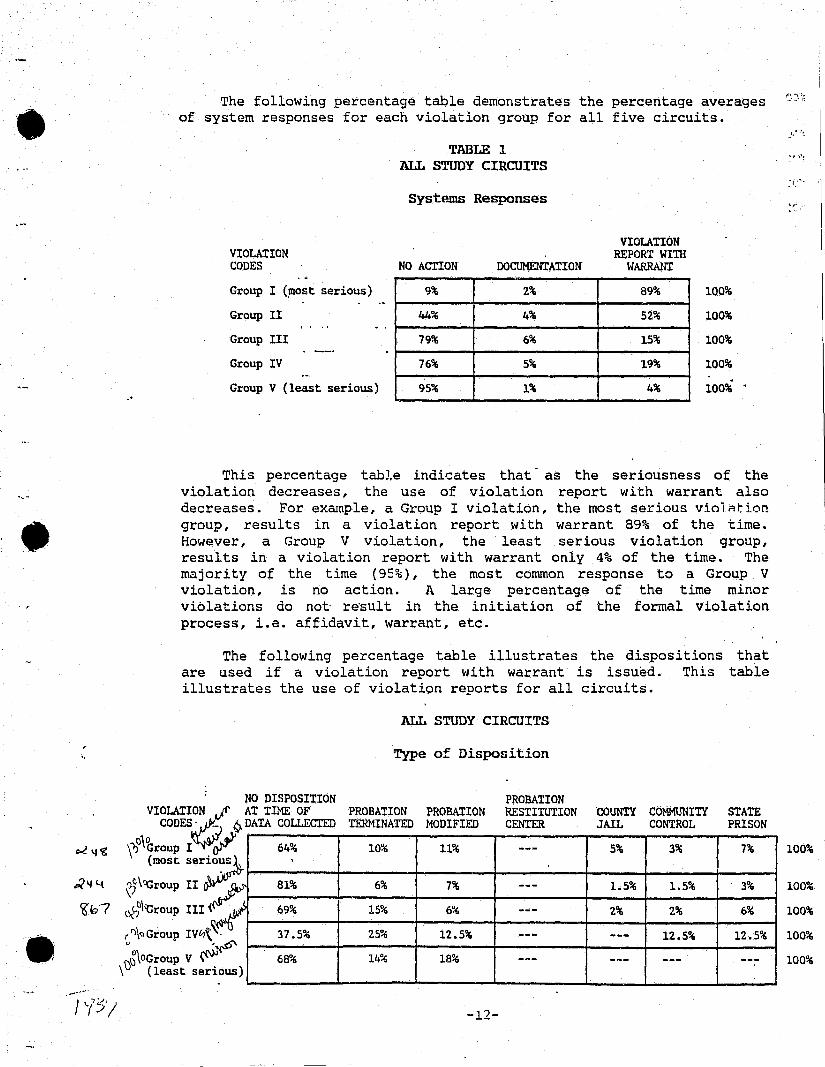
The following percentage table demonstrates the percentage averages of system responses for each violation group for all five circuits.
VIOLATION CODES
Group I (~ost serious)
Group II
Group III
Group IV
Group V (least serious)
TABLE 1 ALL STUDY CIRCUITS
Systp~ Responses
NO ACTION DOCUMENTATION
9% 2%
44% 4%
79% 6%
76% 5%
95% 1%
VIOLATION REPORT WIlli
HARRANT
89%
52%
15%
19%
4%
100%
100%
100%
100%
100% •
This percentage table indicates that' as the seriousness of the violation decreases, the use of violation report with warrant also decreases. For exrunple, a Group I violation, the most serious violAtion group, results in a violation report with warrant 89% of the time . However, a Group V violation, the least serious violation group, results in a violation report with warrant only 4% of the time. The majority of the time (95%), the most comman response to a Group V violation, is no action. A large percentage of the time minor violations do not re'sult in the initiation of the formal violation process, i.e. affidavit, warrant, etc.
The following percentage table illustrates the dispositions that are used if a violation report with warrant is issued. This table illustrates the use of violation reports for all circuits.
ALL STUDY CIRCUITS
Type of Disposition
NO DISPOSITION PROBATION VIOLAII~N AI TIME OF PROBATION PROBATION
CODES' _ Q. DATA COu.ECTED TERMINATED MODIFIED
0\0 \1) Group I 64% 10% 11%
RESTITUTION COUNTY COMMUNITY CENTER JAIL CONTROL
--- 5% 3%
STATE PRISON
7% (most serlo ,
~\f 4 \J\~roup II ~ '6' b ? 08'1'Croup III
.~ ~ ,\~I
81%
69%
6% 7%
15% 6%
--- 1.5% 1.5% 3%
--- 2% 2% 6%
". ....... . . J L/5/
rf)\~ Group IV0\
~~\OGroup V ~ \ (least ser
.
ious) .
37.5% 25%
68% 14%
12.5% --- --- 12.5% 12.5%
18% -~- --- --- ---
-12-
~.I;" .• '~
100%
100%
100%
100%
100%
•
"
•
•
There are many facts that should be noted concerning this table. First, when a violation:report with warrant is issued. a large percentage (over 60% in all groups except four) did not know what the court disposition was at the time of data collection. This may indicate that the criminal justice system is currently backlogged. Second, at no time in any of the circuits is a violator placed in a probation restitution center. This is a very important fact for later comparison with the probation officer questionnaire. Third, Community Control is not utilized to the degree expected. If the violations did correspond with the seriousness of the groups, Group I would send the most violators to prison, followed by Group II, etc. Data does not support that correlation. Fourth, there is no pattern in Groups II, III & IV in sentencing t~ state prison. The small percentage of dispositions known may have skewed this data.
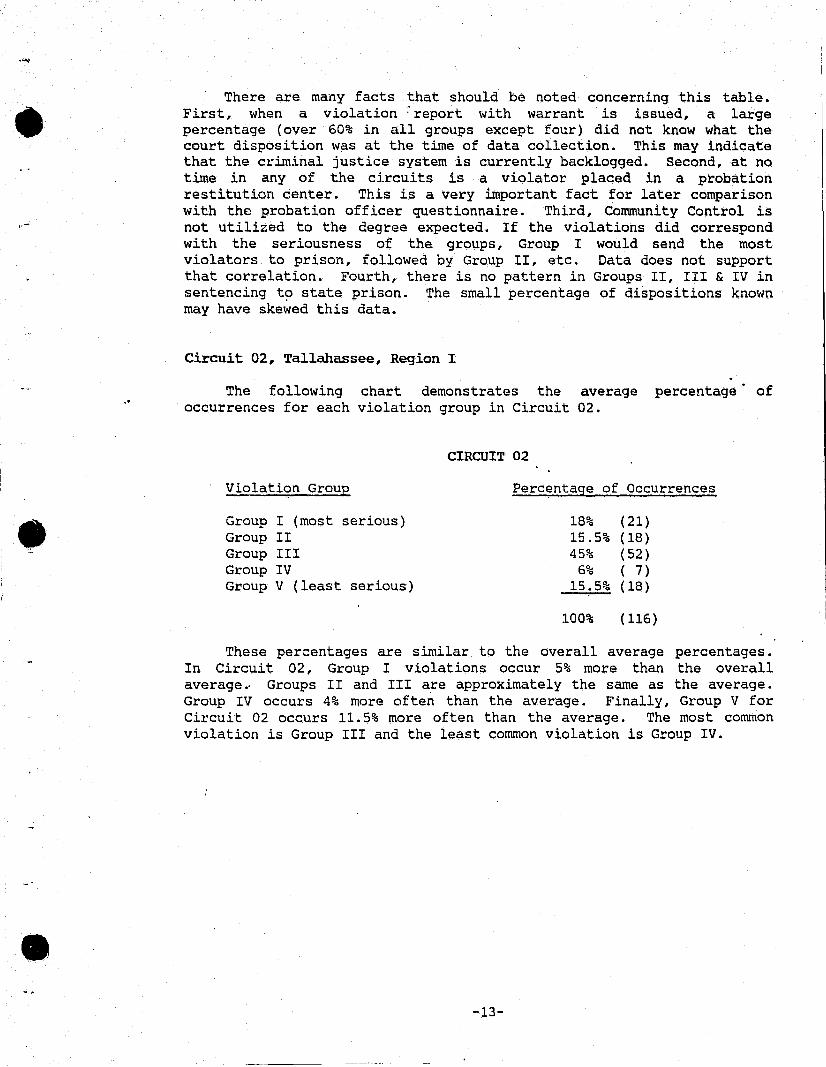
Circuit 02, Tallahassee, Region I
The following chart demonstrates the average percentage of occurrences for each violation group in Circuit 02.
Violation Group
Group I (most serious) Group II Group III Group IV Group V (least serious)
CIRCUIT 02
Percentage of Occurrences
18% (21) 15.5% (18) 45% (52)
6% (7) 15.5% (18)
100% (116)
These percentages are similar to the overall average percentages. In Circuit 02, Group I violations occur 5% more than the overall average., Groups II and III are approximately the sarne as the average. Group IV occurs 4% more often than the average. Finally, Group V for Circuit 02 occurs 11.5% more often than the average. The most common violation is Group III and the least common violation is Group IV .
-13-
•
•
•
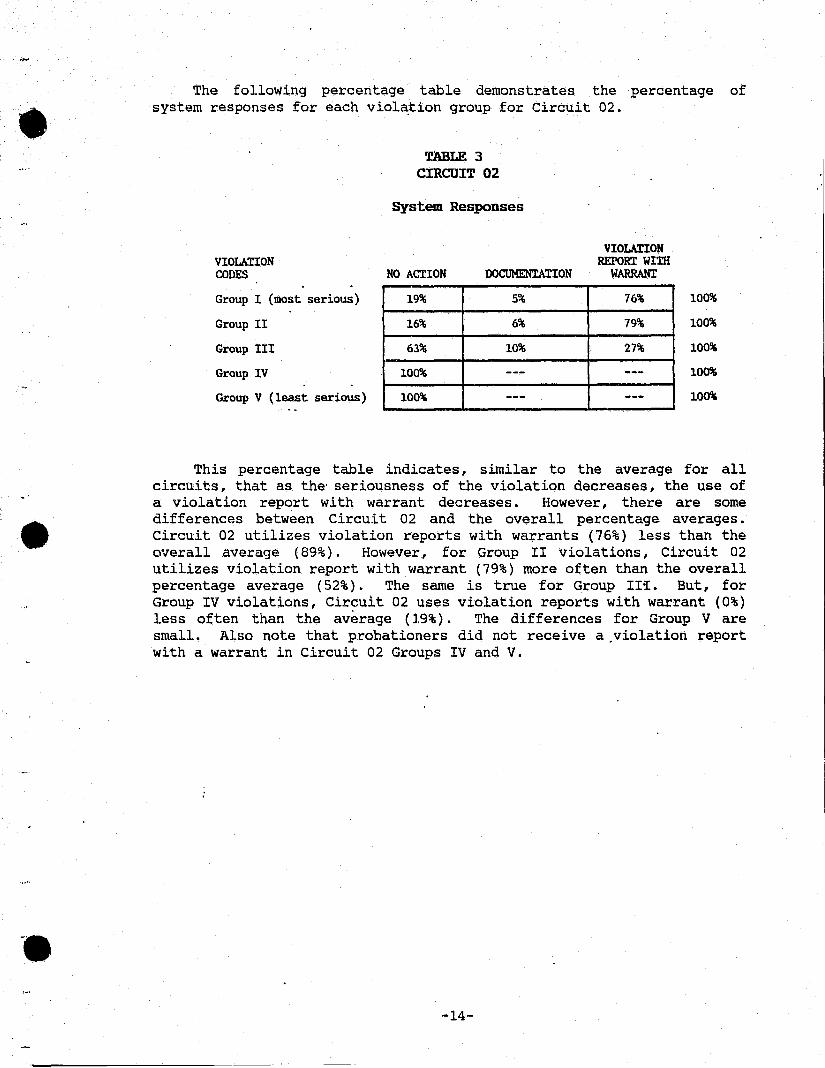
The following percentage table demonstrates the percentage of system responses for each viol~tion group for Circuit 02 .
VIOLAtION CODES
Group I (most serious)
Group II
Group III
Group IV
Group V (least serious)
TABLE 3 CIRCUIT 02
System Responses
NO ACTION DOCUMENTATION
19% 5%
16% 6%
63% 10%
100% ---100% ---
VIOLAnON REPORT WITH
WARRANT
76%
79%
27%
------
100%
100%
100%
100%
100%
This percentage table indicates, similar to the average for all circuits, that as the' seriousness of the violation decreases, the use of a violation report with warrant decreases. However, there are some differences between Circuit 02 and the overall percentage averages . Circuit 02 utilizes violation reports with warrants (76%) less than the overall average (89%). However, for Group II violations, Circuit 02 utilizes violation report with warrant (79%) more often than the overall percentage average ( 52%) . The same is true for Group Ill:. But, for Group IV violations, Circuit 02 uses violation reports with warrant (0%) less often than the average (19%). The differences for Group V are small. Also note that probationers did not receive a ,violation report with a warrant in Circuit 02 Groups IV and V .
-14-

•
•
•
The following percentage~able illustrates the dispositions that were utilized if a violation report with warrant was issued in Circuit II.
NO DISPOSITION VIOLATION AT. TIME OF
CODES DATA COLLECTED
Group I 75% (most serious)
Group II 79%
Group III 50%
Group IV
Group V (least serious)
TABLE 4 CIRCUIT 02
Type of Disposition
PROSATION PROBATION PROBATION RESTITUTION TERMINATED MODIFIED CENTER
12.5% 12.5%
7% 7%
43%
COUNTY COMMUNITY STATE JAIL CONTROL PRISON
7%
7%
As. is true with overall percentage averages, a very high percentage (over 50% in all groups, over 75% excluding Group III) of the dispositions are unknown. Groups IV and V are blank because Circuit 02 did not utilize violation reports with warrants' for these two groups. Note that Circuit 02 for all violation groups did not sentence to county jail nor .probation restitution centers and rarely utilized Community Control or state prison.
Circuit 08, Gainesville, Region II
The following chart demonstrates the average percentage of occurrences for each violation group in Circuit 08.
CIRCUIT 08
Violation Group Percentage of Occurrences
Group I (most serious) 13% (22) Group II 12% (20) Group III 55% (94) Group IV 5% ( 8) Group V (least serious) 15% (25)
100% (169)
These percentages are similar to the overall average percentages. The largest percentage group is Group III and the smallest is Group IV. For Circuit 08, Group III occurs 10% more often than the overall average, and 3% more often for Group IV. However, Group V in Circuit 08 occured 12% less often than the average.
-15-
100%
100%
100%

•
I'.
The following percentage table demonstrates the percentage of system responses for each vio.lation group for Circuit 08 .
VIOLATION CODES
Group I (most serious)
Group II
Group III
Group IV
Group V (least serious)
. TABLE 5 CIRCUIT 08
System Responses
NO ACTION DOCUMENTATION
--- ---30% 35%
64% 24%
74% 13%
80% 20%
VIOLA:l:ION REPORT WITH
WARRANT
100%
35%
12%
13%
---
100%
100%
100%
100%
100%
As was true with Circuit 02, when the seriousness of the violation decreases ~ the use of a violation report with warrant decreases. Note that in Circuit 08, when a Group I violation was committed, a violation report with warrant is always utilized but for a Group V violation, a violation report with warrant is never utilized. Circuit 08 uses documentation or violation report with warrant more often than the statewide average.
The following percentage table illustrates the dispositions that are used whenever a violation report with a warrant is issued. This table illustrates the use of violation reports for Circuit 08 only.
VIOLATION CODES
Group I (most serious)
Group II
Group III
Group IV
Group V least serious)
NO DISPOSITION
TABLE 6 CIRCUIT 08
Type of Disposition
PROBATION AT TIME OF PROBATION PROBA!ION RESTITUTION COUNTY COMMUNITY DATA COLLECTED TERMINATED MODIFIED CENTER JAIL CONTROL
9% 55% 23% --- 13% ---57%· 14% --- --- --- ---73% 9% 9% --- --- ------ --- 100% --- --- ------ --- - --- --- ... --- --- ..
-16-
STATE PRISON
---29%
9%
------
'''I''
100%
100%
100%
100%
100%

••
•
It 'is noteworthy that 29% of the violators for Group II are sentenced to state prison. However, note that this is based upon two cases out of seven. Statistically, no empirical conclusions should be drawn from such small numbers. However, what is noteworthy about this percentage table is that few (9%) cases are still without a disposition in the most serious category, Group I. This may indicate that in Circuit 08, the judicial system is more effectively clearing serious violators at a greater rate. Also note according to this study that Circuit 08 never utilizes Community Control or probation restitution centers, and very rarely utilizes county jail facilities.
Circuit 09, Orlando, Region III
The following chart demonstrates the average percentage of occurrences for each violation group in Circuit 09.
CIRCUIT 09
Violation Group Percentage of Occurrences
Group I (most serious) 24% (30) Group II 18% (23) Group III 39% (50) Group IV 7% ( 9) Group V (least serious) ~ (15)
100% (127)
The percentages for Circuit 09 differ from those percentages for the statewide average. Group I violations occur only 13% of the time statewide, but increase to 24% in Circuit 09. Group II violations occur only 13% of the time statewide, but increase to 18% in Circuit 09. Group III violations decrease by 6% for Circuit 09 and Group V violations decrease by 15%. Group IV violations for Circuit 09 increase by 5%. Overall, the percentages indicate that the more serious offenses occur more often in Circuit 09 than in the other state circuits in the sample.
-17-

•
•
•
The following percentage table demonstrates the percentage of system responses for each violation group in Circuit 09.
VIOLATION CODES
Group I (most serious)
Group II
Group III
Group IV
Group V (least serious)
TABLE 7 CIRCUIT 09
System Responses
NO ACTION DOCUMENTATION
--- ---22% ---70% ---67% ---73% ---
VIOLATION REPORT Wl'rH
WARRANT
100%
78%
30%
33%
27%
100%
100%
100%
100%
100%
The most outstanding pattern in this table is that Circuit 09 never uses documentation for any of the violation groups. Also, when the most serious violation occurs, 100% of the time a violation report with warrant is issued. Compared to the statewide average percentages, Circ\.tit 09 completes a violation report with warrant more often for every violation group and uses no action less often. This indicates that Circuit 09 is more stringent on probationers for all conditions violated.
The following percentage table illustrates the dispositions that are used if a violation report with warrant is issued. This table illustrates the use of violation reports for Circuit 09.
VIOLATION CODES
Group I (most serious)
Group II
Group III
Group IV
Group V (least serious)
NO DISPOSITION
TABLE 8 CIRCUIT 09
AX TIME OF PROBATION PROBATION PROBATION RESTInrrION CENTER DATA COLLECTED TERMINATED MODIFlF.D
70% 7% 3% ---56% 11% 28% ---72% --- 7% ---67% 33% --- ---. , , 75% 25% --- ---
-18-
COUNTY COMMUNITY JAIL CONTROL
10% 3%
--- ---7% 7%
--- ------ ---
STATE PRISON
7%
5%
7%·
------
100%
100%
-100%
100%
100%
,\
I

~.
•
••
This chart demonstrates that over 50% of the time when a violation report with warrant is filed, :the disposition is unknown. As is true with all of the circuits, probationers are not placed in probation restitution centers. County jail, Conununity Control and state prison are utilized for the more serious offenses but not for Groups IV and V. However, the lack of knowledge of dispositions makes data analysis difficult.
Circuit 15, West Palm Beach, Region IV
The following chart demonstrates the average percentage of occurrences for each violation group in Circuit 15.
Violation Group
Group I (most serious) Group II Group III Group IV Group V (least serious)
CIRCUIT 15
Percentage of Occurrences
10% (137) 11% (153) 46% (633)
1% ( 15) 32% (444)
100% (1383)
The largest percentage group for Circuit 15 is Group III. The smallest percentage group is Group IV. The only group which differentiates from the statewide average to any significant amount is Group V. Group V in Circuit 15 has 5% more violations in Group V than the statewide average.
The following percentage table demonstrates the percentage of system responses for each violation group for Circuit 15.
VIOLATION CODES
Group I (most serious)
Group II
Group III
Group IV
Group V (least serious)
,TABLE 9 CIRCUIT 15
System Response
NO ACTION DOCUMENTAtION
10% 4%
58% .5%
85% 4%
69% 9% . 97% .5%
-19-
VIOLATION REPORT WITH
WARRANT
86%
41.5%
11%
25%
2.5%
100%
100%
100%
100%
100%

••
•
•
Circuit 15 documents more for Groups I and IV than the state average. At first glance, it appears that Circuit 15 issues violation reports with warrant at a high rate for Group IV (25%). However, Group IV on~y accounts for 1% of all violations in Circuit 15, and specifically, only four cases receive a violation report with warrant for Group IV, i.e. one out of four cases are sentenced to state prison.
This table also indicates that as the seriousness of the violation decreases, a system response of no action increases.
Circuit 10, Bartow, Region V
The fol19win9 chart demonstrates the average percentage of occurrences for each violation group in Circuit 10.
CIRCUIT 10
Violation Group Percentage of Occurrences
Group I (most serious) 27% (38) Group II 21% (30) Group III 27% (38) Group IV 1% ( 2) Group V (least serious) 24% (34)
100% (142)
These percentages differ from the overall average percentages. Group I and Group III share the top violation group.position. Group IV violations occur the lep,st often. Group I violations occur 14% more often in Circuit 10. Group II violations occur 8% more often in Circuit 10. Group III violations occured 18% less often in Circuit 10. Group IV violations account for few of the violations in Circuit 10. Group V violations occur 3% less often in Circuit 10.
The following percentage table illustrates the dispositions that . 'are used if a violation report with warrant is issued. This table
illustrates the use of violation reports for Circuit 15 •
-20-
•
•
NO DISPOSITION
TABLE 10 CIRCUIT 15
Type of Disposition
PROBATION VIOLATION
CODES AT TIME OF PROBATION PROBATION RESTITUTION COUNTY COMMUNI'.I:Y STATE
PRISON
Group I (lIIOst serious)
Group II
Group III
Group IV
Group V (least serious)
DATA COLLECTED TERMINATED MODIFIED
79% 1% 7%
90% 4% 2%
86% 7% 1%
25% 25% ---82% 9% 9%
CENTER JAIL CONTROL
--- --- 4% 9%
--- --- 2% 2%
--- --- 1% 5%
--- --- 25% 25%
--- , --- --- ---
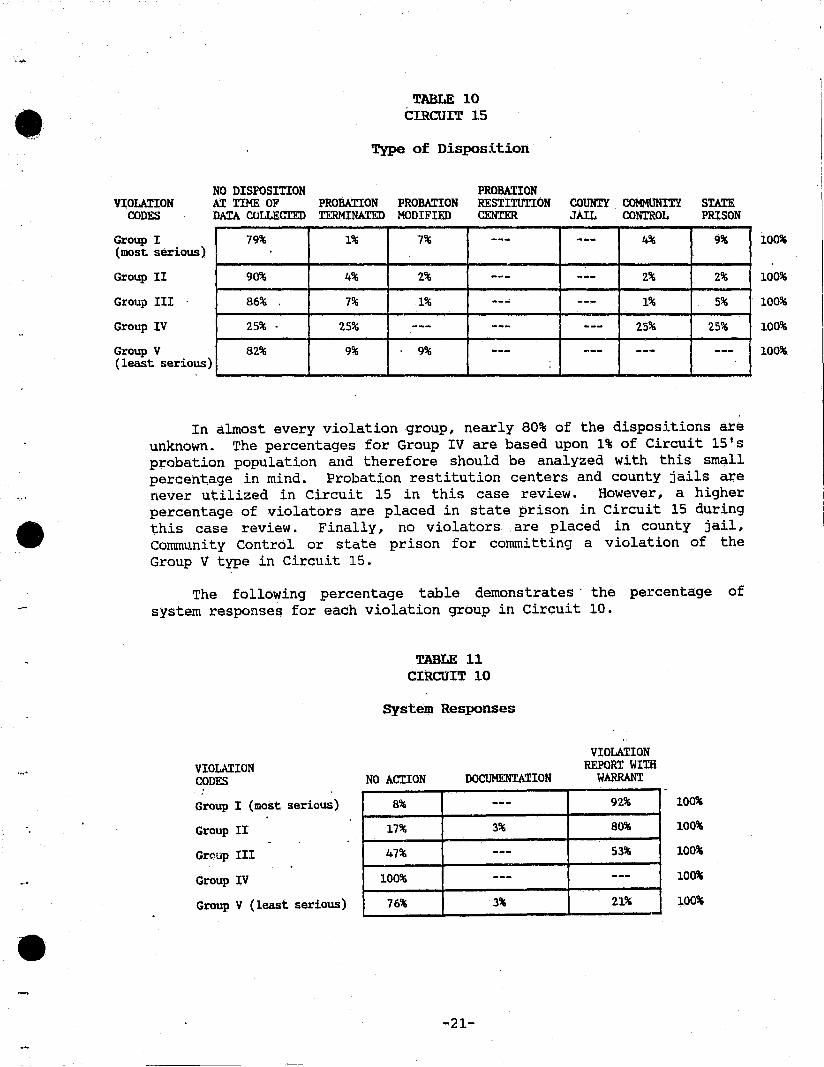
In almost every violation group, nearly 80% of the dispositions are unknown. The percentages for Group IV are based upon 1% of Circuit 15's probation population and therefore should be analyzed with this small percentage in mind. Probation restitution centers and county jails are never utilized in Circuit 15 in this case review. However, a higher percentage of violators are placed in state prison in Circuit 15 during this case review. Finally, no violators are placed in county jail, Community Control or state prison for committing a violation of the Group V type in Circuit 15.
The following percentage table demonstrates' the percentage of system responses for each violation group in Circuit 10.
VIOLATION CODES
Group I (most serious)
Group II
Grc1Ap III
Group IV
Group V (least serious)
TABLE 11 CIRCUIT 10
System Responses
NO ACTION DOCUMENTATION
8% ---17% 3%
47% ---100% ---
76% 3%
-21-
VIOLATION REPORT WITH
WARRANT
92%
80%
53%
---21%
100%
100%
100%
100%
100%
I
100%
100%
100%
100%
100%

•
•
•
Circuit 10 uses violation reports with warrants more often than the statewide average in all case~ except violation Group IV. In Group I, violation report with warrant is utilized 3% m~re often. In Group II, violation report with warrant is utilized 28% more often. In Group III, violation report with warrant is utilized 38% more often. Finally, in Group V, violation report with warrant is utilized 17% more often than the statewide average. Note that Circuit 10 rarely utilizes documentation. OlJerall, it appears that Circuit 10 deals with their probation violators in a more harsh fashion than is customary statewide.
The following percentage table illustrates the dispositions that were used if a violation report with warrant is issued. This table illustrates the use of violation reports with warrant within Circuit 10.
VIOLATION CODES
Group I (most. serious)
Group II
Group III
Group IV
Group V (least serious)
NO DISPOSITION
TABLE 12 CIRCUIT 10
Type of Disposition
PROBATION AT TIME OF PROBATION PROBATION RESTITUTION COUNTY COM:1UNITY DATA COLLECTED TERMINATED MODIFIED CENTER JAIL CONTROL
40% -11% 23% --- 17% ---84% --- 8% --- 8% ---20%· 40% 20% --- 5% ------ --- --- --- --- ---43% .. 14~ 43% --- ._-- ---
I
STATE PRISON
9%
---5%
------
It appears that Circuit 10 has fewer outstanding dispositions than any other circuit in the sarnple~ Circuit 10 never utilizes Conununity Control or probation restitution centers. Circuit 10 utilizes county jail facilities more often than the statewide average. Overall, Circuit 10 utilizes violation reports with warrants more often and clears their dispositions faster than other circuits in the sample.
RACE, AGE, AND GENDER
The demographic variables of race, age, and sex were recorded in order to establish any statewide trends. The following tables illustrate comparisons between black and white violators, various age types, and males and females.
-22-
100%
100%
100%
100%
100%

•
•
•
RACE
Violation Code i
Group I (most serious) Group II Group III Group IV Group V (least serious)
.ALL CIRCUITS
Blacks
13% (108) 13% (107) 48% (395)
3% ( 22) 23% (188)
100% (820)
Whites
13% (139) 12% (136) 42% (471)
2% ( 20) 31% (346)
100% (1112 )
This chart' demonstrates that the same percentage of blacks and whites commit the most serious violations statewide. Group II violations occur 1% more often among blacks. Group III violations occur 6% more orten among blacks and Group IV violations occur 1% more often among blacks. Group V violations occur 8% more orten among whites.
VIOLATION CODES
Group I (most serious)
Group II
Group III
Group IV
Group V (least serious)
TABLE 13 ALL CIRCUITS
System Response
VIOLATION REPORT NO ACTION DOCUMEN'IATION WITH WARRANT
Blacks Whites Blacks Whites Blacks Whites
,6% 11% --- 4% 94% 85%
46% 43% 6% 3% 48% 54%
75% 82% 8% 4% 17% 14%
75% 75% 5% 5% 20% 20%
93% .95% 3% .5% 4% 4.5%
100%
100%
100%
100%
100%
Table 13 illustrates that any differences between blacks and whites occur :in the top three groups only; thus, indicating that blacks and whites' are treated equally for the lesser violations. For Group I violations, 5% more whites receive no action, 4% more whites receive documentation and 9% more blacks receive violation reports with warrants. For Group II violations, 3% more blacks receive no action, 3% more blacks receive documentation and 6% more whites receive violation reports with warrants. Finally, for Group III violations, 7% more whites receive no action, 4% more blacks receive documentation and 3% more blacks receive a violation report with warrant.
-23-

'.
.'
•
VIOLATION CODES
NO DISPOSITION
TABLE 14 ALL, CIRCUITS
Type of Disposition
PROBATION AI TIME OF PROBATION PROBATION RESTITUTION COUNTY COMMUNITY DATA COLLECTED TERMINATED MODIFIED CENTER JAIL CONTROL
STATE PRISON
B W B W B W B W B W B W B W
Group I 62% 67% 10% 9% 11% '11% --- .. _-- 3% 8% 3% 2.5% 11% 2.5% (JIIOst serious)
76% 85% 2% 7% 10% 6% ~-- --- 4% 1% 2% -- 6% 1%
69% 70% 13% 16% 5% 6% --- --- 5% --- 3% 2% 5% 6%
Group II
Group III
Group IV
Group V
--- 75% 25% 25% 25% --- --- --- --- --- 25% --- 25% ---J ----I 43% 80% 14% 13% 43% 7% --- --- --- --- ---- --- ---
(least serious)
Table' 14 illustrates the various types of dispositions for blacks and whites when a violation report with warrant is filed. Over half of the dispositions, and in some cases as high as 85%, were unknown at the time that the data was collected. For all group violations, the dispositions are known more for blacks than for whites. Probation is terminated at a similar percentage for blacks and whites except for Group II where 5% more whites are terminated. Note that the high percentages for Group IV is based upon only eight cases: four whites and four blacks, who received violation reports in this category. Therefore, little statistical regard should be paid to this violation group. For Group V, neither blacks nor whites receive any disposition harsher than probation modified. This is expected since Group V is the least serious violation group. On the average, blacks appear to have had their probation modified more often, blacks are assigned to Community Control more often and blacks ar.e sentenced to state prison more often than whites. Whites a~e sentenced to county jail more often for violation of Group I .
-24-
100%
100%
100%
100%
100%

•
•
•
SITE STUDIES AGE
Violation Group Group I Group II Group III Group IV Group V
25 and under 18% (120) 13% ( 83) 42% (276)
2% ( 16) 25% (169)
100% (664)
ALL CIRCUITS
Age Groups
26-35 36-45 46 and above 10% ( 79) 9% ( 30) 10% ( 18) 15% (110) 11% ( 35) 9% ( 16) 45% (348) 51% (:!. 71) 42% ( 72)
2% ( 16) 2% ( 7) 2% ( 3) 28% (212) 27% ( 92) 37% ( 63)
100% (765) 100% (335) 100% ( 172)
This chart illustrates the' percentage of each age group which committed the various types of violations. The age group which contains the largest amount of violations is the 26-35 age group (765), followed by the 25 and under (664), 36-45 (335) and finally the 46 and abov~ group (172). Based upon percentages, the age group of 25 and under commit more Group I violations than the other age groups. The 26-35 group commit the most Group II violations. The 36-45 commit the most Group III violations. All of the groups commit the same percentage of Group IV violations. Finally, the 46 and above group commit the most Group V violations .
VIOLAtION CODES NO ACIION
Group I (most serious)
Group II
Group III
Group IV
Group V (least serious)
25 and Under
6%
34%
-71%
69% .
93%
26-35
10%
51%
82%
75%
·94%
46 and 36-45 Above
13% 11%
46% 50%
81% 89%
86% 100%
97% 98%
TABLE 15 ALL CIRCUITS
System Responses
DOCUMENTATION
25 and Under 26-35 36-45
3% --- . 3%
2% 5% 3%
8% 5% 5%
13% 13% ---1% 2% ---
-25-
46 and Above
6%
6%
7%
---2%
VIOLAtION REPORT WITH WARRANT
25 and Under 26-35 36-45
~ 91% 90% 84%
65% 45% 51%
21% 13% 14%
18% 12% 14%
6% 4% 3%
46 and Above
83%
44%
4%
------
10Q%
100%
100%
100%
100%
•
•
•
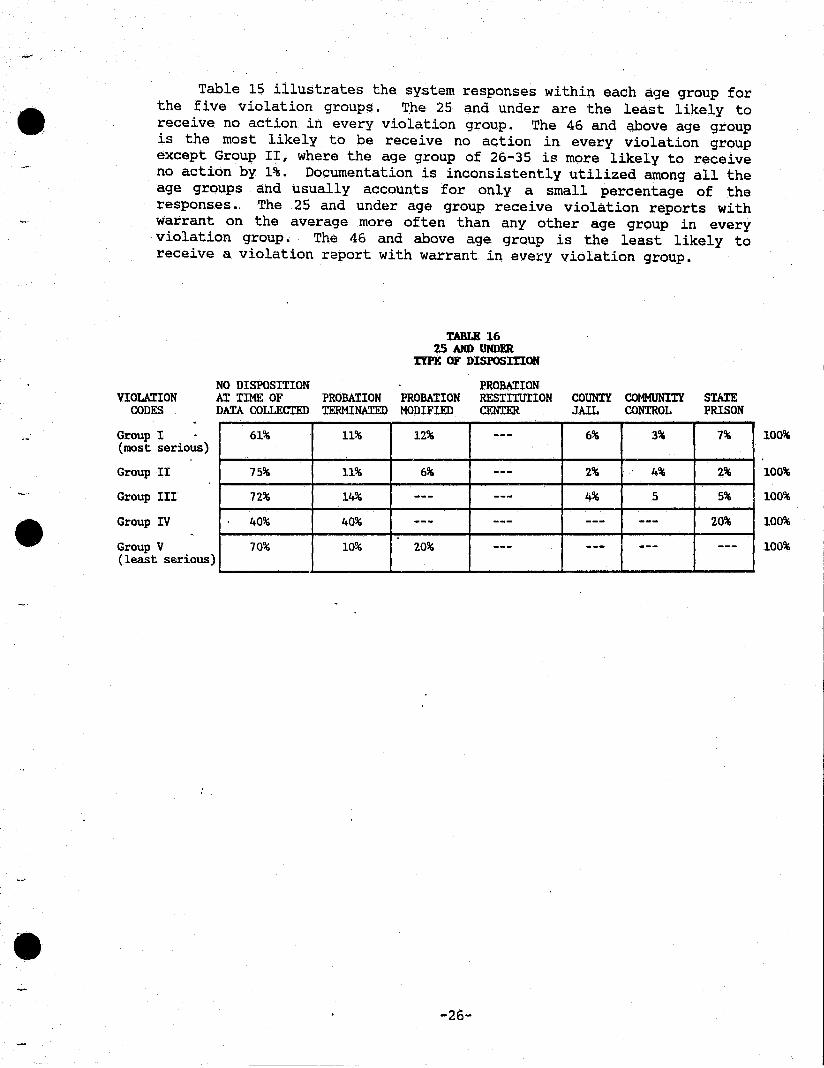
Table 15 illustrates the system responses within each age group for the five violation groups. The 25 and under are the least likely to receive no action in every violation group. The 46 and above age group is the most likely to be receive no action in every violation group except Group II, where the age group of 26-35 is more likely to receive no action by 1%. Documentation is inconsistently utilized among all the age groups and usually accounts for only a small percentage of the responses.. The 25 and under age group receive violation reports with warrant on the average more often than any other age group in every violation group. The 46 and above age group is the least likely to receive a violation report with warrant in every violation group.
VIOLAIION CODES
Group I . (most serious)
Group II
Group III
Group IV
Group V (least serious)
NO DISPOSITION
TABLE 16 2.5 AND UNDER
nPK OF DISPOSInOR
AT TIME OF PROBATION PROBATION PROBATION RESnTIrrION CENTER. DATA. COLLECTED TERMINATED MODIFIED
61% 11% 12% ---
75% 11% 6% ---72% 14% --- ---40% 40% --- ---70% 10% 20% ---
-26-
COUNTY COMMUNITY JAIL CONTROL
6% 3%
2% 4%
4% 5
--- ------ ---
STATE PRISON
7%
2%
5%
20%
---
100%
100%
100%
100%
100%
•
•
•
VIOLATION CODES
Group I (most serious)
Group II
Group III -
Group IV
Group V (least serious)
VIOLATION CODES
Group I (most serious)
Group II
Group III
Group IV
Group V (least serious)
VIOLATION CODES
Group I (most serious)
Group II
Group III
Group IV
Group V (least serious)
'tABLE 17 26-35
T!PK OF DISPOSI'lIOR
NO DISPOSITION PROBAXION AI TIME OF PROBAXION PROBAXION RESTITUTION COUNTY COMMUNITY DAIA COLLECTED TERMINATED MODIFIED CENTER JAIL CONTROL
66% 7% 8% --- 8% 4% '
81% 2% 11% --- 2% ---69%- 20% 2% --- 2% ------ --- 50% --- --- 50%
63% 12% 25% --- --- ---
NO'DISPOSITION PROBATION AI TIME OF PROBATION PROBATION RESTITUTION COUNl'Y COMMUNITY DAIA COLLECTED TERMINATED MODIFIED CENTER JAIL CONTROL
68% 12% 12% --- .-- ---90% --- 5% --- --- ---63% 8% 25% --- --- ---
100% --- --. --- --- ---75% 25% --- ---' --- ---
TABLE 19
NO DISPOSITION
46 AND ABOVE 'ftPK OF DISl'OSInOR
AI TIME OF PROBATION PROBAXION PROBATION RESTITUTION CElln:R DAIACOLLECTED TERMINATED MODIFIED
, 80% ··14% 6%
100%
67%' 33%
-27-
COUNTY COMMUNITY JAIL CONTROL
STATE PRISON
7%
4%
7%
---. ---
STATE PRISON
8%
5%
4%
------
STATE PRISON
100%
100%
100"06
100%
100%
100%
100%
100%
100%
100%
100%
100%
100%
100%
100%
-
•
•
•
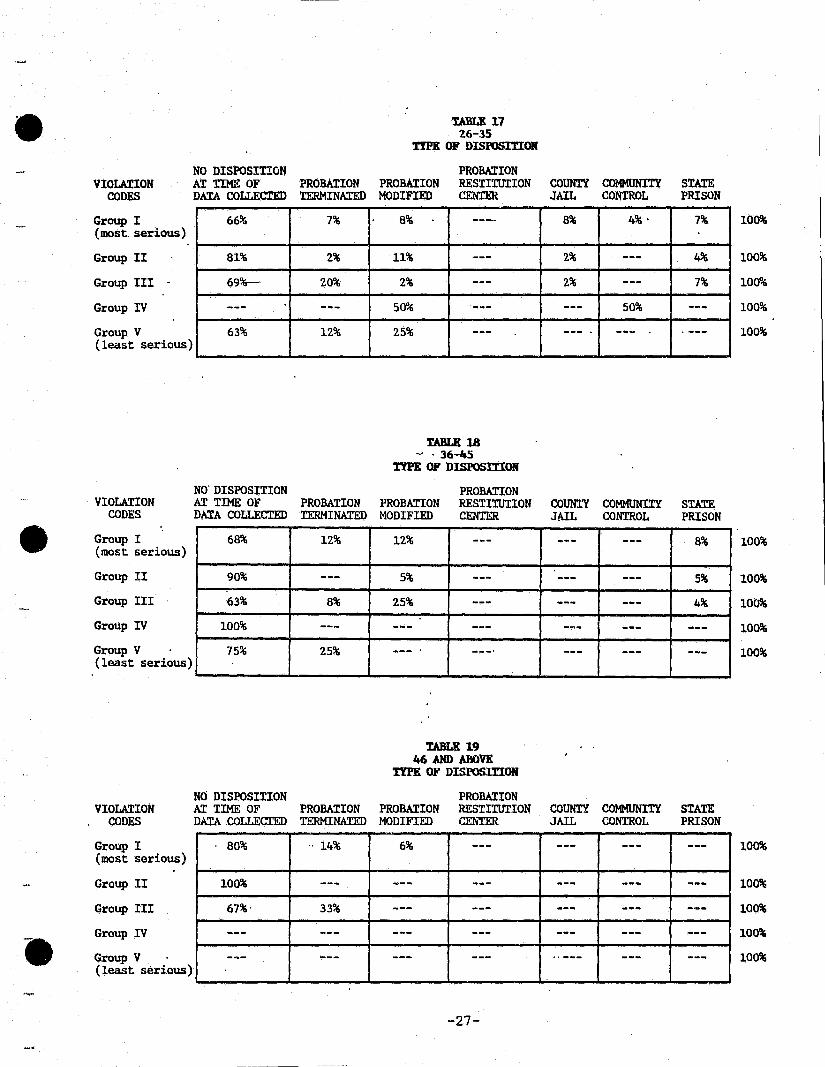
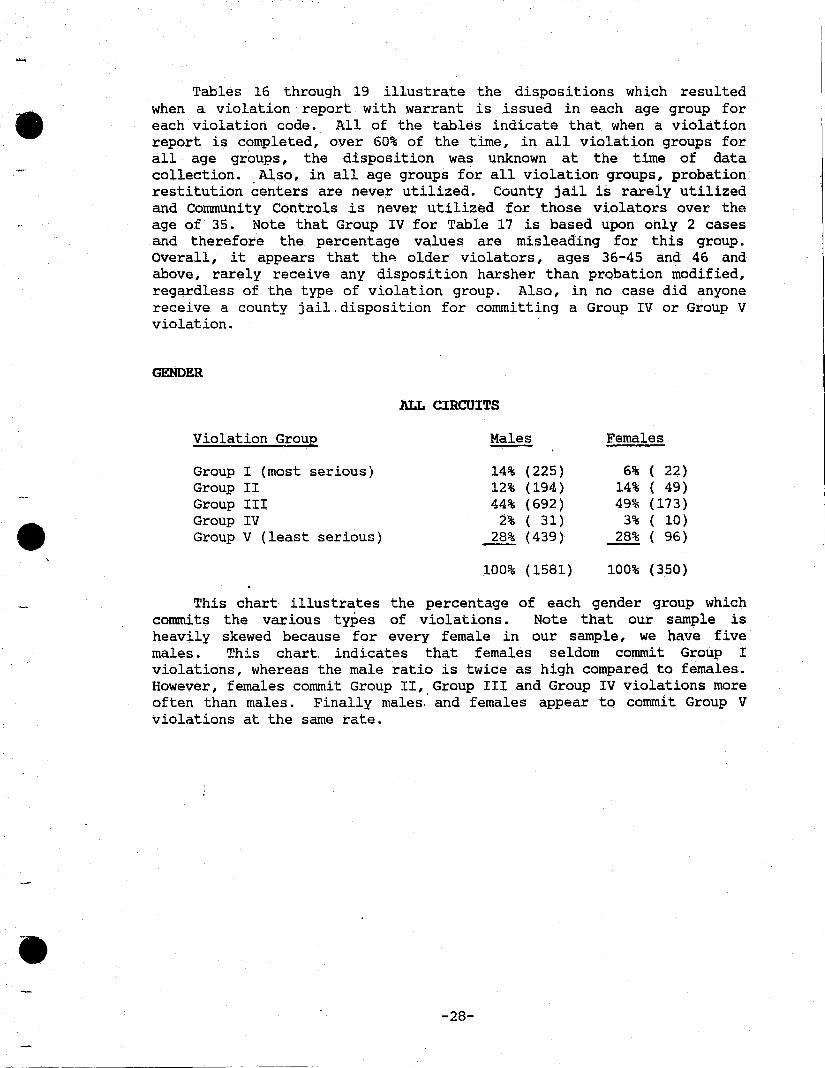
Tables 16 through 19 illustrate the dispositions which resulted when a violation report with warrant is issued in each age group for each violation code. All of the tables indicate that when a violation report is completed, over 60% of the time, in all violation groups for all age groups, the disposition was unknown at the time of data collection. Also, in all age groups for all violation groups, probation restitution centers are never utilized. County jail is rarely utilized and Community Controls is never utilized for those violators over the age of 35. Note that Group IV for Table 17 is based upon only 2 cases and therefore the percentage values are misleading for this group. Overall, it appears that thA older violators, ages 36-45 and 46 and above, rarely receive any disposition harsher than probation modified, regardless of the type of violation group. Also, in no case did anyone receive a county jail.disposition for committing a Group IV or Group V violation.
GENDER
ALL CIRCUITS
Violation Group Males Females
Group I (most serious) 14% (225) 6% ( 22) Group II 12% (194) 14% ( 49) Group III 44% (692) 49% (173) Group IV 2% ( 31) 3% ( 10) Group V (least serious) 28% (439) 28% ( 96)
100% (1581) 100% (350)
This chart illustrates the percentage of each gender group which commits the various types of violations. Note that our sample is heavily skewed because for every female in our sample, we have five males.. This chart. indicates that females seldom commit Group I violations, whereas the male ratio is twice as high compared to females. However, females commit Group II, Group III and Group IV violations more often than males. Finally males,' and females appear to commit Group V violations at the same rate .
-28-
••
•
'.
VIOLATION CODES
Group I (most serious)
Group II
Group III
Group IV
Group V (least serious)
TABLE 20 AU. CIRCUITS
System Responses
NO ACTION DOCtlHENTATION
Males Females Males Females
8% 13% 2% 5%
44% 45% 3% 8%
78% 86% 7% 4%
77% 70% 7% ---94% 96% 2% ---
VIOLATION REPORT wrTHWARRANT
Males Females
90% 82%
53% 47%
15% 10%
16% 30%
4% 4%
100%
100%
100%
100%
100%
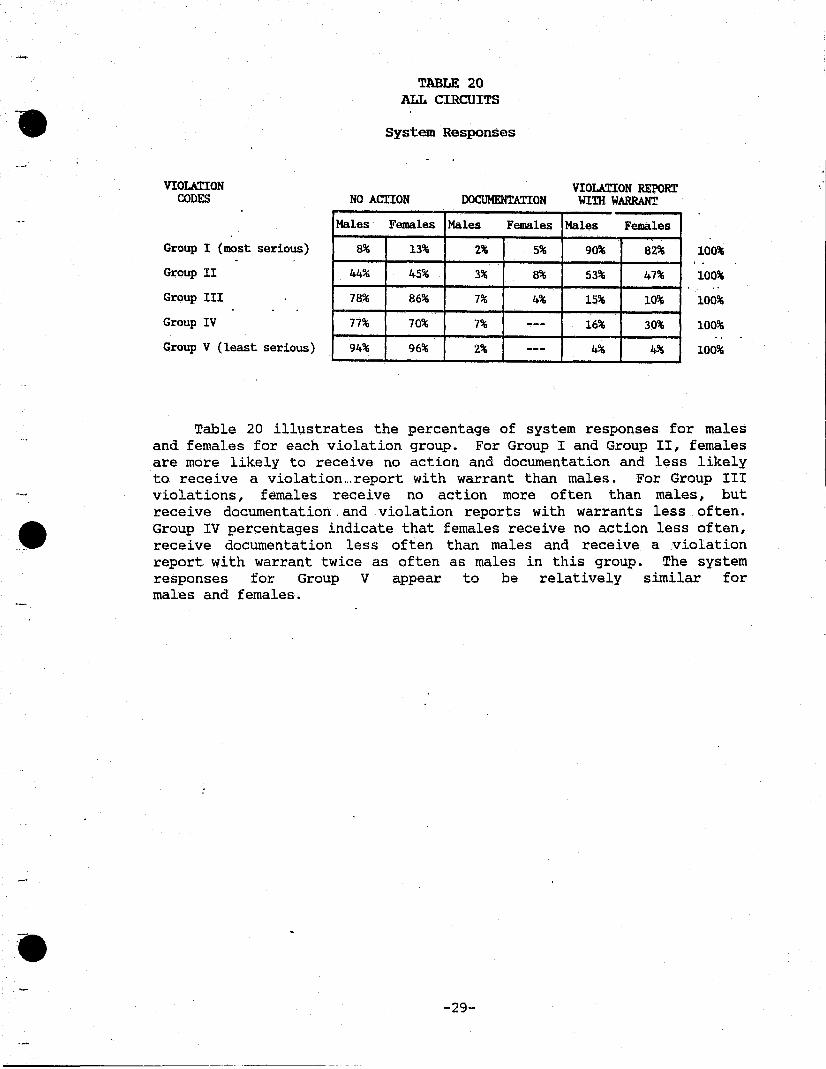
Table 20 illustrates the percentage of system responses for males and females for each violation group. For Group I and Group II, females are more likely to receive no action and documentation and less likely to receive a violation ... report with warrant than males. For Group III violations, females receive no action more often than males, but receive documentation. and violation reports with warrants less often . Group IV percentages indicate that females receive no action less often, receive documentation less often than males and receive a violation report with warrant twice as often as males in this group. The system responses for Group V appear to be relatively similar for males and females.
-29-

•
•
•
NO DISPOSITION
: TABLE 21 ALL CIRCUITS
Type of Di~~sition
VIOLATION AT TIME OF PROBATION PROBATION PROBATION RESTITUTION COUNTY COMMUN"LTY
CONTROL STATE PRISON CODES DATA COLLECTED TERMINATED MODIFIED CENTER JAIL
Group I (most serious)
Group II
Group III
Group IV
Group V (least serious)
Male Fe'.llale Male Female Male Female Male Female Male Female Hale Female Hale Female
65% . 61%· 9% 17% 11% 6% --- --- 5% 11% 2% 6% 8% ---
83% 74% 4% 9% 8% 4% --- --- --- 7% 2% --- 3% 4%
74% 44% 13% 22% 5% 11% --- --- 2% 6% 3% --- 3% 17%
20% 67% 40% --- 20% --- --- --- --- --- --- 33% 20% ---67% ·75% 11% 25% 22% --- --- - --- --- --- ---- --- --- ---
Table 21 illustrates the dispositions that are used statewide when a violation report with warrant is issued. Each disposition category is broken down into male and female categories. The percentages for Group I indicate that males are placed in state prison more often in this violation .group, .but females are placed in community control and county jail more often. Also, in Group I, male probation is modified more often, but a female's probation is terminated more often. As a matter of fact, a females I probation is terminated more often in every group except IV.. . However, beqause Group IV accounts for so few cases in the sample, the percentage results for this violation group are not statistically significant. Females are placed in state prison and county jail in Groups II and tIl more often. Overall, males nor females receive any disposition harsher than probation modified for Group V .
-30-
100%
100%
100%·
100%
100%
•
•
•
PART II
PROBATION OFFICER QUESTIONNAIRE
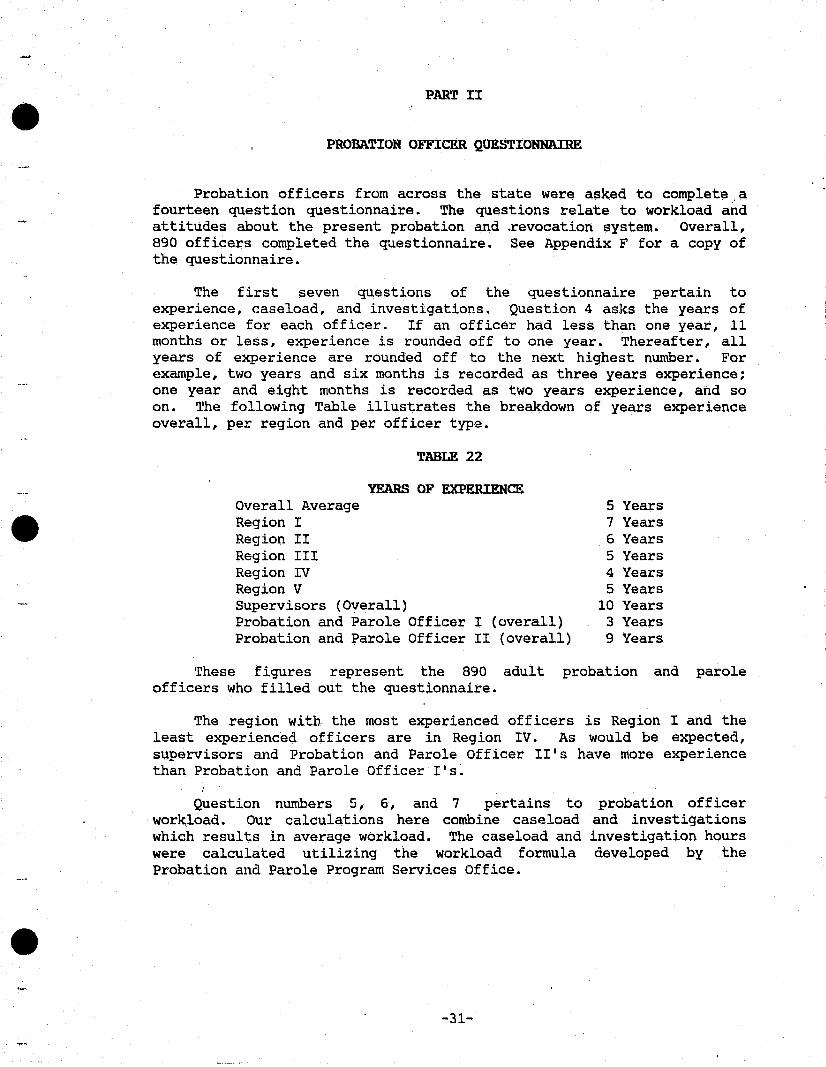
Probation officers from across the state were asked to complete.a fourteen question questionnaire. The questions relate to workload and attitudes about the present probation and ~evocation system. Overall, 890 officers completed the ~~estionnaire. See Appendix F for a copy of the questionnaire.
The first seven questions of the questionnaire pertain to experience, case10ad, and investigations. Question 4 asks the years of experience for each officer. If an officer had less than one year, 11 months or less, experience is rounded off to one year. Thereafter, all years of experience are rounded off to the next highest number. For example, two years and six months is recorded as three years experience; one year and eight months is recorded as two years experience, and so on. The following Table illustrates the breakdown of years experience overall, per region and per officer type.
TABLE 22
YEARS OF EXPERIENCE Overall Average Region I Region II Region III Region IV Region V Supervisors (Oyerall) Probation and Parole Officer Probation and Parole Officer
I (overall) II (overall)
5 Years 7 Years 6 Years 5 Years 4 Years 5 Years
10 Years 3 Years 9 Years
These figures represent the 890 adult probation and parole officers who filled out the questionnaire.
The region with the most experienced officers is Region I and the least experienced officers are in Region IV. As would be expected, supervisors and Probation and Parole Officer II's have more experience than Probation and Parole Officer I's.
Question numbers 5, 6, and 7 pertains to workload. Our calculations here combine caseload which results in average workload. The caseload and were calculated utilizing the workload formula Probation and Pa170le Program Services Office.
-31-
probation officer and investigations investigation hours developed by the

•
•
•
TlmLE 23
Overall average Region I Region II Region III Region IV Region V
WORK HOURS 146 125.4 113.S 157 lSS.S 151
The region with the largest average workload size appears to be Region III, and the region with the smallest workload size appears to be Region II~ However, note that these are the workloads reported by each officer, but may not be exactly accurate. Also, factors such as training absences and vacancies were not measured within Table 23.
Questions three through seven pertain to the types of investigations that each officer completes every month. The following tables illustrate the average amount of investigations each officer completes in every investigation category.
TABLE 24 TABLE 25
VIOLATION REPORTS PRESENTENCE INVESTIGATIONS
Overall average 5 Overall average 4 Region I 4 Region I 4 Region II 5 Region II 6 Region III 6 Region III 6 Region IV 7 Region IV 3 Region V 5 Region V 3 PPO I (overall) S PPOI (overall) 4 PPO II (overall) 7 PPOII (overall) 3
TABLE 26 TABLE 27
POST SENTENCE INVESTIGATION PRE PAROLE INVESTIGATIONS
Overall average S Overall Average 2 Region I 3 Region I 1 R,egion II 3 Region II 3 Region III 5 Region III 1 Region IV 6 Region IV 2 Region V 4 Region V 2 PPO I (overall) S PPO I (overall) 2 PPO II (overall) S PPO II (overall) 2
-32-

••
•
-.
TABLE 28
WORK RELEASE INVESTIGATIONS
Overall average Region I Region II Region III Region IV Region V PPO I (overall) PPO II (overall)
TABLE 30
3 o 2 7 2 1 3 3
R.O.Rm INVESTIGATIONS
Overall average 4 Region I 0 Region II 11 Region III 8 Region IV 2 Region V 2 PPO I (overall) 4 PPO II (verall) 4
TABLE 29
OTHER STATE INVESTIGATIONS
Overall average 2 Region I 1 Region II 2 Region III 3 Region IV 2 Region V 2 PPO I (overall) 2 PPO I (overall) 2
TABLE 31
SECURITY INVESTIGATIONS
Overall average 2 Region I 1 Region II 2 Region III 2 Region IV 1 Region V 2 PPO I (overall) 2 PPO II (overall) 1
This data indicates that Region I completes on the average, more violation reports and presentence investigations than any other type of investigation. It .. appears that Regions II and III complete, on the av:erage, "more R.O.R. investiga'tions than any other type of investigation. , Finally" Regions IV and V, on the average, complete more violation reports than any other'type of investigation •
. This .. data also demonstrates that the regior. which averages the most violation.reports for a .one month period is Region IV. Regions II and III average the highest amount qf presentence investigations for a one month period. Region IV averages the largest amount of post-sentence investigations for a one month period. For pr,e-paroJ.e investigations, Region II has the. highest average. Region III clearly has the highest average of work release investigations; at least double the four other regions' work release investigations. Also, Region III averages more other: state investigations than the other regions, but not by a significant amount. The largest average shows up in the R.O.R. investigations where Region II conducts an average of eleven per month. Most officers in every region conduct one or two security investigations per month. It is also in'teresting to note that on the average, Region I does not conduct work release investigations nor do the Region I officers on the average conduct R.O.R. investigations.
Questions eight and nine center upon what the officer reportedly would do, if a violation is committed by a probationer the officer is supervising. These answers will be correlated with the actual case
-33-
•
•
-.
review. If the system responses by the officers in the case review data and the officer responses for questions eight and nine do not correlate, then this will be an indication of some inconsistency within the system.
Question eight asks the officers to respond to a violation that is commi tted . on one or two occasions. (See Appendix F for a copy of Question number eight). Question nine asks the same response from the officers except the number of violations is changed to from "one or two occasions" to "more than two occasions".
QUESTION 8.
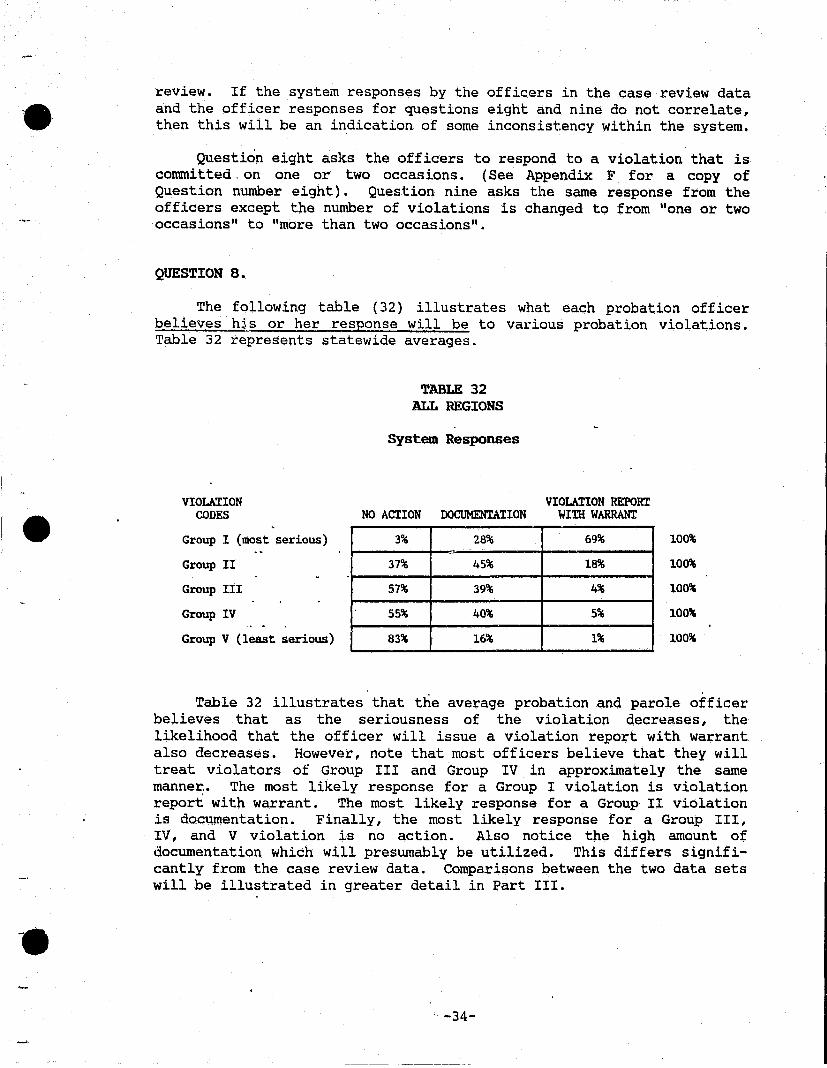
The following table (32) illustrates what each probation officer believes h~.~ or her response will be to various probation violations. Table 32 represents statewide averages.
VIOLATION CODES
Group I (most serious)
Group II
Group III
Group IV
Group V (least serious)
TABLE 32 ALL REGIONS
System Responses
VIOLATION REPORT NO ACTION DOCUMENTATION WITH WARRANT
3% 28% 69%
37% 45% 18%
57% 39% 4%
55% 40% 5%
83% 16% 1%
100%
100%
100%
100%
100%
Table 32 illustrates that the average probation and parole officer believes that as the seriousness of the violation decr~ases, the likelihood that the officer will issue a violation report with warrant also decreases. However, note that most officers believe that they will treat violators of Group III and Group IV in approximately the same manne~. The most likely response for a Group I violation is violation report with warrant. The most likely response for a Group II violation is dooumentation. Finally, the most likely response for a Group III, IV, and V violation is no action. Also notice the high amount of documentation which will presumably be utilized. This differs significantly from the case review data. Comparisons between the two data sets will be illustrated in greater detail in Part III.
-34-
l..
•
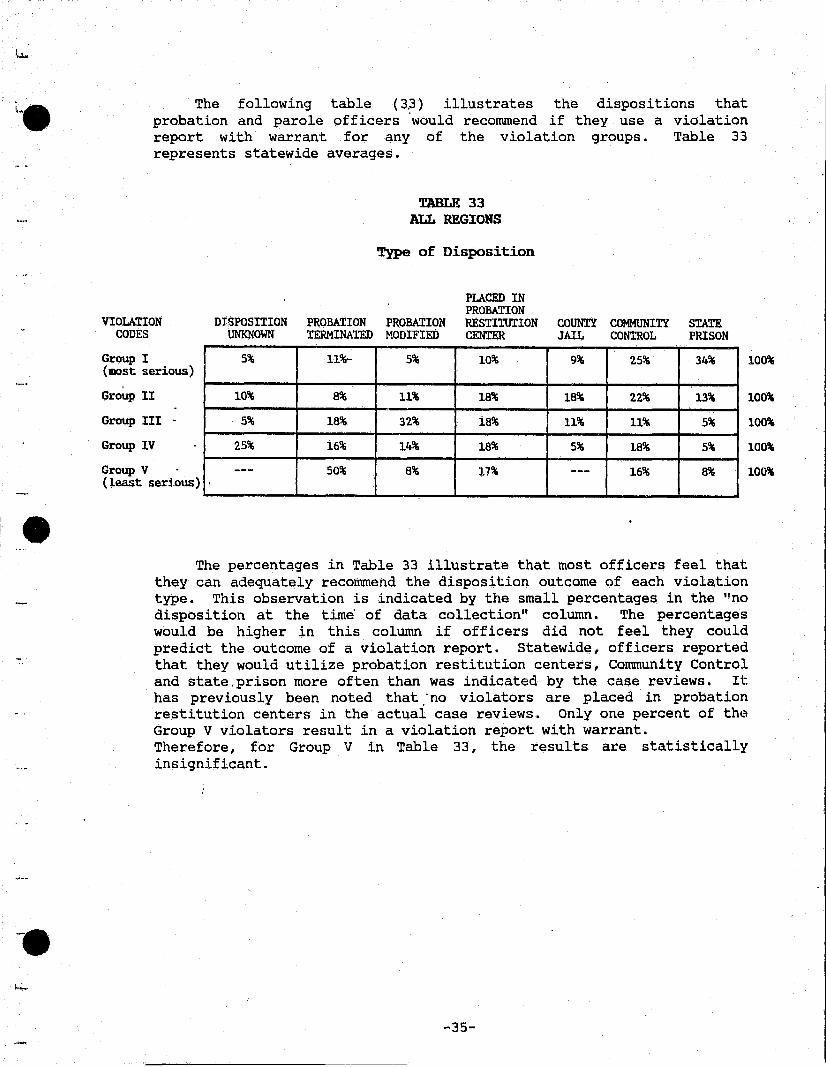
The following table (3.3) illustrates the dispositions that probation and parole off icers 'would recommend if they use a violation report with warrant for any of the violation groups. Table 33 represents statewide averages.
TABLE 33 ALL REGIONS
Type of Disposition
PLACED IN PROBATION
VIOLATION CODES
DISPOSITION PROBATION PROBATION RESTITUTION COUNTY COMMUNITY STATE UNKNOWN TERMINATED MODIFIED CENTER JAIL CONTROL PRISON
Group I 5% 11%- 5% 10% 9% 25% 34% (most serious)
,
100%
Group II
Group III -
Group IV
Group V
10%
5%
25%
---
8% 11%
18% 32%
16% 14%
50% 8%
18% 18%
18% 11%
18% 5%
17% ---
22%
11%
18%
16%
13%
5%
5%
8%
100%
100%
100%
100% (least serious)
The percentages in Table 33 illustrate that most officers feel that they can adequately recommend the disposition outcome of each violation type. This observation is indicated by the small percentages in the "no disposition at the time' of data collection" column. The percentages would be higher in this column if officers did not feel they could predict the outcome of a violation report. Statewide, officers reported that they would utilize probation restitution centers, Community Control and state.prison more often than was indicated by the case reviews. It has previously been noted that :no violators are placed in probation restitution centers in the actual case reviews. Only one percent of the Group V violators result in a violation report with warrant. Therefore, for Group V in Table 33, the results are statistically insignificant.
-35-

, ....
•
•
•
Region I
The following percentage table represents the system responses that eighty-seven probation officers in Region I claim will be their response to each violation type. These results are for Region I only.
VIOLATION CODES
Group I (most serious)
Group II
Group III
Group IV
Group V (leaSt serious)
TABLE 34 REGION I
VIOLATION REPORT NO ACTION DOCUMENTATION WITH WARRANT
3% 40% 57%
52% 45% 3%
,62% 36% 2%
69% 29% 2%
82% 17% 1%
I
100%
100%
100%
100%
100%
The results in Table 34 indicate that the only time Correctional Probation Officers in Region I would resort to a violation report with warrant is when the most serious violations are committed. For all other violations, officers overwhelmingly choose to utilize no action or documentation'. ,The case review statistics indicate that, in actuality, documentation is rarely utilized within Circuit 02, Region I.
-36-
" ,

•
•
-.
The following percentage table illustrates the dispositions each officer would recommend in our .. Region I sample when a violation report with warrant is issued.
VIOLATION CODES
Group I (most serious)
Group II
Group III
Group IV
Group V (least serious)
TABLE 35 REGION I
Type of Di~sition
PLACED IN PROBATION
DISPOSITION PROBATION PROBATION RESTITUTION COUNTY COMMUNITY STATE UNKNOWN TERMINATED MODIFIED CENTER JAIL CONTROL PRISON
4% 22% 6% 12% 6% 28% 22%
--- 33% 33% --- --- --- 33%
--- 50% --- 50% --- --- ------ 50% --- --- --- 50% ------ --- ·100% . --- --- --- ---
The percentages for violation Group II through V are misleading because the actual numbers are low. For example, violation reports with warrants are recommended only three times for Group II, two times for violation Groups III and IV, and only one time for violation Group V. Therefore, the percentages for these groups are not significant. However, the percentages for violation Group I do reveal some interesting results. In Region I, when the most serious violations occur, officers would recommend that probation be terminated, Community Control or state prison most often. According to the case review resuits of Circuit 02, Region I, (see Table 4) neither Community Control nor state prison are utilized and probation terminated is utilized only one-half as often as officers reportedly would recommend. However, 75% of the dispositions are unknown' which makes a true comparison between the two research instruments difficult.
-37-
100%
100%
100%
100%
100%
•
-.
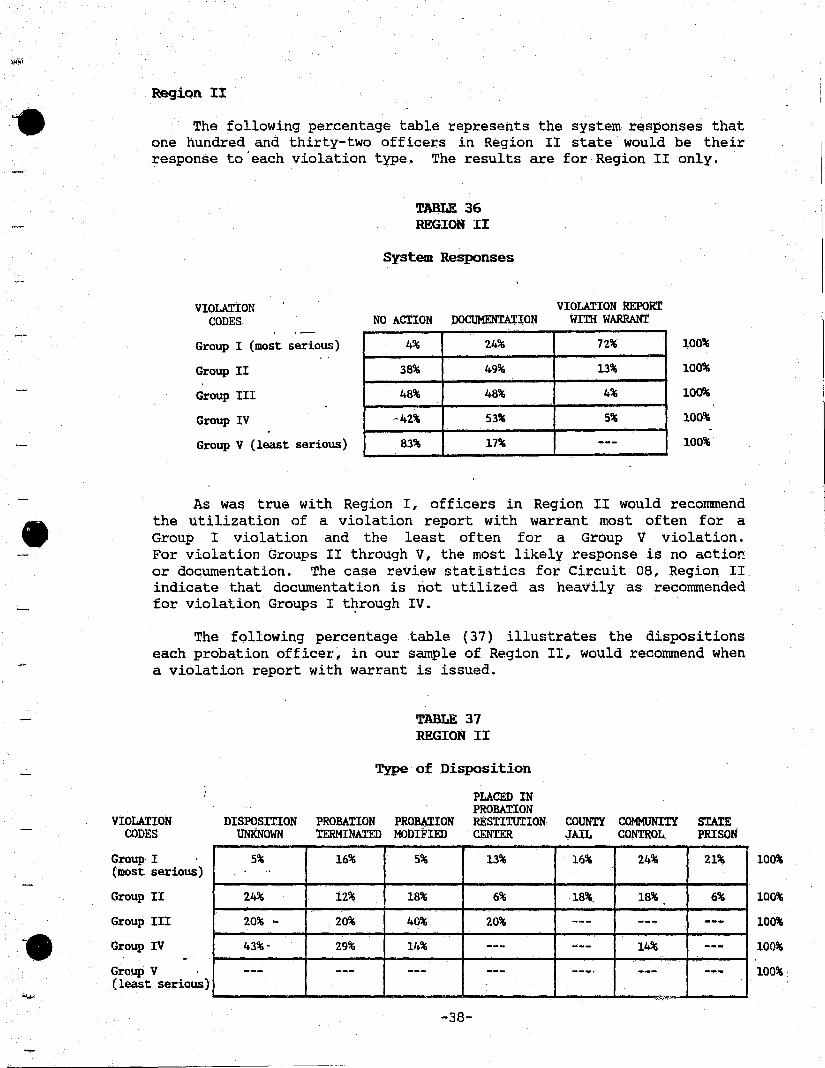
Region II
The following percentage table represents the system responses that one hundred and thirty-two officers in Region II state would be their response to 'each violation type. The results ar.e for Region II only.
VIOLATION CODES
Group I (most serious)
Group II
Group III
Group IV
Group V (least serious)
TABLE 36 REGION II
System Responses
VIOLATION REPORT NO ACIION OOCUMENTATION WIm WARRANT
4% 24% 72%
38% 49% 13%
48% 48% 4-"6
,-42% 53% 5%
83% 17% ---
100%
100%
100%
100%
100%
As was true with Region I, officers in Region II would recommend the utilization of a violation report with warrant most often for a Group I violation and the least often for a Group V violation. For violation Groups II through V, the most likely response is no action or documentation. The case review statistics for Circuit 08, Region II indicate that documentation is not utilized as heavily as recommended for violation Groups I t~rough IV.
The following percentage table (37) illustrates the dispositions each probation officer~ in our sample of Region II, would recommend when a violation report with war.rant is issued.
VIOLATION CODES
Group I (most serious)
Group II
Group III
Group IV
Group V (least serious)
TABLE 37 REGION II
Type of Disposition
PLACED IN PROBATION
DISPOSITION PROBATION PROBATION RESTITUTION COUNTY COMMUNITY STATE UNKNOWN TERMINATED MODIFIED CENTER JAIL CONTROL PRISON
5% 16% 5% 13% 16% 24% 21% .'
24% 12% 18% 6% 18%, 18% 6%
20% .. 20% 40% 20% --- --- ---43%- 29% 1/.% --- --- 14% ------ --- --- --- --_. --- ---
,-.~
-38-
100%
100%
100%
100%
100%·
• } • .j
•
•
•
In Circuit 08, Region II, officers do not use a violation report with warrant for Group V according to the case review. This correlates with the que'stionnaire responses for Region II as indicated by Tables 36 and 37. In Table 37, the percentages for groups III and IV may be skewed because they are based upon small numbers (5 and 7 respectively). The officers in Region II would recommend the use of probation restitution centers, county jail and Community Control more often than actually resulted in the case review. And for Group I violations, according to case review, offenders are not sentenced to state prison; whereas, according to the questionnaire, officers would recommend sentencing to state prison 21% of the time.
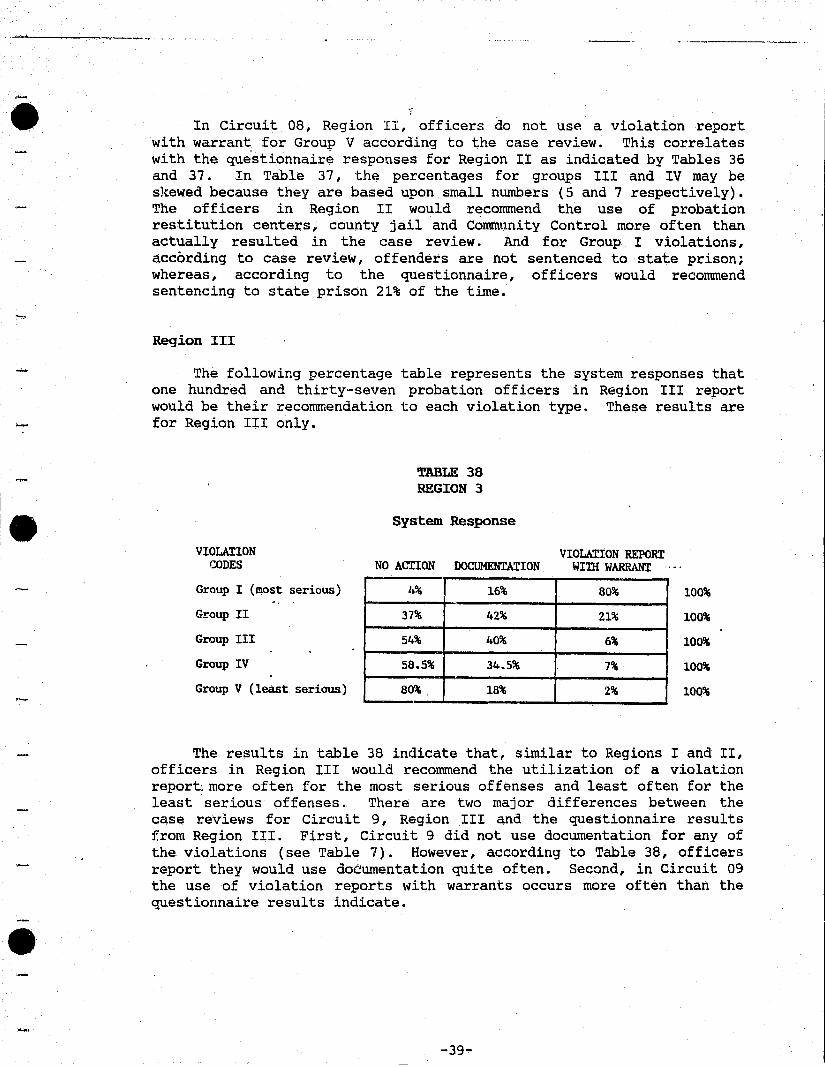
Region III
The following percentage table represents the system responses that one hundred and thirty-seven probation officers in Region III report would be their recommendation to each violation type. These results are for Region III only.
VIOLATION CODES
Group I (~ost serious)
Group II
Group III
Group IV
Group V (least serious)
TABLE 38 REGION 3
System Response
VIOLATION REPORT NO ACIION DOCUMENTATION WIm WARRANT
4% 16% 80%
37% 42% 21%
54% 40% 6%
58.5% 34.5% 7%
80% 18% 2%
100%
100%
100%
100%
100%
The results in table 38 indicate that, sbuilar to Regions I and II, officers in Region III would recommend the utilization of a violation report: more often for the most serious offenses and least often for the least 'serious offenses. There are two major differences between the case reviews for Circuit 9, Region III and the questionnaire results f.rom Region III. First, Circuit 9 did not use documentation for any of the violations (see Table 7). However, according to Table 38, officers report they would use documentation quite often. Second, in Circuit 09 the use of violation reports with warrants occurs more often than the questionnaire results indicate.
-39-

-
•
•
•
The following percentage table (39) illustrates the disposition each officer, in our sample o~ Region III, recommends if a violation report with warrant is requested.
VIOLATION CODES
Group I (most serious)
Group II
Group III
Group IV
Group V (least serious)
TABLE 39 REGION III
Type of Disposition
PLACED IN PROBATION
DISPOSITION PROBATION PROBATION RESTITUTION COUNTY COMMUNITY STATE UNKNOWN· TERMINATED MODIFIED CENTER JAIL CONTROL PRISON
4% 7% 3% .. 18% ·7% 23% 38%
A% 14% 10% 28% 10% 24% 10%
-- 38% 38% 12% 12% --- ---10% 0- 10% 30% 50% --- --- ------ 67% ,,33% --- --- --- ---
In Table 39, the percentages for Groups III, IV and V are based upon ten or fewer responses that indicated they would use a violation report with warrant for this type of violation (out of 137 officer questionnaires). Therefore, these categories are skewed. For Groups I and II in Table 39, officers report they would recommend the utilization of state prison, Community Control, county jail, and probation restitution centers more often than the case reviews indicate. However, since the majority of the responses of the case reviews did not indicate the disposition at the time of data collection, it may be unfair to make comparisons between the two data sets.
-40-
100%
100%
100%
100%
100%
•
•
~.
' ......
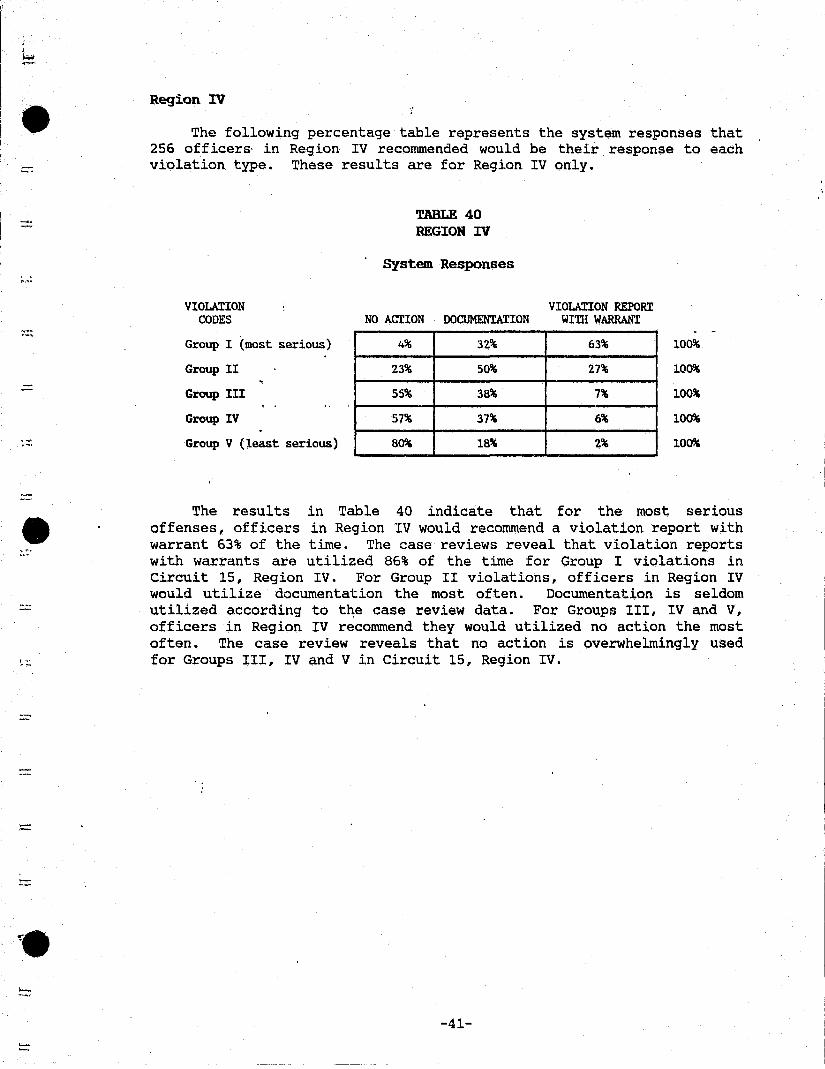
Region IV
The following percentage table represents the system responses that 256 officers· in Region IV recommended would be their response to each violation type. These results are for Region IV only.
VIOLATION CODES
Group I (most serious)
Group II
Group III
Group IV
Group V (least serious)
TABLE 40 REGION IV
System Responses
VIOLATION REPORT NO ACTION DOCUMENTATION WITH WARRANT
4% 32% 63%
23% 50% 27%
55% 38% 7%
57% 37% 6%
80% 18% 2%
100%
100%
100%
100%
100%
The results in Table 40 indicate that for the most serious offenses, officers in Region IV would recommend a violation report with warrant 63% of the time. The case reviews reveal that violation reports with warrants are utilized 86% of the time for Group I violations in Circuit 15, Region IV. For Group II violations, officers in Region IV would utilize documentation the most often. Documentation is seldom utilized according to t~e case review data. For Groups III, IV and V, officers in Region IV recommend they would utilized no action the most often. The case review reveals that no action is overwhelmingly used for Groups III, IV and V in Circuit 15, Region IV.
-41-
•
•
•
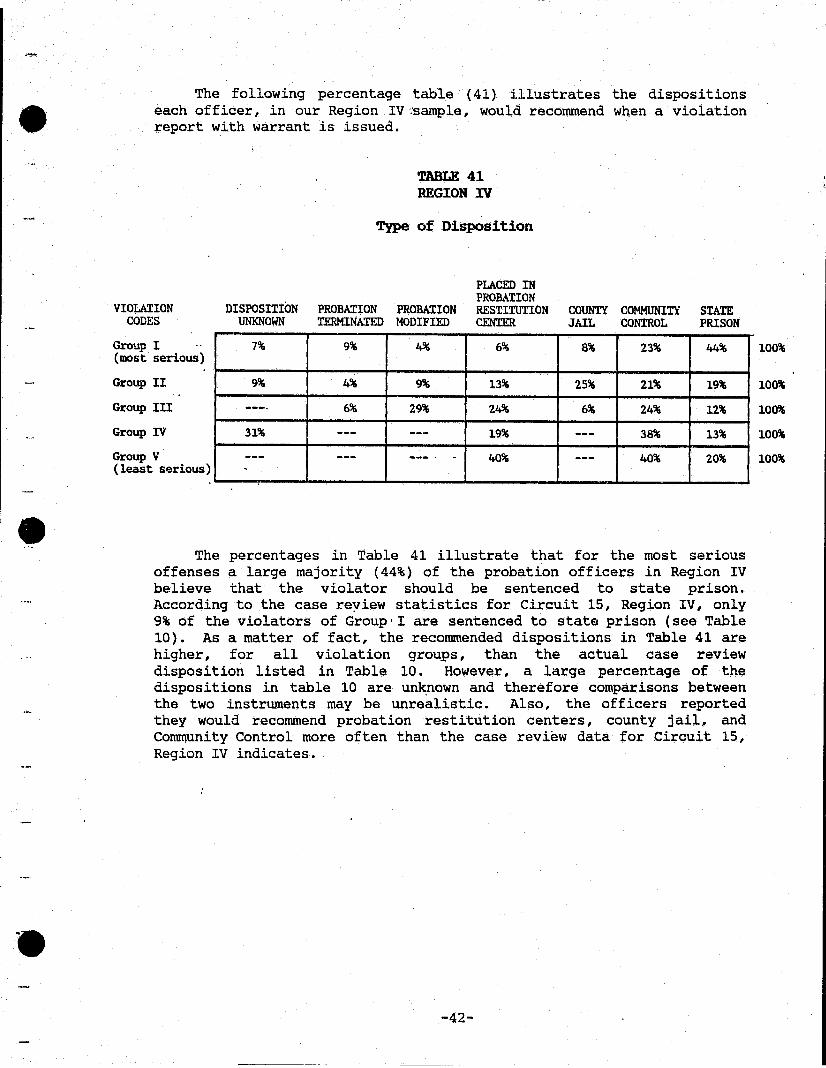
The following percentage table (41) illustrates the dispositions each officer, in our Region IV -:sample, would recommend when a violation report with warrant is issued.
VIOLATION CODES
Group I .. (most serious)
Group II
Group III
Group IV
Group V (least serious)
TABLE 41 REGION IV
Type of Disposition
DISPOSITION PROBATION PROBATION
PLACED IN PROBATION RESTITUTION CENTER UNKNOWN TERMINATED MODIFIED
7% 9% 4% 6%
9% 4% 9% 13%
---. 6% 29% 24%
31% --- --- 19%
--- --- --- . - 40% -
COUNTY COMMUNITY JAIL CONTROL
8% 23%
25% 21%
6% 24%
--- 38%
--- 40%
STATE PRISON
44%
19%
12%
13%
20%
The percentages in Table 41 illustrate that for the most serious offenses a large majority (44%) of the probation officers in Region IV believe that the violator should be sentenced to state prison. According to the case reyiew statistics for Circuit 15, Region IV, only 9% of the violators of Group-I are sentenced to state prison (see Table 10). As a matter of fact, the recommended dispositions in Table 41 are higher, for all violation groups, than the actual case review disposition listed in Table 10. However, a large percentage of the dispositions in table 10 are unknown and therefore comparisons between the two instrwnents may be unrealistic. Also, the off icers reported they would recommend probation restitution centers, county jail, and Community Control more often than the case review data for Circuit 15, Region IV indicates .
-42-
100%
100%
100%
100%
100%
I' I
I I. I
•
•
-.
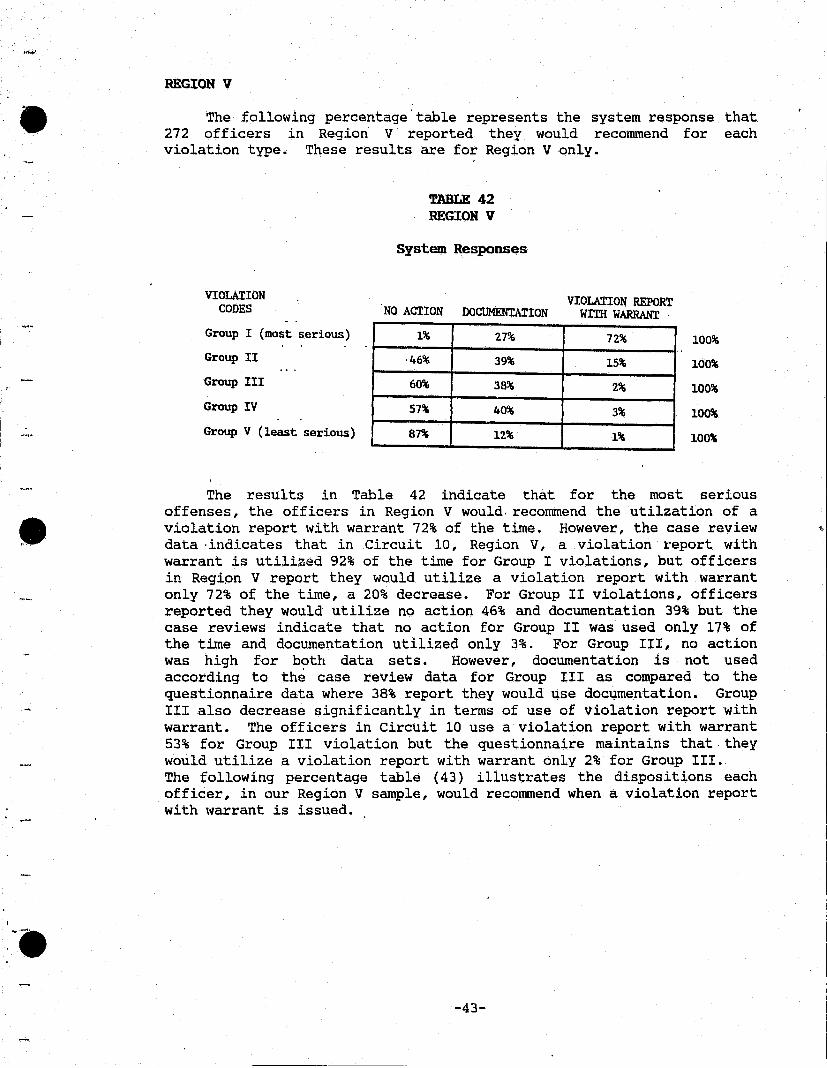
REGION V "
The following percentage'table represents the system response that 272 officers in Region V reported they would recommend for each violation type. These results are for Region V only.
VIOLATION CODES
Group I (most serious)
Group II
Group III
Group IV
Group V (least serious)
TABLE 42 REGION V
System Responses
NO ACTION DOCUMENTATION
1% 27%
·46% 39%
60% 38%
57% 40%
87% 12%
VIOLATION REPORT WI'llI WARRANT
72%
15%
2%
3%
1%
100%
100%
100%
100%
100%
The results in Table 42 indicate that for the most serious offenses, the officers in Region V would. recommend the utilzation of a violation report with warrant 72% of the time. However, the case review data ,indicates that in Circuit 10, Region V, a violation report with warrant is utilized 92% of the time for Group I violations, but officers in Regipn V report they would utilize a violation report with warrant only 72% of the time, a 20% decrease. For Group II violations, officers reported they would utilize no action 46% and documentation 39% but the case reviews indicate that no action for Group II was used only 17% of the time and documentation utilized only 3%. For Group III, no action was high for both data sets. However, documentation is not used according to the case review data for Group III as compared to the questionnaire data where 38% report they would use doc~mentation. Group III also decrease significantly in terms of use of violation report with warrant. The officers in Circuit 10 use a violation report with warrant 53% for Group III violation but the questionnaire maintains that· they would utilize a violation report with warrant only 2% for Group III. The following percentage table (43) illustrates the dispositions each officer, in our Region V sample, would recommend when a violation report with \'iarrant is issued.
-43-

•
•
•
VIOLATION CODES
Group I (most serious)
Group II
Group III
Group IV
Group V (least serious)
TABLE 43 REGION V
Type of Disposition
PLACED IN PROBATION
DISPOSITION PROBATION PROBATION RESTITUTION COUNTY COMMUNITY STAlE UNKNOWN TERMlN.ATlID MODIFIED CENTER JAIL CONTROL PRISON
5% 9% 6%· 9% 9% 30% 33%
13% 8% 10% 25% 13% 28% 5%
17% 17% 33% --- 33% --- ---22% 33% 22% --- 22% --- ------ 100% . --- --- --- --- ---
It is important to note that less than ten officers, out of 272, report they would issue a violation report with warrant for violations in Groups III, IV or V. For Group I Violations, when a violation report is issued, one-third of the officers believe that the violator should receive Community Control and one-third believe that the violator should be sentenced to state prison. The case review data for Circuit 10, Region V indicates that no violators received Community Control and only 9% of the violators were sentenced to state prison. However, as is true with all the regions, the high percentage of unknown dispositions within the case review data makes comparisons unreliable.
QUESTION 9
Question 9, as explained earlier, asks the same questions as Question 8 except that changes the number of times the violation is committed from one or two occurrences to more than two occurrences •
-44-
100%
100%
100%
100%
100%
•
••
•
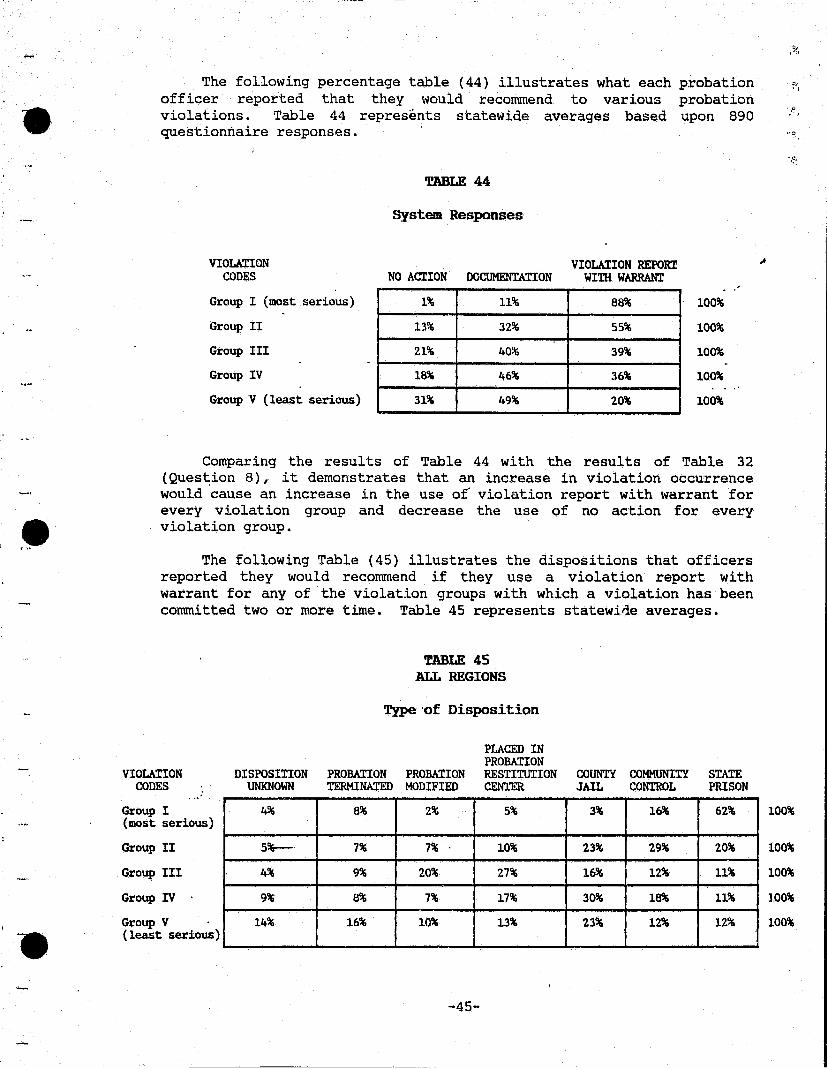
The following percentage table (44) illustrates what each probation officer reported that they would recommend to various probation violations. Table 44 represents statewide averages based upon 890 questionnaire responses.
VIOLATION CODES
Group I (most serious)
Group II
Group III
Group IV
Group V (least serious)
TABLE 44
System Responses
VIOLATION REPORT NO ACTION DOCUMENTATION WITH WARRANT
1% 11% 88%
13% 32% 55%
21% 40% 39%
18% 46% 36%
31% 49% 20%
100%
100%
100%
100%
100%
Comparing the results of Table 44 with the results of Table 32 (Question 8), it demonstrates that an increase in violation occurrence would 'cause an increase in the use of" violation report with warrant for every violation group and decrease the use of no action for every violation group.
The following Table (45) illustrates the dispositions that officers reported they would recommend if they use a violation report with warrant for any of the violation groups with which a violation has been committed two or more time. Table 45 represents statewiile averages.
VIOLATION CODES
Group I (most serious)
Group II
Group III
Group IV
Group V (least serious)
TABLE 45 ALL REGIONS
Type 'of Disposition
PLACED IN PROBATION
DISPOSITION PROBATION PROBATION RESTITUTION COUNTY COMMUNITY S!ATE UNKNOWN TERMINATED MODIFIED CENTER JAIL CONTROL PRISON
4% 8% 2% 5% 3% 16% 62%
5%-- 7% 7% 10% 23% 29% 20%
4% 9% 20% 27% 16% 12% 11%
9% 8% 7% 17% 30% 18% 11%
14% 16% 10% 13% 23% 12% 12%
-45-
0, ..
"\?
100%
100%
100%
100%
100%
•
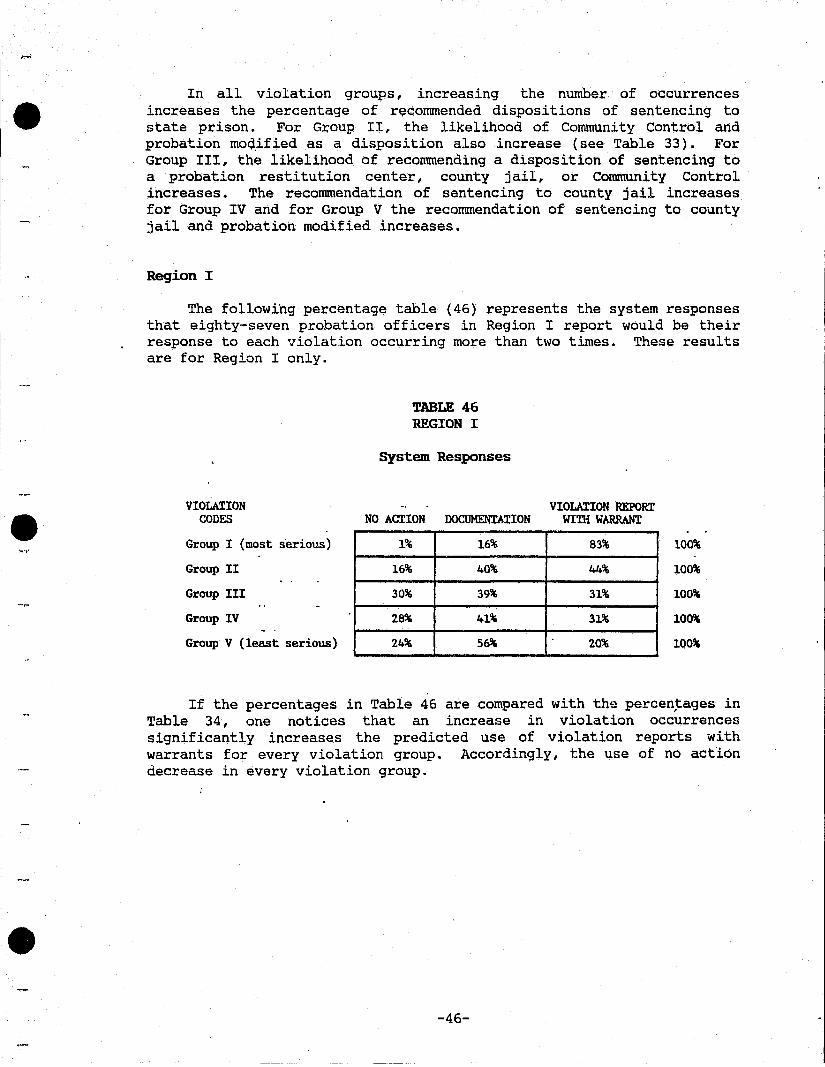
•
•
In all violation groups, increasing the number of occurrences increases the percentage of recommended dispositions of sentencing to state prison. For Group II, the likelihood of Community Control and probation moQ.,ified as a disposition also increase (see Table 33). For Group III, the likelihood of recommending a disposition of sentencing to a probation restitution center, county jail, or Community Control increases. The recommendation of sentencing to county j ail increases for Group IV and for Group V the recommendation of sentencing to county jail and probation modified increases.
Region I
The followi'ng percentage table (46) represents the system responses that eighty-seven probation officers in Region I report would be their response to each violation occurring more than two times. These results are for Region I only.
VIOLA!ION CODES
Group I (most serious)
Group II
Group III
Group IV
Group V (least serious)
TABLE 46 REGION I
System Responses
VIOLA!ION REPORt NO ACTION DOCUHENTA!ION WITH WARRANT
1% 16% 83%
16% 40% 44%
30% 39% 31%
28% 41% 31%
24% 56% 20%
tOO%
100%
100%
100%
100%
If the percentages in Table 46 are compared with the percen~ages in Table 34, one notices that an increase in violation occurrences significantly increases the predicted use of violation reports with warrants for every violation group. Accordingly, the use of no action decrease in every violation group .
-46-
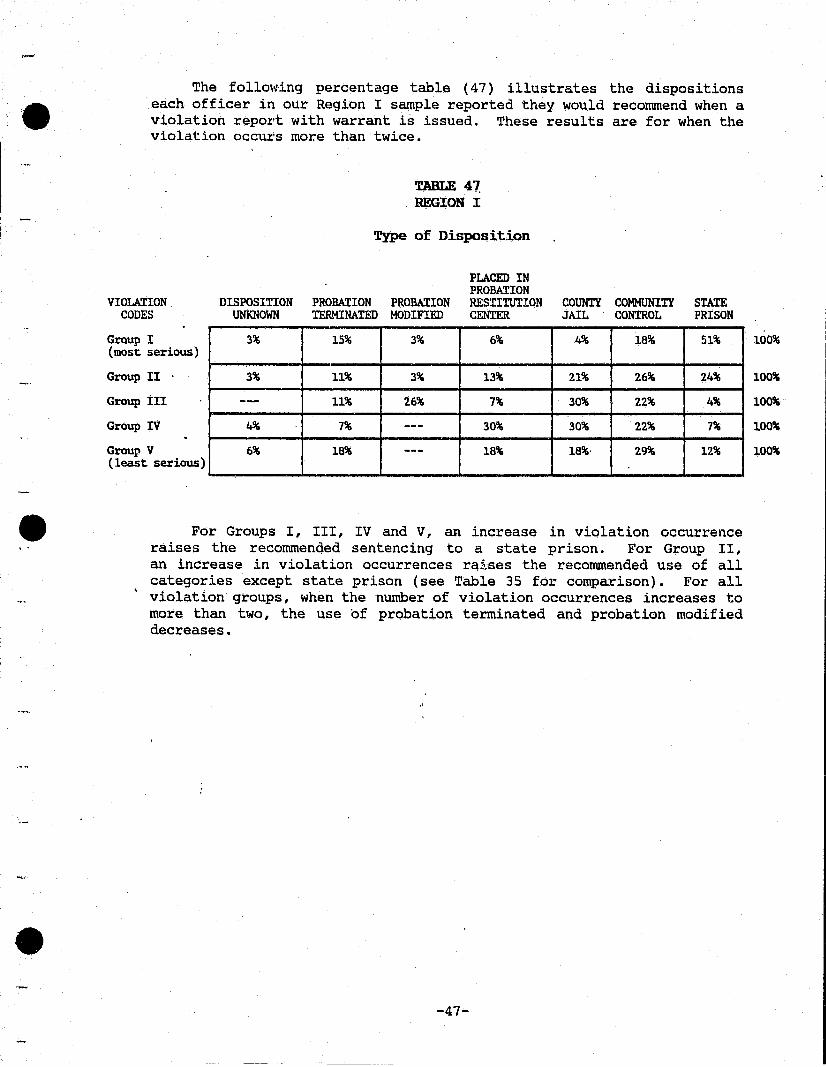
•
•
The following percentage table (47) illustrates the dispositions each officer in our Region I sample reported they would recommend when a violation report with warrant is issued. These results are for when the violation occurs more than twice.
VIOLATION CODES
GrQup I (most serious)
Group II .
Group III
Group IV
Group V (least serious)
TABLE 47, REGION I
Type of Disposition
PLACED IN PROBATION
DISPOSITION PROBATION PROBATION RESTITUTION COUNTY COMMUNITY STATE UNKNOWN TERMINAIED MODIFIED CENTER JAIL CONTROL PRISON
3% 15% 3% 6% 4% 18% 51%
3% 11% 3% 13% 21% 26% 24%
-- 11% 26% 7% 30% 22% 4%
4% 7% --- 30% 30% 22% 7%
6% 18% --- 18% 18%, 29% 12%
For Groups I, III, IV and V, an increase in violation occurrence raises the recommended sentencing to a state prison. For Group II, an increase in violation occurrences ra.ises the recommended use of all categories except state prison (see Table 35 for comparison). For all violation groups, when the number of violation occurrences increases to more than two, the use 'of probation terminated and probation modified decreases .
-47-
100%
100%
100%
100%
100%
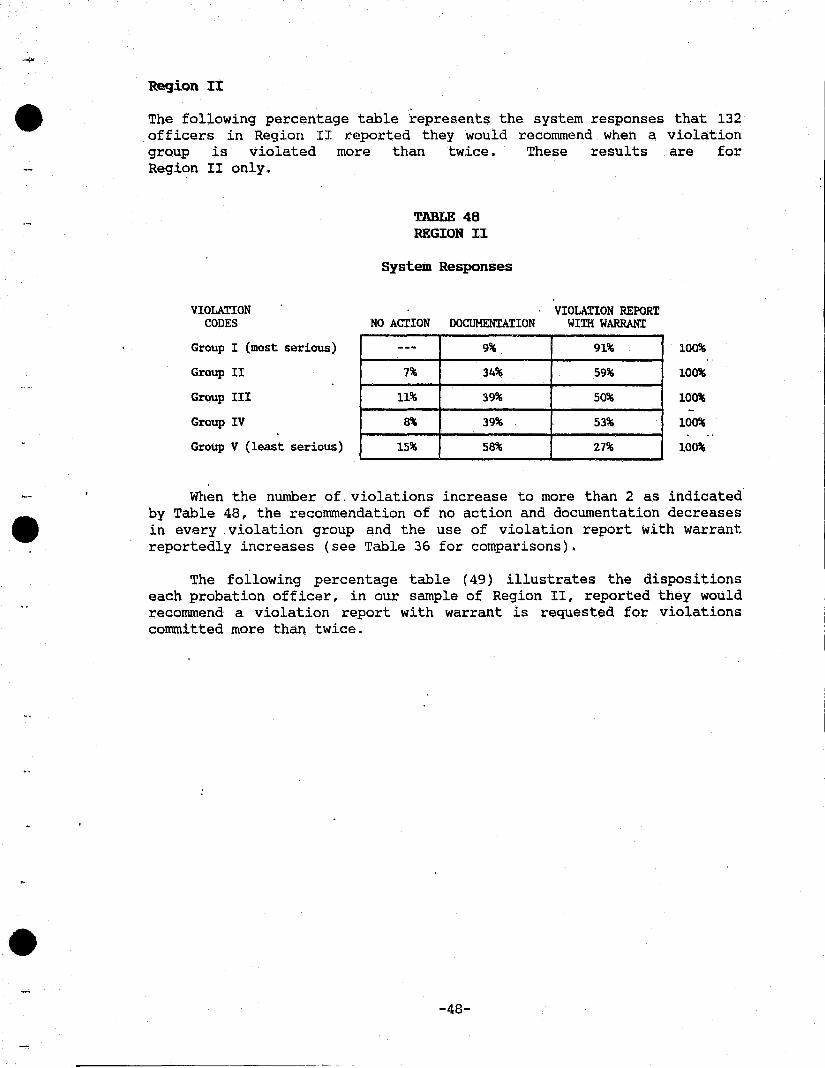
, ......
•
•
•
Region II
The following percentage table represents the system responses that 132 officers in Region II reported they would recommend when a violation group is violated more than twice. These results are for Region II only.
VIOLAIION CODES
Group I (most serious)
Group II
Group III
Group IV
Group V (least serious)
TABLE 48 REGION II
System Responses
VIOLATION REPORT NO ACTION DOCUMENTATION WITH WARRANT
--- 9% 91%
7% 34% 59%
11% 39% 50%
8% 39% 53%
15% 58% 27%
100%
100%
100%
100%
100%
When the number of. violations increase to more than 2 as indicated by Table 48, the recommendation of no action and documentation decreases in every. violation group and the use of violation report with warrant reportedly increases (see Table 36 for comparisons).
The following percentage table (49) illustrates the dispositions each probation officer, in our sample of Region II, reported they would recommend a violation report with warrant is requested for violations committed more than twice .
-48-
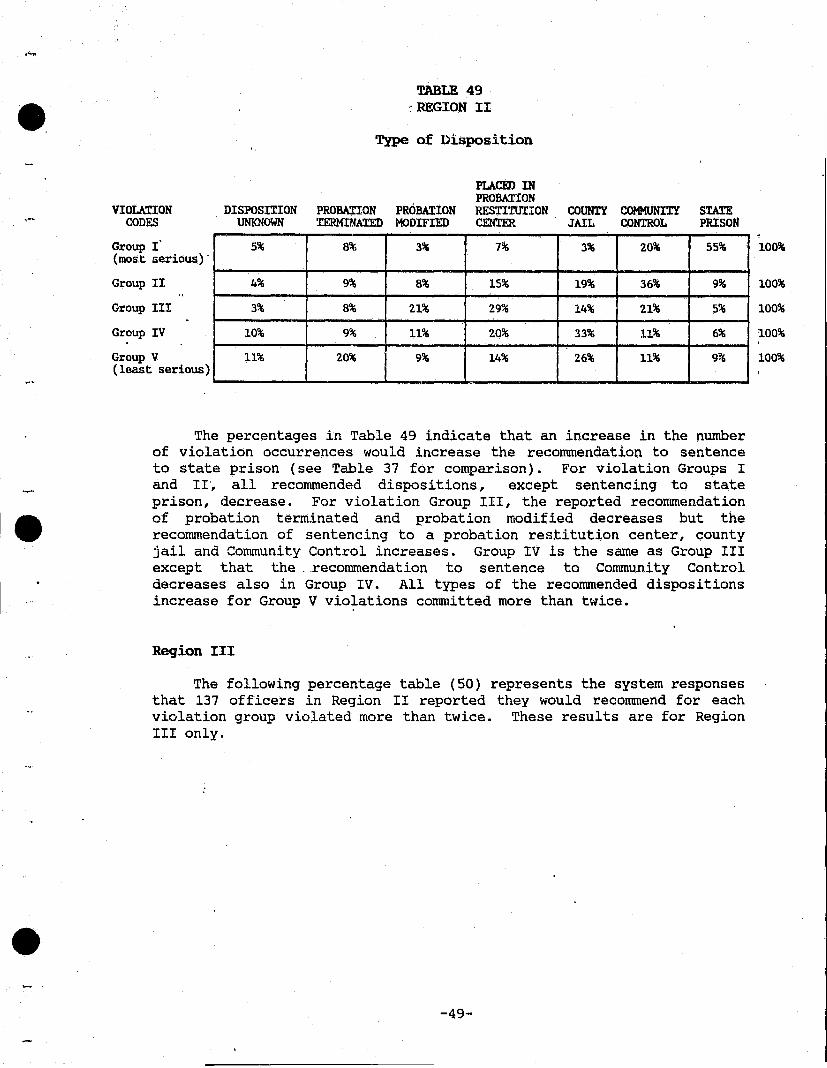
•
•
•
TABLE 49 .: REGION II
Type of Disposition
PLACED IN PROBATION
VIOLATION CODES
DISPOSITION PROBATION PROBATION RESTITUTION COUNTY COMMUNITY STArE
Group I" (mos.t serious)·
Group II
Group III
Group IV
Group V (least serious)
UNKNOWN TERMINATED MODIFIED CENTER. JAIL CONTROL PRISON
5% 8';\; 3% 7% 3% 20% 55%
4% 9% 8% 15% 19% 36% 9%
3% 8% 21% 29% 14% 21% 5%
10% 9% 11% 20% 33% 11% 6%
11% 20% 9% 14% 26% 11% 9%
The percentages in Table 49 indicate that an increase in the number of violation occurrences would increase the recommendation to sentence to state prison (see Table 37 for comparison). For violation Groups r and rr, all recommended dispositions, except sentencing to state prison, decrease. For violation Group III, the reported recommendation of probation terminated and probation modified decreases but the recommendation of sentencing to a probation restitution center, county jail and Community Control increases. Group IV is the same as Group III except that the .. recommendation to sentence to Community Control decreases also in Group IV. All types of the recommended dispositions increase for Group V violations committed more than twice.
Region III
The following percentage table (50) represents the system responses that 137 officers in Region II reported they would recommend for each violation group violated more than twice. These results are for Region III only .
-49-
100%
100%
100%
100%
100%
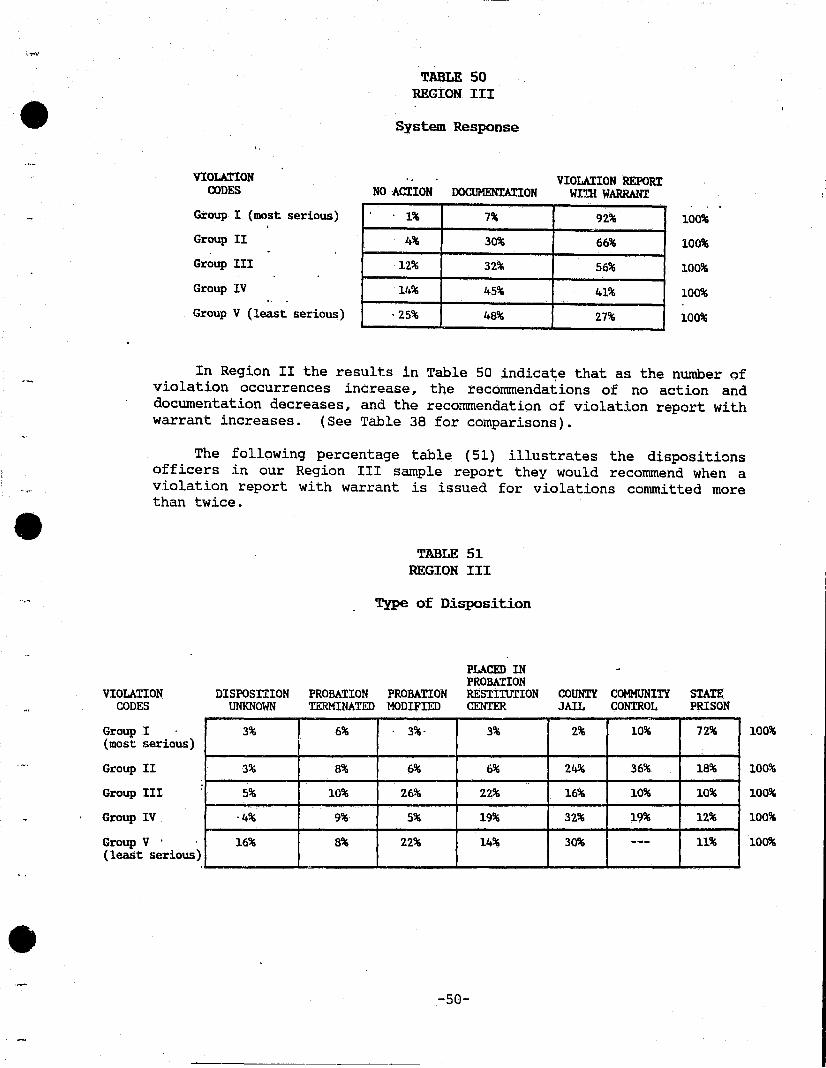
•
•
•
VIOLATION CODES
Group I (most serious)
Group II
Group III
Group IV
Group V (least serious)
TABLE 50 REGION III
System Response
VIOLATION REPORT NOAC!ION DOCUMENTATION WIIH WARRANT
1% 7% 92%
4% 30% 66%
12% 32% 56%
14% 45% 41%
·25% 48% 27%
100%
100%
100%
100%
100%
In Region II the results in Table 50 indica~e that as the number of violation occurrences increase, the recommendations of no action and documentation decreases, and the recommendation of violation report with warrant increases. (See Table 38 for comparisons).
The following percentage table (51) illustrates the dispositions officers in our Region III sample report they would recommend when a violation report with warrant is issued for violations committed more than twice .
TABLE 51 REGION III
Type of Disposition
PLACED IN PROBATION
VIOLATION CODES
DISPOSITION PROBATION PROBATION RESTITUTION COUNTY COHHUNITY STATE UNKNOWN TERMINATED MODIFIED CENTER JAIL CONTROL PRISON
Group I (most serious)
Group II
Group III
Group IV
:
Group V' . (least serious)
3%
3%
5%
'4%
16%
6% 3%·
8% 6%
10% 26%
9% 5%
8% 22%
3% 2% 10% 72%
6% 24% 36% 18%
22% 16% 10% 10%
19% 32% 19% 12%
14% 30% --- 11%
-50-
100%
100%
100%
100%
100%

, ....
•
•
•
The results of Table 51 indicate (when compat'ed to Table 39) that as the number. of violations in.creases to more than two, the reported recommendation of sentencing to' state prison increases for a~,l violation groups. For Group I, all recommended dispositions, except sentencing to state prison, decrease. For Group II, all recommended dispositions, except sentencing. to state prison or to Community Control, decrease. For Groups III and IV, all dispositions, except sentencing to state prison, Community control or county jail, decrease. Finally, for Group V, all recommended dispositions increase, except probation terminated and probation modified.
Region IV
The Following percentage table (52) represents the system responses that 256 officers in Region IV reported they would recommend for violations which are committed more than twice. These results are for Region IV only.
VIOLATION CODES
Group I (most serious)
Group II
Group III
Group IV
Group V (least serious)
TABLE 52 REGION IV
System Responses
VIOLATION REPORT NO ACTION DOCUMENTATION WITH WARRANT
1% 15% 84%
10% 31% 59%
18% 45% 37%
19% 46% 34%
34% 48% 18%
100%
100%
100%
100%
100%
. .
According to the percentages' indicated w'ithin Table 52 (as compared to Table 40), as the number of violations increases to two or more occurrences, the use of no action decreases for all groups and the use of violation report with warrant increases in all violation groups. However, the use of documentation decreases for Groups I, II and III but increases for Groups IV and V.
The following percentage table (53) illustrates the dispositions officers in our Region IV sample would recommend when a violation report with warrant is used for violations committed more than twice .
-51-

•
•
TABLE 53 -: REGION IV
TY.~ of Disposition
PLACED IN PROBATION
VIOLATION CODES
DISPOSITION PROBATION PROBATION RESTI'l'UTrON COUNTY COMMUNITY STATE
Group I (most serious)
Group II
Group III
Group IV
Group V (least serious)
UNKNOWN TERMINATFll MODIFIED CEN'l'ER. JAIL CONTROL PRISON
5% 9% 2% 5% ·5%' 18% . 86%
7% 4% 7% 9% 21% 23% 28%
6% 6% 19% 30% 16% 6% 16%
10% 7% 2% 16% 25% 22% 18%
17% 7% 9% 7% 24% 15% 22% ..
The results. in Table 53 (as compared to Table 41) indicate that as the number of violations increases to more than two, the recommended use of sentencing to state prison increases for all violation groups. For Groups I, II and III the percentage of probation terminated recommendation remains the same. For Groups IV and V, the recommendations of probation terminated and probation modified increases. The recommendations of probation modified decrease for Group I, II and III. The recommended use of probation restitution centers decreases for all violation groups. The recommended use of county jails decreases for Groups I, II and III but increases for Groups IV and V. Finally, the recommended use of Community Control decreases for Group I, III, IV and V but increases for Group II.
Region V
The following percentage, table (54) represents the system responses that 272 officers in Region V report would be their recommended response to each violation group which is violated more than twice. These reported results are for Region V only.
-52-
100%
100%
100%
100%
100%
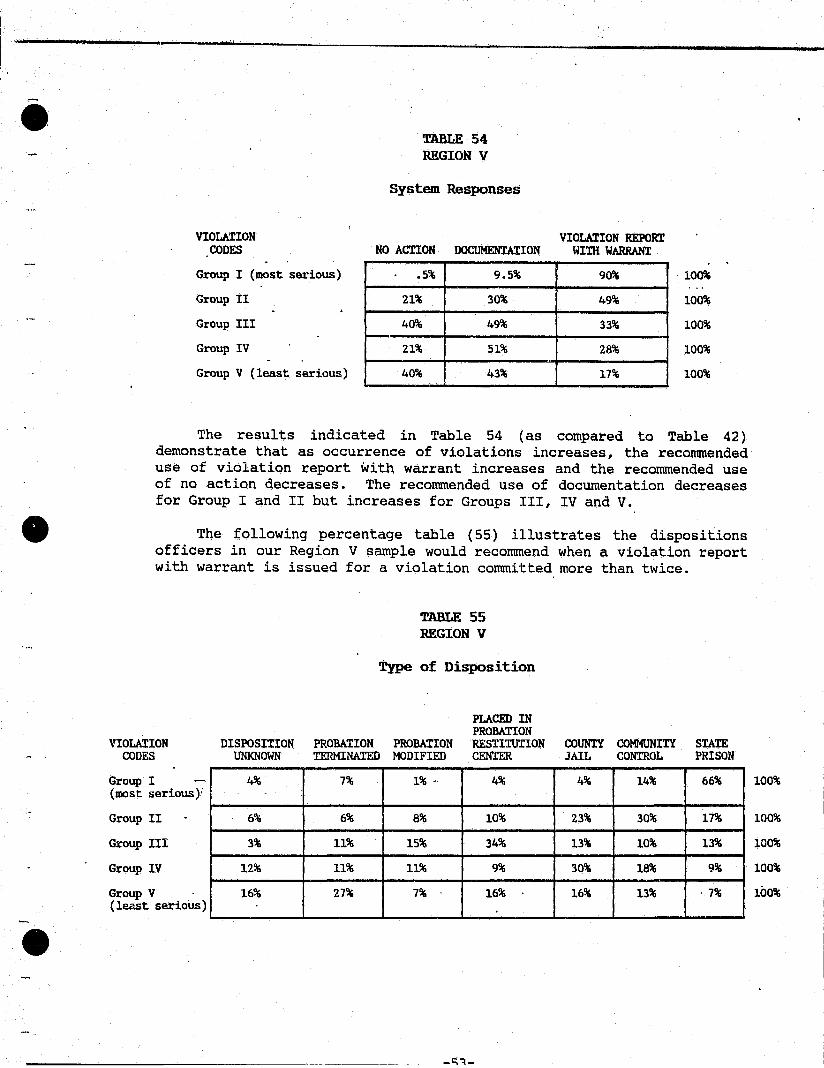
•
•
•
VIOLATION CODES
Group I (most serious)
Group I!
Group II!
Group IV
Group V (least serious)
TABLE 54 REGION V
System Responses
VIOLATION REPORT NO ACTION I>OC1lMENTA!ION WIm WARRANT
.5% 9.5% 90%
21% 30% 49%
40% 49% 33%
21% 51% 28%
40% 43% 17%
100%
100%
100%
100%
100%
The results indicated in Table 54 (as compared to Table 42) demonstrate that as occurrence of violations increases, the recommended use of violation report with warrant increases and the recommended use of no action decreases. The recommended use of documentation decreases for Group I and II but increases for Groups III, IV and V.
The following percentage table (55) illustrates the dispositions officers in our Region V sample would recommend when a violation report with warrant is issued for a violation committed more than twice.
VIOLATION CODES
Group I ~ (most serious):
Group I!
Group III
Group IV
Group V . (least serious)
TABLE 55 REGION V
Type of Disposition
PLACED IN PROBATION
DISPOSITION PROBATION PROBATION RESTITUTION COUNTY COMMUNITY STAXE UNKNOWN TERMINATED MODIFIED CENTER JAIL CONTROL PRISON
4% 7% 1% - 4% 4% 14% 66%
6% 6% 8% 10% 23% 30% 17%
3% 11% 15% 34% 13% 10% 13%
12% 11% 11% 9% 30% 18% 9%
16% 27% 7% 16% 16% 13% ·7%
100%
100%
100%
100%
100%
•
, ..
-.
The reported results indicated in Table 55 (as compared to Table 43) demonstrate that as occurrance of violations increases, the recommended use of state prison increases for all groups and the recommendations of probation terminated decrease for all violation groups. The recommendations of probation modified decrease for all violation groups except Group V. The recommended use of probation restitution centers decreases for violation Groups I and II, but increases for Groups III, IV and V. The recommended use of county jail decreases for Groups I and III, but increases for violation Groups II, IV and V. Finally, the recommended use of Community Control increases for all groups except Group I.
In conclusion, there are major differences between what an officer would recommend· the outcome of a case to be, and what the final disposition actually is, as demonstrated by the case reviews. This may be due to many factors. Also, the number of occurrences of a violation affects the recommendations of the officer. Most readily affected are those reported increased recommendations for sentencing to state prison.
QUESTIONS 10 AND 11
Disregarded due to confusion of the directions for completing the questionnaires.
QUESTION 12
Question number 12 of the officer questionnaire asks officers to indicate what the top five most important aspects of their job. Overall, the statewide average, taken from the 890 questionnaire responses~ shows the following top five choices (listed in order of importance) :
1) Enforce compliance of probation conditions. 2) Identify dangerous offenders and remove them from the
community. 3) Provide services to the Court. 4) Investigations. 5) Documentation.
The responses from each region were calculated in order to make comparisons between regions and between the statewide average and each region. The.following illustration demonstrate the top five choices for each region.
Region I
1. 2.
3. 4. 5.
Enforce compliance of probation conditions. Identify dangerous offenders and remove them from the community. Provide services to the court. Investigations. Documentation
-54-
•
"
•
Region II .'
1. Enforce compliance of probation conditions. 2. Identify dangerous offenders and remove them from the
community. 3. Provide services to the court. 4. Investigations. 5. Counseling
Region III
1. Enforce compliance of probation conditions. 2. Identify dangerous offenders and remove them from the
community. 3. Provide services to the court. 4. Investigations. 5. Documentation
Region IV
1. Enforce compliance of probation conditions. 2. Identify dangerous offenders and remove them from the
community. 3. Provide services to the court. 4. Investigations . 5. Documentation
Region V
1. Enforce compliance of probation conditions. 2. Identify dangerous offenders and remove them from the
community. 3. Investigations. 4. Provide services to the court. 5. Violation reports.
Note that Regions I, III and IV all list their priorities in the same order and agree with the statewide average responses. However, Region II differentiates by listing counseling as their number five choice. Region V differentiates by listing investigations before providing .service .to the court and Region V also lists violations reports as their number five choice.
Question 12 was also broke down by officer type, ( Supervisor, Probation .and Parole Officer I"Probation and Parole Officer II). It is noted that supervisors and Probation and Parole Officer II response, statewide, agree with the statewide averages, but Probation and Parole Officer I's list counseling as their fifth priority.
-55-
•
•
•
QUESTION 13
Question 13 of the probation officer questionnaire asks each officer to list what he or she believes to be the top three promoters of consistency in the re~ocation process. Overall, the statewide average, taken from the 890 questionnaire responses, indicates the following top three choices (listed in order):
1) JUdicial policies and procedures. 2) Department policies and procedures. 3) Officer training.
The responses from each region were calculated in order to make comparisons between regions and between the statewide average and each region. The following illus.tration demonstrates the top three choices for each region.
Region I
1. Judicial policies and procedures. 2. Department policies and procedures. 3. Officer training.
Reqion II
1. Judicial policies and procedures. 2. Department policies and procedures. 3. Officer training.
Region III
1. Judicial policies and procedures. 2. Department policies and procedures. 3. Circuit policies and pro~edures.
Reqion IV
1. Department policies and procedures. ~. Judicial policies and procedures. 3. Circuit policies and procedures.
Reqion V
1. Judicial policies and procedures. 2. Department policies and procedures. 3. Officer training.
Note that Regions I, II and Vall list their priorities in the sarne order and agree with statewide average responses. However, Region III
-56-
......
•
•
•
lists circuit policies as their third choice. Region IV lists Department policies .. first and, JUdicial policies second which is the opposite ordering of the statewide average. Region IV also lists Circuit policies as their third choice, which differentiates from the statewide average.
According to the breakdown of officer types, supervisors concur with the statewide average. Probation and Parole Officer I I s tied Circuit policies, state attorney and Officer training; all for their third choice. Probation and Parole Officer Ills listed Circuit policies for their third choice.
QUESTION 14
Question 14 of the probation officer questionnaire asks each officer to list what the top three promoters of inconsist£:ncy in the revocation process. Overall, the statewide average, taken from 890 questionnaire responses, indicates the following to three choices (listed in order):
1) Judicial policies and procedures. 2) Individual caseload 3} State Attorney
The responses from each region were calculated in order to make comparisons. between regions and between the statewide average and each region .. The following illustration demonstrates the top three choices for each region.
Region I
1. Individual caseload 2. Community pressure 3. State Attorney
Region IV
1. Judicial policy 2. State Attorney ,
Region II
1. Judicial Policy 2. State Attorney 3. Individual
caseload.
Region V
Region III
1. Individual caseload 2. Judicial policy 3. state Attorney
1. Judicial policy 2. Individual caseload
3'. Individual caseload 3. state Attorney
Every region, except Region I, listed Judicial policies and procedures, State Attorney and Individual caseload as the top three contributing factors of. inconsistency in the revocation process, but not necessarily in the same order for every region. Region I listed community .pressure instead of JUdicial policies and procedures as a contributing factor. There were no differences between supervisor, Probation and Parole Officer lis, and Probation and Parole Officer Ills; they all listed conditions that were the same as the overall state average.
-57-
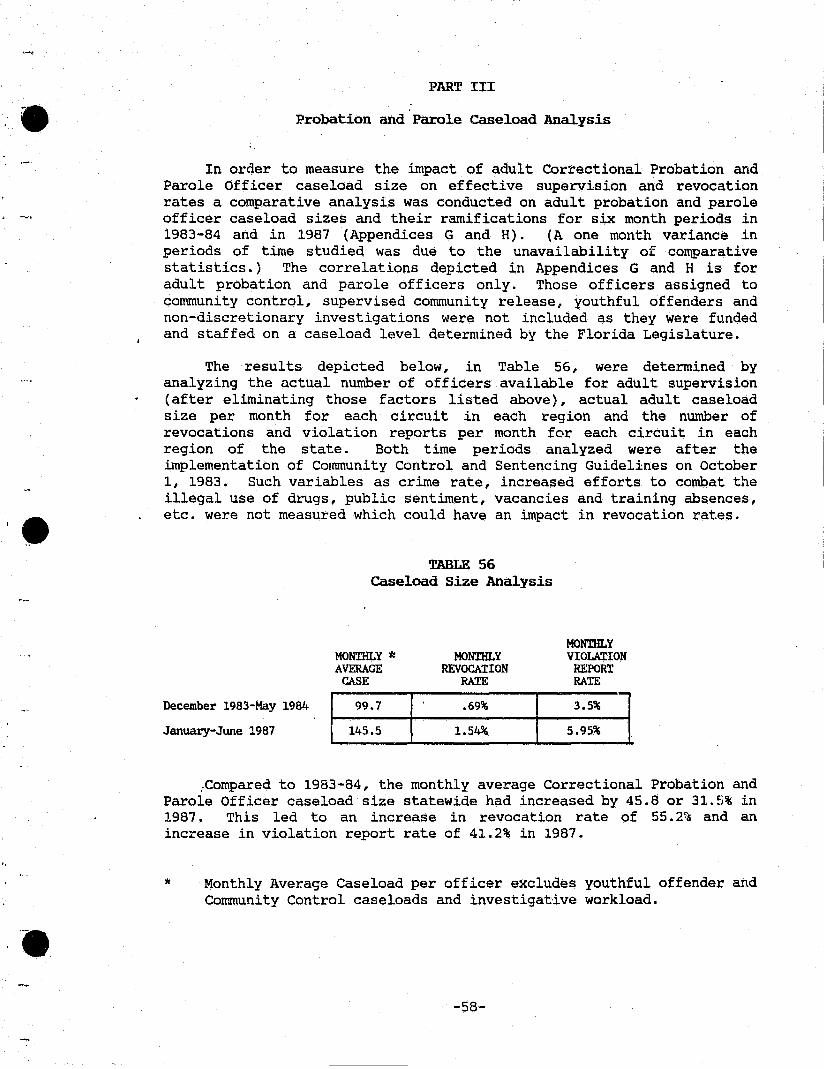
•
•
-.
PART III
Probation and Parole Caseload Analysis
In order to measure the impact of adult Correctional Probation and Parole Officer caseload size on effective supervision and revocation rates a comparative analysis was conducted on adult probation and parole officer case load sizes and their ramifications for six month periods in 1983-84 and in 1987 (Appendices G and H). (A one month variance in periods of time studied was due to the unavailability of comparative statistics. ) The correlations depicted in Appendices G and H is for adult probation and parole officers only. Those officers assigned to community control, supervised community release, youthful offenders and non-discretionary investigations were not included as they were funded and staffed on a caseload level determined by the Florida Legislature.
The results depicted below, in Table 56, were determined by analyzing the actual number of officers available for adult supervision (after eliminating those factors listed above), actual adult caseload size per month for each circuit in each region and the number of revocations and violation reports per month for each circuit in each region of the state. Both time periods analyzed were after the implementation of Community Control and Sentencing Guidelines on October 1, 1983. Such variables as crime rate, increased efforts to combat the illegal use of drugs, public sentiment, vacancies and training absences, etc. were not measured which could have an impact in revocation rates .
December 1983-Hay 1984
January-June 1987
TABLE 56 Caseload Size Analysis
MONTHLY 'I: AVERAGE
CASE
99.7
145.5
MONTHLY REVOCATION
RATE
.69%
1.54%
MONTHLY VIOLATION
REPORT RATE
3.5%
5.95%
:Compared to 1983-84, the monthly average Correctional Probation and Parole Officer caseload size statewide had increased by 45.8 or 31.5% in 1987. This led to an increase in revocation rate of 55. 2f~ and an increase in violation report rate of 41.2% in 1987.
* Monthly Average Caseload per officer excludes youthful offender and Community Control case loads and investigat1ve workload.
-58-
•
•
•
PART IV
Conclusions and Recommendations
The following conclusions and recommendations were derived from the date analysis by the In/Out Decision Making Grant Task Force:
Conclusions Based On case Reviews
1. The revocation process and system response is consistent statewide. It is believed that those few deviations from the norm are a result of variables that were not controlled for in the case reviews, i.e. prior record and prior violations.
2. Correctional Probation Officers (CPO) consistently and routinely notify the sentencing authority for Group I violations (the most serious violations).
3. Correctional Probation ,Officers routinely notify the sentencing authority for Group II violations. Circuit 15
,appears to have interpreted Group II violations as unauthorized moves and not actual absconding.
4.
5.
All 5 Circuits consistently utilize the system response of "No Action" for violation Groups IV and V .
Four of the 5 Circuits consistently utilize the system response of "No Action" for Group III violations.
6. ..The most consistent response statewide for all violations of probation with warrant is either probation terminated or probation modified (64% of the time) which are diversionary measures. (The category of probation terminated includes those who responded by indicating probation terminated or revoked which means either discharged from supervision and/or sentencing on a new/di~ferent charge.)
7. The system resplonse of "sentenced to a Probation Restitution Center" is not reported by any circuit at the time of the case reviews.
8. Numerically, the greatest system response overall (not by group) is "No Action." "No Action" as a system response decreases as the seriousness of the violation increases.
9. Only 4.5% of the time, when the disposition was known and a violation report with warrant is issued, is an offender sentenced to state prison for violating Group III (monetary matters) .
-59-

•
. -
•
•
10. In 74% of the time, when a violation is committed, the system response is either "No Action" or "Documentation" •
11. Of known dispositions, state prison is utilized in 17% of the cases,. county jail in 11% and Community Control in 8%. Therefore, overall probation diversionary measures are utilized more than had been anticipated. Incarceration is the last resort.
12. More offenders commit technical violations rather than new felonies. More than half of the technical violations are for monetary reasons.
13. Blacks are sentenced to state prison more often than whites.
14 .
Whites are sentenced to county jail more often than blacks. However, independent studies (Appendix I) support the hypothesis that when you control for prior offense then race is not a determining factor for incarceration.
Blacks and whites are treated equally for violations in violation Groups III, IV and V.
15. For a Group V violation, (the least serious type) the most harsh system response was "probation modified" ..
16. Sentencing data indicates that the Criminal Justice System is favorably biased towards females when they violate Groups I, II and III.
17. Seventy-four percent of offenders with violations are 35 years old or younger. Overall, these younger offenders commit the more serious violations.
18. of the 507 VOP with warrants, 352 or 69% were still awaiting .disposition at the time of the case reviews. This reflects a .backlog in the Criminal Justice System.
Conclusions Based On Questionnaires
1. Responses to the questionnaire indicate that as the number of times an offender commits a violation increases the more often a violation of probation with warrant is issued.
2. Officers recommend sentencing to Probation Restitution Centers, Community Control and State Prison more often than the case reviews showed this was actually done.
3. Responses indicate that the less experienced the officers, the fewer number of violation of probation with warrants were recommended. •
-60-
•
.<
•
•
4.
-----~---~
Responses indicate that officers would like to document violations more often than is actually being done. Larger caseloads appear to be preventing time for documentation.
5. Varying judicial policies and procedures are reported to be the major contributor to both consistency and inconsistency in the revocation process.
6. Region IV has the least experienced officers with the average number of years' experience statewide being 5 years.
7. The case reviews showed that the disposition of violations is not the same as officers said they would recormnend in the questionnaire.
1.
Conclusions of the Revocation Caseload Analysis
As officer caseload size increases the revocation rate and the violation report rate increases dramatically in each region statewide (see Appendix H). It is obvious as a result of the correlation between the increase in officer caseload sizes and revocation and violation report rates that the effectiveness of supervision is greatly diminished. When officer caseload size increased 31.5% in the sample time frames, the revocation rates and violation report rates increased a staggering 55.2% and 41.2% respectively.
Recaumendations
Administrative:
1. Change the revocation reporting system to identify the actual disposition of violation reports to create a more thorough tracking system.
2. Need to determine why:there was not a system response of ."Sentencing to Probation Restitution Center" in the case reviews.
3. Need to determine why Circuits 13, 17, 18 and 19 issue twice as many violation reports than all the other circuits.
4. Survey judiciary for attitudes using sample cases and a questionnaire.
-61-

•
"
41
'.
----------~~-~--
SUpervision:
1. study the classification system of offenders to determine if variables such as age need to be given more consideration.
2. Document in a separate section of the field sheet all violations.
3. Reduce adult probation and parole caseload levels to at least the size they were prior to the implementation of community control and sentencing guidelines in order to return to' more effective supervision and therefore lower revocation and violation report rates.
4. Further study of the impact of community control on adult probation and parole supervision caseloads.
s. Test and implement procedures for regulating officer action to technical violations other than monetary violations for systematic response. (Appendix J).
-62-
•
.'
SECTION III
•
•• -63-
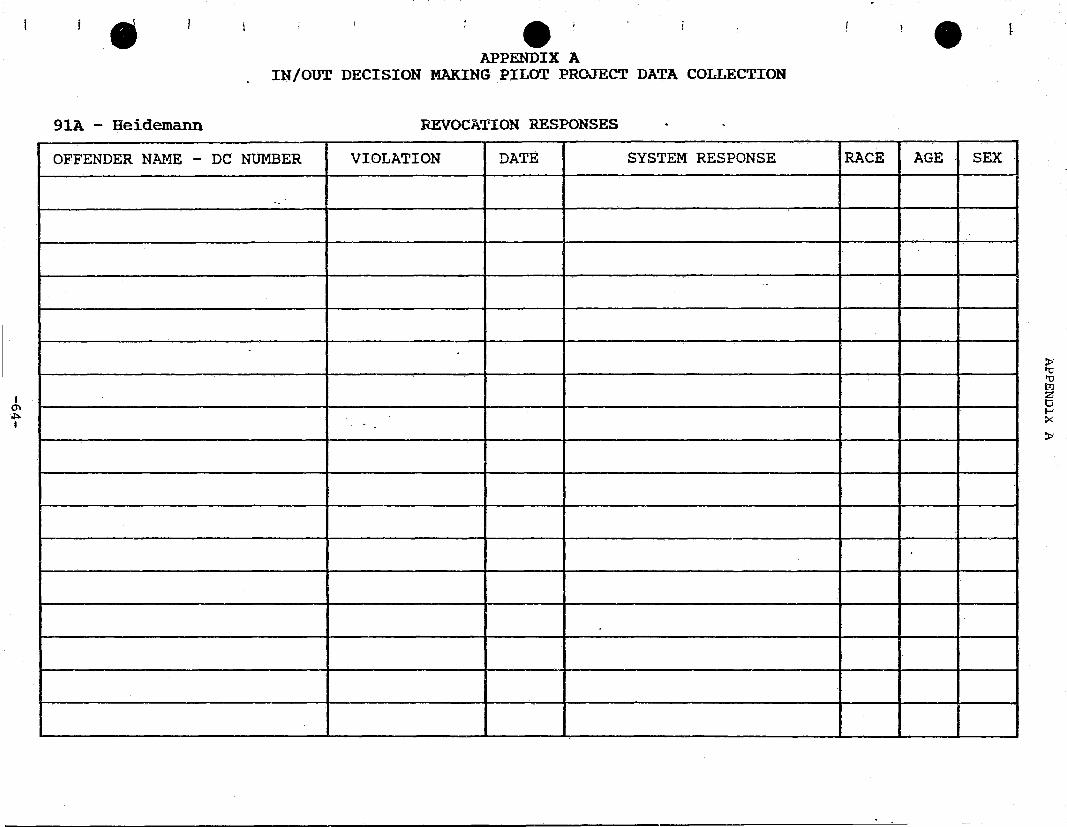
I 0"1 o!=Io I
• • APPENDIX A IN/OUT DECISION MAKING PILOT PROJECT DATA COLLECTION
91A - Heidemann REVOCATION RESPONSES
OFFENDER NAME - DC NUMBER VIOLATION DATE SYSTEM RESPONSE
00
• 0
• RACE AGE SEX
~
.
:P' '0 '"0 t%J Z o I-' >: :P'

•
"
•
•
01.
APPENDIX B
roDE SHEET FOR SYSTEM RESPONSES
NO ACTION TAKEN
no action/no response. filed late.
02. VERBAL WARNING/COUNSELING
03.
warned. verbal warning. telephoned. verbal instruction to begin hours. verbal instruction to complete hours. threatened with VOP. contacted to bring about compliance of conditions. reprimand. discussed problem. counseled case in office visit/warned in office. met and set up payment schedule. increase monthly monetary obligations. instructed to start paying restitution. instructed to catch up on payments. reminded of approaching restitution deadline. modified restitution to set specific restitution payment. counseled on written instruction concerning COS payment. cos waiver. counseled about no alcohol. warned, not allowed'~o drink. spoke to parents. talked with case, case's mother/relative. spoke with spouse. contacted employer. FDA. discussed reason for leaving work, instructed to immediately search for job. changed residence. living with boyfriend, boyfriend moved. l~ving with girlfriend, instructed to change address.
WRITTEN REPRIMAND
advised by delinquent obligation letter. letter of reprimand. letter sent to case. written instruction to complete. written instruction to pay.
-65-
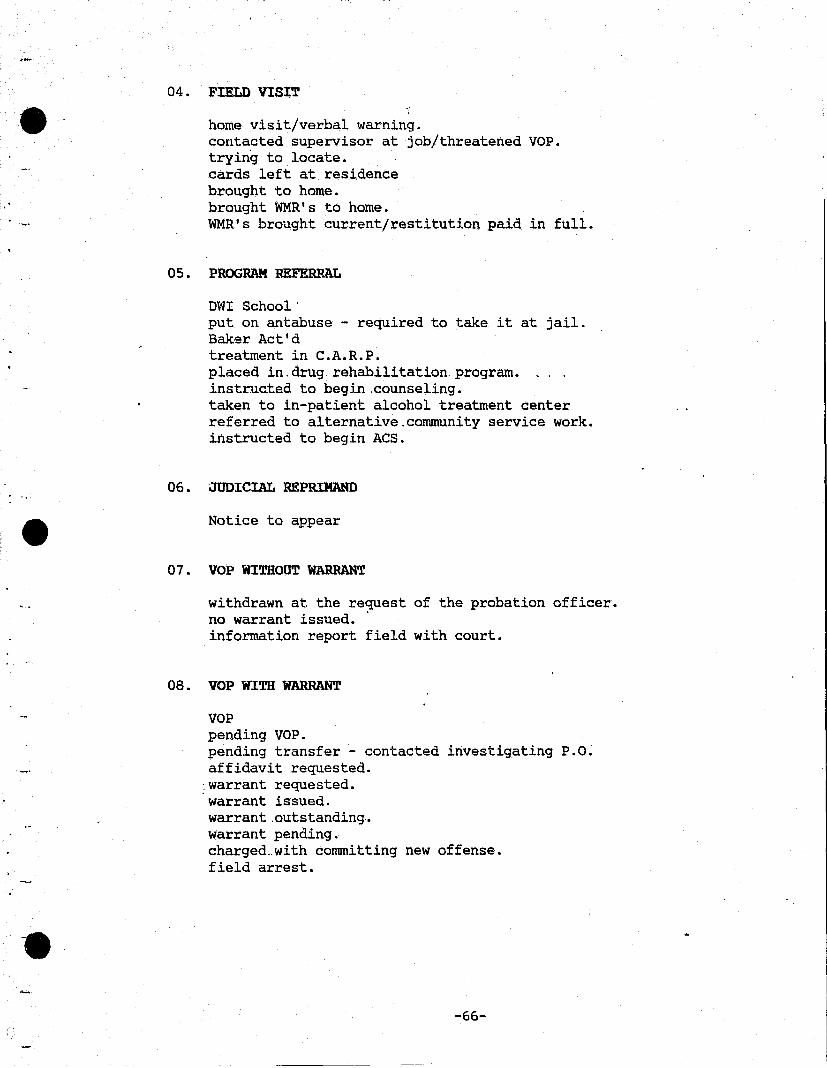
•
•
, .
• ..... ,
04 •
05.
06.
07.
FIELD VISJ;T
home visit/verbal warning. contacted supervisor at job/threatened VOP. trying to locate. cards left at residence brought to home. brought WMR's to home. WMR's brought current/restitution paid in full.
PROGRAM REFERRAL
mu School: put on antabuse - required to take it at jail. Bak,er Act' d treatment in e.A.R.p. placed in.drug rehabilitation. program. instructed to begin.counseling. taken to in-patient alcohol treatment center referred to alternative.community service work. instructed to begin ACS.
JUDICIAL REPRIMAND
Notice to appear
VOP WITHOUT WARRANT
withdrawn at. the request of the probation officer. no warrant issued. . information report field with court.
08. VOP WITH WARRANT
VOP pending VOP. pending transfer - contacted investigating P.o. affidavit requested.
:warrant requested. 'warrant issued. warrant.outstanding. warrant pending. charged .. with committing new offense. field arrest.
-66-

09 .
•
•
•
VOP & DISPOSITION
a. Probation reinstated, no change. b. Probation revoked. c. Revoked, placed in state Prison for any length of time. d. Revoked, placed in County Jail. e. Place on Community Control. f. Supervision extended. g. Supervision modified. h. Monetary fine. L Revoked by parole commission. j. Reviewed by parole commission. k. Supervision terminated. 1. VOP dismissed m. Place in a Probation Restitution Center. n. No official action •
-67-
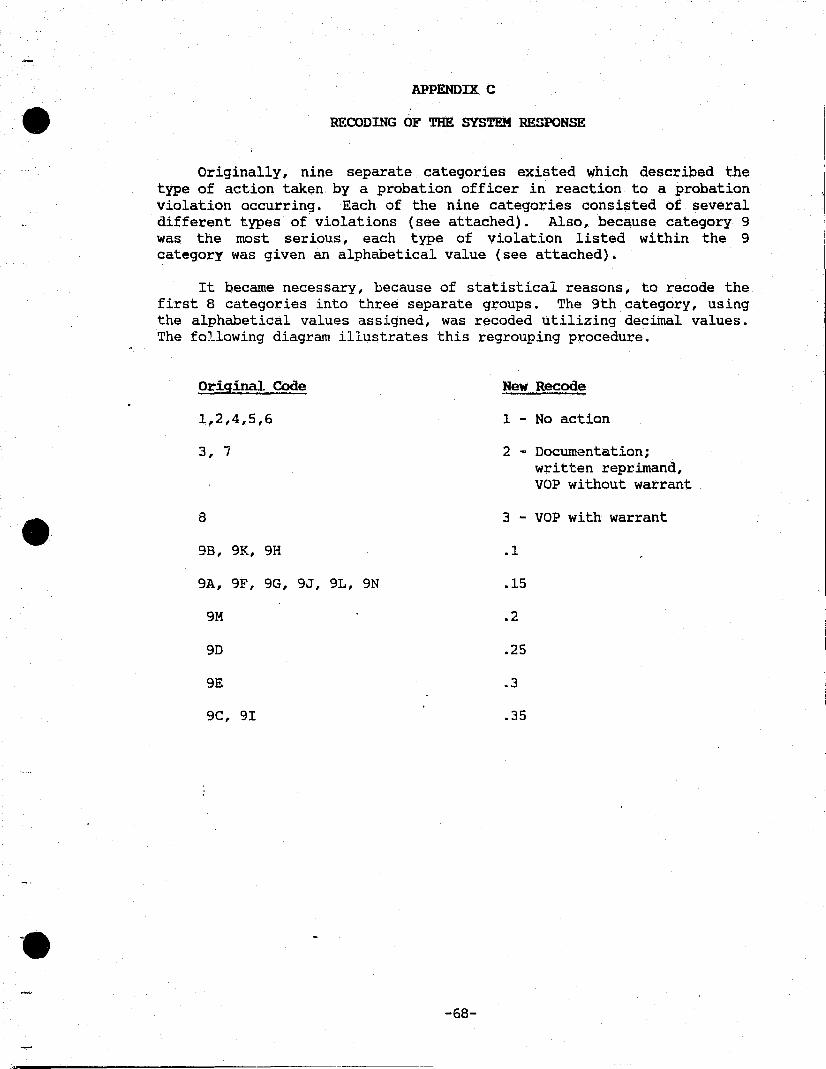
'.
•
•
APPENDIX C
RECODING OF THE SYSTEM RESPONSE
Originally, nine separate categories existed which described the type of action taken by a probation officer in reaction to a probation violation occurring. Each of the nine categories consisted of several different types of violations (see attached). Also, because category 9 was the most serious, each type of violation listed within the 9 category was given an alphabetical value (see attached).
It became necessary, because of statistical reasons, to recode the first 8 categories into three separate groups. The 9th category, using the alphabetical values assigned, was recoded utilizing decimal values. The following diagram illustrates this regrouping procedure.
Original Code
1,2,4,5,6
3, 7
8
9B, 9K, 9H
9A, 9F, 9G, 9J,
9M
9D
9E
ge, 9I
9L, 9N
-68-
New Recode
1 - No action
2 - Documentation; written repr.imand, VOP without warrant
3 - VOP with warrant
.1
.15
.2
.25
.3
.35
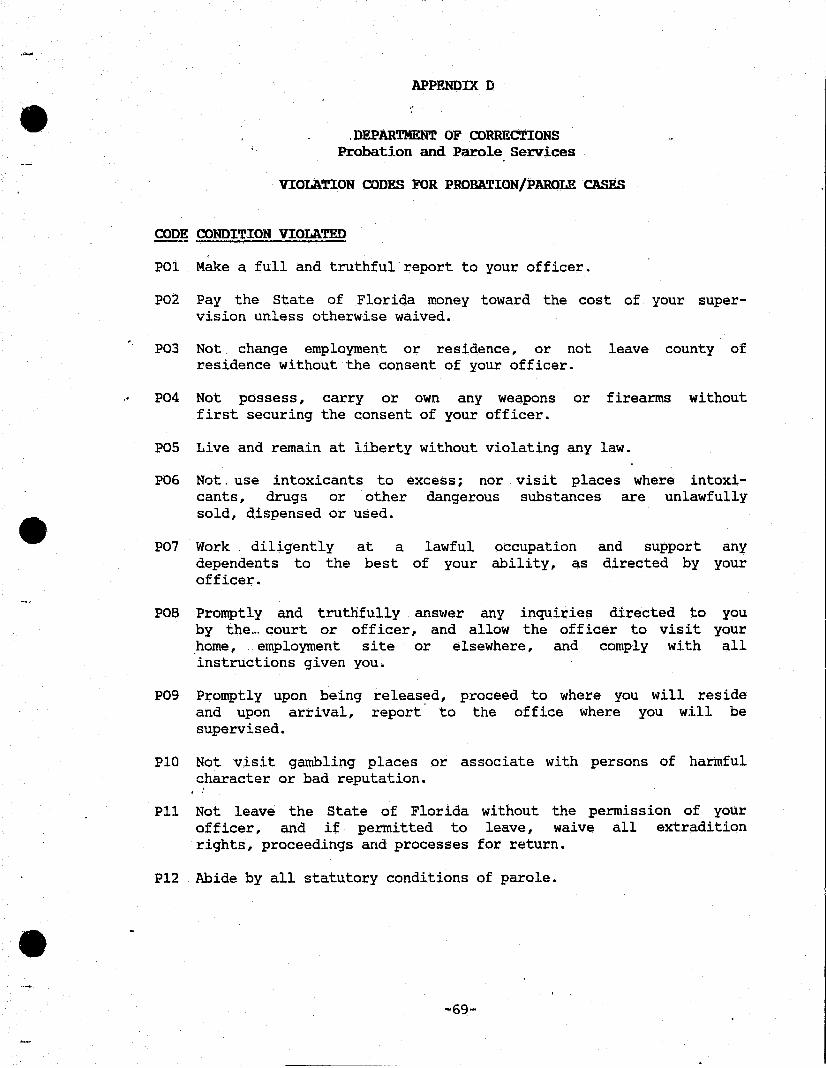
•
•
•
"
APPF.NDIX D
,DEPARTMENT OF CORRECTIONS Probation and Parole Services
VIOLATION CODES FOR PROBATION/PAROLE CASES
CODE CONDITION VIOLATED
POl Make a full and truthful report to your officer.
P02 Pay the state of Florida money toward the cost of your supervision unless otherwise waived.
P03 Not change employment or residence, or not leave county of residence without the consent of your officer.
,- P04 Not possess, carry or own any weapons or firearms without first securing the consent of your officer.
POS Live and remain at liberty without violating any law.
P06
P07
Not. use intoxicants to excess; nor visit places where intoxicants, drugs or other dangerous substances are unlawfully sold, dispensed or used.
Work diligently at a lawful occupation dependents to the best of your ability, as officer.
and support any directed by your
POB Promptly and truthfully answer any inquiries directed to you by the_ court or officer, and allow the officer to visit your .home, employment site or elsewhere, and comply with all instructions given you.
P09 Promptly upon being released, proceed to where you will reside and upon arrival, report' to the office where you will be supervised.
PlO Not visit gambling places or associate with persons of harmful Gharacter or bad reputation.
Pll Not leave the state of Florida without the permission of your officer, and if permitted to leave I waive all extradition rights, proceedings and processes for return.
P12 Abide by all statutory conditions of parole.
-69-

•
. '
•
•
P13 Make restitution and other financial obligations, other than Cost of Supervision .
P14 Participate in self-improvement programs as determined by the court. '
P1S Complete public service hours as determined by the court.
P16 Not have contact or attempt to make contact with the victim.
P17 Other conditions not generally stated above •
-70-
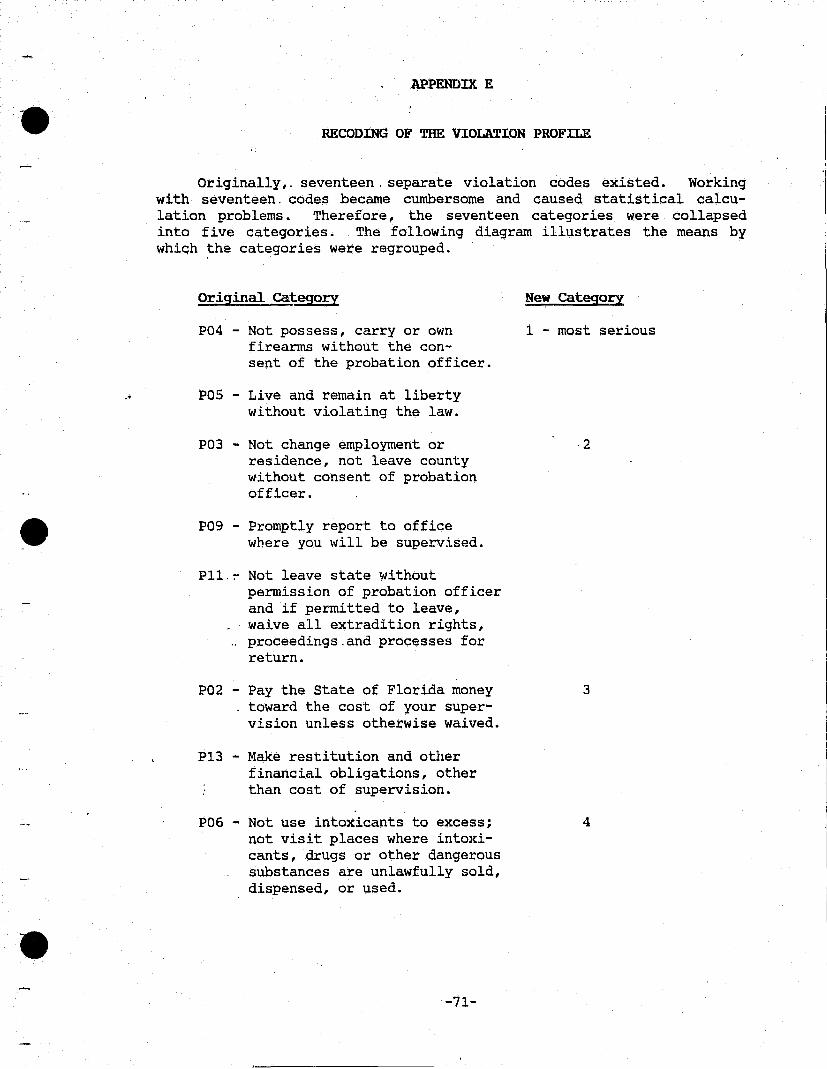
•
..
•
•
APPENDIX E
RECODING OF THE VIOLATION PROFILE
Originally,. seventeen. separate violation codes existed. Working with seventeen. codes became cumbersome and caused statistical calculation problems. Therefore, the seventeen categories were collapsed into five categories. ,The following diagram illustrates the means by whiqh the categories were regrouped.
Original categOry
P04 - Not possess, carry or own firearms without the consent of the probation officer.
POS - Live and remain at liberty without violating the law.
P03 - Not change employment or residence, not leave county without consent of probation officer.
P09 - Promptly report to office where you will be supervised.
P11,~ Not leave state without permission of probation officer and if permitted to leave, waive all extradition rights,
.. proceedings.and processes for return.
P02 - Pay the state of Florida money toward the cost of your supervision unless otherwise waived.
P13 - Make restitution and other financial obligations, other than cost of supervision.
POG - Not use intoxicants to excess; not visit places where into~dcants, drugs or other dangerous substances are unlawfully sold, dispensed, or used.
-71-
New categOry
1 - most serious
·2
3
4

•
.'
•
•
P14 - Participate in self-improvement programs as determi~ed by the court.
P15.- Complete public service hours as determined by the court.
P16 - Not have contact or attempt to make contact with the victim.
POl Make .a.full and truthful report to your officer.
P07 - Work .diligently at a lawful occupation and support any dependents to the best of your ability, as directed by your probation officer.
P08.- Promptly and truthfully answer any inquiries directed to you by the court or officer, and allow the officer to visit your home, employment site or elsewhere, and comply with all instructions given you •
P10 - Not visit gambling places or associate with persons of harmful character or bad reputation.
P12 - Abide by all statutory conditions of parole.
P17 - other conditions not generally stated above .
-72-
5 - least serious

'.
•
•
1. Region
2. Circuit
APPENDIX F
IN/OUT DECISION MAKING GRANT OFFICER QUESTIONNAIRE
Adult Probation SUpervision Only (Not for Community Control)
3. What is your position? Check one:
,-Supervisor Probation & Parole Officer I Probation & Parole Office II
4. Years of Experience in Probation & Parole.
5 • Caseload size for January, 1987.
6. Number of violation reports last month:
7. As of last recap, list the number of investigations completed last month:
Pre Sentence Investigation Post Sentence Investigation Pre Parole Investigation Work Release Investigation Other State Investigation R.O.R. Investigation Security Investigation
8. General" response to condition violated:
A. ,On the chart below, check the action (column 1-8) you would take for each.condition violated when violated on one or two occasions. (Check only one)
-73-

;0'-"
•
•
•
B.
A. B. c .. D. E. F. G. H. I. J. K. L. M. N .
. '
If you checked either VOP Without Warrant or VOP With Warrant, then place the letter of the disposition you would recommend in the recommendation column (column 9). . Choose one only from the following list:
Supervision reinstated, no change. Probation revoked Revoked, placed in State Prison for any length of time. Revoked, placed in county jail. Placed on Community Control. Supe~ision extended. Supervision modified. Monetary fine. Revoked by Parole Commission. Reviewed by Parole Commission. Supervision terminated. VOP dismissed. Placed in a Probation Restitution Center. No official action.
9. General Response to condition violated:
A. On the chart below, check the action (column 1-8) you wduld take for each condition violated when violated three or more times. (Check only one)
B. If you checked either VOP without Warrant or VOP with Warrant, then place the letter of the disposition you would recommend in the recommendation column (column 9). Choose one only from the following list:
A. Supervision reinstated,' no change. B. Probation revoked. C. Revoked, placed in State Prison for any length of time. D. Revoked, placed in county jail. E. Placed on Community Control. F. Supervision extended. G. Supervision modified. H. Monetary fine. I. Revoked by Parole Commission. J •. Reviewed by Parole Commission. K. .supervision terminated. L. .VOP dismissed. M. Placed in a Probation Restitution Center. N. No official action .
-74-

•
•
•
10. List by code what you consider to be the five conditions of supervision most serious if violated and the number of occurrences necessary to warrant a violation report being written.
Code i of Occurrences --
11. List by code what you consider to be the five conditions of supervision least serious if violated and the number of occurrences necessary to warrant a violation
·'report being written.
Code i of Occurrences
12. From this list, rank in order what you believe should be the five most important aspects of your job. (With 1 the most important and 5 the least).
____ Providing services to the Court Public Relations Documentation Monetary collections
____ Investigations Training officers
---- Drug/Alcohol recognition & treatment :::: Enforce compliance of probation conditions
Violations reports ___ Counseling ____ Referral to Progr~"s (STP) ____ "Identifying dangerous offenders & removing them from the Community
(public protection). ____ Aiding law enforcement .
-75-
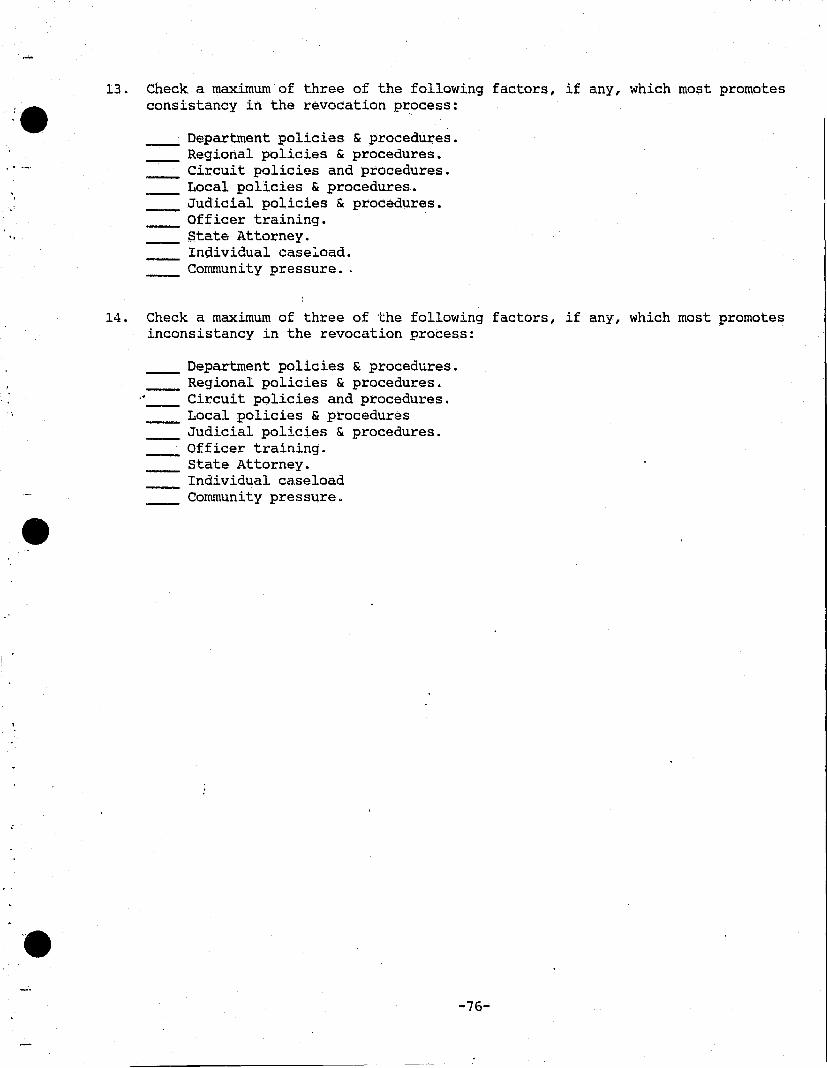
"
"
•
13. Check a maximum of three of the following factors, if any, which most promotes consistancy in the revocation process:
14.
. '
Department policies & procedures. Regional policies & procedures. Circuit policies and procedures. Local policies & procedures. Judicial policies & procedures.
____ Officer training. state Attorney. Inqividual caseioad. Community pressure.
Check a maximum of three of the following factors, if any, which most promotes inconsistancy in the revocation process:
____ Department policies & procedures. Regional policies & procedures. Circuit policies and procedures • Local policies & procedures Judicial policies & procedures.
____ Officer training. state Attorney. Individual ca.seload Community pressure .
-76-
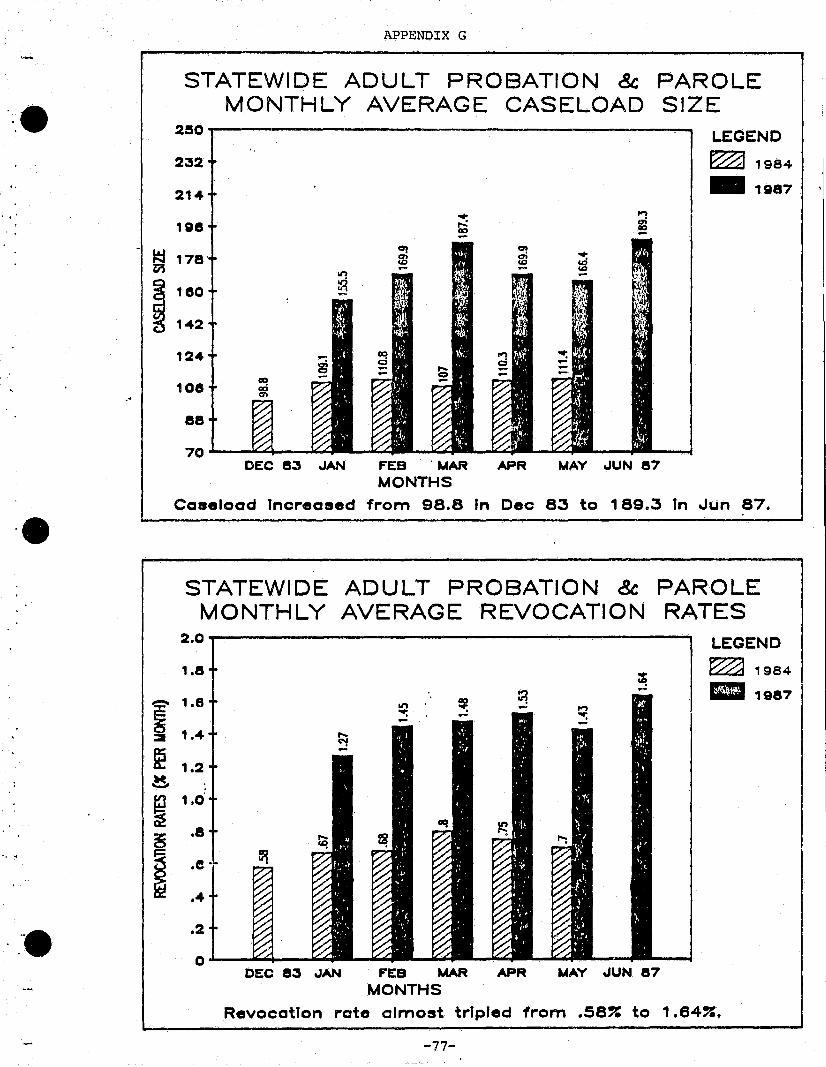
.-
'.
APPENDIX G
STATEWIDE ADULT PROBATION & PAROLE MONTHLY AVERAGE CASELOAD SIZE
2eo l.EGEND
232 ~ 1984
2141- "1$187 ,..,
1ge .,; Gel
'''-
~ 178 in
1'80
142
~ ::I
~ ~
~ ~
I
124
10e
88
70 DEC 83 JAN FEB . MAR APR MAY JUN 87
MONTHS
Caseload Tncreased from 98.8 Tn Cec 83 to 189.3 Tn Jun 87.
STATEWIDE ADULT PROBATION & PAROLE MONTHLY AVERAGE REVOCATION RATES
2.0 LEGEND
1.8 ~
~ 1984 ~
l1li1987 1.8
1.41-
1.2
1.0'
.8
.e
.4
.2
0 DEC 83 JAN FEB MAR APR MAY JUN. 87
MONTHS
RevocatIon rate almost trIpled from .58" to 1.64".
-77-

• .- CIRCUIT
AND RF..GION
Pensacola
Tal laha.<; see
Panama City
ImiION I
Lake City
Jacksonville
Daytona Beach
Gainesville.
R!GION II
Tavares
Orlando
Sanford -
ImiION III
Miami
West Palm Bch.
Key West
Ft. Lauderdale
Ft. Pierce
RmION IV
Clearwater
Bartow
Sarasota
Tampa
Ft. Myers
R!GIOR V
S'L\'.tKWIIlK
DEPARIMENT OF CORRECTIONS
Probation and Parole Services Monthly Average Circuit Adult Probation & Parole case load and Revocation Statistics 1
December 1983 - May 1984
Monthly 4 Average Monthly Monthly 5 Monthly caseload Average Average Revocation
Officers 2 caseload 3 Per Officer Revocations VOP's Rate
27.4 2943.3 107.4 18.5 121.8 .62%
13.7 1448.2 105.7 10.3 44.8 .71%
5.2 951.3 182.9 7.5 37.8 .78%
15.4 1780.9 115.6 12.1 68.1 .67%
6 764.7 127.5 6.8 22 .88%
44.3 3586.3 81 32 161.3 .89%
12.3 1697.3 138 8.2 51.8 .48%
8.9 949.5 106.7 9.3 53.2 .97%
17.9 1749.5 97.7 14.1 72.1 .8%
17,1. 2076 119.3 10.5 64.5 .5%
43.1, 3586.2 83.2 25 99.7 .69%
24.5 2521.2 102.9 15.8 76.3 .62%
28.5 2727.8 96.4 17 .1 80.2 .62%
78.4 7925 101.1 59.8 290.2 .75%
36.8 3428.2 93.2 25.8 115.5 .75%
6 480.2 80 2.2 16.7 .45%
65.9 7018.2 106.5 33.3 198.3 .47%
11.1 1081 97.4 12.2 57.7 1.1%
39.6 3986.5 100.7. 26.7 135.7 .66%
54.6 5567.5 102 35.7 208.2 .64%
24.9 2477.7 99.5 15.3 76.7 .61%
19.1 1985 •. 3 103.9 12.8 81.8 .64%
63.6 5336.2 83.9 48.8 193.7 .91%
13.7 1609 117.4 7.3 56.5 .45%
35.2 3395.1 96.5 24 123.4 .7%
28.8 2871.6 99.7 19.85 101.4 .69%
1. Excludes Youthful Offender & Community Control case loads and investigative workload. 2. Monthly average of officers available to supervise adult probationers and parolees after investigative
workload is covered. Vacancies and absences for basic training are not factored out. e 3. Total monthly average case load during 6 month period. 4. Monthly average case load per available officer. 5. VOP = Violation of Probation Report.
-78-
._- .. -,
Lv VOP Rate
4.1%
3.1%
4%
3.8%
2.9%
4.5%
3.1%
5.6%
4.1%
3.1%
2.8%
3%
2.9%
3.7%
3.4%
3.5%
2.8%
5.3%
3.4%
3.7%
3.1%
4.1%
3.6%
3.5%
3.6%
3.5%
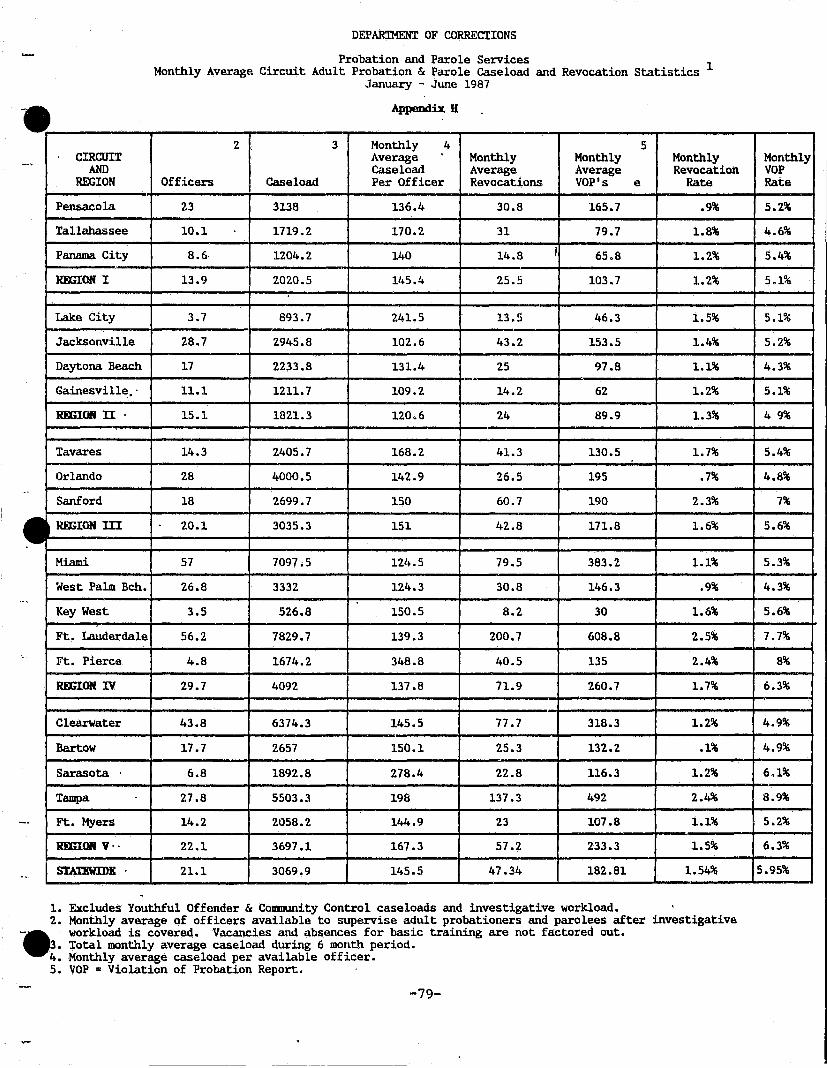
-"0
"-
...
_.
...
CIRCUIT AND
REGION
Pensacola
Tallahassee
Panama City
RmIOH I
Lake City
Jacksonville
Daytona Beach
Gainesville •.
REGION n
Tavares
Orlando
Sanford
RmIOH In
Miami
West Palm Bch.
Key West
Ft. Lauderdale
Ft. Pierce
REGION IV
Clearwater
Bartow
Sarasota
Tampa
Ft. Myers
RmIOff Vo.
stAnWIDE .
DEPARn!ENT OF CORRECTIONS
Probation and Parole Services Monthly Average Circuit Adult Probation & Parole Caseload and Revocation Statistics 1
January - June 1987
Append' H 1%
2 3 Monthly 4 5 Average Monthly Monthly Monthly Caseload Average Average Revocation
Officers Caseload Per Officer Revocations VOP's e Rate
23 3138 136.4 30.8 165.7 .9%
10.1 1719.2 170.2 31 79.7 1.8%
8.6 1204.2 140 14.8 I 65.8 1.2%
13.9 2020.5 145.4 25.5 103.7 1.2%
3.7 893.7 241.5 13.5 46.3 1.5%
28.7 2945.8 102.6 43.2 153.5 1.4%
17 22;33.8 131.4 25 97.8 1.1%
11.1 1211.7 109.2 14.2 62 1.2%
15.1 1821.3 120.6 24 89.9 1.3%
14.3 2405.7 168.2 41.3 130.5 1.7%
28 4000.5 142.9 26.5 195 .7%
18 2699.7 150 60.7 190 2.3%
20.1 3035.3 151 42.8 171.8 1.6%
57 7097,5 124.5 79.5 383.2 1.1%
26.8 3332 124.3 30.8 146.3 .9%
3.5 526.8 150.5 8.2 30 1.6%
56.2 7829.7 139.3 200.7 608.8 2.5%
4.8 1674.2 348.8 40.5 135 2.4%
29.7 4092 137.8 71.9 260.7 1.7%
43.8 6374.3 145.5 77.7 318.3 1.2%
17.7 2657 150.1 25.3 132.2 .1%
6.8 1892.8 278.4 22.8 116.3 1.2%
27.8 5503.3 198 137.3 492 2.4%
14.2 2058.2 144.9 23 107.8 1.1%
22.1 3697.1 167.3 57.2 233.3 1.5%
21.1 3069.9 145.5 47.34 182.81 1.54%
1. Excludes Youthful Offender & Community Control case loads and investigative workload. 2. Monthly average of officers available to supervise adult probationers and parolees after investigative
-. workload is covered. Vacancies and absences for basic training are not factored out. 3. Total monthly average case load during 6 month period. 4. Monthly average caseload per available officer. 5. VOP = Violation of Probation Report.
-79-
----------
Monthly VOP Rate
5.2%
4.6%
5.4%
5.1%
5.1%
5.2%
4.3%
5.1%
4 9%
5.4%
4.8%
7%
5.6%
5.3%
4.3%
5.6%
7.7%
8%
6.3%
4.9%
4.9%
6.1%
8.9%
5.2%
6.3%
5.95%

••
•
•
APPENDIX J
DEPARTMENT OF CORRECTIONS Probation and Parole Services
TECHNICAL VIOLATION PROCEDURES (Other Than Monetary)
A graduated scale of mandatory and optional procedures was designed to be utilized as a framework for uniformity in an effort to standardize and develop a more effective system of procedures and guidelines. This scale will be used for regulating technical violations other than monetary violations. However, this is not intended to replace the skillful and professional judgement of the officer or the supervisor.
The officer should fully investigate each technical violation to determine if it was an emergency or other justifiable
··circumstances. If the violation was justified, then it may be handled by the officer. The local courts, at their discretion, may exclude all options and mandate that a violation report be submitted on the first technical violation.
A. First Violation (within last 3 months)
1. Mandatory ~rocedures
a. Issue a verbal warning at next contact.
b. Make written documentation of the violation on the field sheet in ~he violation section.
2. Optional Procedures
a. Issue a written warning to the offender via letter and addressing the violation and detailing date and time.
b. Increase risk classification if the offender is in medium or minimum classification~
c. If in maximum classification, increase personal contact by one for the next month.
d. File a violation report with the court recommending probation continuation or modification •
. e. File an Affidavit and a violF.l.tton report with the court charging violation of adult probation or parole and requesting a war~ant for their arrest •
-80-

•
•
••
B. Second Violation
. '
1. Mandatory Procedure
a. Immeaiate verbal warning by personal contact.
b. Make written documentation of the violation on the field sheet in the violation section.
c. Follow up with a written warning addressing. the violation and detailing date and time of the violation.
2. Optional Procedures
a. Issue a citation notice immediately to the offender detailing the date and time of the violation and instructing the offender that in the event of a reoccurrence an Affidavit will be filed with the court charging violation of adult probation or parole, and requesting a warrant for their arrest .
b. Documented joint meeting with the offender, probation and parole officer and the officers supervisor explaining the seriousness of the violation.
c. Increase risk classification if the o:fender in medium or minimum classification .
d. If the offender is in maximurr, classification increase personal contact by one for the next month.
e. File a violation ~eport with the court recommending probation continuation or modification.
f. File an Affidavit and a violation report with the court charging violation of adult probation or parole and requesting a warrant for their arrest.
C. Third Violation
1. Mandatory Proced¥res
a. : Issue· a Citation Notice immediately to the offender detailing the date and time of the violation and instructing the offender that in the event of a reoccurrrence an Affidavit will be file with the court charging violation of adult probation or parole and requesting a warrant for their arrest.
b. Mandatory staffing with supervisor explaining the seriousness of the violation •
-81-

•
•
•
.-
c.
.d.
Make written documentation of the violation on the field sheet in the violation section .
Increase risk classification if the offender is in medium or minimum classification •
. e. If the. offender is in maximum classification increase personal contact by one for the next month.
2. Optional Procedures
.. a. File a violation report with the court recommending either probation continued or modification.
b. File an Affidavit and a violation report with the court charging violation of adult probation or parole and requesting a warrant for their arrest.
. c. Documented joint meeting with the offender, Probation and Parole Officer and officers supervisor explaining the seriousness of the violation.
D. Fourth Violation
1. Mandatory Procedure
.. a. File an Affidavit and a violation report with the court charging violation of adult probation or parole and requesting a warrant for their arrest .
-82-
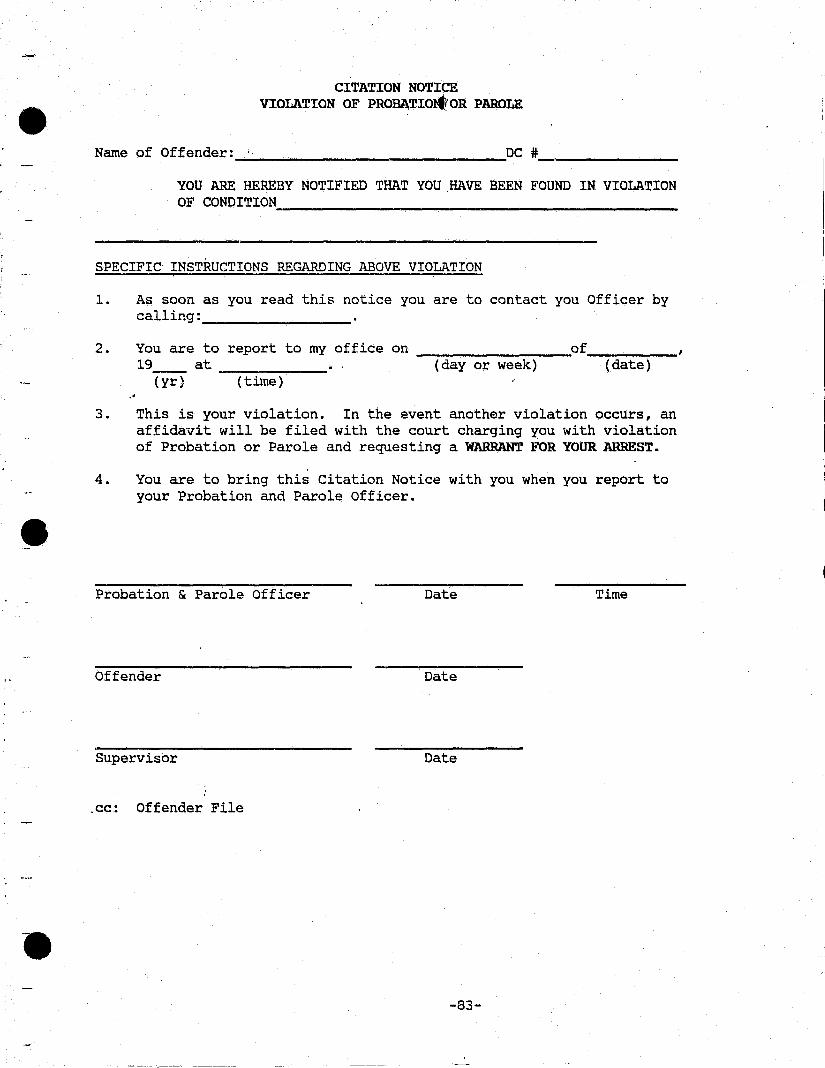
•
•
•
CITATION NOTICE VIOLATION OF PROBA,TIOtfiOR PAROLE
Name of Offender: ________________ DC #_, ______ _
YOU ARE HEREBY NOTIFIED THAT YOU .HAVE BEEN FOUND IN VIOLATION OF CONDITION __________________________________________ __
SPECIFIC INSTRUCTIONS REGARDING ABOVE VIOLATION
1. As soon as you read this notice you are to contact you Officer by calling: _________ ~------
2. You are to report to my office on of --~------~--- --~----19_ at ______ (day or week) (date)
(yr) (time) .<
3. This is your violation. In the event another violation occurs, an affidavit will be filed with the court charging you with violation of Probation or Parole and requesting a WARRANT FOR YOUR ARREST.
4. You are to bring this Citation Notice with you when you report to your Probation and Parole Officer .
Probation & Parole officer Date Time
Offender Date
Supervisor Date
.cc: Offender File
-83-