Embed Size (px)
Citation preview

1

2
© Government of the Republic of Kenya

3
© Government of the Republic of Kenya

ACRONYMS vGLOSSARY viFOREWORD xACKNOWLEDGEMENT xiiINTRODUCTION xiv
PART ONE:THE BIG FOUR PROJECTS MONITORING 15Food security and Nutrition 17Manufacturing 18Universal Health Coverage 19Affordable Housing 20
PART II: OUTCOME INDICATORS 57MACROECONOMIC FRAMEWORK 59FOUNDATIONS FOR NATIONAL TRANSFORMATION/ENABLERS PILLAR: Deploying world classinfrastructure facilitiesand services 60Sector: Infrastructure 10Sector: Information and Communication Technology 12Sector : Science,Technology and Innovation 13Sector: Land Reforms 14Sector: Public Sector Reforms 14Sector : Labour and Employment 14Sector: National Values and Ethics 16
Sector: Ending Drought Emergencies 16Sector : Security, Peace Building and Conflict Resolution 17
ECONOMIC PILLAR; Moving the Economy up the Value Chain 19Sector: Agriculture and Livestock 19Sector: Manufacturing 19Sector: Tourism 20Sector: Blue Economy 20Sector: Trade 20Sector: Financial Services 21Sector: Business Process Outsourcing 21Sector: Oil, Gas and Minerals 22
SOCIAL PILLAR: Investing in the people of Kenya 23Sector: Education and Training 23Sector: Health 25Sector: Environment, Water and Sanitation 27Sector: Gender, Youth and Vulnerable Groups 30Sector: Population, Urbanization and Housing 31Sector: Sports, Culture and Arts 32POLITICAL PILLAR: Moving to the future as One Nation 32
Sector: Devolution 32Sector: GJLOS 33
PART III FLAGSHIP/PRIORITY PROJECTS 37MACROECONOMIC FRAMEWORK 37Statistical Reforms 37FOUNDATIONS FOR NATIONAL TRANSFORMATION/ENABLERS PILLAR; Deploying world class infrastructure facilities and services 37Sub-Sector: Roads 37Sub-Sector: Railway 38Sub-Sector: LAPSSET 38Sub-Sector: Aviation 38Sub-Sector: Maritime 39Sub-Sector: Energy 39Sector: Information and Communication Technology 40Sector: Science Technology and Innovation 41Sector: Land Reforms 42Sector: Public Sector Reforms 42Sector: Labour and Employment 42Sector: Ending Drought Emergencies 43Sector: Security, Peace Building andConflict Resolution 43ECONOMIC PILLAR; Moving the Economy up the Value Chain 43Sector: Tourism 43
CONTENTS
Sector: Trade 45Sector: Financial Services 45Sector: Business Process Outsourcing 45Sector: Oil, Gas and Minerals 45Sector-Blue Economy 46SOCIAL PILLAR: Investing in the people of Kenya 46Sector: Health 46Sector: Population, Urbanization and Housing 48Sector: Education and Training 49Sector: Environment, water and sanitation 50Sector: Gender, Youth and Vulnerable Groups 52Sector: Sports, Arts and Culture 55POLITICAL PILLAR: Moving to the future as One Nation 56Sector: Governance and Rule of Law 56PART IV: CLIMATE CHANGE, DISASTER RISK MANAGEMENT AND HIV/AIDS 58THEMATIC AREA: 58Climate Change 58Disaster Risk Management 91HIV/AIDS 93
Photo CreditsCover:The presidency; KENHA; Make in Kenya

ABMT : Appropriate Building Materials and Technologies
ACE : Enrolment in adult and continuing education
ADAK : Anti-Doping Agency of Kenya
ADP : Annual Development Plan
ADR : Alternative Dispute Resolution
AG : Attorney
AGPO : Access to Government Procurement Opportunities
AI : Artificial Insemination
ARVs : Antiretroviral
ASIO : African Science, Technology and Inno-vation Observatory
AU : The African Union
AYP : Adolescents and Young Adults
BPS : Budget Policy Statement
CA : Communication Authority
CAJ : Commission on Administrative Justice
CAPR : County Annual Progress Report
CARPS : Capacity Assessment and rationaliza-tion of the public service
CGs : County Governments
CBC : Competency Based Curriculum
CBET : Competency Based Education and training
CBROP : County Budget Review and Outlook paper
CCD : Climate Change Directorate
CFSP : Common Foreign and Security Policy
CIDP : County Integrated Development Plan
CLTS : Community Led Total Sanitation
CSA : Climate Smart Agriculture
CUE : Commission for University Education
DFZ : Decease Free Zone
DHIS : District Health Information System
DOCs : Day Old Chicks
DRM : Disaster Risk Mitigation
DRSRS : Department of Resource Surveys and Remote Sensing
DWT : Dead Weight Tonnes
EARNP : East Africa Road Network Project
ECD : Early Childhood Development
ECHN : Enrolled Community Health Nurses
EDE : Ending Draught Emergencies
eNIMES : Electronic National integrated Monitor-ing and Evaluation System
ERS : Economic Recovery Strategy for Wealth and Employment Creation
ESA : Education Sector Analysis
GBV : Gender Based Violence
GCCN : Government Common Core Network
GDP : Gross Domestic Product
GHG : Green House Gas emissions
GoK : Government of Kenya
HELB : Higher Education Loan Board
HIV/AIDS Human Immunodeficiency Virus/Ac-quired Immunodeficiency Syndrome
ICT : Information Communication Technology
IEBC : Independent Electoral and Boundaries Commission
IHRIS : Integrated Human Resources Informa-tion System
JKIA : Jomo Kenyatta International Airport
KAIST : Kenya Advanced Institute of Science and Technology
KALRO : Kenya Agricultural Livestock Research Organization
KCAA : Kenya Civil Aviation Authority
KDF : Kenya Defence Force
KDHS : Kenya Demographic and Health Survey
KEMSA : Kenya Medical Supplies Agency
KENIA : Kenya National Innovation Agency
KFS : Kenya Forest Service
KHHEUS : Kenya Household Health Expenditure and Utilization Survey
KIA : Kenya Investment Authority
KICC : Kenyatta International Convention Centre
KIRDI : Kenya Industrial Research and Develop-ment Institute
KLDC : Kenya Leather Development Council
KMA : Kenya Maritime Authority
KMD : Kenya Meteorological Department
KNBS : Kenya National Bureau of Statistics
KNH : Kenyatta National Hospital
KNLS : Kenya National Library Service
ACRONYMS

KNQF : Kenya National Qualification Framework
KODI : Kenya Open Data Initiative
KPA : Kenya Ports Authority
KPAS : Kenya Probation and Aftercare Service
KPS : Kenya Prisons Service
KWS : Kenya Wildlife Services
KWTA : Kenya Water Towers Agency
KYEOP : Kenya Youth Employment and Opportu-nities Programme
LAPSSET : Lamu Port Southern Sudan Ethiopia Transport
MDAs : Ministries, Departments and Agencies
MED : Monitoring and Evaluation Department
MOE&F : Ministry of Environment and Forestry
MICNG : Ministry of Interior and Co-ordination of National Government
MoALFI : Ministry Of Agriculture, Livestock Fish-eries and Irrigation
MoD&ASAL
: Ministry of Devolution, Arid and Semi-Arid Lands
MoEd : Ministry of Education
MoE : Ministry of Energy
MoH : Ministry of Health
MoICNG : Ministry of Interior and Coordination of National Government
MoICT : Ministry of Information, Communication and Technology
MoL&SP : Ministry of Land and Physical Planning
MOLPP : Ministry of Land and Physical Planning
MoP&M : Ministry of Petroleum and Mining
MoPY&G : Ministry of Public Service, Youth and Gender
MOSCH : Ministry of Sports, Culture and Heritage
MOTI-HUD&PW
: Ministry of Transport, Infrastructure, Housing, Urban Developmentand Public Works
MoPSY&G : Ministry of Public Service, Youth and Gender
MTP : Medium Term Plan
MTW : Ministry of Tourism and Wildlife
MW&S : Ministry of Water and Sanitation
NACC : National Aids Control Council
NACCSC : National Anti-Corruption Campaign Steering Committee
NACOSTI : National Commission for Science, Tech-nology and Innovation
NAMATA Nairobi Metropolitan Area Transport Authority
NCBF : National Capacity Building Framework
NCIC : National Cohesion and Integration Commission
NCPD : National Coordination for and Popula-tion Development
NDEF : National Drought Emergency Fund
NDMA : National Drought and Management Authority
NDOC : National Disaster operation Centre
NEMA : National Environment Management Authority
NESSP : National Education Sector Strategic Plan
NETIP : Northern Kenya Transport improvement project
NGAAF : National Government Affirmative Action Fund
NHDF : National Housing Development Fund
NHIF : National Hospital Insurance Fund
NIFC : Nairobi International Financial Centre
NIMES : National Integrated Monitoring and Eval-uation System
NLC : National Lands Commission
NMC : Nursing and Midwifery Council
NMK : National Museums of Kenya
NOFBI : National Optic Fibre Backbone Infra-structure
NPI : Natural Product Industry
NPS : National Police Service
NPSRL : National Physical Science Research Laboratory
NQCL : National Quality Control Laboratory
NRC : Nanotechnology Research Centre
NRF : National Research Fund
NSSF : National Social Securities Fund
NTSA : National Transport and Safety Authority
NUTRIP : National Urban Transport Improvement Project
NYS : National Youth Services
PSC : Public Service Commission
REA : Rural Electrification Authority
RNUC : Ronald Ngala Utalii College
SCMP : Sub-catchment management Plans
SEZ : Special Economic Zones
SEZA : Special Economic Zones Authority
SGR : Standard Gauge Railway
SKA : Square Kilometre Array
SMEs : Small and Medium Enterprises
TEUs : Twenty foot Equivalent Units
TLU : Tropical Livestock Unit
TNT : The National Treasury
TSC : Teachers Service Commission
TVET : Technical and Vocational Education and Training
UNDP : United Nations Development Pro-gramme
UNESCO : United Nations Educational, Scientific and Cultural Organization
UNICEF : United Nations International Children’s Emergency Fund
USAID : United States Agency for International Development
VRCs : Vocational Rehabilitation Centres
WASREB : Water Services Regulatory Board
WASSMO : Water Sanitation services Management Organization
WHO : World Health Organization
WRA : Water Resources Authority
WTA : World Trade Agreement
YECs : Youth Empowerment Centers
YEDF : Youth Enterprise Development Fund
GLOSSARYProject: A planned undertaking of related activities aimed at specific objective(s) that has a beginning and an end. Usually every task has a planned completion data and assigned resources and responsibilities.
Programme: A series of interrelated projects with a common overall objective. A time-bound intervention similar to a project, but which cuts across sectors, themes or geographic areas; uses a multi-disciplinary approach; involves more institutions; and may be supported by several different funding sources
Goal: A broad statement generally describing a desired outcome for a project. It is the broader regional, sectoral or national objective that a project and/or activity is expected to contribute towards. A broad statement of what the programme is intended to accomplish.
Objective: A measurable statement about the end result that a project/programme is expected to accomplish in a given period of time. What the project specifically aims to achieve. A well-worded objective will be Specific, Measurable, Attainable/Achievable, Realistic and Time-bound (SMART). Difference between ‘goal’ and ‘objective’ is that ‘objective’ is a specific object of an effort, while ‘goal’ has an inspirational element and is more general and broader.
Stakeholder(s): Specific people or groups who
have a stake in the implementation of the Policy. Normally, stakeholders could include state and non-state actors and the Kenyan citizens.
Non-State Actors: Development partners who include Civil Society Organizations (Non-Governmental, Faith Based and Community based organizations), Private Sector Organizations and Foundations,
Result: A describable or measurable change in state that is derived from a cause and effect relationship
Inputs: The financial, human, material and information resources used to produce outputs through activities and to accomplish outcomes.
Activities: Actions taken or work performed, through which inputs are mobilized to produce outputs.
Outputs: Direct products or services stemming from the activities of an organization, policy, program, or initiative delivered to users outside the organization. Describes what a programme, project or organization produces or delivers (2002 OECD DAC)
Outcomes: Immediate effects of the programme/project. Outcomes express the extent to which the immediate objectives are reached.Impacts: are the ultimate long term changes as
a result of the implementation of programmes / projects interventions -the difference, positive and/or negative, the implementation of a programme/project intervention has brought.
Indicators: Specific quantified measurements related to the extent a project/programme or organization is reaching objectives or targets.
Baseline: A standard against which performance, achievements or an intervention can be assessed or comparisons made. A baseline refers to the performance that has been achieved by a project(s) in the recent past.
Baseline Year: Reference year when the baseline value was captured.

The Third National Reporting In-dicators Handbook has been de-veloped by The National Treasury and Planning through the State Department for Planning. The Handbook has been prepared in collaboration with other stake-holders for tracking the progress of implementation of the Third Medium Term Plan (MTP) (2018-2022) of Kenya Vision 2030, United Nations Agenda 2030 on Sustainable Development Goals (SDGs), The African Union Agen-da 2063, East African Communi-ty Vision 2050 and other interna-tional obligations that have been mainstreamed in the Third MTP. The Handbook is designed to in-crease accountability and trans-parency by providing easy and
clear reference to the economic, social and political performance outcome indicators and annualized output indicators for the Kenya Vision 2030 Flagship projects and the “Big Four” Agenda.
The preparation of the Handbook was guided by the Constitution taking cognizant of the various arms and structures of government. Several cross-cutting issues such as gender, climate change and human rights have been mainstreamed in this Handbook. The indicators have set baseline and yearly targets that will be critical in giving citizens an opportunity to interrogate the level of implementation of policies, programmes and projects at the national and devolved levels. The Handbook also provides a platform for the citizens to engage with the government on development issues at national and devolved levels.
FOREWORDThe development of this Handbook benefited from the First and Second National Reporting Indicator Handbooks for the first MTP (2008-2012) and the second MTP (2013-2017) respectively. The Handbook is more comprehensive than the previous handbooks having factored in the “Big Four” Agenda, Disaster Risk Management (DRM) and climate change targets.
The Handbook is divided into four parts. The first part consists of monitoring framework for the “Big Four” Agenda projects, while the second part consists of indicators for monitoring selected key outcomes of the Third MTP (2018-2022). Part three provides a monitoring framework for the Third MTP flagship and priority projects, while the fourth part presents the climate change, DRM and HIV/AIDS indicators. The Indicators will be uploaded into the Electronic National Integrated Monitoring and Evaluation System (e-NIMES) platform where achievements will be updated on regular basis. The online platform is accessible for all and is an important tool for ensuring transparency and accountability. All Ministries, De-partments and Agencies (MDAs) will therefore be required to report on quarterly and annual basis the progress on implementation of their respective programmes and projects
The structure of the Handbook will stimulate distinct interest in monitoring imple-mentation of the Third MTP policies, programmes and projects and allow feed-back to the executing MDAs so that they can keep their progress on track. To-wards this end, the Government will work with likeminded stakeholders in order to foster a broader use of the Handbook in ensuring transparency and accountability in implementation of the Third MTP. I am confident that this collaboration will pro-vide an effective feedback mechanism to the Government and where possible, remedial actions will be undertaken to keep our development agenda on track.
Henry K. Rotich, EGHCabinet SecretaryThe National Treasury and Planning

TThe National Treasury and Planning through the State Department for Planning plays a key role in facilitating and coordinating the national development planning pro-cess. The State Department is charged with the respon-sibility of overseeing the im-plementation of Kenya Vision 2030 and its MTPs, interna-tional obligations such as the SDGs, AU Agenda 2063 among others and also pro-vide leadership in implemen-tation of economic policies.
The other functions of the State Department for Plan-ning include: provision of leadership and coordination
in the preparation of the national development plan documents; and national moni-toring and evaluation framework. In line with its mandate, the State Department for Planning in collaboration with other relevant stakeholders has prepared the Third National Reporting Indicator Handbook for Third MTP. The Handbook will be used in tracking progress of implementation of the third MTP (2018-2022), the Big Four agenda as well as other economic policies and international obligations.
The Handbook was validated through consultative forums, where stakeholders pro-vided valuable inputs that aided its finalization. Towards this end, I would therefore wish to thank the various sector working groups, technical committees from line Ministries, Departments and Agencies for providing support and feedback in the development of this Handbook.
ACKNOWLEDGEMENTSpecial thanks goes to United Nations Development Programme (UNDP), UN Wom-en and many other stakeholders and development partners who contributed im-mensely towards the development of this Handbook and I look forward to continued collaboration as we seek for a better Kenya. I would also like to specifically mention the contribution of the Economic Planning Secretary, Mr. Joseph Mukui, HSC, and the Director of Monitoring and Evaluation Department (MED), Dr Samson Machu-ka, whose able leadership and supervision made the preparatory process of this Handbook a successful. Special thanks to MED staff and other technical staff from the other Departments within the State Department for Planning who demonstrated their commitment in preparation of this Handbook. I therefore take this opportunity to thank all those who, in very diverse ways, made production of this Handbook a success.
The Third National Reporting Indicator Handbook for the Third MTP can be found on the website of the State Department for Planning (http://www.planning.go.ke/) and the Department’s Resource Centre. I wish to call upon all to use the Handbook to track the Government’s achievements and performance.
Julius Muia, PhD, EBSPrincipal SecretaryState Department for PlanningThe National Treasury and Planning

Kenya has made significant progress in the implementation of policies, programmes and projects envisioned in first and second Medium Term Plans of the Kenya Vision 2030 as well as other regional and international commitments. The programmes and projects have had significant impacts on the lives of the citizens. This has partly been attributed to the establishment and operationalization of a monitoring and evaluation framework through the National Integrated Monitoring and Evaluation System (NIMES). The Monitoring and Evaluation Department has made Monitoring and Evaluation of government policies, programmes and projects more efficient and effective with the advent of the real time M&E reporting tool, e-NIMES platform. The system will ensure transparency and accountability in implementation of all policies programmes and projects as it provides mitigation measures for the identified challenges.
Between 2018 and 2022, the Government will undertake the “Big Four” Agenda to steer the country forward in the realization of the Kenya Vision 2030. The “Big Four” Agenda includes manufacturing, and food and nutrition security (Agriculture) under the economic Pillar and, Universal Health Care and Housing under the Social Pillar. The “Big Four” priorities are to be implemented hand-in-hand with other sector priorities in the Kenya Vision 2030. Successful
INTRODUCTIONimplementation of programmes and projects in the “Big Four” Agenda, Kenya Vision 2030, MTPs as well as other international obligations therefore require an efficient and effective national monitoring, evaluation and reporting system. The National Integrated Monitoring and Evaluation System will be critical to the realization and tracking of the identified medium-term programmes and projects.
Towards this end, the Third National Reporting Indicator Handbook for the Third MTP of Kenya Vision 2030 will be used to track progress in implementation of programmes and projects of the Big Four Agenda and the Third MTP. This Handbook precedes the Second National Reporting Indicator Handbook and contains more comprehensive targets covering all sectors of the economy. The Handbook has been aligned to the various international obligations including mainstreaming of climate change, gender and human rights-based issues. This Handbook incorporates the blue economy as an additional sector in the Economic Pillar of the Third MTP. It also incorporates indicators for the thematic areas on climate change, HIV/AIDS and Disaster Risk Mitigation (DRM) which were brought on board during the preparation of the Third MTP.
The preparation of this Handbook took cognizance of the role of county Governments in monitoring and evaluation of their respective
His Excellency Deputy President Dr. William Ruto launching The Third Medium Term Plan at KICC ballroom
Henry K. Rotich, Cabinet Secretary, The National Treasury and Planning making his remarks at The Third Medium Term Plan launch
County Integrated Development Plan (CIDP). The county Governments will develop their County Indicator Handbooks will encompass indicator from the county up to the village level. The Indicator Handbooks for National and County Governments will be uploaded onto the e-NIMES platform.The layout of projects in the Handbook should therefore stir distinct interest in monitoring the projects and allow feedback to the executing Ministries, Departments and Agencies so that they can keep track and ensure that where necessary, appropriate measures can be taken by relevant Departments. This will be further strengthened through the e-NIMES real time reporting platform.
This Handbook is structured into four parts. The
first part presents indicators for the “Big Four” Agenda projects and priorities considering all the output indicators identified under universal health care, housing, manufacturing and food security. Part two presents the National outcome indicators selected to reflect the main aspects of the MTP that include macroeconomic stability, socio-economic transformation, investing in the people of Kenya, moving the economy up the value chain and transformation of Kenya political governance systems. The third part presents the output indicators for all flagship projects identified in the third MTP. The fourth part presents indicators for the thematic areas namely; climate change specific indicators, disaster risk mitigation and HIV/AIDS indicators.
The outcome indicators in the various sectors, key output indicators under the Big Four Agenda, flagship projects and other key interventions will be tracked through a series of annual reports produced at the end of every financial year under the NIMES. Reports on the flagship projects will however be produced with higher frequency by the Vision Delivery Secretariat (VDS), at least every quarter, to inform strategic decision-making. To facilitate the realization of the “Big Four” Agenda and Kenya Vision 2030, the
Third MTP will be implemented through Ministerial Strategic Plans with their own results framework to achieve both Big Four Agenda and Vision 2030 goals. The operational link to the ministerial results frameworks are the Performance Contracts signed by all Chief Executive Officers (CEOs) and Accounting Officers. This Handbook will be a key pillar in the performance monitoring framework for the realization of the Vision 2030 goals and the “Big Four” Agenda. The Handbook establishes agreed parameters for ministerial priorities in the national development plan and offers to have their performances at these levels tracked down for effective delivery.
The Handbook be a guide in preparation of monitoring and evaluation reports. The reports are the Annual Progress Reports for the Third MTP of the Kenya Vision 2030 outcomes, the Quarterly Flagship Project Reports, as well as Quarterly progress reports on implementation of the “Big Four” Agenda. These reports are part of the reporting obligations by public institutions and NGOs within the national monitoring framework. The Handbook will therefore play a major role in understanding the degree of effectiveness of the development policies of the government and performance of those responsible for delivering the priorities of the Government.
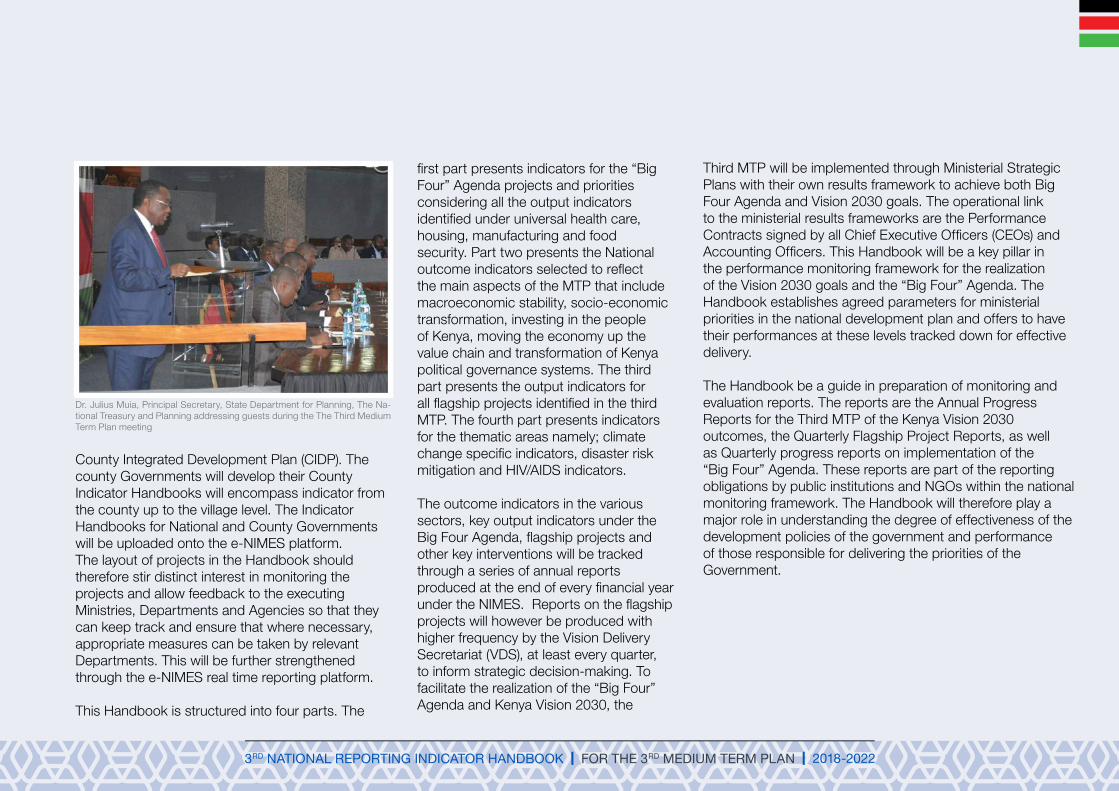
Dr. Julius Muia, Principal Secretary, State Department for Planning, The Na-tional Treasury and Planning addressing guests during the The Third Medium Term Plan meeting

1
PART I: THE BIG FOUR
PROJECTSMONITORING

2
MANUFACTURING
FOODSECURITY
UNIVERSALHEALTH
COVERAGE
AFFORDABLEHOUSING
3
PrIorITY ProJeCT
oUTPUT INDICATor TArGeTS AGeNCY reSPoNSIBLe
2018/19 2019/20 2020/21 2021/22 2022/23
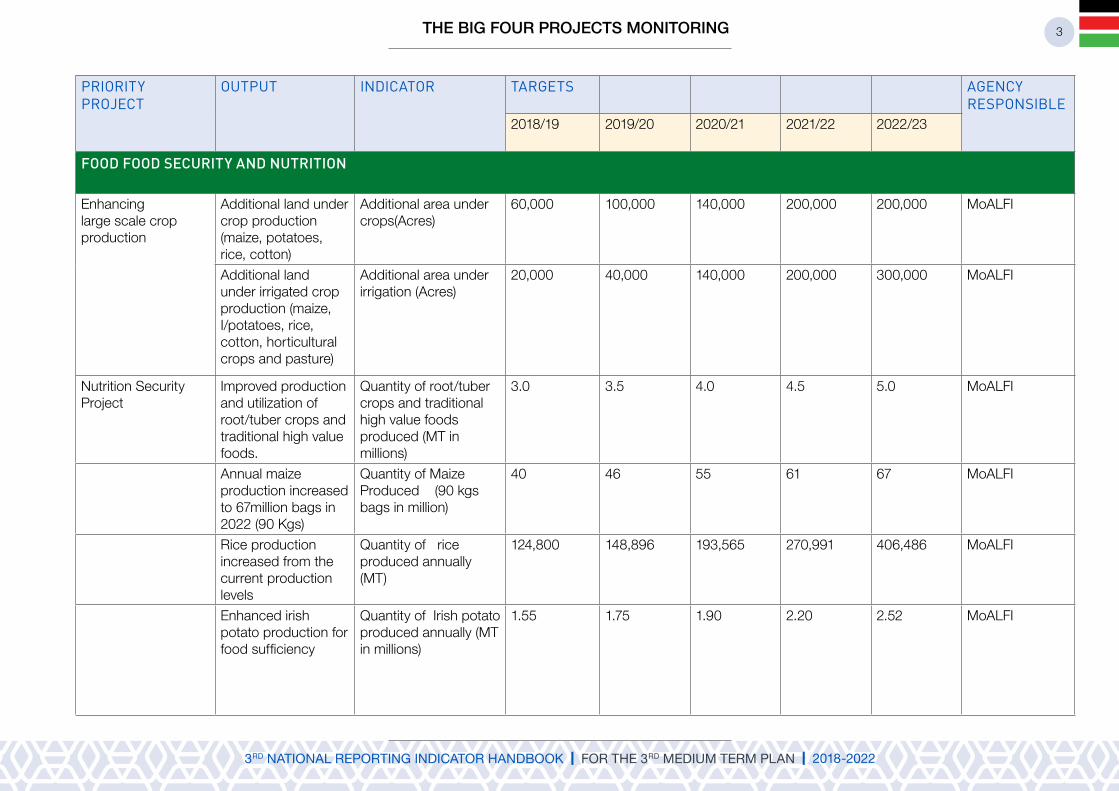
FOOD FOOD SECURITY AND NUTRITION
Enhancing large scale crop production
Additional land under crop production (maize, potatoes, rice, cotton)
Additional area under crops(Acres)
60,000 100,000 140,000 200,000 200,000 MoALFI
Additional land under irrigated crop production (maize, I/potatoes, rice, cotton, horticultural crops and pasture)
Additional area under irrigation (Acres)
20,000 40,000 140,000 200,000 300,000 MoALFI
Nutrition Security Project
Improved production and utilization of root/tuber crops and traditional high value foods.
Quantity of root/tuber crops and traditional high value foods produced (MT in millions)
3.0 3.5 4.0 4.5 5.0 MoALFI
Annual maize production increased to 67million bags in 2022 (90 Kgs)
Quantity of Maize Produced (90 kgs bags in million)
40 46 55 61 67 MoALFI
Rice production increased from the current production levels
Quantity of rice produced annually (MT)
124,800 148,896 193,565 270,991 406,486 MoALFI
Enhanced irish potato production for food sufficiency
Quantity of Irish potato produced annually (MT in millions)
1.55 1.75 1.90 2.20 2.52 MoALFI
THE BIG FOUR PROJECTS MONITORING

4
PrIorITY ProJeCT
oUTPUT INDICATor TArGeTS AGeNCY reSPoNSIBLe
2018/19 2019/20 2020/21 2021/22 2022/23
Revitalization of industrial crops
Increased cotton production
Quantity of cotton produced (Bales where 1 bale= 226.8kg)
52,470 75,000 100,000 150,000 200,000 MoALFI
Increased Pyrethrum production
Quantity of dry pyrethrum flowers produced (MT)
300 600 1,000 2,000 3,000 MoALFI
Increased coffee production
Quantity of clean coffee produced (MT)
46,000 48,000 53,000 56,000 60,000 MoALFI
Increased Tea Production
Quantity of tea produced (MT)
470,000 474,000 479,00 482,000 500,000 MoALFI
Improved Agricultural Mechanization
Increased access to agricultural machinery and equipment
No. of tractors and equipment availed to farmers (Disaggregated by sex of household head)
40 450 700 1050 1000 MoALFI
5 dams constructed to support irrigation with total capacity of 202 million m3 to serve 59,500 ha. (Kithino, Kamumu, Rupingazi, Thambana& Mara dams)
% completion level 10 40 80 100 - MW&S

5
PrIorITY ProJeCT
oUTPUT INDICATor TArGeTS AGeNCY reSPoNSIBLe
2018/19 2019/20 2020/21 2021/22 2022/23
Drive small scale holder productivity and agro-processing
Targeted production level SMEs established
Additional area under crops(Acres)
60,000 100,000 140,000 200,000 200,000 MoALFI
Additional land under irrigated crop production (maize, I/potatoes, rice, cotton, horticultural crops and pasture)
Additional area under irrigation (Acres)
20,000 40,000 140,000 200,000 300,000 MoALFI
Climate Smart Agriculture
database inventory for CSA Developed and maintained
Climate Smart database
- - 1 - - MoALFI&CGs
Fertilizer Cost Reduction Programme
Fertilizer Cost Reduction Programme
Quantity of subsidized fertilizers(MT) (Disaggregated by sex of household head)
180,000 200,000 300,000 300,000 300,000 MoALFI
Disease Free Zone Development
Disease free Zones established (Bachuma, Miritini and Kurawa)
% level of Completion of DFZ
60 70 80 90 100 MoALFI
Enhanced meat production
Feedlots Established No. of feedlots - 14 15 10 11 MoALFI
THE BIG FOUR PROJECTS MONITORING

6
PrIorITY ProJeCT
oUTPUT INDICATor TArGeTS AGeNCY reSPoNSIBLe
2018/19 2019/20 2020/21 2021/22 2022/23
Bull schemes for breeding established.
No. of Bull schemes for breeding established
- 2 3 2 1 MoALFI
Livestock insurance and subsidy scheme in 14 counties
No. of Tropical Livestock Units (TLU) under insurance and subsidy
90,060 110,000 160,000 220,000 300,000 MoALFI
Tsetse infestation in 5 tsetse belts suppressed for agricultural production
No. of tsetse belt 5 5 5 5 5 MoALFI
Day old chicks (DOCs) produced and supplied to farmers
No. of DOCs supplied to farmers (Disaggregated by sex of household head)
432,000 720,000 720,000 720,000 720,000 MoALFI
Rabbits produced and availed to farmers
No. of rabbits supplied to farmers (Disaggregated by sex of household head)
1,100 1,200 10,000 10,000 10,000 MoALFI
12,000 piglets Supplied to farmers per year.
No. of piglets supplied to farmers (Disaggregated by sex of household head)
- 2,000 12,000 12,000 12,000 MoALFI

7
PrIorITY ProJeCT
oUTPUT INDICATor TArGeTS AGeNCY reSPoNSIBLe
2018/19 2019/20 2020/21 2021/22 2022/23
Established 6 poultry agribusiness models for youth and women
No. of poultry agribusiness business models established
- 2 3 1 - MoALFI
Enhanced milk production
Build capacity of dairy stakeholders along the value chain
No. of dairy stakeholders trained (Disaggregated by sex of household head)
- 50 80 100 120 MoALFI
Improved feed availability
No of feed bales available (millions)
- 2 5 8 10 MoALFI
Improved animal genetics (AI services & research)
No. of improved breeds
1 1 2 3 2 MoALFI
Enhanced control of livestock diseases and Pests
Vaccination coverage (%)
50 60 70 80 100 MoALFI
Completion and equipping of BSL3 Laboratory (%)
60 70 80 90 100 MoALFI
Livestock Identification and traceability
No. of counties covered
5 15 25 35 47 MoALFI
THE BIG FOUR PROJECTS MONITORING

8
PrIorITY ProJeCT
oUTPUT INDICATor TArGeTS AGeNCY reSPoNSIBLe
2018/19 2019/20 2020/21 2021/22 2022/23
Improved quality and quantity of Hides and skins
Million square feet of Hides and skins
55 65 70 78 80 MoALFI
No of model centres for hides and skins established
- 3 3 - - MoALFI
No of rural tanneries established
4 4 4 4 MoALFI
% Completion of the Leather Institute at Ngong
10 50 65 80 100 MoALFI
Reduced post-harvest losses in milk
No of coolers installed (Disaggregated geographically by Urban or Rural)
100 110 120 10 MoALFI
Amount of milk processed (million litters)
630 700 800 1,000 1100 MoALFI
Enhancing honey production
Bee bulking sites for colony multiplication and distribution established
No. of new bulking sites established
5 2 4 2 2 MoALFI
Bee colonies produced and distributed
No. of colonies produced and distributed
1,600 2,500 4,000 5,000 5,500 MoALFI
Sentinel bee colonies Established
No. of sentinel bee colonies
4 6 10 12 14 MoALFI

9
PrIorITY ProJeCT
oUTPUT INDICATor TArGeTS AGeNCY reSPoNSIBLe
2018/19 2019/20 2020/21 2021/22 2022/23
Fish Production Increased fish production
Metric Tonnes of fish produced
55 65 70 78 80 MoALFI
Fish Post-harvest Management
Reduced fish post-harvest loses
% of fish post-harvest loses
240,000 272,000 304,000 MoALFI MoALFI
Fish Consumption Increase per capita fish consumption
Per Capita Fish consumption (Kg/person/year)
4.6 5.5 7.2 8.5 10 MoALFI
MANUFACTURING
Special Economic Zones (SEZ) Programme
Special Economic Zones developed1
No. of public SEZs 1 1 1 - 1 MOITC
No. of private SEZs 1 1 1 1 1 MOITC
Industrial clusters development programme
Increased textile production in Athi River,Voi, Samburu, Eldoret, Nyandarua, Moyale/Isiolo, Nandi, Homa Bay
No. of Industrial clusters developed for textile production
2 2 2 2 2 MOITC
Modernized RIVATEX E.A.
% level of modernization of machinery
80 100 - - - MOITC
Kenanie leather park established
% completion of Kenanie leather park
24 50 100 - - MOITC
1 The public Special Economic Zones include Dongo Kundu, Lamu, Naivasha and Kisumu
THE BIG FOUR PROJECTS MONITORING

10
PrIorITY ProJeCT
oUTPUT INDICATor TArGeTS AGeNCY reSPoNSIBLe
2018/19 2019/20 2020/21 2021/22 2022/23
Agro-food processing programme
Food hub and agro park established at Nakuru, Mombasa, Nyandarua
No. of food hub and agro parks established
- 1 1 1 - MOITC
Aquaculture processing plants established at Kisumu, Turkana, Naivasha and Mombasa
No. of Aquaculture processing plants established
- 1 1 1 1 MOITC
Establishment of Iron and Steel milling plant
Iron and steel milling plant established
Completion level of Iron and steel plant(%)
- 30 45 70 100 MOITC
Manufacture of Machinery, Equipment and Industrial Parts
Investments in the manufacture of Agro Machinery, equipment and tools increased
Amount invested in manufacture of Agro Machinery, equipment and tools (KSh Billion)
10 10 10 10 10 MOITC
Increased production of castings and manufacture of transmission parts
No. of tonnes of production of castings
107 125 132 132 132 MOITC
No. of transmission parts
55,000 56,000 57,000 57,000 60,000 MOITC
Promotion of investments (domestic and foreign)
Increased investment both domestic and foreign
Amount of additional investments (in ksh billions)
100 140 180 200 220 MOITCTNT&P

11
PrIorITY ProJeCT
oUTPUT INDICATor TArGeTS AGeNCY reSPoNSIBLe
2018/19 2019/20 2020/21 2021/22 2022/23
Upgrade of research laboratories infrastructure
Research Laboratories upgraded
Level of completion of Industrial Research, laboratories in Nairobi, South B (%)
64 80 100 - - MOITC
Level of completion of Industrial Research, laboratories in Kisumu (%)
70 100 - - - MOITC
UNIvERSAl HEAlTH COvERAGE
Social Health Protection
Health Insurance accessed by Elderly People and Persons with Severe Disabilities (PWSDs)
No of elderly persons and PWSDs registered & accessing healthcare (Disaggregate by sex, age and PWSDs)
1,040,000 1,640,00 1,694,000 1,740,000 1,790,000 MOH
Health Insurance Subsidy accessed by Poor and vulnerable households increased
No. of beneficiaries per year
300,000 500,000 700,000 900,000 1,200,000 MOH
Mothers of children under 1 year reached under Linda Mama Programme
No of mothers of children under 1 benefiting
1,230,000 1,260,000 1,300,000 1,330,000 1,365,000 MOH
THE BIG FOUR PROJECTS MONITORING

12
PrIorITY ProJeCT
oUTPUT INDICATor TArGeTS AGeNCY reSPoNSIBLe
2018/19 2019/20 2020/21 2021/22 2022/23
Social Health Protection
Health Insurance accessed by Elderly People and Persons with Severe Disabilities (PWSDs)
No of elderly persons and PWSDs registered & accessing healthcare (Disaggregate by sex, age and PWSDs)
1,040,000 1,640,00 1,694,000 1,740,000 1,790,000 MOH
Health Insurance Subsidy accessed by Poor and vulnerable households increased
No. of beneficiaries per year
300,000 500,000 700,000 900,000 1,200,000 MOH
Mothers of children under 1 year reached under Linda Mama Programme
No of mothers of children under 1 benefiting
1,230,000 1,260,000 1,300,000 1,330,000 1,365,000 MOH
Free healthcare accessed by all
Budget allocation to public primary health care facilities(million)
900 900 900 1,100 1,200 MOH
Increased insurance coverage
% of population needing subsidies covered under mandatory insurance
10 40 60 80 100 MOH

13
PrIorITY ProJeCT
oUTPUT INDICATor TArGeTS AGeNCY reSPoNSIBLe
2018/19 2019/20 2020/21 2021/22 2022/23
AFFORDABlE HOUSING
Provision of Affordable and Social Housing Programme
400,000 affordable housing units constructed
No. of housing units constructed
80,000 80,000 80,000 80,000 80,000 MOTIHUD&PW
100,000 social housing units constructed
No. of housing units constructed
11,000 22,000 22,000 22,000 23,000 MOTIHUD&PW
THE BIG FOUR PROJECTS MONITORING

14

15
PART II: OUTCOME
INDICATORS

16

17
oUTCoMe INDICATorS UNIT BASeLINe YeAr
BASeLINe vALUe
TArGeTS DATA SoUrCe
reSPoNSIBLe AGeNCY(IeS)
LINKTo SDG
2018/19
2019/20
2020/21
2021/22
2022/23
MACroeCoNoMIC FrAMeWorKAccelerated Economic Growth
Annual GDP Growth rate
% 2016/17 5.3 5.9 6.3 6.8 6.9 7.0 Economic Survey
TNT&P SDG 8
Gross National Savings to GDP
% 2016/17 12.4 16.5 17.1 18.0 19.2 21.2 Economic Survey
TNT&P SDG 8
Investment to GDP
% 2016/17 17.5 21.9 22.6 22.8 23.4 25.4 Economic Survey
TNT&P SDG 8
GDP per Capita US$ 2016/17 1169 1237 1315 1405 1502 1607 Economic Survey
TNT&P SDG 8.1.1
Price Stability Overall Inflation Rate
% 2016/17 6.9 5.0 5.0 5.0 5.0 5.0 Economic Survey
TNT&P SDG 8
Broad Money supply (M3)
% 2016/17 6.0 14.1 13.1 12.8 13.1 13.2 Economic Survey
TNT&P SDG 8
Credit to Private Sector
% 2016/17 1.5 14.0 11.6 14.7 13.1 12.1 Economic Survey
TNT&P SDG 8
Sustainable Fiscal Deficit
Overall Balance to GDP (Inc. Grants)
% 2016/17 -9.1 -6.0 -4.3 -3.3 -3.0 -3.1 Economic Survey
TNT&P SDG 8
Overall Balance to GDP (Excl. grants)
% 2016/17 -9.3 -6.5 -4.8 -3.8 -3.4 -3.4 Economic Survey
TNT&P SDG 8
Total Revenue to GDP
% 2016/17 18.3 18.9 18.3 19.2 19.4 19.6 Economic Survey
TNT&P SDG 8
OUTCOME INDICATORS
18
oUTCoMe INDICATorS UNIT BASeLINe YeAr
BASeLINe vALUe
TArGeTS DATA SoUrCe
reSPoNSIBLe AGeNCY(IeS)
LINKTo SDG
2018/19
2019/20
2020/21
2021/22
2022/23
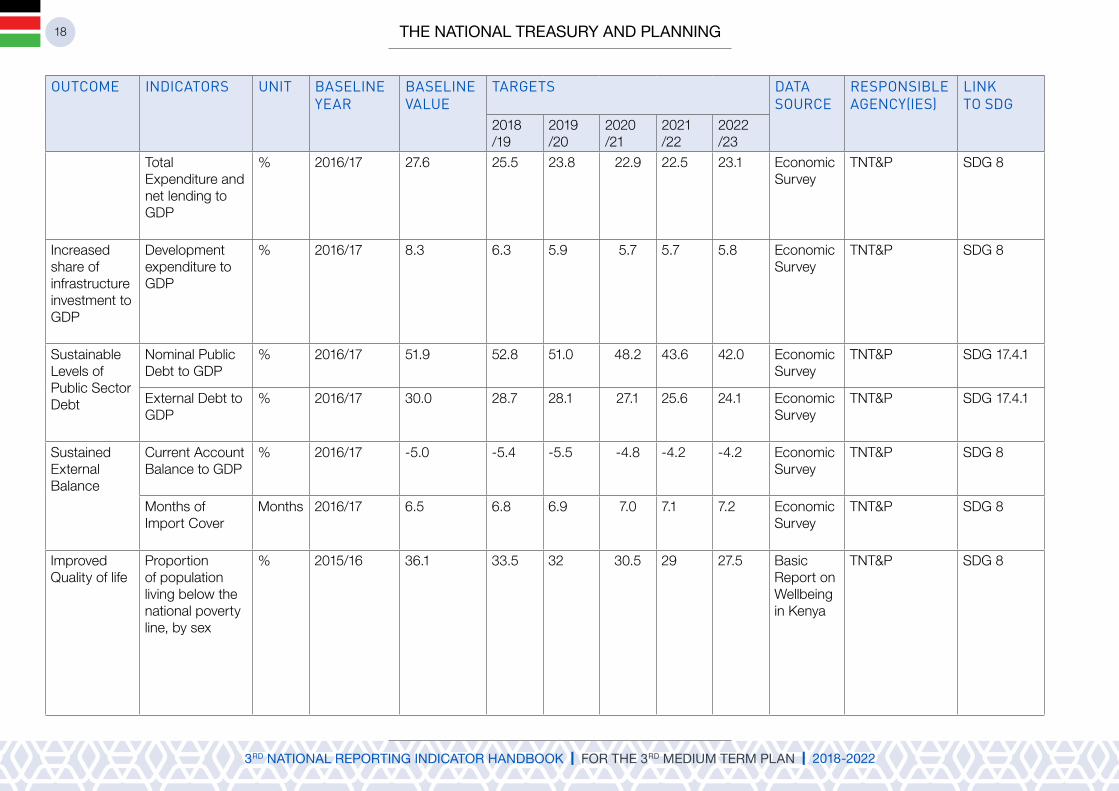
Total Expenditure and net lending to GDP
% 2016/17 27.6 25.5 23.8 22.9 22.5 23.1 Economic Survey
TNT&P SDG 8
Increased share of infrastructure investment to GDP
Development expenditure to GDP
% 2016/17 8.3 6.3 5.9 5.7 5.7 5.8 Economic Survey
TNT&P SDG 8
Sustainable Levels of Public Sector Debt
Nominal Public Debt to GDP
% 2016/17 51.9 52.8 51.0 48.2 43.6 42.0 Economic Survey
TNT&P SDG 17.4.1
External Debt to GDP
% 2016/17 30.0 28.7 28.1 27.1 25.6 24.1 Economic Survey
TNT&P SDG 17.4.1
Sustained External Balance
Current Account Balance to GDP
% 2016/17 -5.0 -5.4 -5.5 -4.8 -4.2 -4.2 Economic Survey
TNT&P SDG 8
Months of Import Cover
Months 2016/17 6.5 6.8 6.9 7.0 7.1 7.2 Economic Survey
TNT&P SDG 8
Improved Quality of life
Proportion of population living below the national poverty line, by sex
% 2015/16 36.1 33.5 32 30.5 29 27.5 Basic Report on Wellbeing in Kenya
TNT&P SDG 8
19
oUTCoMe INDICATorS UNIT BASeLINe YeAr
BASeLINe vALUe
TArGeTS DATA SoUrCe
reSPoNSIBLe AGeNCY(IeS)
LINKTo SDG
2018/19
2019/20
2020/21
2021/22
2022/23
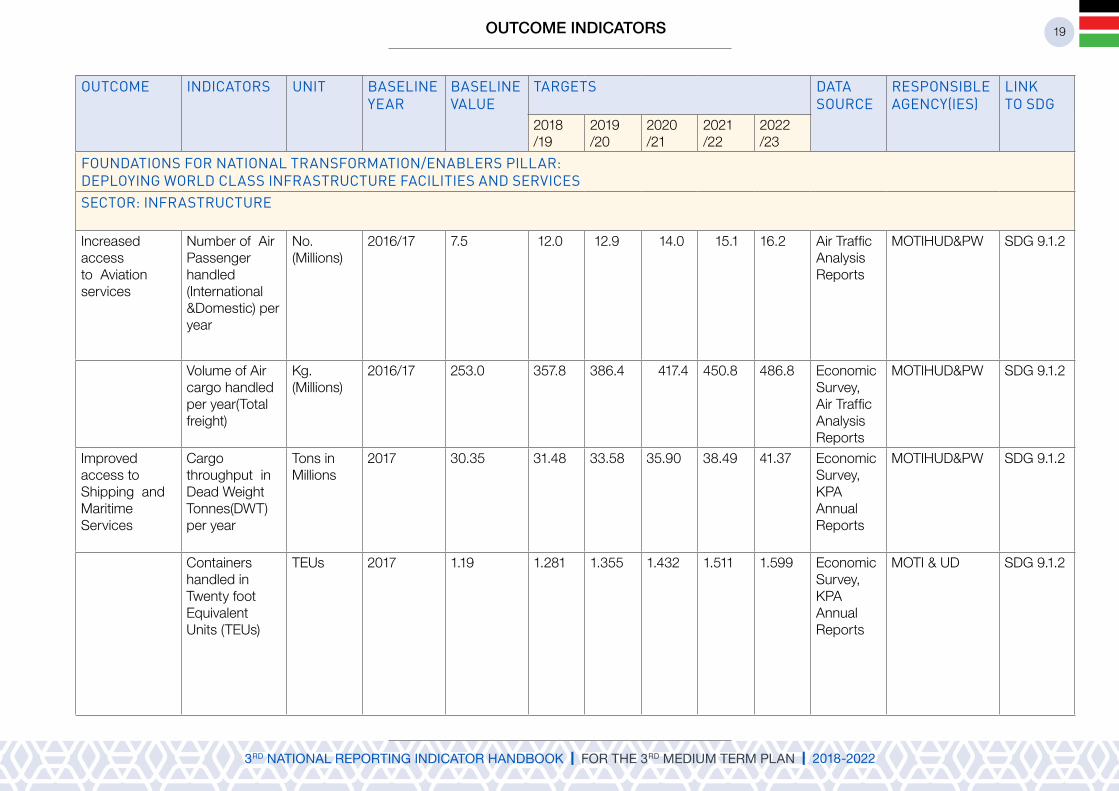
FoUNDATIoNS For NATIoNAL TrANSForMATIoN/eNABLerS PILLAr:DePLoYING WorLD CLASS INFrASTrUCTUre FACILITIeS AND ServICeSSeCTor: INFrASTrUCTUre
Increased access to Aviation services
Number of Air Passenger handled (International &Domestic) per year
No. (Millions)
2016/17 7.5 12.0 12.9 14.0 15.1 16.2 Air Traffic Analysis Reports
MOTIHUD&PW SDG 9.1.2
Volume of Air cargo handled per year(Total freight)
Kg.(Millions)
2016/17 253.0 357.8 386.4 417.4 450.8 486.8 Economic Survey, Air Traffic Analysis Reports
MOTIHUD&PW SDG 9.1.2
Improved access to Shipping and Maritime Services
Cargo throughput in Dead Weight Tonnes(DWT) per year
Tons in Millions
2017 30.35 31.48 33.58 35.90 38.49 41.37 Economic Survey,KPA AnnualReports
MOTIHUD&PW SDG 9.1.2
Containers handled in Twenty foot Equivalent Units (TEUs)
TEUs 2017 1.19 1.281 1.355 1.432 1.511 1.599 Economic Survey,KPA AnnualReports
MOTI & UD SDG 9.1.2
OUTCOME INDICATORS

20
oUTCoMe INDICATorS UNIT BASeLINe YeAr
BASeLINe vALUe
TArGeTS DATA SoUrCe
reSPoNSIBLe AGeNCY(IeS)
LINKTo SDG
2018/19
2019/20
2020/21
2021/22
2022/23
IImproved access to all weatherRoads
Classified Roads Maintained and Rehabilitated
Kms 2016/17 45,000 50,000 50,000 50,000 50,000 50,000 Economic Survey,
MOTIHUD&PW SDG 9.1.1
Additional Classified Roads Constructed(By class: A,B,C,D, E,F,G e.t.c
Kms 2016/17 2000 2000 2000 2000 2000 2000 Economic Survey,Ministerial Reports
SDG 9.1.1
Improved access to Rail Services
Rail Passengers handled per year
No. ‘000’ 2016/17 2,186 2,937 3,350 3,582 3,658 3,770 Economic Survey,Ministerial Reports
MOTIHUD&PW SDG 9.1.2
Rail Cargo handled per year
Tons ‘000’ 2016/17 1,429 1,603 4,801 6,478 7,116 7,902 Economic Survey,Ministerial Reports
SDG 9.1.2
Increased Power Generation
National Power Generation Capacity
MWs 2016/17 2,336 2,699 3,561 3,876 4,192 4,821 Economic Survey,Reports
MOE SDG 7.1.1
Proportion of National power generation capacity from clean sources
MWs 2016/17 1,571 1,954 2,416 2,787 3,158 3,724 Ministry Reports
MOE SDG 7.1.2

21
oUTCoMe INDICATorS UNIT BASeLINe YeAr
BASeLINe vALUe
TArGeTS DATA SoUrCe
reSPoNSIBLe AGeNCY(IeS)
LINKTo SDG
2018/19
2019/20
2020/21
2021/22
2022/23
Improved Energy Efficiency
New Companies adopting energy efficiency and conservation practices
No. 2016/17 35 50 50 50 50 50 Ministry Reports
MOE SDG 7.1.1
Universal Connectivity
Number of Households Connected to Electricity
No. 2016/17 6,182,282 6,763,921
7,763,921
8,763,921
9,763,921
10,763,921
Ministry Reports
MOE SDG 7.1.1
Improved access to Shipping and Maritime Services
Cargo throughput in Dead Weight Tonnes(DWT) per year
Tons in Millions
2017 30.35 31.48 33.58 35.90 38.49 41.37 Economic Survey,KPA AnnualReports
MOTIHUD&PW SDG 9.1.2
Containers handled in Twenty foot Equivalent Units (TEUs)
TEUs 2017 1.19 1.281 1.355 1.432 1.511 1.599 Economic Survey,KPA AnnualReports
MOTI & UD SDG 9.1.2
SeCTor: INForMATIoN AND CoMMUNICATIoN TeChNoLoGYUniversal Access to Information
Mobile Network Coverage
% 2017/18 92 93 94 97 98 100 Economic Survey, KDHS
MoICT SDG 9.c.1 and 5.b.1
Proportion of the population with Internet Connectivity
% 2017/18 70 75 80 85 90 95 Economic Survey,KPHC
MoICT SDG 9.c.1, & SDG 17.6.2& 17.8.1
OUTCOME INDICATORS

22
oUTCoMe INDICATorS UNIT BASeLINe YeAr
BASeLINe vALUe
TArGeTS DATA SoUrCe
reSPoNSIBLe AGeNCY(IeS)
LINKTo SDG
2018/19
2019/20
2020/21
2021/22
2022/23
Proportion of the country covered by dig-ital TV Signal
% 2017/18 78 80 85 90 95 100 Economic Survey
MoICT, SDG 9.c.1
Proportion of Households with Access to Radio
% 2017/18 95 96 97 98 99 100 KIBHSKDHS
MoICT
Bits per sec-ond per capita
Bps/Person
2017/18 20,630 21,000 21,500 22,000 22,500 23,000 Economic Survey/ CA reports
MoICT SDG17.6.2
SeCTor : SCIeNCe, TeChNoLoGY AND INNovATIoNEnhanced production of Niche products and Pharmaceutical using indigenous Knowledge
Number of Patents and Certification issued
No. 2017/18 6 14 16 20 22 25 Kenya Industrial Property Institute Reports
MOITC
Niche Phar-maceuticals produced and marketed
No. 2016/17 - - 3 4 6 KENIA ReportsNRF Re-ports
MOEd
23
oUTCoMe INDICATorS UNIT BASeLINe YeAr
BASeLINe vALUe
TArGeTS DATA SoUrCe
reSPoNSIBLe AGeNCY(IeS)
LINKTo SDG
2018/19
2019/20
2020/21
2021/22
2022/23
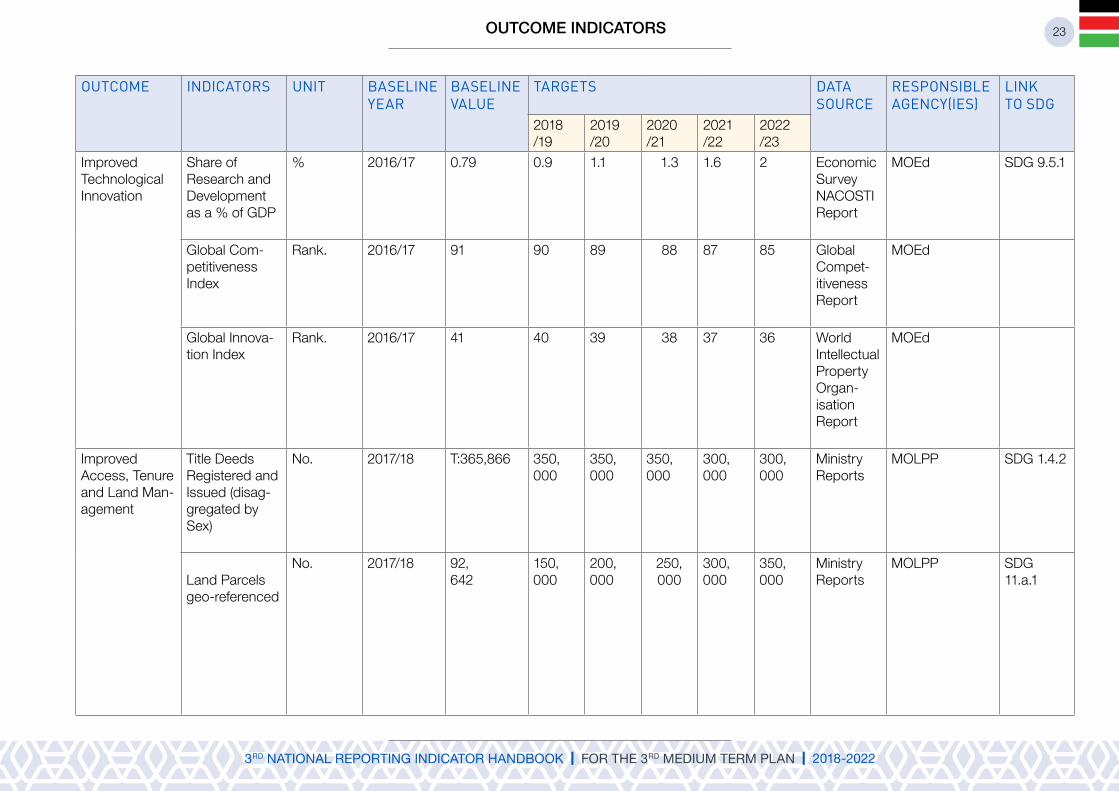
Improved Technological Innovation
Share of Research and Development as a % of GDP
% 2016/17 0.79 0.9 1.1 1.3 1.6 2 Economic Survey NACOSTI Report
MOEd SDG 9.5.1
Global Com-petitiveness Index
Rank. 2016/17 91 90 89 88 87 85 Global Compet-itiveness Report
MOEd
Global Innova-tion Index
Rank. 2016/17 41 40 39 38 37 36 World Intellectual Property Organ-isation Report
MOEd
Improved Access, Tenure and Land Man-agement
Title Deeds Registered and Issued (disag-gregated by Sex)
No. 2017/18 T:365,866 350,000
350,000
350,000
300,000
300,000
Ministry Reports
MOLPP SDG 1.4.2
Land Parcels geo-referenced
No. 2017/18 92,642
150,000
200,000
250,000
300,000
350,000
Ministry Reports
MOLPP SDG 11.a.1
OUTCOME INDICATORS

24
oUTCoMe INDICATorS UNIT BASeLINe YeAr
BASeLINe vALUe
TArGeTS DATA SoUrCe
reSPoNSIBLe AGeNCY(IeS)
LINKTo SDG
2018/19
2019/20
2020/21
2021/22
2022/23
SeCTor: PUBLIC SeCTor reForMSImproved Public Service Delivery
Proportion of Officers recruit-ed who are women in the public service
% 2016/17 50 50 50 50 50 50 Ministry Reports
MoPSY&G SDG 5.5.2
Proportion of public servants in Job Group P and above who are women
% 2016/17 - - - - - - Ministry Reports
MoPSY&G(PSC)
SDG 5.5.2
Proportion of Compliance with Public service Values and Principles of Governance
% 2016/17 69.9 73 75 75 85 100 Annual Presiden-tial Re-ports
MoPSY&G SDG 16
SeCTor : LABoUr AND eMPLoYMeNT
Enhanced Labour Pro-ductivity
No. of Jobs Created (dis-aggregated by Sex)
No. in 000 2016/17 T-832.9 1,000 1,150 1,350 1,450 1,500 Economic Survey
MoL&SP SDGs 5&8

25
oUTCoMe INDICATorS UNIT BASeLINe YeAr
BASeLINe vALUe
TArGeTS DATA SoUrCe
reSPoNSIBLe AGeNCY(IeS)
LINKTo SDG
2018/19
2019/20
2020/21
2021/22
2022/23
Enhanced Labour Pro-ductivity
Country Labour Productivity Growth
% 2017/18 0.8 3.0 3.1 3.2 3.3 3.4 Economic Survey
MoL&SP SDG 8
Country Com-petitiveness Index(Out of 7)
Ratio 2017/18 4.0 4.0 4.1 4.2 4.3 4.5 Global Compet-itiveness Report
MoL&SP SDG 8
Improved Access, Tenure and Land Management Increased Employability of the youth
Hard to serve youth2 provided with core life and business skills by (dis-aggregated by Sex)
No. 2017/18 - 7,542 25,000 42,000 45,000 20,486 Ministry Reports
MoL&SP SDG 8.6.1
Unemployment Rates (disag-gregated by Sex)
% 2015/16 7.4 7.0 5 5 5 5 Labour force report/ Economic Survey
TNT&P SDG 8.5.2
Proportion of hard to serve youth em-ployed after core life and business skills training
% 2017/18 - - - 90 90 90 Ministry Reports
MoL&SP SDG 8.6.1
2 These are youths who have dropped out of school without a certificate, skill and employment.
OUTCOME INDICATORS

26
oUTCoMe INDICATorS UNIT BASeLINe YeAr
BASeLINe vALUe
TArGeTS DATA SoUrCe
reSPoNSIBLe AGeNCY(IeS)
LINKTo SDG
2018/19
2019/20
2020/21
2021/22
2022/23
SeCTor: NATIoNAL vALUeS AND eThICSEnhanced Compliance to National Values and Ethics
Proportion of public awareness on National Values and Ethics
% 2016/17 59 63 68 70 80 100 Annual Presiden-tial Re-ports
MoPSY&G SDG 16
Proportion of Compliance with Public service Values and Principles of Governance
% 2016/17 69.9 73 75 75 85 100 Annual Presiden-tial Re-ports
MoPSY&G SDG 16
Number of public insti-tutions main-streaming of National Values and Principles of governance
No. 2017/18 251 200 220 240 260 300 Annual Presiden-tial Re-ports
Cabinet Affairs Office
Number of Hu-man Rights Vi-olations Cases Reported and concluded by (disaggregated by Sex)
No. 2017 8000 4000 2000 1000 500 250 KNCHR Reports
KNCHR SDG 16.1.1SDG 16.1.1SDG 16.2.1SDG16.2.3SDG 16.3.1SDG 16a.1SDG 16b.1
27
oUTCoMe INDICATorS UNIT BASeLINe YeAr
BASeLINe vALUe
TArGeTS DATA SoUrCe
reSPoNSIBLe AGeNCY(IeS)
LINKTo SDG
2018/19
2019/20
2020/21
2021/22
2022/23
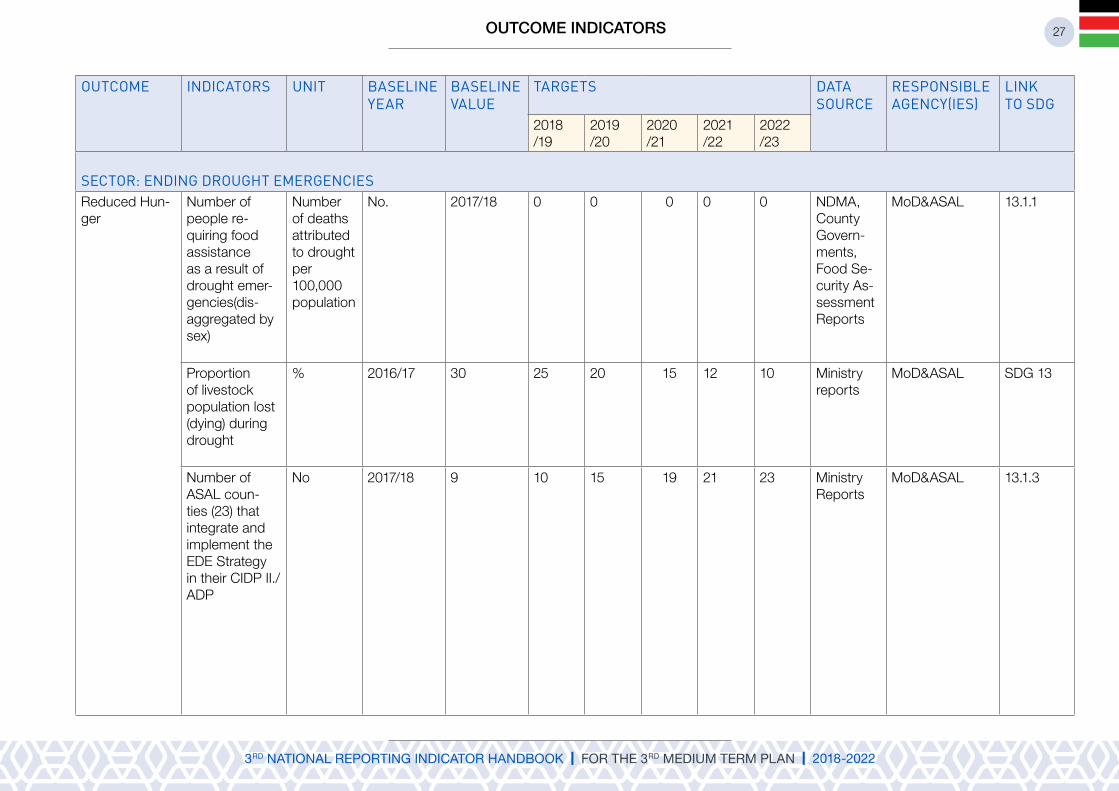
SeCTor: eNDING DroUGhT eMerGeNCIeSReduced Hun-ger
Number of people re-quiring food assistance as a result of drought emer-gencies(dis-aggregated by sex)
Number of deaths attributed to drought per 100,000 population
No. 2017/18 0 0 0 0 0 NDMA,County Govern-ments, Food Se-curity As-sessment Reports
MoD&ASAL 13.1.1
Proportion of livestock population lost (dying) during drought
% 2016/17 30 25 20 15 12 10 Ministry reports
MoD&ASAL SDG 13
Number of ASAL coun-ties (23) that integrate and implement the EDE Strategy in their CIDP II./ADP
No 2017/18 9 10 15 19 21 23 Ministry Reports
MoD&ASAL 13.1.3
OUTCOME INDICATORS

28
oUTCoMe INDICATorS UNIT BASeLINe YeAr
BASeLINe vALUe
TArGeTS DATA SoUrCe
reSPoNSIBLe AGeNCY(IeS)
LINKTo SDG
2018/19
2019/20
2020/21
2021/22
2022/23
SeCTor : SeCUrITY, PeACe BUILDING AND CoNFLICT reSoLUTIoNEnhanced Security in the Country
Police to Popu-lation Ratio
Ratio 2017/18 1:444 1:430 1:420 1:411 1:403 1:395 Economic Survey
MoICNG,
Crime Rate % 2017/18 13.2 6.00 5.42 5.14 5.1 5.03 Crime Reports
MoICNG,
Timeliness in the Crime Scene Re-sponse
Time (Hours)
2017/18 2 2 1.5 1.5 1 1 Ministry Reports
MoICNG,
Enhanced Cit-izen Participa-tion in Security Matters
% of Nyumba Kumi Coverage
% 2017/18 60 100 100 100 100 100 Ministry Reports
MoICNG
Participation of Women in the County Peace and Security Committees
% 2017/18 29 30 31 32 33 33.3 Ministry Reports
MoICNG
Improved management of correctional Services
Percentage of offenders con-tained, super-vised
% 2017/18 100 100 100 100 100 100 Ministry Reports
Kenya Prison Service
Percentage of offenders re-habilitated and reintegrated to the community
% 2017/18 100 100 100 100 100 100 Ministry Reports
Kenya Prison Service& Kenya Probation & Af-tercare Service

29
oUTCoMe INDICATorS UNIT BASeLINe YeAr
BASeLINe vALUe
TArGeTS DATA SoUrCe
reSPoNSIBLe AGeNCY(IeS)
LINKTo SDG
2018/19
2019/20
2020/21
2021/22
2022/23
Improved Immigration Services
No of e Pass-ports Issued
No. 2017/18 400,322 800,000
500,000
250,000
250,000
250,000
Ministry Reports
MoICNG
No of Work Permits Issued
No. 2017/18 20,219 24,000 26,000 30,000 30,000 30,000 Ministry Reports
MoICNG
No of E Visa Issued
No. 2017/18 354,774 419,300
469,200
525,000
580,500
600,000
Ministry Reports
MoICNG
Improved Ref-ugee Manage-ment
No of Refugees Registered
No. 2017/18 17,557 22,500 26,000 27,000 28,000 29,000 Ministry Reports
MoICNG
No of Refugees Relocated
No. 2017/18 9,402 12,000 13,000 13,600 14,000 14,500 Ministry Reports
MoICNG
No of Refugees Voluntarily Re-patriated
No. 2017/18 11,479 11,500 12,000 12,500 13,000 13,500 Ministry Reports
MoICNG
OUTCOME INDICATORS

30
oUTCoMe INDICATorS UNIT BASeLINe YeAr
BASeLINe vALUe
TArGeTS DATA SoUrCe
reSPoNSIBLe AGeNCY(IeS)
LINKTo SDG
2018/19
2019/20
2020/21
2021/22
2022/23
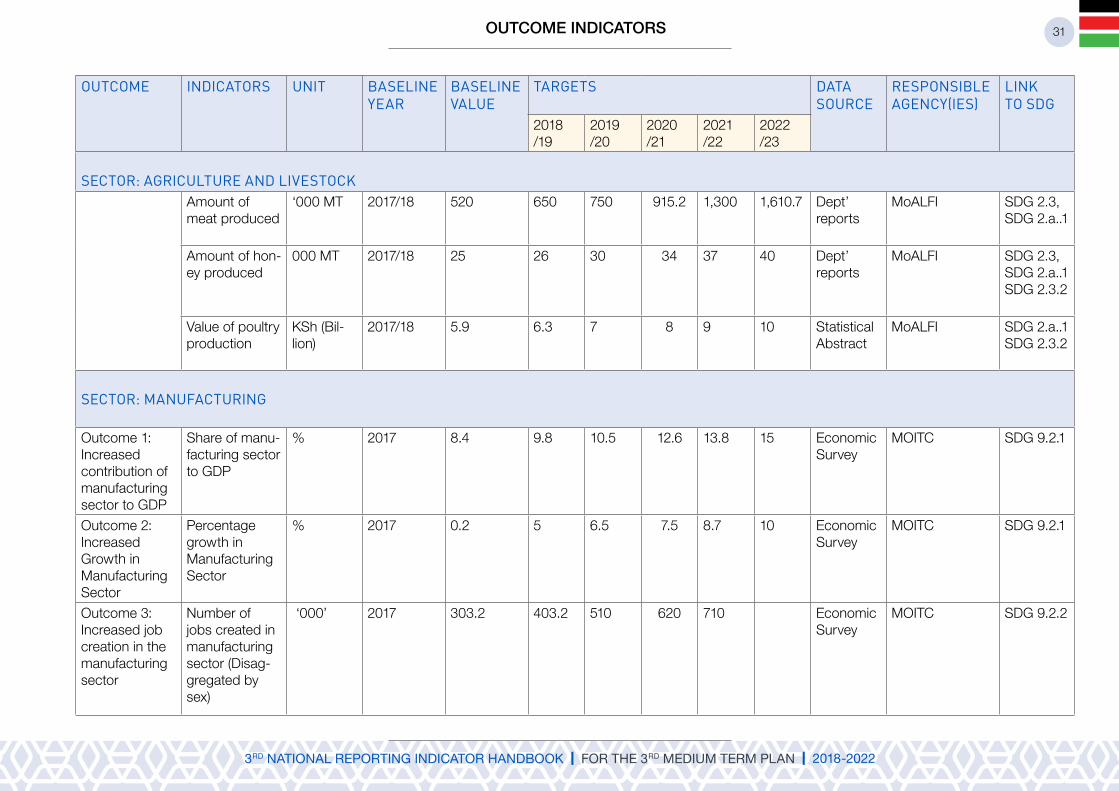
SeCTor: AGrICULTUre AND LIveSToCKOutcome 1: Crop contribu-tion to GDP
Share of crops subsector contribution to GDP
% 2017/18 24.9 28 29 30 30 30 Economic Survey
MoALFI SDG 2.3; SDG 2.a..1 SDG 2.3.2 ASPIRA-TION 1 of Agenda 2063
Outcome 2: Reduced post-harvest losses of maize
Percentage change in post-harvest losses of maize
% 2017 30 20 18 15 15 15 Dept’ report/Economic Survey
MoALFI SDG 2.3, SDG 2.a..1, SDG 2.3.2 &SDG 12.3
Outcome 3: Increased live-stock produc-tion
Share of live-stock subsec-tor contribution to GDP
% 2017/18 4.4 5.5 6.5 7.5 7.0 8.0 Economic survey
MoALFI SDG 2.3; SDG 2.a..1 SDG 2.3.2 ASPIRA-TION 1 of Agenda 2063
Amount of Milk produced
Million Litres
2017/18 5,300 5,500 5,800 6,000 6,500 7,000 Dept’ reports/Economic Survey
MoALFI SDG 2.3, SDG 2.a..1SDG 2.3.2
ECONOMIC PIllAR; MOvING THE ECONOMY UP THE vAlUE CHAIN
31
oUTCoMe INDICATorS UNIT BASeLINe YeAr
BASeLINe vALUe
TArGeTS DATA SoUrCe
reSPoNSIBLe AGeNCY(IeS)
LINKTo SDG
2018/19
2019/20
2020/21
2021/22
2022/23
SeCTor: AGrICULTUre AND LIveSToCKAmount of meat produced
‘000 MT 2017/18 520 650 750 915.2 1,300 1,610.7 Dept’ reports
MoALFI SDG 2.3, SDG 2.a..1
Amount of hon-ey produced
000 MT 2017/18 25 26 30 34 37 40 Dept’ reports
MoALFI SDG 2.3, SDG 2.a..1SDG 2.3.2
Value of poultry production
KSh (Bil-lion)
2017/18 5.9 6.3 7 8 9 10 Statistical Abstract
MoALFI SDG 2.a..1SDG 2.3.2
SeCTor: MANUFACTUrING
Outcome 1: Increased contribution of manufacturing sector to GDP
Share of manu-facturing sector to GDP
% 2017 8.4 9.8 10.5 12.6 13.8 15 Economic Survey
MOITC SDG 9.2.1
Outcome 2: Increased Growth in Manufacturing Sector
Percentage growth in Manufacturing Sector
% 2017 0.2 5 6.5 7.5 8.7 10 Economic Survey
MOITC SDG 9.2.1
Outcome 3: Increased job creation in the manufacturing sector
Number of jobs created in manufacturing sector (Disag-gregated by sex)
‘000’ 2017 303.2 403.2 510 620 710 Economic Survey
MOITC SDG 9.2.2
OUTCOME INDICATORS
32
oUTCoMe INDICATorS UNIT BASeLINe YeAr
BASeLINe vALUe
TArGeTS DATA SoUrCe
reSPoNSIBLe AGeNCY(IeS)
LINKTo SDG
2018/19
2019/20
2020/21
2021/22
2022/23
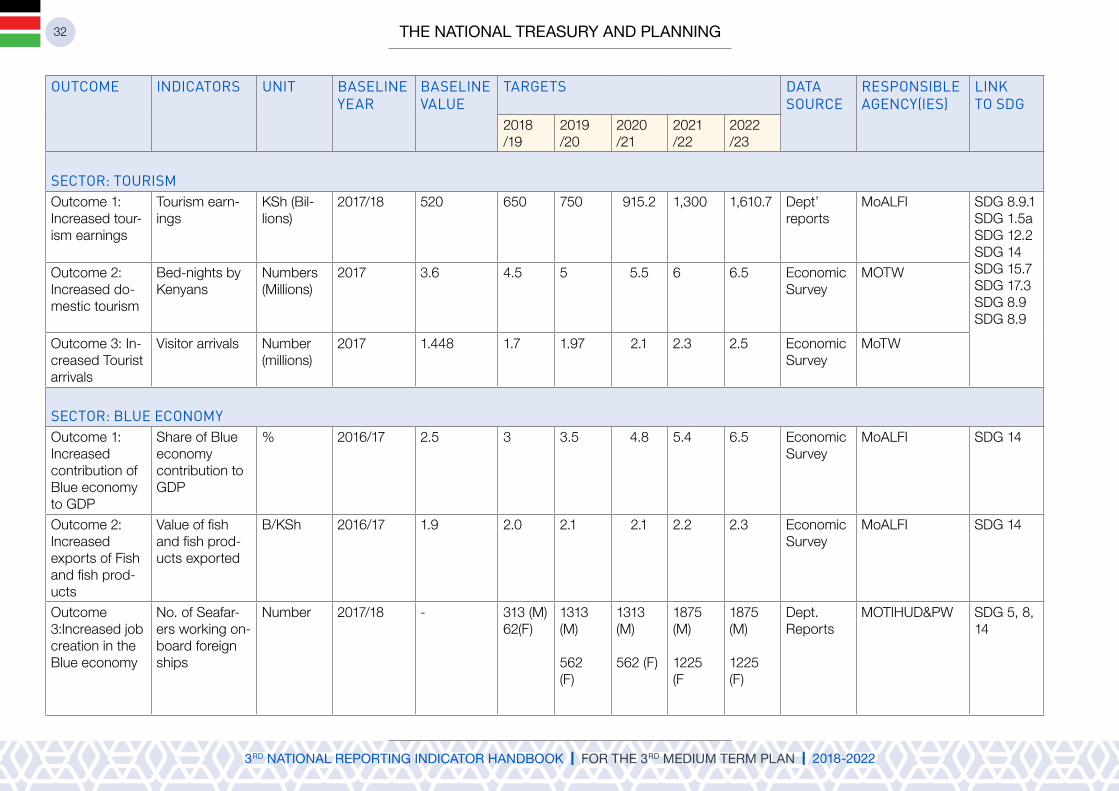
SeCTor: ToUrISMOutcome 1: Increased tour-ism earnings
Tourism earn-ings
KSh (Bil-lions)
2017/18 520 650 750 915.2 1,300 1,610.7 Dept’ reports
MoALFI SDG 8.9.1SDG 1.5aSDG 12.2SDG 14SDG 15.7SDG 17.3SDG 8.9SDG 8.9
Outcome 2: Increased do-mestic tourism
Bed-nights by Kenyans
Numbers (Millions)
2017 3.6 4.5 5 5.5 6 6.5 Economic Survey
MOTW
Outcome 3: In-creased Tourist arrivals
Visitor arrivals Number (millions)
2017 1.448 1.7 1.97 2.1 2.3 2.5 Economic Survey
MoTW
SeCTor: BLUe eCoNoMYOutcome 1: Increased contribution of Blue economy to GDP
Share of Blue economy contribution to GDP
% 2016/17 2.5 3 3.5 4.8 5.4 6.5 Economic Survey
MoALFI SDG 14
Outcome 2: Increased exports of Fish and fish prod-ucts
Value of fish and fish prod-ucts exported
B/KSh 2016/17 1.9 2.0 2.1 2.1 2.2 2.3 Economic Survey
MoALFI SDG 14
Outcome 3:Increased job creation in the Blue economy
No. of Seafar-ers working on-board foreign ships
Number 2017/18 - 313 (M)62(F)
1313 (M)
562 (F)
1313 (M)
562 (F)
1875 (M)
1225(F
1875 (M)
1225(F)
Dept. Reports
MOTIHUD&PW SDG 5, 8, 14

33
oUTCoMe INDICATorS UNIT BASeLINe YeAr
BASeLINe vALUe
TArGeTS DATA SoUrCe
reSPoNSIBLe AGeNCY(IeS)
LINKTo SDG
2018/19
2019/20
2020/21
2021/22
2022/23
SeCTor: TrADeOutcome 1: In-creased contri-bution of retail and wholesale trade to GDP
Share of trade contribution to GDP
% 2017 7.6 7.8 8.4 8.9 9.6 10 Economic Survey
MOITC SDG 17.11
Outcome 2: Increased Ken-yan Exports
Total Value of Exports
B/KSh 2017 594.1 742.6 928.25 1160.3 1450.4 1813 Economic Survey
MOITC SDG 17.11
Total Value of exports to the EAC
B/KSh 2017 131.6 164.5 205.6 257 321.3 401.6 Economic Survey
MOITC SDG 17.11
Outcome 3: Increased Do-mestic Trade
Value of whole-sale and retail Trade
B/KSh 2017 520.4 540 565 588 615 650.4 Economic Survey
MOITC SDG 17.11
Outcome 4: Jobs created in wholesale and retail trade
No. of jobs cre-ated (Disaggre-gated by sex)
‘000 No. 2017 1038.6 1,098 1,148 1182 1217 1242 Economic Survey
MOITC SDG 8.5
SeCTor: FINANCIAL ServICeSOutcome 1: Increased ac-cess to finan-cial services
Proportion of the population using formal financial servic-es (Disaggre-gated by sex)
% 2017 75.3 76.8 77.5 80 83 85 FinAccess survey
TNT&P SDG 8.10
OUTCOME INDICATORS

34
oUTCoMe INDICATorS UNIT BASeLINe YeAr
BASeLINe vALUe
TArGeTS DATA SoUrCe
reSPoNSIBLe AGeNCY(IeS)
LINKTo SDG
2018/19
2019/20
2020/21
2021/22
2022/23
Outcome 2:Increased fi-nancial servic-es contribution to GDP
Share financial services contri-bution to GDP
% 2017 7.3 7.6 7.8 8.1 8.5 8.5 Economic survey
TNT&P SDG 8.10
Outcome 3: Increased gross national savings
Saving as % of GDP
% 2017 18.3 19.9 20.9 21.2 22.1 23.1 Economic Survey
TNT&P SDG 8.10
SeCTor: BUSINeSS ProCeSS oUTSoUrCINGOutcome 1: Increased Ac-cess to online jobs in BPO/ITES Industries
Number of BPO dedicated seats
No 2017 15,000 16,000 17,000 18,000 19,000 20,000 MICT MOICT SDG 9.c.1, SDG 5.b.1
No. of youth-strained and connected to online jobs (Disaggregated by sex)
No 2017 100,000 500,000
500,000
500,000
1,000,000
1,000, MICT MOICT SDG 9.c.1, SDG 5.b.1
No. of incuba-tion centres established and utilised
No. 2017 22 105 210 410 710 1167 MICT MOICT SDG 9.c.1, SDG 5.b.1
Outcome 2: Improved e-government services
Number of applications (e-systems) used in govern-ment agencies
No. 2017 10 12 14 16 18 20 MICT MOICT SDG 9.c.1, SDG 5.b.1
3 Provisional

35
oUTCoMe INDICATorS UNIT BASeLINe YeAr
BASeLINe vALUe
TArGeTS DATA SoUrCe
reSPoNSIBLe AGeNCY(IeS)
LINKTo SDG
2018/19
2019/20
2020/21
2021/22
2022/23
SeCTor: oIL, GAS AND MINerALSOutcome 1: In-creased oil and gas production
Quantity of crude oil pro-duced
BPD 2018 200 2,000 2,000 2,000 4,000 4,000 Dept’ reports/ Economic Survey
MoP&M SDG 12.c
Outcome 2: Increased ac-cess to LPG
Proportion of households using LPG(Disaggregat-ed by sex of Household head and geo-graphically i.e.Rural Urban)
% 2015/16 13.4 30 40 50 60 70 Dept’ reports
MoP&M SDG 7.1.2
Total consump-tion of LPG disaggregated by Rural or Urban
Metric Tonnes
2017 192,502 213,677
237,181
263,271
292,231
324,377
Dept’ reports
MoP&M SDG 7.1.2
OUTCOME INDICATORS

36
oUTCoMe INDICATorS UNIT BASeLINe YeAr
BASeLINe vALUe
TArGeTS DATA SoUrCe
reSPoNSIBLe AGeNCY(IeS)
LINKTo SDG
2018/19
2019/20
2020/21
2021/22
2022/23
SeCTor: eDUCATIoN AND TrAINING Universal ac-cess to Basic Education
ECDGross En-rolment rate (disaggregate by sex)
% 2017 77.1 77.5 80 81 82 83 NESSP, ESA
MoEd SDG 4.2.2 SDG 4.5.1
Net Enrolment rate (disaggre-gate by sex)
% 2017 74.9 75.5 76.5 77.2 78.5 80 NESSP, ESA
MoEd
Transition rate from ECD to primary level
% 2017 - - - - - - NESSP, ESA
MoEd
Primary LevelGross en-rolment rate (disaggregate by sex)
% 2017 104 104.5 104.8 105.2 105.4 105.5 NESSP,ESA
MoEd
Net Enrolment rate (disaggre-gate by sex)
% 2017 91 92.5 92.8 93 94 95 NESSP,ESA
MoEd
Primary to Sec-ondary Transi-tion Rate
% 2017 83.1 96 98 100 100 100 NESSP, ESA
MoEd
Secondary Gross en-rolment rate (disaggregate by sex)
% 2017 68.5 70 75 80 84 90 NESSP, ESA
MoEd
4 KIHBS 5 All indicators to be reported by sex, location (rural/urban) and by disability where possible
SOCIAl PIllAR: INvESTING IN THE PEOPlE OF KENYA

37
oUTCoMe INDICATorS UNIT BASeLINe YeAr
BASeLINe vALUe
TArGeTS DATA SoUrCe
reSPoNSIBLe AGeNCY(IeS)
LINKTo SDG
2018/19
2019/20
2020/21
2021/22
2022/23
Net Enrolment rate (disaggre-gate by sex)
% 2017 51.1 58 69 75 80 86 NESSP, ESA
MoEd
Improved Adult & child numer-acy and literacy Skills
Enrollment in adult and continuing ed-ucation (ACE) (disaggregate by sex)
No. 2017 227,322 311,000
316,000
321,874
330,000
335,322
NESSP, ESA; Economic Survey
MoEd SDG 4.1.1 SDG 4.6.1
Enhanced quality of pri-mary education
Teacher-pupil Ratio at basic education level
Ratio 2017 1:41 1:40 1:40 1:40 1:40 1:40 NESSP MoEd SDG 4.c.1
Teacher-stu-dent Ratio at secondary education level.
Ratio 2017 1:40 1:40 1:40 1:40 1:40 1:40 NESSP MoEd
Textbook: pupil ratio (primary and secondary)
Ratio 1:1 1:1 1:1 1:1 1:1 1:1 NESSP MoEd
Increased Ac-cess to TVETGross Enrol-ment Num-ber 2017
Gross Enrol-ment
Number 2017 226,647 (T)113,963 (M)88,593(F)
249,312(T)137,820(M)111,492(F)
274,243(T) 151,602 (M)122,641(F)
301,667(T)166,762(M)134,905(F)301,667(T)166,762(M)134,905(F)
301,667(T)166,762(M)134,905(F)
315,158(T)166,762 9(m)148,395(F)
Ministerial; reports
MOEd SDG 4.3.1
OUTCOME INDICATORS

38
oUTCoMe INDICATorS UNIT BASeLINe YeAr
BASeLINe vALUe
TArGeTS DATA SoUrCe
reSPoNSIBLe AGeNCY(IeS)
LINKTo SDG
2018/19
2019/20
2020/21
2021/22
2022/23
SeCTor: eDUCATIoN AND TrAINING Improved gender equity in education sector
Gender Parity Index
Ratio 2017 0.7 0.8 0.8 0.8 0.9 0.9 MOEd reports
MOEd SDG 4.5.1
Improved ac-cess to univer-sity Education by eligible students
Enrolment Rate % 2017 85 87 88 89 90 93 MOEd; Economic Survey
MOEd SDG 4.3.1
SeCTor: heALTh
Reduced child Mortality
Under -5 mor-tality rate
/1000 2014 52 48 47 45 43 40 KDHS MOH SDG 3.2.1
Infant mortality rate
/1000 2014 39 35 33 30 31 28 KDHS MOH SDG 3.2.1
Infant mortality rate
/1000 2014 39 35 33 30 31 28 KDHS MOH SDG 3.2.1
Neonatal mor-tality rate
/1000 2014 22 21 21 20 20 19 KDHS MOH SDG 3.2.2
Proportion of under 1 year old children fully immunized
% 2017 82 84 86 88 88 90 DHIS 2 MOH
DPT/Hib/Heb (Penta3) Cov-erage
% 2017 82 85 88 90 92 95 DHIS 2 MOH

39
oUTCoMe INDICATorS UNIT BASeLINe YeAr
BASeLINe vALUe
TArGeTS DATA SoUrCe
reSPoNSIBLe AGeNCY(IeS)
LINKTo SDG
2018/19
2019/20
2020/21
2021/22
2022/23
Reduced Ma-ternal Mortality
Maternal Mor-tality rate
/100,000 2014 362 340 320 300 270 250 KDHS MOH SDG 3.1.1
Improved maternal and neonatal health
Proportion of births attend-ed by skilled health person-nel
% 2017 61.8 66 72 78 85 90 DHIS 2 MOH SDG 3.1.2
4th ANC Cov-erage
(%) 2017 53 52 55 60 65 70 DHIS 2 MOH
Modern contraceptive prevalence rate (mCPR)
Rate 2017 56.4 56.8 57 57.6 58 58.4 KDHS MOH SDG 3.7.1
Unmet need for family planning
% 2017 14.6 14.2 13.8 13.4 13.2 13 KDHS MOH SDG 3.7.1
Reduced ma-laria, HIV/AIDS, TB incidences
Climate re-lated Malaria incidence per 1000 popula-tion
Ratio 2017 8 4 4 4 3 3 DHIS 2 MOH SDG 3.3.3
TB incidence per 100,000 population
Ratio 2017 266 172 150 150 130 120 DHIS 2 MOH SDG 3.3.2
TB treatment success rate
% 2017 90 92 93 94 95 95 TIBU MOH
% change in New HIV infec-tions
% 2015 5.6 5 5 5 5 5 KENPHI-AEconom-ic Survey
MOH SDG 3.3.1
OUTCOME INDICATORS

40
oUTCoMe INDICATorS UNIT BASeLINe YeAr
BASeLINe vALUe
TArGeTS DATA SoUrCe
reSPoNSIBLe AGeNCY(IeS)
LINKTo SDG
2018/19
2019/20
2020/21
2021/22
2022/23
TB incidence per 100,000 population
Ratio 2017 266 172 150 150 130 120 DHIS 2 MOH SDG 3.3.2
Reduced life-style diseases related mor-tality
Proportion of population accessing specialized healthcare (cardiovascular, cancer, diabe-tes and renal diseases )
% 2017 12 16 20 22 47 50 DHIS 2 MOH SDG 3.4.1
Increased ac-cess to univer-sal healthcare
Doctors per 10,000 popu-lation
Ratio 2016 1.5 1.7 2.5 2.3 4 5 iHRIS MOH SDG 3.c.1
Nurses per 10,000 popu-lation
Ratio 2016 8.3 12 16 18 20 23 iHRIS MOH SDG 3.c.1
Average distance to nearest health facility
Kms 2014 9.8 9 8 7 6 5 KHHEUS, KDHS
MOH SDG 3.c.1
SeCTor: eNvIroNMeNT, WATer AND SANITATIoNImproved access to clean and safe water
Proportion of national pop-ulation using basic drinking water services
% 2016 60.0 64 68 72 76 80 Annual Water Sector Review; KIHBS
MWS SDG 6.1.1 SDG 3.9.2
6Percentage of population using an improved source of drinking water (improved source of drinking water include: Piped water into dwelling yard or plot, borehole or tube wells, protected dug wells, protected spring, rainwater and packaged or delivered water) with a total collection time of 30 minutes or less for a round-trip, including queuing

41
oUTCoMe INDICATorS UNIT BASeLINe YeAr
BASeLINe vALUe
TArGeTS DATA SoUrCe
reSPoNSIBLe AGeNCY(IeS)
LINKTo SDG
2018/19
2019/20
2020/21
2021/22
2022/23
Urban pop-ulation with access to clean and safe water
% 2016 70.3 72 75 78 80 83 Annual Water Sector Review
MWS
Rural pop-ulation with access to clean and safe water
% 2016 55.9 60 64 68 72 76 Annual Water Sector Review
MWS
Annual per capita water availability
Cubic metres
2016 647 717 788 859 929 1000 UNESCO report, 2013 WB
MWS SDG 6.4.1
Proportion of water bodies with good ambient water quality
% 2017 35.5 37 40 45 48 50 SDG 6 Progress report to UN Water
MWS SDG 6.3.2
Outcome 2: Improved water use efficiency
Proportion of non-revenue water
% 2017 42 41 39 37 35 33 Impact WASREB report
MWS SDG 6.4.2
Level of wa-ter stress: freshwater withdrawal as a proportion of available freshwater resources
% 2017 20.2 20 20 20 20 20 MWS SDG6 Report; WASSMO
MWS SDG 6.4.2
6Percentage of population using an improved source of drinking water (improved source of drinking water include: Piped water into dwelling yard or plot, borehole or tube wells, protected dug wells, protected spring, rainwater and packaged or delivered water) with a total collection time of 30 minutes or less for a round-trip, including queuing
OUTCOME INDICATORS

42
oUTCoMe INDICATorS UNIT BASeLINe YeAr
BASeLINe vALUe
TArGeTS DATA SoUrCe
reSPoNSIBLe AGeNCY(IeS)
LINKTo SDG
2018/19
2019/20
2020/21
2021/22
2022/23
Change in wa-ter-use efficien-cy over time
USD/ M3 2017 9.138 10 12 15 17 17 MWS SDG6 Report; WASSMO
MWS SDG 6.4.1
Increased wa-ter harvesting and storage capacity
Water storage capacity per capita
m³/capita 2016 3.4 4 4.5 5 5.5 6 Annual Water Sector Review; WASSMO
MWSMOALFI
SDG 6.4.1
Increased ac-cess to sanita-tion
Percentage of population using basic sanitation ser-vices
% 2016 67.5 71.0 74.5 78 81.5% 85 Annual Water Sector Review; WASSMO
MWS SDG 6.2.1
Percentage of population practising open defecation
% 2017 12.5 11 9 7 5 0 CLTS system; SDG 6 Progress report
MWS
Proportion of Urban popu-lation with ac-cess to sewer-age connection
% 2016 25 28 31 34 37 40 WASREB Impact report
MWS
Population whose excreta are deposited (directly or after being covered by a layer of earth) in the bush, a field, a beach, or other open area; are discharged into a drainage channel, river, sea, or other water body; or are wrapped in temporary material and discarded. With an assumption that there is possible additional degradation, it is estimated that by end of plan period, 70% of degraded land will have been restored.

43
oUTCoMe INDICATorS UNIT BASeLINe YeAr
BASeLINe vALUe
TArGeTS DATA SoUrCe
reSPoNSIBLe AGeNCY(IeS)
LINKTo SDG
2018/19
2019/20
2020/21
2021/22
2022/23
Improved sustainability of water-Related Ecosystems including, mountains, for-ests, wetlands, rivers, aquifers and lakes
Proportion of land area under forest cover
% 2016 7.24 7.34 7.5 7.62 7.8 8.0 Ministerial reports
MOEF SDG 15.1.1
Area of moun-tain ecosys-tems sustaina-bly conserved and managed
No. of Hectares
2017 553,896 624,000
698,000
774,000
8,506,200
924,200
Ministerial reports
MOEFMTW
SDG 15.4.1
Proportion of degraded landscapes restored
% 2017 20 30 40 50 60 70 Ministerial reports
MOEF SDG 15.3.1
Area of inland freshwater ecosystems and wetlands protected
No. of Hectares
2017 - 1000 1000 1000 1000 1000 Ministerial reports
MOEF SDG 15.1.2
Area of Forest-ed Watersheds protected and conserved
No. of Hectares
2017 350,000 420,000
490,000
560,000
620,000
690,000
Ministerial reports
MOEF SDG 15.1.2
Area of inland freshwater ecosystems and wetlands protected
Hectares 2017 - 1000 1000 1000 1000 1000 KWTA reports
MOEF SDG 15.1.2
7Population whose excreta are deposited (directly or after being covered by a layer of earth) in the bush, a field, a beach, or other open area; are discharged into a drainage channel, river, sea, or other water body; or are wrapped in temporary material and discarded. With an assumption that there is possible additional degrada-tion, it is estimated that by end of plan period, 70% of degraded land will have been restored.
OUTCOME INDICATORS
44
oUTCoMe INDICATorS UNIT BASeLINe YeAr
BASeLINe vALUe
TArGeTS DATA SoUrCe
reSPoNSIBLe AGeNCY(IeS)
LINKTo SDG
2018/19
2019/20
2020/21
2021/22
2022/23
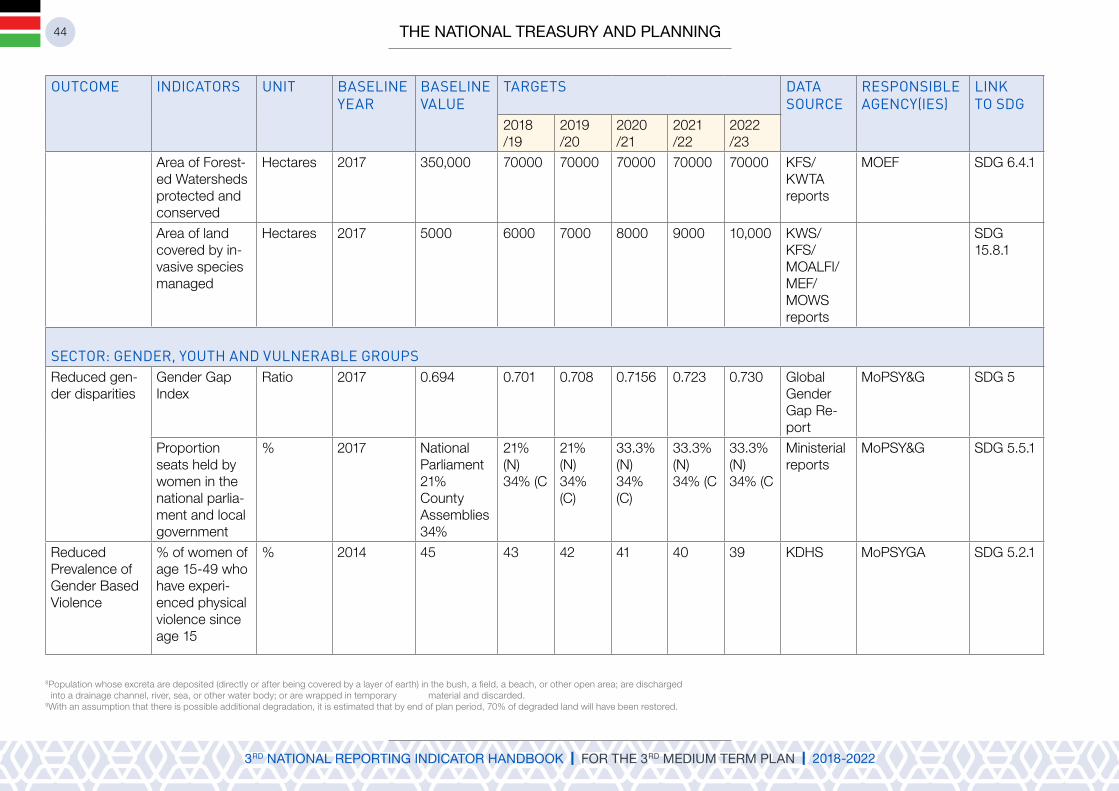
Area of Forest-ed Watersheds protected and conserved
Hectares 2017 350,000 70000 70000 70000 70000 70000 KFS/KWTA reports
MOEF SDG 6.4.1
Area of land covered by in-vasive species managed
Hectares 2017 5000 6000 7000 8000 9000 10,000 KWS/KFS/MOALFI/MEF/MOWS reports
SDG 15.8.1
SeCTor: GeNDer, YoUTh AND vULNerABLe GroUPSReduced gen-der disparities
Gender Gap Index
Ratio 2017 0.694 0.701 0.708 0.7156 0.723 0.730 Global Gender Gap Re-port
MoPSY&G SDG 5
Proportion seats held by women in the national parlia-ment and local government
% 2017 National Parliament 21%County Assemblies 34%
21% (N)34% (C
21% (N)34% (C)
33.3% (N)34% (C)
33.3% (N)34% (C
33.3% (N)34% (C
Ministerial reports
MoPSY&G SDG 5.5.1
Reduced Prevalence of Gender Based Violence
% of women of age 15-49 who have experi-enced physical violence since age 15
% 2014 45 43 42 41 40 39 KDHS MoPSYGA SDG 5.2.1
8Population whose excreta are deposited (directly or after being covered by a layer of earth) in the bush, a field, a beach, or other open area; are discharged into a drainage channel, river, sea, or other water body; or are wrapped in temporary material and discarded.
9With an assumption that there is possible additional degradation, it is estimated that by end of plan period, 70% of degraded land will have been restored.

45
oUTCoMe INDICATorS UNIT BASeLINe YeAr
BASeLINe vALUe
TArGeTS DATA SoUrCe
reSPoNSIBLe AGeNCY(IeS)
LINKTo SDG
2018/19
2019/20
2020/21
2021/22
2022/23
Reduced Prev-alence of FGM
% of girls and women age 15-49 who have undergone FGM (by age and region)
% 2014 21 16 15 14 13 12 KDHS MoPSYGA SDG 5.3.2
Improved well-being of vulnerable groups
Proportion of vulnerable pop-ulation covered by social pro-tection systems by sex and age
% 2017 30 35 40 52 60 72 Single Registry (SR)
MoPSYGA SDG 1.3.1
Proportion of National Safety Net beneficiar-ies enrolled in NHIF Cover
% 2017 15 19 28 38 47 51 SR MoPSYGA
Improved tracking of gen-der budgeting
Functional tracking system for gender equality and women’s em-powerment
A system (standard Chart of Account Systems)
2017 0 0 0 1 - - Ministerial Report
TNT&P SDG 5.c.1
SeCTor: PoPULATIoN, UrBANIzATIoN AND hoUSING Reduced pop-ulation growth
Annual Popu-lation Growth rate
% 2017 2.9 2.7 2.6 2.4 2.3 2.2 Population Census; Population Projection Mono-graphs
TNT&P
OUTCOME INDICATORS

46
oUTCoMe INDICATorS UNIT BASeLINe YeAr
BASeLINe vALUe
TArGeTS DATA SoUrCe
reSPoNSIBLe AGeNCY(IeS)
LINKTo SDG
2018/19
2019/20
2020/21
2021/22
2022/23
Area of Forest-ed Watersheds protected and conserved
Hectares 2017 350,000 70000 70000 70000 70000 70000 KFS/KWTA reports
MOEF SDG 6.4.1
Area of land covered by in-vasive species managed
Hectares 2017 5000 6000 7000 8000 9000 10,000 KWS/KFS/MOALFI/MEF/MOWS reports
SDG 15.8.1
SeCTor: GeNDer, YoUTh AND vULNerABLe GroUPS
Reduced gen-der disparities
Gender Gap Index
Ratio 2017 0.694 0.701 0.708 0.7156 0.723 0.730 Global Gender Gap Re-port
MoPSY&G SDG 5
Proportion seats held by women in the national parlia-ment and local government
% 2017 National Parliament 21%County Assemblies 34%
21% (N)34% (C
21% (N)34% (C)
33.3% (N)34% (C)
33.3% (N)34% (C
33.3% (N)34% (C
Ministerial reports
MoPSY&G SDG 5.5.1
Reduced Prevalence of Gender Based Violence
% of women of age 15-49 who have experi-enced physical violence since age 15
% 2014 45 43 42 41 40 39 KDHS MoPSYGA SDG 5.2.1
47
oUTCoMe INDICATorS UNIT BASeLINe YeAr
BASeLINe vALUe
TArGeTS DATA SoUrCe
reSPoNSIBLe AGeNCY(IeS)
LINKTo SDG
2018/19
2019/20
2020/21
2021/22
2022/23
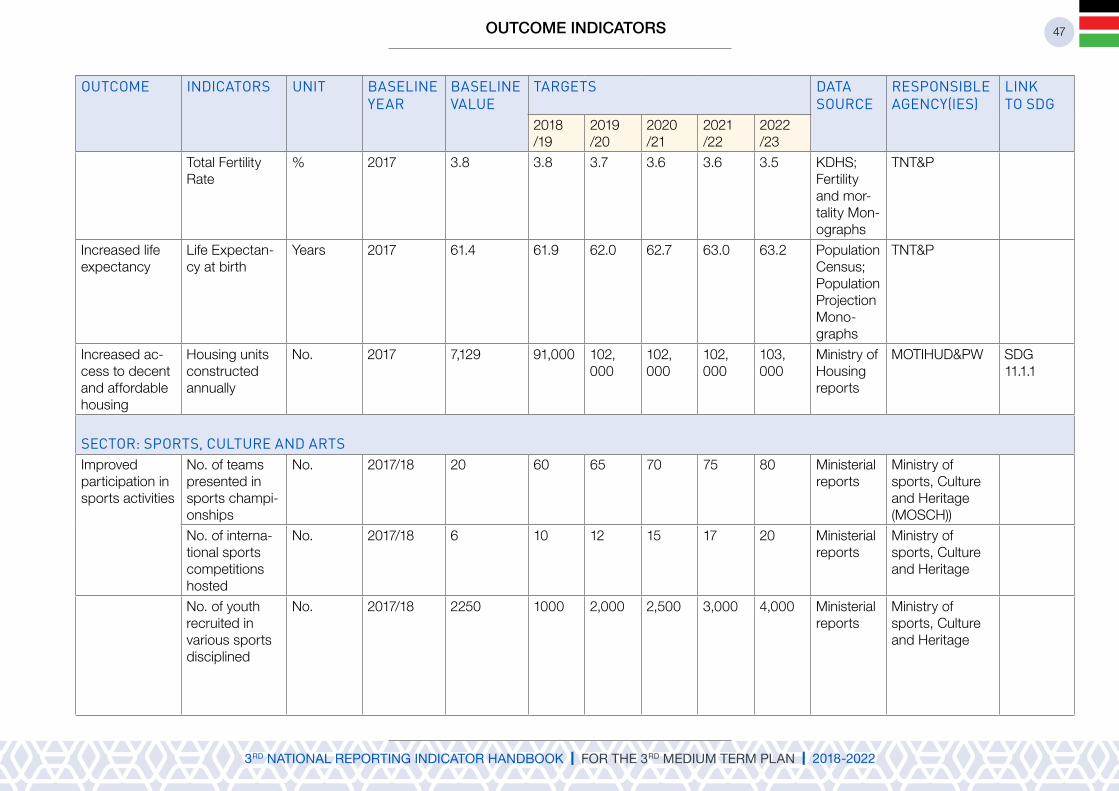
Total Fertility Rate
% 2017 3.8 3.8 3.7 3.6 3.6 3.5 KDHS; Fertility and mor-tality Mon-ographs
TNT&P
Increased life expectancy
Life Expectan-cy at birth
Years 2017 61.4 61.9 62.0 62.7 63.0 63.2 Population Census; Population Projection Mono-graphs
TNT&P
Increased ac-cess to decent and affordable housing
Housing units constructed annually
No. 2017 7,129 91,000 102,000
102,000
102,000
103,000
Ministry of Housing reports
MOTIHUD&PW SDG 11.1.1
SeCTor: SPorTS, CULTUre AND ArTSImproved participation in sports activities
No. of teams presented in sports champi-onships
No. 2017/18 20 60 65 70 75 80 Ministerial reports
Ministry of sports, Culture and Heritage (MOSCH))
No. of interna-tional sports competitions hosted
No. 2017/18 6 10 12 15 17 20 Ministerial reports
Ministry of sports, Culture and Heritage
No. of youth recruited in various sports disciplined
No. 2017/18 2250 1000 2,000 2,500 3,000 4,000 Ministerial reports
Ministry of sports, Culture and Heritage
OUTCOME INDICATORS

48
oUTCoMe INDICATorS UNIT BASeLINe YeAr
BASeLINe vALUe
TArGeTS DATA SoUrCe
reSPoNSIBLe AGeNCY(IeS)
LINKTo SDG
2018/19
2019/20
2020/21
2021/22
2022/23
No. of interna-tional sports competitions hosted
No. 2017/18 6 10 12 15 17 20 Ministerial reports
Ministry of sports, Culture and Heritage
No. of youth recruited in various sports disciplined
No. 2017/18 2250 1000 2,000 2,500 3,000 4,000 Ministerial reports
Ministry of sports, Culture and Heritage
Preserved na-tional heritage and culture
No. of cultural events held
No. 2017/18 12 15 17 18 19 20 Ministerial reports
Ministry of sports, Culture and Heritage
No. of national heritage sites preserved
No. 2017/18 3 4 5 6 7 8 Ministerial reports
Ministry of sports, Culture and Heritage
Increased ac-cess to library and information
No. of persons with access to libraries and information
No 2017/18 15,185,816 15,685,816
16,185,816
16,685,816
17,185,816
17,685,816
Ministerial reports
Ministry of sports, Culture and Heritage
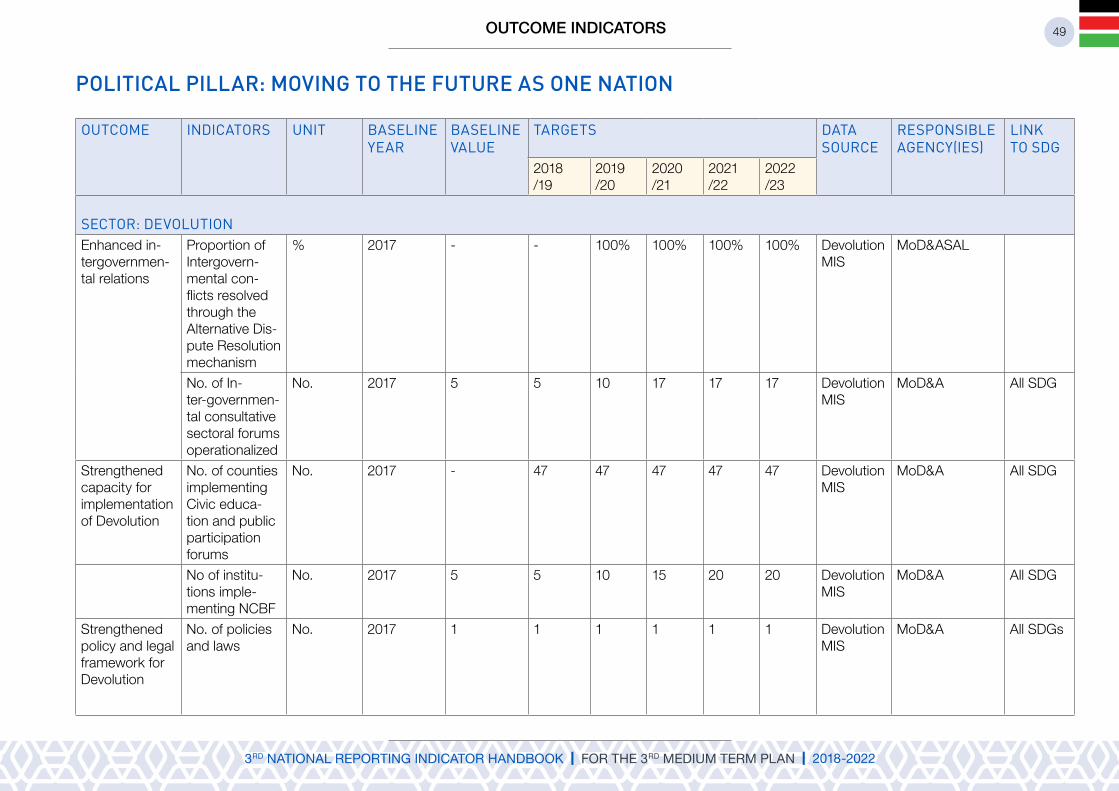
49
POlITICAl PIllAR: MOvING TO THE FUTURE AS ONE NATION
oUTCoMe INDICATorS UNIT BASeLINe YeAr
BASeLINe vALUe
TArGeTS DATA SoUrCe
reSPoNSIBLe AGeNCY(IeS)
LINKTo SDG
2018/19
2019/20
2020/21
2021/22
2022/23
SeCTor: DevoLUTIoNEnhanced in-tergovernmen-tal relations
Proportion of Intergovern-mental con-flicts resolved through the Alternative Dis-pute Resolution mechanism
% 2017 - - 100% 100% 100% 100% Devolution MIS
MoD&ASAL
No. of In-ter-governmen-tal consultative sectoral forums operationalized
No. 2017 5 5 10 17 17 17 Devolution MIS
MoD&A All SDG
Strengthened capacity for implementation of Devolution
No. of counties implementing Civic educa-tion and public participation forums
No. 2017 - 47 47 47 47 47 Devolution MIS
MoD&A All SDG
No of institu-tions imple-menting NCBF
No. 2017 5 5 10 15 20 20 Devolution MIS
MoD&A All SDG
Strengthened policy and legal framework for Devolution
No. of policies and laws
No. 2017 1 1 1 1 1 1 Devolution MIS
MoD&A All SDGs
OUTCOME INDICATORS

50
oUTCoMe INDICATorS UNIT BASeLINe YeAr
BASeLINe vALUe
TArGeTS DATA SoUrCe
reSPoNSIBLe AGeNCY(IeS)
LINKTo SDG
2018/19
2019/20
2020/21
2021/22
2022/23
SeCTor: DevoLUTIoNStrengthened policy and legal framework for Devolution
No. of policies and laws
No. 2017 1 1 1 1 1 1 Devolution MIS
MoD&A All SDGs
SeCTor: GJLoS
Enhanced ac-cess to Justice/legal services
Enhanced ac-cess to Justice/legal services
ratio ratio 2017 1: 295,792
- - - - Judiciary reports
Judiciary SDG 16.3
Magistrates to population ratio
ratio 2017 1:68,840 Judiciary reports
Judiciary SDG 16.3
Average time to disposition
days 2017 526 450 360 360 360 360 Judiciary reports
Judiciary SDG 16.3.
Case Clear-ance Rate (CCR)
Percent-age
2017 88% 110% 110% 110% 110% 110% Judiciary reports
Judiciary SDG 16.3
Remandees as a proportion of overall prison population (Proposal)
2017 SDG 16.3
No. of counties where legal aid rolled out
No. 2017 5 7 10 14 18 21 NLAS reports
OAG&DOJ SDG 16.3
Number of vulnerable per-sons accessing legal aid
2017 15,000 20000 30000 40000 50000 60000 NLAS Reports
OAG&DOJ SDG 16.3

51
oUTCoMe INDICATorS UNIT BASeLINe YeAr
BASeLINe vALUe
TArGeTS DATA SoUrCe
reSPoNSIBLe AGeNCY(IeS)
LINKTo SDG
2018/19
2019/20
2020/21
2021/22
2022/23
SeCTor: DevoLUTIoNNo. of High Courts estab-lished
Number 2017 39 - 3 2 2 2 Judiciary reports
Judiciary SDG 16.3
Courts estab-lished (High courts; magis-trates’ courts and small claims courts.)
No. of Magis-trates Courts established
Number 2017 123 41 41 41 41 Judiciary reports
Judiciary
No. of circuit/mobile courts established
Number 2017 54 4 4 4 4 Judiciary reports
Judiciary
No. of Courts constructed
Number 2017 5 23 40 40 40 Judiciary reports
Judiciary
Number of courts with an operational-ized mediation annex
Number 2017 1 5 5 10 10 10 Judiciary reports
Judiciary SDG 16.3
Court annexed mediation op-erationalized
Percentage of courts with au-tomated case mgmt. system)
percent-age
2017 20 40 60 80 100 Judiciary reports
Judiciary SDG 16.3
Case manage-ment systems
% of online knowledge management system devel-opment
percent-age
2017 0 - 50 50 - - Depart-mental reports
OAG&DOJ
OUTCOME INDICATORS
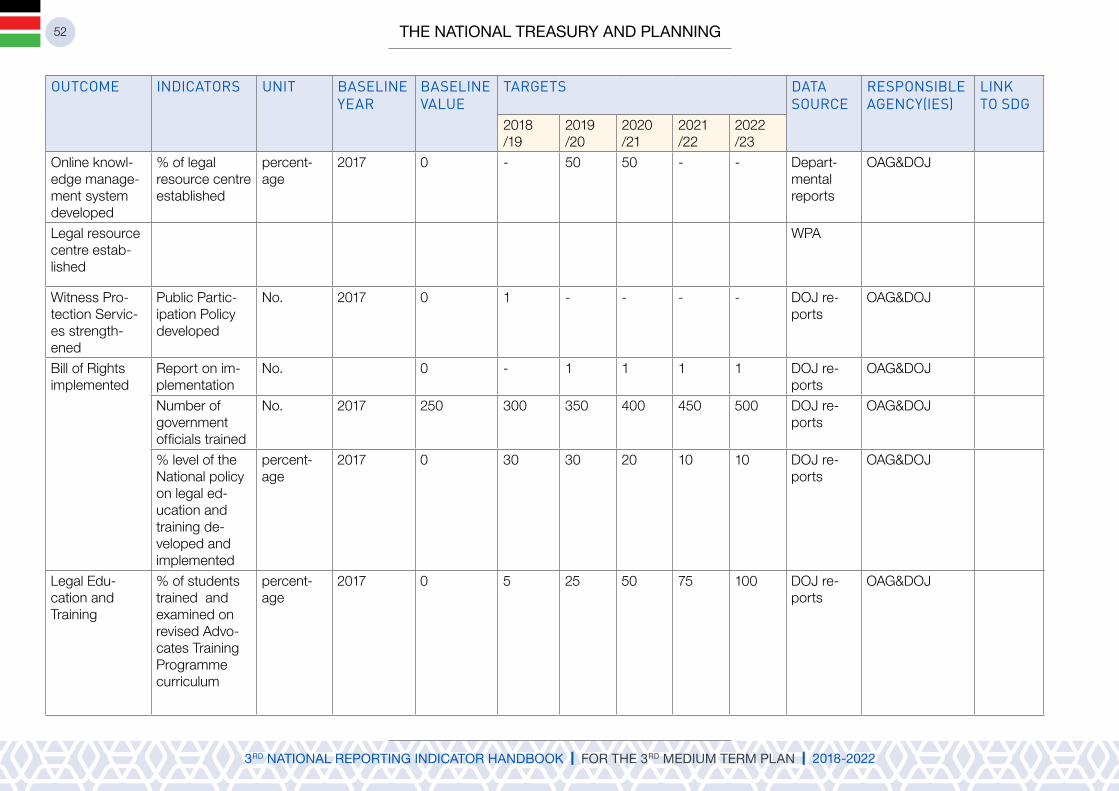
52
oUTCoMe INDICATorS UNIT BASeLINe YeAr
BASeLINe vALUe
TArGeTS DATA SoUrCe
reSPoNSIBLe AGeNCY(IeS)
LINKTo SDG
2018/19
2019/20
2020/21
2021/22
2022/23
Online knowl-edge manage-ment system developed
% of legal resource centre established
percent-age
2017 0 - 50 50 - - Depart-mental reports
OAG&DOJ
Legal resource centre estab-lished
WPA
Witness Pro-tection Servic-es strength-ened
Public Partic-ipation Policy developed
No. 2017 0 1 - - - - DOJ re-ports
OAG&DOJ
Bill of Rights implemented
Report on im-plementation
No. 0 - 1 1 1 1 DOJ re-ports
OAG&DOJ
Number of government officials trained
No. 2017 250 300 350 400 450 500 DOJ re-ports
OAG&DOJ
% level of the National policy on legal ed-ucation and training de-veloped and implemented
percent-age
2017 0 30 30 20 10 10 DOJ re-ports
OAG&DOJ
Legal Edu-cation and Training
% of students trained and examined on revised Advo-cates Training Programme curriculum
percent-age
2017 0 5 25 50 75 100 DOJ re-ports
OAG&DOJ

53
oUTCoMe INDICATorS UNIT BASeLINe YeAr
BASeLINe vALUe
TArGeTS DATA SoUrCe
reSPoNSIBLe AGeNCY(IeS)
LINKTo SDG
2018/19
2019/20
2020/21
2021/22
2022/23
SeCTor: DevoLUTIoN% Completion level of the Well-equipped library
percent-age
2017 0 25 30 20 15 10 Depart-mental reports
OAG&DOJ
Improve Busi-ness processes in the provision of legal servic-es
% level of competency capacity devel-opment of legal staff
percent-age
2017 0 15 15 20 25 25 Depart-mental reports
OAG&DOJ
% level of satisfaction with elections declared (free, fair and cred-ible)
percent-age
2017 0 40 10 5 5 40 Depart-mental reports
OAG&DOJ
Electoral and Political Pro-cesses
% reduction in boundaries dis-putes petitions
percent-age
2017 0 - - 95 5 - IEBC reports
IEBC
% level of Re-vision of Maps and alignment of administra-tive boundaries to electoral boundaries
percent-age
- - - - 76 23 1 IEBC reports
IEBC
% level of establishment of Geo-coordi-nates for polling stations
percent-age
- - 20 5 50 - 25 IEBC reports
IEBC
OUTCOME INDICATORS
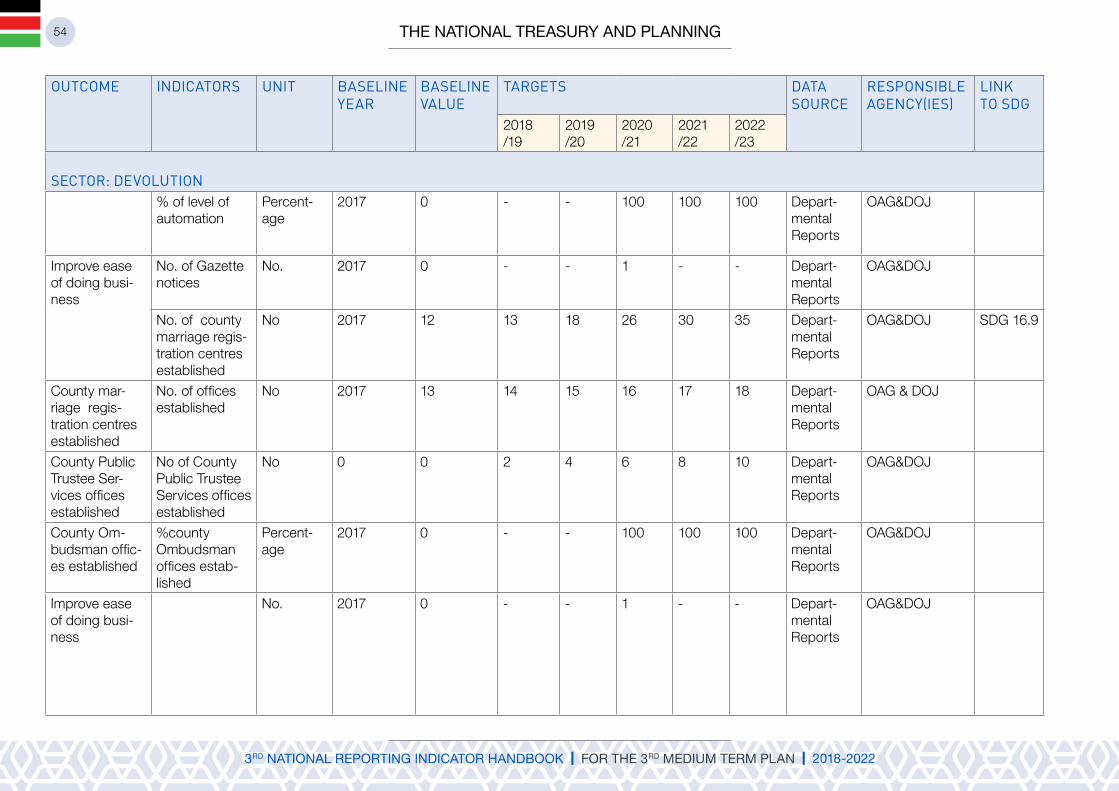
54
oUTCoMe INDICATorS UNIT BASeLINe YeAr
BASeLINe vALUe
TArGeTS DATA SoUrCe
reSPoNSIBLe AGeNCY(IeS)
LINKTo SDG
2018/19
2019/20
2020/21
2021/22
2022/23
SeCTor: DevoLUTIoN% of level of automation
Percent-age
2017 0 - - 100 100 100 Depart-mental Reports
OAG&DOJ
Improve ease of doing busi-ness
No. of Gazette notices
No. 2017 0 - - 1 - - Depart-mental Reports
OAG&DOJ
No. of county marriage regis-tration centres established
No 2017 12 13 18 26 30 35 Depart-mental Reports
OAG&DOJ SDG 16.9
County mar-riage regis-tration centres established
No. of offices established
No 2017 13 14 15 16 17 18 Depart-mental Reports
OAG & DOJ
County Public Trustee Ser-vices offices established
No of County Public Trustee Services offices established
No 0 0 2 4 6 8 10 Depart-mental Reports
OAG&DOJ
County Om-budsman offic-es established
%county Ombudsman offices estab-lished
Percent-age
2017 0 - - 100 100 100 Depart-mental Reports
OAG&DOJ
Improve ease of doing busi-ness
No. 2017 0 - - 1 - - Depart-mental Reports
OAG&DOJ

55
PART IIIFlAGSHIP/PRIORITY
PROJECTS
56

57
FLAGShIP/PrIorITY ProJeCT
oUTPUT INDICATor TArGeTS reSPoNSIBLe AGeNCY(IeS)
2018/19
2019/20
2020/21
2021/22
2022/23
MACroeCoNoMIC FrAMeWorK
STATISTICAL reForMS
Rebasing of National Accounts
Time-use survey conduct-ed
Time-use survey report - 1 - - - SDP
Tracking MTP M&E reports prepared No of M&E reports[1] 1 1 1 1 1 SDP
FoUNDATIoNS For NATIoNAL TrANSForMATIoN/eNABLerS PILLAr;DePLoYING WorLD CLASS INFrASTrUCTUre FACILITIeS AND ServICeSSUB-SeCTor: roADS
Mombasa-Nairobi six lane highway toll road
km of the six lane High-way Constructed
Length of Road Con-structed( Kms)
- - 100 250 450 MOTIHUD&PW
East Africa Road Network Project (EARNP)
Km of road Constructed Length of Road Con-structed( Kms)
60 82 110 150 190
Kenya Transport Sector Support Project
Km of road Constructed Length of Road Con-structed( Kms)
38 53 - - -
East Africa Regional Transport, Trade and Development Facilitation Project
Km of road Constructed Length of Road Con-structed( Kms)
70 148 226 286 344
National Urban Transport Improvement Project (NUTRIP)
Km of road Constructed Length of Road Con-structed( Kms)
11 33 41 44 47
FLAGSHIP/PRIORITY PROJECTS

58
FLAGShIP/PrIorITY ProJeCT
oUTPUT INDICATor TArGeTS reSPoNSIBLe AGeNCY(IeS)
2018/19
2019/20
2020/21
2021/22
2022/23
Decongestion of cities and urban areas
Km bypasses constructed Length of Bypass Con-structed( Kms)
80 185 245 293 308 MOTIHUD&PW
Km of missing links Con-structed
Length of Road Con-structed( Kms)
25 33 - - -
Km of Non-Motorized Transport Facilities
Length Constructed( Kms) 8 16 24 32 40
Roads 10,000 (Low Vol-ume Sealed Roads)
Km of Roads Construct-ed
Kms of roads construct-ed
1,400 2,800 4,200 5,850 7,500 MOTIHUD&PW
Roads 2000(Low Volume Sealed Roads)
Km of Roads Construct-ed
Kms of roads construct-ed
50 90 130 155 177 MOTIHUD&PW
Roads 2000 Programme Gravel)
Km of Roads Maintained Length of roads(Kms) un-der R2000 Maintenance
61 119 179 238 299 MOTIHUD&PW
Periodic Maintenance Km under Periodic Main-tenance
Length of Kms of roads under periodic mainte-nance
1,280 2,560 3,840 5,120 6400 MOTIHUD&PW
Routine MaintenanceKm of Roads under Rou-tine Maintenance
Kms of roads under rou-tine maintenance
29,062 58,124 87,186 116,248 145,310 MOTIHUD&PW
Reconstruction /Rehabili-tation of Roads
Km of roads reconstruct-ed/rehabilitated
Kms of roads recon-structed/rehabilitated
123 248 374 501 629 MOTIHUD&PW
Development of 20year Roads Master Plan
Master Plan Developed Roads Master Plan - - - - 1 MOTIHUD&PW
[1] M&E reports include: Annual Public Report, Public Expenditure Review, Evaluation Reports; MTP Review.
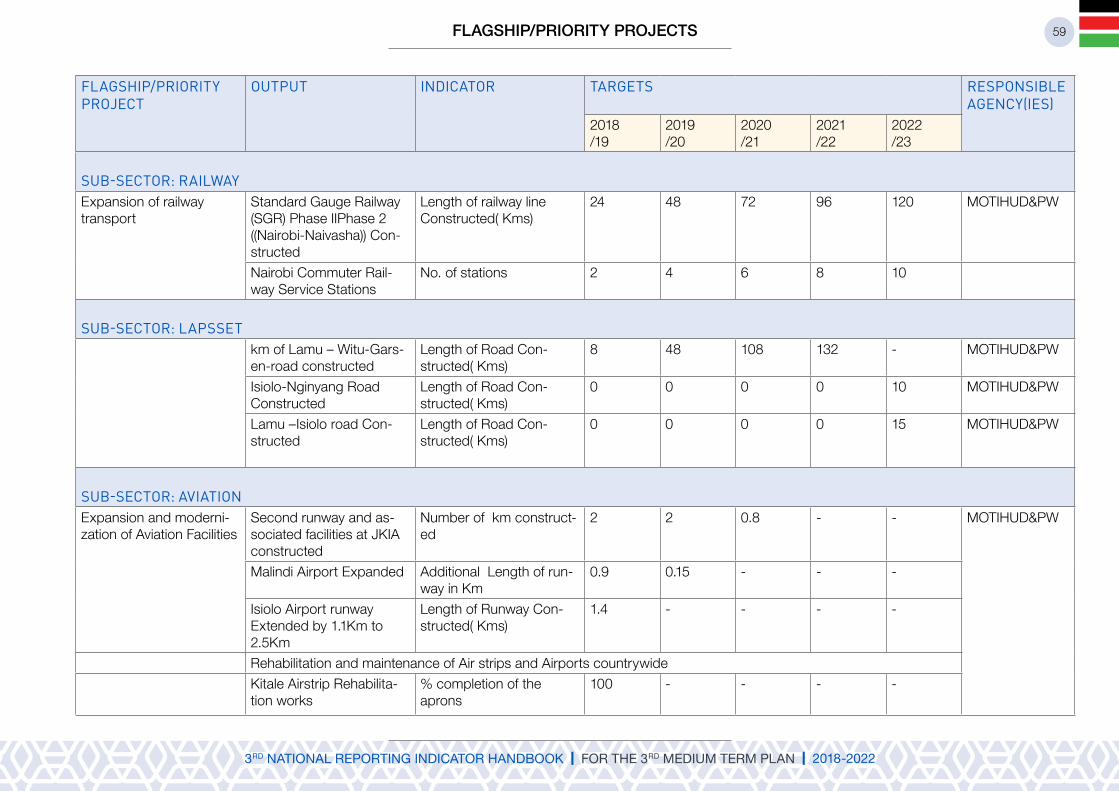
59
FLAGShIP/PrIorITY ProJeCT
oUTPUT INDICATor TArGeTS reSPoNSIBLe AGeNCY(IeS)
2018/19
2019/20
2020/21
2021/22
2022/23
SUB-SeCTor: rAILWAYExpansion of railway transport
Standard Gauge Railway (SGR) Phase IIPhase 2 ((Nairobi-Naivasha)) Con-structed
Length of railway line Constructed( Kms)
24 48 72 96 120 MOTIHUD&PW
Nairobi Commuter Rail-way Service Stations
No. of stations 2 4 6 8 10
SUB-SeCTor: LAPSSeTkm of Lamu – Witu-Gars-en-road constructed
Length of Road Con-structed( Kms)
8 48 108 132 - MOTIHUD&PW
Isiolo-Nginyang Road Constructed
Length of Road Con-structed( Kms)
0 0 0 0 10 MOTIHUD&PW
Lamu –Isiolo road Con-structed
Length of Road Con-structed( Kms)
0 0 0 0 15 MOTIHUD&PW
SUB-SeCTor: AvIATIoNExpansion and moderni-zation of Aviation Facilities
Second runway and as-sociated facilities at JKIA constructed
Number of km construct-ed
2 2 0.8 - - MOTIHUD&PW
Malindi Airport Expanded Additional Length of run-way in Km
0.9 0.15 - - -
Isiolo Airport runway Extended by 1.1Km to 2.5Km
Length of Runway Con-structed( Kms)
1.4 - - - -
Rehabilitation and maintenance of Air strips and Airports countrywideKitale Airstrip Rehabilita-tion works
% completion of the aprons
100 - - - -
FLAGSHIP/PRIORITY PROJECTS

60
FLAGShIP/PrIorITY ProJeCT
oUTPUT INDICATor TArGeTS reSPoNSIBLe AGeNCY(IeS)
2018/19
2019/20
2020/21
2021/22
2022/23
Lokichoggio Airport Phase II
% completion 100 - - - -
Moyale Runway and fencing Rehabilitation
% completion - - 100 - -
Migori runway, Fenced Aistrip Land&Terminal Building
% completion - 100 - - -
Lodwar Car Park, Access Road and the Fence
% completion - - - 55 45
Musiara – Narok Runway % completion - - - 15 85
Mandera Airport 1.5km long by 30m wide. Run-way constructed Apron, Drainage works and associated signage and Fencing
% completion - - - 75 25
SUB-SeCTor: MArITIMeImprovement of Shipping and Maritime Facilities
Second Container Termi-nal Phase II & III Expand-ed
Percentage expansion 2% 40% 60% 100% - MOTI&UD
Dongo Kundu Free Trade Port Constructed
Level of completion - - -- - 10%Construc-tion

61
FLAGShIP/PrIorITY ProJeCT
oUTPUT INDICATor TArGeTS reSPoNSIBLe AGeNCY(IeS)
2018/19
2019/20
2020/21
2021/22
2022/23
SUB-SeCTor: eNerGYIncrease power Genera-tion
Second runway and as-sociated facilities at JKIA constructed
Number of km construct-ed
2 2 0.8 - - MOTIHUD&PW
290 Wells drilled MW Generated 15 69 70 72 64 MOE800MW of wind installed in Ngong, Lake Turkana, and Meru among others
MW Generated 300 10 80 360 50 MOE
93 MW installed from hydro projects
MW Generated 27.6 19.5 24 1.5 20.4 MOE
442 MW installed from solar projects
MW Generated 60 52 80 170 80 MOE
157 MW installed from biomass projects
MW Generated 10 11 21 - 11.5 MOE
328MW installed from coal power projects
MW Generated - - - - 328 MOE
1130 MW installed from multipurpose dam pro-jects
MW Generated - - - - 80 MOE
Power Transmission 5,121Km of power trans-mission lines and 77 high voltage substations constructed
Km/kV constructed - 1,868 1,203 1,369 81 MOE
Last Mile Connectivity Project
5 Million Households Connected
No. of Households 1,000,000 1,000,000 1,000,000 1,000,000 1,000,000 MOE
15,739 Public Facilities projects connected
No of Public Facilities 174 250 7,440 7,440 7,440 MOE
Public Street Lighting Project implemented
No. of Street Lighting points Installed
35,346 30,000
25,000
25,000
15,000 MOE
FLAGSHIP/PRIORITY PROJECTS

62
FLAGShIP/PrIorITY ProJeCT
oUTPUT INDICATor TArGeTS reSPoNSIBLe AGeNCY(IeS)
2018/19
2019/20
2020/21
2021/22
2022/23
SUB-SeCTor: eNerGYDistribution Network Ex-pansion and Improvement
116 New primary distri-bution substations con-structed
No. of Substations 3 3 11 40 49 MOE
Renewable Energy Tech-nologies
No. of Institutional Bio digesters constructed
No. 0 2 2 2 2 MOE
No. of House with Biogas Digesters Constructed
No 304 200 400 400 400 MOE
SeCTor: INForMATIoN AND CoMMUNICATIoN TeChNoLoGY
National ICT Infrastructure Programme
2,500 Km of National Optic Fibre Backbone Infrastructure (NOFBI) constructed
Km of Optic Fibre 500 500 500 500 500 MoICT
47 Counties connected to NOFBI in the County Con-nectivity Project Phase III
No. of buildings connect-ed in the 47 Counties
50 50 50 50 50 MoICT
Government Common Core Network (GCCN) Programme
No. of MDA’s connected 52 60 80 90 100 MoICT
Integrated Government Unified Communication System Project
No. of MDA’s connected 52 60 80 90 100 MoICT
6 e-Waste Management Centres established in economic zones across the country
No. of e-Waste Manage-ment Centres
0 1 3 4 6 MoICT
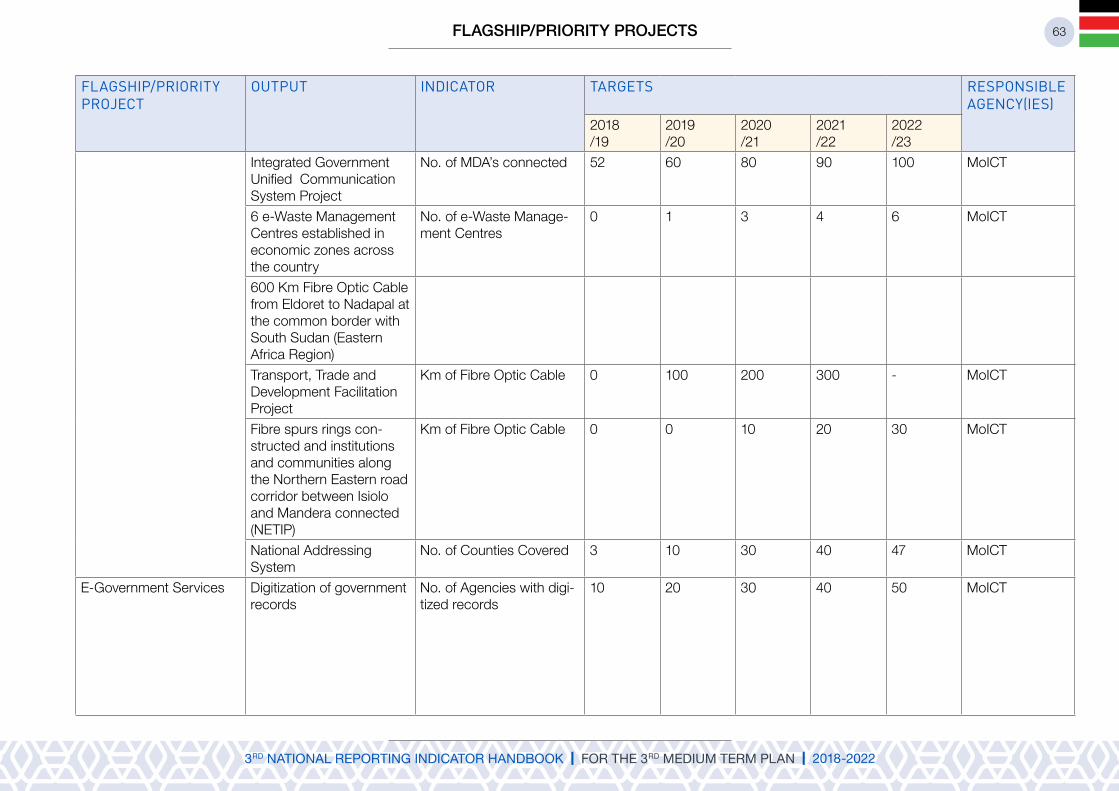
63
FLAGShIP/PrIorITY ProJeCT
oUTPUT INDICATor TArGeTS reSPoNSIBLe AGeNCY(IeS)
2018/19
2019/20
2020/21
2021/22
2022/23
Integrated Government Unified Communication System Project
No. of MDA’s connected 52 60 80 90 100 MoICT
6 e-Waste Management Centres established in economic zones across the country
No. of e-Waste Manage-ment Centres
0 1 3 4 6 MoICT
600 Km Fibre Optic Cable from Eldoret to Nadapal at the common border with South Sudan (Eastern Africa Region)Transport, Trade and Development Facilitation Project
Km of Fibre Optic Cable 0 100 200 300 - MoICT
Fibre spurs rings con-structed and institutions and communities along the Northern Eastern road corridor between Isiolo and Mandera connected (NETIP)
Km of Fibre Optic Cable 0 0 10 20 30 MoICT
National Addressing System
No. of Counties Covered 3 10 30 40 47 MoICT
E-Government Services Digitization of government records
No. of Agencies with digi-tized records
10 20 30 40 50 MoICT
FLAGSHIP/PRIORITY PROJECTS
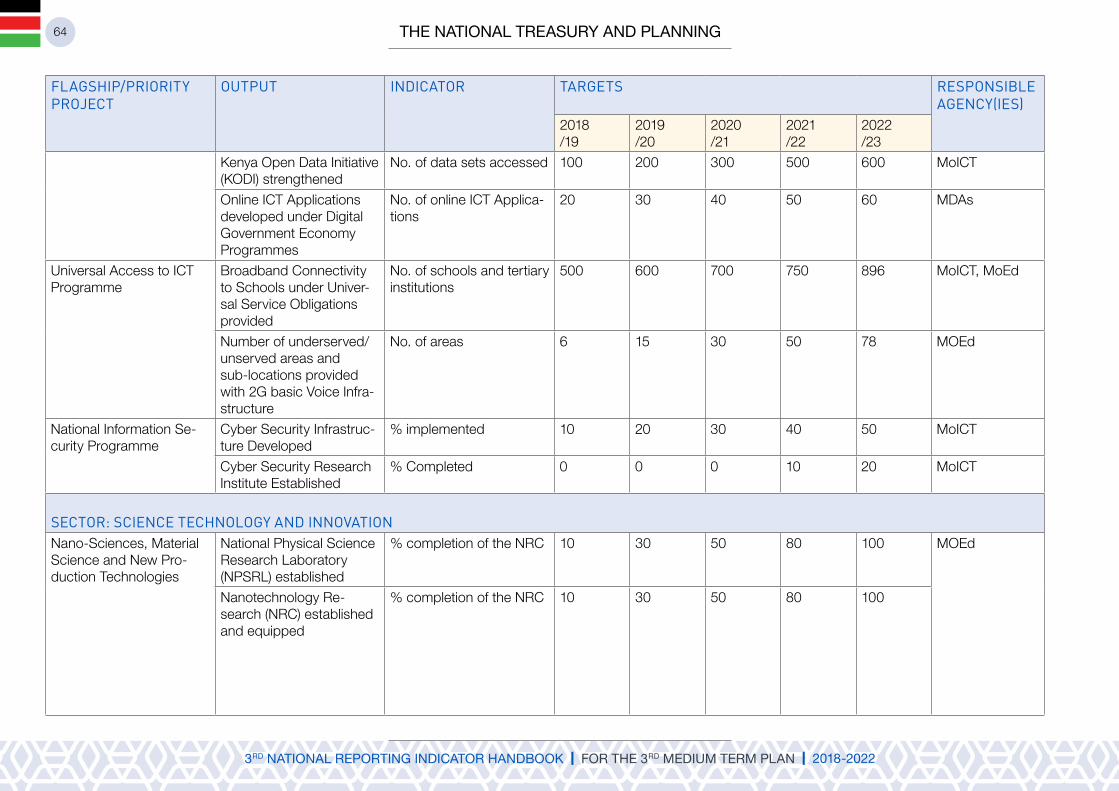
64
FLAGShIP/PrIorITY ProJeCT
oUTPUT INDICATor TArGeTS reSPoNSIBLe AGeNCY(IeS)
2018/19
2019/20
2020/21
2021/22
2022/23
Kenya Open Data Initiative (KODI) strengthened
No. of data sets accessed 100 200 300 500 600 MoICT
Online ICT Applications developed under Digital Government Economy Programmes
No. of online ICT Applica-tions
20 30 40 50 60 MDAs
Universal Access to ICT Programme
Broadband Connectivity to Schools under Univer-sal Service Obligations provided
No. of schools and tertiary institutions
500 600 700 750 896 MoICT, MoEd
Number of underserved/unserved areas and sub-locations provided with 2G basic Voice Infra-structure
No. of areas 6 15 30 50 78 MOEd
National Information Se-curity Programme
Cyber Security Infrastruc-ture Developed
% implemented 10 20 30 40 50 MoICT
Cyber Security Research Institute Established
% Completed 0 0 0 10 20 MoICT
SeCTor: SCIeNCe TeChNoLoGY AND INNovATIoNNano-Sciences, Material Science and New Pro-duction Technologies
National Physical Science Research Laboratory (NPSRL) established
% completion of the NRC 10 30 50 80 100 MOEd
Nanotechnology Re-search (NRC) established and equipped
% completion of the NRC 10 30 50 80 100

65
FLAGShIP/PrIorITY ProJeCT
oUTPUT INDICATor TArGeTS reSPoNSIBLe AGeNCY(IeS)
2018/19
2019/20
2020/21
2021/22
2022/23
Space Science Technol-ogy Development Pro-gramme:
Centre for Microsatellite Technology Development Established and Opera-tionalized
% of Completion 10 20 40 70 100 MOEd
The Square Kilometer Array (SKA) Acquired and operationalized
% of Completion 10 50 80 100 -
Energy Technologies De-velopment Programme
Renewable Energies Re-search Laboratory Estab-lished
% of Completion 30 50 70 90 100 MOEd
The Centre for Petrole-um and Gas Exploration Research Equipped and operational
% of Completion 30 50 70 90 100
Science, Technology, En-gineering and Mathemat-ics (STEM) Programme
Kenya Advanced Institute of Science and Technolo-gy (KAIST) established
% Completion 10 35 60 85 100 MOEd
Institution of Applied Sciences Established
% Completion 10 20 50 75 100
Centres of Excellence in Universities and Research Institutions Improved
No of Centres of Excel-lence
3 3 3 3 3
Centres of Excellence in Universities and Research Institutions Improved
No of Centres of Excel-lence
3 3 3 3 3
Coordination of Technolo-gy and Innovation Com-mercialization Programme
National, Science Tech-nology and Innovation parks established in Konza Technopolis and Dedan Kimathi University of Technology
% Completion 10 30 60 80 100 MoICT
FLAGSHIP/PRIORITY PROJECTS

66
FLAGShIP/PrIorITY ProJeCT
oUTPUT INDICATor TArGeTS reSPoNSIBLe AGeNCY(IeS)
2018/19
2019/20
2020/21
2021/22
2022/23
County Technology and Innovation Delivery Ser-vices Programme
County Technology and Innovations Advisory and Prospective Centres Established
No. of Centres 8 20 10 7 2 MoICT
SeCTor: LAND reForMSProcessing and Registra-tion of Title Deeds
1,650,000 Title Deeds Registered
No.of title deeds regis-tered
350,000 350,000 350,000 300,000 300,000
National Land Manage-ment Information System
29 Land Registries Con-structed
No. of Land Registries 5 6 6 6 6 MOLPP
35 land registries rehabil-itated
No. of Land Registries 7 7 7 7 7
Land registration process-es automated in 83 land offices
No. of Land Offices digi-tized
18 15 15 15 20 MOLPP
Develop a National Land Value Index
A National land value index Implemented in 41 counties
Value Index 6 8 10 10 13 MOLPP
Implementation of Na-tional Spatial Plan and National Land Use Policy
47 counties sensitized on the provisions of National Spatial Plan and National Land Use Policy
No. Counties Sensitized 27 20 0 0 0 MOLPP
SeCTor: PUBLIC SeCTor reForMSIntegrated Service De-livery Models (One-Stop Shops)
290 One-stop Huduma Centres established
No of One Stop Huduma Centres
42 - 72 -- 87 MoPY&G

67
FLAGShIP/PrIorITY ProJeCT
oUTPUT INDICATor TArGeTS reSPoNSIBLe AGeNCY(IeS)
2018/19
2019/20
2020/21
2021/22
2022/23
Labour Market Informa-tion System
Up-to-date Labour Market Information generated
No. of people accessing the Labour Market Infor-mation
300,000 450,000 600,000 800,000 1,000,000 MoL&SP
SeCTor: LABoUr AND eMPLoYMeNTNational Internship Pro-gramme
National Internship Pro-gramme Developed
No. of youths placed on internship
- - 130,000 488,000 488,000 MoPY&GA
Research and Training in Occupational Safety and Health
Occupational Safety and Health Institute Estab-lished
% of Completion 95 100 - - - MoL&SP
Occupational safety and health practitioners trained
No. of persons trained - - 3000 4000 5000
Alternative Dispute Reso-lution (ADR) Mechanisms
Alternative Dispute Reso-lution (ADR) Mechanisms established
% of Labour and Employ-ment disputes resolved
75 75 80 90 96 MoL&SP
SeCTor: eNDING DroUGhT eMerGeNCIeSNational Drought Emer-gency Fund
NDEF operationalized Amounts of NDEF dis-bursed(in Millions)
2000 2000 2000 2000 2000 MoD&ASAL,
Hunger Safety Net Pro-grammes
Hunger Safety Net scal-ability Programme imple-mented
No. of vulnerable house-holds receiving cash transfers
100,000 120,000 120,000 150,000 150,000 MoD&ASAL,
National Integrated Drought Early Warning System
Early warning information accessible to stakehold-ers
No. of stakeholders receiving early warning information
1600 2300 3000 3000 3000 MoD&ASAL,
Integrated Knowledge Management (KM) Sys-tem for EDE
Integrated Knowledge Management (KM) Sys-tem for EDE Established
Integrated KM System in place
0 0 1 - - MoD&ASAL,
FLAGSHIP/PRIORITY PROJECTS

68
FLAGShIP/PrIorITY ProJeCT
oUTPUT INDICATor TArGeTS reSPoNSIBLe AGeNCY(IeS)
2018/19
2019/20
2020/21
2021/22
2022/23
SeCTor: SeCUrITY, PeACe BUILDING AND CoNFLICT reSoLUTIoNInstallation of Surveil-lance Cameras in Nairobi &Mombasa metropolis, Nakuru, Eldoret and Kisumu
Surveillance cameras installed in priority areas
No. of cameras installed 334 1200 1000 1000 500 MoI&CNG, CGs
37 Prisoners Wards con-structed
No of Wards constructed 7 7 7 8 8 MoI&CNG
18 New Prisons complet-ed and equipped.
No of Prisons completed 4 4 4 4 2 MoI&CNG
Construction and equip-ping of NPS Hospital
National Police Service Hospital constructed
% Completion 14 39 64 89 100 MoI&CNG
KDF Modernization KDF Assorted security equipment acquired
Proportion of assort-ed security equipment acquired
20 20 20 20 20 MoD
Police Modernization Police Assorted security equipment acquired
% of assorted security equipment
22 10 5 5 5 MoI&CNG
Police information man-agement system rolled out
% roll out 23 25 25 27 - MoI&CNG
National Forensic Labo-ratory
National Forensic Labora-tory fully Equipped
Level of equipping in % 10 40 20 20 10 MoI&CNG

69
FLAGShIP/PrIorITY ProJeCT
oUTPUT INDICATor TArGeTS reSPoNSIBLe AGeNCY(IeS)
2018/19
2019/20
2020/21
2021/22
2022/23
SeCTor: ToUrISM
Tourism Product Develop-ment
Re-designed Iconic Mama Ngina Drive and Jomo Kenyatta Public beach seafront
Level of Completion of the Iconic Mama Ngina Drive (%)
50 100 - - - MTW
Re-designed Iconic Mama Ngina Drive and Jomo Kenyatta Public beach seafront
Level of Completion of the Jomo Kenyatta Public beach seafront (%)
50 100 - - - MTW
Little theatre rehabilitated Little theatre 1 - - - - MTWShanzu Creek Tourism City developed
Shanzu Creek Tourism City
- - 1 - - MTW
Amboseli’s National Park elevated to “Must See” status.
% change in visitation to Amboseli National Park
15 20 25 30 35 MTW
Top six KWS parks transformed into signature Africa safari product
No of KWS parks trans-formed
- 1 2 2 1
Niche Products Develop-ment and Diversification
Nairobi International Convention and Exhibition Centre (NAICEC) devel-oped
NAICEC - - - - 1 MTW
National convention bureau established and operationalized
National convention bu-reau
- - - - 1 MTW
Mombasa international convention centre devel-oped
Mombasa international convention centre
- - - - 1 MTW
ECONOMIC PIllAR; MOvING THE ECONOMY UP THE vAlUE CHAIN
FLAGSHIP/PRIORITY PROJECTS

70
FLAGShIP/PrIorITY ProJeCT
oUTPUT INDICATor TArGeTS reSPoNSIBLe AGeNCY(IeS)
2018/19
2019/20
2020/21
2021/22
2022/23
SeCTor: ToUrISMKICC Prefab developed KICC Prefab - 1 - - - MTW
Fort Jesus rehabilitated Completion rates(%)
25 50 75 100 - MOSCH
Cradle of Mankind devel-oped
Developed Cradle of Mankind
- - - - 1 MOSCH
World Rally Championship Safari Rally reinstated
No of World Rally Cham-pionship Safari Rally held
- - - 1 - MOSCH
Development of Isiolo, Turkana and Lamu Resort Cities
Master Plans, Model de-signs& Resource Mobili-zation Plans developed
Number of Resort Cities plans/designs developed
3 3 3 - - MTW
Tourism Training and Capacity Building
Ronald Ngala Utalii Col-lege (RNUC) constructed
Ronald Ngala Utalii Col-lege (RNUC)
- - - 1 - MTW
Construction of Wholesale Hub in Maragua
Wholesale Hub in Mara-gua
Maragua Wholesale Hub - - - - 1 MOITC
Construction of Tier 1 Re-tail Market in Athi River
Tier 1 Retail Market in Athi River
Athi River Tier 1 Retail Market
- - - - 1 MOITC
Establishment and opera-tionalization of Commodi-ties Exchange
Operational Commodities Exchange
% Level of establishment and operationalization
65 80 90 100 - MOITC
Establishment of Export Credit Guarantee Scheme
National Credit Guarantee scheme operationalized
Operational National Credit Guarantee scheme
- - - - 1 MOITC
Establishment of World Trade Centre and Inter-national Exhibition and Convention Centre
World Trade Centre and International Exhibition and Convention Centre established
World Trade Centre and International Exhibition and Convention Centre
- - - - 1 MOITC
10Top six KWS parks include Nairobi, Tsavo East, Meru, Mt. Kenya and L. Nakuru National Parks, Kisite Mfunguti Marine National Park

71
FLAGShIP/PrIorITY ProJeCT
oUTPUT INDICATor TArGeTS reSPoNSIBLe AGeNCY(IeS)
2018/19
2019/20
2020/21
2021/22
2022/23
SeCTor: FINANCIAL ServICeSNairobi International Fi-nancial Centre (NIFC)
NIFC established NIFC - - 1 - - TNT&P
Capital Markets Deepen-ing
Policy and regulatory framework developed/amended
No. of Policy and regu-latory framework devel-oped/amended
1 1 1 1 - TNT&P
New products introduced No. of new products introduced
1 1 1 1 1 TNT&P
Digital Finance Fully digitized financial system
Fully digitized financial system
- - - - 1 TNT&P
SeCTor: BUSINeSS ProCeSS oUTSoUrCINGEstablishment of Konza-Tecno-polis
Konza Complex con-structed
Konza complex - - - 1 - MOICT
National data centre con-structed
National data centre - - - - 1 MOICT
KonzaTechnopolis smart city facilities constructed
KonzaTechnopolis smart city facilities
- - - - 1
Presidential Digital Talent ICT graduated recruited under the Presidential Digital Talent
Number of youths trained and recruited (Disaggre-gated by sex)
400 400 400 400 400 MOICT
Digital Literacy Program ICT devices distributed to public primary schools
No. of devices distributed (‘000)
Computer labs construct-ed in school
No. of computer labs constructed
- - 5,000 10,000 10,000 MOICT
FLAGSHIP/PRIORITY PROJECTS

72
FLAGShIP/PrIorITY ProJeCT
oUTPUT INDICATor TArGeTS reSPoNSIBLe AGeNCY(IeS)
2018/19
2019/20
2020/21
2021/22
2022/23
SeCTor: oIL, GAS AND MINerALSCommercialization of the Oil and Gas discoveries
South lokichar field devel-oped
% of south lokichar field developed
- 10 30 60 100 MOPM
Complete Early Oil Pilot Scheme
Crude oil exported Amount of crude oil Ex-ported (barrel per day)
2,000 2000 2000 4000 4000 MOPM
Construction of Lo-kichar-Lamu Crude Oil Pipeline
Crude pipeline oil con-structed
% of lokichar-Lamu crude oil export pipeline con-structed
10 30 60 80 100 MOPM
LPG distribution and infra-structure
LPG cylinders distributed to low income households
No of LPG cylinders dis-tributed
(Disaggregated by sex of household head and geo-graphically by either Rural or Urban) 800,000 800,000 800,000 900,000 - MOPM
Nationwide Airborne Geo-physics survey
Geological Map of the country on potential min-eralization
% of country mapped 25 50 75 100 MOPM
Marine Geophysics Sur-vey
Geological map of the marine
% of marine mapped - - - 25 50 MOPM
International Accredited Laboratory
A modern Mineral Certifi-cation Laboratory.
modern Mineral Certifica-tion Laboratory
- - - 1 - MOPM

73
FLAGShIP/PrIorITY ProJeCT
oUTPUT INDICATor TArGeTS reSPoNSIBLe AGeNCY(IeS)
2018/19
2019/20
2020/21
2021/22
2022/23
SeCTor-BLUe eCoNoMY Development of Blue Economy Master Plan
Blue Economy Master Plan developed
Blue Economy Master Plan
- - 1 - - MOALFI
Development of Human Resource to Manage the Blue Economy
Diverse skills and com-petencies developed and awareness on Blue Econ-omy created
Number of skilled per-sons. (Disaggregated by sex)
1,500 1,500 1,500 1,500 1,500 MOALFI, MOTI-HUD&PW
Develop Integrated Na-tional Maritime Policy
Integrated National Mari-time Policy developed
Integrated National Mari-time Policy
- - 1 0 0 MOALFI MOTIHUD&PW
Development of a National Maritime Spatial Plan
National Maritime Spatial Plan developed
National Maritime Spatial Plan
- - 1 0 0 MOALFI MOTIHUD&PW
Development of National Fleet
National fishing and mer-chant fleet developed.
Number of national fishing and merchant vessels
9 18 18 18 19 MOALFI MOTIHUD&PW
Development of fisheries and maritime Infrastruc-ture
Infrastructure of fisheries and maritime developed
Level of development of infrastructure (%)
5 8 10 15 20 MOALFI MOTIHUD&PW
Revival of Kenya National Shipping Line (KNSL)
Kenya National Shipping Line (KNSL) revived and operationalized
Operational KNSL - - - - 1 SDM&SA, TNT&MP, AG, KNSL
“Vijana Baharia” Pro-gramme
Skilled youth workforce created
Number of skilled youth trained (Disaggregated by sex)
1,250 1,250 1,250 1,250 1,250 MOTIHUD&PW
SOCIAl PIllAR: INvESTING IN THE PEOPlE OF KENYA
FLAGSHIP/PRIORITY PROJECTS

74
FLAGShIP/PrIorITY ProJeCT
oUTPUT INDICATor TArGeTS reSPoNSIBLe AGeNCY(IeS)
2018/19
2019/20
2020/21
2021/22
2022/23
SeCTor: heALThMedical Tourism East Africa Kidney Centre
of Excellence established and operationalized
Operational Kidney Insti-tute
10% 30% 60% 80% 100% MOH
Regional Trauma Centre established (Sachang-wan-Nakuru County and Makindu)
No. of trauma centres established
- - - 1 1
New referral hospital es-tablished (Othaya)
No of new hospitals es-tablished
- - 1 - -
National referral hospitals (KNH, MTRH, Mathari and Spinal Injury Hospital) fully modernized as Centres of excellence
No. of modernized Cen-tres of excellence
- 1 1 1 1
Health Infrastructure Regional Comprehensive Cancer Centres estab-lished in Nakuru, Momba-sa, Nyeri and Kisii.
No. of cancer centres - 1 1 1 1 MOH
National Commodities Storage Centre construct-ed
% completion of National Commodities Storage Centre
10 30 50 70 100
Regional Cold Storage Chains for Drugs and Vaccines established
No. of New Cold Chains established
9 17 30 38 47
Multi-Speciality Moi Teaching and Referral Hospital constructed and equipped
% completion of Mul-ti-Specialty MTRH
10 20 50 100

75
FLAGShIP/PrIorITY ProJeCT
oUTPUT INDICATor TArGeTS reSPoNSIBLe AGeNCY(IeS)
2018/19
2019/20
2020/21
2021/22
2022/23
SeCTor: heALThUltra-Modern Laboratory Complex for the National Quality Control Laboratory (NQCL) in Nairobi con-structed and equipped
% completion of Ul-tra-modern laboratory complex
N/A 10 30 70 100
State of the art Research laboratories constructed in Kirinyaga, Uasin Gishu and Marsabit
% completion of research laboratories
20 30 50 70 100
Construction of new KMTCs in Mandera, Tave-ta, Voi and Lamu
No. of KMTCs 1 1 1 1 1
State of the art Research laboratories constructed
% completion of research laboratories
20 30 50 70 100
Digital Health Programme Public Health facilities digitized
% of Public Health facili-ties digitized
10 20 30 40 50 MOH
% of health facilities re-porting through the DHIS 2 and KMHFL systems
70 80 85 90 100
Human Resource for Health Programme
Enrolled Community Health Nurses (ECHN) trained in 3 colleges
No, of Enrolled Communi-ty Health Nurses trained
- - - - 1200 MOH
Specialized health work-ers trained
No of specialized health workers trained
500 550 700 800 1000
FLAGSHIP/PRIORITY PROJECTS

76
FLAGShIP/PrIorITY ProJeCT
oUTPUT INDICATor TArGeTS reSPoNSIBLe AGeNCY(IeS)
2018/19
2019/20
2020/21
2021/22
2022/23
SeCTor: PoPULATIoN, UrBANIzATIoN AND hoUSINGPopulation and Housing Census 2019
Population and Housing Census 2019 reports
Number Population and Housing Census 2019 reports
- - 1 15 - TNT&P
Population and Housing Census 2019
Population and Housing Census 2019 reports
Number Population and Housing Census 2019 reports
- - 1 15 - TNT&P
Research and Devel-opment on Appropriate Building Materials and Technologies (ABMT)
20 Operational Appro-priate Building Materials and Technologies (ABMT) centres established
No. of ABMT centres established
4 4 4 4 4 MOTIHUD&PW
20,000 New trainees on ABMT
No. of new trainees on ABMT
4,000 4,000 4,000 4,000 4,000
125 Locally manufactured hydraulic block making machines purchased and maintained
No. of functional machine - 20 30 35 40
Development and Im-plementation of Housing Finance Initiatives
National Housing De-velopment Fund (NHDF) established
NHDF in place - 1 - - - MOTIHUD&PW
Maintenance and Rede-velopment Fund estab-lished;
Maintenance and Rede-velopment Fund in place
- - 1 - -
Provision of physical and Social Infrastructure in Slums and Informal Settlements in Selected Urban Areas
Physical and Social infra-structure developed
No. of Kms of water pipe-line constructed
13 60 20 16 3 MOTIHUD&PW

77
FLAGShIP/PrIorITY ProJeCT
oUTPUT INDICATor TArGeTS reSPoNSIBLe AGeNCY(IeS)
2018/19
2019/20
2020/21
2021/22
2022/23
No. of Kms of water pipe-line constructed
13 60 20 16 3 MOTIHUD&PW
No. of households con-nected to water
1,000 500 3,000 3,000 1,000
No. of Kms of sewer line constructed
5 30 9 9 7
No. of sewer connections 200 200 500 300 300
No. of kms of roads upgraded to bitumen standards
20 20 20 30 30
No. of high mast security lighting installed
10 10 30 30 30
No. of footpaths and drainage canals con-structed
15 15 20 30 30
Facilitation of 24 Hour Economy
Supportive Infrastructure installed
No. of security lighting installed
0 700 700 700 700 MOTIHUD&PW
No. of high mast lighting installed
20 20 20 20 20
No. of firemen trained 20 20 20 - -
Integrated Urban Devel-opment Planning
Integrated Urban Devel-opment Plans
No. of plans developed and approved
4 5 5 5 5 MOTIHUD&PW
Urban Renewal Pro-grammes for selected towns
Market hubs & link supportive infrastructure constructed
No. of market hubs facili-ties constructed
5 5 2 2 2
Completion of Flagship and ESP markets
No. of markets construct-ed
3 14 14 14 14
FLAGSHIP/PRIORITY PROJECTS

78
FLAGShIP/PrIorITY ProJeCT
oUTPUT INDICATor TArGeTS reSPoNSIBLe AGeNCY(IeS)
2018/19
2019/20
2020/21
2021/22
2022/23
SeCTor: PoPULATIoN, UrBANIzATIoN AND hoUSINGDevelopment of Urban Storm Water Infrastructure facilities in selected urban areas
Storm Water drainage developed
No. of Km of storm water and sewer line
50 50 50 50 50 MOTIHUD&PW
Safety vehicular bridges constructed
No. of safety vehicular bridges constructed
2 2 2 2 2
SeCTor: eDUCATIoN AND TrAININGBasic education Compe-tency Based Curriculum
CBC Rolled out % level of CBC rollout 40 53 67 80 93 MOEd
Implementation of the Kenya National Qualifica-tion Framework (KNQF)
KNQF rolled out % of Roll out 30 40 60 90 100
Roll out of Competency Based Education and training (CBET) for TVET
CBET for TVET rolled out % of roll out 5 20 35 50 65
TVET Infrastructure and Equipping
Enhanced capacity of TVET Institutions
No of New TVET Institu-tions constructed
64 130 15 15 30
No of TVET Infrastructure rehabilitated in existing TVET Institutions
64 125 155 175 195 MOEd
No of TVET Institutions Equipped
70 100 135 155 175

79
FLAGShIP/PrIorITY ProJeCT
oUTPUT INDICATor TArGeTS reSPoNSIBLe AGeNCY(IeS)
2018/19
2019/20
2020/21
2021/22
2022/23
Student Financing Students supported through loans and bursa-ries
No of TVET trainees awarded TVET Loans
T 37313 20899 16414
1887210,8757997
452942610019194
108,7066264046063
260,894150336110551
MOEdMF
No of TVET trainees awarded TVET Loans
T 395927621197
1567692426434
371522131502
205010031047
1599950649
MF
Laptops and assistive technology for learners with special needs and disabilities provided to institutions
laptops and assistive technologies provided to institutions
No of institutions pro-vided with laptops and assistive technologies
8 16 24 32 51 MOEd
National Psycho-edu-cation assessment and placement centre at KISE
A National Psycho-Educa-tional Assessment Centre established
% level of completion (construction and equip-ment)
60 70 80 100 MOEd
Enterprise development incubators in TVET
Incubators established No. of enterprise develop-ment incubators estab-lished
0 0 20 50 75 MOEd
Operationalize the NEMIS Operational NEMIS % completion of policy and legal framework for NEMIS
100 - - - - MOEd
No. of education manag-ers and teachers trained
10,000 30,000 40,000 - -
% coverage of schools in all data collection series
100 100 100 100 100
FLAGSHIP/PRIORITY PROJECTS

80
FLAGShIP/PrIorITY ProJeCT
oUTPUT INDICATor TArGeTS reSPoNSIBLe AGeNCY(IeS)
2018/19
2019/20
2020/21
2021/22
2022/23
National Skills Develop-ment
Operational Kenya Na-tional Skills Development framework
% of Completion _ 50 100 _ _ MOEd
Operational Kenya Nation-al Development Council
% of legal framework development and imple-mentation
_ 50 100 100 100
Updated National Skills Inventory
Updated National Skills Inventory
_ _ 1 - -
SeCTor: eNvIroNMeNT, WATer AND SANITATIoN
Waste Management and Pollution Control
Improved solid waste management countrywide
No. of county dumpsites with ten minimum points
9 9 9 9 11 MOE&F
Number of landfill/waste disposal sites screened for climate change im-pacts
- - - - 2
Modernization of meteor-ological services
National Weather Net-work Modernized
% of Meteorological ser-vices modernized
17 19 20 22 22
Rehabilitation and Protec-tion of Water Towers
Water towers and other selected areas rehabili-tated
No. of hectares rehabili-tated annually
70,000 74,000 76,000 76,000 74,000
Rehabilitation of Urban Rivers
Riparian areas in urban areas rehabilitated and protected
Length of riparian re-serves rehabilitated in KM
32 50 80 100 100
Forest Conservation and Management
Area under forest cover increased
No of Ha under forest cover
2.45 M 2.5 M 2.65 M 2.75 M. 2.8 M.
Report by water tower (Mount Kenya, Aberdares, Mau Forest Complex, Mount Elgon and Cherangany)

81
FLAGShIP/PrIorITY ProJeCT
oUTPUT INDICATor TArGeTS reSPoNSIBLe AGeNCY(IeS)
2018/19
2019/20
2020/21
2021/22
2022/23
Wildlife Conservation and Management
Wild life corridors se-cured,
No. of corridors secured 1 1 1 1 1
Modern anti-poaching technologies adopted
Number of technologies adopted
- 2 1 1 1
Parks secured Kilometers of fence erect-ed
600 600 600 600 600
Establish Wildlife compen-satation scheme
No of wildlife insurance schemes implemented
- - - 1 1
Water Harvesting and Storage Programme
Water points (Dams, Boreholes, water pans and roof/rock catchments) rehabilitated and devel-oped12
No. of water points devel-oped
4 5 6 6 7 MWS
Increased water storage capacity by 700 million cubic meters
cubic meters 2 14 14 79 591
Integrated regional devel-opment programme
Multi-purpose dams de-veloped
Capacity in million cubic meters of Multi-purpose dams constructed
- - - 80 520 MWS
Water Resource Manage-ment Programme
Sub-catchment man-agement Plans (SCMPs) implemented
No. of SCMPs implement-ed
51 50 45 45 45
Water resource monitor-ing stations rehabilitated/ upgraded
No. of stations 50 80 90 90 90
Urban Water Supply Water supply and sani-tation expanded for 20 medium sized towns
No. of towns completed 4 4 4 4 4
Rural Water Supply Strategic boreholes drilled and equipped
No. of boreholes 30 45 55 50 35
FLAGSHIP/PRIORITY PROJECTS

82
FLAGShIP/PrIorITY ProJeCT
oUTPUT INDICATor TArGeTS reSPoNSIBLe AGeNCY(IeS)
2018/19
2019/20
2020/21
2021/22
2022/23
Schools equipped with water supply
No. of schools equipped with water supply schemes
100 100 100 100 100
Water Research Pro-gramme
Water Research institu-tions established
No. of institutions estab-lished
- - 1 - 2
2 Water Research Pro-jects financed
No. of research projects financed/ supported
24 32 48 48 48
Provision of water to un-derserved areas including informal settlements
60 urban water supply and 64 sanitation pro-jects constructed serving 1,484,000 people
No. of projects completed in urban
23 31 35 17 18
75 rural water supply and 66 sanitation pro-jects constructed serving 207,300 people
No. of projects completed in rural
51 32 30 30 28
Land reclamation Area of land reclaimed annually
Acres 6,000 9,000 14,000 17,000 1,000 MoALFI
Report by location and type Report by lacation Expansion of water supply and sanitation will be undertaken in 20 medium sized towns namely;Chuka, Chogoria, Runyenjes, Naivasha, Narok, Maralal, Moyale, Wote, Kitui, Mavoko, Matuu, Wajir,La-mu, Moi’s Bridge, Matunda, Malava,Marsabit and NanyukiNyahururu, Londiani, under the Vision 2030 The sector will operationalize Water Resource Center at KEWI in Year 1; establish and operationalize Water Resources Management Institute; establish Sewerage Research Centre in Kisumu in Year 5

83
FLAGShIP/PrIorITY ProJeCT
oUTPUT INDICATor TArGeTS reSPoNSIBLe AGeNCY(IeS)
2018/19
2019/20
2020/21
2021/22
2022/23
SeCTor: GeNDer, YoUTh AND vULNerABLe GroUPSWomen Enterprise Fund Affordable credit ac-
cessed by womenAmount disbursed per annum in KSh. (billions)
2.6 2.7 2.9 3. 3.6 MoPY&G
No of beneficiaries sup-ported
135,000 140,000 155,000 170,000 190,000
UWEZO Fund Affordable credit ac-cessed
Amount disbursed per annum in KSh. (billions)
0.3 0.4 0.5 0.6 0.7 MoPY&G
No. of beneficiaries trained
60,000 80,000 100,000 120,000 140,000
National Government Affirmative Action Fund (NGAAF)
Vulnerable groups sup-ported through targeted social services
Amount disbursed annu-ally to counties to support the vulnerable groups in KSh. (billions)
2 2 2. 2 2
No. of vulnerable stu-dents supported through bursaries
74,000 78,000 82,000 86,000 90,000
No. of groups supported through grants in women economic empowerment
9,000 10,000 11,000 12,000 13,000
Access to Government Procurement Opportuni-ties (AGPO)
Government procurement opportunities accessed
No of beneficiaries 20,000 26,000 33,000 41,000 50,000 MoPY&G
% of Government tenders awarded under AGPO
30 30 30 30 30
Value of AGPO tenders awarded in KSh. (billions)
24 30 37 45 53
FLAGSHIP/PRIORITY PROJECTS
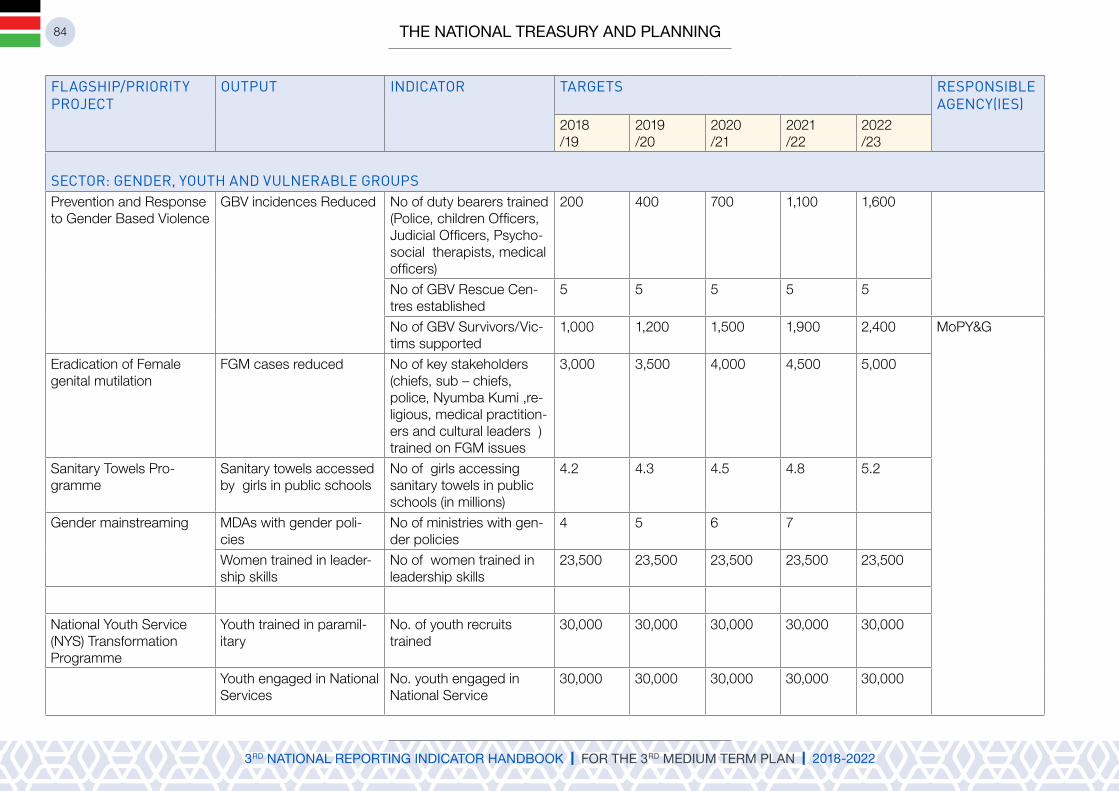
84
FLAGShIP/PrIorITY ProJeCT
oUTPUT INDICATor TArGeTS reSPoNSIBLe AGeNCY(IeS)
2018/19
2019/20
2020/21
2021/22
2022/23
SeCTor: GeNDer, YoUTh AND vULNerABLe GroUPSPrevention and Response to Gender Based Violence
GBV incidences Reduced No of duty bearers trained (Police, children Officers, Judicial Officers, Psycho-social therapists, medical officers)
200 400 700 1,100 1,600
No of GBV Rescue Cen-tres established
5 5 5 5 5
No of GBV Survivors/Vic-tims supported
1,000 1,200 1,500 1,900 2,400 MoPY&G
Eradication of Female genital mutilation
FGM cases reduced No of key stakeholders (chiefs, sub – chiefs, police, Nyumba Kumi ,re-ligious, medical practition-ers and cultural leaders ) trained on FGM issues
3,000 3,500 4,000 4,500 5,000
Sanitary Towels Pro-gramme
Sanitary towels accessed by girls in public schools
No of girls accessing sanitary towels in public schools (in millions)
4.2 4.3 4.5 4.8 5.2
Gender mainstreaming MDAs with gender poli-cies
No of ministries with gen-der policies
4 5 6 7
Women trained in leader-ship skills
No of women trained in leadership skills
23,500 23,500 23,500 23,500 23,500
National Youth Service (NYS) Transformation Programme
Youth trained in paramil-itary
No. of youth recruits trained
30,000 30,000 30,000 30,000 30,000
Youth engaged in National Services
No. youth engaged in National Service
30,000 30,000 30,000 30,000 30,000

85
FLAGShIP/PrIorITY ProJeCT
oUTPUT INDICATor TArGeTS reSPoNSIBLe AGeNCY(IeS)
2018/19
2019/20
2020/21
2021/22
2022/23
Youth employed in Textile and Garment Technology Institute
No. of youth employed in the Textile and Garment Technology Institute
418 418 440 462 462
Youth trained on Technical and Vocational skills
No. of youth enrolled to Technical and Vocational courses
31,304 39,130 48,912 61,140 73,368
Youth Enterprise Develop-ment Fund
Youth entrepreneurial and financial services provided
Amount disbursed to youth in (KSh. millions)
1,343.48 1,746.52 2,270.48 2,480.30 2,685.10 MoPY&G
No. of youth beneficiaries 268,700 349,300 454,100 500,000 520,000
No. of trading spaces provided for youth
1,500 2,000 2,500 3,000 3,500
No. of youth trained on entrepreneurship skills
75,500 81,000 86,500 86,500 86,500
No. of youth facilitated to market their Products
3,000 3,200 3,500 3,500 3,500
The Kenya Youth Employ-ment and Opportunities Programme(KYEOP)
Youth trained and trade placement done
No of youths trained and trade placement done
100,000 100,000 40,000 40,000 - MoPY&G
Internship and attachment opportunities availed to
No. of youths given internship or attachment opportunities
4,000 4,000 2,000 2,000 -
Youth Empowerment Centres (YECs)
Youth Empowerment Centres upgraded
No. of YECs upgraded to be centres of excellence
10 10 10 10 7
Establishment YECs Established.
No. of YECs established 50 47 50 - -
Youth Cohesion, National values and Social Devel-opment
Youth mentored on lead-ership and national values
No. of youth mentored on leadership and National Values
9,000 12,000 12,000 12,000 12,000
FLAGSHIP/PRIORITY PROJECTS

86
FLAGShIP/PrIorITY ProJeCT
oUTPUT INDICATor TArGeTS reSPoNSIBLe AGeNCY(IeS)
2018/19
2019/20
2020/21
2021/22
2022/23
Youth sensitized on drugs and substance abuse
No. of youth sensitized on drugs and substance abuse
2,350 2,350 2,350 2,350 2,350
National Safety Net Pro-gramme (Inua Jamii)
Households with poor & vulnerable persons sup-ported
No of Older Persons Households supported (cumulative)
932,600 989,200 1,045,800 1,045,800 1,045,800 MoL&SP
No of Orphans and Vul-nerable Children house-holds supported (cumu-lative)
393,000 393,000 393,000 393,000 393,000
No of Persons with se-vere Disability households supported (cumulative)
94,000 117,000 167,000 167,000 167,000
Integrated Management Information System (MIS) for Consolidated Cash Transfer Programme
Integrated MIS for cash transfer Programmes de-veloped and rolled out
1 1 1 1 1
Harmonized targeting tool finalized and rolled out
1 1 1 1 1
Disability Mainstreaming Enhanced capacities of PWDs for self-reliance
No. of PWDs provided with Assistive devices
3,400 3,400 3,800 4,000 4,200 MoL&SP
No. of learners with disabilities provided with educational bursaries
2,000 2,000 2,500 2,700 3,000
No. of self- help groups provided with grants
290 290 435 525 575
No. of institutions provid-ed with grants
24 24 24 30 36
No. of PWDs trained on vocational skills
650 700 730 750 800

87
FLAGShIP/PrIorITY ProJeCT
oUTPUT INDICATor TArGeTS reSPoNSIBLe AGeNCY(IeS)
2018/19
2019/20
2020/21
2021/22
2022/23
No. of Vocational Reha-bilitation Centres (VRCs) upgraded
3 3 3 3 -
No. of graduates from VRCs provided with tool kits
500 500 625 700 750
No. of workers trained in Kenya Sign language
300 300 300 300 300
No. of entrepreneur PWDs provided with LPO financ-ing guarantee fund
250 350 400 450 500
No. of persons with Albinism Supported with sunscreen lotion, af-ter-sun lotion, lip-balms, protective clothing and eye care services
3,250 4,000 4,000 4,000 4,000
No. of Ministries, Coun-ties, Departments and Agencies audited on disability accessibility
75 100 100 100 150
SeCTor: SPorTS, ArTS AND CULTUre
Sports Stadia Sports stadia constructed No. of sports stadia con-structed
- - - - 6 MOSCH
Sports stadia rehabilitated No. of sports stadia reha-bilitated
2 - -
FLAGSHIP/PRIORITY PROJECTS

88
FLAGShIP/PrIorITY ProJeCT
oUTPUT INDICATor TArGeTS reSPoNSIBLe AGeNCY(IeS)
2018/19
2019/20
2020/21
2021/22
2022/23
Regional stadia upgraded to international standards
No. of regional stadia upgraded to international standards
- - 3 4 - MOSCH
County stadia refurbished to National standards
No. of county stadia refurbished to national standards
- - - 10 20
Stadia upgraded to sports city status
No. of Stadia upgraded to sports city status
- - 2 4
Kenya Academy of Sports Kenya Academy of Sports (National)
Percentage of completion of Phase 1
80 90 100
Percentage of completion of Phase 2
- - - 10 40
Satellite academies estab-lished (Regional)
Number of satellite acade-mies established
2 2 2 2 2
National Sports Fund Lottery
National Sports Lottery operationalized
A functional national sports lottery
- - 1 - -
Anti-doping promotion Anti-dopping awareness created
Number of persons reached
23,200 33,000 43,000 53,000 63,000
Intelligence based testing carried out
No. of tests carried out 800 900 1000 1100 1200
National Library of Kenya National Library of Kenya constructed
% of completion of Phase 1
69.8 100 - - -
% of completion of Phase 2
- - 10 60 100
International Arts and Culture Centre
An Ultra-Modern Cultural Centre developed.
International Arts and Culture Centre
- - - - 1 MOSCH
Natural Product Industry (NPI) Initiative
Locally derived value- added natural products produced
No. of products value added
- 15 15 40 30

89
POlITICAl PIllAR: MOvING TO THE FUTURE AS ONE NATION
FLAGShIP/PrIorITY ProJeCT
oUTPUT INDICATor TArGeTS reSPoNSIBLe AGeNCY(IeS)
2018/19
2019/20
2020/21
2021/22
2022/23
SeCTor: GoverNANCe AND rULe oF LAWImplementation of Consti-tution and Legal Reforms
Laws reviewed and devel-oped; Laws to implement the constitution reviewed/developed
% of Laws reviewed 100 100 100 100 100 OAG&DOJ
% of Bills developed 100 100 100 100 100 OAG&DOJ
Audit of Rules and reg-ulations for constitution implementation legislation
Annual audit report 1 1 1 1 1 OAG&DOJ
County legislation audit-ed to ensure compliance with the constitution and national legislations
% of county legislation audited
100 100 100 100 100 OAG&DOJ
Leadership, Ethics and Integrity
Whistle blower protection bill developed;
Whistle blower protection bill;
- 1 - - - OAG&DoJ
Task force report for legal policy and institutional framework for fighting corruption implemented
% of annual recommen-dations implemented
100 100 100 100 100 OAG&DOJ
County Anti-Corruption Civilian Oversight Com-mittees established and operationalized in 25 counties
No. of County Anti- Cor-ruption Civilian Oversight Committees established and operationalized
5 5 5 5 5 OAG&DOJ
Legal Aid and Awareness Legal aid rolled out to counties
No. of counties where legal aid rolled out
7 10 14 18 21 OAG & DOJ
FLAGSHIP/PRIORITY PROJECTS

90
FLAGShIP/PrIorITY ProJeCT
oUTPUT INDICATor TArGeTS reSPoNSIBLe AGeNCY(IeS)
2018/19
2019/20
2020/21
2021/22
2022/23
Increased access to jus-tice by vulnerable mem-bers of the society
Number of vulnerable per-sons accessing legal aid
20000 30000 40000 50000 60000 OAG & DOJ
Judicial Transformation Expeditious delivery of justice
Transformed and reorient-ed court procedures and processes
Judiciary
Strengthening the criminal justice system
Strengthened prosecution services, witness protec-tion services
Average time taken to determine a case.
Judiciary
High courts established in counties
No. of counties Judiciary
Magistrates courts estab-lished
No. of courts Judiciary
Court annexed media-tions operationalized in all courts
No. of courts Judiciary
Case management sys-tems implemented in all courts
% of courts Judiciary
Judicial Training Institute accredited
JTI premises and accred-itation
20% 20% 20% 20% 20% Judiciary

91
PART Iv: ClIMATE CHANGE, DISASTER RISK MANAGEMENT AND HIv/AIDS
oUTCoMe INDICATorS UNIT BASeLINe YeAr
BASeLINe vALUe
TArGeTS DATA SoUrCe
reSPoNSIBLe AGeNCY(IeS)
LINKTo SDG
2018/19
2019/20
2020/21
2021/22
2022/23
TheMATIC AreA: CLIMATe ChANGeImproved Social Inclusion and sustainable livelihoods
No. of green jobs creat-ed(disaggregat-ed by sex)
No ‘000’ 2017 - 200,000
200,000
200,000
200,000
200,000
Ministerial reports
MOE&F SDG 8.3.1, SDG 8.9.2, SDG 9.2.2
No of counties with GIS based spatial plans that integrate climate change and Disaster Risk Reduction
No 2017 1 6 10 10 10 10 Ministerial reports
MoD&ASAL, SDG 11.a.1, SDG 11.b.2
ReducedGHG Emis-sions
GHG Emission per year
CO2eMt 2015 80 85 90 96 101 107 Ministerial reports
MOE&F SDG 13
DISASTer rISK MANAGeMeNTImproved community resilience to disasters
No. ofdeaths, missing personsand persons affectedby disaster per100,000people (disag-gregated by sex and geographic location)
No. 2017 50 45 40 35 30 27 Ministerial reports
MoD&ASAL SDG 1.5.1;SDG 11.5.1; SDG 13.1.1
FLAGSHIP/PRIORITY PROJECTS
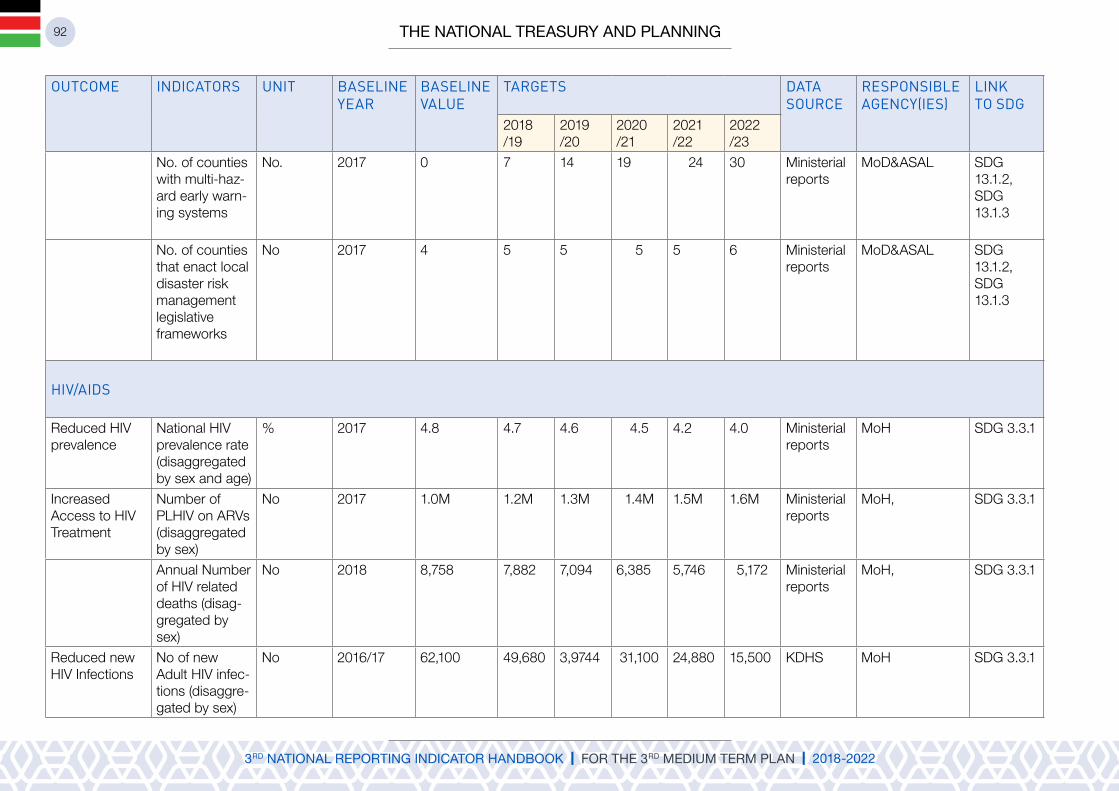
92
oUTCoMe INDICATorS UNIT BASeLINe YeAr
BASeLINe vALUe
TArGeTS DATA SoUrCe
reSPoNSIBLe AGeNCY(IeS)
LINKTo SDG
2018/19
2019/20
2020/21
2021/22
2022/23
No. of counties with multi-haz-ard early warn-ing systems
No. 2017 0 7 14 19 24 30 Ministerial reports
MoD&ASAL SDG 13.1.2, SDG 13.1.3
No. of counties that enact localdisaster risk management legislativeframeworks
No 2017 4 5 5 5 5 6 Ministerial reports
MoD&ASAL SDG 13.1.2, SDG 13.1.3
hIv/AIDS
Reduced HIV prevalence
National HIV prevalence rate (disaggregated by sex and age)
% 2017 4.8 4.7 4.6 4.5 4.2 4.0 Ministerial reports
MoH SDG 3.3.1
Increased Access to HIV Treatment
Number of PLHIV on ARVs (disaggregated by sex)
No 2017 1.0M 1.2M 1.3M 1.4M 1.5M 1.6M Ministerial reports
MoH, SDG 3.3.1
Annual Number of HIV related deaths (disag-gregated by sex)
No 2018 8,758 7,882 7,094 6,385 5,746 5,172 Ministerial reports
MoH, SDG 3.3.1
Reduced new HIV Infections
No of new Adult HIV infec-tions (disaggre-gated by sex)
No 2016/17 62,100 49,680 3,9744 31,100 24,880 15,500 KDHS MoH SDG 3.3.1

93
oUTCoMe INDICATorS UNIT BASeLINe YeAr
BASeLINe vALUe
TArGeTS DATA SoUrCe
reSPoNSIBLe AGeNCY(IeS)
LINKTo SDG
2018/19
2019/20
2020/21
2021/22
2022/23
Percentage of child infections from HIV in-fected women delivering in the past 12 months.
% 2016/17 8.2 6.7 5.5 4.1 3.4 2.1 Ministerial reports
MoH SDG 3.3.1
Adolescents and Young People (AYP) Education centers estab-lished.
Number of AYP education centers estab-lished.
No 2018 - 6 12 18 24 30 Ministerial reports
MoH SDG 3.3.1
FLAGSHIP/PRIORITY PROJECTS

94
Dr. Julius Muia, Principal Secretary, State Department for Planning, poses in a group photo with Technical Officers at the finalization of the Handbook of National Reporting Indicators, Mombasa Beach Hotel, Mombasa
95

96

97
98

99
100
The Principal SecretaryThe National Treasury and Planning
State Department for PlanningTreasury Building
Fax No: 2218475Telephone: 2252299
P.O. Box 30005-00100Website: www.planning.go.ke
E-mail: [email protected]