Embed Size (px)
Citation preview

08/01/2012
1
CCFFR-2012 Society for Canadian Limnologists:
Science for Wetland Policy and Management
LiDAR-BASED DELINEATION OF WETLAND BORDERS
Jae Ogilvie, Hua Kim Wen, and Paul A. ArpDepartment of Forestry and Environmental Management, University of New
Brunswick, NB. January 5-7, 2012. Moncton, NB
AbstractThis presentation introduces a GIS-based method designed to sharpen the delineation ofwetland borders. This method utilizes LiDAR point-cloud data (1m resolution) in theESRI environment for systematic digital representations of bare-ground elevation, slope,mean of the standard deviation slope within a 20 m radius, vegetation height above bareground and depth-to-water (DTW).The criteria for an automatic delineation of wetlands borders are set as follows: DTW <1m, standard deviation of slope within a 20 m radius < 0.1, and vegetation height < 2 m.These criteria delineate GPS-tracked wetland borders within 4 m 8 times out of 10,conform well to high-resolution surface images, and tend to be more consistent in thisregard than image delineated wetland borders.Once the various LiDAR derived data layers are assembled, the results can be furtherscrutinized through image overlay and by way of line scanning, to obtain a vertical viewof the upland-wetland- wetland upland transitions.Applications of this methodology within the context of rural and urban development andrelated wetland conservation planning are also discussed.
Edited from: http://www.dot.state.oh.us/Divisions/ProdMgt/Aerial/Pages/LiDARBasicS.aspx
LiDAR
Distance from laser to ground and back again:
Determined as laser-pulse travel time taken between emission and return to the air-borne pulse sensor
Laser pulse emission rate: up to 500,000 per second
Elevation:
flying height and position of the aircraft are used to determine the location and elevation of the reflecting surfaces (roofs, leaves, ground, etc).
Point cloud data
Edited from: http://www.dot.state.oh.us/Divisions/ProdMgt/Aerial/Pages/LiDARBasicS.aspx
LiDAR Benefits
Much improved slope, flow channel, wet-areas and wetland mapping
Leading innovations towards precision forestry , agriculture and wetland conservation
Towards single-tree forest inventory and detailed vegetation classification
Many applications in natural resource management , from field operations to policy formulations

08/01/2012
2
Wet Areas or depth-to-water mapping: the concept
Cartographic depth-to-water (DTW)
DEM surface
Flow Channels
1. Prepare bare-ground DEM surface from LiDAR data (last returns)2. Predict locations of stream channels; decide on flow initiation area (e.g. 4 ha)3. Use the wet-areas delineation algorithms to determine the cartographic depth-to-water index (DTW)
across the landscape, using all flow channels and shorelines for the DTW = 0 reference4. Subtract DTW from DEM to get the cartographically referenced water table elevation5. Overlay the first LiDAR returns to obtain vegetation height.
Vegetation height
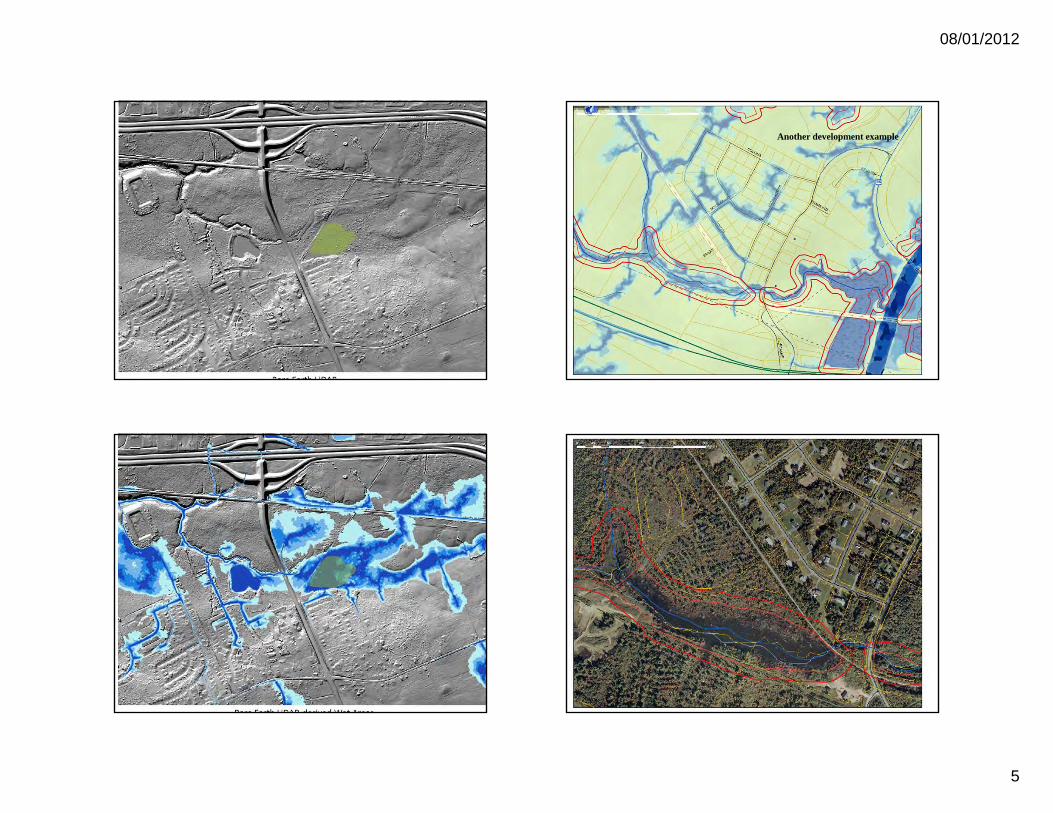
Hydrological risk show case: Grand Bay NB, Highway 7, LiDAR bare-ground DEM, hill-shaded
15 m drop
LiDAR bare-ground DEM, hill-shaded + cartographic depth-to-water (DTW) 0-1m

08/01/2012
3
LiDAR bare-ground DEM, hill-shaded + cartographic depth-to-water (DTW) 0-1m+ average tree height (moving average per 20 m circle) , with 2m contours
Focusing on the wetland: DEM-base slope derivation plus tree height (2 m intervals) + DTW (0 – 1 m)
Beaverdam
Cedar
Cedar
Cedar Cedar
Alder
Larch
Black spruce(raised bog)
FirSpruce
FirSpruce
FirSpruce
FirSpruce
FirSpruce
Using WAM: delineating watershed border (left, yellow line); flood risk mapping using the filled and unfilled DEM; watershed area combined with ppt during storm events determines max flow rate at culvert location, and matches that with existing or contemplated culvert capacity .

08/01/2012
4
0 40 80 120
Nearest distance between GPS track and selected DTW contour or air-photo wetland border, in m
0
20
40
60
80
100
Con
form
ance
(%)
Probability of wetland border 'x' meters away from DTW=0.5m contour
LiDAR-WAMAir-photo
Prov. DEM WAMUsing provincial DEMs:
generally ± 40 m, 8 times out of 10
Using bare-ground LiDAR DEMs:
generally ± 4 m, 8 times out of 10
08/01/2012
5
Another development example

08/01/2012
6
Wet areas mapping: DTW according to municipal drainage infrastructure (blue shading)
460
480
500
520
540
Ele
va
tio
n (
m)
460
480
500
520
540
0.0 0.2 0.4 0.6 0.8 1.0
Ele
va
tio
n (
m)
NormalizedDistance
9113m
9472m
10P110P2
10P310P4
10P5 10P6 10P710P8
10P9 10P10
10P11 10P1210P13 10P14
10-1
Road 1AP
Road 1TRAIL
470
480
490
500
Ele
va
tio
n (
m)
470
480
490
500
0.0 0.2 0.4 0.6 0.8 1.0
Ele
va
tio
n (
m)
Normalized Distance
7174m
7115m
SP15SP2 SP3 SP4 SP5 SP7SP6 SP8 SP9 SP10
SP11SP12 SP13SP1 SP14
S1S3S2 S4 S5 S6 S7 S9S8
Road 3AP
Road 3TRAIL
Using TRAIL to optimize proposed forest road locations (black)
Alternative
Alternative
Proposed
Proposed
Wet-areas mapping, across the maritimes region

08/01/2012
7
New Brunswick:
Coastal floodingand cliff erosion risk map
Risk levels:low (green), high (red)
Sackville, NB – Hillshade of LiDAR DEM (1m Resolution)
Sackville, NB –LiDAR DEM (1m Resolution)Digitized Mapped Water & Prov. Stream Network
Sackville, NB –LiDAR DEM (1m Resolution)Drainage Ditches, Breaches, Dykes & Municipal Infrastructure

08/01/2012
8
Sackville, NB –LiDAR DEM (1m Resolution)Wet-Areas-Map & Flood Potential
+7.78m
+8.03m
+6.88m+7.16m
+7.13m
+8.81m
+5.17m
+9.09m
Sackville, NB –LiDAR DEM (1m Resolution)Trans-Canada Highway Potential Flooding – Tantramar Marsh Area
Inland + coastal flooding, with outline of the Saxby Gale surge
Tantramar Marsh: Coastal flooding
Moncton LiDAR DEM + prov. water atlas + 0-7 m coastal flood+ 0-1 m wet-areas next to flow channels and shorelines,
with storm-water management

08/01/2012
9
Moncton LiDAR DEM + prov. water atlas + 0-7 m coastal flood+ 0-1 m wet-areas next to flow channels and shorelines,
no storm-water drainage
St. Stephen: flooding Dec. 13., 2010, centered on Charlotte Mall
Milltown Boulevard, coastal flooding (red)
Charlotte Mall,Irving Gas Station
0
100
200
300
400
500
600
0 1 2 3 4 5Depth-to-water (m) associated with flood claim locations
Frequency of NB flood claims, December 2010
ETF DTW project
Pipeline
Northwest
Containmentberms
Oil retrieval:Temporary road
with two tanks to retrieve spilled oil
(drum storage)
Temporary road with two tanks

08/01/2012
10
Spill source.
Oil spill: extent controlled by (i) hydraulic gradients (white contour lines), (ii) amount of water flow (broad arrows, proportional to upslope area), (iii) natural blocks (beaver dams), (iv) presence of water: oil floats and backs up towards shallow areas with little flow. (v) Shown: hill-shaded DEM; DTW (0 25 cm contour lines <1m with a 4 ha flow initiation threshold
Block
Outlook. LiDAR-based wetland delineation leads to:
…improved field reconnaissance and detailed feature delineations;
…better and more informed wetland conservation practices;
…insightful rural, urban and industrial wetland planning.
The wetland data layers so generated are:
… cartographically correct and numerically stable (+/- 4 m, eight times out of ten);
… cut across scales, from small to regions;
… provide many high-resolution dimensions for wetland risk assessments and related functional a
… are complementary to other geospatial data layers;
… facilitate communications, and promote wetland impact awareness, from private to regulatory;
…require ground work for final adjustments and legal verifications.
Many thanks to
Lee Swanson Robert Hughes Nelda Craig Lori MoffatSabine DietzNB Env.NB ETFRACEMODTOASRD
Calgary, October 2011