Embed Size (px)
Citation preview

– -
For Oxford Age Of Stupid Debate Barrack Lane 24 May 2009**
What Does & Does Not CAUSE Climate Change
• What is it all about? • Science vs The New Green ‘Religion’
• The Solar Weather Technique & Forecast of World Climate for 100 yrs
** Further to presentations at Raven’s Ait ‘Environment Parliament’ historic island occupation Easter 2009 and International Climate Change Conference New York 10 March 2009
Piers Corbyn*Climate Realist www.weatheraction.comTeam includes Judith Humprey, Kirill Kuzanyan (IZMIRAN Russ Acad Sci) & Ulric Lyons
Piers Corbyn is the originator of the Solar Weather Technique of Long Range Forecasting and founder of WeatherAction 177 Borough High St, London SE1 1HRTel: +44 (0)20 7939 9946.;
+447958713320
-
The Long Range Forecasters
• Evidence based science !• Beware of confusing Cause, Effect & ‘Association’!
Key Presentation slides 1-42 NOTES mode for info on slides: 12 & 28- 31.
SWT 85% hit success slide 54

Key Explanations• What is Global Warming / Climate Change?• What is happening - Is it new?• What Does & Does Not cause Climate Change?
Key Message• Global warming is over and it never was anything to with CO2.• There is no evidence for the CO2 theory of Global Warming/Climate Change – only evidence against.• Global Warming & Climate Change policy are Politically driven.• Accountability must be extended and all public policy must be Evidence based.

Science must come Before Ideology & Religion.
Should scientific evidence be over-ruled when it disagrees with a religion, ideology or political project?
Public Safety must come before politics & ideology
Is it more important to Work to solve environmental problems or Refuse to use help to find solutions because they are from the ‘wrong ideology or don’t serve a particular political project’?
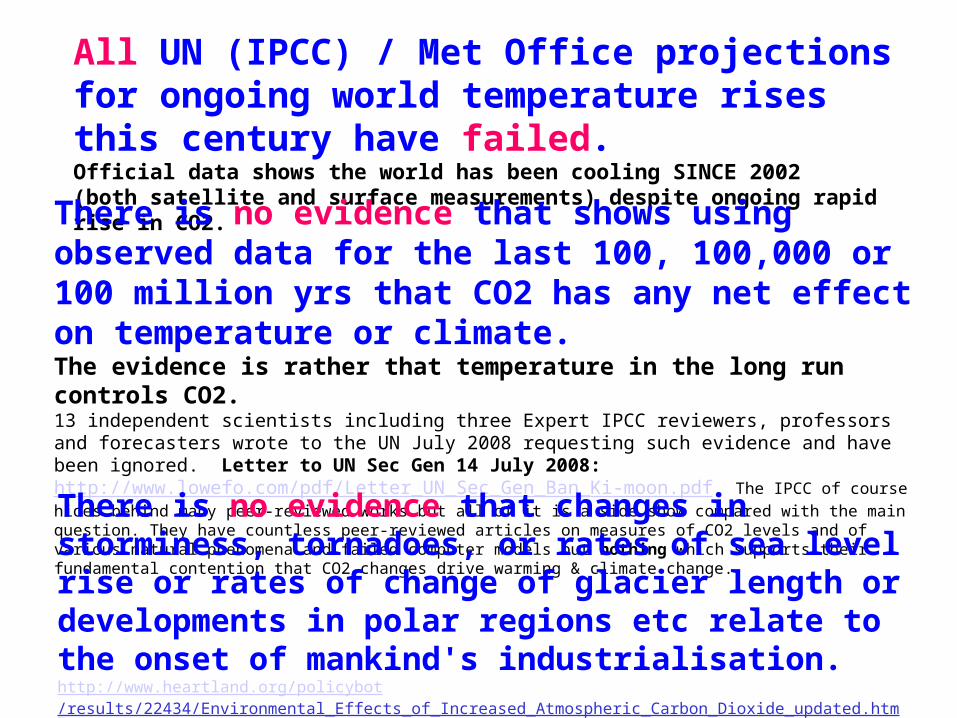
All UN (IPCC) / Met Office projections for ongoing world temperature rises this century have failed. Official data shows the world has been cooling SINCE 2002 (both satellite and surface measurements) despite ongoing rapid rise in CO2.
There is no evidence that shows using observed data for the last 100, 100,000 or 100 million yrs that CO2 has any net effect on temperature or climate.The evidence is rather that temperature in the long run controls CO2. 13 independent scientists including three Expert IPCC reviewers, professors and forecasters wrote to the UN July 2008 requesting such evidence and have been ignored. Letter to UN Sec Gen 14 July 2008: http://www.lowefo.com/pdf/Letter_UN_Sec_Gen_Ban_Ki-moon.pdf The IPCC of course hides behind many peer-reviewed works but all of it is a side show compared with the main question. They have countless peer-reviewed articles on measures of CO2 levels and of various natural phenomena and failed computer models but nothing which supports their fundamental contention that CO2 changes drive warming & climate change.
There is no evidence that changes in storminess, tornadoes, or rates of sea level rise or rates of change of glacier length or developments in polar regions etc relate to the onset of mankind's industrialisation.http://www.heartland.org/policybot/results/22434/Environmental_Effects_of_Increased_Atmospheric_Carbon_Dioxide_updated.html
The Four kinds of Global Warming propaganda
The first two are in tatters so now we will hear more GW propaganda of 3rd & 4th kind.
GW1 = "CO2 causes Global Warming"
GW2 = "CO2 causes Climate Change/extremes" - Jumping over the warming link which is proven as broken - Storms, Arctic, etc
GW3 = "CO2 direct effects" eg so called ocean acidification
GW4 = Twisted logic, pseudo-science & innuendo of the type - "It's not a dog therefore its a cat" ("It's not solar brightness / Galactic Cosmic Rays therefore its CO2");- The CO2 effect is being 'stored up‘. This is like waiting for time to run backwards - since CO2 levels in the long run are driven by temp. - Al Gore gave up tobacco farming therefore Climate Realists are wrong.

How High is the Sky? 8 miles - like 1mm of card on a football

How much CO2 is in air? – Only 1 part in 3300. If each block below is one molecule of gas in air just ONE is CO2

Q. Of this ONE part in 3300. How much of the CO2 flow in and out of the atmosphere is due to mankind?
A. 4% (or LESS) = one part in 25 = the dark square
So mankind’s CO2 is about changes of 1/100,000 part of the atmosphere which is only 8 miles high COMPARE Earth’s magnetic field extends into space at least 40,000 miles.Standard meteorology relies on 8 miles of atmosphere. The Solar Weather Technique of weather & climate forecasting relies on the Earths whole atmosphere, the solar wind between the sun & the earth and the sun 93 Million miles away.

Q. What proportion of total ‘Greenhouses effect’ is Man’s CO2?
A. The tiny blue sliver that hardly shows on this pie chart!
www.searchanddiscovery.com/.../images/04.htm NB precise figures uncertain but Man’s CO2 certainly < 1%

World Temperatures keep falling while CO2 is rising!
Graph Joe D’Aleo
Graph: Joe DAleo

Temperatures (USA) 60 yr Cycle & CO2 1895 to 2008
- Official data - Graph by JD’Aleo Sept 2008 Circulated by Piers Corbyn www.weatheraction.com
World Temp peak 2002/3


Problems for GW Orthodoxy - 2
Rather than face continued embarrassment from scientists who requested the temperatures be also published, the most recent IPCC ‘report’ leaves out even the historical CO2 graph!

Temps drive CO2 as ice ages end.Fast CO2 changes (like now) are hidden
At the end of the last ice age temperature changes LEAD CO2 by 800yrsSimilar leads are in Antarctic Termination III 240kyr ago (Caillon et al Science Mar 03)
CO2 diffuses through ice CO2 data points are at best 200yrs apart and show only small variations between points. This is because CO2 is a gas and diffuses into centuries of ice layers. The present CO2 spike will amount to a mere blip in 1,000yrs time.
There is No Evidence that the present CO2 rapid rise is unique.
Time
Inconvenient Truths for GW Orthodoxy!

Why GW is renamed Climate Change
The theory of ‘Global warming’ holds that Man’s CO2 causes Global Warming and this causes other Climate Change and extremes.
CO2 Global Warming Climate Change
We have heard a lot about weather extremes & ‘Climate Change’
Since 1998 CO2 has gone up but World Temperatures have gone down. ALL subsequent years* have been colder than 1998Or In terms of two year moving averages the peak was 2002/3
*From Official estimates of world temperatures: http://www.cru.uea.ac.uk/cru/data/temperature/hadcrut3vgl.txt
So there are claimed extra effects – ‘Climate Change’ - without temperature rise to cause them!
AND has post Industrial revolution CO2 caused any change that wasn’t going to happen anyway?


Global Temperature and Atmospheric CO2 over 600 Million yrs- No Evidence of CO2 driving temperature
Late Carboniferous to Early Permian time (315 million years ago - 270 million years ago) is the only time period in the last 600 million years when both atmospheric CO2 and temperatures were as low as they are today (Quaternary Period). At no point do temperature and CO2 levels relate. Temperature after C.R. Scotese http://www.scotese.com/climate.htm CO2 after R.A. Berner, 2001 (GEOCARB III)

Arctic Ice & Polar Bears – More ‘GW2’ All changes in the Arctic & Antarctic follow natural highly variable patterns. They are not new or special and have been recorded for over a thousand years and have been very well known to the British navy for a long time and available in the Met Office library**.
The Antarctic has been cooling for decades & the Arctic has started to cool in the last year or two. Ice break-up of is a natural process and has been happening for millions of years - before media noticed. (**HMSO 1963 Weather In the Home Fleet waters Vol 1 Northern Seas part 1 table XV page 246 shows the very high variability of ice off Iceland (eg) since 1900 and the long periods of change of two decades or more. Figures 124 & 125 (page 256) show that historical records indicate there was no pack ice off Iceland for about 180 years from 1020AD to 1200AD yet there was plenty of pack ice through the rapid expansion of industry since 1900 (Fig 126 page 257).
The 120 year long late medieval warm period of Ice-free Iceland waters is much longer than the supposedly alarming present events in the Arctic.

Ocean Acidification – a case of ‘GW3’! – Hysterical nonsense & a research grant scam- Man might be polluting the seas in many ways but CO2 isn’t one of them
FactsSea life did not die out
in Jurassic times when CO2 was 5x present or in Devonian times & before when it was 10x present. In fact it boomed!
Official figures show at current rates would take 23,000 years for Ocean CO2 to double even ignoring all the myriad of buffering effects.

What Stops CO2 Extra ‘Greenhouse’ effect?- further to Piers Corbyn International Climate Seminar Stockholm Sept 2006
10% or so of total evapo-transpiration heat removal (cooling) is transpiration from land plants. 11% of 78W/m2 = 8.6 W/m2
Extra plant transpiration-Cooling negates all extra CO2 heating
New!
Doubling CO2 increases CO2 Greenhouse heating of Earth’s surface by 3.8 W/m2. It also increases plant growth & therefore transpiration heat removal (cooling) by 43% to 45%. Now, 44% of 8.6 = 3.8 W/m2
3.8 – 3.8 = 0 So CO2 increase has no net effect on world temperatures.

The Global Warmers’ last gasps
Really - like present world cooling!!?? The graphs making this claim are smudge and fudge. (see slide 30). Geomagnetic activity smoothed over 22yrs (solar magnetic period) fits temperature much better.
The EVIDENCE is that CO2 changes are generally driven by temperature. This assertion is equivalent to ‘time will run backwards’.
“ONLY CO2 can explain the temp rises”
CO2 effect is being ‘stored up’ & delayed.
(i) Anything X zero effect = zero(ii) No evidence for this. There are no CO2 spikes in
the past ice cores because CO2 is a gas and diffuses through centuries of ice. This current CO2 spike will be invisible in 1k yrs time.
“CO2 levels have never risen so fast or been so high”
RefutationClaim

Solar Activity drives Climate – Oman stalagmite data 9.5kyr to 6k yr before present
Growth layers of stalagmite in a Cave in Oman show:
Close correlation between Particles from the Sun* & Temperature** {*C14 proxy from Cosmic Ray Flux which is reduced by Solar magnetic-particle
activity. **O18 isotope is Climate proxy}
Similar correlations exist over the last 500 Million yearsSee Neff et al, Nature May 2001; Veizer, Geoscience Canada March 05

http://www.ashevilletribune.com/asheville/global%20warming/Global%20Warming%20DM%20Main%20Story%20March%2031%20Update.htm


6
11
16
21
26
31
1870
-188
3
1883
-189
3
1893
-190
5
1905
-191
7
1917
-192
8
1928
-193
7
1937
-194
7
1947
-195
7
1957
-196
8
1968
-197
9
1979
-198
9
Single cycles© M
. G
olip
our,
Wea
ther
Act
ion
Plc
, M
arch
199
8
-0.70
-0.50
-0.30
-0.10
0.10
0.30
Glo
bal
Tem
per
atu
re A
no
mal
y
aa index
Global_temp
Fig 4a. Global Temperature Anomaly [red line] and
geomagnetic activity, aa, [blue line], both averaged for successive solar cycles (from maximum to maximum).
World Temperatures & Solar Particles (Geomagnetic Activity), Over Single Solar Cycles
aa
View in NOTES MODE for explanationWorld Temperatures and solar particles move together much better when averaged over
the (approx)11yr sunspot cycle, but there is an alternate cycle difference.
Note Colour change!

13
15
17
19
21
23
25
1870-1893 1893-1917 1917-1937 1937-1957 1957-1979
Double Solar Cycles
© M
. G
olip
our,
Wea
ther
Act
ion
Plc
, M
arch
199
8
-0.40
-0.35
-0.30
-0.25
-0.20
-0.15
-0.10
-0.05
0.00
0.05
Glo
ba
l Te
mp
era
ture
An
om
aly
aa index
Global_temp
Fig 6a. Global Temperature Anomaly [red line] and geomagnetic activity, aa, [blue line], both averaged over each double solar
cycle (from maximum to second maximum).
World Temperatures & Solar particles (Geomagnetic
Activity), Over Double Solar (Hale) Cycles. Shown Moscow July 04
aa
World Temperatures and solar particles move together astoundingly well when averaged over the Double sunspot cycle.

‘TG’ Gap
World Temperatures follow what…?
Answer to ‘TG’ gap question re Inst Of Physics Presentation 2004 lies in Solar -magnetic - Lunar modulation – to be explained at Presentation!
Solar particle & magnetic activity - OR -A ‘special mix’ of CO2 (nature & Man) + CH4 + N2O + O3 + volcanoes + soot/aerosols + some sunlight +..If the Man-Earth ‘special mix’ is in charge then how does the sun decide to send out particles to match this Earth-based driver?!
The two graphs are lined up so that points of the upper graph (average up to date shown over double sunspot cycle of approx 22yr) corresponds to the date in lower graph, the smoothed CO2/Soot model
The ‘soot’ model uses global ‘undimmimng’ (soot reduction) to explain rises later in the graph. The solar model can use the same or effects of the very rapid motion of the North magnetic pole.
The CO2/soot model has wide uncertainties which include different assumptions which might fit OK in one section but not in others (eg so over any 22yr section). The idea there is even rough closeness to the range needs hidden inconsistencies.
And a mystery solved!!
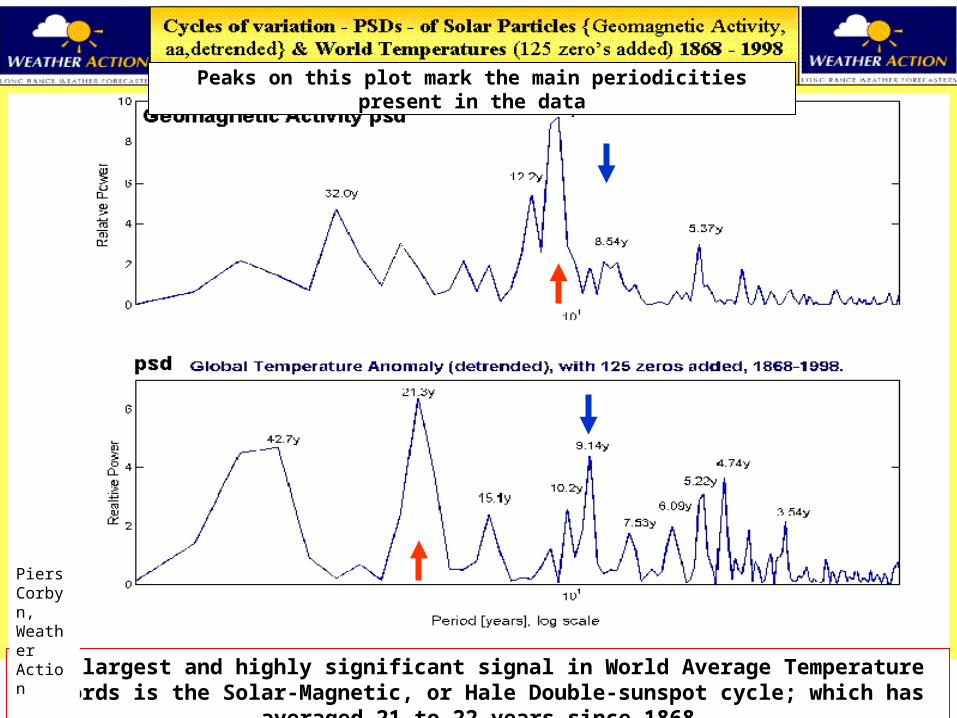
The largest and highly significant signal in World Average Temperature records is the Solar-Magnetic, or Hale Double-sunspot cycle; which has averaged 21 to 22 years since 1868
Peaks on this plot mark the main periodicities present in the data
Piers Corbyn, Weather Action

What Does & Doesn’t drive ClimateOne X and you are out!
Evidence
CandidateTemps 1975 to 2000 (smoothed)
Temps last 100 or1k or 10k yrs
Temps last 25k yrs
22 yr signal in world temps
= might explain that evidence
X = doesn't work
CO2 X X* X * This shows that on v long time scales CO2 is driven BY temps
(Extra solar)
Cosmic Rays(avoid confusion with solar muons etc)
X NB Total Energy flux of solar particles ~300 times Cosmic rays.
Light variations in solar cycle
? ? ? X Light variations in solar cycle less important than solar magnetic (but UV is important)
Solar Activity & MAGNETIC Link/modulation
ALSO (SWT) has predictive powers 12 months ahead
See 13th May 2009 WeatherAction News No 30 = http://www.weatheraction.com/displayarticle.asp?a=34&c=1


SLAM – Solar Lunar Amplitude Magnetic – Process – 60yr signal
- Official data - Graph (Temp data) by Judith Humphrey March 2009 for Piers Corbyn www.weatheraction.com
11 13 15 17 19
21 23
9
= Declining phase of Odd solar cycle = Solar eclipse Dec 1-13 (lunar node pointing to sun near where earth crosses solar equator downwards) = Lr/fEfThe main world temperature envelope peaks occur in years following close coincidence of Lr/fEf & Odd solar max + 1 or 2 yrs. Cycles 23 & 17 show this well.
The weather extremes of recent years are part of natural essentially predictable processes*……..
The severe summer floods of 2007 & 2008 & 2009 were like the very wet summers of 1875, 1876, 1877 and 1879 - associated with the approx 132 yr pattern : 6X22=132, 7X19=133
The 2007 & 2008 & 2009 summer floods were predicted in detail by the SWT. This flood-likely summers situation can continue for a few years but is SUBJECT TO other conditions (SWT) being satisfied.
*As first explained by Piers Corbyn to the Imperial College Union President’s centenary dinner 27th July 2007.
Weather in 21st Century - Answers

How can solar particles & events change the weather? - 1
Lunar Nodal regression, R = 1/18.61 yr, & Magnetic linkages Z/2 = 1/22.2 yr
Beats for 2R & (Z/2): 2R /(Z/2) = 2.37 => B = 2R-2(Z/2); 1/B = ~59 yr
Beats for R & (Z/2) : R /(Z/2) = 1.18 => B = R- (Z/2); 1/B = ~118yrThis Solar-Lunar (‘SLAM’) theory of the 60 yr fluctuation in World temperatures was first presented by Piers Corbyn at the Centenary dinner of the Royal College of Science Association (science graduates of Imperial College) on Dec 9th 2008 at the Criterion Restaurant, Piccadilly Circus London.
These ‘beat’ cycles are ‘envelope’ periods - not precise predictors of detailed repeat situations. So, eg, close repeats are not 118 yrs before 2002 (=1884) but the odd cycles 11 and 13 each side of this which moderately satisfy the Lunar node & Solar-Earth ‘falling’ node coincidence rule.

World temperatures trend will continue down in 2008 and all the way to 2013 and
almost certainly beyond WeatherAction’s Climate forecast issued in Jan 2007 that world temperatures in 2007 would NOT rise in the way the UN’s Climate Change panel predicted has been confirmed.
“For 2008 the general downward trend of world temperature will continue. World temperatures, averaged over pairs of consecutive years, peaked in 2002/3 coinciding with the peak of the 22yr world temperature cycle which is driven by the sun’s magnetic cycle. The Solar-particle corridor is open for more – predictable - solar driven weather extremes in 2008” says Piers Corbyn of WeatherAction.
SWT Climate Forecast – issued Jan 08
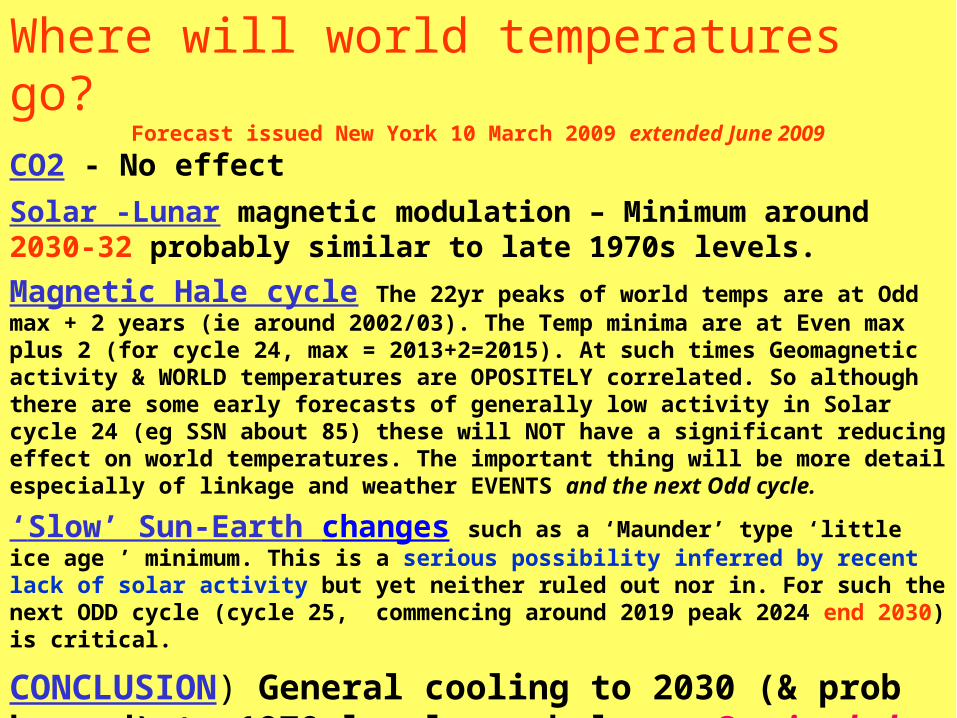
Where will world temperatures go? Forecast issued New York 10 March 2009 extended June 2009
CO2 - No effect
Solar -Lunar magnetic modulation – Minimum around 2030-32 probably similar to late 1970s levels.
Magnetic Hale cycle The 22yr peaks of world temps are at Odd max + 2 years (ie around 2002/03). The Temp minima are at Even max plus 2 (for cycle 24, max = 2013+2=2015). At such times Geomagnetic activity & WORLD temperatures are OPOSITELY correlated. So although there are some early forecasts of generally low activity in Solar cycle 24 (eg SSN about 85) these will NOT have a significant reducing effect on world temperatures. The important thing will be more detail especially of linkage and weather EVENTS and the next Odd cycle.
‘Slow’ Sun-Earth changes such as a ‘Maunder’ type ‘little ice age ’ minimum. This is a serious possibility inferred by recent lack of solar activity but yet neither ruled out nor in. For such the next ODD cycle (cycle 25, commencing around 2019 peak 2024 end 2030) is critical.
CONCLUSION) General cooling to 2030 (& prob beyond) to 1970 levels or below. Staying below recent (2002) levels for at least 100 years. The possibility of getting much colder by 2040 to below 1910 levels is not ruled out and will be estimated with further theoretical research and solar observation.

Key Science Summary: Solar activity is in Charge CO2 ‘greenhouse warming’ is negated by plant feedback processes
The idea that Carbon Dioxide, from Man or nature, is the cause of global warming is disproved by the facts. Science has advanced beyond that theory.
1. If Carbon Dioxide (CO2) drives world temperatures then past data would show it. But it does not. Data going back decades, centuries and thousands of years shows that CO2 is not in charge. The graphs make it clear! The supporters of the theory of CO2 enhanced Greenhouse effect driven global warming must answer this fact or their theory must be abandoned.
2. World temperatures & particles from the Sun move together very closely - over recent decades, past centuries, thousands and millions of years. This proves the Sun, not CO2, is in charge. Does the Sun cause the weather or does the weather cause the Sun to change? Various theoretical graphs have been drawn and presented to the public, using many assumptions, which combine CO2 (heating effect) with careful amounts of cooling effects involving smoke and dust from volcanoes cars and industry etc to construct a curve which more-or-less moves with world temperatures. If those theoretical graphs show that a special mix of CO2 and smoke drives the weather you also must explain HOW is it that the Sun sends out particles to follow Earth Temperature!.
3. CO2 is a greenhouse gas so why doesn’t more of it make it warmer? The answer is transpiration-cooling by plants. Science has moved past the GW one-way-effect--CO2-theory. The (close) equality of enhanced greenhouse heating & plant transpiration cooling is not coincidence. If there are not enough plants to do this cooling then the world gets warmer. But photosynthesis then increases and plants grow more when it is warmer (tropical forests are the best) and so the amount of plants increases, and their cooling effect increases - so temperatures cannot go up any more. Put simply: -
Plants increase their photosynthesis activity and it’s cooling effect until that equals extra CO2 greenhouse heating.
Thanks to all in CLIMATE SCEPTICS International E Group for inspiration which made this Presentation possible, Piers Corbyn, Weather Action The long range forecasters

1. Enjoy life! Enjoy the planet! Don't feel guilty about ‘carbon footprints’. CO2 is the Gas Of Life (GOL)! More GOL increases the bounteousness of plant & animal life. Stop real smoke and chemical pollution – GOL (CO2) IS NOT A POLLUTANT.
2. Recognise Man cannot change Climate Change! The Problem is Climate Change POLICY.
‘Climate Science’ lacks integrity. Science is not driving policy. It’s the other way round! Climate Change ‘science’ is driven by those who benefit from Climate Change Policy. Act on the Charter for Climate Truth:
Prove and predict. Basic standards of science should be applied in Climate science and any theory of Climate Change must be tested against available recorded data and testable specific predictions made.
Naming & Shaming. Scientists or journalists who make baseless claims or false statements on Climate and weather should be ‘named and shamed’.
3. Get rid of ‘Green Spivs’ - Call politicians to account. ‘Justify it or drop it’. If they cannot justify a claim they most drop the policy.
Write to them – challenge them in meetings…..
Support Honest green policies for biodiversity & defending nature.Scrap Climate Change / anti GOL (‘Green’) taxes and policies. End their world burden - of high energy prices and food price rises and starvation caused by biofuels.
Support the world economy not the green scam – which is the of new bubble of FALSE VALUE. The climate hype industry are a burden on the world economy & make billions from carbon trading, windfarms & other green scams, nuclear power, & holding back world development.
What to do? – 3 point plan

Environment solutions starting in 2009 - the year of Accountability & Rebirth of
integrity in politics & science!
• Put Science before ideology & politics.
• Stop the plunderers & creators of false value destroy the environment when their ‘theory’ is given up.
• Honest Green principles: Defend Nature, rainforests etc for THEIR OWN VALUE.
• WEXFAD Weather EXtremes (& any Natural extreme) Forecasting And Defence.
• A New ‘(non) Religion’ of Democracy Integrity & Accountability in Politics & Science.
Following slides are discussion extras

The Global Warming Lobby1. Governments - taxation and energy ‘security’
2. The Climate Crisis industry – Carbon traders - advisors – ‘wind farmers’ – biofuel makers – ‘GW Scientists’ – environmental columnists – ‘science correspondents’…
3. Oil Companies – BP policy: http://www.bp.com/productlanding.do?categoryId=6900&contentId=7028276… We support urgent action to stabilize greenhouse gas concentrations.... governments and businesses must work together to create policy 'spaces' .... defined by appropriate policy and regulation ... activity driven by market mechanisms .... policy and regulatory interventions must support the development and implementation of appropriate technological solutions and also enable the amendment of market mechanisms...
4. Green Zealots and Goons – self appointed bishops and commissars of the new godless ‘Green’ religion – any operation or business which can make money by getting you to pay to ‘save the planet’ or ‘feel green’.
What causes Climate Change Policy?

The weather extremes of recent years are part of natural essentially predictable processes……..
The slow sea level (volume) rise - 6 inches per century - will continue even as world
surface cools {notwithstanding changes in ocean floor shape such as the appearance of trenches and sumps in the Pacific as
the Indian sub-continent pushes up the Himalayas}
Weather in 21st Century - Answers

The weather extremes of recent years are part of natural essentially predictable
processesThe ’22yr’ (Solar-Magnetic) cyclical tendency for more extreme events will continue for a
few years and then decline (NB It is not clockwork!)
Last cycle: - Hot July 84, V cold Feb 86, Storms Oct 87
The SWT Predicted to within a few days from 11 months ahead the major Autumn storms 07 – N Sea storm surge early Nov,
- Giant sea swell (highest ever recorded west BI) end Nov
Weather in 21st Century - Answers

The weather extremes of recent years have been part of natural essentially predictable processes……..
Supposed man-made Global Warming / Climate Change extremes as distinct from natural – eg solar activity driven – extremes are fiction and will not recur.
Prediction of tendency for extreme events and actual events is entirely possible and depends on many factors of cycles and processess in the Solar Weather Technique.
Weather in 21st Century - Answers

How can solar particles & events change the weather? - 2
Signals of note – all observed in spectrum to within uncertainties
Lunar nodes (either direction) ~ 9.3yr
~ 22yr = solar period doubled due to magnetic linkage modulation.
World Temps
Lunar apsides (perigee-apogee line) advance ~ 8.85yr
~ 11yr = Solar cycle Geomagnetic activity
Solar wind – Moon – Planets angular momentum interactions
4.025.5d6.3 – 6.4dPluto-Charon
1.027.227.212dEarth-Moon
RatioSolar magnetic rotation (synodic) days
Nodal period days
Earth/Moon & Pluto/Charon are both ‘comparable mass’ pairs of bodies. All the moons of all other planets are relatively much smaller. This special relationship between the sun spin relative rate & the nodal crossing period of moons with their planets is not seen anywhere else in the solar system.

How can solar particles & events change the weather? - 3

How can solar particles & events change weather? - 4
Solar UV & Particle bursts affect the stratosphere and jet stream. Jet stream shifts are the main immediate causes of weather & climate change.
Many of these changes described by ‘Red Spikes’ & ‘SWIPS’ (Solar Weather Impact Periods) are predictable by the Solar Weather Technique many months ahead with 85% Success rate for SWT predicted extreme events (in eg 66 world extreme predictions in last 12 months)

Proxies drivers and modulatorsBeware confusion of cause, effect & association!
Increased solar (magnetic) activity excludes more cosmic rays (extra-solar high energy) from solar system and Earth. Cosmic rays convert N14 to C14 so C14 is a reverse proxy for solar activity.
ΔC14 = – Δ Solar activity => 11yr signal Also note solar Cycle length = 1/ solar activity approx.
Geomagnetic activity = Solar activity <11yr> X Earth magnetic cross section (depends on slow
changing Earth’s magnetic field) => 11yr signal
Temperature = Particle EFFECT = Geomag activity X magnetic linkage to lower atmosphere via poles etc <22yr> => 22yr signalSolar magnetic cycle (22yr) smoothed temps and geomagnetic activity move together better than anything else.

World Temps follow the Solar Magnetic cyclePeaks on average are 2 years after Odd Maximum.
The Max for cycle 23 was in 2001. Smoothed (2yr) world temps show a peak in 2002/3.
Piers Corbyn
Solar charged particles come in essentially 11year cycles but the magnetic connectivity of the Sun-Earth system, which enables the particles to penetrate the Earth’s atmosphere further, changes from strong to weak over periods of Hale cycle length. This causes the Hale cycle of World temperature.
Strong linkage peaks just after the Odd Max (eg Cycle 23 max 2001) and Weak linkage peaks just after the even Max (cycle 24 Max will be approx 2012)
Warm/Strongest Linkage = Odd max (phase16)+2 Cold/Weakest = Even max (phase 5)+2

Geomagnetic Activity, which is a measure of solar particles hitting the Earth’s magnetic field (which extends 7 Earth radii into space), mainly follows the 11yr sunspot cycle
Piers Corbyn, Weather Action
NOTE. Scaled Hale Cycles are all made 22 ‘pseudo-years’ long so shorter cycles are stretched a little and longer ones compressed so Minima and Maxima coincide for stacking purposes etc.

New!Heat flow in & out of Earth’s surface
- Assuming effect of CO2 doubling reliable although that is questioned -
Extra Radiation to surface INFLOW =>To surface from Ghe if CO2 doubled =3.8W/m2
Ghe = Greenhouse effect = H2O (largest Ghe) + CO2 etc
Extra Photosynthesis transpiration <= heat OUTFLOW if CO2 doubled approx = 3.8W/m2- taken up and away from surface
IF there are not enough plants to do the cooling the world gets warmer, Spring gets earlier and plants grow more and have a greater cooling effect. This feedback ensures that the two effects balance over time.
Plant evap
Sea
evap
Long
wave
rad

See www.weatheraction.com – Forecast accuracy button
•14/16 Success for Brit & Ire Floods/storms Jun to Dec 07: inc:• All 11 flood periods in Britain summer 2007, success 10/11 in England/Wales • The North Sea storm surge – which came on 9th Nov – 2,000 evacuated from Yarmouth, unprecedented raising of sea defences in Holland• “Extremely stormy sea conditions & alarming build up of swell” for near end Nov (extended to1/2Dec) – confirmed by highest ever recorded waves in West Britain/Ire (f/c 11 mths ahead).
• ALL 5 notable seasonal weather types 2007-09 correct while Met Office forecast the opposite to what occurred in ALL cases. - For wet summers 2007, 08, 09, icy snowy winter 08/9, & world temp decline 08 & 09.
Weather Action World extreme events forecasts:(now under SWT25d) March 2008 to June 2009 scored 85% success on forecasts of: rain/hail/thunder and snow deluges, heatwaves, floods, tornadoes, typhoon & tropical storm formation (& the vital ‘end-game’ land hit storm tracks in Gulf Of Mexico)Forecasts covered events in Britain, Ireland, Europe, USA, Alaska, Canada, Brazil, Atlantic, Caribbean/Gulf, Pacific, Taiwan, Japan, China, Indian Ocean, Bay of Bengal, Australia.
SWT Spectacular success from 11 mths ahead85% success on world extreme events: