Embed Size (px)
Citation preview

®
Financial Update
Mailer’s Technical AdvisoryCommittee Meeting
November 18, 2009
Joe CorbettChief Financial Officer & Executive Vice President

2
AgendaAgenda
2009 Financial Results2010 Plan HighlightsSOX Update

3
-8.6%
-16.5%
-7.6%
-13.7%
-12.3%
-18.0%
-16.0%
-14.0%
-12.0%
-10.0%
-8.0%
-6.0%
-4.0%
-2.0%
0.0%
First-Class Standard Periodicals Package Svcs Shipping Services
(% S
PL
Y)
FY 2009 Volume Performance FY 2009 Volume Performance
$35.9B
$17.4B
$2.0B
$1.7B$8.1B
Total Volume vs. SPLY = -12.7%

4
Total Workhour SavingsTotal Workhour Savings
-115
-50-36
-4
11
-130
-110
-90
-70
-50
-30
-10
10
30
2005 2006 2007 2008 2009FY
(Millions)

5
FY 2009 Financial ResultsFY 2009 Financial Results
(Billions) FY 2008 FY 2009
Volume 203 177
Revenue $75.0 68.1Personnel Costs 53.6 53.1Non-Personnel Costs 16.8 15.4Retiree Health Benefits 7.4 3.4Net Loss ($2.8) (3.8)
Career Employees * 663 623(*) Thousands

6
AgendaAgenda
2009 Financial Results2010 Plan HighlightsSOX Update

7
Principles of the PlanPrinciples of the Plan
Liquidity Protect The Brand Maintain Service: Quality and Timeliness Return To Profitability Fulfill Universal Service Obligation Grow New Revenue Streams Meet Other Fiduciary Responsibilities

8
Major AssumptionsMajor Assumptions
No Rate Increase No Cost of Living Increase $3.8B in Cost Savings Fuel Prices Remain Stable Reduction of 93M Workhours/53K FTEs Full RHB Payment ($7.7B)
9
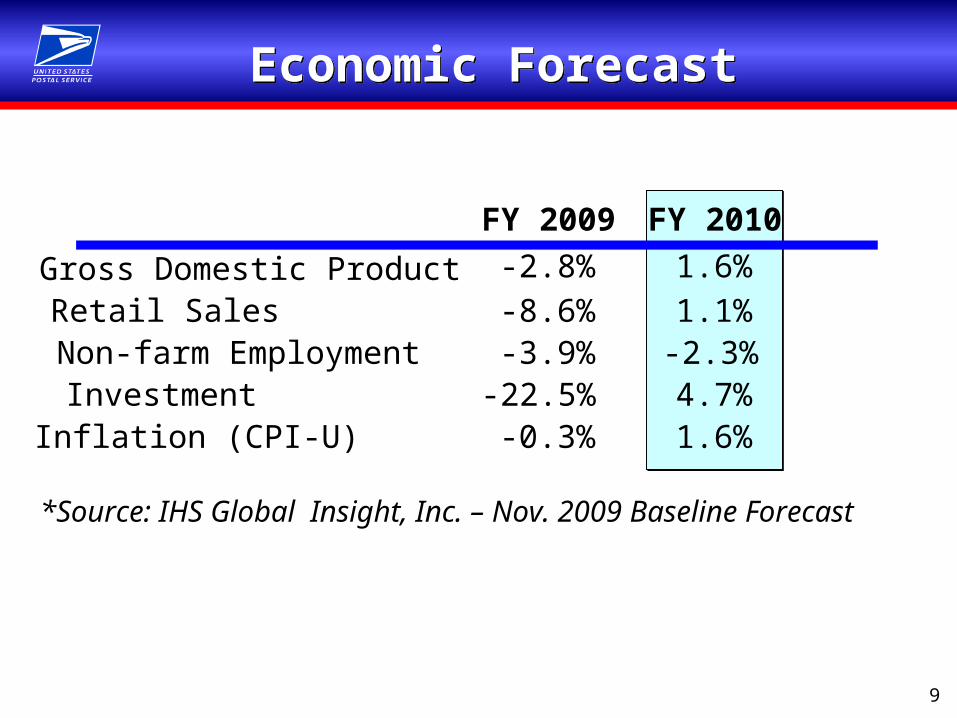
Economic ForecastEconomic Forecast
FY 2009 FY 2010
Gross Domestic Product -2.8% 1.6%Retail Sales -8.6% 1.1%Non-farm Employment -3.9% -2.3%Investment -22.5% 4.7%Inflation (CPI-U) -0.3% 1.6%
*Source: IHS Global Insight, Inc. – Nov. 2009 Baseline Forecast

1010
-6.2%
-14.3%-13.6%
-6.2%
-2.0%-1.1%
-7.4%
-16.0%
-14.0%
-12.0%
-10.0%
-8.0%
-6.0%
-4.0%
-2.0%
0.0%Volume
MailProcessing
CustomerServices
CityDelivery
RuralDelivery Other Total
(% S
PL
Y)
166B
215M 154M
398M
FY 2010 Workhours PlanFY 2010 Workhours Plan
177M220M
1.2B

11
$75
$68
$66
$60
$70
$80
FY 2008 FY 2009 FY 2010 Plan
Revenue Comparison
Revenue Comparison
($ Billions)
*Scale Starts at $60B

12
Integrated Financial PlanIntegrated Financial Plan
(Billions) FY 2009Plan
FY 2010
Volume 177 166
Revenue 68.1 65.9Personnel Costs 53.1 50.0Non-Personnel Costs 15.4 16.0Retiree Health Benefits 3.4 7.7Net Loss (3.8) (7.8)
Career Employees * 623 593(*) Thousands

13
FY 2010 Capital CommitmentsFY 2010 Capital Commitments
5-Year FY 2010Average Plan
Facilities $896 $623Equipment 703 573Infrastructure and Support 443 304Vehicles 79 0Total $2,121 $1,500
($ in Millions)

14
($
Bill
ion
s)
($8.0)
($6.0)
($4.0)
($2.0)
$0.0
$2.0
$4.0
$6.0
$8.0
Sep
-09
Oct
-09
Nov
-09
Dec
-09
Jan-
10
Feb-
10
Mar
-10
Apr
-10
May
-10
Jun-
10
Jul-1
0
Aug
-10
Sep
-10
($ B
illio
ns)
FY 2010 projection assumes that debt is at its statutory maximum of $13.2 B through Sept. 2010
Average Monthly Operating Expenses
Volume Plan: 166B Pieces
Available Cash by Month FY 2010Available Cash by Month FY 2010
Before $5.5B RHB Payment 9-30-10
$5.6B
Unrestricted Cash: $4.0B

15
AgendaAgenda
2009 Financial Results2010 Plan HighlightsSOX Update

16
SOX AccomplishmentsSOX Accomplishments
Determine Materiality and Scope
Establish Steering Committee
Develop Communications and
Training plan
FY 2007Prepare
Prepare Documentation
Identify Controls and Gaps
Initiate Gap Remediation
FY 2008Document
Continue Gap Remediation
Update Documentation as Needed
Perform Readiness Testing
FY 2009Test
Update Documentation
Test Controls
CEO and CFO Certification
FY 2010Full Assessment

17
Business Mail Entry UnitsBusiness Mail Entry Units
Significant Deficiency in FY 2009
Focus on compliance● BMA Scorecard
Timely Postage Statement entry Verifications Completed
● SOX Certification All units accepting business mail SOX Controls

18
Business Mail Entry UnitsBusiness Mail Entry Units
Mailers support needed for compliance● Move to electronic postage statements /
verify completion of postage statements● Bring complete postage statements with
mailings● Ensure mailings are checked in at BMEU

®
Financial Update
Mailer’s Technical AdvisoryCommittee Meeting
November 18, 2009
Joe CorbettChief Financial Officer & Executive Vice President