Embed Size (px)
Citation preview

Solvent dependent growth of one-dimensional crystalline
β-FeOOH nanorods
by
MAHABUBUR RAHMAN CHOWDHURY
Thesis submitted in fulfilment of the requirements for the degree
DOCTOR TECHNOLOGIAE: ENGINEERING: CHEMICAL
in the
FACULTY OF ENGINEERING
at the
CAPE PENINSULA UNIVERSITY OF TECHNOLOGY
Cape Town Campus
Supervisor: Assoc. Prof. V.G. Fester
Co-supervisor: Assoc. Prof. G.M. Kale (University of Leeds, UK)
February 2014
CPUT copyright information
The dissertation/thesis may not be published either in part (in scholarly, scientific or technical journals),
or as a whole (as a monograph), unless permission has been obtained from the University.

“Read! In the name of your Lord Who has created (all that exists). He has created
man from a clot (a piece of thick coagulated blood). Read! And your Lord is the
Most Generous. Who has taught (the writing) by the pen. He has taught man which
he knew not” [Al-Quran, 96: 1-5]
“A saint is a sinner who keeps on trying” – N. R. Mandela
Preamble
DECLARATION
I, Mahabubur Rahman Chowdhury, hereby declare that the contents of this thesis represent my own
unaided work, and that the thesis has not previously been submitted for academic examination towards
any qualification. Furthermore, it represents my own opinions and not necessarily those of the National
Research Foundation and Cape Peninsula University of Technology.
10 February 2014
Signed Date
Mahabubur Rahman Chowdhury

Preamble
i
Solvent dependent growth of 1-D crystalline β-FeOOH nanorods
by
Mahabubur Rahman Chowdhury
ABSTRACT
Several authors have reported on the use of alcohols – water /or mixed solvents to synthesise metal oxide
nanoparticles. However, no systematic study has been carried out to evaluate the effect of mixed solvent
on the particle characteristics, although considerable research has been reported, a gap still exists with
regard to the effect of the alcohols as solvents on the growth kinetics of nanoparticles. To address these
issues, four different alcohols, namely, methanol (MeOH), ethanol (EtOH), propanol (PrOH) and butanol
(BuOH) were used as solvents in the synthesis of β-FeOOH particles.
The effect of organic solvents on the growth kinetics of β-FeOOH nanorods has been evaluated for the
first time in this study. Two-stage growth of akaganeite nanorods has been observed in BuOH and PrOH.
The first growth stage follows a typical power law representing Ostwald ripening (OR) kinetic. The
second stage was found to be asymptotic and obeyed oriented attachment (OA) kinetic. The proof of the
OA kinetic also comes from the HRTEM images of the synthesised particles. Simultaneous occurrence of
the two mechanisms was observed in the growth of the particles synthesised in EtOH and MeOH. The
rate constants for OR kinetic, KOR, was found to be higher than the rate constant for OA kinetic, KOA, for
different solvents used.
Preamble
ii
The use of a mixed solvent is a new approach in the synthesis and processing of materials. Various
researchers have stated that the surface tension of the solvent plays an important role in the formation of
uniform nanorods. However, the effect of surface tension was not correlated with the particle growth,
earlier, though the dielectric properties of the mixed solvents were only taken into account. Additionally,
no quantitative or qualitative relationship was presented between surface tension and particle growth in
the literature. In this work an attempt to correlate these two parameters (surface tension and particle
growth) with the concentration of the precursor and temperature was made, resulting in an exponential
relationship between KOR for the particle growth and surface tension of the alcohols. Furthermore, the
relationship between surface tension and particle growth was validated by an independent study using
statistically designed experiments to account for the influence of various process variables on the particle
growth. The findings in this study obtained from both theoretical and experimental work provides an
insight into the relationship between solvent surface tension and particle growth interactions, producing a
new piece of information that will further promote our understanding of the formation mechanisms of β-
FeOOH growth.
The transformation temperature of akaganeite (β-FeOOH) nanorods to hematite (α-Fe2O3) particles was
found to be solvent dependent. Thermogravimetric analysis and differential scanning calorimetry were
performed to evaluate the effect of alcohol on the thermodynamic stability of the particles. Alcohol as
solvent played a significant role in the dehydration property of the synthesised particles. The percentage
mass loss of the particles at 300˚C decreases linearly with increasing carbon number in the linear alkyl
chain of the solvent.
The effect of alcohol type on the particle morphology was found to be more pronounced at higher FeCl3
concentrations (>0.5M). Splitting of β-FeOOH nanorods was observed at FeCl3 concentration of 0.7M in
BuOH. In PrOH, rectangular morphologies were obtained whereas nanoribbons resulted in surfactant-free
conditions. It was found that the nature of anions (chloride vs. nitrate and sulphate) in the precursor salt
also influenced the morphology.

Preamble
iii
DEDICATION
To my dearest parents
Late Shafiqur Rahman Chowdhury and Arnis Akhter Chowdhury
To my dearest younger brothers
Ashiqur Rahman Chowdhury and Mashukur Rahman Chowdhury
To the love of my life
I could not have finished this work in time without your support and sacrifice

Preamble
iv
BIOGRAPHICAL SKETCH
Mahabubur Rahman Chowdhury was born in Dhaka, Bangladesh. He attended Khilgaon Government
High School in Dhaka where he matriculated in 2002. He obtained his Bachelor of Technology (cum
laude) in Chemical Engineering at CPUT in 2008. Both the SAIMM (Southern African Institute of
Mining and Metallurgy) and SAIChE (South African Institution of Chemical Engineers) presented him
with awards for exceptional academic achievement during his undergraduate studies. He was awarded a
Master of Technology degree (passed with 73%) in Chemical Engineering in 2010, and received several
postgraduate merit scholarships from the University. He also received an innovation scholarship from the
National Research Foundation (NRF) of South Africa. While at the University he has worked as a
research assistant/metallurgist, student tutor, lecturer, and supervisor for Bachelor of Technology research
projects. His master’s study has generated two published papers. The data generated from his study were
included in engineering design software by an international engineering design company (ESDU). The
developed correlation is used in “Pipe Tool” slurry pipeline design software. After completion of his
master’s degree, he enrolled for a doctorate in Chemical Engineering in 2011 under the supervision of
Prof. Veruscha Fester (CPUT, RSA) and Prof. Girish Kale (University of Leeds, UK). A paper have been
published so far from this work and another paper has been accepted for consideration in reputed journal.

Preamble
v
PUBLICATIONS
1. Chowdhury, MR & Fester, VG 2012, Modelling pressure losses for Newtonian and non-Newtonian
laminar and turbulent flow in long square edged orifices, Chemical engineering research and design,
vol 90, pp. 863-869.
2. Chowdhury, MR, Fester, VG & Kale, GM 2014, Growth kinetics evaluation of hydrothermally
synthesised β-FeOOH nanorods, Journal of crystal growth, vol 387, pp. 57-65.
3. Chowdhury, MR, Fester, VG, Kale, GM & Cespedes, O, Effect of experimental conditions on the
synthesis of β-FeOOH nanostructures, Journal of nanoparticle research, (accepted).
4. Fester, VG, Chowdhury, MR & Ludicello, F 2010, Pressure loss and discharge coefficients for non-
Newtonian fluids in long orifices, 18th International conference on hydrotransport, BHR group, Rio de
Janeiro.

Preamble
vi
PRESENTATIONS
1. Chowdhury, MR & Fester, VG 2010, Modelling pressure losses for Newtonian and non-
Newtonian laminar and turbulent flow in long square edged orifices, 18th international
hydrotransport conference, Rio de Janeiro, Brazil.
2. Chowdhury, MR & Fester, VG 2012, Relationship between solvent surface tension and particle
growth, CPUT post graduate conference, Cape Town, R.S.A.
3. Chowdhury, MR, Fester, VG & Kale, GM 2013, Relationship between solvent surface tension
and particle growth, Nanotechnology, Cancun, Mexico.

Preamble
vii
ACKNOWLEDGEMENTS
I am grateful to:
ALLAH the ALMIGHTY, for giving me strength and courage to pursue the highest degree.
Prof. Veruscha Fester, for giving me the opportunity to pursue this degree under her supervision.
Prof. Girish Kale, for his advice.
All the crazies from the leodies flat in UK
Dr Franscious Cummings from UCT, for helping with TEM images and microscopic analysis.
Ronel August from UCT for assisting with the XRD analysis.
Berita Blaauw Combrinck (CPUT) for her splendid laboratory work.
Unitemp, South Africa, for their excellent professionalism in delivering the parts on time.
Jackie from CJ labs for delivering the chemicals timeously.
Steven Mudenda (PhD student at the University of Leeds, UK) for his assistance during my time
at Leeds.
All other staff of the Material Science and Technology group who contributed to this work.
The financial assistance of the Cape Peninsula University of Technology (CPUT) and the National
Research Foundation (NRF) towards the research are acknowledged. Opinions expressed in this thesis
and the conclusions arrived at are those of the author and are not necessarily attributable to the Cape
Peninsula University of Technology or the National Research Foundation.

Preamble
viii
TABLE OF CONTENTS
ABSTRACT I
DEDICATION III
BIOGRAPHICAL SKETCH IV
PUBLICATIONS V
PRESENTATIONS VI
ACKNOWLEDGEMENTS VII
TABLE OF CONTENTS VIII
LIST OF TABLES XIII
TERMS AND CONCEPT XV
LIST OF ABBREVIATIONS XVI
LIST OF SYMBOLS XVIII
CHAPTER 1 1
INTRODUCTION 1
1.1 BACKGROUND 1
1.2 OBJECTIVES OF THE STUDY 4
1.3 DELINEATION OF THE STUDY 4
CHAPTER 2 5
LITERATURE REVIEW 5
2.1 INTRODUCTION 5
2.2 IRON OXIDES 5
2.2.1 Structure of iron oxides 5
2.2.2 Hematite α – Fe2O3 7
2.2.3 Akaganeite – β-FeOOH 8
2.2.4 Applications of α-Fe2O3 and β-FeOOH 9
2.3 1-D NANOSTRUCTURE OVERVIEW 10
2.3.1 Particle formation mechanisms and applications of 1-D nanostructures 10

Preamble
ix
2.4 FABRICATION APPROACHES AND TECHNIQUES 12
2.4.1 Hydrothermal / solvo-thermal synthesis 14
2.4.1.1 Batch synthesis 16
2.4.1.2 Continuous synthesis 17
2.5 EFFECT OF NANOPARTICLE SIZE ON PHYSICAL PROPERTIES 19
2.6 PREDICTION OF NANOPARTICLE SIZES UNDER DIFFERENT EXPERIMENTAL CONDITIONS 21
2.7 SURFACTANTS 21
2.7.1 Previous workreported on the effect of surfactants and alcohols on the iron oxide nanoparticle 22
2.8 AN OVERVIEW ON THE EFFECT OF PROCESSING CONDITIONS ON Β-FEOOH PARTICLE
CHARACTERISTICS REPORTED IN LITERATURE IN THE ABSENCE OF ALCOHOL 23
2.8.1 Effect of temperature on the β-FeOOH particle characteristics 23
2.8.2 Effect of FeCl3 concentrations on the β-FeOOH particle characteristics 23
2.9 GENERAL SYNTHESIS THEORY 24
2.9.1 Nucleation 24
2.9.2 Growth mechanisms 25
2.9.2.1 Classical growth kinetics, OR kinetics 25
2.9.2.2 Oriented attachment, OA, mechanism 26
2.9.2.3 OA based nanocrystal growth kinetic models 28
2.9.2.3.1 (A1+A1) model 28
2.9.2.4 Two-step reaction during the OA growth 29
2.9.2.4.1 Rotation of nanoparticles before coalescence 29
2.9.2.4.2 Self-recrystallisation of nanocrystal after coalescence 30
2.10 KINETIC SIZE CONTROL 31
2.11 MATERIAL CHARACTERISATION TECHNIQUES 31
2.11.1 X-ray diffractometry 31
2.11.2 Electron microscopy 33
2.11.2.1 Transmission electron microscopy (TEM) 33
2.11.2.2 Scanning electron microscopy (SEM) 34
2.11.3 Thermogravimetric analysis 34
2.11.4 Energy dispersive spectroscopy 35
2.12 CONCLUSION 35
CHAPTER 3 37
EXPERIMENTAL METHODOLOGY 37

Preamble
x
3.1 INTRODUCTION 37
3.2 GENERAL SYNTHESIS SCHEME OF Β-FEOOH PARTICLES 37
3.3 MATERIALS AND PROCESSING CONDITIONS 38
3.4 FACTORIAL TRIAL EXPERIMENTS 41
CHAPTER 4 43
HYDROTHERMAL PRECIPITATION OF Β-FEOOH PARTICLES IN DIFFERENT SOLVENT RATIO (% V/V) AND PH
43
4.1 INTRODUCTION 43
4.2 EXPERIMENTAL METHODOLOGY 43
4.3 RESULTS AND DISCUSSION 44
4.3.1 Effect of BuOH-to-H2O and PrOH – to-H2O ratio on the akaganeite nanoparticle characteristics 44
4.3.2 Effect of EtOH - to - H2O and MeOH – to - H2O ratio on the akaganeite nanoparticle
characteristics 50
4.3.3 Relationship between particle size and surface tension 53
4.3.4 Effect of pH on the growth of β-FeOOH nanoparticles 56
4.3.5 Effect of alcohol on the Raman spectra of the synthesised particles 59
4.4 CONCLUSION 60
CHAPTER 5 63
ROLE OF SOLVENT ON THE GROWTH KINETICS OF Β-FEOOH NANORODS 63
5.1 INTRODUCTION 63
5.2 EXPERIMENTAL METHODOLOGY 63
5.3 RESULTS AND DISCUSSION 65
5.3.1 Evaluation of growth mechanism via HRTEM 65
5.3.1.1 Investigation of β-FeOOH growth in BuOH and PrOH 65
5.3.1.2 Investigation of β-FeOOH growth in EtOH 70
5.3.1.3 Investigation of β-FeOOH growth in MeOH 71
5.3.2 Relationship between particle size and carbon number present in the linear alkyl chain of the
solvent 73
5.3.3 Growth kinetic evaluation of akaganeite nanorods 74
5.3.3.1 Effect of BuOH and PrOH on the growth kinetics of akaganeite nanorods 74
5.3.3.2 Effect of EtOH and MeOH on the growth kinetics of β-FeOOH nanorods 78
5.3.4 Relationship between solvent surface tension and growth rate constants 81
Preamble
xi
5.5 CONCLUSION 87
CHAPTER 6 88
PREDICTION OF HYDROTHERMALLY SYNTHESISED SOLVENT-DEPENDENT Β-FEOOH NANOROD SIZES 89
6.1 INTRODUCTION 89
6.2 EXPERIMENTAL METHODOLOGY 89
6.3 RESULTS AND DISCUSSION 91
6.3.1 Effect of FeCl3 concentration 91
6.3.1.1 Structural evolution of particles 91
6.3.1.2 Morphological evolution of particles in BuOH 91
6.3.1.3 MORPHOLOGICAL EVOLUTION OF Β-FEOOH PARTICLES IN PROH 95
The effect of FeCl3 concentration in propanol is illustrated in Figure 6.3. 95
6.3.2 Effect of anions on the particle characteristics 99
6.3.3 Effect of reaction temperature on the particle characteristics 102
6.3.3.1 Transformation of β-FeOOH to α-Fe2O3 in BuOH and PrOH 102
6.3.3.2 Transformation of β-FeOOH to α-Fe2O3 in EtOH and MeOH 107
6.3.4 Role of alcohol on the dehydration properties of β-FeOOH particles 110
6.3.5 Magnetic properties of the β-FeOOH nanorods 112
6.3.6 Mathematical relationship between experimental conditions and particle size 113
6.4 CONCLUSION 116
CHAPTER 7 119
SUMMARY AND CONCLUSIONS 119
7.1 INTRODUCTION 119
7.2 SUMMARY 119
7.3 CONCLUSION 120
7.4 SIGNIFICANT CONTRIBUTION 120
7.5 FUTURE RESEARCH CONTRIBUTION 120
REFERENCES 121
APPENDICES 135
APPENDIX A 135

Preamble
xii
MINERALOGICAL, CHEMICAL AND STRUCTURAL INFORMATION FOR Β-FEOOH
PARTICLES (JCPDS CARD NO: 42-1315) 135
MINEROLOGICAL, CHEMICAL AND STRUCTURAL INFORMATION FOR Α-FE2O3 PARTICLES
(JCPDS CARD NO: 33-0664) 139
MINEROLOGICAL, CHEMICAL AND STRUCTURAL INFORMATION FOR HYDRONIUM IRON
JAROSITE PARTICLES (JCPDS CARD NO: 21-0932) 145
APPENDIX B 149

Preamble
xiii
LIST OF TABLES
Table 2.1 Various types of iron oxides (Azhar, 2007) .......................................................................... 6
Table 2.2 One-dimensional nanostructures overview (Almeida, 2010) ................................................ 11
Table 2.3 Comparison between different techniques (Dawson, 1988) ................................................. 15
Table 2.4Materials prepared from under NCW or SCW conditions (Xu, 2006) .................................... 18
Table 2.5 OA mechanism controlled growth of iron oxide nanoparticles ............................................. 27
Table 3.1 Process variable for the synthesis of β-FeOOH (bold text represents standard conditions) ...... 40
Table 3.2 Two level three factor experimental design ........................................................................ 41
Table 4.1 Experiments with different solvent ratios ........................................................................... 44
Table 4.2 Experiments with different solution pH ............................................................................. 44
Table 4.3 Effect of solvent ratio on the particle characteristics ........................................................... 49
Table 4.4 Effect of solvent ratio on the particle characteristics ........................................................... 53
Table 5.1 Experiments with different synthesis time ......................................................................... 63
Table 5.2 Effect of time on the particle characteristics in BuOH ......................................................... 69
Table 5.3 Effect of time on the particle characteristics in PrOH .......................................................... 69
Table 5.4 Effect of time on the particle characteristics in EtOH .......................................................... 71
Table 5.5 Effect of time on the particle characteristics in MeOH ........................................................ 73
Table 5.6 Rate constants for both growth mechanisms....................................................................... 78
Table 5.7 Rate constants for both growth mechanisms....................................................................... 81
Table 5.8 Physical properties of alcohol and water at 100˚C .............................................................. 82
Table 5.9 Surface tension values of alcohol ...................................................................................... 85
Table 6.1 HS processing variables ................................................................................................... 90
Table 6.2 Effect FeCl3 concentrations on β-FeOOH particle characteristics in BuOH ........................... 94
Table 6.3 Effect FeCl3 concentrations on β-FeOOH particle characteristics in PrOH ............................ 96
Table 6.4 Effect FeCl3 concentrations on β-FeOOH particle characteristics in EtOH ............................ 98
Table 6.5 Effect FeCl3 concentrations on β-FeOOH particle characteristics in MeOH .......................... 99

Preamble
xiv
Table 6.6 Effect of temperature on the particle characteristics .......................................................... 106
Table 6.7 Effect of temperature on the particle characteristics .......................................................... 109

Preamble
xv
TERMS AND CONCEPT
1-D nanorod: A rod shaped particles having both dimensions in nanometer scale.
Hydrothermal synthesis: A synthesis technique for crystallization of nanomaterials by utilizing high
temperature and high pressure.
Nanowire: Practically similar to nanorod but have aspect ratios higher than 10
Ostwald ripening: Growth of bigger particles by dissolution of and re-deposition of smaller particles in
solution.
Oriented attachment: A recently observed phenomenon where the particle shape or size changes by
attaching different particles together crystallographically.
Supercritical water: Water at a temperature and pressure above its critical point.
Preamble
xvi
LIST OF ABBREVIATIONS
1-D One dimensional
CHP Continuous hydrothermal synthesis
CHS Continuous hydrothermal plant
CTAB Cetyltrimethylammonium bromide
CVD Chemical vapour deposition
EDS Energy dispersive spectroscopy
FEG Field emission gun
GRIGC Grain rotation induced grain coalescence
HS Hydrothermal synthesis
LSW Lifshitz-Slyozov-Wagner
OA Oriented attachment
OR Ostwald ripening
NCW Near critical water
NR Nanorod
NT Nanotube
NW Nanowire
SCW Supercritical water
SDD Silicon drift detector
SEM Scanning electron microscope
TEM Transmission electron microscope
TGA Thermogravimetric analysis

Preamble
xvii
VLS Vapour-liquid-solid
XRD XRay diffraction

Preamble
xviii
LIST OF SYMBOLS
Symbol Description Unit
C Solute concentration M
D Particle diameter m
d Particle diameter m
de Equivalent diameter m
do Initial particle diameter m
e Electron charge C
G Gibbs free energy kJ/mol
h Planck’s constant -
K Boltzmann’s constant -
OAK Growth rate constant min-1/3
ORK Growth rate constant min-1
L Particle length m
AVL Average particle length m
T Temperature ˚C
t Time s
GREEK SYMBOLS
ε Dielectric constant -

Preamble
xix
εo Permittivity in vacuum -
μ Viscosity Pa.s
μ Chemical potential J
γ Interfacial energy j/m2
σ Surface tension N/m
AVφ Average diameter m
Chapter 1: Introduction
1
Chapter1
Introduction
1.1 Background
Metal oxide nanoparticles often exhibit enhanced chemical, thermal, optical, electrical and magnetic
properties, which make them useful in different catalysis, pigments, coatings and inks applications (Darr
& Poliakoff, 1999). Iron oxide nanoparticles have promising potential in imaging technique (Jun et al.,
2007). Non-spherical nanoparticles have become attractive because of their anisotropic behaviour (Jiang
et al., 2010).
One-dimensional (1-D) nanomaterials such as nanowires, nanotubes, nanorods and nanoribbons have
unusual properties, such as photochemical, photophysical and electron transport properties (Liu et al.,
2006) and have been extensively investigated as building blocks for many functional applications, ranging
from molecular nanosensors and nanoscale electronics to nanocomputing (Persson et al., 2004).
Akaganeite (β-FeOOH) is a type of iron oxy hydroxide which has applications in different technological
fields. One dimensional β-FeOOH nanorods and nano wires were synthesised in which surfactants were
used to direct growth, achieve uniformity and prevent aggregation of the product. However, one-step
surfactant-free synthesis of 1-D β-FeOOH is not common (Wei & Nan, 2011). There are several studies
pertaining to the novel morphological features of a-Fe2O3 nanoparticles, but the same for β-FeOOH are
almost non-existent, despite its different applications (application in lithium batteries, Shao et al., 2005;
hydro-processing of coals, Cornell & Schwertmann, 2003; precursor to ferromagnetic materials, (xiong et
al., 2003; etc.). Published literature provides strong evidence that β-FeOOH particle formation strongly
Chapter 1: Introduction
2
depends on the experimental conditions, however, no attempts have been made to describe
mathematically how these factors impact the characteristics of the synthesised particles. Despite the
number of studies conducted on the synthesis of β-FeOOH particles, there is a lack of a standardised
synthesis procedure for preparation of a specific particle size systematically. Therefore, particles were
synthesised systematically to derive mathematical relationships between experimental conditions and
particle growth.
The particle size and morphology strongly control the magnetic and optical properties of 1-D
nanoparticles. Different intriguing applications of metal oxide nanoparticles often depend on specific
physical characteristics of the nanoparticles such as size, morphology and crystallinity. These physical
characteristics are subject to the method employed to fabricate these particles (Kandori et al., 2002).
Several techniques exist to fabricate 1-D nanostructures such as template-directed synthesis (Kim et al.,
2002), vapour-solid (VS) or vapour-liquid-solid (VLS) growth (Pan et al., 2001), hydrothermal or
solvothermal method (Wang & Li, 2002) and the solution-liquid-solution method (Holmes et al., 2000).
Hydrothermal synthesis possesses several advantages over other manufacturing techniques, including
high purity (> 99.5%) and chemical homogeneity, small particle size (< 5 nm possible), narrow particle
size distribution, single-step processing, low energy usage, fast reaction times, low- cost equipment, the
ability to generate metastable compounds, and importantly, no calcination is required for many materials
since they are fully crystallised by the reaction (Byrappa & Adschiri, 2007). Because of all these
advantages, the hydrothermal method was chosen to synthesise 1-D β-FeOOH and α-Fe2O3 particles in
this study.
Several authors have reported the use of alcohols for nanoparticle synthesis. Chen et al. (2008)
synthesised hematite nanoplates using alcohols as solvents. They reported that alcohol played an
important role in controlling nanoplate sizes. Liu et al. (2006) reported the synthesis of 1-D α-Fe2O3
nanorods and tubes in the presence of butanol and different surfactants (L113B and SPAN 80). Together
with the surfactant, it was believed that butanol played an important role in obtaining the rod-like
Chapter 1: Introduction
3
structure. Shao et al. (2005) reported the synthesis of arrayed akaganeite nanorods and hexagram shaped
particles using ethanol as solvent. The authors reported that the surface tension of the ethanol-water
mixture was low enough to form β-FeOOH nanorods. Fester et al. (2008) reported use of alcohols in the
synthesis of 1-D α-Fe2O3 nanorods and concluded that 1-D α-Fe2O3 nanorods could be synthesised
without a surfactant only in butanol. Vorkapic and Matsoukas (1998) studied the role of alcohols in the
preparation of titania colloids and reported that alcohol played a significant role in the synthesis of the
particles. Verdon and co-worker (1995) found that the presence of ethanol improved the dehydration
properties of the particles significantly, compared with those synthesised without ethanol. Liang et al.,
(2010) developed a continuous hydrothermal method to produce single crystal iron oxide nanoparticles
using ferric nitrate and isopropanol (IPA). The degree of crystallinity and crystal size decreased with
increasing amount of IPA, indicating that the presence of alcohol mainly affected the crystallization
process. A correlation between the type of alcoholic solvent and the growth mechanism of the β-FeOOH
nanoparticles is lacking which makes this study relevant.
Surface tension of alcohol plays an important role in the formation of uniform nanorods. A low surface
tension of solvent can promote the growth of β-FeOOH nanorods (Shao et al., 2005, Fester et al., 2008).
Addition of medium which can lower the surface tension of precursor solution can alter the
thermodynamic properties of the reaction system and subsequently affect the nucleation kinetics, which
would result in various morphology and particle sizes. The application of alcohol / water mixture during
the synthesis of different metal oxide nanoparticles can be found in the literature. However the effect of
mixed solvent properties on the growth of 1-D β-FeOOH nanorods was not evaluated despite of its
numerous industrial and scientific applications. Dielectric constants of the mixed solvents were related to
particle nucleation and growth in all cases. Coulombic interaction is weaker in water and solvent with
high dielectric constant values (Israelachvili, 1992). This phenomenon makes the application of the
dielectric constant only, to relate particle growths susceptible. On the hypothesis that a quantitative and /
or qualitative relationship between alcohol surface tension and particle growth exists, the effect of four

Chapter 1: Introduction
4
different alcohols on the growth kinetics of β-FeOOH nanorods has been evaluated. Empirical
correlations have been developed to further illustrate the relationships between the solvent surface tension
and particle growth.
1.2 Objectives of the study
The objectives of the study can be summarised as:
1. To conduct a systematic study to evaluate the effect of alcohol on the β-FeOOH particle
morphology and growth mechanism under different hydrothermal processing conditions, i.e.
solvent ratio, precursor concentration and type and temperature.
2. To establish a quantitative and / or qualitative relationship between particle growth and solvent
surface tension.
1.3 Delineation of the study
The following was not included in this study:
Applications of the synthesised particles.
Use of nonpolar solvent to synthesise the particles.
Chapter 2: Literature review
5
Chapter2
Literature review
2.1 Introduction
This chapter presents a brief review of literature on different synthesis techniques to obtain iron oxide
nanoparticles. One-dimensional nanostructures are reviewed. Effect of surfactant and nature of alcohol
used as solvent on the morphology of the synthesized iron oxide nanoparticles is discussed. A
comprehensive review of different growth kinetics is offered. Fundamentals of different characterisation
techniques are also briefly given.
2.2 Iron oxides
One of the common compounds that exists as a natural mineral and can also be fabricated synthetically is
iron oxide. There are 16 types of iron oxides are known to date (Cornell & Schwertmann, 2003) and these
are noted in Table 2.1.
2.2.1 Structure of iron oxides
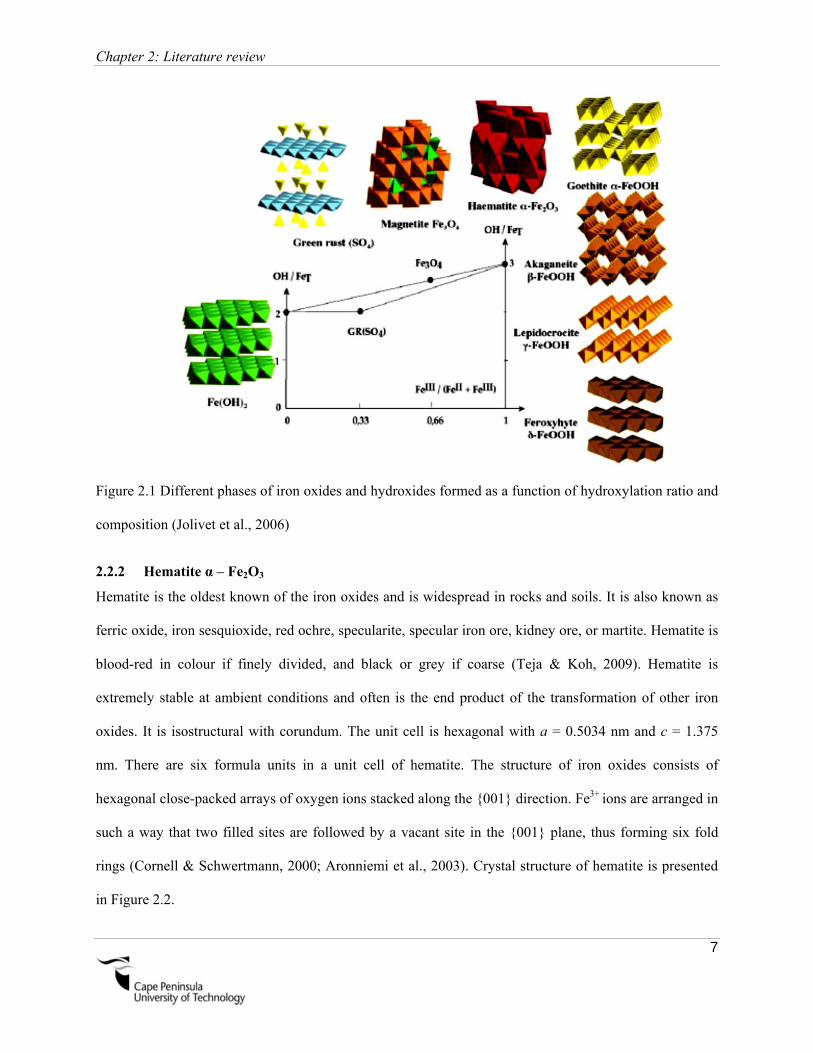
Iron oxides are crystalline except schwertmannite and ferrihydrite, which are poorly crystalline. The
structural chemistry of iron compounds is diverse; this is reflected in their large number of atomic
structures. Figure 2.1 presents the structures of common iron compounds. Virtually all the phases of iron
compounds can be formed from chemical solutions, alluding to a complicated chemistry of formation
(Almeida, 2010). The high versatility of iron chemistry in an aqueous medium originates from two
factors: 1) the occurrence of two oxidation states, Fe2+ and Fe3+ which are stable on a large range of
Chapter 2: Literature review
6
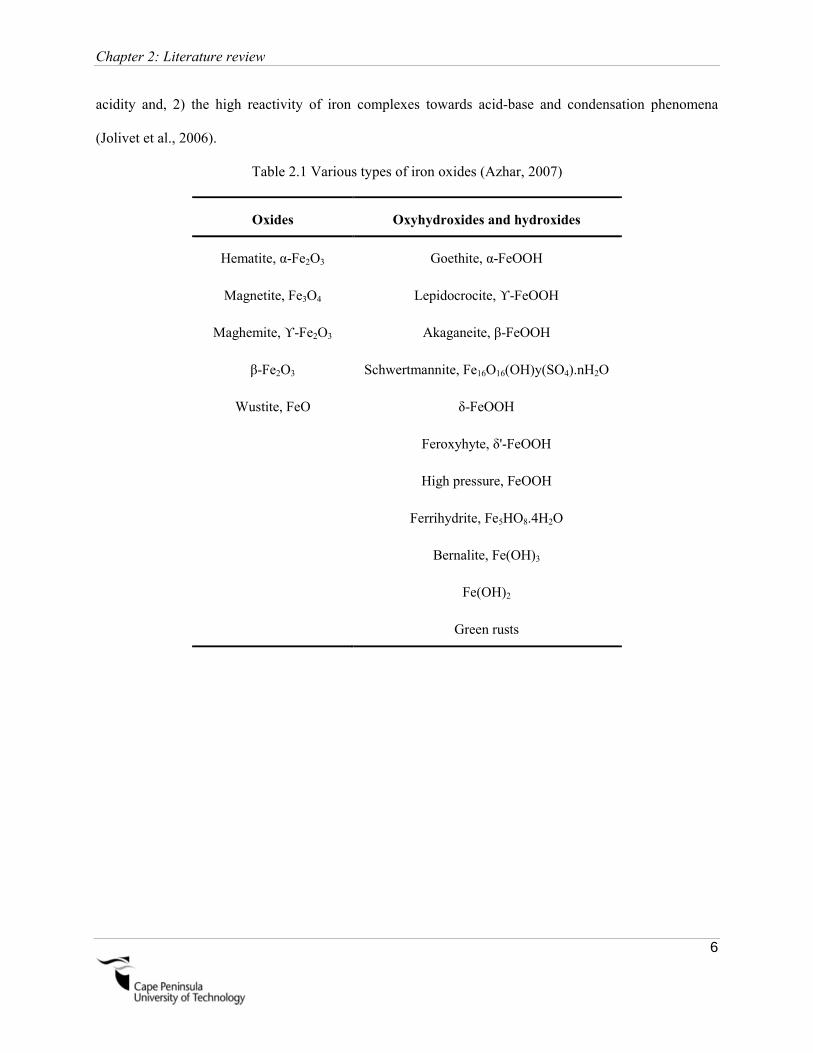
acidity and, 2) the high reactivity of iron complexes towards acid-base and condensation phenomena
(Jolivet et al., 2006).
Table 2.1 Various types of iron oxides (Azhar, 2007)
Oxides Oxyhydroxides and hydroxides
Hematite, α-Fe2O3 Goethite, α-FeOOH
Magnetite, Fe3O4 Lepidocrocite, ϒ-FeOOH
Maghemite, ϒ-Fe2O3 Akaganeite, β-FeOOH
β-Fe2O3 Schwertmannite, Fe16O16(OH)y(SO4).nH2O
Wustite, FeO δ-FeOOH
Feroxyhyte, δ'-FeOOH
High pressure, FeOOH
Ferrihydrite, Fe5HO8.4H2O
Bernalite, Fe(OH)3
Fe(OH)2
Green rusts
Chapter 2: Literature review
7
Figure 2.1 Different phases of iron oxides and hydroxides formed as a function of hydroxylation ratio and
composition (Jolivet et al., 2006)
2.2.2 Hematite α – Fe2O3
Hematite is the oldest known of the iron oxides and is widespread in rocks and soils. It is also known as
ferric oxide, iron sesquioxide, red ochre, specularite, specular iron ore, kidney ore, or martite. Hematite is
blood-red in colour if finely divided, and black or grey if coarse (Teja & Koh, 2009). Hematite is
extremely stable at ambient conditions and often is the end product of the transformation of other iron
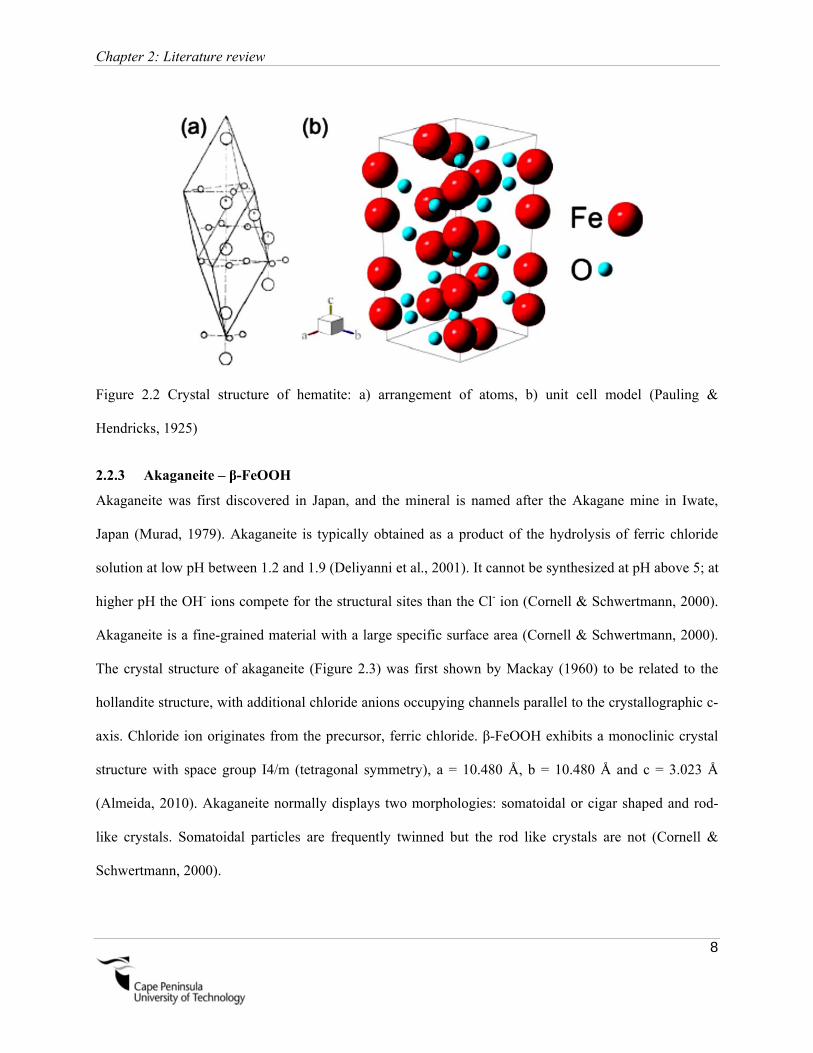
oxides. It is isostructural with corundum. The unit cell is hexagonal with a = 0.5034 nm and c = 1.375
nm. There are six formula units in a unit cell of hematite. The structure of iron oxides consists of
hexagonal close-packed arrays of oxygen ions stacked along the 001 direction. Fe3+ ions are arranged in
such a way that two filled sites are followed by a vacant site in the 001 plane, thus forming six fold
rings (Cornell & Schwertmann, 2000; Aronniemi et al., 2003). Crystal structure of hematite is presented
in Figure 2.2.
Chapter 2: Literature review
8
Figure 2.2 Crystal structure of hematite: a) arrangement of atoms, b) unit cell model (Pauling &
Hendricks, 1925)
2.2.3 Akaganeite – β-FeOOH
Akaganeite was first discovered in Japan, and the mineral is named after the Akagane mine in Iwate,
Japan (Murad, 1979). Akaganeite is typically obtained as a product of the hydrolysis of ferric chloride
solution at low pH between 1.2 and 1.9 (Deliyanni et al., 2001). It cannot be synthesized at pH above 5; at
higher pH the OH- ions compete for the structural sites than the Cl- ion (Cornell & Schwertmann, 2000).
Akaganeite is a fine-grained material with a large specific surface area (Cornell & Schwertmann, 2000).
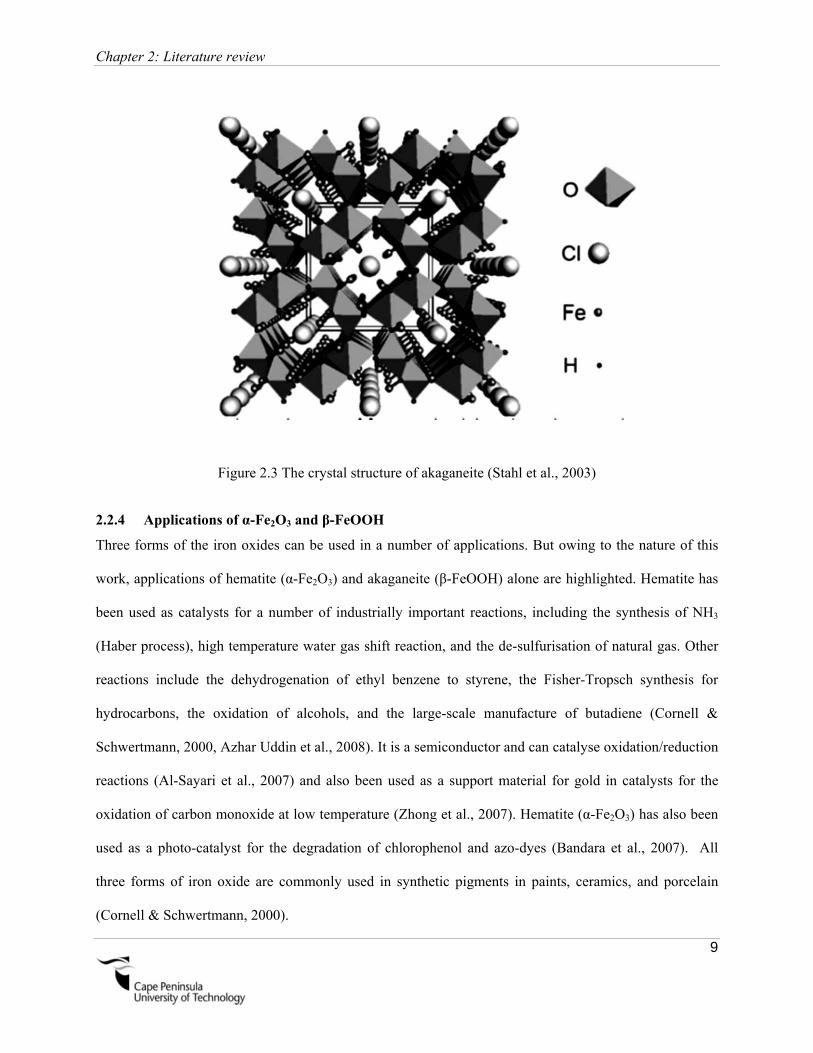
The crystal structure of akaganeite (Figure 2.3) was first shown by Mackay (1960) to be related to the
hollandite structure, with additional chloride anions occupying channels parallel to the crystallographic c-
axis. Chloride ion originates from the precursor, ferric chloride. β-FeOOH exhibits a monoclinic crystal
structure with space group I4/m (tetragonal symmetry), a = 10.480 Å, b = 10.480 Å and c = 3.023 Å
(Almeida, 2010). Akaganeite normally displays two morphologies: somatoidal or cigar shaped and rod-
like crystals. Somatoidal particles are frequently twinned but the rod like crystals are not (Cornell &
Schwertmann, 2000).
Chapter 2: Literature review
9
Figure 2.3 The crystal structure of akaganeite (Stahl et al., 2003)
2.2.4 Applications of α-Fe2O3 and β-FeOOH
Three forms of the iron oxides can be used in a number of applications. But owing to the nature of this
work, applications of hematite (α-Fe2O3) and akaganeite (β-FeOOH) alone are highlighted. Hematite has
been used as catalysts for a number of industrially important reactions, including the synthesis of NH3
(Haber process), high temperature water gas shift reaction, and the de-sulfurisation of natural gas. Other
reactions include the dehydrogenation of ethyl benzene to styrene, the Fisher-Tropsch synthesis for
hydrocarbons, the oxidation of alcohols, and the large-scale manufacture of butadiene (Cornell &
Schwertmann, 2000, Azhar Uddin et al., 2008). It is a semiconductor and can catalyse oxidation/reduction
reactions (Al-Sayari et al., 2007) and also been used as a support material for gold in catalysts for the
oxidation of carbon monoxide at low temperature (Zhong et al., 2007). Hematite (α-Fe2O3) has also been
used as a photo-catalyst for the degradation of chlorophenol and azo-dyes (Bandara et al., 2007). All
three forms of iron oxide are commonly used in synthetic pigments in paints, ceramics, and porcelain
(Cornell & Schwertmann, 2000).
Chapter 2: Literature review
10
The α-, β-, γ-type, iron oxyhydroxides have distinctive properties and these materials have been widely
used as electrode materials and precursors in lithium batteries (Flynn, 1984; Kanno et al., 1996; Amine et
al., 1999). Akaganeite (β-FeOOH) possesses a large, tunnel-type structure where iron atoms are strongly
bonded to the framework (Amine at al., 1999), and lithium can be intercalated and extracted freely in the
tunnels (2 X 2) during discharge and charge processes. Akaganeite exhibits good electrochemical
performance with a high theoretical discharge capacity of 283 mAhg-1, which makes it a promising
electrode material. It is also a semiconductor with a band gap of 2.12 eV (White, 1990), and can be used
in oxidation/reduction reactions, hydro-processing of coal (Cornell & Schwertmann, 2003) and in the
preparation of ferromagnetic materials such as γ-Fe2O3 (Xiong et al., 2003).
The fabrication technique plays a key role in determining the particle size and shape, size distribution,
surface chemistry and hence the applications of the iron oxide (Jiang et al., 2010). In addition, the
preparation method also determines the degree of structural defects or impurities present in the particles,
and the distribution of such defects (Tartaj et al., 2003). Hence, several synthesis routes have been
developed to obtain proper control over the physical and magnetic properties (Tartaj et al., 2003).
2.3 1-D nanostructure overview
1-D nanostructure represents a cluster of nano-materials with highly anisotropic morphologies. Nanowires
(aspect ratio > 10), nanorods (aspect ratio < 10), belts, ribbons and hollow tubes are typical examples of
1-D nanostructure. One-dimensional nanostructures are considered ideal model systems for investigating
the dependence of optical, electrical, magnetic and mechanical properties on size and morphology
(Almeida, 2010).
2.3.1 Particle formation mechanisms and applications of 1-D nanostructures
Understanding the growth mechanism of nanostructures is of critical importance in optimizing their size,
morphology and dispersity. In recent years, a variety of chemical methods has been identified for
generating 1-D nanostructures, offering different levels of control over their dimensional parameters. A
summary of the 1-D nanostructures synthesised using a variety of techniques is presented in Table 2.2.

Chapter 2: Literature review
11
Table 2.2 One-dimensional nanostructures overview (Almeida, 2010)
Material Fabrication
technique
Shape Length Diameter Growth Mechanism
MOS2 Redox reactions in
aqueous solution
NR 50-150
(nm)
20-40
(nm)
Growth via template
CNT Fluid bed CVD Multi-
walled
carbon
tube
0.02-60
(μm)
3-11 (nm) Surface diffusion and precipitation
on a catalyst
LnVO4 Hydrothermal
synthesis
NR 50-200
(nm)
10-50
(nm)
Ostwald ripening
BN Boron oxide CVD NT 10 (μm) 50 (nm) Catalytic growth parallel to 1010
plane
Eu2O3 Precipitation NR 200 (nm) 10-30
(nm)
Crystalline nucleation anisotropic
growth in 001 direction followed
by calcination
CdS Wet chemical
method
NR < 64 (nm) < 25 (nm) Oriented attachment
ZnO Wet chemical
method
NR array 1-5 (μm) 20-200
(nm)
Nucleation and anisotropic growth
TiO2 Sol-gel processing NW array 10 (μm) 180 (nm) Nucleation
Si Laser ablation NW >100 (μm) 3-43 (nm) Laser ablated material from the
Fe/Si target collides with inert gas
molecules and condenses in the gas
phase, resulting in Fe-Si
nanodroplets, which act as seeds
for vapour-liquid-solid Si NW
growth
FePt Solvothermal
synthesis
NW 5 (μm) 30-50
(nm)
Coarsening (Ostwald ripening)
W18O49 Solvothermal
synthesis
NW 5 (μm) Bundles of
2-5 (nm)
Alignment of ultra-thin NWs that
grow anistropically in the <010>
direction
PbCrO4 Facile aqueous
solution
NR < 2.5 (μm) > 150
(nm)
PbCrO4 NPs nucleate and grow up
to 50 nm agglomerate and
crystalline into NRs
CdS Sonochemical
synthesis
NR/NW 1.3 (μm) 80 (nm) Ultrasound expels S2- and Cd2+ and
strong pentadentate ligand
complexing action mediates CdS
NR formation along the [001]
Chapter 2: Literature review
12
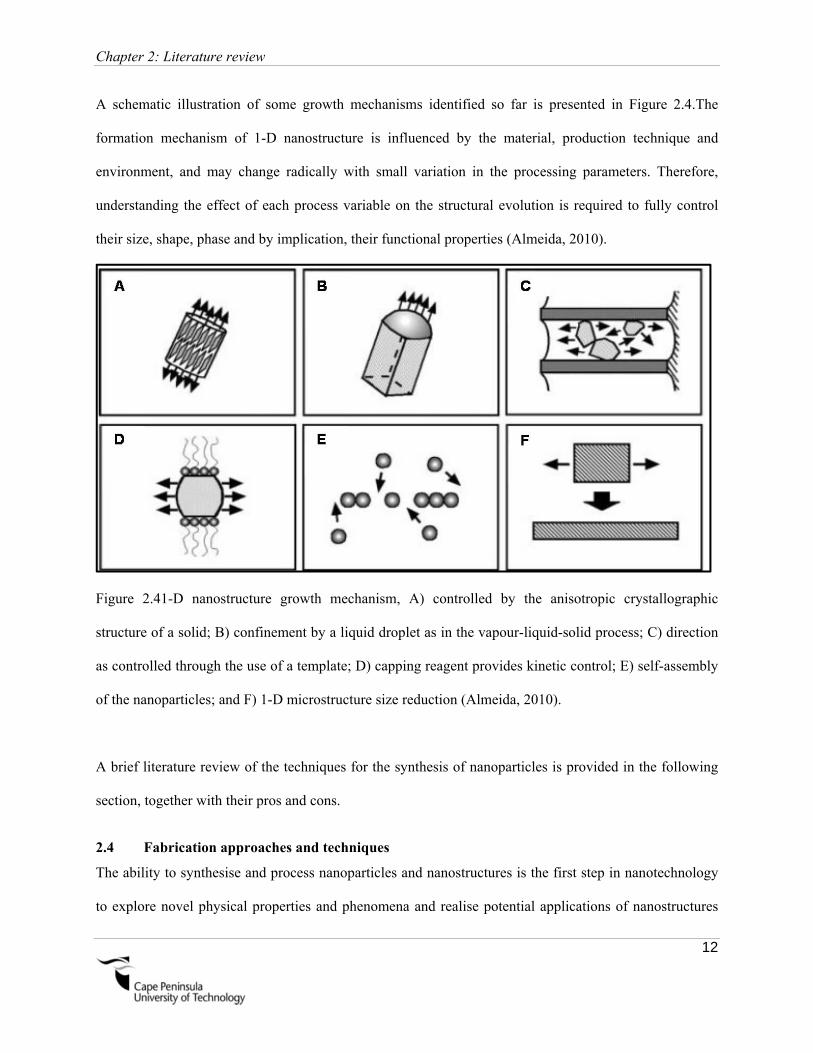
A schematic illustration of some growth mechanisms identified so far is presented in Figure 2.4.The
formation mechanism of 1-D nanostructure is influenced by the material, production technique and
environment, and may change radically with small variation in the processing parameters. Therefore,
understanding the effect of each process variable on the structural evolution is required to fully control
their size, shape, phase and by implication, their functional properties (Almeida, 2010).
Figure 2.41-D nanostructure growth mechanism, A) controlled by the anisotropic crystallographic
structure of a solid; B) confinement by a liquid droplet as in the vapour-liquid-solid process; C) direction
as controlled through the use of a template; D) capping reagent provides kinetic control; E) self-assembly
of the nanoparticles; and F) 1-D microstructure size reduction (Almeida, 2010).
A brief literature review of the techniques for the synthesis of nanoparticles is provided in the following
section, together with their pros and cons.
2.4 Fabrication approaches and techniques
The ability to synthesise and process nanoparticles and nanostructures is the first step in nanotechnology
to explore novel physical properties and phenomena and realise potential applications of nanostructures
Chapter 2: Literature review
13
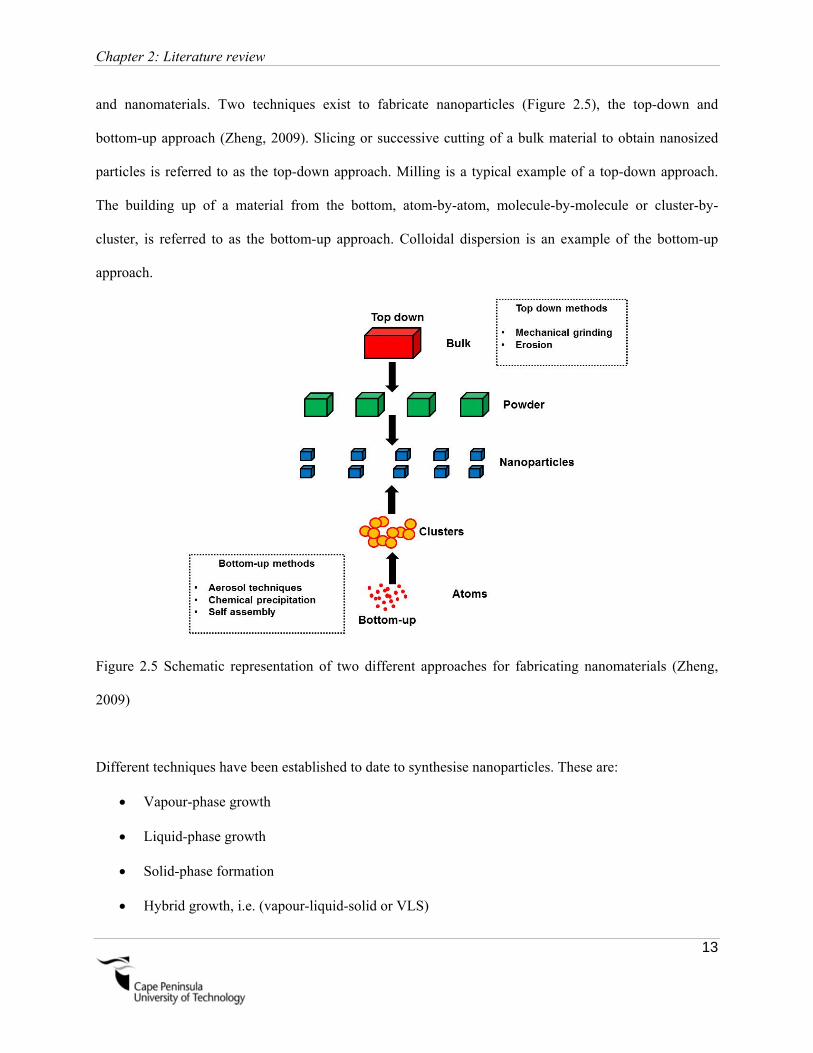
and nanomaterials. Two techniques exist to fabricate nanoparticles (Figure 2.5), the top-down and
bottom-up approach (Zheng, 2009). Slicing or successive cutting of a bulk material to obtain nanosized
particles is referred to as the top-down approach. Milling is a typical example of a top-down approach.
The building up of a material from the bottom, atom-by-atom, molecule-by-molecule or cluster-by-
cluster, is referred to as the bottom-up approach. Colloidal dispersion is an example of the bottom-up
approach.
Figure 2.5 Schematic representation of two different approaches for fabricating nanomaterials (Zheng,
2009)
Different techniques have been established to date to synthesise nanoparticles. These are:
Vapour-phase growth
Liquid-phase growth
Solid-phase formation
Hybrid growth, i.e. (vapour-liquid-solid or VLS)

Chapter 2: Literature review
14
2.4.1 Hydrothermal / solvo-thermal synthesis
The concept “hydrothermal” is primarily a geological term, relating to the natural processes resulting
from the joint action of heat and water under pressure (Mambote et al., 2000). Hydrothermal synthesis
(HS) of inorganic materials has been carried out since the end of the 19th century (Byrappa & Yoshimura,
2001), and is defined as the precipitation of these materials from aqueous solutions at temperatures above
boiling point and at pressures greater than ambient pressure (Dawson & Han, 1993). Hydrothermal
synthesis technique is generally operated at around a temperature range of 100°C— 200°C (Arai et al.,
2002).Figure 2.6 presents a pressure/temperature map of hydrothermal synthesis in relation to other
material processing techniques.
Figure 2.6 A pressure/temperature map for different material processing techniques (Yoshimura et al.,
2000)
Chapter 2: Literature review
15
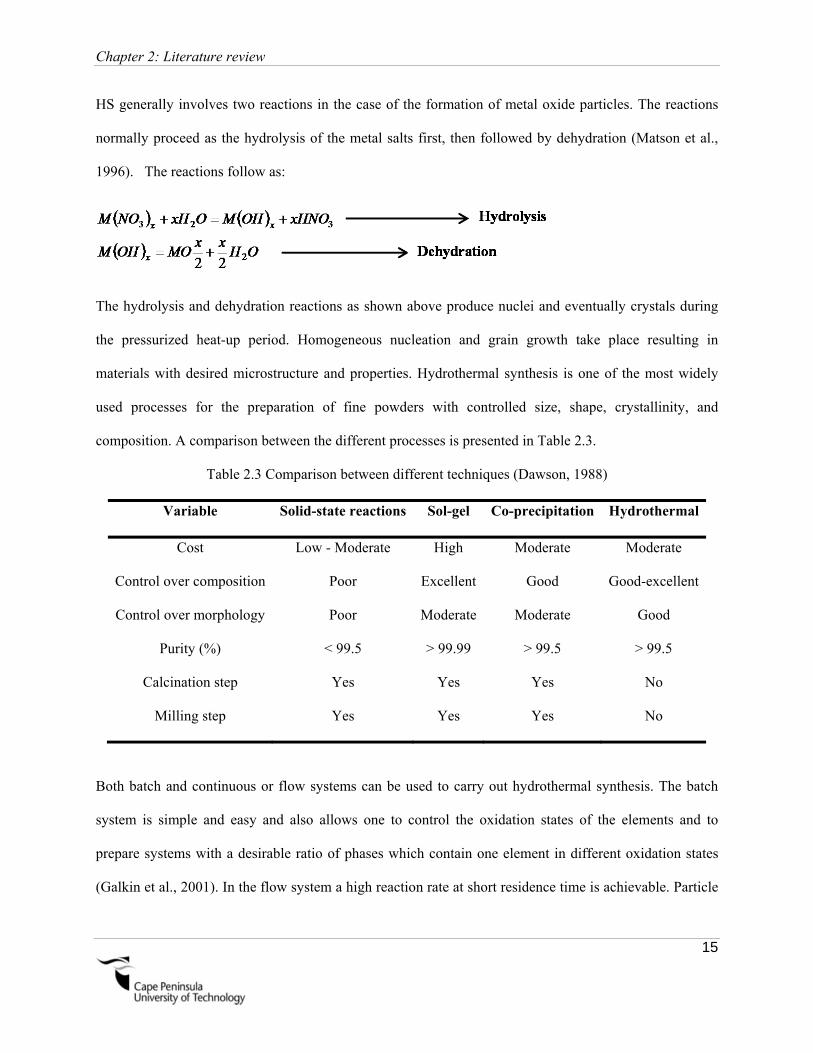
HS generally involves two reactions in the case of the formation of metal oxide particles. The reactions
normally proceed as the hydrolysis of the metal salts first, then followed by dehydration (Matson et al.,
1996). The reactions follow as:
The hydrolysis and dehydration reactions as shown above produce nuclei and eventually crystals during
the pressurized heat-up period. Homogeneous nucleation and grain growth take place resulting in
materials with desired microstructure and properties. Hydrothermal synthesis is one of the most widely
used processes for the preparation of fine powders with controlled size, shape, crystallinity, and
composition. A comparison between the different processes is presented in Table 2.3.
Table 2.3 Comparison between different techniques (Dawson, 1988)
Variable Solid-state reactions Sol-gel Co-precipitation Hydrothermal
Cost Low - Moderate High Moderate Moderate
Control over composition Poor Excellent Good Good-excellent
Control over morphology Poor Moderate Moderate Good
Purity (%) < 99.5 > 99.99 > 99.5 > 99.5
Calcination step Yes Yes Yes No
Milling step Yes Yes Yes No
Both batch and continuous or flow systems can be used to carry out hydrothermal synthesis. The batch
system is simple and easy and also allows one to control the oxidation states of the elements and to
prepare systems with a desirable ratio of phases which contain one element in different oxidation states
(Galkin et al., 2001). In the flow system a high reaction rate at short residence time is achievable. Particle
Chapter 2: Literature review
16
size, shape and size distribution can be controlled to some extent by independently varying the different
process parameters (Xu, 2006).
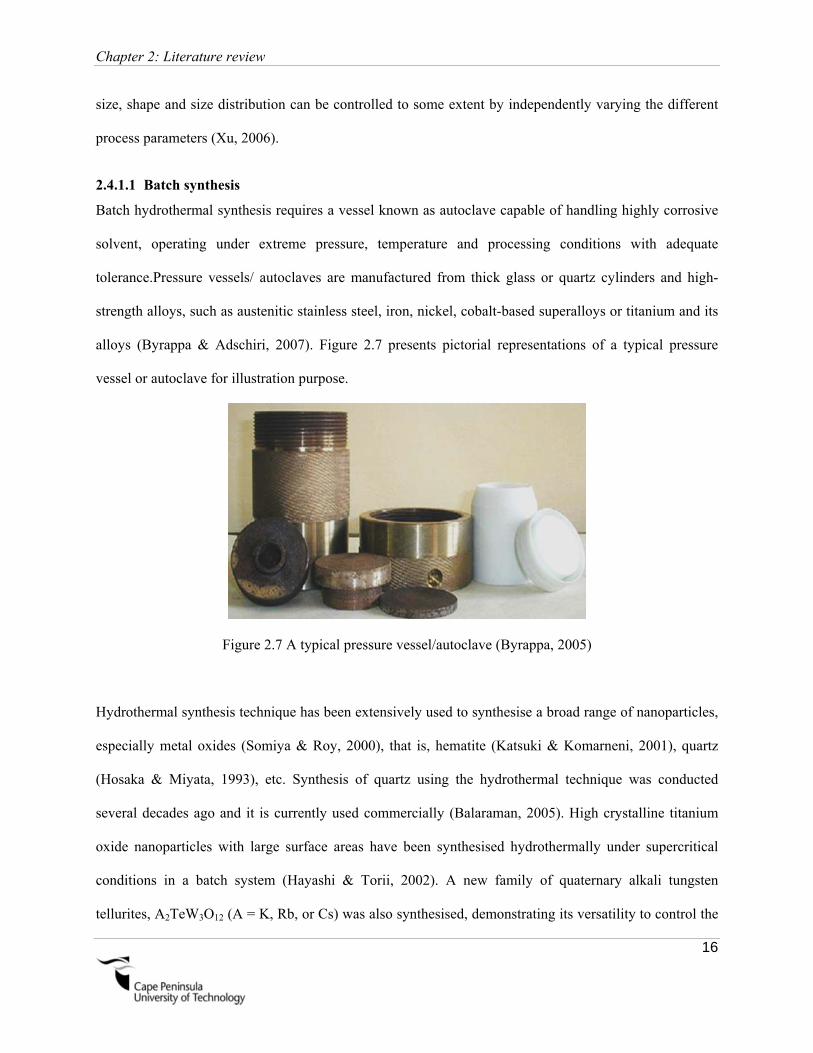
2.4.1.1 Batch synthesis
Batch hydrothermal synthesis requires a vessel known as autoclave capable of handling highly corrosive
solvent, operating under extreme pressure, temperature and processing conditions with adequate
tolerance.Pressure vessels/ autoclaves are manufactured from thick glass or quartz cylinders and high-
strength alloys, such as austenitic stainless steel, iron, nickel, cobalt-based superalloys or titanium and its
alloys (Byrappa & Adschiri, 2007). Figure 2.7 presents pictorial representations of a typical pressure
vessel or autoclave for illustration purpose.
Figure 2.7 A typical pressure vessel/autoclave (Byrappa, 2005)
Hydrothermal synthesis technique has been extensively used to synthesise a broad range of nanoparticles,
especially metal oxides (Somiya & Roy, 2000), that is, hematite (Katsuki & Komarneni, 2001), quartz
(Hosaka & Miyata, 1993), etc. Synthesis of quartz using the hydrothermal technique was conducted
several decades ago and it is currently used commercially (Balaraman, 2005). High crystalline titanium
oxide nanoparticles with large surface areas have been synthesised hydrothermally under supercritical
conditions in a batch system (Hayashi & Torii, 2002). A new family of quaternary alkali tungsten
tellurites, A2TeW3O12 (A = K, Rb, or Cs) was also synthesised, demonstrating its versatility to control the

Chapter 2: Literature review
17
composition of targeted materials (Goodey et al., 2003). More recently, the use of the supercritical water
approach in a batch reactor has been demonstrated for phosphate materials (Lee & Teja, 2006). Highly
crystalline micro or nanoparticles of LiFePO4 were obtained and higher electrochemical performance was
reported compared with that synthesised at low temperatures, less than 200 °C (Yang et al., 2001).
However, fundamental understanding of the kinetics during hydrothermal crystallisation is very limited.
This is due to lack of data relating to the formation of intermediate phases and the inaccessibility of direct
in situ investigative tools under conditions of high pressure and temperature (Almeida, 2010).
2.4.1.2 Continuous synthesis
In recent years, continuous hydrothermal synthesis (CHS) using near critical or supercritical water has
attracted attention compared to the batch process (Adschiri et al., 1992; Hakuta et al., 1998). This
technique has exhibited promise in the production of nano and submicron-sized fine particles (mainly
metal oxides and oxyhydroxide), owing to the high reaction rates at short residence time and the ability to
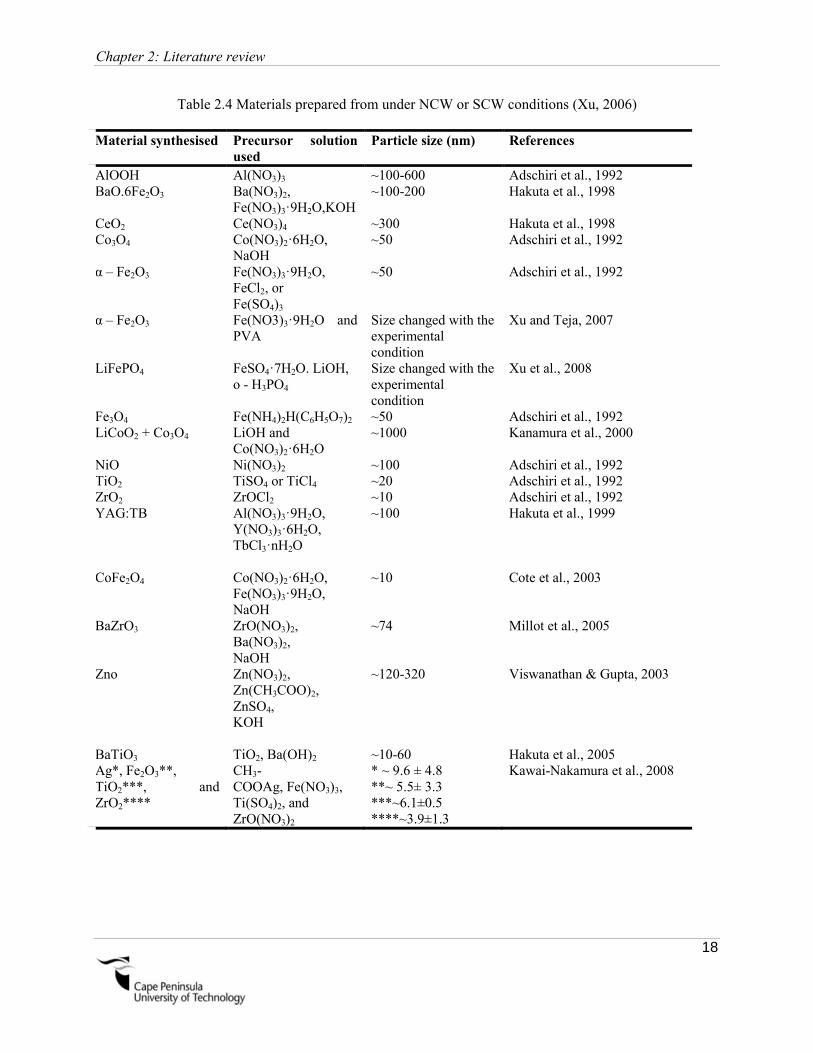
control particle characteristics to some extent. Various materials have been prepared using continuous
process under NCW or SCW conditions. A summary is given in Table 2.4.
In a continuous process, pressurized water is preheated to near- critical or supercritical temperature and is
then contacted with a metal salt solution pre-mixed if necessary with a hydroxide solution. Figure 2.8
presents a typical CHS setup. Due to high temperature and pressure use, the process control in the
continuous hydrothermal synthesis becomes difficult in terms of mass production due to problems such as
corrosion and blockage.
Chapter 2: Literature review
18
Table 2.4 Materials prepared from under NCW or SCW conditions (Xu, 2006)
Material synthesised Precursor solution used
Particle size (nm) References
AlOOH Al(NO3)3 ~100-600 Adschiri et al., 1992 BaO.6Fe2O3 Ba(NO3)2,
Fe(NO3)3·9H2O,KOH ~100-200 Hakuta et al., 1998
CeO2 Ce(NO3)4 ~300 Hakuta et al., 1998 Co3O4 Co(NO3)2·6H2O,
NaOH ~50 Adschiri et al., 1992
α – Fe2O3 Fe(NO3)3·9H2O, FeCl2, or Fe(SO4)3
~50 Adschiri et al., 1992
α – Fe2O3 Fe(NO3)3·9H2O and PVA
Size changed with the experimental condition
Xu and Teja, 2007
LiFePO4 FeSO4·7H2O. LiOH, o - H3PO4
Size changed with the experimental condition
Xu et al., 2008
Fe3O4 Fe(NH4)2H(C6H5O7)2 ~50 Adschiri et al., 1992 LiCoO2 + Co3O4 LiOH and
Co(NO3)2·6H2O ~1000 Kanamura et al., 2000
NiO Ni(NO3)2 ~100 Adschiri et al., 1992 TiO2 TiSO4 or TiCl4 ~20 Adschiri et al., 1992 ZrO2 ZrOCl2 ~10 Adschiri et al., 1992 YAG:TB Al(NO3)3·9H2O,
Y(NO3)3·6H2O, TbCl3·nH2O
~100 Hakuta et al., 1999
CoFe2O4 Co(NO3)2·6H2O, Fe(NO3)3·9H2O, NaOH
~10 Cote et al., 2003
BaZrO3 ZrO(NO3)2, Ba(NO3)2, NaOH
~74 Millot et al., 2005
Zno Zn(NO3)2, Zn(CH3COO)2, ZnSO4, KOH
~120-320
Viswanathan & Gupta, 2003
BaTiO3 TiO2, Ba(OH)2 ~10-60 Hakuta et al., 2005 Ag*, Fe2O3**, TiO2***, and ZrO2****
CH3- COOAg, Fe(NO3)3, Ti(SO4)2, and ZrO(NO3)2
* ~ 9.6 ± 4.8 **~ 5.5± 3.3 ***~6.1±0.5 ****~3.9±1.3
Kawai-Nakamura et al., 2008

Chapter 2: Literature review
19
Water pump
Water heater 1Water heater 2
Precursor pump
T1
T2
T3
P1
Heating tapeMixing point
Precursor solution
Crystallizer
Cooler
Back pressure regulator
Collection vessel
Water
Filter
Figure 2.8 Continuous system to synthesise iron oxide nanoparticles (Xu & Teja, (2007)
The process control for the CHP technique is also very difficult, because of the high temperature and
pressure. To realise the actual production of nanoparticles using the flow reaction system, there are still
some problems in terms of engineering issues, namely, corrosion, blockage, and mass production.
2.5 Effect of nanoparticle size on physical properties
Nanoparticles act as an effective bridge between bulk materials and atomic or molecular structures.
Constant physical properties are exhibited by bulk materials irrespective of their size and mass. NPs
possess unique size-dependent properties due to the significant proportion of atoms existing on their
surface in relation to the bulk, resulting in a large specific surface area (Almeida, 2010). The electronic,
optical and magnetic properties of materials are found to change as their size decreases towards the nano-
scale. The total free energy of a nanoparticle, GNanoparticle, is the sum of the free energy of the bulk, GBulk,
and the surface, GSurface, of the nanoparticles. This can be expressed as (Zhang & Banfield, 1999):
BulkSurfaceleNanopartic GGG Equation 2. 1

Chapter 2: Literature review
20
In the case of a nanoparticle, the surface-free energy becomes a large factor of the total free energy and an
important element of its overall phase stability (Zhang & Banfield, 1998). The electronic properties of
nanoparticles are size dependent. The electronic band gap, Eg, of a spherical semiconductor nanoparticle
can be shown as:
εR
1.8e
μ
1
2R
hπE
2
2
22
g , Equation 2. 2
where, h, is Planck’s constant, R, the particle radius, μ, the reduced mass of the electron-hole pair, e, the
electric charge and ε, is the dielectric constant of the semiconductor. The optical properties of
nanoparticles also vary greatly as a function of size. If a small spherical metallic nanoparticle is irradiated
by light, the accompanying incident electric field causes the conduction electrons to oscillate coherently
(Kelly et al., 2003). This electron oscillation is called the dipole plasmon resonance. Magnetic properties
of nanoparticles are also size dependent. The magnetisation of a single-domain nanoparticle lies along an
easy direction which is determined by the shape and the magnetocrystalline anisotropy of the
nanoparticles. Before an external field is applied, the magnetisation of a single-domain nanorod lies along
the easy direction which is presented in Figure 2.9 (a). After an external field is applied in the opposite
direction, the nanorod is unable to respond by domain wall motion and instead the magnetisation must
rotate through the hard direction (Figure 2.9b), to the new easy direction (Figure 2.9c). The anisotropy
forces which hold the magnetisation in an easy direction in NRs are stronger than isotropic NPs, and thus
the coercivity is large (Spaldin, 2003). For this reason, 1-D nanostructures are desirable for magnetic
storage media applications.

Chapter 2: Literature review
21
Figure 2.9 Single domain nanorods magnetisation rotations (Almeida, 2010)
2.6 Prediction of nanoparticle sizes under different experimental conditions
A mathematical relationship that describes the dependence of particle size on the processing conditions is
important in production of uniform nanoparticles with specific sizes. However, there is a lack of a
quantitative mathematical relationship between particle size and processing conditions.
Correlation to predict particle sizes under different experimental conditions was derived by Beach (2009)
to predict spherical SnO2 particle size under different temperatures. The correlation is presented below:
2.1455 T5.805X102.646φ , Equation 2. 3
where, φ , is average particle diameter and, T , temperature.
Further work was done by Chiu et al. (2012). Their developed correlation predicts particle sizes of
spherical hematite at different temperatures and reaction times. The correlation is presented below:
0.33p t26.40.49Td Equation 2. 4
where, pd , is particle diameter, T , temperature, and t ,the time.
2.7 Surfactants
A surfactant is a surface-active compound used in practical applications (Scamehorn, 1986). Surfactants
are usually organic compounds that are amphiphilic, meaning they contain both hydrophobic and
hydrophilic groups. Surfactants are employed in a variety of technologies including detergent,
Chapter 2: Literature review
22
emulsification, dispersion, coating, wetting, flotation, petroleum recovery, lubrication, and adhesion
(Rosen, 1989). Surfactants are also used to control the morphology, size and shape of the nanoparticles
grown from chemical solution (Almeida, 2010).
2.7.1 Previous work reported on the effect of surfactants and alcohols on the iron oxide
nanoparticle
Surfactant-assisted hydrothermal synthesis can be found in the literature. Liu et al. (2006) synthesised α-
Fe2O3 nanorods and nanotubes in the presence of surfactant L113B and SPAN 80 in BuOH. They
concluded that the surfactant plays an important role in determining the shape of the nanoparticle as only
nanotubes were formed without the surfactants. Baruwati et al. (2006) produced various morphologies
(tubes, rods and needles) of -Fe2O3, utilising various hydrolysing agents in the presence of NaOH and
CTAB. This was a two-stage process, hydroxylation followed by calcination of the as-prepared -
FeOOH. Only nanoparticles were obtained in the absence of NaOH, indicating that it is not only the effect
of the surfactant that is important in the formation of nanorods. Fester et al. (2008) synthesised hematite
nanorods in the presence of different alcohols and surfactant SPAN 80. They concluded that the surfactant
plays no role in the formation of the nanorods. It was reported that the length of the nanorods increases
with the increase in carbon chain in the alcohol solvent. Hematite nanoplates were synthesised by Chen et
al. (2010). The authors used different alcohols as solvents. They concluded that the nanoplate diameter
and thickness could be controlled by choosing alcoholsselectively. Rod, arrayed nanorods, bundled fibre
and hexagram-like structures of β–FeOOH were obtained by Shao et al. (2005). The authors used a
surfactant-free condition but ethanol was used as a solvent. Different shapes were obtained by varying the
ethanol-water ratio. Aggregates of α–FeOOH and rod-like β–FeOOH particles were synthesised by Bashir
et al. (2009). The authors used polyoxyethylene oxide as a surfactant and butan-2-ol (five times the
amount of surfactant) to synthesise the particles. Precipitation of α- and β-FeOOH iron oxides in alcohol-
surfactant medium was observed to be faster when compared with the precipitation in a free aqueous
medium, though the reason for these phenomena is not clear. Liang et al. (2010) used isopropanol (IPA)
Chapter 2: Literature review
23
as a solvent to synthesise crystalline Fe3O4 nanoparticles in a CHS process. The IPA provided reducing
atmosphere due to the conversion of IPA into acetone. It was suggested that the acetone molecules
adsorbed on the Fe3O4 surfaces suppressed crystallite growth. In another work, Guo and Xiao (2006)
reported that the addition of alcohol in the hydrothermal reaction largely affected the crystallisation
process. The crystallite size and crystallinity of the particles decreased with increasing isopropanol (IPA)
addition.
The above discussion clearly highlights the application of various alcohols in the synthesis of different
iron oxide nanoparticles. No systematic study has been reported in the literature to the best of my
knowledge despite the number of work has been carried out.
2.8 An overview on the effect of processing conditions on β-FeOOH particle characteristics
reported in literature in the absence of alcohol
A brief review of literature, on the effect of processing conditions on β-FeOOH particle characteristics in
the absence of alcohol is presented in this section.
2.8.1 Effect of temperature on the β-FeOOH particle characteristics
Cornell and Schwertmann (2000) synthesised β-FeOOH particles using a 0.1M FeCl3 solution. The pH of
the solution was kept at 1.7. A synthesis temperature of 40—90˚C was used to synthesise these particles.
The authors reported that well crystalline somatoidal particles were formed in the temperature range of
40—70˚C. The particles were elongated in the c-direction and had a surface area of 30 m2/g. Poorly
crystalline particles were formed at higher temperature (90˚C). Hematite formed competitively with
akaganeite at reaction temperatures above 90˚C.
2.8.2 Effect of FeCl3 concentrations on the β-FeOOH particle characteristics
Yue et al. (2011) studied the effect of FeCl3 concentrations on the physiognomies of β-FeOOH nanorods.
A FeCl3 concentration range of 0.05—0.75M was used. They reported that FeCl3 concentrations affect the
nucleation and growth of particles. However, at the same time, an increase in FeCl3 concentration will

Chapter 2: Literature review
24
decrease the pH, leading to a slow hydrolysis process. However phase and morphology changes were not
reported with change in FeCl3 concentrations.
2.9 General synthesis theory
Nanocrystal formation is a two-stage process, firstly nucleation of an initial seed followed by subsequent
growth (Yadong & Alivisatos, 2005). Transformation from solution to solid occurs when the free energy
of the initial solution phase is greater than the sum of the free energies of the crystalline phase plus the
final solution phase (Gibbs, 1876).
2.9.1 Nucleation
Nucleation is one of the two major mechanisms of the first order phase transition, the process of
generating a new phase from an old phase whose free energy has become higher than that of the emerging
new phase (Hohenberg & Halperin, 1977). Nucleation occurs via the formation of small embryos of the
new phase inside the large volume of the old phase. The statement that the free energy per molecule of the
new phase is less than that of the solvated phase only applies to the bulk of the new phase (De Yoreo &
Vekilov, 2003). The difference between the free energy per molecule of the bulk and that of the surface is
referred to as the interfacial free energy. The interfacial free energy is always a positive term and acts to
destabilise the nucleus. As a consequence, at very small size when many of the molecules reside at the
surface, the nucleus is unstable. The addition of more molecules just increases the free energy of the
system. On average, such a nucleus will dissolve rather than grow. But once the nucleus gets large
enough, the drop in free energy associated with formation of the bulk phase becomes sufficiently high
that the surface-free energy is unimportant, and every addition of a molecule to the lattice lowers the free
energy of the system. There is an intermediate size at which the free energy of the system is decreased,
whether the nucleus grows or dissolves, and this is known as the critical size. A number of implications
are associated with the existence of a critical size. Nucleation of the new phase is the result of fluctuations
that bring together sufficient numbers of molecules to exceed the critical size; the probability of
nucleation will be strongly affected by the value of the critical size. This implies that nucleation can be

Chapter 2: Literature review
25
controlled, to some extent, by modulating the critical size, which is in turn a function of the interfacial
energy. The smaller the interfacial energy, the smaller the critical size and the more likely nucleation
becomes for any given supersaturation. As a consequence, by varying either the solution composition or
the supersaturation, the probability of nucleation can be manipulated (De Yoreo & Vekilov, 2003).
2.9.2 Growth mechanisms
Understanding of the dynamics that affect crystal growth kinetics and the microstructure development in
nanocrystals is fundamental to tailor new types of nanostructures and control material properties (Zhang
et al., 2009). Two types of growth mechanisms have been reported, 1) the classical Ostwald ripening, OR
kinetics, and 2) Oriented attachment, OA kinetics.
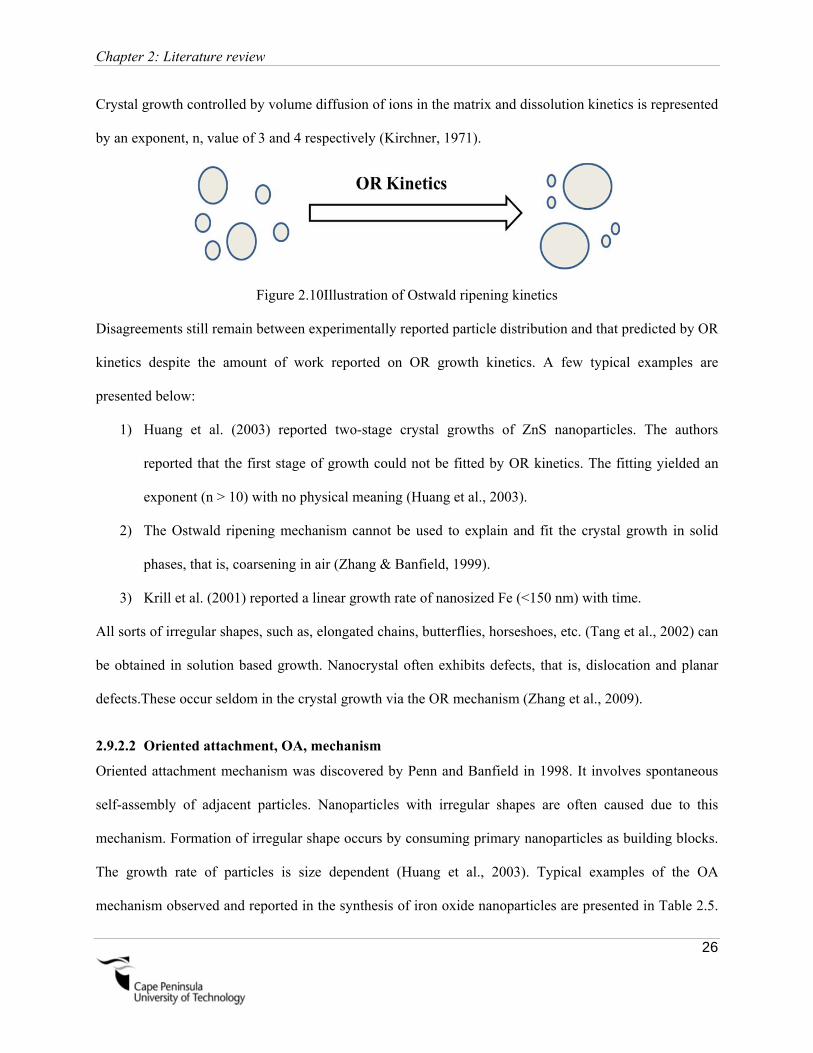
2.9.2.1 Classical growth kinetics, OR kinetics
OR kinetics involves the growth of larger particles at the expense of smaller ones. The driving force for
this process is the decrease in total surface free energy (Zhang et al., 2010). According to the Gibbs–
Thomson equation (Campbell et al., 2002), the equilibrium solute concentration at the surface of larger
particles is lower than that of smaller ones and the resultant concentration gradients lead to solute ions
flowing from small particles to larger ones. The coarsening mechanism is often controlled by the
diffusion, particle growth via addition of ions to the particle surface from solution (Zhang et al., 2010).
An illustration of the OR kinetic is presented in Figure 2.10. The classical kinetic model for the OR
mechanism is known as the LSW (Lifshitz-Slyozov-Wagner) model which is based on the Gibbs–
Thomson equation (Kirchner, 1971). The general kinetic equation for these cases can be written as:
n
1
o k(t)DD , Equation 2. 5
where, D, is the particle diameter, Do, the initial diameter, K, material constant which is temperature
dependent, t, time and, n, exponent which is relevant to coarsening mechanisms. An ‘n’ value of 2
dictatesa crystal growth that is controlled by the diffusion of ions along the matrix-particle boundary.
Chapter 2: Literature review
26
Crystal growth controlled by volume diffusion of ions in the matrix and dissolution kinetics is represented
by an exponent, n, value of 3 and 4 respectively (Kirchner, 1971).
Figure 2.10Illustration of Ostwald ripening kinetics
Disagreements still remain between experimentally reported particle distribution and that predicted by OR
kinetics despite the amount of work reported on OR growth kinetics. A few typical examples are
presented below:
1) Huang et al. (2003) reported two-stage crystal growths of ZnS nanoparticles. The authors
reported that the first stage of growth could not be fitted by OR kinetics. The fitting yielded an
exponent (n > 10) with no physical meaning (Huang et al., 2003).
2) The Ostwald ripening mechanism cannot be used to explain and fit the crystal growth in solid
phases, that is, coarsening in air (Zhang & Banfield, 1999).
3) Krill et al. (2001) reported a linear growth rate of nanosized Fe (<150 nm) with time.
All sorts of irregular shapes, such as, elongated chains, butterflies, horseshoes, etc. (Tang et al., 2002) can
be obtained in solution based growth. Nanocrystal often exhibits defects, that is, dislocation and planar
defects.These occur seldom in the crystal growth via the OR mechanism (Zhang et al., 2009).
2.9.2.2 Oriented attachment, OA, mechanism
Oriented attachment mechanism was discovered by Penn and Banfield in 1998. It involves spontaneous
self-assembly of adjacent particles. Nanoparticles with irregular shapes are often caused due to this
mechanism. Formation of irregular shape occurs by consuming primary nanoparticles as building blocks.
The growth rate of particles is size dependent (Huang et al., 2003). Typical examples of the OA
mechanism observed and reported in the synthesis of iron oxide nanoparticles are presented in Table 2.5.
Chapter 2: Literature review
27
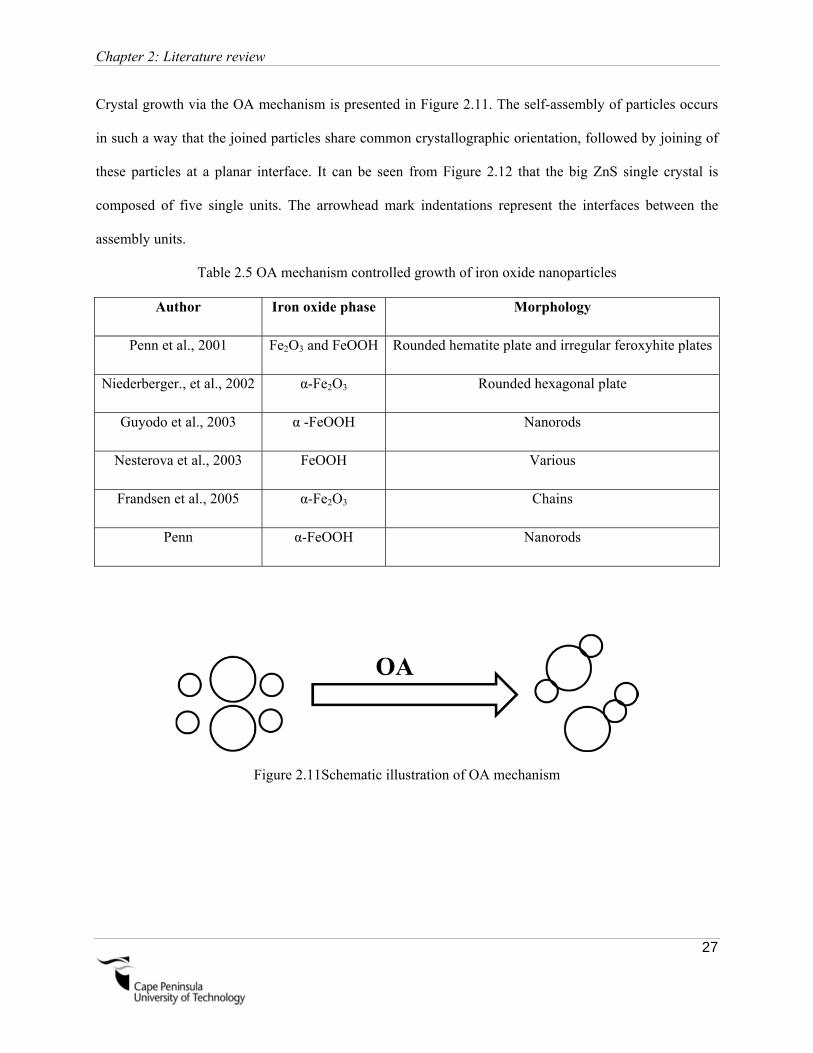
Crystal growth via the OA mechanism is presented in Figure 2.11. The self-assembly of particles occurs
in such a way that the joined particles share common crystallographic orientation, followed by joining of
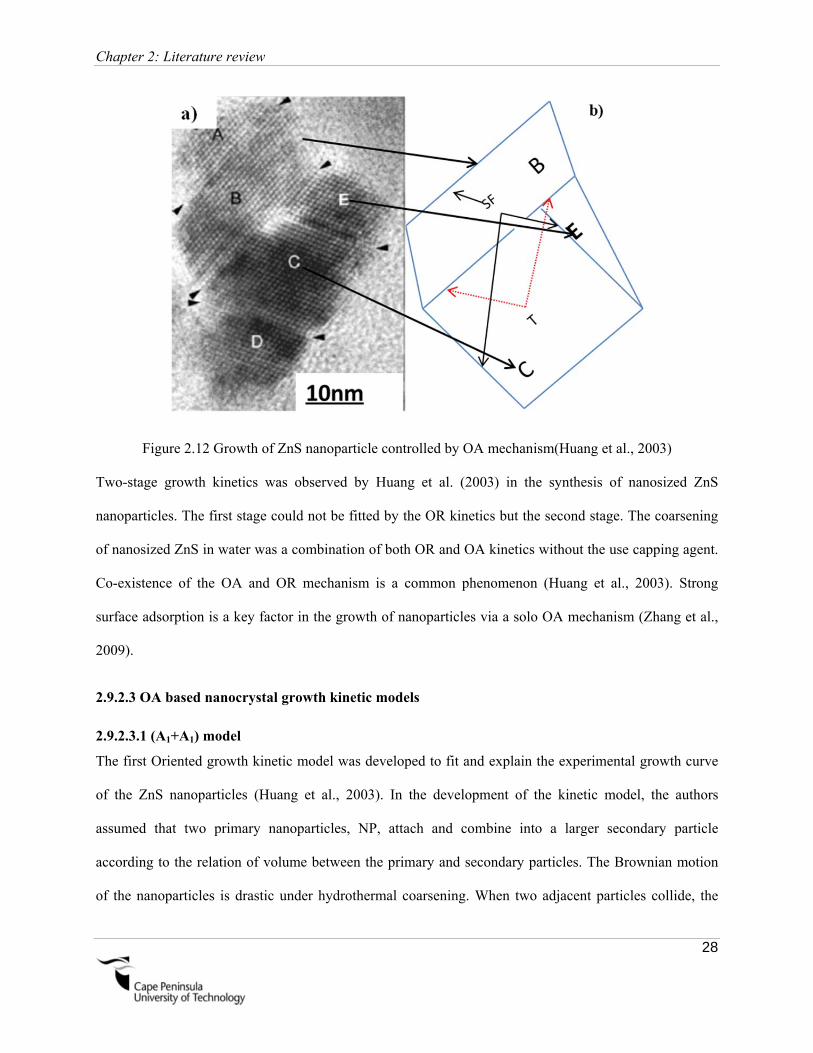
these particles at a planar interface. It can be seen from Figure 2.12 that the big ZnS single crystal is
composed of five single units. The arrowhead mark indentations represent the interfaces between the
assembly units.
Table 2.5 OA mechanism controlled growth of iron oxide nanoparticles
Author Iron oxide phase Morphology
Penn et al., 2001 Fe2O3 and FeOOH Rounded hematite plate and irregular feroxyhite plates
Niederberger., et al., 2002 α-Fe2O3 Rounded hexagonal plate
Guyodo et al., 2003 α -FeOOH Nanorods
Nesterova et al., 2003 FeOOH Various
Frandsen et al., 2005 α-Fe2O3 Chains
Penn α-FeOOH Nanorods
Figure 2.11Schematic illustration of OA mechanism
Chapter 2: Literature review
28
Figure 2.12 Growth of ZnS nanoparticle controlled by OA mechanism(Huang et al., 2003)
Two-stage growth kinetics was observed by Huang et al. (2003) in the synthesis of nanosized ZnS
nanoparticles. The first stage could not be fitted by the OR kinetics but the second stage. The coarsening
of nanosized ZnS in water was a combination of both OR and OA kinetics without the use capping agent.
Co-existence of the OA and OR mechanism is a common phenomenon (Huang et al., 2003). Strong
surface adsorption is a key factor in the growth of nanoparticles via a solo OA mechanism (Zhang et al.,
2009).
2.9.2.3 OA based nanocrystal growth kinetic models
2.9.2.3.1 (A1+A1) model
The first Oriented growth kinetic model was developed to fit and explain the experimental growth curve
of the ZnS nanoparticles (Huang et al., 2003). In the development of the kinetic model, the authors
assumed that two primary nanoparticles, NP, attach and combine into a larger secondary particle
according to the relation of volume between the primary and secondary particles. The Brownian motion
of the nanoparticles is drastic under hydrothermal coarsening. When two adjacent particles collide, the

Chapter 2: Literature review
29
coalescence may occur on the premise and the two particles might share a common crystallographic
orientation. The OA kinetic model can be described as the following reaction (Huang et al., 2003):
BAA 1K11 , Equation 2. 6
where, A1 is the two primary particles and B, the product of the coalescence of two primary nanoparticles.
K1 is a kinetic constant for the reaction between two particles. Based on that, a growth model was derived
(Huang et al., 2003):
1tk
1tk2dd
1
13
o
, Equation 2. 7
where, d, is particle diameter, do, initial particle diameter, k1, growth rate constant dependent on
temperature, and t, time.
Further studies were also initiated to attain a better understanding of the OA growth behaviour.
Nanoparticle growth via OA mechanism was discussed from the degree of the electrostatic interaction and
diffusion and coagulation of colloids (Penn, 2004 ; Riberio et al., 2005).
2.9.2.4 Two-step reaction during the OA growth
Oriented attachment-based nanocrystal growth often undergoes two reaction steps. The first is the
diffusion of the nanocrystals followed by the coalescence and desorption of surface species. The motion
of nanoparticles in a fluid is due to Brownian motion and fluid convection, which is much slower than the
diffusion of molecules.
2.9.2.4.1 Rotation of nanoparticles before coalescence
After a collision of two or more particles in solution, the particles may not have any common
crystallographic orientation. To achieve the structural accord at the interface, the primary particles would
be free to rotate into an orientation (Zhang et al., 2009). This process is directly linked to the reduction of
surface energy. It is also aimed at minimising the area of high-energy interfaces. The coarsening of
nanocrystal via OA can be also named as the grain-rotation induced grain coalescence (GRIGC)
mechanism (Figure 2.13) (Moldovan et al., 2002).
Chapter 2: Literature review
30
Figure 2.13 Particle rotation during OA mechanism (Zhang et al., 2009)
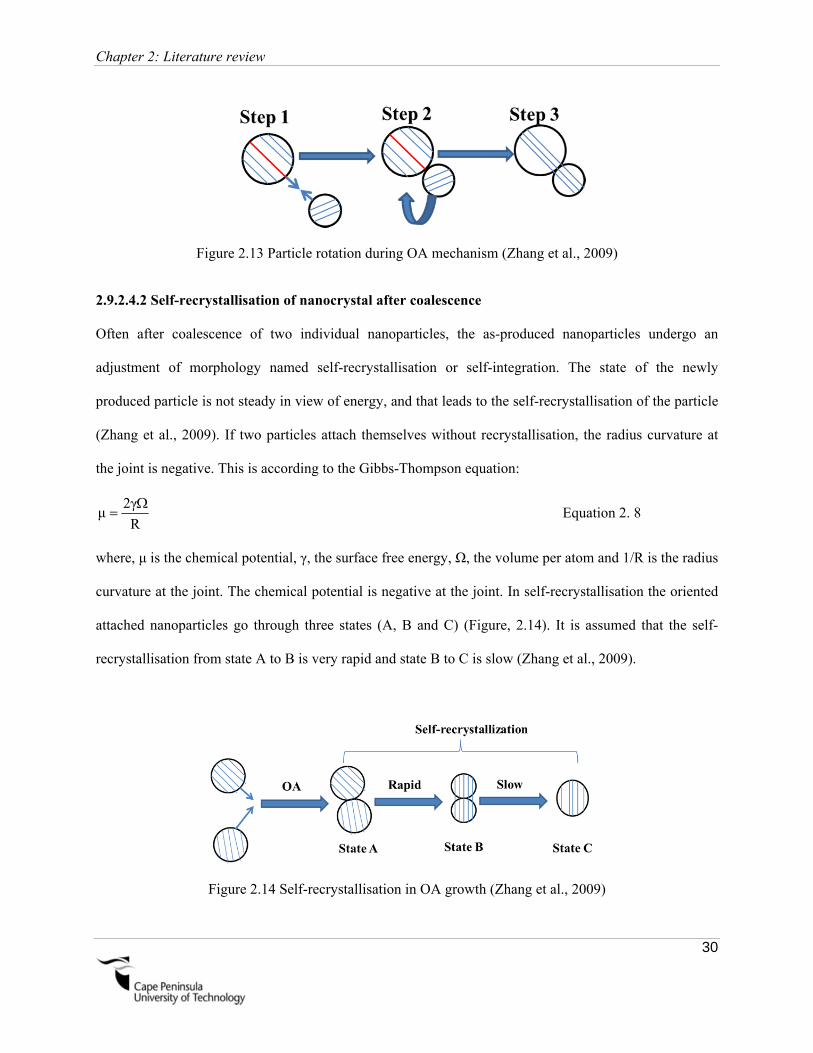
2.9.2.4.2 Self-recrystallisation of nanocrystal after coalescence
Often after coalescence of two individual nanoparticles, the as-produced nanoparticles undergo an
adjustment of morphology named self-recrystallisation or self-integration. The state of the newly
produced particle is not steady in view of energy, and that leads to the self-recrystallisation of the particle
(Zhang et al., 2009). If two particles attach themselves without recrystallisation, the radius curvature at
the joint is negative. This is according to the Gibbs-Thompson equation:
R
2γμ
Equation 2. 8
where, μ is the chemical potential, γ, the surface free energy, Ω, the volume per atom and 1/R is the radius
curvature at the joint. The chemical potential is negative at the joint. In self-recrystallisation the oriented
attached nanoparticles go through three states (A, B and C) (Figure, 2.14). It is assumed that the self-
recrystallisation from state A to B is very rapid and state B to C is slow (Zhang et al., 2009).
Figure 2.14 Self-recrystallisation in OA growth (Zhang et al., 2009)
Chapter 2: Literature review
31
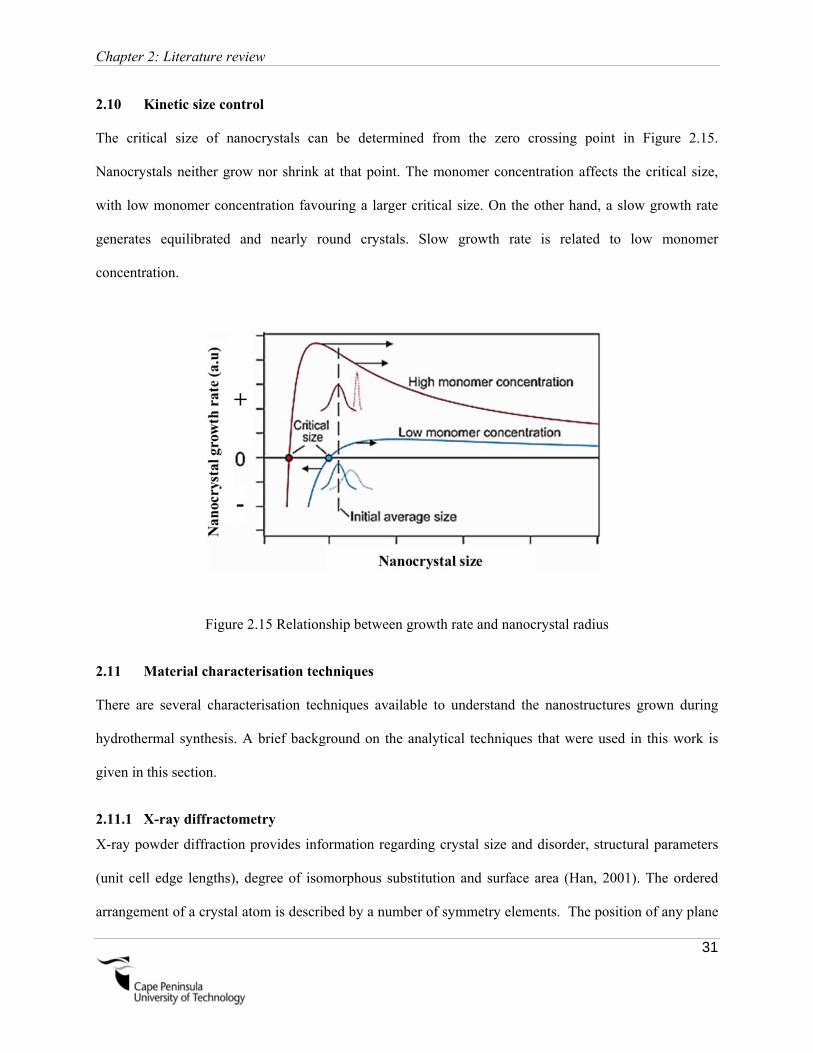
2.10 Kinetic size control
The critical size of nanocrystals can be determined from the zero crossing point in Figure 2.15.
Nanocrystals neither grow nor shrink at that point. The monomer concentration affects the critical size,
with low monomer concentration favouring a larger critical size. On the other hand, a slow growth rate
generates equilibrated and nearly round crystals. Slow growth rate is related to low monomer
concentration.
Figure 2.15 Relationship between growth rate and nanocrystal radius
2.11 Material characterisation techniques
There are several characterisation techniques available to understand the nanostructures grown during
hydrothermal synthesis. A brief background on the analytical techniques that were used in this work is
given in this section.
2.11.1 X-ray diffractometry
X-ray powder diffraction provides information regarding crystal size and disorder, structural parameters
(unit cell edge lengths), degree of isomorphous substitution and surface area (Han, 2001). The ordered
arrangement of a crystal atom is described by a number of symmetry elements. The position of any plane

Chapter 2: Literature review
32
of atoms within the crystal can be characterised by the intercepts the plane makes with the system axes.
These intercepts are usually expressed as their reciprocal value, hkl (Miller indices), and thus converted
into small integer numbers. The interaction of the electromagnetic waves with the atoms of the crystal is
observed in the X-ray diffraction (Han, 2001).When a monochromatic beam of X-rays is directed towards
a crystalline material, the incident X-ray photons interact with the electrons that surround the atoms. The
electron clouds scatter the X-rays in all directions. However, at certain angles (θ), the distance travelled
by the incident and scattered X-rays differs by a complete number (n) of wavelengths. These directions
are related to the distances between atomic planes, the d-values, and the angle (θ) at which X-rays enter
and leave a crystal. A schematic diagram is presented in Figure 2.16 to illustrate the constructive
interference of scattered waves. This relationship can be described by the Bragg equation (Graef and
Henry, 2012):
Sinθ2dnλ hkl Equation 2.9
where, λ, is the wavelength of the X-rays used, θ , the angle at which the X-rays strike the crystal and for
which the maximum interference intensity is observed, and dhkl, the distance between the set of hkl planes
in the crystal (lattice spacings).
Figure 2.16 X-ray diffraction incident beam interaction with periodically aligned atoms (Almeida, 2010)

Chapter 2: Literature review
33
2.11.2 Electron microscopy
In an electron microscope a variety of signals can be detected when a high-energy electron beam interacts
with a specimen (Figure 2.17). Many of these signals can be used for imaging. In a scanning electron
microscope (SEM), mainly the secondary electrons (SE), backscattered electrons and characteristic X-
rays (EDX) are analysed. The first two types of electrons provide visual information about the specimen.
Information regarding specimen composition can be determined using EDX, Cathodoluminescence and
Auger electron signals. Some of these signals are used in TEM (Williams, 1984).
Figure 2.17 Different signals generated during the interaction of a high-electron beam with a thin
specimen (Goodhew & Humphreys, 1988)
2.11.2.1 Transmission electron microscopy (TEM)
A beam of electrons is transmitted through an ultrathin specimen (<100 nm) in this technique. As the
beam passes through the specimen it interacts with the specimen. An image is formed from the interaction
of the electrons transmitted through the specimen. The formed image is magnified and focused onto an

Chapter 2: Literature review
34
imaging device, such as a fluorescent screen, on a layer of photographic film or detected by a sensor such
as a CCD camera (Goodhew & Humphreys, 1988). Only the transmitted beams or some of the forward
scattered beams are used in conventional TEM to form a diffraction contrast image.
High-resolution TEM (HRTEM) uses the transmitted and scattered beams to create an interference image.
Preparation of TEM specimens is specific to the material under analysis and the desired information to
obtain from the specimen.
2.11.2.2 Scanning electron microscopy (SEM)
Bulk specimens are observed using Scanning Electron Microscopy (SEM). Scanning electron microscopy
uses a fine electron probe (7~10 nm diameter) to illuminate the specimen (Williams, 1984). An image
may be formed by scanning the probe across the specimen, and detecting the low- energy secondary or
high-energy primary backscattered electrons returning from the surface (Han, 2001). All samples must be
of an appropriate size to fit in the specimen chamber and are generally mounted rigidly on a specimen
holder called a specimen stub. Several models of SEM can examine any part of a 6-inch (15cm)
semiconductor wafer, and some can tilt an object of that size to 45 degrees. For conventional imaging in
the SEM, specimens must be electrically conductive, at least at the surface, and electrically grounded to
prevent the accumulation of electrostatic charge at the surface. Nonconductive specimens tend to charge
when scanned by the electron beam, and especially in secondary electron imaging mode, which causes
scanning faults and other image artefacts. The non-conducting materials are therefore usually coated with
an ultrathin coating of electrically conducting material, such as gold, deposited on the sample either by
low vacuum sputter coating or by high vacuum evaporation (Suzuki, 2002).
2.11.3 Thermogravimetric analysis
Thermogravimetric analysis (TGA) is an analytical method that has been used to determine a material’s
thermal stability and its fraction of volatile components. This is done by measuring the weight loss of a
sample that occurs when the sample is heated. The measurement is normally carried out in air or in an
inert atmosphere. Helium or nitrogen can be used to create inert atmosphere. The weight of the sample is
Chapter 2: Literature review
35
recorded as a function of increasing temperature. Sometimes lean oxygen atmosphere is used to perform
the measurement if one wants to slow down oxidation. Differential thermal analysis or DTA is another
thermo-analytical technique. Normally TGA and DTA measurement is done simultaneously with the
same instrument. The temperature difference between sample and reference is recorded. This differential
temperature is then plotted against time or temperature, which is represented as DTA curve or
thermogram. A DTA curve provides data on the transformation that has occurred, such as glass
transitions, crystallisation, melting, decomposition or sublimation, etc. The area under a DTA peak is the
enthalpy change for the process under study (Gabbot, 2008).
2.11.4 Energy dispersive spectroscopy
A standard method for local identification of elements within a sample in an SEM or TEM is EDS
analysis. The interaction with the innermost electron shell of an atom by the high-energy electron beam
leads to the ejection of a photoelectron. Consequently, an electron from an outer orbiting shell jumps into
the core level vacancy, and emits energy in the form of an X-ray photon. The energy of the X-rays arising
from the difference in energy between the shells, is characteristic of the atomic number, and therefore can
be used to ascertain the elemental composition of a sample (Almeida, 2010). The relationship between
atomic number and energy for a given X-ray is given by Moseley’s Law (Garratt-Reed and Bell, 2003):
21 CZCE Equation 2.10
where, E represents the energy of the emission line for a given X-ray series (e.g. Kα, Kβ etc.), Z is the
atomic number and C1, C2 are constants.
2.12 Conclusion
Application and physical properties of iron oxide nanoparticles, more specifically for α-Fe2O3 and
β-FeOOH, are given in this chapter. The dependency of the physical properties of various nanostructures,
in particular one-dimensional nanostructures, on their size and morphology, has been discussed. A
comprehensive overview of literature on the effect of alcohols on the particle size, shape and morphology

Chapter 2: Literature review
36
is presented, highlighting the necessity to conduct a systematic study. Effect of processing conditions on
the particle characteristics without the presence of alcohol reported in the literature is also given. An in
depth discussion on the intricate details related to different growth mechanisms are reported. Finally a
brief background to the fundamental concepts underpinning the structural characterisation techniques of
XRD, electron microscopy and thermogravimetric analysis is given.

Chapter 3: Experimental methodology
37
Chapter3
Experimental methodology
3.1 Introduction
A detailed description of the hydrothermal synthesis technique, including the equipment and chemical
precursors used are presented in this section.
3.2 General synthesis scheme of β-FeOOH particles
β-FeOOH particles in both nano and micro sizes can be prepared via hydrolysis and / or forced hydrolysis
of [Fe(H2O)6]3+. Hydrolysis involves a stepwise elimination of protons from the six water molecules that
surround the central hydrated ferric ion to form mono- and binuclear species (Cornell & Schwertmann,
2000), which in turn becomes multinuclear moieties. The latter finally precipitates as a more or less a
crystalline product whose crystallinity depends on the rate and conditions of the reaction (Cornell &
Schwertmann, 2000). Two main variables that cause hydrolysis are: 1) increasing the temperature and 2)
addition of base. Due to the release of protons, the pH of the system falls during the early stages of the
hydrolysis. At high temperature, the pH may become low enough to inhibit further hydrolysis resulting in
incomplete hydrolysis that reduces the yield (Cornell & Schwertmann, 2000). Akaganeite particles form
at pH 1.9. The formation of the particles is controlled by a variety of factors, including rate of hydrolysis,
solution pH, temperature, Fe3+ concentrations and the nature of anions present in the system (Cornell &
Schwertmann, 2000). In forced hydrolysis, precipitation is carried in aqueous solutions at higher
temperatures (>100˚C) and pressure. Simple equations presenting the precipitation of β-FeOOH from
FeCl3 solution are presented below:
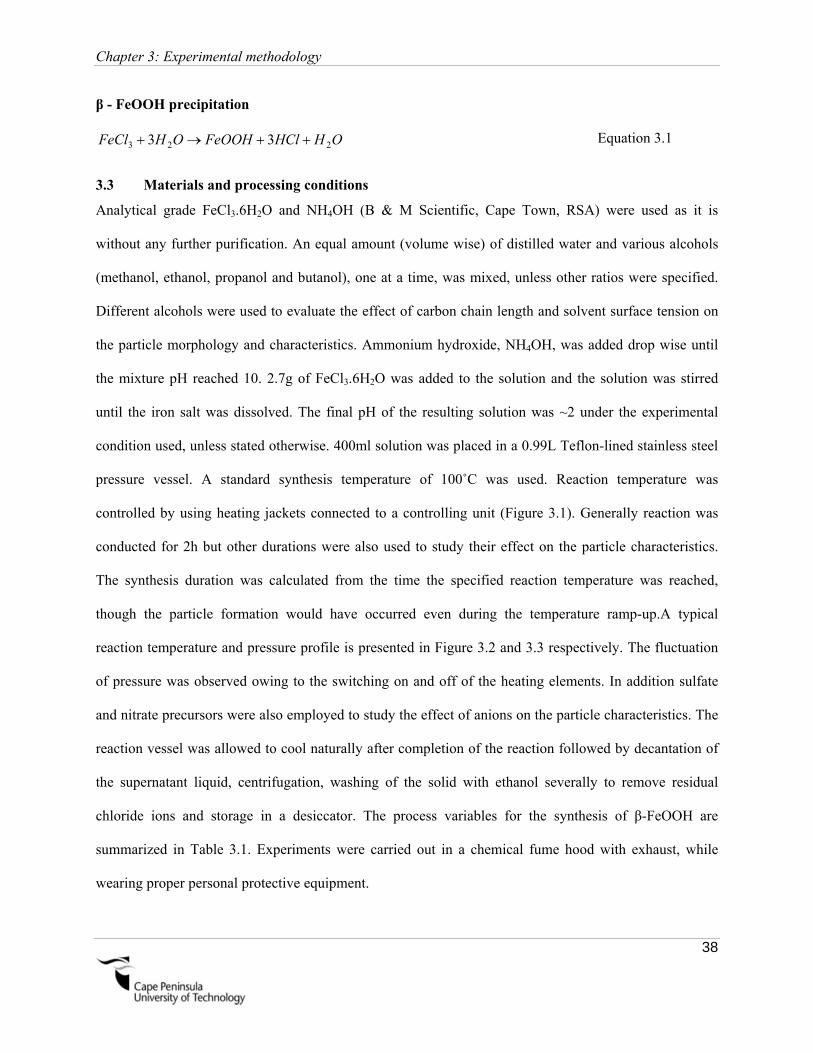
Chapter 3: Experimental methodology
38
β - FeOOH precipitation
Equation 3.1
3.3 Materials and processing conditions
Analytical grade FeCl3.6H2O and NH4OH (B & M Scientific, Cape Town, RSA) were used as it is
without any further purification. An equal amount (volume wise) of distilled water and various alcohols
(methanol, ethanol, propanol and butanol), one at a time, was mixed, unless other ratios were specified.
Different alcohols were used to evaluate the effect of carbon chain length and solvent surface tension on
the particle morphology and characteristics. Ammonium hydroxide, NH4OH, was added drop wise until
the mixture pH reached 10. 2.7g of FeCl3.6H2O was added to the solution and the solution was stirred
until the iron salt was dissolved. The final pH of the resulting solution was ~2 under the experimental
condition used, unless stated otherwise. 400ml solution was placed in a 0.99L Teflon-lined stainless steel
pressure vessel. A standard synthesis temperature of 100˚C was used. Reaction temperature was
controlled by using heating jackets connected to a controlling unit (Figure 3.1). Generally reaction was
conducted for 2h but other durations were also used to study their effect on the particle characteristics.
The synthesis duration was calculated from the time the specified reaction temperature was reached,
though the particle formation would have occurred even during the temperature ramp-up.A typical
reaction temperature and pressure profile is presented in Figure 3.2 and 3.3 respectively. The fluctuation
of pressure was observed owing to the switching on and off of the heating elements. In addition sulfate
and nitrate precursors were also employed to study the effect of anions on the particle characteristics. The
reaction vessel was allowed to cool naturally after completion of the reaction followed by decantation of
the supernatant liquid, centrifugation, washing of the solid with ethanol severally to remove residual
chloride ions and storage in a desiccator. The process variables for the synthesis of β-FeOOH are
summarized in Table 3.1. Experiments were carried out in a chemical fume hood with exhaust, while
wearing proper personal protective equipment.
OHHClFeOOHOHFeCl 223 33
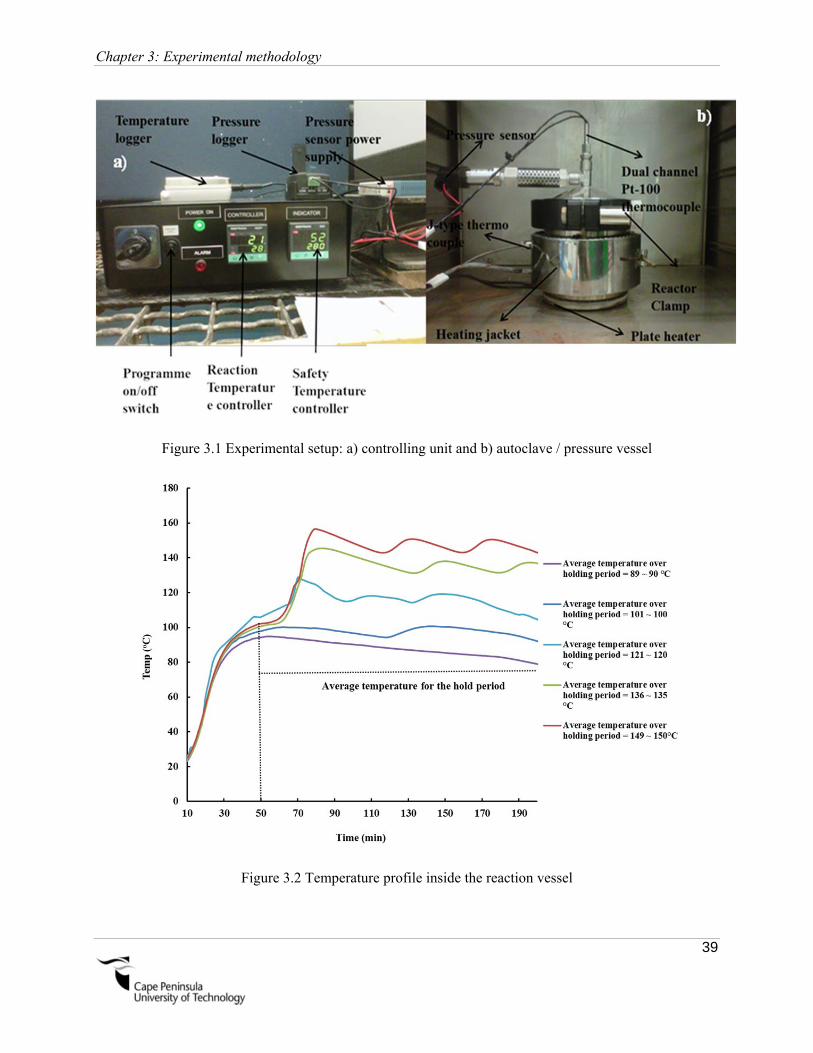
Chapter 3: Experimental methodology
39
Figure 3.1 Experimental setup: a) controlling unit and b) autoclave / pressure vessel
Figure 3.2 Temperature profile inside the reaction vessel

Chapter 3: Experimental methodology
40
Figure 3.3 Pressure profile at different temperature inside the reaction vessel
Table 3.1 Process variable for the synthesis of β-FeOOH (bold text represents standard conditions)
Reaction variable Values
Reaction temperature (°C) 90 100 120 135 150 - - -
Synthesis time (minutes) 50 120 240 360 720 - - -
(%v/v) alcohol in the solution 0 10 30 50 70 95 98 100
FeCl3 ratio 0.05 0.1 0.2 0.3 0.4 0.5 0.7 -
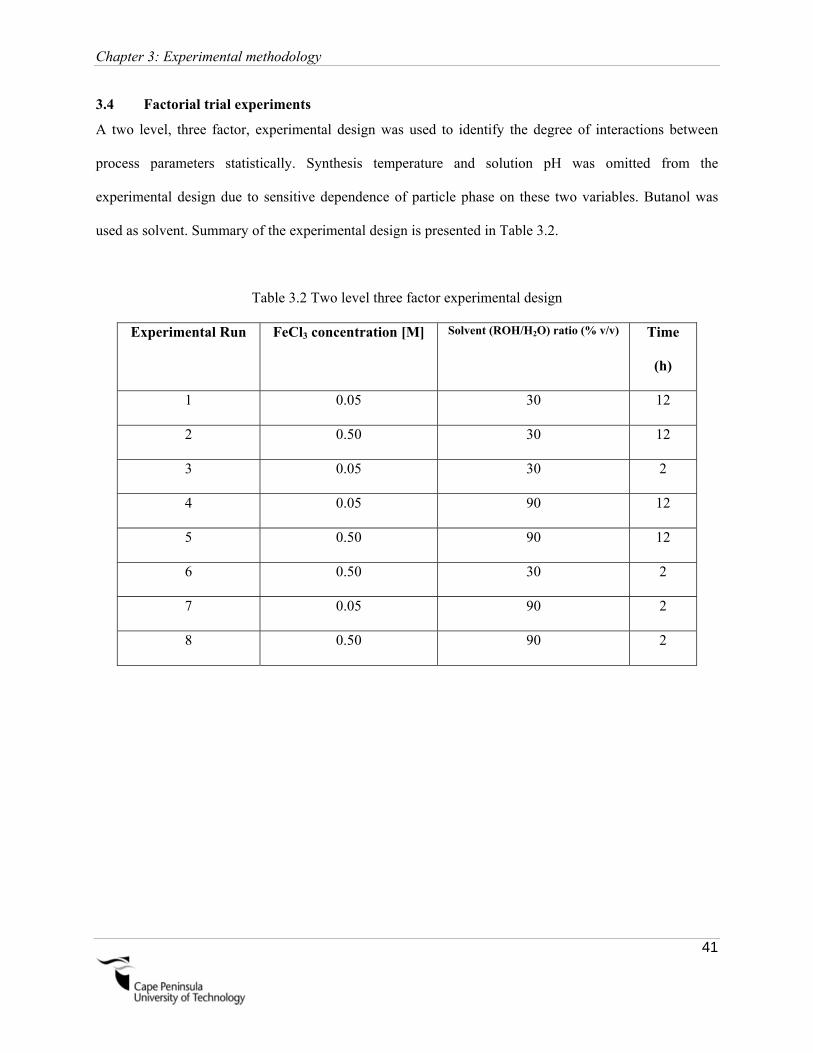
Chapter 3: Experimental methodology
41
3.4 Factorial trial experiments
A two level, three factor, experimental design was used to identify the degree of interactions between
process parameters statistically. Synthesis temperature and solution pH was omitted from the
experimental design due to sensitive dependence of particle phase on these two variables. Butanol was
used as solvent. Summary of the experimental design is presented in Table 3.2.
Table 3.2 Two level three factor experimental design
Experimental Run FeCl3 concentration [M] Solvent (ROH/H2O) ratio (% v/v) Time
(h)
1 0.05 30 12
2 0.50 30 12
3 0.05 30 2
4 0.05 90 12
5 0.50 90 12
6 0.50 30 2
7 0.05 90 2
8 0.50 90 2

42
Chapter 4: Hydrothermal precipitation of β-FeOOH particles in different solvent ratio (%v/v) and pH
43
Chapter 4
Hydrothermal precipitation of β-FeOOH particles in different solvent ratio (% v/v) and pH
4.1 Introduction
To evaluate the effect of alcohol-to-water ratio on the particle morphology and phase, four different
alcohols at varying ratios (% v/v) ranging from 0 – 100% was used. A kinetic equation was evaluated to
correlate particle size with solvent surface tension. The effect of solution pH on the particle phase and
morphology was also evaluated.
4.2 Experimental methodology
A change in solvent ratio results in a change of solution pH. Simultaneous change of experimental
variables may result in an outcome that is fallacious. In order to discern the effect of the variables
individually on the particle morphology and phase, the study was conducted in two parts. In the first case,
solvent ratio was varied at constant pH while in the second case, pH was changed keeping the alcohol-to-
water ratio constant.
Accordingly, in the first case, a 0.05M FeCl3 solution was prepared and mixed with different alcohols.
The synthesis temperature was kept constant at 100°C for 2h. The solution pH was kept constant at ~2 by
addition of NH4OH. The temperature was maintained at 100˚C for 2h. Details of the experimental design
are illustrated in Table 4.1.
To study the effect of the solution pH (prior to heating) on the particle characteristics, a 0.05M FeCl3
solution was prepared and mixed with water and a given alcohol in 50/50 (v/v) ratio while changing the
pH range from 2 - 2.5 - 3 by dropwise ammonia addition. The temperature was maintained at 100˚C for
2h. The details of this experimental design are shown in Table 4.2.

Chapter 4: Hydrothermal precipitation of β-FeOOH particles in different solvent ratio (%v/v) and pH
44
Table 4.1 Experiments with different solvent ratios
Solvent Solvent (ROH/H2O) ratio (% v/v)
BuOH 10,30,50,70,95,98,100
PrOH 10,30,50,70,95,98,100
EtOH 10,30,50,70,95,98,100
MeOH 10,30,50,70,95,98,100
Table 4.2 Experiments with different solution pH
Solvent Solvent (ROH/H2O) ratio (% v/v) Final solution pH
BuOH 50 2, 2.5,3
PrOH 50 2, 2.5,3
EtOH 50 2, 2.5,3
MeOH 50 2, 2.5, 3
4.3 Results and discussion
4.3.1 Effect of BuOH-to-H2O and PrOH – to-H2O ratio on the akaganeite nanoparticle
characteristics
Variation in alcohol-to-water ratio has a marked effect on the morphology of akaganeite particles. The
morphologies evolved as a function of alcohol-to-water ratio variation are shown in Figure 4.1.
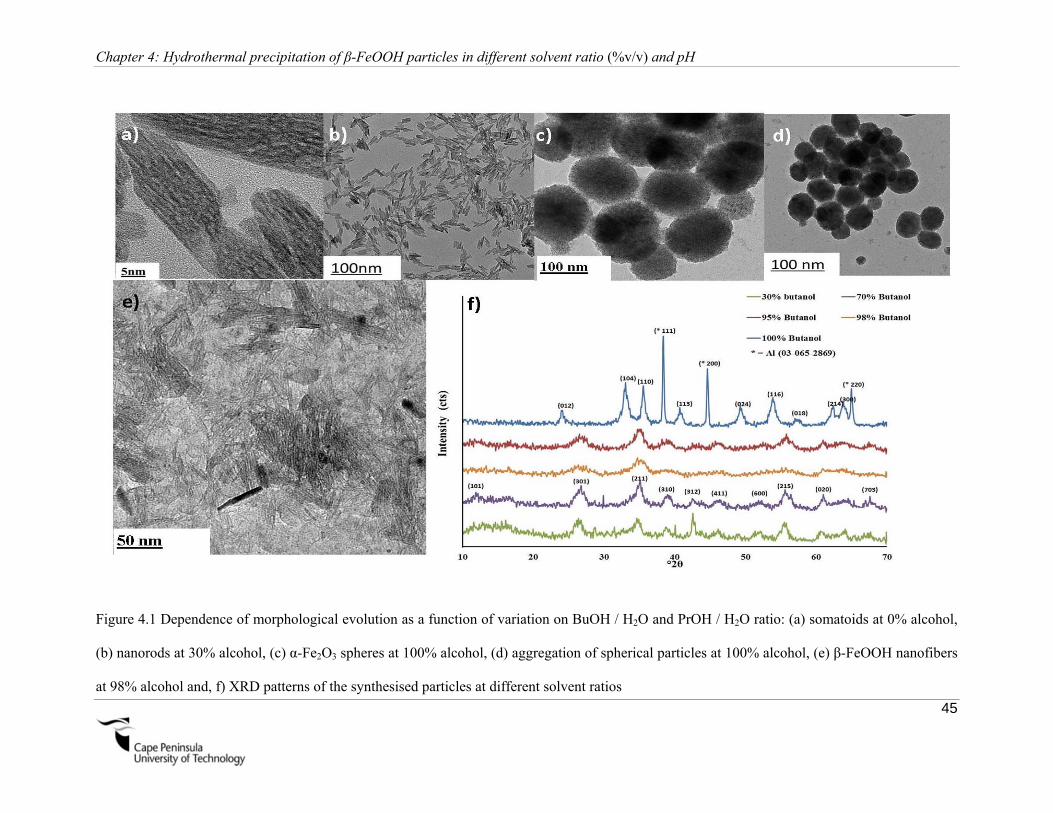
Chapter 4: Hydrothermal precipitation of β-FeOOH particles in different solvent ratio (%v/v) and pH
45
Figure 4.1 Dependence of morphological evolution as a function of variation on BuOH / H2O and PrOH / H2O ratio: (a) somatoids at 0% alcohol,
(b) nanorods at 30% alcohol, (c) α-Fe2O3 spheres at 100% alcohol, (d) aggregation of spherical particles at 100% alcohol, (e) β-FeOOH nanofibers
at 98% alcohol and, f) XRD patterns of the synthesised particles at different solvent ratios

Chapter 4: Hydrothermal precipitation of β-FeOOH particles in different solvent ratio (%v/v) and pH
46
About 75 nm long somatoidal (cigar-shaped) particles with ~20 nm diameter were formed in pure water
(4.1a). No precipitate formed in solution containing 10 vol % BuOH or PrOH, while well-defined rod-
shaped particles resulted in solution with 30 vol % BuOH or PrOH in water. In fact, crystalline β-FeOOH
nanorods (aspect ratio ~10) could be synthesized in solvent mixtures containing BuOH or PrOH in 30-95
vol % concentration, as revealed by the XRD pattern in Figure 4.1f, that matches the JCPDS standard 42-
1315. Crystalline β-FeOOH nanofibres (Figure 4.1 e) were obtained at 98 vol % BuOH or PrOH in
water. It should be pointed out that presence of water facilitates the nucleation and growth of the nanorod-
shaped β-FeOOH particle; in pure alcoholic solutions only spherical hematite (a-Fe2O3) particles could be
seen, as shown in the TEM images (Figure 4.1c-d). Some of these are attached to one another, which
imply growth via OA mechanism. Structurally, they are hematite (α-Fe2O3; JCPDS 33-0664) whose XRD
pattern is shown in Figure 4.1 f. Similar observation was made by Chen et al (2010) who synthesized
hematite nanoplates using different alcohols (BuOH, PrOH, EtOH and MeOH ) as the solvent. It was
theorized by them that trace amount of water could have facilitated nucleation and growth of hematite in
nanoplate morphology which is contrary to the findings in the present work which demonstrates the
formation of spherical hematite nanoparticles in the absence of water. It is believed that presence of
water promotes the hydrolysis of ferric chloride and crystallization of β-FeOOH which is a hematite
precursor as per the following reaction:
Equation 4.1
No study has been reported to the best of our knowledge in the literature that uses 100% alcohol as
solvent to synthesise akaganeite particles. For this reason a direct comparison could not be made
regarding the nucleation and growth of akaganeite particles in solvent only.
Huang et al. (2003) reported that the presence of water around the nanoparticle surface induces the
oriented attachment via Brownian motion-induced reorientation and thereby promoting growth by bulk
diffusion. Diffusion, either via surface reorganisation or addition of ions from aqueous solution,
eliminates the indentations at particle contacts, ultimately generating rounded crystals. This is
2 β-FeOOH α-Fe2O3 + H2O
Chapter 4: Hydrothermal precipitation of β-FeOOH particles in different solvent ratio (%v/v) and pH
47
corroborated by the spherical hematite particles formed in the absence of water (Figure 4.1-D), which are
seen attached to one another via oriented attachment mechanism. This observation contradicts with the
findings of Huang et al. (2003). In addition to promoting nucleation of β-FeOOH, presence of water
significantly impacts the growth of β-FeOOH nanorods; 2-5 vol % water transforms the nanofibres into
high aspect ratio nanorods.
Though the formation of highly anisotropic particles using growth inhibitors, such as, surfactants or
templates, has been reported in the literature, neither was used in the present study. It was shown that the
addition of butanol and propanol confines the growth of the akaganeite nanorods in both diameter and
length directions. For example, in a solvent mixture containing 30 vol % butanol, the diameter and the
length of the particles was reduced by 70% and 50%, respectively, compared to when no butanol was
used; reduction in diameter and length was 70 and 75%, respectively, in the case of 30 vol % propanol-
water mixture. This clearly highlights the crucial role of alcohol as solvent in controlling particle
dimensions. Figure 4.2 presents the % reduction in particle dimensions relative to those without alcohol.
As can be seen, the particle size reduction is highest at 50% ROH/H2O mixture (4.2a& b). Also, the effect
of propanol is more pronounced than that of butanol on diameter and length. The results are summarized
in Table 4.3.

Chapter 4: Hydrothermal precipitation of β-FeOOH particles in different solvent ratio (%v/v) and pH
48
Figure 4.2 % Reduction in particle size using solvent compared to without solvent; a) particle diameter
and b) particle length

Chapter 4: Hydrothermal precipitation of β-FeOOH particles in different solvent ratio (%v/v) and pH
49
Table 4.3 Effect of solvent ratio on the particle characteristics
Solvent Solvent
(ROH/H2O) ratio
(% v/v)
ᶲAV(nm) LAV (nm) Phase Morphology Average
aspect ratio
Bu
OH
0 20 ± 6 77 ± 7 β-FeOOH Somatoidal 4
10 - - No
precipitation
- -
30 6 ± 2 51 ± 5 β-FeOOH Rods 9
50 9 ± 2 38 ± 5 β-FeOOH Rods 4
70 5 ± 1 37 ± 5 β-FeOOH Rods 7
95 3 ± 1 30 ± 3 β-FeOOH Rods 10
98 n/a n/a β-FeOOH Fibres -
100 130 ± 15 α-Fe2O3 Spheres -
PrO
H
0 20 ± 6 77 ± 7 β-FeOOH Somatoidal 4
10 - - No
precipitation
- -
30 5 ± 2 26 ± 4 β-FeOOH Rods 5
50 7 ± 2 29 ± 3 β-FeOOH Rods 4
70 5 ± 1 50 ± 2 β-FeOOH Rods 10
95 3 ± 1 15 ± 1 β-FeOOH Rods 5
98 n/a n/a β-FeOOH Fibres -
100 108 ± 15 n/a α-Fe2O3 Spheres -

Chapter 4: Hydrothermal precipitation of β-FeOOH particles in different solvent ratio (%v/v) and pH
50
4.3.2 Effect of EtOH - to - H2O and MeOH – to - H2O ratio on the akaganeite nanoparticle
characteristics
The morphologies evolved as a function of alcohol-to-water ratio are illustrated in Figure 4.3.Somatoidal
particles were formed in mixture containing 10 vol % MeOH or EtOH in water. In solvent mixtures
containing up to 70 vol % EtOH in water, β-FeOOH nanorods were formed, while aggregates resulted at
higher (98 vol %) EtOH-to - H2O mixture. The particles assumed spindle-like shape in 30-70 vol %
MeOH while fibres and nanoflakes were formed in 95-98 vol % MeOH to water mixtures. Fast Fourier
Transform (FFT) algorithm was performed on the TEM images of the particles. The dots in the FFT
(Figure 4.3 a) represent the crystallinity of the material. The XRD patterns (Figure 4.3 i) of the samples
synthesized in 95-98% to EtOH / H2O mixture tallied with those (JCPDS card no: 33-0664) of the α-
Fe2O3 particles.
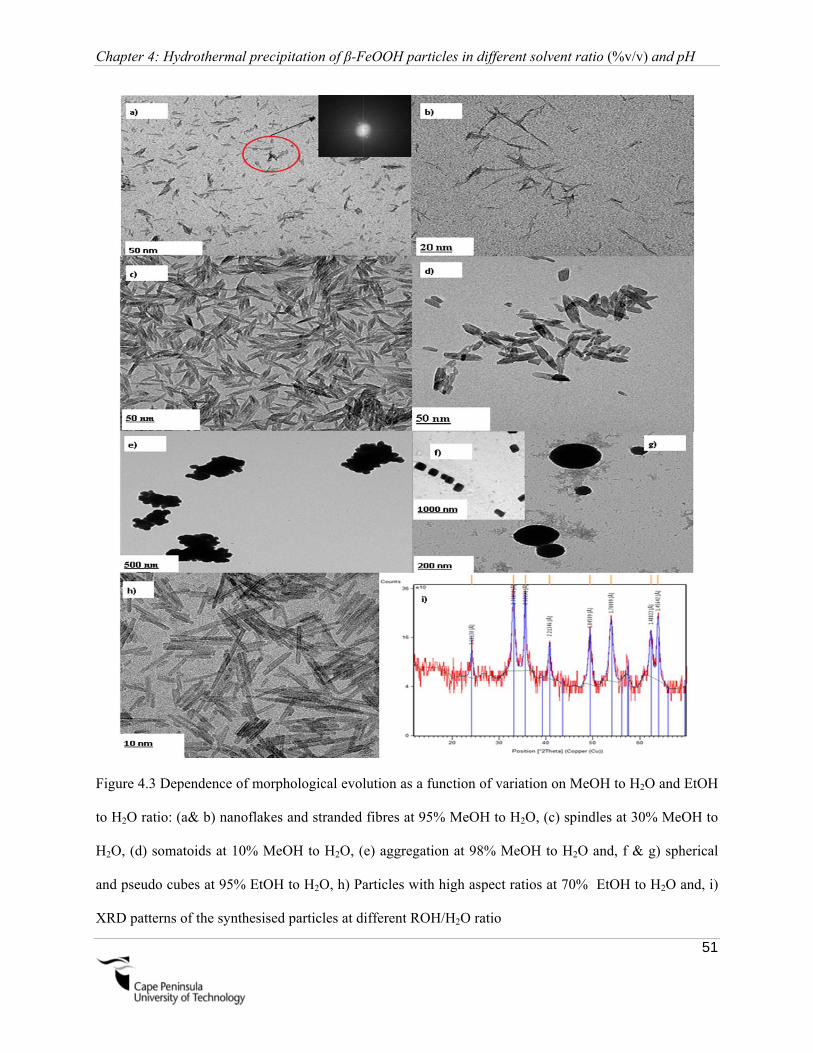
Chapter 4: Hydrothermal precipitation of β-FeOOH particles in different solvent ratio (%v/v) and pH
51
Figure 4.3 Dependence of morphological evolution as a function of variation on MeOH to H2O and EtOH
to H2O ratio: (a& b) nanoflakes and stranded fibres at 95% MeOH to H2O, (c) spindles at 30% MeOH to
H2O, (d) somatoids at 10% MeOH to H2O, (e) aggregation at 98% MeOH to H2O and, f & g) spherical
and pseudo cubes at 95% EtOH to H2O, h) Particles with high aspect ratios at 70% EtOH to H2O and, i)
XRD patterns of the synthesised particles at different ROH/H2O ratio

Chapter 4: Hydrothermal precipitation of β-FeOOH particles in different solvent ratio (%v/v) and pH
52
From the foregoing discussion it appears that carbon chain length of the alcohol and the alcohol-to-water
ratio control the nucleation and growth of particles. Particle length and diameter decrease with increase in
the alcohol-to-water ratio; for example, a 50% ethanol-to-water mixture changes the particle diameter and
length by 75 and 71% respectively, compared to when no alcohol was used. The percentage reduction in
nanorod diameter and length was constant over the methanol-to-water ratio range of 10 – 50% compared
to when no alcohol was used.These results are summarized in Table 4.4.
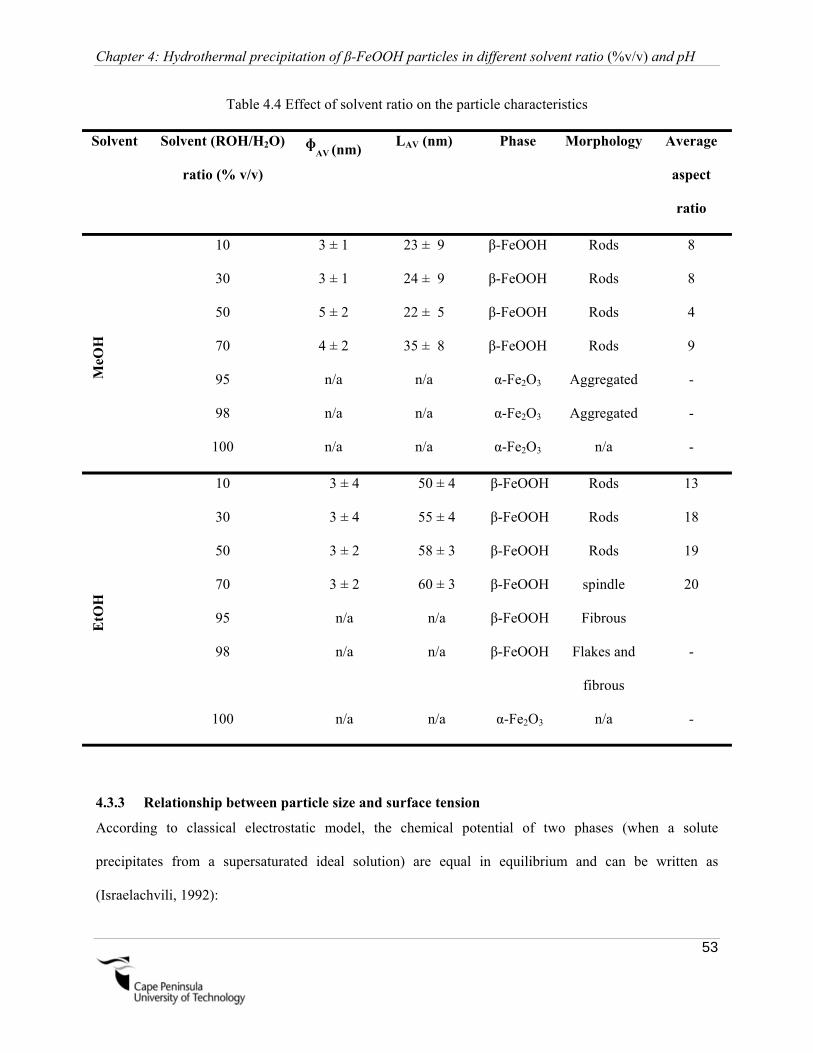
Chapter 4: Hydrothermal precipitation of β-FeOOH particles in different solvent ratio (%v/v) and pH
53
Table 4.4 Effect of solvent ratio on the particle characteristics
Solvent Solvent (ROH/H2O)
ratio (% v/v)
ᶲAV (nm) LAV (nm) Phase Morphology Average
aspect
ratio
MeO
H
10 3 ± 1 23 ± 9 β-FeOOH Rods 8
30 3 ± 1 24 ± 9 β-FeOOH Rods 8
50 5 ± 2 22 ± 5 β-FeOOH Rods 4
70 4 ± 2 35 ± 8 β-FeOOH Rods 9
95 n/a n/a α-Fe2O3 Aggregated -
98 n/a n/a α-Fe2O3 Aggregated -
100 n/a n/a α-Fe2O3 n/a -
EtO
H
10 3 ± 4 50 ± 4 β-FeOOH Rods 13
30 3 ± 4 55 ± 4 β-FeOOH Rods 18
50 3 ± 2 58 ± 3 β-FeOOH Rods 19
70 3 ± 2 60 ± 3 β-FeOOH spindle 20
95 n/a n/a β-FeOOH Fibrous
98 n/a n/a β-FeOOH Flakes and
fibrous
-
100 n/a n/a α-Fe2O3 n/a -
4.3.3 Relationship between particle size and surface tension
According to classical electrostatic model, the chemical potential of two phases (when a solute
precipitates from a supersaturated ideal solution) are equal in equilibrium and can be written as
(Israelachvili, 1992):

Chapter 4: Hydrothermal precipitation of β-FeOOH particles in different solvent ratio (%v/v) and pH
54
LLo
So CKTCKTS lnln Equation 4.2
Where, o is the standard chemical potential and C , concentration of solute. Solid and liquid phase are
denoted by subscripts S and L respectively. T is the temperature expressed in Kelvin and K , Boltzmann
constant. Equation 4.3 also known as Coulombs interaction and can be used to express the energy
required to separate the charged ions from the solid state (Israelachvili, 1992):
)(4
2
rr
e
o
o
Equation 4.3
where, o ,represents the permittivity in vacuum and , dielectric constant of a given solution and r+ and
r- the ionic radius of species with charge Z+ and Z-, respectively. By putting appropriate values and
combining Equations 4.2 and 4.3, Equations 4.4 and 4.5 can be written as follows:
Lo
CKTrr
eln0
)(4
2
Equation 4.4
))(4
exp(2
rrKT
eC
oL
Equation 4.5
From the nucleation theory it is known that the formation of particles is dependent significantly on the
supersaturation defined as:
LC
CS Equation 4.6
where, S is the supersaturation of solute, C and LC the solute concentration and solvent concentration.
Relationship between super-saturation and particle size can be expressed by Kelvin equation (Mullin,
2001):
rKT
mS
2)ln( Equation 4.7
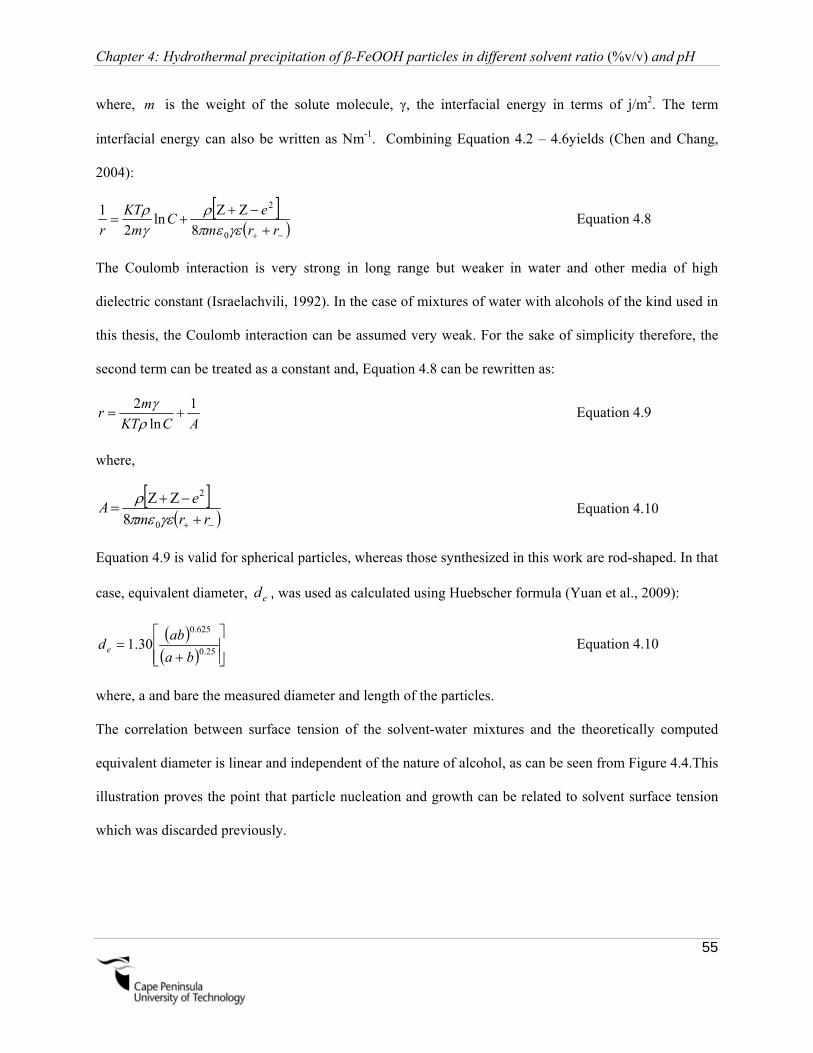
Chapter 4: Hydrothermal precipitation of β-FeOOH particles in different solvent ratio (%v/v) and pH
55
where, m is the weight of the solute molecule, γ, the interfacial energy in terms of j/m2. The term
interfacial energy can also be written as Nm-1. Combining Equation 4.2 – 4.6yields (Chen and Chang,
2004):
rrm
eC
m
KT
r
0
2
8ln
2
1 Equation 4.8
The Coulomb interaction is very strong in long range but weaker in water and other media of high
dielectric constant (Israelachvili, 1992). In the case of mixtures of water with alcohols of the kind used in
this thesis, the Coulomb interaction can be assumed very weak. For the sake of simplicity therefore, the
second term can be treated as a constant and, Equation 4.8 can be rewritten as:
ACKT
mr
1
ln
2
Equation 4.9
where,
rrm
eA
0
2
8 Equation 4.10
Equation 4.9 is valid for spherical particles, whereas those synthesized in this work are rod-shaped. In that
case, equivalent diameter, ed , was used as calculated using Huebscher formula (Yuan et al., 2009):
25.0
625.0
30.1ba
abde Equation 4.10
where, a and bare the measured diameter and length of the particles.
The correlation between surface tension of the solvent-water mixtures and the theoretically computed
equivalent diameter is linear and independent of the nature of alcohol, as can be seen from Figure 4.4.This
illustration proves the point that particle nucleation and growth can be related to solvent surface tension
which was discarded previously.
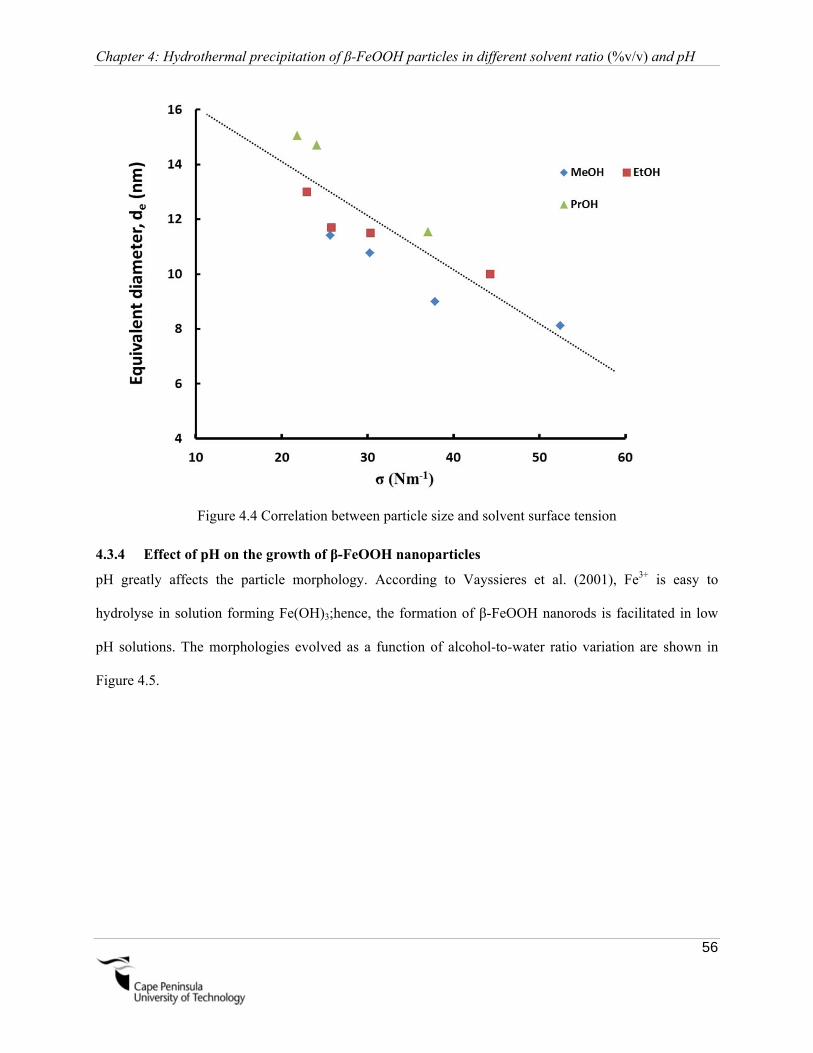
Chapter 4: Hydrothermal precipitation of β-FeOOH particles in different solvent ratio (%v/v) and pH
56
Figure 4.4 Correlation between particle size and solvent surface tension
4.3.4 Effect of pH on the growth of β-FeOOH nanoparticles
pH greatly affects the particle morphology. According to Vayssieres et al. (2001), Fe3+ is easy to
hydrolyse in solution forming Fe(OH)3;hence, the formation of β-FeOOH nanorods is facilitated in low
pH solutions. The morphologies evolved as a function of alcohol-to-water ratio variation are shown in
Figure 4.5.

Chapter 4: Hydrothermal precipitation of β-FeOOH particles in different solvent ratio (%v/v) and pH
57
Figure 4.5 Dependence of morphological evolution as a function of pH: a) nanorods at pH 2, b)
aggregation of nanorods at pH 2.5 in butanol and propanol, c) spherical α-Fe2O3 particles at pH 3 in
butanol and propanol, d) clustered α-Fe2O3 particles at pH 2.5 in ethanol and e) dispersed α-Fe2O3
particles at pH 2.5 in methanol

Chapter 4: Hydrothermal precipitation of β-FeOOH particles in different solvent ratio (%v/v) and pH
58
β-FeOOH nanorods were obtained at pH 2 in all cases (Figure 4.5 a). With increase in pH to 2.5,
aggregation of the β-FeOOH rods (Figure 4.5 b) was observed in both butanol and propanol. Spherical
nanosized α-Fe2O3 particles were obtained when the precursor pH was adjusted to pH~3 (Figure 4.5c).
The spherical nanoparticles have an average diameter of ~95 ± 19nm.
Clustered α-Fe2O3 nanoparticles (Figure 4.5 d) were obtained at pH ~2.5 in ethanol contrary to butanol
and propanol. From the TEM image it was observed that the particle clusters were formed from small
spherical particles. The spherical particles are marked with white circles and presented as a subset in
Figure 4.5d.
Dispersed crystalline α-Fe2O3 (Figure 4.5 e) particles with an average diameter of ~112 ± 38 were
obtained at pH~2.5 in methanol contrary to other three solvent used. Khan et al. (2011) synthesised
spherical α-Fe2O3 nanoparticle with and without surfactant Tween 80 at 200˚C for a total duration of 5h.
Irregular-shaped α-Fe2O3 nanoparticles with a wide range of size distribution in the range of 150 – 300nm
were obtained without the surfactant. Moreover, the surfactant was effective in controlling the particle
shape and restricting particle growth to a narrow range of 40 – 60nm.
It was shown that dispersed α-Fe2O3nanoparticles with controlled particle sizes could be synthesised
without the use of surfactant under mild conditions just by altering the pH of the solution. XRD patterns
of the synthesised β-FeOOH and α-Fe2O3 particles are presented in Figure 4.6.

Chapter 4: Hydrothermal precipitation of β-FeOOH particles in different solvent ratio (%v/v) and pH
59
Figure 4.6 XRD patterns of the particles synthesised at different pH
4.3.5 Effect of alcohol on the Raman spectra of the synthesised particles
Raman spectroscopy was performed to evaluate the effect of alcohols on the particle morphology and
chemistry, using Horiba Jobin Yvon spectroscope (Model LabRAM HR 800). The spectra were collected
using a 532nm laser (250 muW), a 5x objective and a grating of 600 lines/mm. The spectra were identical
in all the cases, as seen from Figure 4.7, from which the presence of β-FeOOH and α-Fe2O3 could be
discerned. The spectrum of bright flakes (region 1) is characteristic of akaganeite with peaks at 308, 391,
486, 537, 718 and 3500 cm-1(Réguer et al., 2007). The spectrum of region3 is characteristic of hematite
with large, broad peaks at 1315 and 2440 cm-1, and narrow peaks at 224, 291, 408 and 486 cm-1 (region
3). This is consistent with the literature. Region 2 contains a mixture of akaganeite and hematite. The
inset shows slight stretching of the OH peak at ~3500 cm-1, which is ascribed to the presence of Cl-1 in the
sample (as an impurity) that originates from the chloride precursor for iron.
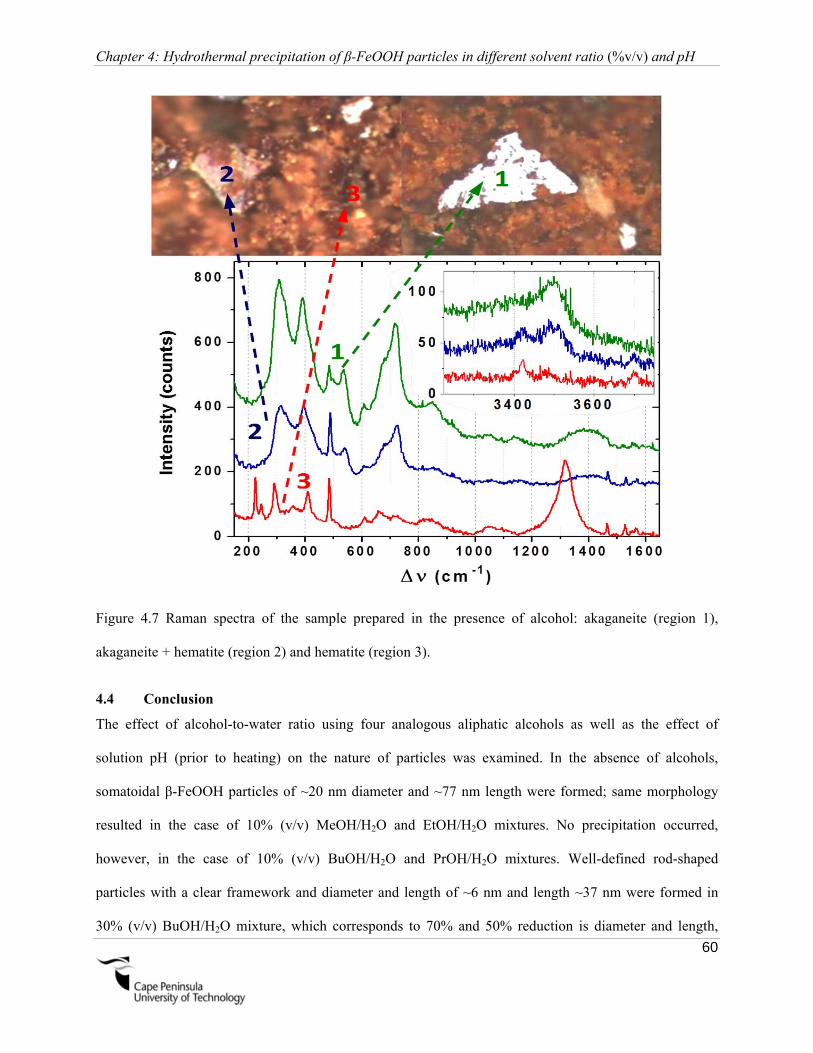
Chapter 4: Hydrothermal precipitation of β-FeOOH particles in different solvent ratio (%v/v) and pH
60
Figure 4.7 Raman spectra of the sample prepared in the presence of alcohol: akaganeite (region 1),
akaganeite + hematite (region 2) and hematite (region 3).
4.4 Conclusion
The effect of alcohol-to-water ratio using four analogous aliphatic alcohols as well as the effect of
solution pH (prior to heating) on the nature of particles was examined. In the absence of alcohols,
somatoidal β-FeOOH particles of ~20 nm diameter and ~77 nm length were formed; same morphology
resulted in the case of 10% (v/v) MeOH/H2O and EtOH/H2O mixtures. No precipitation occurred,
however, in the case of 10% (v/v) BuOH/H2O and PrOH/H2O mixtures. Well-defined rod-shaped
particles with a clear framework and diameter and length of ~6 nm and length ~37 nm were formed in
30% (v/v) BuOH/H2O mixture, which corresponds to 70% and 50% reduction is diameter and length,

Chapter 4: Hydrothermal precipitation of β-FeOOH particles in different solvent ratio (%v/v) and pH
61
respectively, of the nanorods. The dimensional reduction was 70% and 75% in 30% (v/v) PrOH/H2O
mixture. Nanofibrillar and aggregated nanoparticles of β-FeOOH were formed in 98%PrOH/H2O and
EtOH / H2O mixture, respectively; flakes and fibres resulted in 95% MeOH / H2O mixture. The presence
of water plays an important role in the formation of β-FeOOH particles. Only spherical α-Fe2O3 particles
were formed in pure alcohols implying nucleation and growth of particles was dependent on the length of
the carbon chain in these alcohols as well as on the alcohol-to-water ratio. Kinetic equation was tested to
fit the experimental data as a function of solution pH at constant FeCl3 concentration and reaction time.
Surfactant free synthesis of spherical α-Fe2O3 nanoparticles is not reported widely in the literature and
therefore, their synthesis under conditions of controlled pH might be an alternative approach. β-FeOOH
structure was not particularly affected by the choice of solvent as revealed by Raman data.

62

Chapter 5: Role of solvent on the growth kinetics of β-FeOOH nanorods
63
Chapter5
Role of solvent on the growth kinetics of β-FeOOH nanorods
5.1 Introduction
The effect of four different alcohols on the growth kinetics of the β-FeOOH nanorods has been assessed.
Relationship between surface tension and growth rate constants are also demonstrated in this chapter.
5.2 Experimental methodology
To conduct time evolution study, a 0.05M FeCl3 solution was prepared and mixed with water and a given
alcohol in 50/50 (% v/v) ratio. Reaction temperature and solution pH was maintained at 100˚C and 2
respectively. Synthesis time was varied in the range of 2 – 12h. Details of this experimental design are
presented in Table 5.1.
Table 5.1 Experiments with different synthesis time
Solvent Solvent (ROH/H2O) ratio (% v/v) Time (minutes)
BuOH 50 50, 60, 120, 240, 280, 300, 360 and
720
PrOH 50 50, 60, 120, 240, 280, 300, 360 and
720
EtOH 50 50, 60, 120, 240, 280, 300, 360 and
720
MeOH 50 50, 60, 120, 240, 280, 300, 360 and
720

Chapter 5: Role of solvent on the growth kinetics of β-FeOOH nanorods
64
Synthesis time had no effect on the particle phase over a synthesis time range of 1 – 12h in BuOH, PrOH
and EtOH. A mixture of particles (β-FeOOH + α-Fe2O3) and pure α-Fe2O3 particles was formed at 360
and 720 minutes respectively in MeOH as shown by the XRD patterns in Figure 5.1.
Figure 5.1 XRD patterns a) β-FeOOH particles synthesised in butanol, propanol and ethanol, b) particles
synthesised in methanol
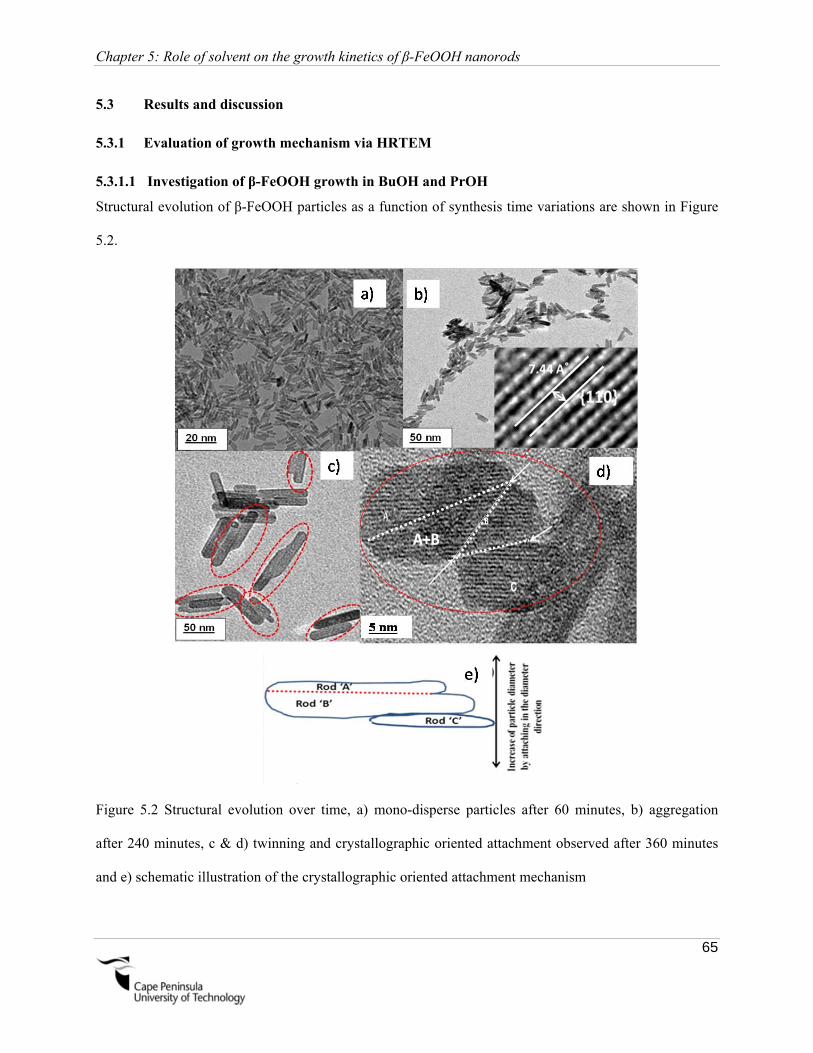
Chapter 5: Role of solvent on the growth kinetics of β-FeOOH nanorods
65
5.3 Results and discussion
5.3.1 Evaluation of growth mechanism via HRTEM
5.3.1.1 Investigation of β-FeOOH growth in BuOH and PrOH
Structural evolution of β-FeOOH particles as a function of synthesis time variations are shown in Figure
5.2.
Figure 5.2 Structural evolution over time, a) mono-disperse particles after 60 minutes, b) aggregation
after 240 minutes, c & d) twinning and crystallographic oriented attachment observed after 360 minutes
and e) schematic illustration of the crystallographic oriented attachment mechanism

Chapter 5: Role of solvent on the growth kinetics of β-FeOOH nanorods
66
Uniform akaganeite nanorods are formed after 60 minutes (Figure 5.2 a). Aggregation of particles occurs
with increase in synthesis time (Figure 5.2b). It was suggested by Huang et al. (2003) that for spherical
particles, once a particle pair is formed via the OA mechanism, the radius of the new larger particles is
smaller than twice the radius of the two primary particles. Hence, the distance between the new particles
and other adjacent particles increases. Aggregation ensures small distances between the nanoparticles as
can be seen from Figure 5.2 b, providing the possibility of coarsening via oriented attachment. Twinning
of rods is observed after a synthesis time of 360 minutes (Figure 5.2c). Twin rods and stacking faults are
common signs of the OA mechanism. Side by side crystallographically oriented growth of akaganeite
nanorods are shown in Figure 5.2 d and a schematic outline is presented in Figure 5.2 e. The arrowhead
(Figure 5.2 d) marks indentations, interpreted to be the interfaces between assembly units. Once formed,
it is possible to preserve the structure in the following growth process (Deng et al., 2007).
Growth by OA mechanism as illustrated in Figure 5.3 will result in a broader and unsymmetrical particle
size distribution (Figure 5.4) due to random attachment symmetry. However Particle growth via OR
mechanism will normally result in an undisturbed size distribution curve due to systematic growth of the
particles. It can be seen from Figure 5.4 (a & b) that particle size distribution at 50 minutes represents a
bell-shaped curve (variance, σ2 = 6.7 and standard deviation, σ = 2.58). As the time increases, the shape
of the curve deviates from ideal Gaussian distribution. The standard deviation, σ and variance, σ2 for the
particles synthesised at 720 minutes were found to be 4.32 and 19 respectively, implying that inconsistent
distribution occurs over time, confirming the presence of OA growth. A similar observation was reported
by Zhang and Benfield (2002) during the heating of amorphous TiO2in air, to form nanocrystalline
anatase. The findings are summarized in Table 5.2 and 5.3.
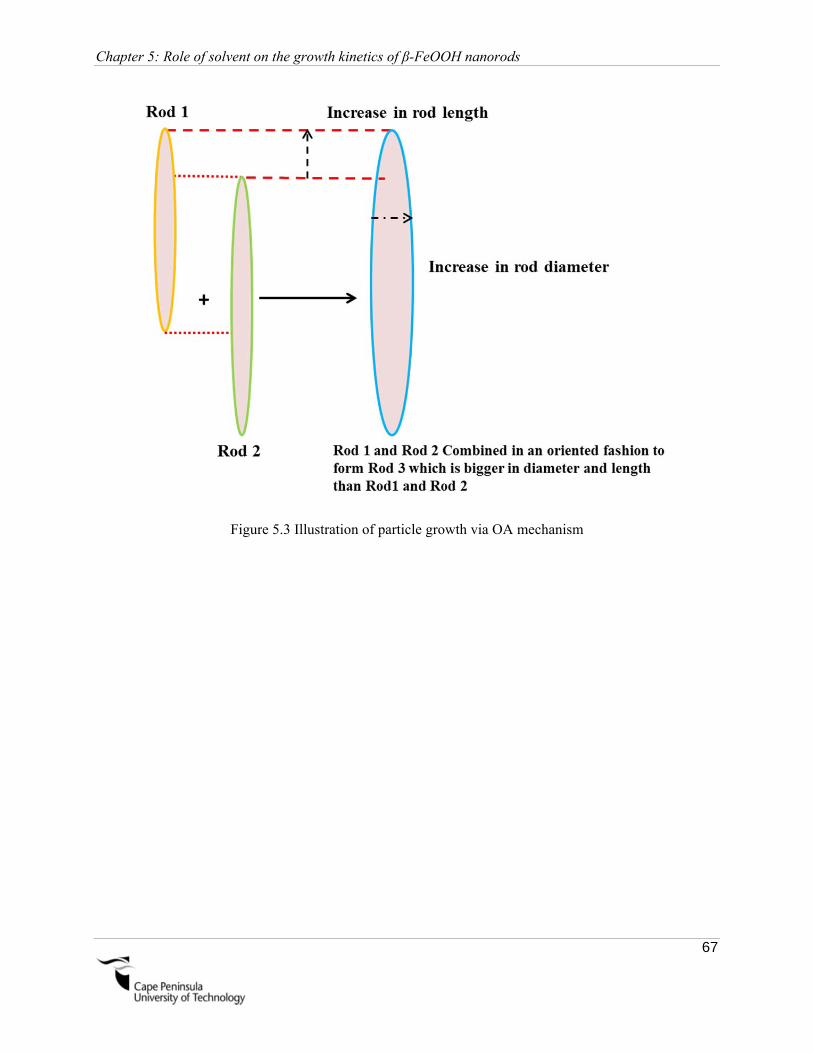
Chapter 5: Role of solvent on the growth kinetics of β-FeOOH nanorods
67
Figure 5.3 Illustration of particle growth via OA mechanism
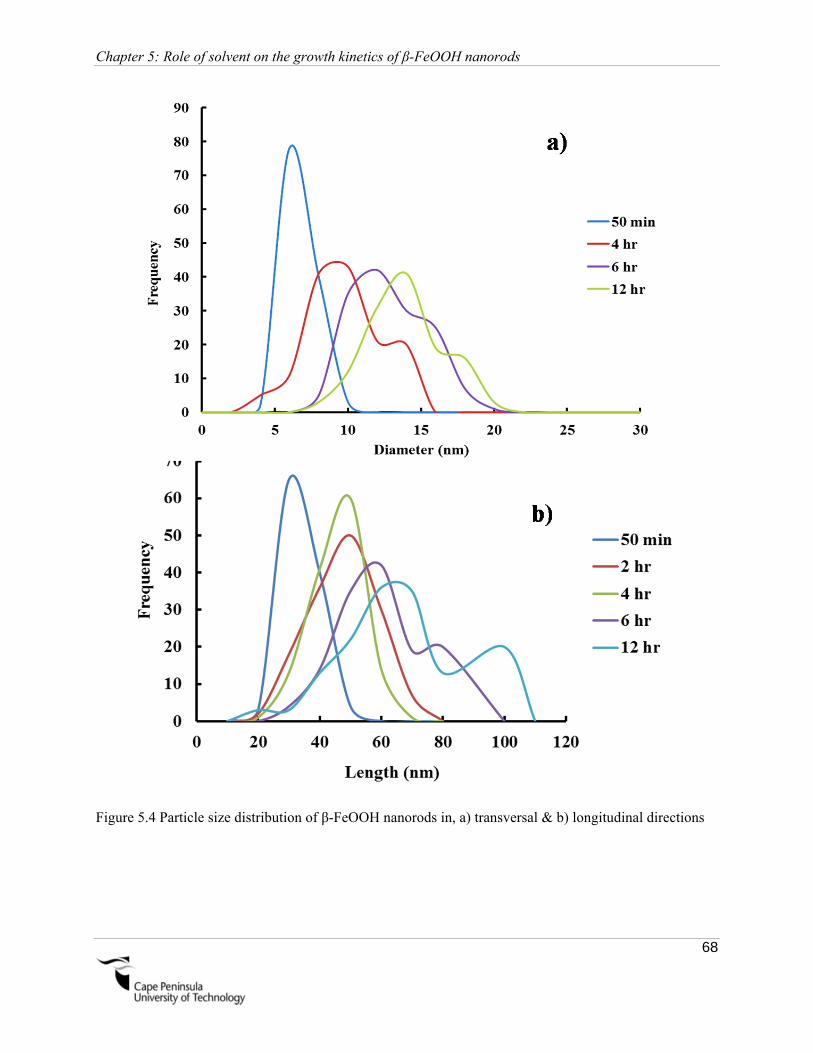
Chapter 5: Role of solvent on the growth kinetics of β-FeOOH nanorods
68
Figure 5.4 Particle size distribution of β-FeOOH nanorods in, a) transversal & b) longitudinal directions

Chapter 5: Role of solvent on the growth kinetics of β-FeOOH nanorods
69
Table 5.2 Effect of time on the particle characteristics in BuOH
Time (min) ᶲAV(nm) LAV (nm) Morphology Phase Average aspect
ratio
50 6±1 30±6 Rods β-FeOOH 5
60 7±1 32±7 Rods β-FeOOH 5
120 7±2 36±10 Rods β-FeOOH 5
240 8±2 39±11 Rods β-FeOOH 5
280 9±5 39±11 Rods β-FeOOH 4
300 10±9 44±12 Rods β-FeOOH 4
360 12±7 50±13 Rods β-FeOOH 4
720 13±8 58±14 Rods β-FeOOH 4
Table 5.3 Effect of time on the particle characteristics in PrOH
Time (min) ᶲAV(nm) LAV (nm) Morphology Average aspect
ratio
50 5±1 27±6 Rods 5
60 6±2 29±7 Rods 5
120 6±1 32±7 Rods 5
240 7±3 35±8 Rods 5
280 7±2 35±8 Rods 5
300 7±1 39±9 Rods 6
360 10±2 44±8 Rods 4
720 11±3 52±9 Rods 5

Chapter 5: Role of solvent on the growth kinetics of β-FeOOH nanorods
70
5.3.1.2 Investigation of β-FeOOH growth in EtOH
Only rod-shaped particles were obtained in ethanol over the time range. Particle size distribution given in
Figure 5.5, highlights that the distribution curves are symmetrical and become broader as the time
progresses. A diffusion-based growth such as OR would normally result in symmetrical distribution
curve, postulating that particle growth in ethanol is controlled by OR mechanism. The results are
summarised in Table 5.4.
Figure 5.5 Particle size distribution of β-FeOOH nanorods synthesised in ethanol
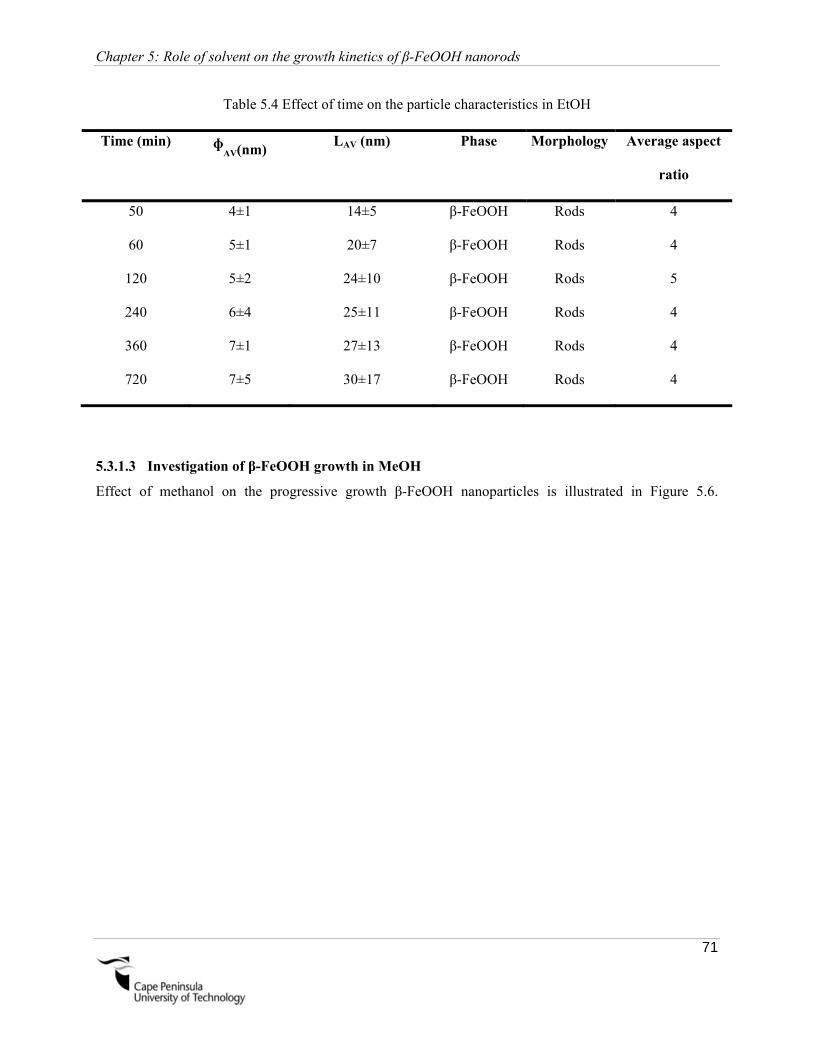
Chapter 5: Role of solvent on the growth kinetics of β-FeOOH nanorods
71
Table 5.4 Effect of time on the particle characteristics in EtOH
Time (min) ᶲAV(nm) LAV (nm) Phase Morphology Average aspect
ratio
50 4±1 14±5 β-FeOOH Rods 4
60 5±1 20±7 β-FeOOH Rods 4
120 5±2 24±10 β-FeOOH Rods 5
240 6±4 25±11 β-FeOOH Rods 4
360 7±1 27±13 β-FeOOH Rods 4
720 7±5 30±17 β-FeOOH Rods 4
5.3.1.3 Investigation of β-FeOOH growth in MeOH
Effect of methanol on the progressive growth β-FeOOH nanoparticles is illustrated in Figure 5.6.
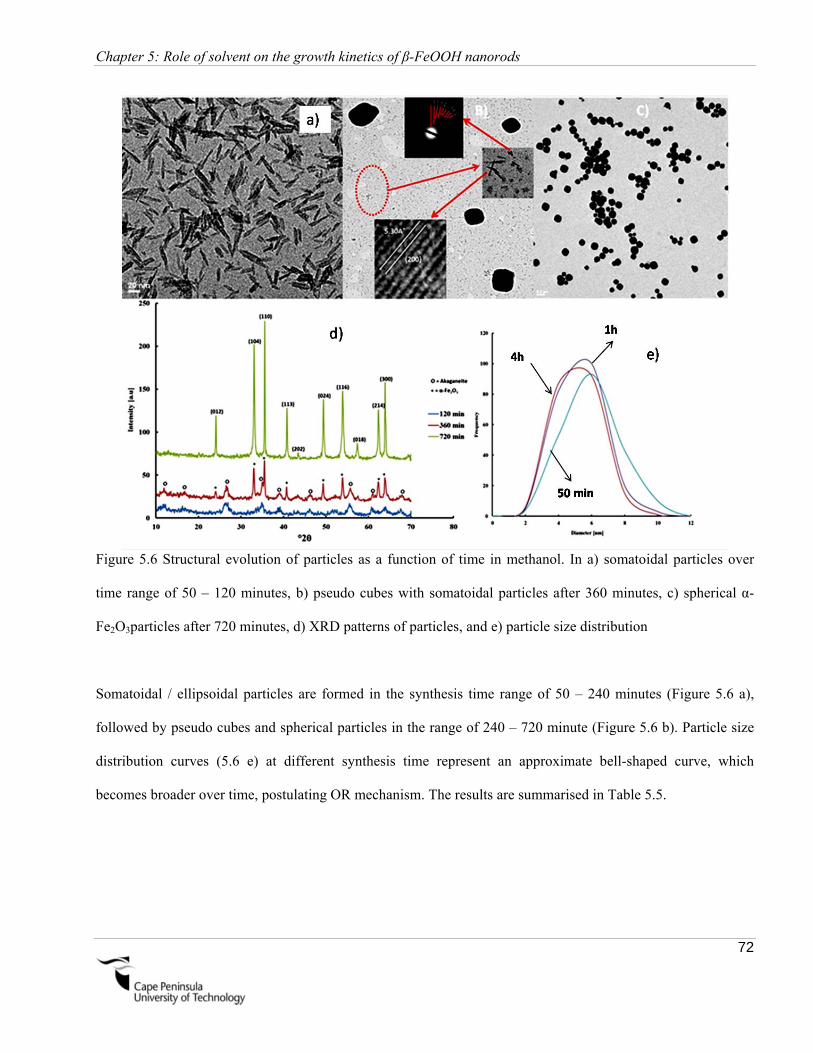
Chapter 5: Role of solvent on the growth kinetics of β-FeOOH nanorods
72
Figure 5.6 Structural evolution of particles as a function of time in methanol. In a) somatoidal particles over
time range of 50 – 120 minutes, b) pseudo cubes with somatoidal particles after 360 minutes, c) spherical α-
Fe2O3particles after 720 minutes, d) XRD patterns of particles, and e) particle size distribution
Somatoidal / ellipsoidal particles are formed in the synthesis time range of 50 – 240 minutes (Figure 5.6 a),
followed by pseudo cubes and spherical particles in the range of 240 – 720 minute (Figure 5.6 b). Particle size
distribution curves (5.6 e) at different synthesis time represent an approximate bell-shaped curve, which
becomes broader over time, postulating OR mechanism. The results are summarised in Table 5.5.

Chapter 5: Role of solvent on the growth kinetics of β-FeOOH nanorods
73
Table 5.5 Effect of time on the particle characteristics in MeOH
Time (min) ᶲAV(nm) LAV (nm) Phase Morphology Average aspect
ratio
50 4±1 14±5 β-FeOOH Somatoidal 4
60 5±1 20±7 β-FeOOH Somatoidal 4
120 5±2 24±10 β-FeOOH Somatoidal 5
240 6±4 25±11 β-FeOOH Somatoidal 4
360 6±1 27±13 β-FeOOH+ α-Fe2O3 Somatoidal+Cubes 4
720 390±90 30±17 α-Fe2O3 Cubes 4
5.3.2 Relationship between particle size and carbon number present in the linear alkyl chain of the
solvent
The variation of the full width at half maxima (FWHM) of 101, 300 and 211 diffractions (Figure 5.7) for
particles synthesised shows a monotonic decrease of FWHM with increasing carbon number in the linear alkyl
chain of the solvent, confirming an increase in particle sizes with the increase in carbon number.

Chapter 5: Role of solvent on the growth kinetics of β-FeOOH nanorods
74
Figure 5.7Relationship between particle size and carbon number present in the linear alkyl chain of the solvent
5.3.3 Growth kinetic evaluation of akaganeite nanorods
5.3.3.1 Effect of BuOH and PrOH on the growth kinetics of akaganeite nanorods
Evidence for OA based growth comes both from interpretation of microstructure and the deviation of the
growth kinetics from the OR model. OA growth does not follow Ostwald Ripening kinetics (Gilbert et al.,
2003). Figure 5.8presents two stage hydrothermal coarsening of akaganeite nanorods in BuOH and PrOH. In
both cases the stages start to occur around ~250 minutes. Two stage crystal growth for β-FeOOH particles has
not been reported previously to the best of our knowledge.
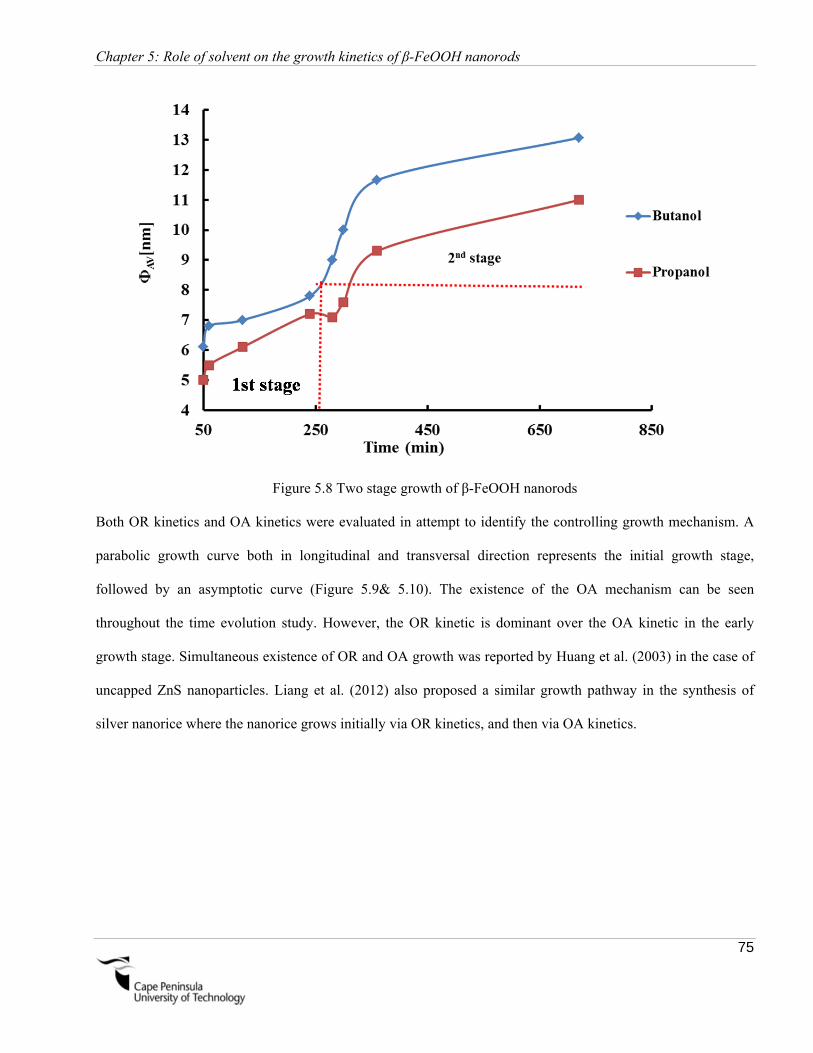
Chapter 5: Role of solvent on the growth kinetics of β-FeOOH nanorods
75
Figure 5.8 Two stage growth of β-FeOOH nanorods
Both OR kinetics and OA kinetics were evaluated in attempt to identify the controlling growth mechanism. A
parabolic growth curve both in longitudinal and transversal direction represents the initial growth stage,
followed by an asymptotic curve (Figure 5.9& 5.10). The existence of the OA mechanism can be seen
throughout the time evolution study. However, the OR kinetic is dominant over the OA kinetic in the early
growth stage. Simultaneous existence of OR and OA growth was reported by Huang et al. (2003) in the case of
uncapped ZnS nanoparticles. Liang et al. (2012) also proposed a similar growth pathway in the synthesis of
silver nanorice where the nanorice grows initially via OR kinetics, and then via OA kinetics.
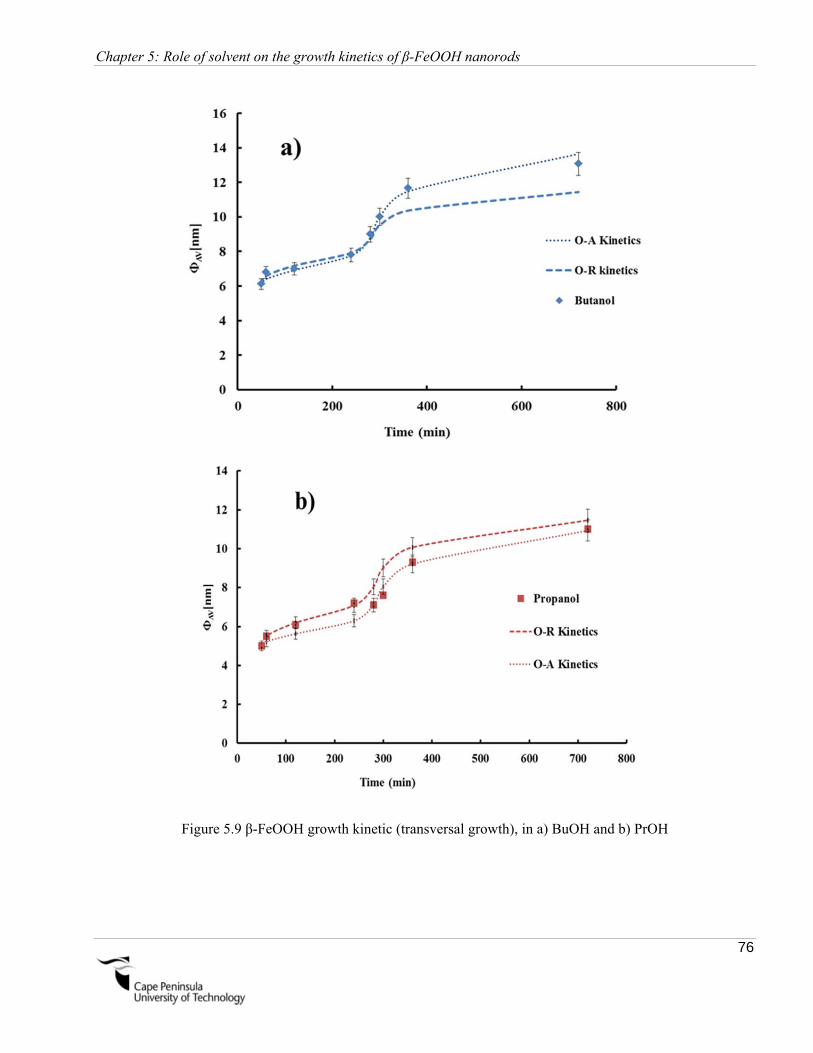
Chapter 5: Role of solvent on the growth kinetics of β-FeOOH nanorods
76
Figure 5.9 β-FeOOH growth kinetic (transversal growth), in a) BuOH and b) PrOH
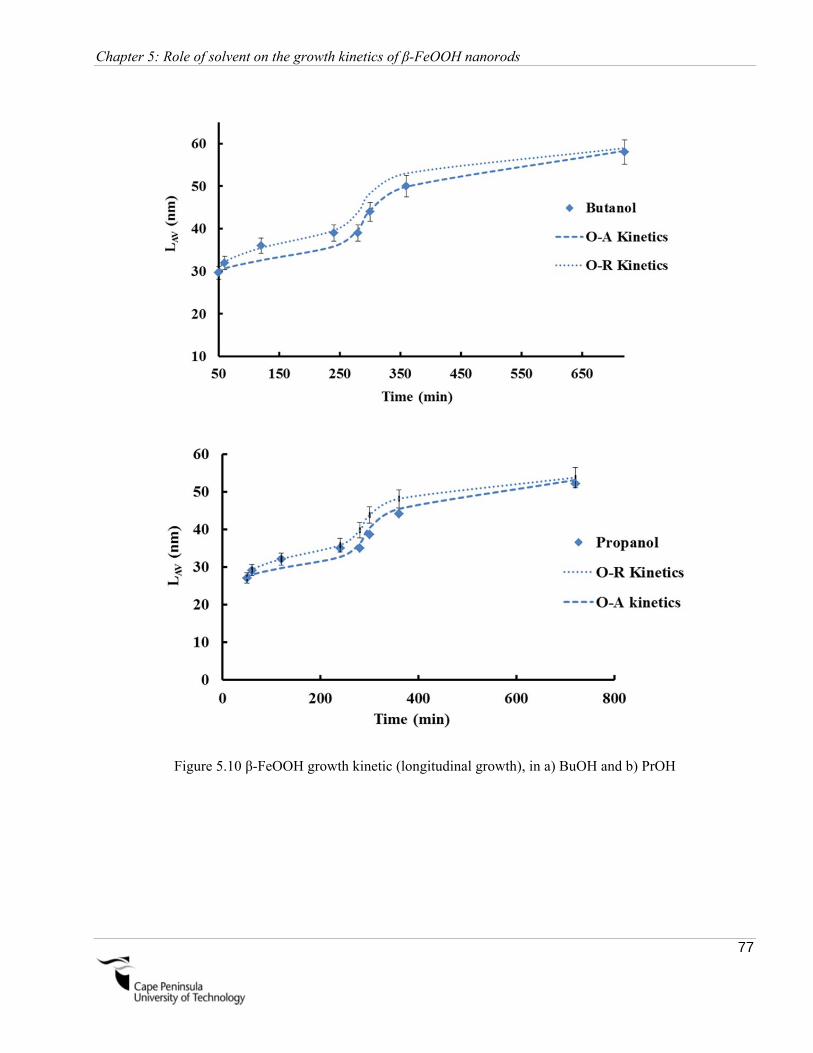
Chapter 5: Role of solvent on the growth kinetics of β-FeOOH nanorods
77
Figure 5.10 β-FeOOH growth kinetic (longitudinal growth), in a) BuOH and b) PrOH

Chapter 5: Role of solvent on the growth kinetics of β-FeOOH nanorods
78
Kinetic evaluation confirms the existence of OA growth, further validating the relationship between growth
mechanism and particle size distribution curve as discussed earlier in this chapter.
The rate constants, K, for both OR and OA kinetic together with the exponent, n, for OR kinetic were obtained
using multivariable regression and summarised in Table 5.6. The exponent, n for OR kinetics was found to be
~3 in all cases. A similar method was used by Kang and Yoon (1983). They concluded that this method gives
accurate analysis. It was found that the rate constant for longitudinal growth is significantly higher than
transversal growth for BuOH compared to PrOH as shown Table 5.6.
Table 5.6 Rate constants for both growth mechanisms
Solvent
KOR (min-1) KOR (min-1) KOA (min-1/3) KOA (min-1/3)
(Transversal
direction)
(Longitudinal
direction)
(Transversal
direction)
(Longitudinal
direction)
BuOH 0.12 0.66 0.0036 0.0026
PrOH 0.10 0.47 0.0035 0.0024
5.3.3.2 Effect of EtOH and MeOH on the growth kinetics of β-FeOOH nanorods
No distinctive growth stages were observed in EtOH and MeOH contrary to the observation in both BuOH and
PrOH. It can be seen from Figure 5.11 and 5.12 that both growth kinetics can be fitted to the data. The goodness
of fit was found to be R2>0.98 in all cases, postulating that both OR and OA kinetics occur simultaneously.
However OR kinetics was dominant over OA kinetics. The exponent, n for OR kinetics was found to be ~3 for
both cases implying precipitation/dissolution growth. The results are summarised in Table 5.7.

Chapter 5: Role of solvent on the growth kinetics of β-FeOOH nanorods
79
Figure 5.11 β-FeOOH growth kinetic (transversal growth), in a) EtOH and b) MeOH
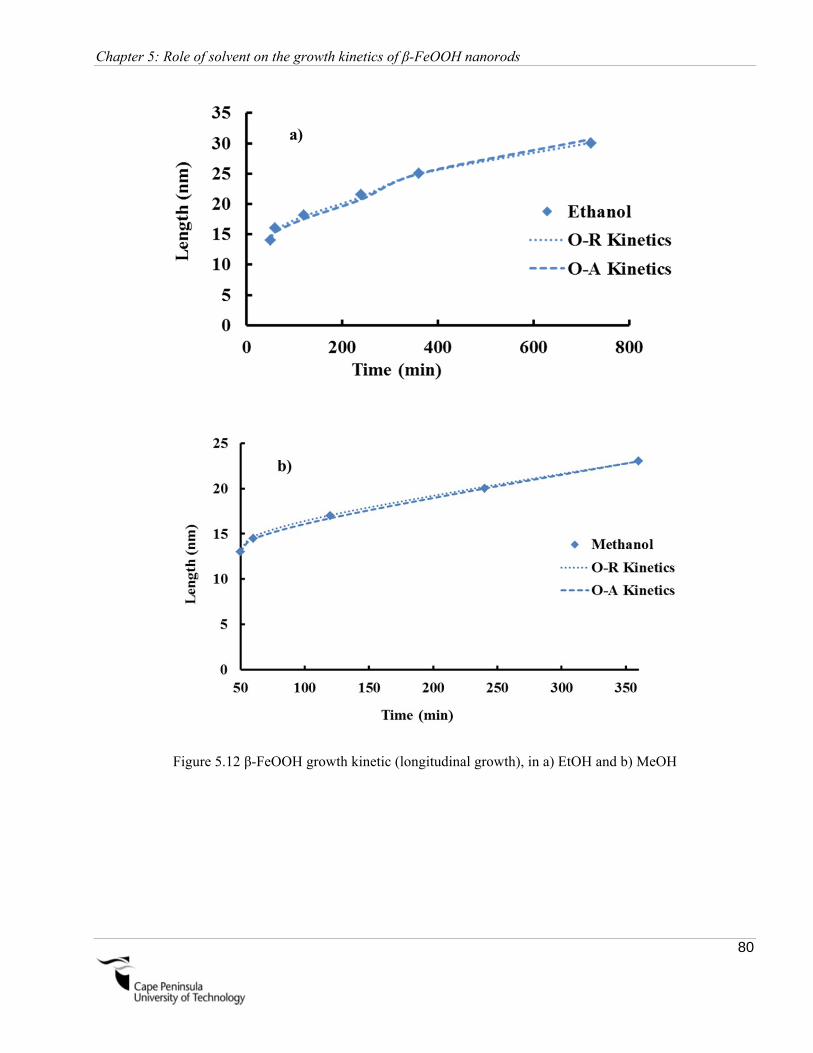
Chapter 5: Role of solvent on the growth kinetics of β-FeOOH nanorods
80
Figure 5.12 β-FeOOH growth kinetic (longitudinal growth), in a) EtOH and b) MeOH
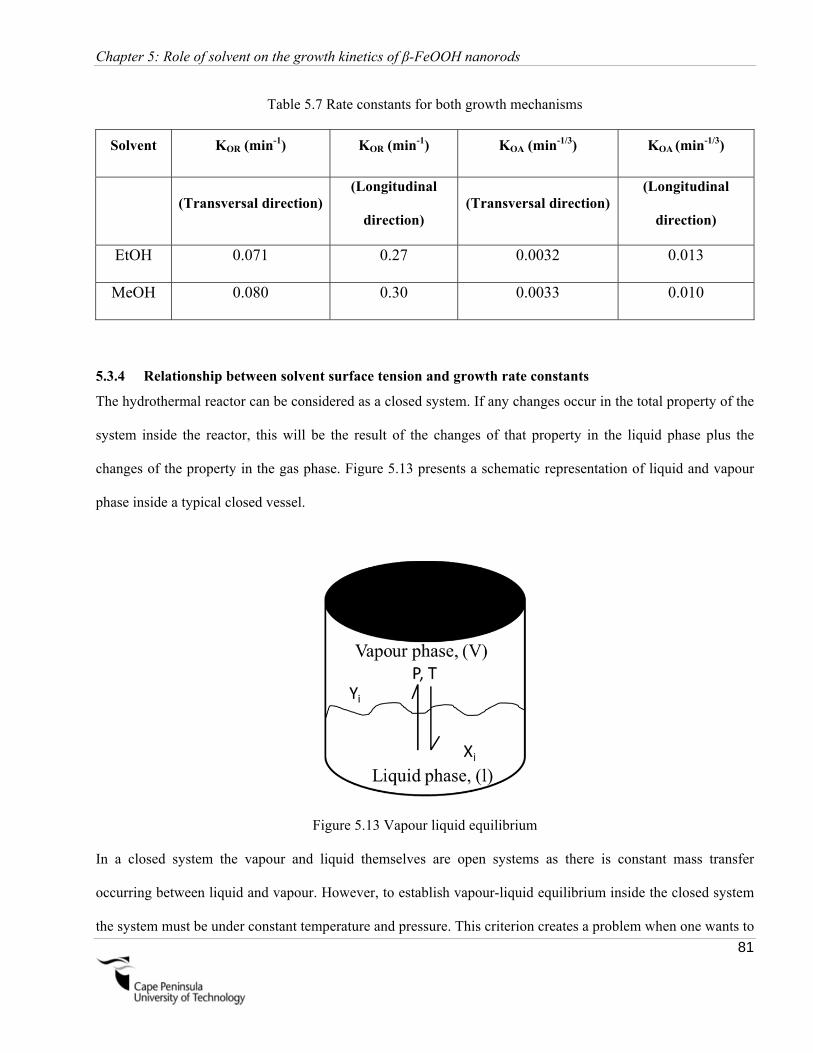
Chapter 5: Role of solvent on the growth kinetics of β-FeOOH nanorods
81
Table 5.7 Rate constants for both growth mechanisms
Solvent KOR (min-1) KOR (min-1) KOA (min-1/3) KOA (min-1/3)
(Transversal direction) (Longitudinal
direction) (Transversal direction)
(Longitudinal
direction)
EtOH 0.071 0.27 0.0032 0.013
MeOH 0.080 0.30 0.0033 0.010
5.3.4 Relationship between solvent surface tension and growth rate constants
The hydrothermal reactor can be considered as a closed system. If any changes occur in the total property of the
system inside the reactor, this will be the result of the changes of that property in the liquid phase plus the
changes of the property in the gas phase. Figure 5.13 presents a schematic representation of liquid and vapour
phase inside a typical closed vessel.
Figure 5.13 Vapour liquid equilibrium
In a closed system the vapour and liquid themselves are open systems as there is constant mass transfer
occurring between liquid and vapour. However, to establish vapour-liquid equilibrium inside the closed system
the system must be under constant temperature and pressure. This criterion creates a problem when one wants to
Chapter 5: Role of solvent on the growth kinetics of β-FeOOH nanorods
82
evaluate the actual liquid ratio of each component present in the mixture inside the reactor at a specific
temperature and time. This is due to the fluctuation of pressure inside the vessel. The physical properties of four
different alcohols and water are presented in Table 5.8. Vapour pressure values presented were calculated using
Antoine equation.
Table 5.8 Physical properties of alcohol and water at 100˚C
Compound Boiling point Pressure at 100˚C
MeOH 64.70 ˚C 258.00 kPa
EtOH 78.37 ˚C 225.90 kPa
PrOH 97.00 ˚C 110.46
BuOH 118.00 ˚C 52.30 kPa
Butanol has a higher boiling point than water, implying the presence of a higher concentration of butanol in
liquid phase (at 100˚C) compared to vapour phase inside the reactor at any given time. For MeOH – H2O, EtOH
– H2O and PrOH – H2O mixture systems H2O is the less volatile component. If a MeOH – H2O system is
considered, the following occurred inside the reactor:
As the temperature was raised to 64.7˚C, MeOH started to boil, slowly increasing the vapour pressure
inside the reactor. At this point the concentration of MeOH in liquid phase starts to drop.
The temperature rises quickly to 100˚C and at an intermediate temperature the concentration of water in
the vapour phase would also start to increase, further increasing the vapour pressure to ~377kPa.
At 377 kPa methanol vapour starts to condensate, hence increasing the concentration of methanol in
liquid phase. Typical pressure profile and the schematics of thermodynamic behaviour of the methanol
water system inside the reactor is presented in Figure 5.14 and 5.15 respectively.
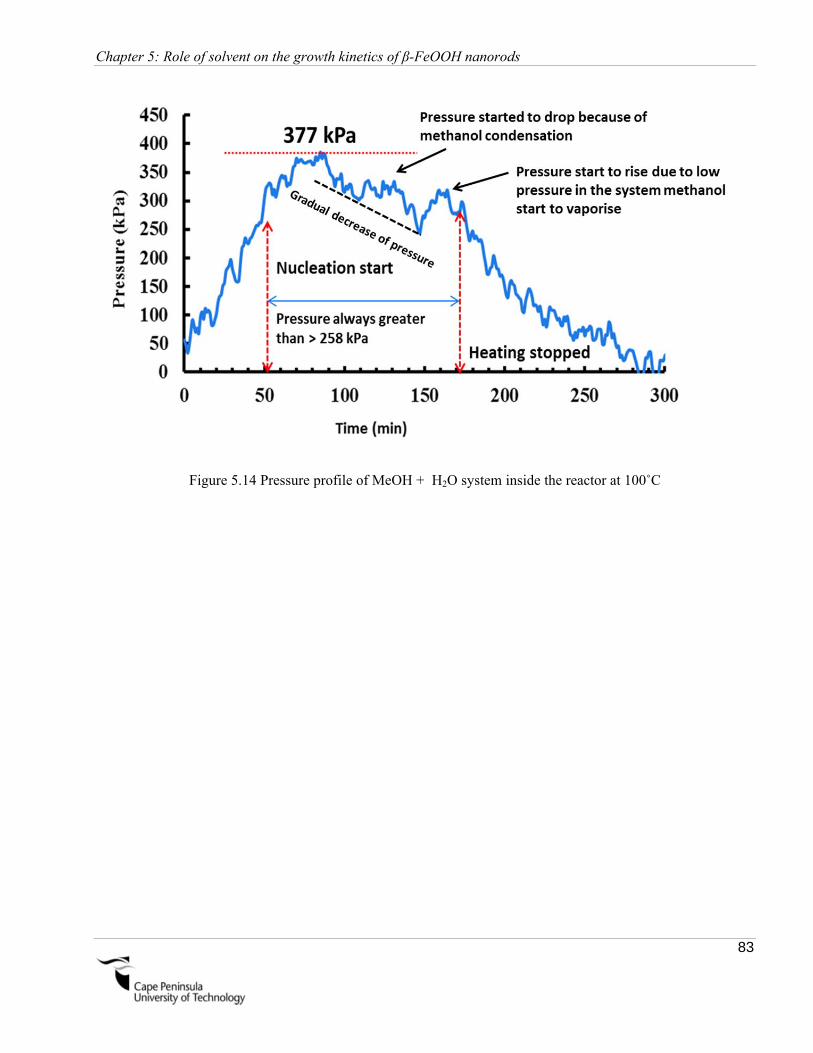
Chapter 5: Role of solvent on the growth kinetics of β-FeOOH nanorods
83
Figure 5.14 Pressure profile of MeOH + H2O system inside the reactor at 100˚C
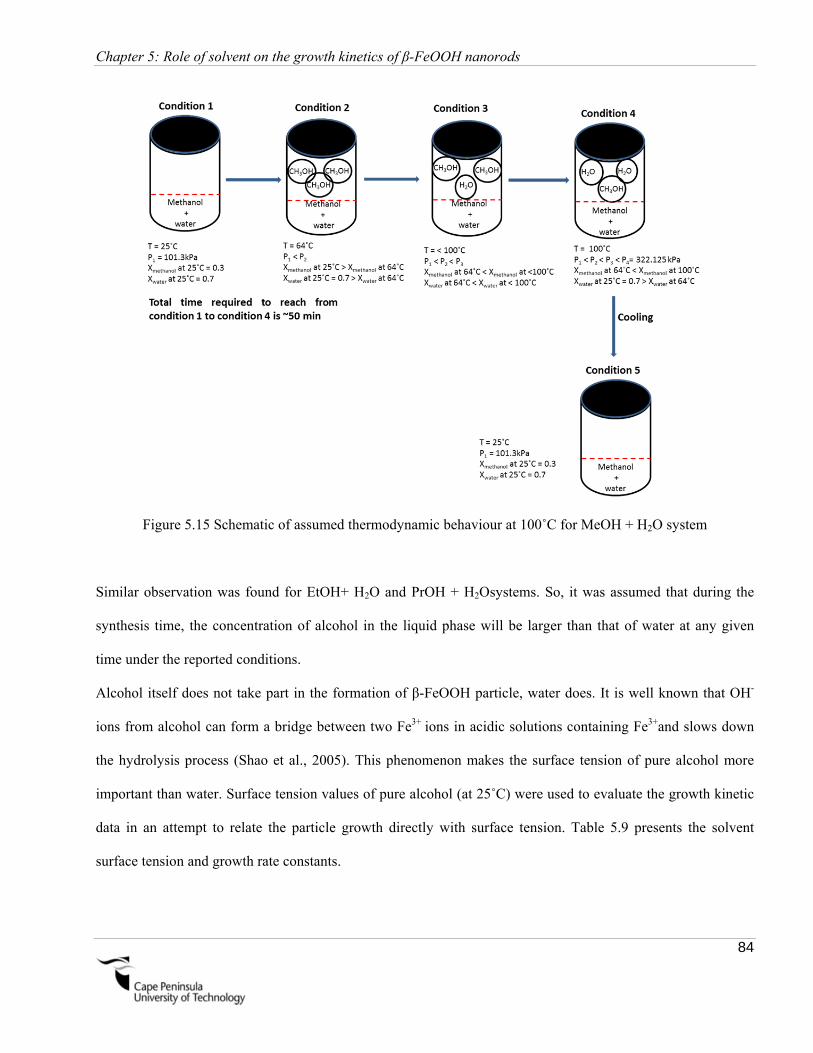
Chapter 5: Role of solvent on the growth kinetics of β-FeOOH nanorods
84
Figure 5.15 Schematic of assumed thermodynamic behaviour at 100˚C for MeOH + H2O system
Similar observation was found for EtOH+ H2O and PrOH + H2Osystems. So, it was assumed that during the
synthesis time, the concentration of alcohol in the liquid phase will be larger than that of water at any given
time under the reported conditions.
Alcohol itself does not take part in the formation of β-FeOOH particle, water does. It is well known that OH-
ions from alcohol can form a bridge between two Fe3+ ions in acidic solutions containing Fe3+and slows down
the hydrolysis process (Shao et al., 2005). This phenomenon makes the surface tension of pure alcohol more
important than water. Surface tension values of pure alcohol (at 25˚C) were used to evaluate the growth kinetic
data in an attempt to relate the particle growth directly with surface tension. Table 5.9 presents the solvent
surface tension and growth rate constants.

Chapter 5: Role of solvent on the growth kinetics of β-FeOOH nanorods
85
Table 5.9 Surface tension values of alcohol
Solvent σ (mnm-1) (100% alcohol at 25˚C) σ (mnm-1) (50% alcohol water at 50˚C)
Methanol 22.75 30.28
Ethanol 22.27 25.78
Propanol 23.70 22.30
Butanol 24.70 20.00
The relationship between solvent surface tension and growth rate constants are exponential and independent of
the direction of growth, as can be seen from Figure 5.16, approving of the initial hypothesis. The validity of the
relationship was checked further by conducting an independent study under identical conditions using octanol
as solvent and presented in Figure 5.17.It can be seen from Figure 5.17 that the data generated by independent
study follows the similar trend as reported in this work, thus further highlighting the validity of the relationship
between surface tension and particle growth. Only KOR was used to evaluate the relationship between surface
tension and particle growth due to the higher significance of KOR than KOA.
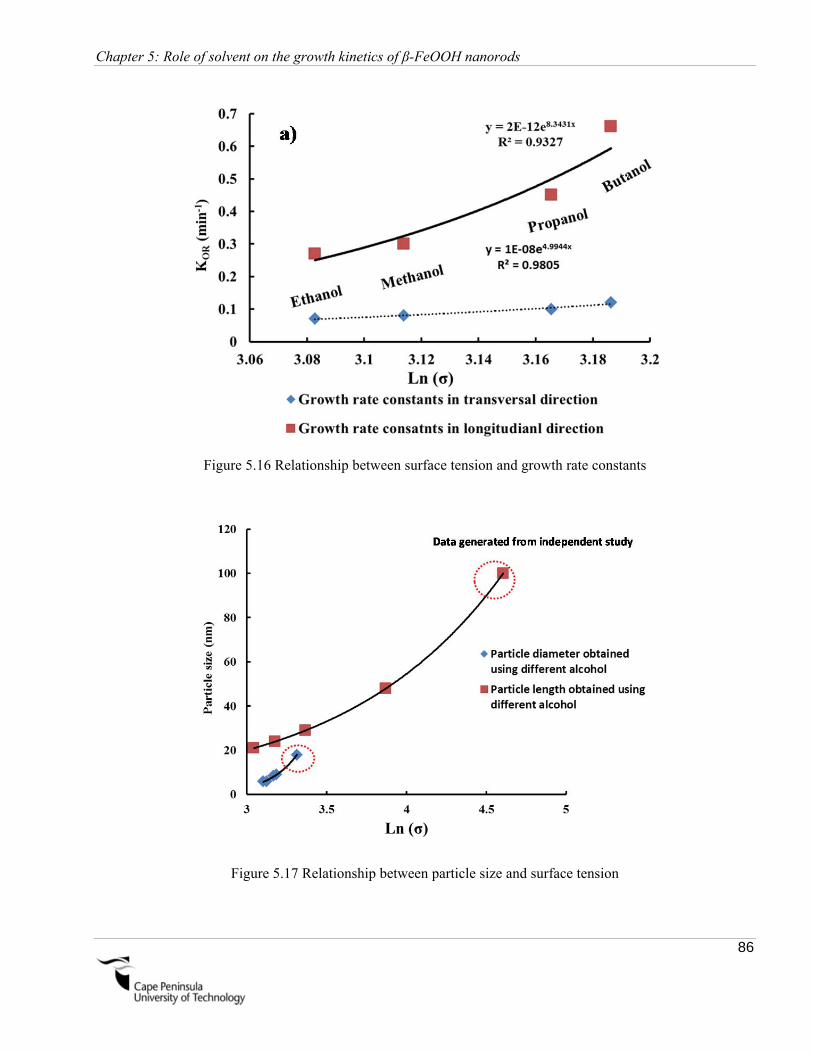
Chapter 5: Role of solvent on the growth kinetics of β-FeOOH nanorods
86
Figure 5.16 Relationship between surface tension and growth rate constants
Figure 5.17 Relationship between particle size and surface tension

Chapter 5: Role of solvent on the growth kinetics of β-FeOOH nanorods
87
5.5 Conclusion
Solvent dependent growth kinetics of β-FeOOH nanorods was reported. Shape of the particle size distribution
curve was evaluated to identify the growth mechanism of the particles. Two stage growth curve was reported
for the first time for β-FeOOH particles. A quantitative relationship between growth rate constants and alcohol
solvent surface tension was established and later validated. Although the relationship between the alcohol
surface tension and rate constants was established at room temperature a clear dependence is demonstrated in
this work.

88

Chapter 6: Prediction of hydrothermally synthesised solvent-dependent β-FeOOH nanorod sizes
89
Chapter 6
Prediction of hydrothermally synthesised solvent-dependent β-FeOOH nanorod sizes
6.1 Introduction
A wide range of hydrothermal synthesis process parameters were evaluated to determine the boundaries for
β-FeOOH precipitation in order to develop a generalized correlation for nanorod size prediction.
6.2 Experimental methodology
The effect of alcoholic solvents, as a function of (a) FeCl3 concentration, (b) nature of anion in the iron
precursor and (c) reaction temperature, on the particle morphology is reported in this section. The process
parameters are summarised in Table 6.1.

Chapter 6: Prediction of hydrothermally synthesised solvent-dependent β-FeOOH nanorod sizes
90
Table 6.1 HS processing variables

Chapter 6: Prediction of hydrothermally synthesised solvent-dependent β-FeOOH nanorod sizes
91
6.3 Results and discussion
6.3.1 Effect of FeCl3 concentration
6.3.1.1 Structural evolution of particles
Pure crystalline β-FeOOH particles were synthesised regardless of the nature of solvent used over an FeCl3
concentration range of 0.05 — 0.7M as shown in Figure 6.1.
Figure 6.1 XRD patterns of the particles synthesised
6.3.1.2 Morphological evolution of particles in BuOH
Variation of FeCl3 concentrations in BuOH has a marked effect on the morphology of akaganeite particles as
shown in Figure 6.2.
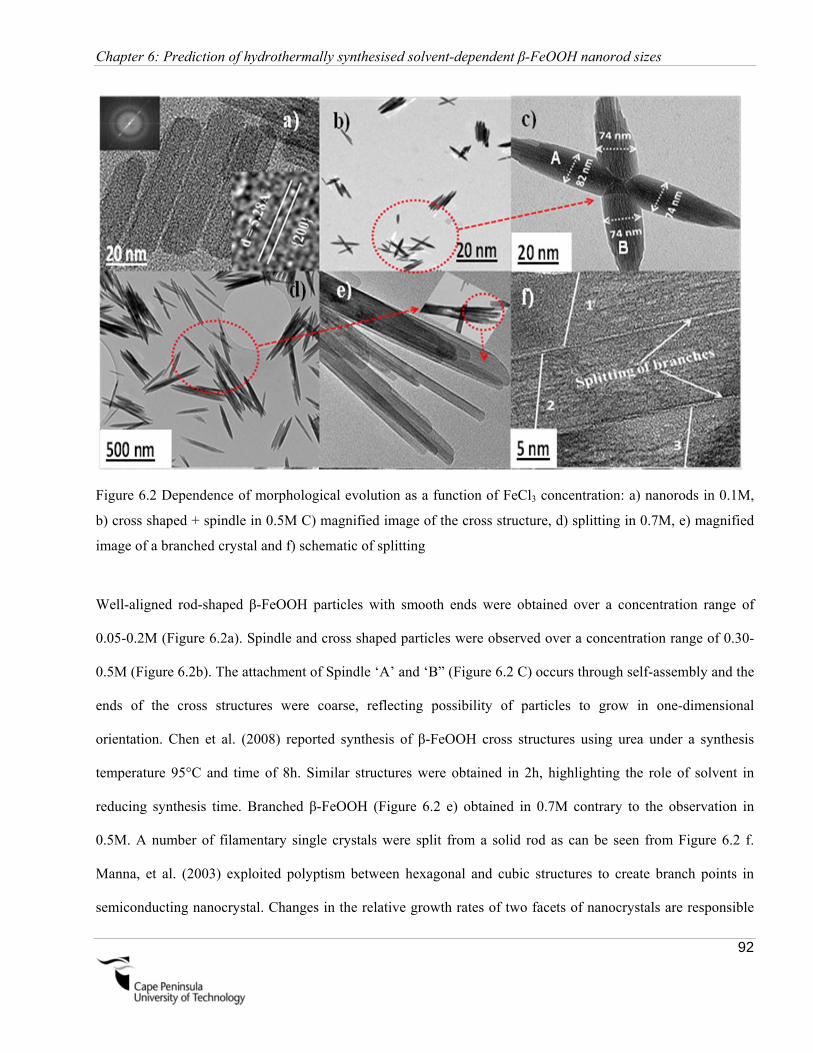
Chapter 6: Prediction of hydrothermally synthesised solvent-dependent β-FeOOH nanorod sizes
92
Figure 6.2 Dependence of morphological evolution as a function of FeCl3 concentration: a) nanorods in 0.1M,
b) cross shaped + spindle in 0.5M C) magnified image of the cross structure, d) splitting in 0.7M, e) magnified
image of a branched crystal and f) schematic of splitting
Well-aligned rod-shaped β-FeOOH particles with smooth ends were obtained over a concentration range of
0.05-0.2M (Figure 6.2a). Spindle and cross shaped particles were observed over a concentration range of 0.30-
0.5M (Figure 6.2b). The attachment of Spindle ‘A’ and ‘B” (Figure 6.2 C) occurs through self-assembly and the
ends of the cross structures were coarse, reflecting possibility of particles to grow in one-dimensional
orientation. Chen et al. (2008) reported synthesis of β-FeOOH cross structures using urea under a synthesis
temperature 95°C and time of 8h. Similar structures were obtained in 2h, highlighting the role of solvent in
reducing synthesis time. Branched β-FeOOH (Figure 6.2 e) obtained in 0.7M contrary to the observation in
0.5M. A number of filamentary single crystals were split from a solid rod as can be seen from Figure 6.2 f.
Manna, et al. (2003) exploited polyptism between hexagonal and cubic structures to create branch points in
semiconducting nanocrystal. Changes in the relative growth rates of two facets of nanocrystals are responsible

Chapter 6: Prediction of hydrothermally synthesised solvent-dependent β-FeOOH nanorod sizes
93
for splitting (Tang & Alivisatos, 2006). Controlling precursor solution in BuOH resulted in artificial crystal
splitting in β-FeOOH particles, which has not been reported before to our best knowledge. Split β-FeOOH
might find applications where a larger surface area is required, owing to the fact that each filament possesses a
different surface area. This makes the total surface area per single crystal very large compared to a solid single
crystal only. Splitting is only possible if the oversaturation exceeds a certain ‘critical’ level (Tang & Alivisatos,
2006). 0.7M was found to be the critical limit in this study. Tang and Alivisatos (2006) reported that the
splitting of crystal is favoured in situations where the organic surfactant is a very potent surface stabiliser and
where at equilibrium the balance of bulk and surface energies dictates a particular crystal size. At lower
temperature, when few nuclei form, fast growth can lead to a situation of metastability, where crystals grow
beyond this size. It is then thermodynamically favourable for a large crystal to split, because of the strong
adhesion of the surfactant to the newly created surface. Surface adsorption was shown as an important factor in
controlling crystal growth stages (Huang et al., 2003). However, no surfactant was used in this study. So it can
be postulated that the morphological evolution were merely due to the presence of butanol. A summary of the
findings are presented in Table 6.2.

Chapter 6: Prediction of hydrothermally synthesised solvent-dependent β-FeOOH nanorod sizes
94
Table 6.2 Effect FeCl3 concentrations on β-FeOOH particle characteristics in BuOH
FeCl3 Conc.
(M)
ᶲAV(nm) LAV (nm) Phase Morphology Average
aspect ratio
0.05 9 ± 1 42 ± 5 β-
FeOOH
Rods 5
0.01 10 ± 1 50 ± 7 β-
FeOOH
Rods 5
0.2 14 ± 2 68 ± 10 β-
FeOOH
Rods 5
0.3 22 ± 4 194 ± 11 β-
FeOOH
Spindle 9
*0.5 40 ± 1 406 ± 13 β-
FeOOH
Coarse spindle +
cross structure
10
*0.7 93 ± 90 780 ± 17 β-
FeOOH
Branched
spindle+cross
structure
8
*ᶲAV and LAV presented are for spindle shaped particles only

Chapter 6: Prediction of hydrothermally synthesised solvent-dependent β-FeOOH nanorod sizes
95
6.3.1.3 Morphological evolution of β-FeOOH particles in PrOH
The effect of FeCl3 concentration in propanol is illustrated in Figure 6.3.
Figure 6.3 Dependence of morphological evolution as s function of FeCl3 concentration: a) nanorods in 0.1M,
b) spindle in 0.5M, C) no sign of splitting in 0.7M, d) rectangular particles in 0.7M.
Rod-like particles (Figure 6.3 a) were obtained at concentration ranging from 0.1 – 0.3M,which evolved into a
mixture of spindle (Figure 6.3 b), somatoidal (Figure 6.3 c)and rectangular particles (Figure 6.3 d) at high
concentrations. To our best knowledge, no studies have previously reported on the observation of rectangular
β-FeOOH. A summary of the findings are presented in Table 6.3.

Chapter 6: Prediction of hydrothermally synthesised solvent-dependent β-FeOOH nanorod sizes
96
Table 6.3 Effect FeCl3 concentrations on β-FeOOH particle characteristics in PrOH
[FeCl3] Conc.
(M)
ᶲAV(nm) LAV (nm) Phase Morphology Average
aspect ratio
0.05 9±1 29±5 β-
FeOOH
Rods 3
0.01 10±2 35±7 β-
FeOOH
Rods 4
0.2 12±2 50±11 β-
FeOOH
Rods 4
0.3 15±3 74±12 β-
FeOOH
Spindle+somatoidal 5
*0.5 30±5 121±13 β-
FeOOH
Spindle+somatoidal 6
*0.7 65±9 350±17 β-
FeOOH
Spindle+somatoidal+rectangular 5
*ᶲAV and LAV presented are for spindle shaped particles only
6.3.1.4 Morphological evolution of β-FeOOH particles in EtoH and MeOH
The morphologies obtained as a function of FeCl3 concentrations in EtOH and MeOH are shown in Figure 6.4.
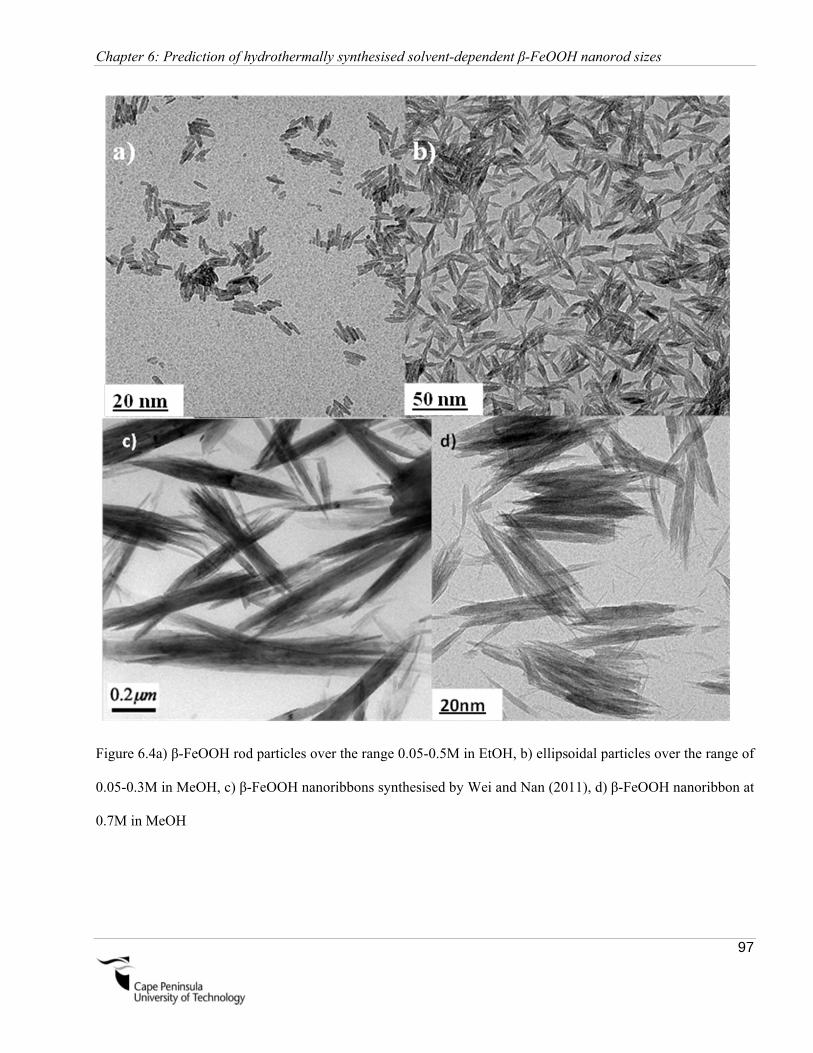
Chapter 6: Prediction of hydrothermally synthesised solvent-dependent β-FeOOH nanorod sizes
97
Figure 6.4a) β-FeOOH rod particles over the range 0.05-0.5M in EtOH, b) ellipsoidal particles over the range of
0.05-0.3M in MeOH, c) β-FeOOH nanoribbons synthesised by Wei and Nan (2011), d) β-FeOOH nanoribbon at
0.7M in MeOH

Chapter 6: Prediction of hydrothermally synthesised solvent-dependent β-FeOOH nanorod sizes
98
Rod particles (Figure 6.4a) were obtained over the concentration range of 0.05 – 0.5M and particles with no
definite structures were formed at 0.7M in ethanol. Ellipsoidal / spindle shaped particles were synthesised over
the range of 0.05 – 0.5M,which evolved into β-FeOOH nanoribbons (Figure 6.4 d) at 0.7M in methanol.
Surfactant-assisted synthesis of β-FeOOH nanoribbons (Figure 6.4 c) was reported in the literature (Wei & Nan,
2011).Surfactant free synthesis of β-FeOOH nanoribbons have not been reported before to our best knowledge.
However, the formation mechanism needs to be further evaluated. A summary of the findings are presented in
Table 6.4 and 6.5.
Table 6.4 Effect FeCl3 concentrations on β-FeOOH particle characteristics in EtOH
[FeCl3] Conc.
(M)
ᶲAVnm) LengthAV (nm) Phase Morphology Average
aspect ratio
0.05 6 ± 2 24 ± 8 β-FeOOH Rods 4
0.01 7 ± 2 29 ± 8 β-FeOOH Rods 4
0.2 8 ± 2 35 ± 11 β-FeOOH Rods 4
0.3 10 ±2 52 ± 18 β-FeOOH Rods 5
0.5 13 ± 2 75 ± 12 β-FeOOH Rods 3
0.7 - - β-FeOOH - -

Chapter 6: Prediction of hydrothermally synthesised solvent-dependent β-FeOOH nanorod sizes
99
Table 6.5 Effect FeCl3 concentrations on β-FeOOH particle characteristics in MeOH
[FeCl3] Conc.
(M)
ᶲAv(nm) LengthAV(nm) Phase Morphology Average
aspect ratio
0.05 6 ± 1 21 ± 8 β-FeOOH Ellipsoidal / spindle 4
0.01 6 ± 2 23 ± 8 β-FeOOH Ellipsoidal / spindle 4
0.2 7 ± 2 35 ± 11 β-FeOOH Ellipsoidal / spindle 5
0.3 9 ± 3 42 ± 18 β-FeOOH Ellipsoidal / spindle 5
0.5 12 ± 4 50 ± 12 β-FeOOH Ellipsoidal / spindle 4
0.7 - - β-FeOOH Nanoribbon -
6.3.2 Effect of anions on the particle characteristics
Dependency of particle morphology and phase as a function of anions is presented in Figure 6.5.

Chapter 6: Prediction of hydrothermally synthesised solvent-dependent β-FeOOH nanorod sizes
100
Figure 6.5 Structural evolution of particles as a function of anions, a & b) irregular shaped hematite using NO3-
in butanol and methanol, b) XRD of particles synthesised using NO3- anions, d) irregular shaped hydronium
iron jarosite using SO42- and e) XRD for hydronium iron jarosite

Chapter 6: Prediction of hydrothermally synthesised solvent-dependent β-FeOOH nanorod sizes
101
Irregularly shaped aggregated particles, independent of the nature of the solvent used, were produced when
Fe(NO3)3 was used as a precursor salt (Figure 6.5 a & b).The XRD pattern (Figure 6.5 c) of the synthesised
sample matches the standard diffraction patterns of α-Fe2O3 (JCPDS card no. 33-0664) in contradiction to the
finding by Yue et al., 2011. They reported formation of spherical α-FeOOH particles (JCPDS card no: 81 -
0464) under atmospheric pressure.
Replacing the NO3- with SO4
2-anions resulted in dispersed particles with no defined structure (Figure 6.5d). The
XRD patterns (Figure 6.5 e) could be assigned to the rhombohedral single phase of hydronium iron jarosite,
H3O.Fe3(SO4)2(OH)6, (JCPDS card no. (021 – 0932) with lattice constants of a = b = 7.3559A˚, c = 17.0100 A˚
, α = β = 90o and γ = 120˚. The colour of the powder is golden yellow, which is the typical colour of hydronium
jarosite. High intensity peaks in the XRD patterns indicate that the synthesised hydronium iron jarosite is well
crystalline. HS of hydronium iron jarosite reported by Earle et al. (1999) used 3days compared to 2h reported in
this study. It is reported that hydronium iron jarosite forms in an acidic medium (pH ~2). The only modification
done in the synthesis was dropwise addition of NH4OH to keep the precursor solution at pH ~2 prior to heating,
resulted in a 98% reduction of synthesis time.
Figure 6.6 shows particles (due to phase change) obtained when FeCl3, Fe(NO3)3 and Fe2(SO4)3 were used
respectively. Single phase hydronium iron jarosite could not be synthesised without the presence of alcohol.
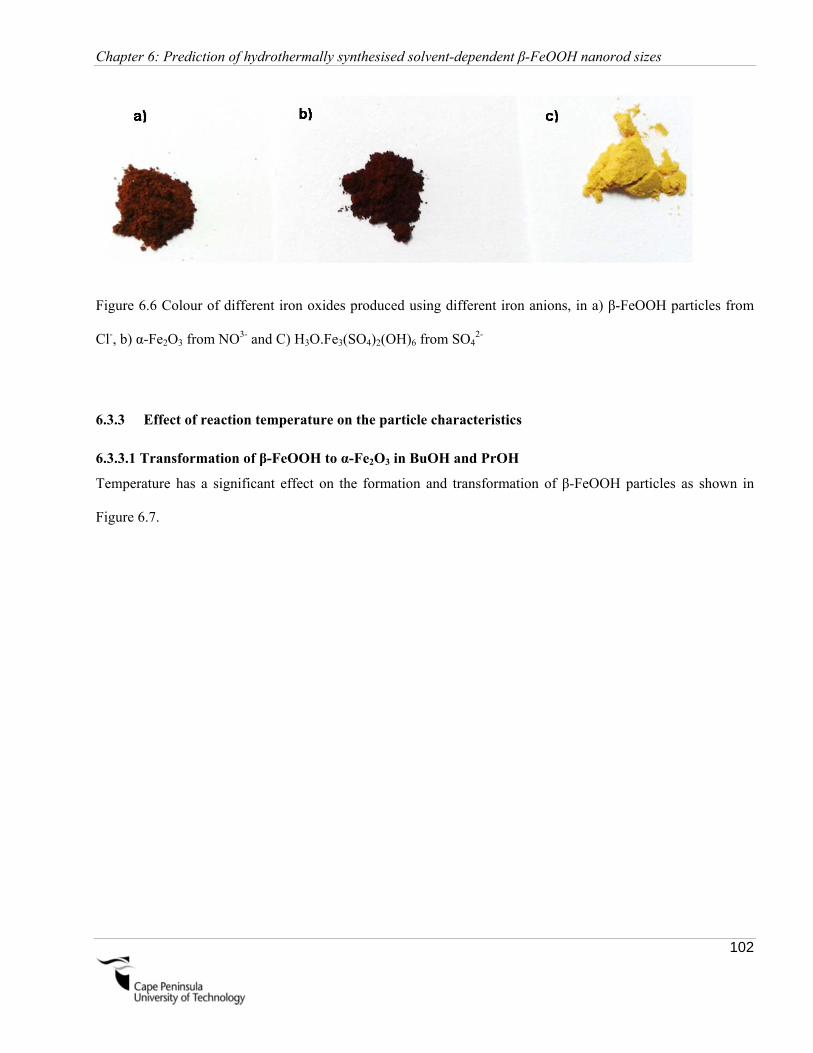
Chapter 6: Prediction of hydrothermally synthesised solvent-dependent β-FeOOH nanorod sizes
102
Figure 6.6 Colour of different iron oxides produced using different iron anions, in a) β-FeOOH particles from
Cl-, b) α-Fe2O3 from NO3- and C) H3O.Fe3(SO4)2(OH)6 from SO42-
6.3.3 Effect of reaction temperature on the particle characteristics
6.3.3.1 Transformation of β-FeOOH to α-Fe2O3 in BuOH and PrOH
Temperature has a significant effect on the formation and transformation of β-FeOOH particles as shown in
Figure 6.7.

Chapter 6: Prediction of hydrothermally synthesised solvent-dependent β-FeOOH nanorod sizes
103
Figure 6.7 Reaction products obtained at different temperatures: a) β-FeOOH nanorods at 100°C, b) self-
assembly of nanorods at 135°C, c) formation of α-Fe2O3 and pseudo cube at 135°C, d) d-spacing and SAED
patterns of the nanorods at 135°C and e) α-Fe2O3 pseudo cubes and rhombohedral particles at 150°C.
Well crystalline β-FeOOH nanorods were synthesised in a temperature range of 90 – 120°C (Figure 6.7 a).
The average crystal diameters and lengths increases with increasing temperature. Figures 6.7 (b – e) chart
the transformation from an intermediate phase of β-FeOOH to a well-defined phase of α-Fe2O3. At 135°C
there is enough surface energy available for the nanorods to initiate fusing, resulting in the self-assembly of
the β-FeOOH nanorods. The d-spacing and the SAED patterns of the nanorods and pseudo cubes observed
at 135°C are presented in Figure 6.7d, which matches well with the standard akaganeite and α-Fe2O3
patterns. Both β-FeOOH and α-Fe2O3 peaks were observed in the XRD pattern as presented in Figure 6.8,

Chapter 6: Prediction of hydrothermally synthesised solvent-dependent β-FeOOH nanorod sizes
104
complimenting the observations in TEM. Quantification of the two phases (Figure 6.9) shows that 60% of
the peaks in the XRD pattern represent α-Fe2O3 and the rest is β-FeOOH. Pure α-Fe2O3 particles were
obtained at 150˚C. The results are summarised in Table 6.6.
Figure 6.8 XRD patterns of the particles

Chapter 6: Prediction of hydrothermally synthesised solvent-dependent β-FeOOH nanorod sizes
105
Figure 6.9 Phase quantification of the particles at 135°C

Chapter 6: Prediction of hydrothermally synthesised solvent-dependent β-FeOOH nanorod sizes
106
Table 6.6 Effect of temperature on the particle characteristics
Solvent Temperature ᶲAV(nm) LAV (nm) Phase Morphology Average
aspect
ratio
Bu
OH
90 5 ±3 25 ± 5 β-
FeOOH
Rods 5
100 9 ± 5 38± 8 β-
FeOOH
Rods 4
120 12± 5 53 ± 8 β-
FeOOH
Rods 4
135 10± 8 71 ± 10 β-
FeOOH
Rods + pseudo cube 7
150 1200 ± 70 - α-Fe2O3 Pseudo cube -
PrO
H
90 4 ± 3 19 ± 3 β-
FeOOH
Rods 5
100 7 ±5 29 ± 5 β-
FeOOH
Rods 4
120 10 ± 5 46 ± 6 β-
FeOOH
Rods 5
135 8±6 58 ± 10 β-
FeOOH
Rods + pseudo cube 7
150 1168±90 - α-Fe2O3 Pseudo cube -

Chapter 6: Prediction of hydrothermally synthesised solvent-dependent β-FeOOH nanorod sizes
107
6.3.3.2 Transformation of β-FeOOH to α-Fe2O3 in EtOH and MeOH
Structural evolution of particles as a function of temperature in EtOH and MeOH is illustrated in Figure 6.10.
Figure 6.10 Morphological evolution of particles as a function of temperature, in a) self-assembly of the
β-FeOOH at 120°C in ethanol, b) d-spacing and SAED of nanorods at 120°C, c) pseudo cubes at 135˚C
Pure β-FeOOH rod shaped particles could not be obtained at temperature higher than 100°C in EtOH and
MeOH contrary to particles synthesised in BuOH and PrOH. Fusing of nanoparticles (Figure 6.10 a) followed
by subsequent transformation of β-FeOOH to α-Fe2O3 starts at 120˚C in EtOH oppose to 135˚C in BuOH and
PrOH. The β-FeOOH rods present at this temperature are well crystalline as can be seen from the d-spacing and
SAED of the nanorods. Figure 6.11 presents phase quantification of the particles, indicating that at 120˚C 41%
of β-FeOOH has already been converted to α-Fe2O3. All the akaganeite particles were converted to large α-
Fe2O3 particles at 150°C. A 100% conversion of β-FeOOH to α-Fe2O3was obtained at temperatures higher than
100˚C in MeOH. A summary of the findings are presented in Table 6.7.

Chapter 6: Prediction of hydrothermally synthesised solvent-dependent β-FeOOH nanorod sizes
108
Figure 6.11 Phase quantification of the particles synthesised in EtOH at 135°C
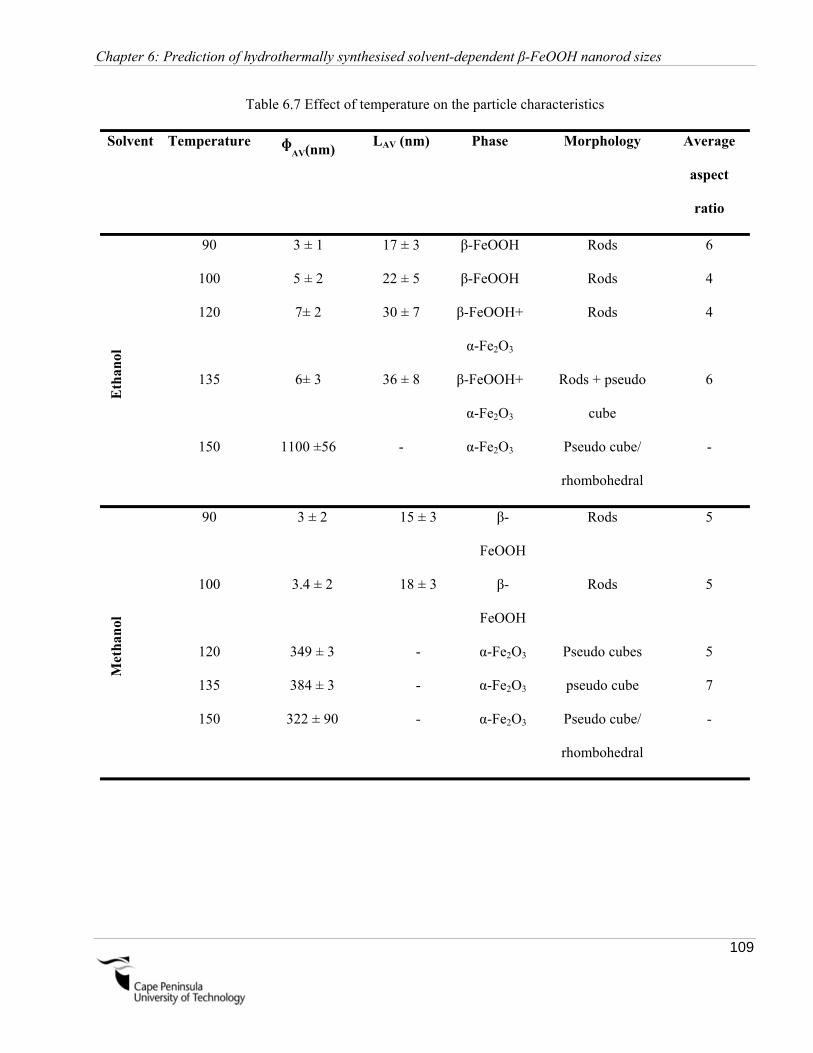
Chapter 6: Prediction of hydrothermally synthesised solvent-dependent β-FeOOH nanorod sizes
109
Table 6.7 Effect of temperature on the particle characteristics
Solvent Temperature ᶲAV(nm) LAV (nm) Phase Morphology Average
aspect
ratio
Eth
anol
90 3 ± 1 17 ± 3 β-FeOOH Rods 6
100 5 ± 2 22 ± 5 β-FeOOH Rods 4
120 7± 2 30 ± 7 β-FeOOH+
α-Fe2O3
Rods 4
135 6± 3 36 ± 8 β-FeOOH+
α-Fe2O3
Rods + pseudo
cube
6
150 1100 ±56 - α-Fe2O3 Pseudo cube/
rhombohedral
-
Met
han
ol
90 3 ± 2 15 ± 3 β-
FeOOH
Rods 5
100 3.4 ± 2 18 ± 3 β-
FeOOH
Rods 5
120 349 ± 3 - α-Fe2O3 Pseudo cubes 5
135 384 ± 3 - α-Fe2O3 pseudo cube 7
150 322 ± 90 - α-Fe2O3 Pseudo cube/
rhombohedral
-

Chapter 6: Prediction of hydrothermally synthesised solvent-dependent β-FeOOH nanorod sizes
110
6.3.4 Role of alcohol on the dehydration properties of β-FeOOH particles
Thermal stability of β-FeOOH particles were evaluated using TGA (Figure 6.12 a), performed up to 300°C.
β-FeOOH particles, lose 12%, 14%, 15% and 18% of mass at 300˚C, synthesised in BuOH, PrOH, EtOH and
MeOH respectively. The % mass loss, as shown in Figure 6.12 b, is linearly dependent on the number of carbon
present in the linear alkyl chain of the solvent. Verdon et al. (1995) have reported that EtOH enhanced the
dehydration properties of the CeO2 nanocrystallite. The improvement of dehydration of akaganeite
nanoparticles with increasing carbon number is related azeotrope formation. MeOH – H2O does not form any
azeotrope, however EtOH - H2O, PrOH - H2O and BuOH - H2O form azeotrope, increasing the dehydration
properties of the synthesised akaganeite nanoparticles. However, the underlying mechanism has to be further
evaluated.
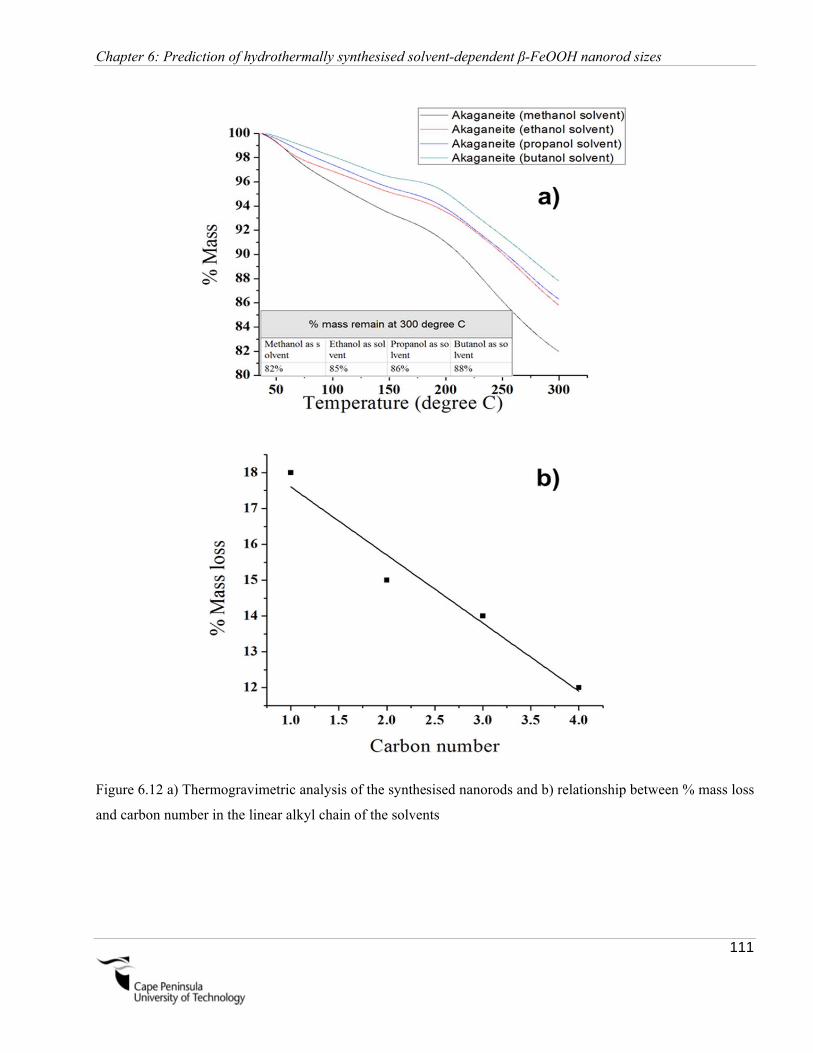
Chapter 6: Prediction of hydrothermally synthesised solvent-dependent β-FeOOH nanorod sizes
111
Figure 6.12 a) Thermogravimetric analysis of the synthesised nanorods and b) relationship between % mass loss
and carbon number in the linear alkyl chain of the solvents

Chapter 6: Prediction of hydrothermally synthesised solvent-dependent β-FeOOH nanorod sizes
112
6.3.5 Magnetic properties of the β-FeOOH nanorods
The magnetic properties of the β-FeOOH nanorods were measured in lightly compressed powders using an
Oxford Instruments Vibrating Sample Magnetometer (VSM) from 4 to 290 K and with a sensitivity of 50
emu.As prepared β-FeOOH nanorods do not show ferromagnetism at any temperature down to 4 K but they
have a high positive linear susceptibility of about 1.3x10⁻³ constant up to 5 T, giving a magnetic moment per
unit mass of about 1 – 1.5 Am2/kg at 5 T (Figure 6.13). The zero field cooled curve measured (inset Figure
6.13) at 100 mT does not show a blocking temperature, which is different from previous measurements in long
akaganeite amorphous nanowires (Zhang et al., 2006). This high susceptibility and the absence of a
ferromagnetic phase at low temperatures are probably due to the small size of the particles and the presence of
anti-ferromagnetic interactions. However solvent nature had no effect on the magnetic properties of the
β-FeOOH particles.
Figure 6.13 Magnetic moment per unit mass of the β-FeOOH nanoparticles in fields up to 5 T. The samples
have a large linear susceptibility without hysteresis down to 4 K. Inset: zero field cooled curve measured at
100 mT
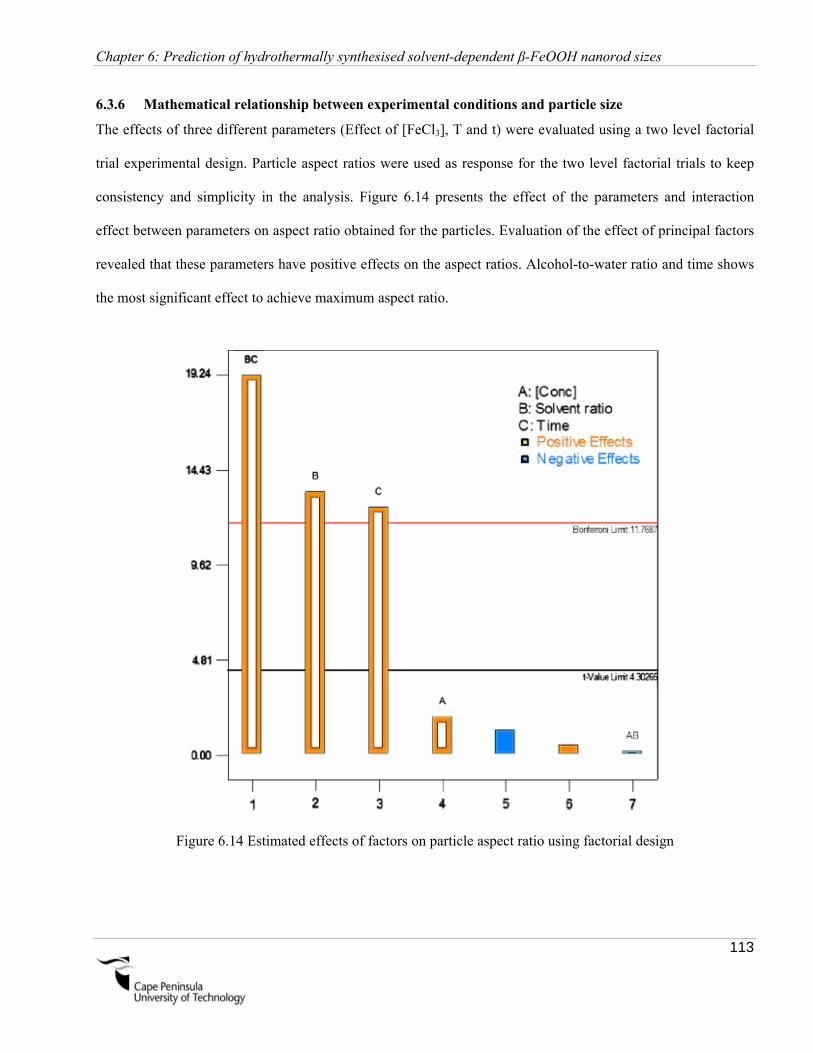
Chapter 6: Prediction of hydrothermally synthesised solvent-dependent β-FeOOH nanorod sizes
113
6.3.6 Mathematical relationship between experimental conditions and particle size
The effects of three different parameters (Effect of [FeCl3], T and t) were evaluated using a two level factorial
trial experimental design. Particle aspect ratios were used as response for the two level factorial trials to keep
consistency and simplicity in the analysis. Figure 6.14 presents the effect of the parameters and interaction
effect between parameters on aspect ratio obtained for the particles. Evaluation of the effect of principal factors
revealed that these parameters have positive effects on the aspect ratios. Alcohol-to-water ratio and time shows
the most significant effect to achieve maximum aspect ratio.
Figure 6.14 Estimated effects of factors on particle aspect ratio using factorial design

Chapter 6: Prediction of hydrothermally synthesised solvent-dependent β-FeOOH nanorod sizes
114
A generalized correlation is proposed based on the significance of effects of the parameters and relationship
between solvent surface tension and particle characteristics on the particle growth.
Ai Ai iAj
ijiio εXiXjβXββY Equation 6.1
Where, Y, is the predicted response (aspect ratio in this case), Xi, the un-coded or coded values of the factors
(concentration denoted by A, % alcohol to water ratio is denoted by B and time is denoted by C), oβ , a
constant, σ, the surface tension of alcohol used, iβ , the main effect coefficients for each variable and jiβ ,the
interaction effect coefficients. The corresponding response model for the aspect ratio of the particles which are
valid for un-coded factor is:
BC0.009AB0.07C0.50B0.29A0.25σY Equation 6.2
Statistical analysis performed in design-expert® software revealed that Equation 6.2 has an F-Test / Model F-
value of 141.91, implying that the model is statistically significant and there is a 0.70% chance that a Model F-
value this high is due to data noise. The P-value of the model was found to be less than 0.05 indicating model
terms are significant. The term B, C and BC in Equation 6.2 is statistically the most significant model terms.
Figure 6.2 presents the comparison between predicted and actual aspect ratio obtained. The average percentage
uncertainty between the predicted and the actual aspect ratio was found to be between ± 2%.

Chapter 6: Prediction of hydrothermally synthesised solvent-dependent β-FeOOH nanorod sizes
115
Figure 6.15Comparison between experimental and predicted aspect ratio
Independent experiments at random sequence were conducted to further validate the model. BuOH, PrOH and
EtOH were used as solvent for validating the relationships between solvent surface tension and particle growth.
Figure 6.163 presents a comparison between experimental data and the model. It can be seen from Figure 6.16
that the model predicts the particle aspect ratio very well, and the uncertainty range is within ±25% in all cases.
Considering the nanoscale of the materials this model should be considered reliable under the reported
conditions.
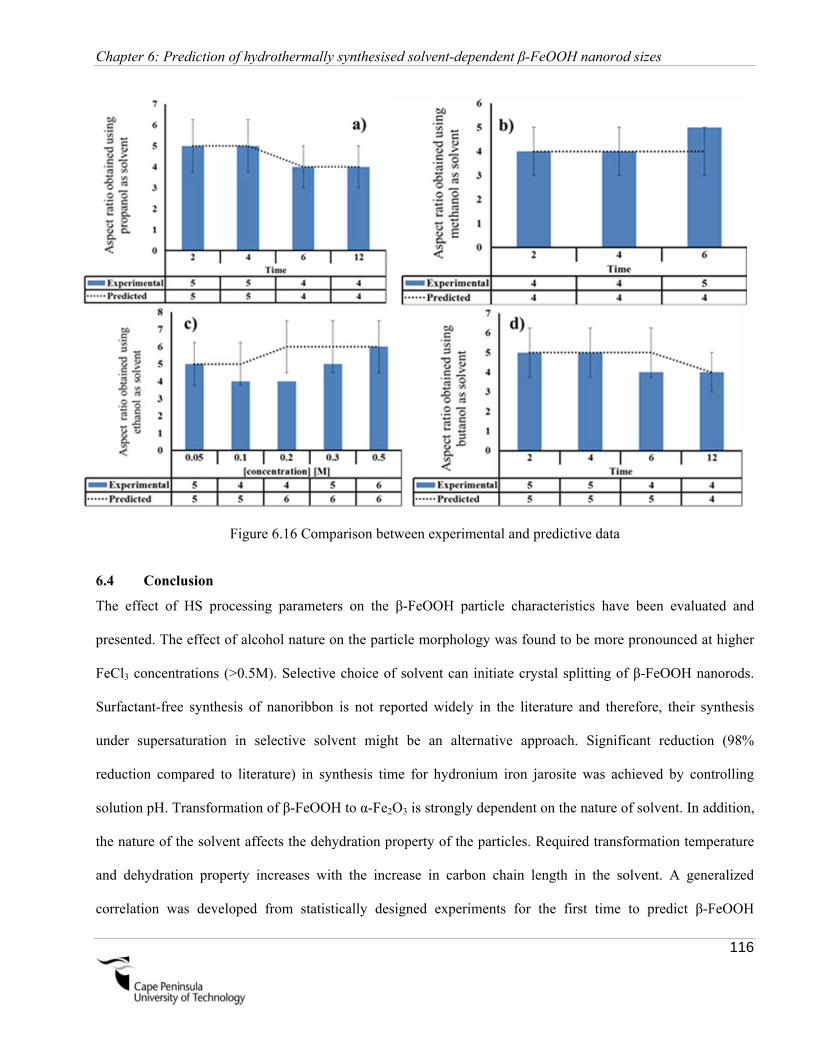
Chapter 6: Prediction of hydrothermally synthesised solvent-dependent β-FeOOH nanorod sizes
116
Figure 6.16 Comparison between experimental and predictive data
6.4 Conclusion
The effect of HS processing parameters on the β-FeOOH particle characteristics have been evaluated and
presented. The effect of alcohol nature on the particle morphology was found to be more pronounced at higher
FeCl3 concentrations (>0.5M). Selective choice of solvent can initiate crystal splitting of β-FeOOH nanorods.
Surfactant-free synthesis of nanoribbon is not reported widely in the literature and therefore, their synthesis
under supersaturation in selective solvent might be an alternative approach. Significant reduction (98%
reduction compared to literature) in synthesis time for hydronium iron jarosite was achieved by controlling
solution pH. Transformation of β-FeOOH to α-Fe2O3 is strongly dependent on the nature of solvent. In addition,
the nature of the solvent affects the dehydration property of the particles. Required transformation temperature
and dehydration property increases with the increase in carbon chain length in the solvent. A generalized
correlation was developed from statistically designed experiments for the first time to predict β-FeOOH

Chapter 6: Prediction of hydrothermally synthesised solvent-dependent β-FeOOH nanorod sizes
117
nanorod growth empirically. The developed correlation takes three different process parameters into account to
predict particle aspect ratio with acceptable confidence.

118
Chapter 7: Summary and conclusions
119
Chapter7
Summary and conclusions
7.1 Introduction
Solvent dependent morphological evolution and growth mechanisms of the β-FeOOH nanorods were
investigated in depth and the findings are reported in this study. A summary and conclusions are presented
here.
7.2 Summary
In Chapter 4, the main aspects concerning the effect of alcohol-to-water ratio are discussed. The use of a
controlled ROH/H2O to control particle size is new approach in the synthesis and processing of materials. Prior
literature always utilized the dielectric constant properties of the mixed solvent only, to relate particle
nucleation and growth. In this study by means of kinetic equation it was illustrated that the solvent surface
tension can also be used to relate to particle growth. It was found that there is a linear relationship between
surface tension and particle size that holds approximately independent of the nature of the alcohol used to
synthesise the particles.
The effect of solvents on the growth kinetics of the β-FeOOH nanorods was evaluated in Chapter 5. Lacunae
still exist regarding the growth mechanism of nanoparticles under mixed solvent conditions. Time evolution
experiments were conducted under different mixed solvent conditions to investigate the growth of the
akaganeite nanorods. A mechanism for the growth of nanorods via the OA mechanism is also presented. The
shape of the particle size distribution was linked with the growth mechanism of the nanorods. A quantitative
and / or qualitative relationship was established between particle growth rate constants and surface tension and
was further validated by an independent study.
Chapter 7: Summary and conclusions
120
In Chapter 6, the effect of HS processing parameters on the morphological and structural evolution of β-FeOOH
particles were evaluated to delimit the boundaries for β-FeOOH precipitation. The particle morphology as well
as dehydration properties were strongly dependent on solvent nature. A generalized correlation derived from
statistically designed experiments predicted particle sizes with acceptable confidence.
7.3 Conclusion
This study relates the role of solvent surface tension with the growth of the particles, which is original.
It revealed that:
Particle morphology is strongly dependent on the solvent nature;
the growth kinetics of the β-FeOOH nanorods are solvent dependent;
selective choice of solvent can give control over particle sizes and
a quantitative and / or qualitative relationship exists between solvent surface tension and particle
growth.
7.4 Significant contribution
The findings in this study obtained from both theoretical and experimental work, provides insight into solvent
surface tension and particle growth interactions, producing new vital information that will further promote
understanding of the formation mechanisms of β-FeOOH growth.
7.5 Future research contribution
The following comprise some suggestions for future work:
In situ observation of the growth kinetics of the β-FeOOH nanorods via ultrasound method
The effect of H-bonding on the nanoparticle formation
The use of polar aprotic and non-polar solvent in the synthesis of β-FeOOH particles
References
121
References
ADSCHIRI , T, T MOUSAVAND, S TAKAMI et al. 2005. Supercritical hydrothermal synthesis of advanced
metal oxide nanoparticles. In: H WAKAYAMA, (ed). Materials Chemistry in Supercritical Fluids.
ADSCHIRI, T, K KANAZAWA, and K ARAI. 1992. Rapid and continuous hydrothermal synthesis of metal
oxide particles in supercritical water. Journal of American Ceramic Society. 75, pp.1019-1022.
ALMEIDA, T. 2010. Hydrothermal synthesis of α-Fe2O3 nanorods. University of Nottingham.
ALMEIDA, T. 2010. Hydrothermal synthesis of α-Fe2O3 nanorods. Nottingham: University of Nottingham.
AL-SAYARI, S, A F CARLEY, S H TAYLOR, and G J HUTCHINGS. 2007. Au/ZnO and Au/Fe2O3 catalysts
for CO oxidation at ambient temperature: comments on the effect of synthesis conditions on the preparation of
high activity catalysts prepared by coprecipitation. Topics in Catalysis. 44, pp.123-128.
AMINE, K, H YASUDA, and M YAMACHI. 1999. β-FeOOH, a new positive electrode material for lithium
secondary batteries. Journal of Power Sources. 81-82, pp.221-223.
ARAI, Y, T SAKO, and Y TAKEBAYASHI. 2002. Supercritical Fluids: Molecular, Interactions, Physical
Properties And New Applications. New York: Springer-Verlag, Nerlin Heidelberg.
ARONNIEMI, M, J LAHTINEN, and P HAUTOJARVI. 2003. Characterization of iron oxide thin films.
Surface And Interface Analysis. 36, pp.1004 - 1006.
AZHAR, S. 2007. Synthesis of well defined hematite films and their use for sintering studies. Lulea university
of technology.
AZHAR UDDIN, M, H TSUDA, S WU, and E SASAOKA. 2008. Catalytic decomposition of biomass tars with
iron oxide catalysts. Fuel. 87, pp.451-459.
BAIKER, A and R WANDELER. 2000. Supercritical fluids: opportunities in heterogeneous catalysis.
CATTECH. 4(1), pp.128-143.
BALARAMAN, D. 2005. Ultra-thin ceramic films for low temperature embedding of decoupling capacitors
into organic printed wiring boards. Georgia: Georgia Institute of Technology.
BANDARA, J, U KLEHM, and J KIWI. 2007. Raschig rings-Fe2O3 composite photocatalyst activate in the
degradation of 4-chlorophenol and Orange II under daylight irradiation. Applied Catalysis B: Environmental.
76, pp.73-81.
BARRIOS, E, L HERNAN, J MORALES, and J L TIRADO. 1986. Effect of grinding in synthetic akaganeite.
Journal of Colloid and Interface Science. 113, pp.212-217.
References
122
BARUWATI, B, K M REDDY , and S V MANORAMA. 2006. Synthesis of Nanostructured Hydroxides and
Oxides of Iron: Control over morphology and physical properties. Journal of American Ceramic Society. 89,
pp.2602 – 2605.
BASHIR, S, R W MCCABE , C BOXALL , and M S LEAVE. 2009. Synthesis of a- and b-FeOOH iron oxide
nanoparticles in non-ionic surfactant medium. Journal of Nanoparticle Research. 11, pp.701-706.
BEACH, Elvin R. 2009. Picoliter drop deposition of oxide nanoparticles: a route to high performance
microsensor arrays. Ohio: The ohio state university.
BENZIGER, J B and I A AKSAY. 1999. Notes on data analysis: Chemical engineering 346 spring term.
Princeton, Newjersey: Department of Chemical Engineering, Princeton university.
BERNARDI , M IB, C A C FEITOSA , C A PASKOCIMAS et al. 2009. Development of metal oxide
nanoparticles by soft chemical method. Ceramics International. 35 , pp.463-466.
BO, Tang, Wang GUANGLI, Zhuo LINHAI et al. 2006. Facile route to α-FeOOH and and α-Fe2O3 nanorods
and magnetic property. Inorganic Chemistry. 45(13), pp.5196-5200.
BORG, R J and J G DIENES. 1992. The physical chemistry of solids. Boston: Academic press.
BRADLEY, D C. 1989. Metal Alkoxides as Precursors for Electronic and Ceramic Materials. Chemical
Reviews. 89, pp.1317-1322.
BRINKER, C J and G W SCHERER. 1990. Sol-gel science the physics and chemistry of sol-gel processing. San
Diego: Academic Press.
BYRAPPA, K. 2005. In: Kirke Othmer encyclopedia of chemical technology, London: John wiley and Sons.
BYRAPPA, K. 2005. Hydrothermal processing. In: Kirke Othmer encyclopedia of chemical technology,
London: John wiley and Sons.
BYRAPPA, K and T ADSCHIRI. 2007. Hydrothermal technology for nanotechnology. Progress in Crystal
Growth and Characterization of Materials. 53.
BYRAPPA, K and M YOSHIMURA. 2001. handbook of hydrothermal technology: a technology for crystal
growth and materials processing. New York: Noyes publications.
CAHN, R W, P HAASEN, and E J CREMER. 1991. Materials science technology: phase transformations in
materials. Weiheim: WCH Press.
CAI, J, J LIU, Z GAO et al. 2001. Synthesis and anion exchange of tunnel structure akaganeite. Chemistry of
Materials. 13(12), pp.4595-4602.
CAMPBELL, C T, S C PARKER, and D E STARR. 2002. The effect of size-dependent nanoparticle energetics
on catalyst sintering. Science. 298, pp.811-814.
CANSELL, F, B CHEVALIER, A DEMOURGUES et al. 1999. Supercritical fluid processing: a new route for
materials synthesis. Journal of Materials Chemistry. 9, pp.67–75.
References
123
CASTRO, C, J RAMOS, A MILLAN et al. 2000. Production of magnetic nanoparticles in imine polymer
matrixes. Chemistry of Materials. 12, pp.3681-3688.
CAURANTA, D, N BAFFIERA, B GARCIAA , and J P PEREIRA-RAMOS. 1996. Synthesis by a soft
chemistry route and characterization of LiNixCo1−xO2 (0 ≤ x ≤ 1) cathode materials. Solid State Ionics. 91,
pp.45-54.
CELE, Nonhlanhla Precious. 2010. Preparation and characterization of nafion-based nanocomposite
membranes for fuel cell applications. Kwazulu Natal: University of Zululand.
CHEN, Huey Ing and Hung Yi CHANG. 2004. Homogeneous precipitation of cerium dixoide nanoparticles in
alcohol/water mixed solvents. Colloids and surfaces A: physicochem. Eng. Aspects. 242, pp.61-69.
CHEN, Ming, Jianhua JIANG, Xiaoming ZHOU, and Guowang DIAO. 2008. Preparation of akaganeite
nanorods and their transformation to sphere shape hematite. Journal of Nanoscience and Nanotechnology. 8,
pp.3942-3948.
CHIU, Chao An, Kiril D HRISTOVSKI, Richard DOCKERY et al. 2012. Modeling temperature and reaction
time impacts on hematite nanoparticle size during forced hydrolysis of ferric chloride. Chemical Engineering
Journal. 210, pp.357-362.
CORNELL, R M and U SCHWERTMANN. 2000. Iron oxides in the laboratory: preparation and
charcaterization. Wiley VCH.
CORNELL, R M and U SCHWERTMANN. 2003. The iron oxides: structure, propoerties, reactions,
occurences and uses. Wiley VCH.
COTE, L J, A S TEJA, A P WILKINSON, and Z J ZHANG. 2003. Continuous hydrothermal synthesis and
crystallization of CoFe2O4 nanoparticles. Fluid Phase Equlibrium. 210, pp.307-317.
DARR, J A and M POLIAKOFF. 1999. New directions in inorganic and metal-organic coordination chemistry
in supercritical fluids. Chemical Revision., pp.495-541.
DAWSON, W J. 1988. Hydrothermal synthesis of advanced ceramic powders. American Ceramic Society
Bulletin. 67(10), pp.1673-1678.
DAWSON, W J and M K HAN. 1993. Development and scale-up of hydrothermal processes for synthesis of
high performance materials. In: J B HISKEY and G W WARREN, (eds). Hydrometallurgy Fundamentals,
Technology And Innovations, SME Inc.
DE YOREO, JJ and P VEKILOV. 2003. Principles of crystal nucleation and growth. In: PM DOVE , JJ DE
YOREO , and S WEINER , (eds). Biomineralization, Washington, DC: Mineralogical society of america,
pp.57-93.
DELIYANNI, E A, D N BAKOYANNAKIS, A I ZOUBOULIS et al. 2001. Akaganeite β-FeO(OH) type
nanocrystals: preparation and characterization. Microporous and Mesoporous Materials. 42, pp.49-57.
References
124
DENARDO, S J, G L DENARDO, and L A MIERS. 2005. Development of Tumor Targeting Bioprobes(111
in-chemaric L6 Monoclonal Antibody Nanoparticles) for alternating magnetic field cancer therapy. Clinical
Cancer Research. 11, pp.7087-7092.
DENG, Z, D CHEN, F TANG et al. 2007. Oriented attachment assisted selfassembly of of Sb2O3 nanorods and
nanowires: End to End vs Side by side. Journal of Physcial Chemistry C. 111, pp.5325-5330.
DIMITRIEV, Y, Y IVANOVA, and R IORDANOVA. 2008. History of Sol-Gel Science and Technology
(Review). Journal of the University of Chemical Technology and Metallurgy. 43, pp.181-192.
DING, Z Y, M A FRISCH, L LI, and E F GLOYNA. 1996. Catalytic oxidation in supercritical water. Industrial
and Engineering Chemistry Research. 35, pp.3257-3279.
DRONSKWOSKI, R. 2001. ChemInform Abstract: The little maghemite story. A classic functional material.
Advanced Functional Materials. 11, pp.27-29.
EARLE, S A, A P RAMIREZ, and R J CAVA. 1999. The effect of gallium substituion for iron on themagnetic
properties of hydronium iron jarosite. Physica B. 262, pp.199-204.
FESTER, V G, P T SLATTER, S BIGGS, and G KALE. 2008. Significance of alcohols in the synthesis of iron
oxide nanorods. In: Green chemietry & engineering, process intensification & nanotechnology conference.
Albany,New York: BHR group, pp.231-236.
FLYNN, C M. 1984. Hydrolysis of inorganic Iron(III) salts. Chemical Reviews. 84, pp.31-41.
FRANDSEN, C, C R BAHL, B LEBECH et al. Oriented attachment coupling of a-Fe2O3 nanoparticles.
Physical review B: Condensed Matter Material Phyics. 72, p.214406.
GABBOT, paul. 2008. Prinicple and applications of thermal analysis. New Delhi: Blackwell publishing.
GALKIN, A A, B G KOSTYUK, N N KUZNETSOVA et al. 2001. Unusual approache to the preparation of
heterogeneous catalysts and supports using water in subcritical and supercritical states. Kinetics and Catalysis.
42, pp.154-162.
GALLAGHER, K J. 1970. The atomic structure of tubular subcrystals of β-Iron(III) oxide hydroxide. Nature.
226, p.1225.
GARCIA, K E, C A BARRERO, A L MORALES, and J M GRENECHE. 2008. Characterization of akaganiete
synthesized in presence of Al3+, Cr3+ and Cu2+ ions and urea. Materials Chemistry and Physics. 112, pp.120-
126.
GARRATT-REED, A J and D C BELL. 2003. Energy-Dispersive X-Ray analysis in the electron microscope.
Oxford: Bios Scientific publishers limited.
GIBBS , J W. 1876. On the equilibrium of heterogeneous substances. Trans Connect Acta Sci. 3, pp.108-248.
GILBERT, Benjamin, Hengzhong ZHANG, Feng HUANG et al. 2003. Special phase transformation and crystal
growth pathways observed in nanoparticles. Geochemical Transaction. 4, pp.20-27.
References
125
GOODEY, J, O K K MIN , J BROUSSARD et al. 2003. Syntheses, structures, and second-harmonic generating
properties in new quaternary tellurites: A2TeW3O12 (A = K, Rb, or Cs). Journal of Solid State Chemistry. 175,
pp.3–12.
GOODHEW, P J and F J HUMPHREYS. 1988. Electron Microscopy and Analysis, 2nd edition. London:
Taylor & Francis.
GRAEF, Marc and Michael E HENRY. 2007. Structure of materials. New York: Cambridge press.
GRUTTNER, Cordula, Knut MULLER, Joachim TELLER et al. 2007. Synthesis and antibody conjugation of
magnetic nanoparticles with improved specific power absorption rates for alternating magnetic field cancer
therapy. Journal of Magnetism And Magnetic Materials. 311, pp.181-186.
GUO, X and P XIAO. 2006. Effects of solvents on properties of nanocrystalline hydroxyapatite produced from
hydrothermal process. Journal of Europian Ceramic Society. 26, pp.3383–3391.
GUYODO, Y, A MOSTROM, R L PENN, and S K BANERJEE. 2003. From nanodots to nanorods:Oriented
aggregation and magnetic evoution of nanocrystalline geothite. Geophysical Research Letters. 30, p.1512.
HAKUTA, Y, T ADSCHIRI, T SUZUKI et al. 1998. Flow method for rapidly producing barium hexaferrite
particles in supercritical water. Journal of American Ceramic Society. 81, pp.2461-2464.
HAKUTA, Y, S ONAI, T ADSCHIRI, and K ARAI. 1998. Production of ultra-fine ceria particles by
hydrothermal synthesis under supercritical conditions. Journal of Materials Science Letters. 17, pp.1211-1213.
HAKUTA, Y, K SEINO, H URA et al. 1999. Production of phosphor (YAG:Tb) fine particles by hydrothermal
synthesis in supercritical water. Journal of Materials Chemistry. 9, pp.2671-2674.
HAKUTA, Y, H URA, H HAYASHI, and K ARAI. 2005. Continuous production of BaTiO3 nanoparticles by
hydrothermal synthesis. Industrial and Engineering Chemistry Research. 44, pp.840-846.
HAN, Jisheng. 2001. PhD Thesis : A study of α-iron oxide as a gas sensing material. University of South
Australlia.
HANEDA, K and A H MORRISH. 1977. Vacancy ordering in γ-Fe2O3 small particles. Solid State
Communications. 22, pp.7797-782.
HAO, Y and A S TEJA. 2003. Continuously hydrothermal crystallization of α-Fe2O3 and Co3O4 anoparticles.
Journal of Materials Research. 18, pp.415-422.
HAYASHI , Hiromichi and Yukiya HAKUTA. 2010. Hydrothermal Synthesis of Metal Oxide Nanoparticles in
Supercritical Water. Materials. 3, pp.3794-3817.
HAYASHI, H and K TORII. 2003. Hydrothermal synthesis of titania photocatalyst under subcritical and
supercritical water conditions. Journal of Materials Chemistry. 12, pp.3671–3676.
References
126
HELGASON, O, J M GRENECHE, F J BERRY, and F MOSSELMANS. 2003. The influence of ruthenium on
the magnetic properties of γ-Fe2O3 (maghemite) studied by Mössbauer spectroscopy. Journal of Physics:
Condensed Matter. 15, pp.2907-2915.
HENDRIKSEN, P V, S LINDEROTH, and P A LINDGA°RD. 1993. Finite-size modifications of the magnetic
properties of clusters. Physical Review B. 48, pp.7259-7273.
HOHENBERG , PC and BI HALPERIN. 1977. Theory of dynamic critical phenomena. Reviews of Modern
Physics. 49, pp.435-479.
HOLMES, J D, K P JOHNSTON, R C DOTY, and B A KORGEL. 2000. Control of thickness and orientation
of solution-grown silicon nanowires. Science. 287, pp.1471-1473.
HOSAKA, M and T MIYATA. 1993. Hydrothermal growth of α-quartz using high-purity α- cristobalite as feed
material. Materials Research Bulletin. 28, pp.1201-1208.
HUANG, F, H ZHANG, and J F BANFIELD. 2003. Two-stage crystal growth kinetics observed during
hydrothermal coarsening of nanocrystalline ZnS. Nano Letters. 3(3), pp.373-378.
HUNG, I M, H P WANG, W H LAI, and K Z FUNG. 2004. Preparation of mesoporous cerium oxide templated
by tri-block copolymer for solid oxide fuel cell. Electrochemica Acta. 50, pp.745-748.
INOUE, M. 2005. Solvothermal synthesis. In: B LEE and S KOMARNENI, (eds). Chemical Processing of
Ceramics, Boca Raton: CRC Press, pp.21-61.
ISHIKAWA, T, S MIYAMOTO, K KANDORI , and T NAKAYAMA. 2005. Influence of anions on the
fomration of beta-FeOOH rusts. Corrosion Science. 47(10), pp.2510-2520.
ISRAELACHVILI, Jacob N. 1992. Intermolecular and surface forces. Academic press.
JIANG, X C, A B YU, W R YANG et al. 2010. Synthesis and growth of hematite nanodiscs through a facile
hydrothermal approach. Journal of Nanoparticle Research. 12, pp.877-893.
JIU, J, Y GE, X LI, and L NIE. 2002. Preparation of CO3PO4 nanoparticles by a polymer combustion route.
Materials Letter. 54, pp.260-263.
JOLIVET, J P, E TRONC, and C CHANEAC. 2006. Iron oxides: From molecular clusters to solid. A nice
example of chemical versatility. Comptes Rendus Geoscience. 338, pp.488-497.
JUN, Y W, M F CASULA M. F, J H SIM et al. 2003. Surfactant-assisted elimination of a high energy facet as a
means of controlling the shapes of TiO2 nanocrystals. Journal of American Chemical Society. 125, pp.15981-
15985.
JUN, Y W, J H LEE, and J CHEON. 2007. Nanoparticle contrast agents for molecular magnetic resonance
imaging. In: Nanobiotechnology II: More Concepts And Applications. Weinheim: Wiley-VCH.
KAKIHANA , M and M YOSHIMURA. 1999. Synthesis and characteristics of complex mul-ticomponent
oxides prepared by polymer complex method. Bulletin of The Chemical Society of Japan. 72, pp.1427-1443.

References
127
KANAMURA, K, T UMEGAKI, K TOYOSHIMA et al. 2000. Preparation and electrochemical
characterization of LiCoO2 single crystal particles prepared by supercritical water synthesis (SCWS). Materilas
Research Society Symposium. 575 , pp.59-64.
KANDORI, K, N YAMAMATO, A YASUKAWA, and T ISHIKAWA. 2002. Preparation and characterization
of disk-shaped hematite particles by a forced hydrolysis reaction in the presence of polyvinyl alcohol. Physical
Chemistry Chemical Physics. 4, pp.6116-6122.
KANNO, R, T SHIRANE, Y KAWAMOTO et al. 1996. Synthesis, Structure, and Electrochemical Properties
of a New Lithium Iron Oxide, LiFeO2, with a Corrugated Layer Structure. Journal of The Electrochemical
Society. 143, pp.2435-2442.
KATSUKI, H and S KOMARNENI. 2001. Microwave-hydrothermal synthesis of monodispersed nanophase α-
Fe2O3. Journal of the American Ceramic Society. 84, pp.2313-2317.
KAWAI-NAKAMURA, Akiko, Toshiyuki SATO, Kiwamu SUE et al. 2008. Rapid and continuous
hydrothermal synthesis of metal and metal oxide nanoparticles with a microtube-reactor at 523 K and 30 MPa.
Materilas Letter. 62, pp.3471-3473.
KELLY, K L, E CORONADO, L L ZHAO, and G C SCHATZ. 2003. The optical properties of metal
nanoparticles: The influence of size, shape and dielectric environment. Journal of Physical Chemistry B. 668-
677.
KHAN, Yaqoob, S k DURRANI, M SIDDIQUE, and Mazhar MEHMOOD. 2011. Hydrothermal synthesis of
α-Fe2O3 nanoparticles capped by Tween-80. Materials Letters. 65, pp.2224-2227.
KIM, F, J SONG, and P YANG. 2002. Photochemical synthesis of nanorods. Journal of the American Chemcial
Society. 124, pp.14316-14317.
KIRCHNER, H OK. 1971. Coarsening of Grain-Boundary precipitates. Metallurgical Transactions. 2, pp.2861-
2864.
KLIER, J, C J TUCKER, T H KALANTAR, and D P GREEN. 2000. Properties and Applications of
Microemulsions. Advanced Materials. 12, pp.1751-1757.
KLOTZ, S, G STEINLE-NEUMANN, T STRASSLE et al. 2008. Magnetism and the Verwey transition in
Fe3O4 under pressure. Physical Review., pp.012411-1 - 012411-4.
KRILL, C E, L HELFEN, D MICHELS et al. 2001. Size dependent grain growth kinetics observed in
nanocrystalline Fe. Physics Review Letters. 86, pp.842-845.
KUMAR, R V, Y KOLTYPIN, Y S COHEN et al. 2000. Preparation of amorphous magnetic nanoparticles
embedded in polyvinyl alcohol using ultrasonic raidation. Journal of Materials Chemistry. 10, pp.1125-1129.

References
128
KUO, Chih-Wei , Yueh-Hsun LEE, Kuan-Zong FUNG, and Moo-Chin WANG. 2005. Effect of Y2O3 addition
on the phase transition and growth of YSZ nanocrystallites prepared by a sol–gel process. Journal of
NonCrystalline Solids. 351, pp.304-311.
LAM, U T, R MAMMUCARI, K SUZUKI, and N R FOSTER. 2008. Processing of iron oxide nanoparticles by
supercritical fluids. Industrial And Engineering Chemistry Research. 47, pp.599-614.
LEE, Y W. 5–9 August 2006. Formation of nano particles in supercritical fluids. In: Proceedings of ISHR &
ICSTR. Sendai, Japan.
LEE, Y C, Y L CHUEH, C H HSIEH et al. 2007. p-Type α-Fe2O3 nanowires and their n-Type transition in a
reductive ambient. Small. 3, pp.1356-1361.
LEE, J and A TEJA. 2006. Synthesis of LiFePO4 micro and nanoparticles in supercritical water. Materials
Letter. 60, pp.2105-2109.
LESTER, E, P BLOOD, J DENYER et al. 2006. Reaction engineering: the supercritical water hydrothermal
synthesis of nanoparticles. Journal of Supercritical Fluids., pp.209-214.
LIANG, Ming-Tsai, Shih-Han WANG, Yu-Lun CHANG et al. 2010. Iron oxide synthesis using a continuous
hydrothermal and solvothermal system. Ceramics International. 36, pp.1131-1135.
LIANG, H, H ZHAO, D ROSSOUW et al. 2012. Silver nanorice structures:Oriented attavhment dominated
growth, high environmental sensitivity and real-space visualization of multipolar resonances. Chemistry of
Materials. 24, pp.2239-2246.
LIEBER, C M. 2003. Nanoscale science and technolgy: Building a big future from small things. Materials
Research Society. 28, p.486.
LIN, Jun, Min YU, Cuikun LIN, and Xiaoming LIU. 2007. Multiform Oxide Optical Materials Via the Versatile
Pechini-Type Sol-Gel Process: Synthesis and Characteristics. Journal of Physical Chemistry C. 111, pp.5835-
5845.
LIU, L, H-Z KOU, W MO et al. 2006. Surfactant-assisted synthesis of α-Fe2O3 nanotubes and nanorods with
shape dependent magnetic properties. Journal of Physical Chemistry B. 110, pp.15218-15223.
LODHIA, J, G MANDARANO, N J FERRIS et al. 2010. Development and use of iron oxide nanoparticles
(Part 1): Synthesis of iron oxide nanoparticles for MRI. Biomedical Imaging And Intervention Journal. 6 ,
pp.doi: 10.2349/biij.6.2.e12.
MACKAY, A L. 1960. Mossbauer and X-ray data on β-FeOOH (akaganeite). Mineralogical Magazine, pp.545-
557.
MACKAY, A L. 1962. β-ferric oxyhydroxide-akaganeite. Mineralogical Magazine, pp.270-280.
MAJEWSKI, P. 2008. Encyclopaedia britannica online. [online].
References
129
MAMBOTE, R C M, M A REUTER, P KRIJGSMAN, and R D SCHUILING. 2000. Hydrothermal metallurgy:
an overview of basic concepts and applications. Minerals Engineering. 13, pp.803-822.
MANNA, L, D J MILLIRON, A MEILSEL et al. 2003. Controlled growth of tetrapod-branched inorganic
nanocrystal. Nature Materials. 2(6), pp.382-385.
MARGULIES, D T, F T PARKER, M L RUDEE et al. 1997. Origin of the anomalous magnetic behavior in
single crystal Fe3O4 films. Physical Review Letters. 79, pp.5162-5165.
MATIJEVIC, E. 1985. Production of monodispersed colloidal particles. Annual Review of Materials Science.
15, pp.483-516.
MATIJEVIC, E and P SCHEINER. 1978. Ferric hydrous oxide sols: III. preparation of uniform particles by
hydrolysis of Fe(III)-chloride, -nitrate, and -perchlorate solutions. Journal of Colloid And Interface Science. 63,
pp.509-522.
MATSON, D W, J C LINEBAN, J G DARAB et al. A flow-through hydrothermal method for the synthesis of
active nanocrystalline catalysts. In: Advanced catalysts and nanostructured materials:modern synthetic
methods, California: Academic press.
MEISEN, U and H KATHREIN. 2000. The influence of particle size, shape and particle size distribution on
propertiesof magnetites for the production of toners. Journal of Imaging Science And Technology. 44, pp.508-
513.
MILLOT, N, B XIN, C PIGHINI, and D AYMES. 2005. Hydrothermal synthesis of nanostructured inorganic
powders by a continuous process under supercritical conditions. Journal of the European Ceramic Society. 25,
pp.2013-2016.
MOLDOVAN, D, V Y YAMAKOV, D WOLF, and S R PHILLPOT. 2002. Scaling behaviour of of grain-
rotation induced grain growth. Physical Review Letters. 89, p.206101.
MORRISH, A H and J A EATON. 1971. Magnetic transition in rhodium‐doped hematite single crystals.
Journal of Appplied Physics. 42, pp.1495-1496.
MORRISH, A H, G B JOHNSTON, and N A CURRY. 1963. Magnetic transition in pure and Ga doped -
Fe2O3. Physics Letters. 7, pp.177-178.
MULLIN, J W. 2011. Crystallization. Butterworth Heinmann.
MURAD, E. 1979. Mossbauer and X-ray data on beta-FeOOH. Calay Minerals. 14, pp.273-283.
MURAD, E. 1985. In: J W STUCKI, B A GOODMAN, and U SCHWERTMANN, (eds). Series C:
Mathematical and physical sceinces, D. Reidel.
MURRAY, C B, D J NORRIS, and M G BAWENDI. 1993. Synthesis and characterization of nearly
monodisperse CdE (E = sulfur, selenium, tellurium) semiconductor nanocrystallites. Journal of American
Chemical Society. 115, pp.8706-8715.

References
130
NESTEROVA, M, J MOREAUAND, and J F BANFIELD. 2003. Model biomimitec studies of templated
growth and assembly of nanocrystalline FeOOH. Geochimica et Cosmochimica Acta. 67, pp.1185-1187.
NEUBERGER, T, B SCHOPF, H HOFMANN et al. 2005. Superparamagnetic nanoparticles for biomedical
applications: possibilities and limitations of a new drug delivery system. Journal of Magnetism And Magnetic
Materials. 293, pp.483-496.
NIEDERBERGER, M, G GARNWEITNER, J BUHA et al. 2006. Nonaqueous synthesis of metal oxide
nanoparticles: review and indium oxide as case study for the dependence of particle morphology on precursors
and solvents. Journal of Sol-Gel Science And Technology. 40, pp.259-266.
NIEDERBERGER, M, F KRUMEICH, K HEGETSCHWEILER, and R NESPER. 2002. An iron polyolate
complex as a precursor for the controlled synthesis of mono dispersed iron oxide colloids. Chemistry of
Materials. 2002, pp.78-82.
PAN, Z W, Z R DAI, and Z L WANG. 2001. Nanobelts of semiconducitng oxides. Science. 291, pp.1947-1949.
PAULING, L and S B HENDRIKS. 1925. The crystla structures of hematite and corundum. Journal Of The
American Chemical Society. 47, pp.781-790.
PENG, X, L MANNA , W YANG et al. 2000. Shape Control Of CdSe Nanocrystals. Nature. 404, pp.59-61.
PENN, R L. 2004. Kinetics of oriented aggregation. Journal of Physcial Chemistry B. 108, pp.12707-12712.
PENN, R L and J F BANFIELD. 1998. Oriented attachment and growth, twinning, polytypism and formation
metastable phase: Insights from nanocrystalline TiO2. American Mineralogist. 83, pp.1077-1082.
PENN, R L and J F BANFIELD. 1999. Morphology development and crystal growth in nanocrystalline
aggregates under hydrothermal conditions:insights from titania. Geochimica Et Cosmochimica Acta. 63,
pp.1549-1557.
PENN, R L, J J ERBS, and M GULLIVER. 2006. Controlled growth of alpha-FeOOh nanorods by exploiting
oriented aggreagation. Journal of Crystal Growth. 293, pp.1-4.
PENN, R L, G OSKAM, T J STRATHMANN et al. 2001. Epitaxial assembly in aged colloids. Journal of
Physical Chemistry. B. 105, pp.2177-2182.
PERSSON, A I, M W LARSSON, S STRENSTORM et al. 2004. Solid-phase diffusion mechanism for GaAs
nanowire growth. Nature Materials. 3, p.677.
PU, Z, M CAO, J YANG et al. 2006. Controlled synthesis and growth mechanism of hematite
nanorhombohedra, nanorods and nanocubes. Nanotechnology. 17, pp.799-804.
PUNTES, V F, K M KRISHNAN, and A P ALIVISATOS. 2001. Colloidal nanocrystal shape and size control:
the case of cobalt. Science. 291, pp.2115-2117.
PUNTES, V F, D ZANCHET , C K ERDONMEZ, and A P ALIVISATOS. 2002. Synthesis of hcp-Co
nanodisks. Journal of American Chemcial Society. 124, pp.12874-12880.
References
131
REDL, F X, K S CHO, C B MURRAY, and S O’BRIEN. 2003. Three-dimensional binary superlattices of
magnetic nanocrystlas nad semiconductor quantam dots. Nature. 423, pp.968-971.
REGUER, S, D NEFF, Bellot GURLET, and P DILLMANN. 2007. Deterioration of iron archaeological
artefacts: micro-Raman investigation on Cl-containing corrosion products. Journal of Raman Spectroscopy. 38,
p.389.
RIVEROS , P A and J E DUTRIZAC. 1997. The precipitation of hematite from ferric chloride media.
Hydrometallurgy. 46, pp.85-104.
ROSEN, M J. 1989. Surfactants and Interfacial Phenomena. New York: Wiley-Interscience.
ROUSSEAU, R W. 1992. Crystallization processes. In: Encyclopedia of physical science and technology,
Academic press, Inc.
SAKKA, S. 2003. Sol-Gel technology as reflected in journal of sol-gel science and technology. Journal of Sol-
Gel Science And Technology. 26 , pp.29-33.
SCAMEHORN, J. 1986. An overview of Phenomena Involving Surfactant Mixtures. In: Phenomena in Mixed
Surfactant Systems, Washington, DC.: American chemical society.
SCHMIDT, H. 2006. Considerations about the sol-gel process: from the classical sol-gel route to advanced
chemical nanotechnologies. Journal of SolGel Science And Technology. 40 , pp.115-130.
SEGAL, D. 1997. Chemical synthesis of ceramic materials. Journal of Materials Chemistry. 7, pp.1297-1305.
SENA, S P, R A LINDLEY, H J BLYTHE et al. 1997. Investigation of magnetite thin films produced by pulsed
laser deposition. Journal of Magnetism And Magnetic Materials. 176, pp.111-126.
SHAO, Hua-Feng, Xue-Feng QIAN, Jie YIN, and Zi-Kang ZHU. 2005. Controlled morphology synthesis of b-
FeOOH and the phase transition to Fe2O3. Journal of Solid State Chemistry. 178, pp.3130-3136.
SHI , J and H VERWEIJ. 2005. Synthesis and purification of oxide nanoparticle dispersions by modified
emulsion precipitation. Langmuir. 21, pp.5570-5575.
SOHNEL, O and J W MULLIN. 1978. A method for the determination of precipitation induction periods.
Journal of Crystal Growth. 44, p.377.
SOMIYA, S and R ROY. 2000. Hydrothermal synthesis of fine oxide powders. Bulletinf of Matreial Science.
23, pp.453-460.
SPADA, F E, A E BERKOWITZ, and N T PROKEY. 1991. Hc enhancement in partially reduced γ-Fe2O3 via
surface treatment with sodium polyphosphate (revisited). Journal of Applied Physics. 69, pp.4475-4477.
SPALDIN, N. 2003. Magnetic materials: Fundamentals and device applications. Cambridge: Cambridge
University press.

References
132
SPANHEL, L and M ANDERSON. 1991. Semiconductor clusters in the Sol-gel process: quantized
aggregation, gelation, and crystal growth in concentrated ZnO Col-loids. Journal of the American Chemical
Society. 113 , pp.2826-2833.
STADTLÄNDER, CT K-H. 2007. Scanning electron microscopy and transmission electron microscopy of
mollicutes: challenges and opportunities. In: A MÉNDEZ-VILAS and J DÍAZ, (eds). Modern research and
educational topics in microscopy, Clemson: Formatex, pp.122-131.
STAHL, K, K NIELSEN, J JIANG et al. 2003. On the akaganeite crystal structure, phase transformations and
possible role in post-excavational corrosion of iron artifacts. Corrosion Science. 45, p.2563.
SUE, K, K KINURA, and K ARAI. 2004. Hydrothermal synthesis of ZnO nanocrystals using microreactor.
Materials Letters. 58, pp.3229-3231.
SUZUKI, E. 2002. High-resolution scanning electron microscopy of immunogold-labelled cells by the use of
thin plasma coating of osmium. Journal of Microscopy. 208, pp.153-157.
SVÁB, E and E KRÉN. 1979. Neutron diffraction study of substituted hematite. Journal of Magnetism And
Magnetic Materials. 14, pp.184-186.
TANG, Jing and A Paul ALIVISATOS. 2006. Crystal Splitting in the Growth of Bi2S3. Nano Letters. 6(12),
pp.2701-2706.
TANG, Z Y, N A KOTOV, and M GIERSIG. 2002. Spontaneous organization of single CdTe nanoparticles
into luminescent nanowires. Science. 297, pp.237-240.
TARTAJ, P, M P MORALES, T GONZALVEZ-CARRENO et al. 2003. The preparation of magnetic
nanoparticles for applications in biomedicine. Journal of Physics D: Applied Physics. 36(13), pp.183-197.
TEJA, A S and Pei-Yoong KOH. 2009. Production of magnetic oxide nanoparticles. Synthesis, properties, and
applications of magnetic iron oxide nanoparticles. 55, pp.22-45.
TRONC, E, A EZZIR, R CHERKAOUI et al. 2000. Surface-related properties of γ-Fe2O3 nanoparticles.
Journal of Magnetism And Magnetic Materials. 221, pp.63-79.
USKOKOVIC , V and M DROFENIK. 2005. Synthesis of materials within reverse micelle. Surface Review
And Letters. 12, pp.239-277.
VAYSSIERES, L, N BEERMANN, S E LINDQUIST, and A HAGFELDT. 2001. Controlled aqueous chemical
growth of oriented three-dimensional crystalline nanorod arrays: Application to iron (III) oxides. Chemistry Of
Materials. 13, pp.233-235.
VAYSSIERES, L, C SATHE, S M BUTORIN et al. 2005. One-dimensional quantum confinement effect in α-
Fe2O3 ultrafine nanorods arrays. Advance Materials. 17, p.2320.
VAZQUEZ, G, E ALVAREZ, and J M NAVAZA. 1995. Surface tension of alcohol+ water from 20 to 50
degree C. Journal of Chemical Engineering Data. 40, pp.611-614.

References
133
VERDON, E, M DEVALETTE, and G DEMAZEAU. 1995. Solvothermal synthesis of cerium dioxide
microcrystallites:effect of the solvent. Materials Letters. 25, pp.127-131.
VISWANATHAN, R and R B GUPTA. 2003. Formation of zinc oxide nanoparticles in supercritical water.
Journal of Supercritical Fluids. 27, pp.187–193.
VORKAPIC, Danijela and Themis MATSOUKAS. 1998. Effect of temperature and alcohols in the preparation
of titania nanoparticles from alkoxides. Journal of American ceramic society. 11, pp.2815-2820.
WANDELER, R and A BAIKER. 2000. Supercritical fluids: opportunities in heterogeneous catalysis. Cattech.
4, pp.34-50.
WANG, G, X GOU, J HORVAT, and J PARK. 2008. Facile synthesis and characterization of iron oxide
semiconductor nanowires for gas sensing appliction. The Journal of Physical Chemistry C. 112, pp.15220-
15225.
WANG, X and Y LI. 2002. Selected-control hydrothermal Synthesis of alpha- and β -MnO2 single crystal
nanowires. Journal of American Chemical Society. 124, pp.2880-2881.
WATSON, JH L and R R CARDELL. 1962. The internal structure of colloidal crystals of β-FeOOH and
remarks on their assemblies in schiller layers. The Journal of Physical Chemistry. 66, pp.1757-1763.
WAYCHUNAS, G A. 2001. Structure, aggregation and charracterization of nanoparticles. In: J F BANFIELD
and A NAVROTSKY, (eds). Nanoparticles And The Environment, Washington,DC: Minerological society of
America, pp.105-166.
WEI, Chengzhen and Zhaodong NAN. 2011. Effects of experimental conditions on One-dimensional single-
crystla nanoxtruxture of b-FeOOH. Materials Chemistry And Physics. 127, pp.220-226.
WHITE, A F. 1990. Heterogeneous electrochemical reactions associated with oxidation of ferrous oxide and
silicate surfaces. In: M F HOCHELLA and A F WHITE, (eds). Mineral-Water Interface Geochemistry,
Reviews in Mineralogy, pp.467-505.
WILLIAMS, D B. 1984. Practical analytical electron microscopy in materials science. Deerfield beach,
Florida: Electron optics publishing group.
XIONG, Y J, Y XIE, S W CHEN, and Z Q LI. 2003. Fabrication of Self-Supported Patterns of Aligned β-
FeOOH Nanowires by a Low-Temperature Solution Reaction Chem. Eur. J. 9 (2003) 4991. Chemistry-A
European Journal. 9, pp.4991-4996.
XU, Chunbao, Jaewon LEE, and Amyn S TEJA. 2008. Continuous hydrothermal synthesis of lithium iron
phosphate particles in subcritical and supercritical water. Journal of Supercritical Fluids. 44, pp.92-97.
XU, Chunabo and Amyn S TEJA. 2008. Continuos hydrothermal synthesis of iron oxide and PVA-protected
iron oxide nanoparticles. Journal of Supercritical Fluids. 44, pp.85-91.

References
134
YADONG, Yin and A P ALIVISATOS. 2005. Colloidal nanocrystal synthesis and the organic–inorganic
interface. Nature. 437, pp.664-670.
YANG, S, y SONG, P Y ZAVALIJ, and M Whittingham STANLEY. 2001. Hydrothermal synthesis of lithium
iron phosphate cathodes. Electrochemistry Communications. 3 , pp.505-508.
YOSHIMURA , M, W SUCHANEK, and K BYRAPPA. 2000. Soft processing for advanced inorganic
materials. Material Research Society Bulletin. 25, pp.17-24.
YU, S H. 2001. Hydrothermal/Solvothermal processing of advanced ceramic materials. Journal of The Ceramic
Society of Japan. 109 , pp.S65-S75.
YUAN, Qingchun, Nita ARYANTI, Ruozhou HOU, and Richard WILLIAMS. 2009. Performance of slotted
pores in particle manufacture using rotating membrane emulsification. Particulogy. 7(2), pp.114-120.
YUE, Jeffrey, Xuchuan JIANG, and Aibing YU. 2011. Experimental and theoretical study on the β-FeOOH
nanorods: Growth and conversion. Journal of Nanoparticle Research. 13, pp.3961-3974.
ZHANG, H and BANFIELD. 1999. New kinetic model for the nanocrystalline anatase-to-rutile transformation
revealing rate dependence on number of particles. American Mineral. 84, pp.528-535.
ZHANG, H and J F BANFIELD. 2002. Kinetics of crystallization and crystal growth of nanocrystalline anatase
in nanometer-sized amorphous titania. Chemistry of Materials. 14, pp.4145-4154.
ZHANG, Jing, Feng HUANG, and Zhang LIN. 2010. Progress of nanocrystalline growth kinetics based on
oriented attachment. Nanoscale. 18, pp.18-34.
ZHANG, J, Z LIN, Y LAN et al. 2006. A multistep oriented attachement kinetics: Coarsening of ZnS
nanoparticles in concentrated NaOH. Journal of American Chemical Society. 128, pp.12981-12987.
ZHANG, J, Y WANG, J ZHENG et al. 2007. Oriented attachment kinetics for ligand capped nanocrystals:
coarsening of thiol-PbS nanoparticles. Journal of Physical Chemistry B. 111, pp.1449-1454.
ZHENG, Zhanfeng. 2009. Synthesis and modifications of metal oxide nanostructures and their applications.
Queensland university of technology.
ZHONG, Z Y, J LIN, S P TEH et al. 2007. A rapid and efficient method to deposit gold particles on catalyst
supports and its application for CO oxidation at low temperatures. Advanced Functional Materials. 17, pp.1402-
1408.
ZHUANG, Z, J ZHANG, F HUANG et al. 2009. Pure multistep oriented attachment growth kinetics of
surfactant-free SnO2 nanocrystals. Physical Chemistry Chemical Physics. 11, pp.8516-8521.
ZYSLER, R D, D FIORANI, and A M TESTA. 2001. Investigation of magnetic properties of interacting Fe2O3
nanoparticles. Journal of Magnetism And Magnetic Materials. 224, pp.5-11.
Appendix
135
Appendices
Appendix A
Mineralogical, chemical and structural information for β-FeOOH particles (JCPDS card no: 42-1315)
a) Name and formula
Reference code: 00-042-1315
Mineral name: Akaganeite-M
PDF index name: Iron Oxide Chloride Hydroxide
Empirical formula: Cl1.3Fe8H9.7O16
Chemical formula: Fe8+3 ( O , OH )16Cl1.3
b) Crystallographic parameters
Crystal system: Monoclinic
Space group: I2/m
Space group number: 12
a (Å): 10.6030

Appendix
136
b (Å): 3.0350
c (Å): 10.5120
Alpha (°): 90.0000
Beta (°): 90.2200
Gamma (°): 90.0000
Calculated density (g/cm^3): 3.68
Volume of cell (10^6 pm^3): 338.27
Z: 1.00
RIR: 1.32
c) Subfiles and Quality
Subfiles: Inorganic
Mineral
Corrosion
Quality: Indexed (I)
d) Comments
Color: Orange-brown
Sample source: Specimen from corrosion rind on Campo del Cielo meteorite, Argentina.
Analysis: Microprobe analysis: Fe7.6Ni0.4O6.35 ( OH )9.65Cl1.25 .
Additional pattern: See ICSD 69606 (PDF 80-1770).

Appendix
137
e) References
Primary reference: Post, J., National Museum of Natural History, Smithsonian Institution,
Washington, DC, USA, ICDD Grant-in-Aid, (1989)
f) Peak list
No. h k l d [A] 2Theta[deg] I [%]
1 1 0 -1 7.46800 11.841 100.0
2 2 0 0 5.30100 16.711 37.0
3 0 0 2 5.25600 16.855 35.0
4 2 0 -2 3.74000 23.772 4.0
5 2 0 2 3.72500 23.869 4.0
6 3 0 -1 3.34500 26.628 74.0
7 1 0 -3 3.33400 26.717 74.0
8 1 1 0 2.91700 30.624 1.0
9 4 0 0 2.65000 33.797 14.0
10 0 0 4 2.62700 34.102 14.0
11 2 1 -1 2.55100 35.151 86.0
12 3 0 -3 2.49200 36.011 6.0
13 4 0 2 2.35800 38.134 6.0
14 2 0 4 2.35300 38.218 3.0
15 3 1 0 2.30300 39.081 27.0
16 0 1 3 2.29400 39.241 27.0
17 3 1 -2 2.10600 42.909 8.0
18 5 0 -1 2.07900 43.495 2.0

Appendix
138
19 1 0 -5 2.06300 43.849 2.0
20 4 1 -1 1.96080 46.264 15.0
21 1 1 -4 1.95290 46.462 15.0
22 4 0 -4 1.86980 48.657 2.0
23 4 0 4 1.86270 48.855 2.0
24 6 0 0 1.76720 51.684 8.0
25 0 0 6 1.75200 52.166 8.0
26 5 1 0 1.73780 52.624 4.0
27 3 1 -4 1.73290 52.785 4.0
28 6 0 -2 1.67700 54.688 2.0
29 5 1 -2 1.64940 55.682 27.0
30 2 1 -5 1.64340 55.903 30.0
31 0 2 0 1.51750 61.010 13.0
32 6 1 -1 1.51360 61.184 11.0
33 7 0 1 1.49840 61.872 4.0
34 5 0 5 1.48770 62.367 4.0
35 6 0 -4 1.46420 63.483 2.0
36 4 0 6 1.45900 63.736 4.0
37 5 1 -4 1.45190 64.085 12.0
38 4 1 5 1.44560 64.398 12.0
39 2 2 -2 1.40590 66.447 1.0
40 3 1 6 1.39230 67.182 2.0
41 7 0 3 1.38840 67.395 4.0
42 3 2 -1 1.38090 67.811 7.0

Appendix
139
g) Stick Pattern
Minerological, chemical and structural information for α-Fe2O3 particles (JCPDS card no: 33-0664)
a) Name and formula
Reference code: 00-033-0664
Mineral name: Hematite, syn
Common name: burnt ochre

Appendix
140
PDF index name: Iron Oxide
Empirical formula: Fe2O3
Chemical formula: Fe2O3
b)
c) Crystallographic parameters
Crystal system: Rhombohedral
Space group: R-3c
Space group number: 167
a (Å): 5.0356
b (Å): 5.0356
c (Å): 13.7489
Alpha (°): 90.0000
Beta (°): 90.0000
Gamma (°): 120.0000
Calculated density (g/cm^3): 5.27
Measured density (g/cm^3): 5.26
Volume of cell (10^6 pm^3): 301.93
Z: 6.00
RIR: 2.40

Appendix
141
d) Subfiles and Quality
Subfiles: Inorganic
Mineral
Alloy, metal or intermetalic
Corrosion
Common Phase
Educational pattern
Forensic
NBS pattern
Pharmaceutical
Pigment/Dye
Quality: Star (S)
e) Comments
Color: Dark reddish brown
General comments: Opaque mineral optical data on specimen from Elba, R1R0=30.2,
RR2Re=26.1, Disp.=16, VHN=1038 (mean at 100, 200, 300), Color values=1
.299, .309, 29.8, 2 .299, .309, 25.7.
Pattern reviewed by Syvinski, W., McCarthy, G., North Dakota State Univ.,
Fargo, North Dakota, USA, ICDD Grant-in-Aid (1990). Agress well with
experimental and calculated patterns.
Additional weak reflection [indicated by brackets] was observed.
Sample source: Sample from Pfizer, Inc., New York, USA, heated at 800 C for 3 days.
Optical data: A=2.94, B=3.22, Sign=-
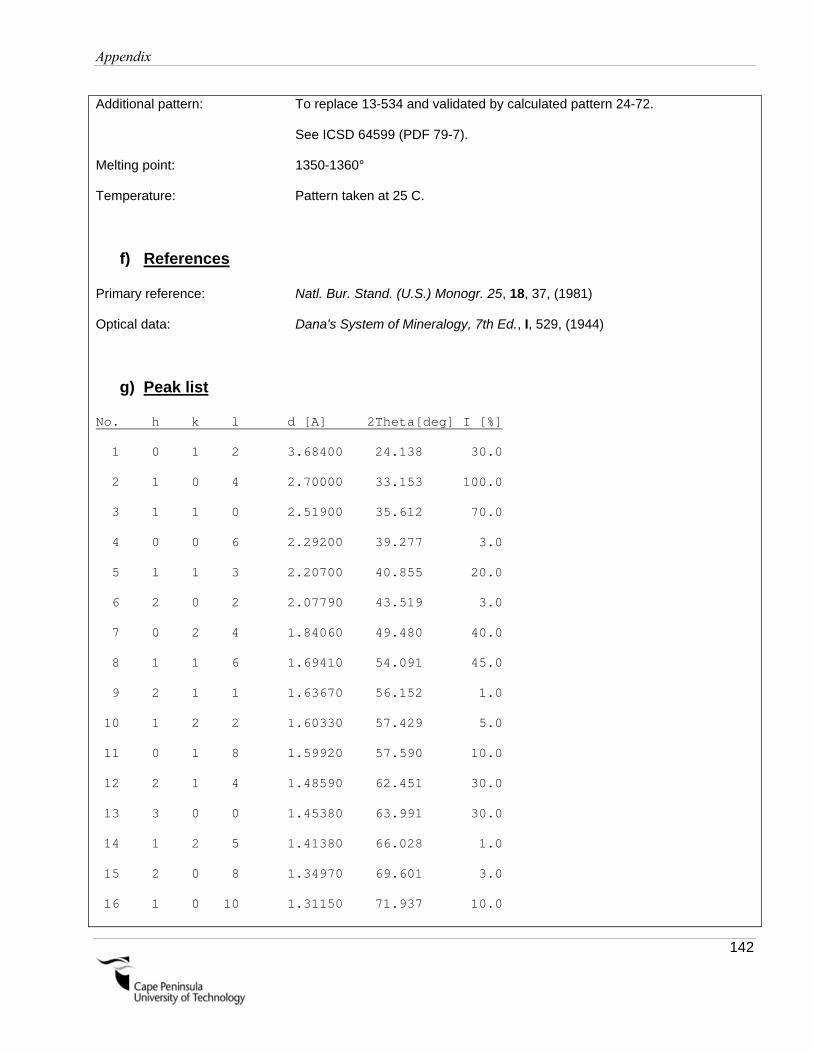
Appendix
142
Additional pattern: To replace 13-534 and validated by calculated pattern 24-72.
See ICSD 64599 (PDF 79-7).
Melting point: 1350-1360°
Temperature: Pattern taken at 25 C.
f) References
Primary reference: Natl. Bur. Stand. (U.S.) Monogr. 25, 18, 37, (1981)
Optical data: Dana's System of Mineralogy, 7th Ed., I, 529, (1944)
g) Peak list
No. h k l d [A] 2Theta[deg] I [%]
1 0 1 2 3.68400 24.138 30.0
2 1 0 4 2.70000 33.153 100.0
3 1 1 0 2.51900 35.612 70.0
4 0 0 6 2.29200 39.277 3.0
5 1 1 3 2.20700 40.855 20.0
6 2 0 2 2.07790 43.519 3.0
7 0 2 4 1.84060 49.480 40.0
8 1 1 6 1.69410 54.091 45.0
9 2 1 1 1.63670 56.152 1.0
10 1 2 2 1.60330 57.429 5.0
11 0 1 8 1.59920 57.590 10.0
12 2 1 4 1.48590 62.451 30.0
13 3 0 0 1.45380 63.991 30.0
14 1 2 5 1.41380 66.028 1.0
15 2 0 8 1.34970 69.601 3.0
16 1 0 10 1.31150 71.937 10.0
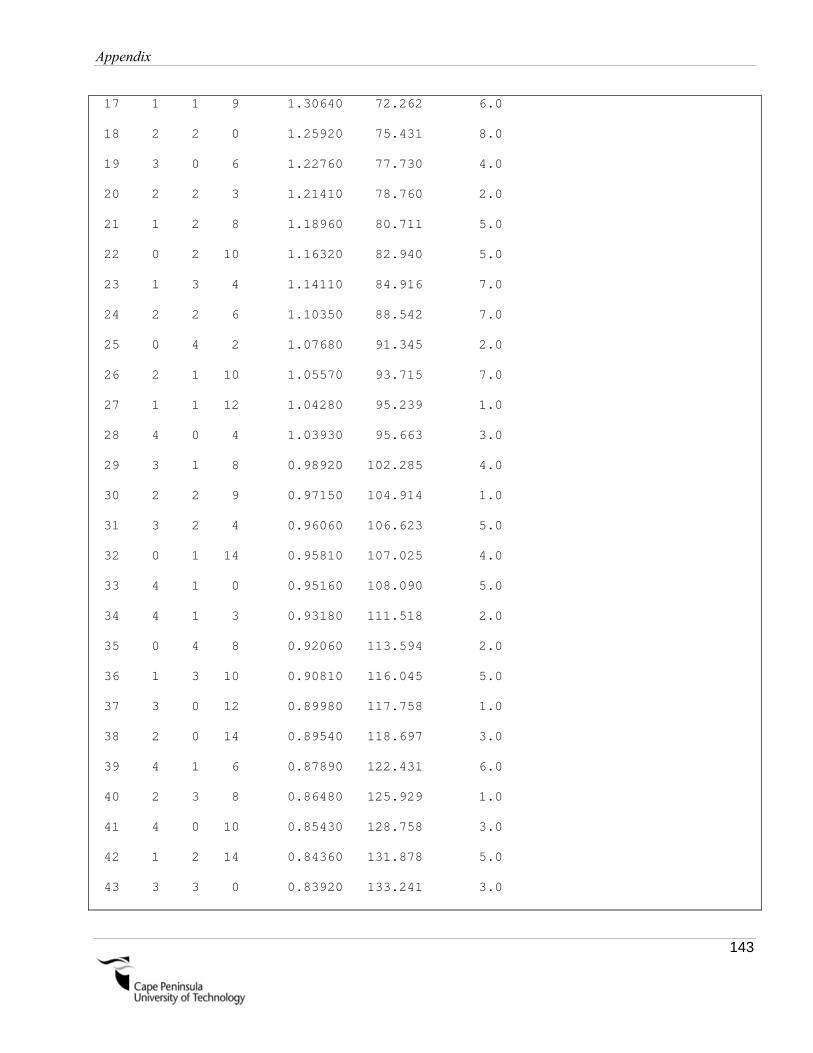
Appendix
143
17 1 1 9 1.30640 72.262 6.0
18 2 2 0 1.25920 75.431 8.0
19 3 0 6 1.22760 77.730 4.0
20 2 2 3 1.21410 78.760 2.0
21 1 2 8 1.18960 80.711 5.0
22 0 2 10 1.16320 82.940 5.0
23 1 3 4 1.14110 84.916 7.0
24 2 2 6 1.10350 88.542 7.0
25 0 4 2 1.07680 91.345 2.0
26 2 1 10 1.05570 93.715 7.0
27 1 1 12 1.04280 95.239 1.0
28 4 0 4 1.03930 95.663 3.0
29 3 1 8 0.98920 102.285 4.0
30 2 2 9 0.97150 104.914 1.0
31 3 2 4 0.96060 106.623 5.0
32 0 1 14 0.95810 107.025 4.0
33 4 1 0 0.95160 108.090 5.0
34 4 1 3 0.93180 111.518 2.0
35 0 4 8 0.92060 113.594 2.0
36 1 3 10 0.90810 116.045 5.0
37 3 0 12 0.89980 117.758 1.0
38 2 0 14 0.89540 118.697 3.0
39 4 1 6 0.87890 122.431 6.0
40 2 3 8 0.86480 125.929 1.0
41 4 0 10 0.85430 128.758 3.0
42 1 2 14 0.84360 131.878 5.0
43 3 3 0 0.83920 133.241 3.0

Appendix
144
44 3 2 10 0.80890 144.457 4.0
45 2 4 4 0.80140 147.971 4.0
h) Stick Pattern

Appendix
145
Minerological, chemical and structural information for hydronium iron jarosite particles (JCPDS card no:
21-0932)
a) Name and formula
Reference code: 00-021-0932
Mineral name: Hydronium jarosite, syn
PDF index name: Iron Sulfate Hydroxide Hydrate
Empirical formula: Fe3H9O15S2
Chemical formula: Fe3 ( SO4 )2 ( OH )5 ·2H2O
b) Crystallographic parameters
Crystal system: Rhombohedral
Space group: R3m
Space group number: 160
a (Å): 7.3559
b (Å): 7.3559
c (Å): 17.0100
Alpha (°): 90.0000
Beta (°): 90.0000
Gamma (°): 120.0000

Appendix
146
Calculated density (g/cm^3): 3.00
Volume of cell (10^6 pm^3): 797.09
Z: 3.00
RIR: -
c) Status, subfiles and quality
Status: Marked as deleted by ICDD
Subfiles: Inorganic
Mineral
Quality: Indexed (I)
d) Comments
Deleted by: Deleted by 31-650.
Color: Golden yellow
General comments: Rhombohedral axes: a0=7.085, =62.56.
Synthesized by Mme. Walter-Levy (University Caen).
To replace 2-597 and 18-644.
Additional pattern: To replace 18-515, 18-653.
e) References
Primary reference: Technisch Physische Dienst, Delft, Netherlands., ICDD Grant-in-Aid, (1968)

Appendix
147
Unit cell: Dana's System of Mineralogy, 7th Ed., 2, 566
f) Peak list
No. h k l d [A] 2Theta[deg] I [%]
1 1 0 1 5.97000 14.827 16.0
2 0 0 3 5.67000 15.616 18.0
3 0 1 2 5.10000 17.374 100.0
4 1 1 0 3.68000 24.165 10.0
5 1 0 4 3.54000 25.136 4.0
6 0 2 1 3.13000 28.494 90.0
7 1 1 3 3.09000 28.871 65.0
8 0 1 5 3.00000 29.757 2.0
9 2 0 2 2.98400 29.920 4.0
10 0 0 6 2.83500 31.532 4.0
11 0 2 4 2.54900 35.179 10.0
12 2 0 5 2.32500 38.697 2.0
13 1 2 2 2.31800 38.818 2.0
14 1 0 7 2.27100 39.655 10.0
15 1 1 6 2.24700 40.097 2.0
16 3 0 0 2.12500 42.507 2.0
17 2 1 4 2.09500 43.146 2.0
18 3 0 3 1.99000 45.547 20.0
19 0 2 7 1.93300 46.969 4.0
20 0 0 9 1.89100 48.077 2.0
21 2 2 0 1.83900 49.526 30.0
22 2 0 8 1.76700 51.690 2.0

Appendix
148
23 2 2 3 1.74900 52.262 4.0
24 3 1 2 1.73000 52.880 4.0
25 2 1 7 1.71100 53.514 2.0
26 1 3 4 1.63100 56.366 4.0
27 1 2 8 1.59400 57.796 2.0
28 4 0 1 1.58500 58.155 4.0
29 0 4 2 1.56600 58.930 4.0
30 2 2 6 1.54200 59.940 8.0
31 0 2 10 1.50000 61.799 6.0
32 4 0 4 1.49100 62.213 2.0
33 3 2 1 1.45600 63.883 2.0
34 0 4 5 1.44200 64.578 4.0
35 1 3 7 1.42900 65.238 2.0
g) Stick Pattern
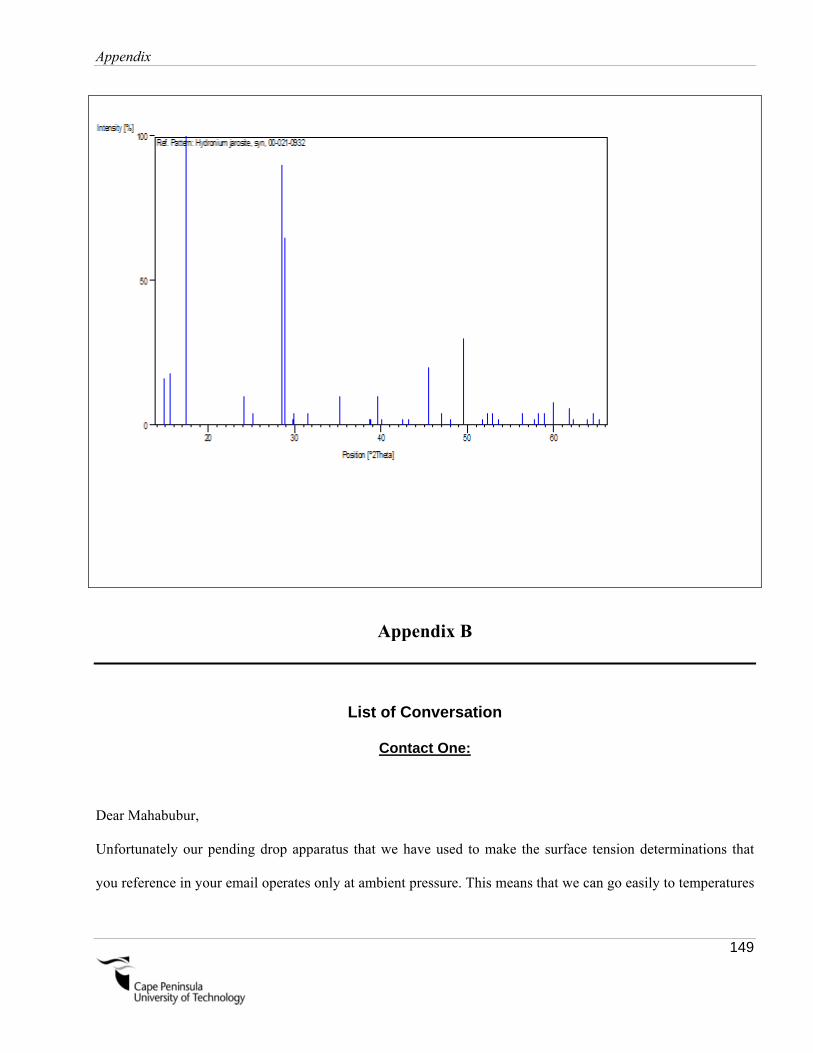
Appendix
149
Appendix B
List of Conversation
Contact One:
Dear Mahabubur,
Unfortunately our pending drop apparatus that we have used to make the surface tension determinations that
you reference in your email operates only at ambient pressure. This means that we can go easily to temperatures

Appendix
150
around 100ºC but we cannot go to pressures of 200-300 kPa (which in the case of alcohol or water mixtures are
necessary in order to establish liquid-vapour equilibria inside the chamber). I am sorry that I can not help you.
Good luck with your wok,
Cheers
José Nuno
On Aug 26, 2013, at 1:13 PM, Mahabubur Chowdhury <[email protected]> wrote:
> Good day prof. Lopes,
>
> I hope this email finds you well. I am writing to you in regard of
> measurement of surface tension at high temperature and pressure. I have
> read your paper "High-temperature surface tension and density
> measurements of 1-alkyl-3-methylimidazolium bistriflamide ionic liquids,
> 2010". My research field is in material science. I have submitted a
> paper in the Journal of crystal growth, which evaluates the functional
> relationship between solvent surface tension and particle growth rate.
> However the editor will only accept the paper if i show the surface
> tension of the solvents at hydrothermal conditions (at 100 degree c and
> 200-300 kPa. ) I would like to know if you can assist me with measuring
> the surface tension of 4 different alcohols, (Pure alcohol: 1. methanol,
> 2. ethanol, 3. propanol and 4. butanol: and also 50: 50 mixture of the
> same alcohol+water. ) at this specific temperature and pressure? You
> Can charge me with the cost to run the experiments or you can co-author

Appendix
151
> the paper as it will be accepted once the data is provided and the paper
> is revised. So you can decide how you would like to do this. Please let
> me know. I thank you in advance and hope to hear from you soon.
>
>
> With regards
> Mahabubur
>
>
> M.R.Chowdhury
> Chemical Engineering
> Flow Process Research Centre (FPRC)
> Cape Peninsula University of Technology (CPUT)
> P.O. Box 652, Cape Town 8000 ,South Africa
> Tel: +27 837882309
> Office: +27 (-021)- 4603496
>Email (optional)[email protected]
>http://www.cput.ac.za/flowpro/
> --------------------------------------------------------------------
> Disclaimer
> This e-mail transmission contains confidential information,
> which is the property of the sender.
> The information in this e-mail or attachments thereto is
> intended for the attention and use only of the addressee.
> Should you have received this e-mail in error, please delete

Appendix
152
> and destroy it and any attachments thereto immediately.
> Under no circumstances will the Cape Peninsula University of
> Technology or the sender of this e-mail be liable to any party for
> any direct, indirect, special or other consequential damages for any
> use of this e-mail.
> For the detailed e-mail disclaimer please refer to
>http://www.cput.ac.za/email.php or call +27 (0)21 460 3911
>
> Email secured by Check Point
Email secured by Check Point
Contact two:
Hi,
We do not have the means to measure against pressure.
Kind regards.
Luis Paulo Rebelo
At 13:13 26-08-2013, Mahabubur Chowdhury wrote:
>Good day Prof. Rebelo,
>
>I hope this email finds you well. I am writing to you in regard of
>measurement of surface tension at high temperature and pressure. I have
>read your paper "High-temperature surface tension and density
>measurements of 1-alkyl-3-methylimidazolium bistriflamide ionic liquids,

Appendix
153
>2010". My research field is in material science. I have submitted a
>paper in the Journal of crystal growth, which evaluates the functional
>relationship between solvent surface tension and particle growth rate.
>However the editor will only accept the paper if i show the surface
>tension of the solvents at hydrothermal conditions (at 100 degree c and
>200-300 kPa. ) I would like to know if you can assist me with measuring
>the surface tension of 4 different alcohols, (Pure alcohol: 1. methanol,
>2. ethanol, 3. propanol and 4. butanol: and also 50: 50 mixture of the
>same alcohol+water. ) at this specific temperature and pressure? You
>can charge me with the cost to run the experiments or you can co-author
>the paper as it will be accepted once the data is provided and the paper
>is revised. So you can decide how you would like to do this. Please let
>me know. I thank you in advance and hope to hear from you soon.
>
>
>With regards
Mahabubur
>M.R.Chowdhury
>Chemical Engineering
>Flow Process Research Centre (FPRC)
>Cape Peninsula University of Technology (CPUT)
>P.O. Box 652, Cape Town 8000 ,South Africa
>Tel: +27 837882309
>Office: +27 (-021)- 4603496

Appendix
154
>Email (optional)[email protected]
>http://www.cput.ac.za/flowpro/
>--------------------------------------------------------------------
>Disclaimer
>This e-mail transmission contains confidential information,
>which is the property of the sender.
>The information in this e-mail or attachments thereto is
>intended for the attention and use only of the addressee.
>Should you have received this e-mail in error, please delete
>and destroy it and any attachments thereto immediately.
>Under no circumstances will the Cape Peninsula University of
>Technology or the sender of this e-mail be liable to any party for
>any direct, indirect, special or other consequential damages for any
>use of this e-mail.
>For the detailed e-mail disclaimer please refer to
>http://www.cput.ac.za/email.php or call +27 (0)21 460 3911
>
>Email secured by Check Point
>
>__________ Information from ESET NOD32 Antivirus, version of virus
>signature database 8729 (20130826) __________
>
>The message was checked by ESET NOD32 Antivirus.
>
>http://www.eset.com

Appendix
155
Email secured by Check Point
Contact three:
Dear Sir:
I am sorry to say that I have retired and my lab has been dismantled.
The surface tension equipment has been moved to the lab of Dr Michael
Pegg. I am not sure if he has an available technician to do this work
for you.
I am copying this email to him and he will get back to you if he is
able to do this for you for a fee.
Chris Watts
Quoting Mahabubur Chowdhury <[email protected]>:
> Good day prof. watts,
>
> I hope this email finds you well. I am writing to you in regard of
> measurement of surface tension at high temperature and pressure. I have
> read your paper "Surface tensions of petro-diesel, canola, jatropha and
> soapnut biodiesel fuels at elevated temperatures and pressures, 2013".
> My research field is in material science. I have submitted a paper in
> the Journal of crystal growth, which evaluates the functional

Appendix
156
> relationship between solvent surface tension and particle growth rate.
> However the editor will only accept the paper if i show the surface
> tension of the solvents at hydrothermal conditions (at 100 degree c and
> 200-300 kPa) I would like to know if you can assist me with measuring
> the surface tension of 4 different alcohols, (Pure alcohol: 1. methanol,
> 2. ethanol, 3. propanol and 4. butanol: and also 50: 50 mixture of the
> same alcohol + water) at this specific temperature and pressure? You
> can charge me with the cost to run the experiments or you can co-author
> the paper as it will be accepted once the data is provided and the paper
> is revised. And also this experiment will provide novel data as high
> temperature and pressure surface tension measurements of these four
> alcohol is not presented in the literature. So you can decide how you
> would like to do this, either co-authorship or charge me for your
> service. Please let me know. I thank you in advance and hope to hear
> from you soon.
> With regards
> Mahabubur
> M.R.Chowdhury
> Chemical Engineering
> Flow Process Research Centre (FPRC)
> Cape Peninsula University of Technology (CPUT)
> P.O. Box 652, Cape Town 8000 ,South Africa
> Tel: +27 837882309
> Office: +27 (-021)- 4603496

Appendix
157
>Email (optional) [email protected]
>http://www.cput.ac.za/flowpro/
> --------------------------------------------------------------------
> Disclaimer
> This e-mail transmission contains confidential information,
> which is the property of the sender.
> The information in this e-mail or attachments thereto is
> intended for the attention and use only of the addressee.
> Should you have received this e-mail in error, please delete
> and destroy it and any attachments thereto immediately.
> Under no circumstances will the Cape Peninsula University of
> Technology or the sender of this e-mail be liable to any party for
> any direct, indirect, special or other consequential damages for any
> use of this e-mail.
> For the detailed e-mail disclaimer please refer to
>http://www.cput.ac.za/email.php or call +27 (0)21 460 3911
>
> Email secured by Check Point
Contact four:
Mahabubur,
Thanks for your interest in our interfacial tension analysis service. However, I regret to say that we do not have
capacity to help this autumn. Please, note also that although production of reference data for pure systems like
those mentioned is valuable as such, we work on a commercial basis and would have to charge for such
services. Our services are aimed at the oil industry and our instruments are designed for very much higher

Appendix
158
pressure than 200-300 kPa. If you can find some laboratory at a university doing interfacial tension
measurement at the relatively low pressures you request, I think that would be your best option. Such
instruments would probably be better suited for the requested pressure range, the work would be less expensive
(our services are maybe too expensive to be charged to a private person) and you might find someone who
could collaborate with you one the publication instead of charging for the service.
Best regards
Bard Bjorkvik
From: Mahabubur Chowdhury [mailto:[email protected]]
Sent: 04 September 2013 15:58
To: Bård Bjørkvik
Subject: Interfacial tension measurement
Good day,
I hope this email finds you well. I am writing to you in regard of measurement of surface tension at high
temperature and pressure. I have read an article from SINTEF regarding the surface tension measurement (I
have attached the pdf), My research field is in material science. I have submitted a paper in the Journal of
crystal growth, which evaluates the functional relationship between solvent surface tension and particle growth
rate. However the editor will only accept the paper if i show the surface tension of the solvents at hydrothermal
conditions (at 100 degree c and 200-300 kPa) I would like to know if you can assist me with measuring the
surface tension of 4 different alcohols, (Pure alcohol: 1. methanol, 2. ethanol, 3. propanol and 4. butanol: and
also 50: 50 mixture of the same alcohol + water) at this specific temperature and pressure? You can charge me
with the cost to run the experiments or you can co-author the paper as it will be accepted once the data is
provided and the paper is revised. And also this experiment will provide novel data as high temperature and

Appendix
159
pressure surface tension measurements of these four alcohol is not presented in the literature. So you can decide
how you would like to do this, either co-authorship or charge me for your service. Please let me know. I thank
you in advance and hope to hear from you soon.
With regards
Mahabubur
M.R.Chowdhury
Chemical Engineering
Flow Process Research Centre (FPRC)
Cape Peninsula University of Technology (CPUT)
P.O. Box 652, Cape Town 8000 ,South Africa
Tel: +27 837882309
Office: +27 (-021)- 4603496
Email (optional)[email protected]<mailto:[email protected]>
http://www.cput.ac.za/flowpro/
Contact five:
Good day Prof. Lamia and Dr. Piri,
I hope this email finds both of you well. I am writing to you in regard of measurement of surface tension at
high temperature and pressure. Your contacts were forwarded to me by Bård Bjørkvik from SINTEF Norway.
My research field is in material science. I have submitted a paper in the Journal of crystal growth, which
evaluates the functional relationship between solvent surface tension and particle growth rate. However the
editor will only accept the paper if i show the surface tensions of the solvents at hydrothermal conditions (at 100

Appendix
160
degree c and 200-300 kPa) I would like to know if you can assist me with measuring the surface tension of 4
different alcohols, (Pure alcohol: 1. methanol, 2. ethanol, 3. propanol and 4. butanol: and also 50: 50 mixture of
the same alcohol + water) at this specific temperature and pressure? You can charge me with the cost to run the
experiments or you can co-author the paper as it will be accepted once the data is provided and the paper is
revised. And also this measured experimental data will be novel data as high temperature and pressure surface
tension measurements of these four alcohol is not presented in the literature so far. So you can decide how you
would like to do this, either co-authorship or charge me for your service. Please let me know. I am in desperate
need as the date for the re-submission of the paper is the 6th of October 2013. I thank you in advance and hope
to hear from you soon.
With regards
Mahabubur
M.R.Chowdhury
Chemical Engineering
Flow Process Research Centre (FPRC)
Cape Peninsula University of Technology (CPUT)
P.O. Box 652, Cape Town 8000,South Africa
Tel: +27 837882309
Office: +27 (-021)- 4603496
Email (optional)[email protected]
http://www.cput.ac.za/flowpro/
NO response