Embed Size (px)
Citation preview
2.6 MODELS OF TEMPERATURE STRUCTURE AND GENERAL CIRCULATION
J. B. Pollack
Rival Models of T i t an ' s Atmosphere
Most o f t h i s paper w i l l deal with greenhouse models of T i t an ' s atmosphere. Towards t h e end, I w i l l summarize some work done by Leovy and myself, i n which elementary, general c i r c u l a t i o n models o f i t s atmosphere are considered. This l a t t e r subjec t has s ign i f i cance both f o r providing es t imates of hor izonta l tem- pe ra tu re va r i a t ions and i n i l luminat ing another unique c h a r a c t e r i s t i c of T i t an ' s atmosphere.
Up u n t i l recent ly , i n f r a r e d br ightness- tempera ture measurements of Ti tan have been in t e rp re t ed within t h e context of greenhouse models. Such models imagine t h a t the atmospheric pressure i s s u f f i c i e n t l y high s o t h a t t h e lower atmosphere i s opaque over almost a l l wavelengths containing l a rge amounts o f thermal r ad ia t ion . Accordingly, t h e surface temperature i s much higher than the e f f e c t i v e temperature a t which t h e s a t e l l i t e r ad ia t e s t o space and the lower atmosphere i s charac ter ized by a decrease o f temperature with an increase i n a l t i t u d e . High in f r a red br ightness temperatures a re in t e rp re t ed as occurring a t wavelengths of reduced atmospheric opaci ty , which permit pene t r a t ion t o warmer temperature l eve l s .
An a l t e r n a t i v e model has been proposed by Danielson, e t a l . (1973). Accord- i ng t o t h i s view, the upper atmosphere i s heated t o a high temperature through t h e absorption o f much of t h e s o l a r energy reaching the s a t e l l i t e and t h e surface has a temperature c lose t o t h e e f f e c t i v e temperature. In t h i s case, high i n f r a - red br ightness temperatures a re understood as occurring a t wavelengths t h a t a re f a i r l y opaque, permi t t ing a view of the warm upper atmosphere. Danielson's model considers almost a l l of t he atmosphere t o be a t a high temperature, with only a narrow region next t o t h e surface serving as a t r a n s i t i o n region between the two temperature extremes.
Danielson's model i s p a r t i a l l y supported by recent narrow-band measurements made i n the 8 t o 13 micron region by G i l l e t t e t a l . (1973). As d e t a i l e d below, -- a t l e a s t p a r t of these observations do r e f e r t o a warm upper atmosphere. I t t he re fo re seems appropriate t o reconsider my greenhouse models, (Pollack, 1973), which were based on broad-band i n f r a r e d measurements.
There are two ques t ions t h a t need t o be addressed and these a re q u i t e sepa- r a t e from one another. The f i r s t concerns i t s e l f with the o r i g i n of t h e high br ightness temperatures found i n t h e 8 t o 13 micron region. There is a con- tinuum of poss ib le answers t o the f i r s t question: A t some wavelengths the r ad i - a t ion may a r i s e from a hot upper atmosphere and, a t t h e remaining wavelengths, from a hot lower atmosphere. The ends of t h i s continuum a re the pure Danielson model and t h e pure greenhouse model.
The second question concerns i t s e l f with whether o r not t h e surface has a temperature s i g n i f i c a n t l y above the e f f e c t i v e temperature. In p r inc ip l e , one could imagine a s i t u a t i o n i n which a l l t h e 8 t o 13 micron r ad ia t ion came from a hot upper atmosphere and ye t t h e r e was a s i g n i f i c a n t greenhouse e f f e c t i n t h e lower atmosphere. For example, clouds could prevent our viewing t h e lower atmos- phere a t wavelengths shortward of 13 um. The answer t o t h i s second question may
https://ntrs.nasa.gov/search.jsp?R=19740012373 2018-06-24T02:13:55+00:00Z
be c ruc ia l i n assess ing t h e f e a s i b i l i t y of a Ti tan Entry Probe mission. I f t h e r e is a s i g n i f i c a n t greenhouse e f f e c t , t h e surface pressure would be high enough, s o t h a t measurements from an Entry Probe could commence well above the surface . This s i t u a t i o n would not necessa r i ly hold i f Danielson's model i s co r rec t .
Greenhouse Model Revisi ted
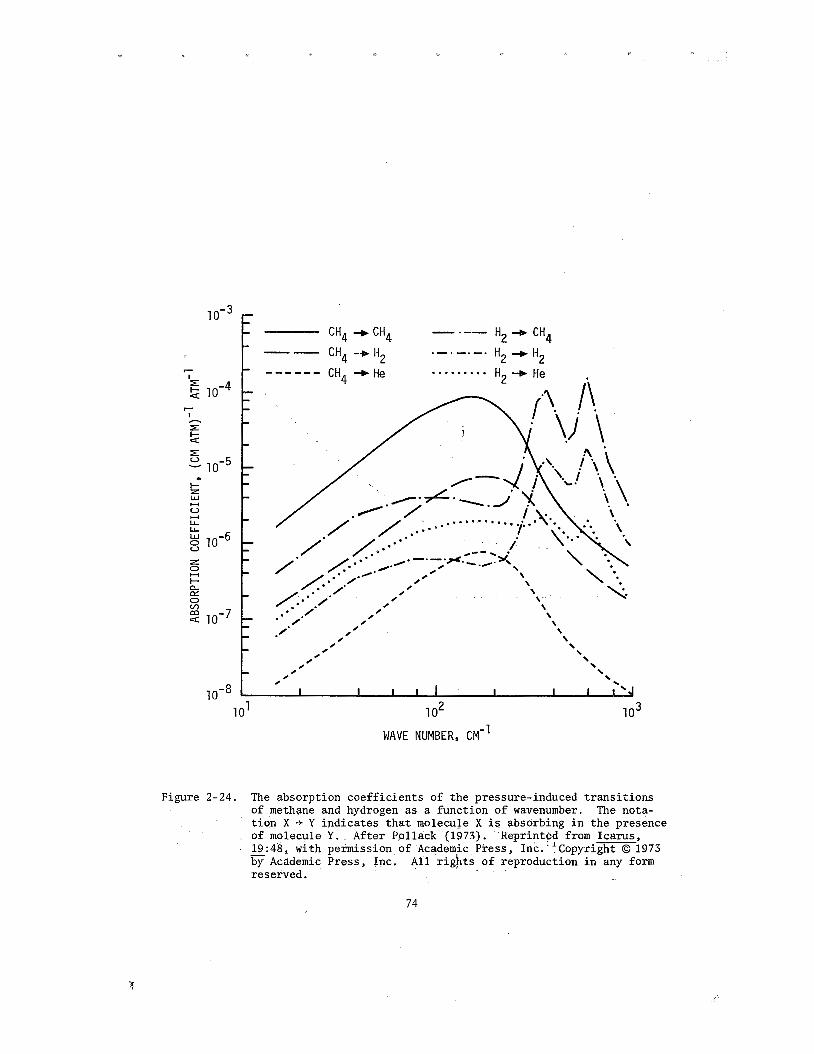
Let us now review my p r i o r greenhouse ca lcula t ions . Because of T i t a n ' s low e f f e c t i v e temperature, t h e only way t o achieve a la rge greenhouse e f f e c t i s by means of pressure-induced absorptions. Figure 2-24 i l l u s t r a t e s t h e absorp- t i o n coe f f i c i en t o f t h e pressure-induced t r a n s i t i o n s of hydrogen and methane as a function o f wavenumber. The nota t ion X -+ Y i nd ica t e s t h a t molecule X is ab- sorbing i n t h e presence of molecule Y. To cause a s i g n i f i c a n t greenhouse e f f e c t the wavenumber region from about 50 cm-l t o 700 cm-l should be opaque. We see from Figure 2-24 t h a t i n an atmosphere containing comparable amounts o f methane and hydrogen, as is perhaps suggested by the spectroscopic observation, t h e methane and hydrogen opacity complement one another q u i t e n i ce ly . Where the hydrogen absorption is weak, t h e methane absorption is s t rong and v ice versa .
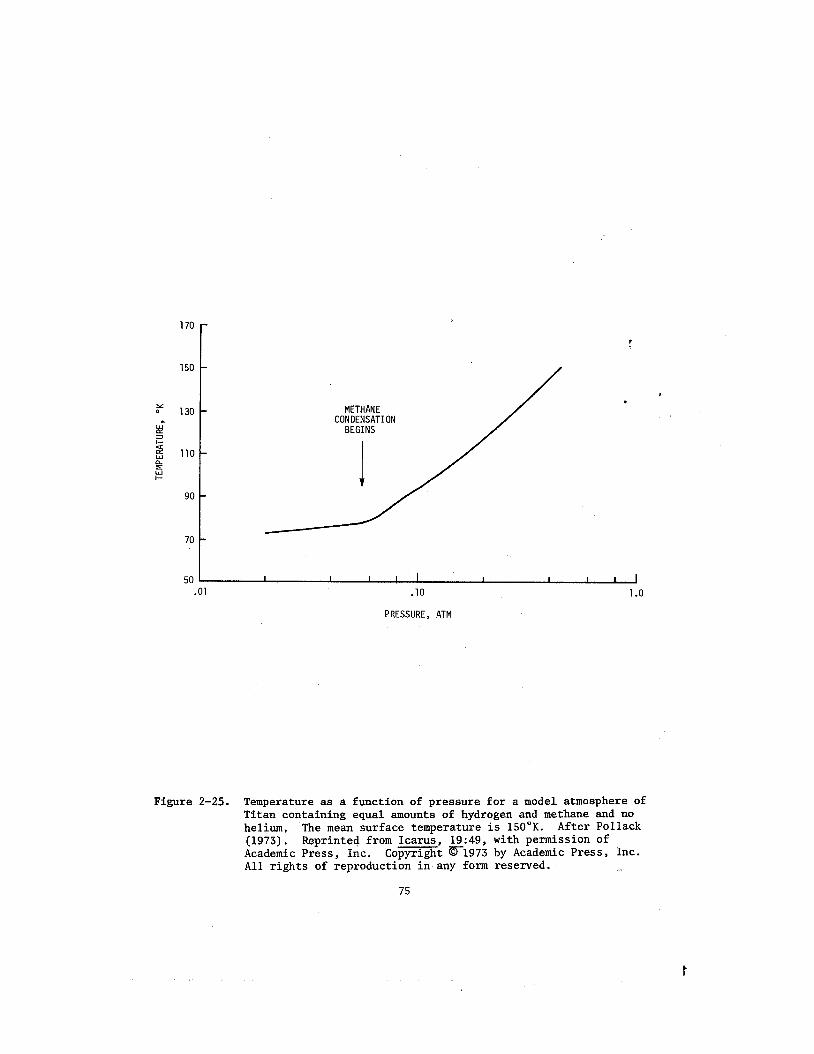
Figure 2-25 shows a determination of t h e pressure-temperature s t r u c t u r e of an atmosphere containing equal amounts o f hydrogen and methane and having a sur- face temperature of 1 5 0 ' ~ . We see t h a t t he atmospheric temperature begins t o rapid ly increase with pressure above a pressure l eve l of 0.1 atm. Put another way, i n an atmosphere of t h i s composition, i f t h e surface pressure i s above 0.1 atm, the re w i l l be a s i g n i f i c a n t greenhouse e f f e c t . The spect roscopica l ly de- termined gas amounts of methane and hydrogen ind ica t e pressures o f severa l hun- dredths of an atmosphere. The amounts of methane and hydrogen a re comparable, as long as the re is no o the r major component t o the atmosphere, such as n i t r o - gen. Trafton has shown t h a t much of t h e l i n e formation takes p lace i n t h e v i c i n i t y o f a cloud layer . Therefore, the surface pressure i s s i g n i f i c a n t l y g r e a t e r than severa l hundredths of an atmosphere and i s c lose t o o r above the c r i t i c a l value of 0.1 atm needed f o r a greenhouse e f f e c t t o become important.
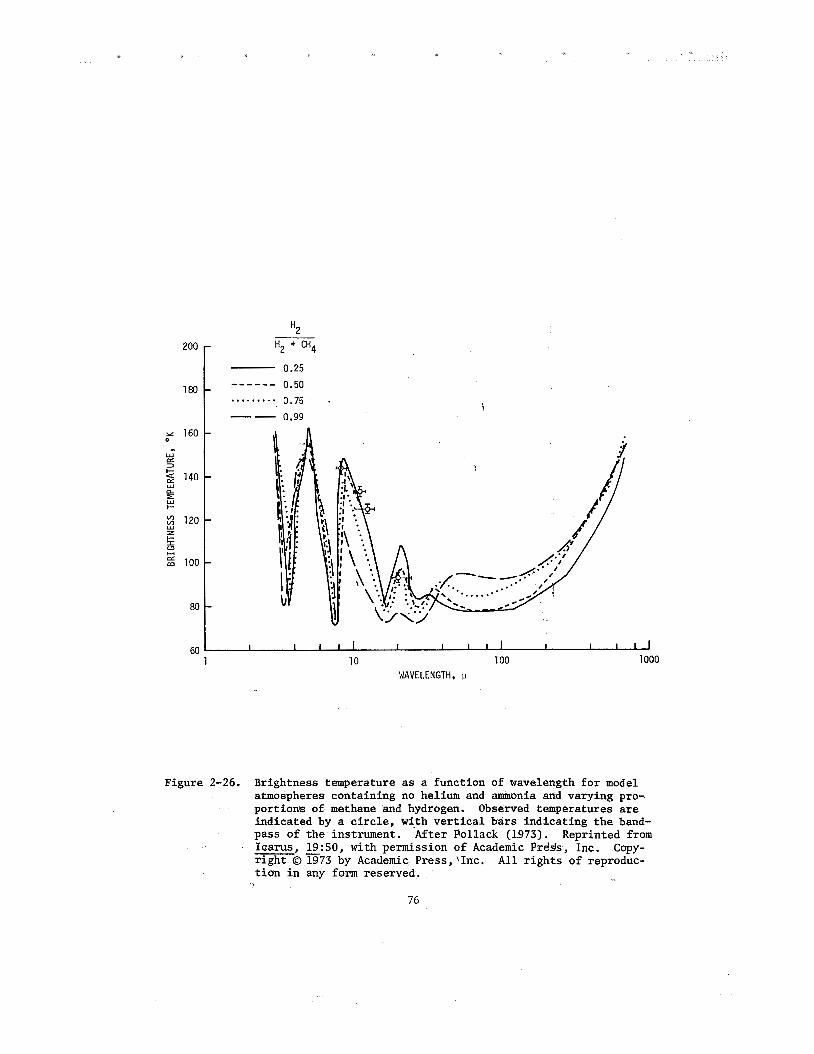
Using model atmospheres of t h e type shown i n Figure 2-25, I ca l cu la t ed the dependence of br ightness temperature on wavelength. Figure 2-26 i l l u s t r a t e s t h i s dependence f o r atmospheres containing only methane and hydrogen. The curves are labeled according t o t h e value of t he hydrogen mixing r a t i o assumed. Also shown as c i r c l e s a re the four broad-band observations, ava i l ab le a t t he time the ca l cu la t ion was performed. The hor izonta l b a r through the c i r c l e represents t h e band pass o f t h e instrument used, while t h e v e r t i c a l ba r i nd ica t e s t h e est imated e r r o r i n t h e br ightness temperature value.
The 20-micron observation provides a good discriminant of t he hydrogen mixing r a t i o f o r t h i s s e t of model atmospheres. This poin t i s f u r t h e r i l l u s - t r a t e d i n Figure 2-27, where the t h e o r e t i c a l spec t r a have been convoluted over t he instrument band pass a t 20 ym. We see t h a t approximately even proport ions of hydrogen and methane a re implied by t h e observed br ightness temperature.
Table 2-5 summarizes t h e broad-band observations t h a t have cu r ren t ly been made, as well as t h e recent narrow-band r e s u l t s o f G i l l e t t , e t a l . (1973). The broad-band values used f o r Figure 2-26 a re marked with a s t a r . The narrow-band observations force us t o reconsider our i n t e r p r e t a t i o n of t h e 8113 micron spect ra .
WAVE NUMBER, CM-I
Figure 2-24. The absorption coefficients of the pressure-induced transitions of methane and hydrogen as a function of wavenumber. The nota- tion X -+ Y indicates that molecuJe X is absorbing in the presence of molecule Y. - After Pollack (1973). Reprinted from Icarus, 19 :48, with permission of Academic Press, Inc. ' ' copyright O 1973 - by Academic Press, Inc. All rights of reproduction in any form reserved.
METHANE CONDENSATION
BEGINS
PRESSURE, ATM
Figure 2-25. Temperature as a function of pressure for a model atmosphere of Titan containing equal amounts of hydrogen and methane and no helium. The mean surface temperature is 150°K. After Pollack (1973). Reprinted from Icarus, 19:49, with permission of Academic Press, Inc. Copyright v1973 by Academic Press, Inc. All rights of reproduction in any form reserved.
60 1 I I 1 1 1 I I I r l I I I 1 1 1 10 100 1000
WAVELENGTH, p
Figure 2-26. Brightness temperature as a function of wavelength for model atmospheres containing no helium and ammonia and varying pro- portions of methane and hydrogen. Observed temperatures are indicated by a circle, with vertical bars indicating the band- pass of the instrument. After Pollack (1973). Reprinted from Icarus 19:50, with permission of Academic Prdgs, Inc. Copy- -' - right O 1973 by Academic Press,\Inc. All rights of reproduc- tion in any form reserved.
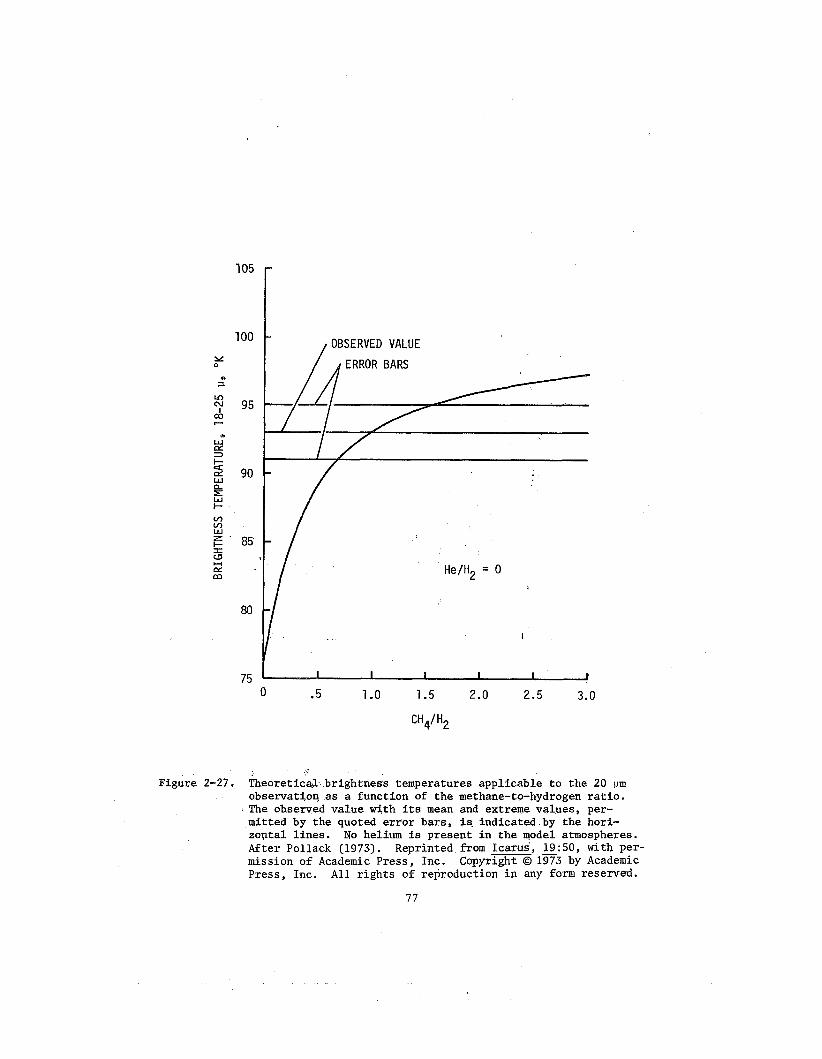
Figure 2-27. Theoretic& brightness temperatures applicable to the 20 urn observatioq as a function of the methane-to-hydrogen ratio. The observed value with its mean and extreme values, per- mitted by the quoted error bars, is. indicated by the hori- zoptal lines. No helium is present in the model atmospheres. After Pollack (1973). Reprinted from Icarus, 2 : 5 0 , with per- mission of Academic Press, Inc. Copyright @ 1973 by Academic Press, Inc. All rights of reproduction in any form reserved.
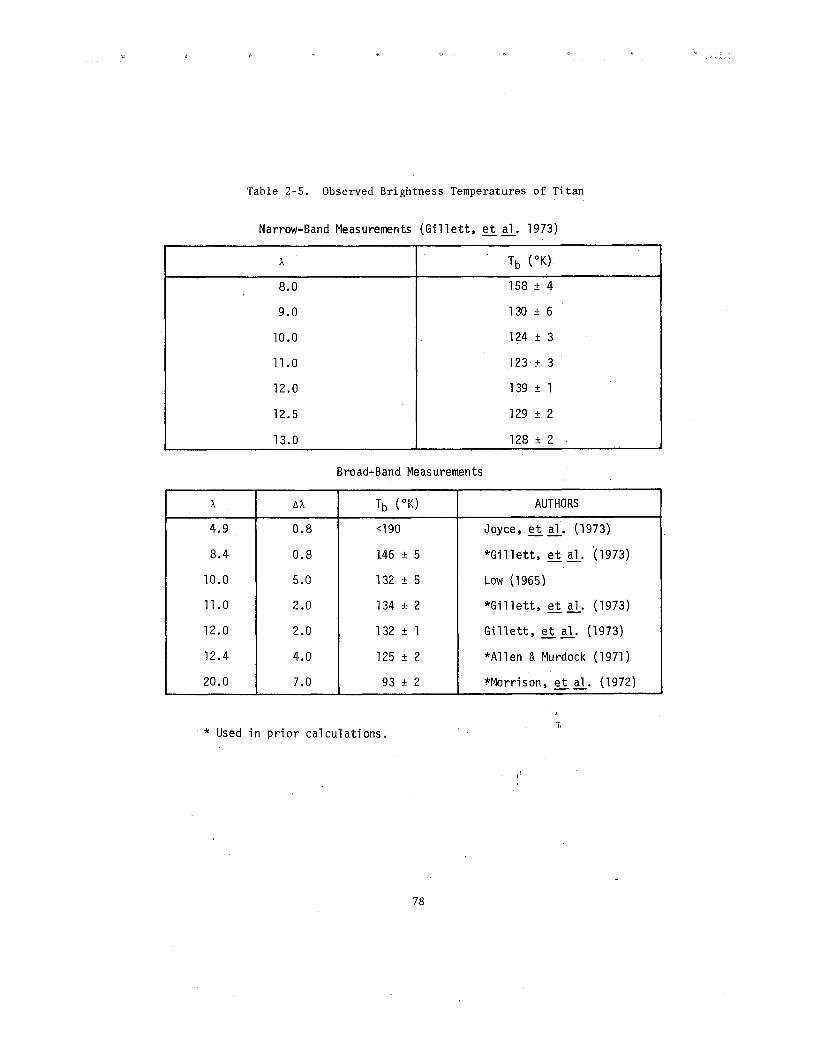
Table 2-5. Observed Brightness Temperatures o f Titan
Narrow-Band Fleasurements (Gi 11 e t t , e t a1 . 1973)
Broad-Band Measurements
* Used in p r io r ca lcula t ions .
+
AUTHORS
Joyce, e t a l . (1973)
*Gi l l e t t , e t a l . (1973)
Low (1965)
*Gi l l e t t , e t a l . (1973)
G i l l e t t , e t a l . (1973)
*A1 len & Murdock (1 971 )
*Morrison, e t a l . (1972)
x
4.9
8.4
10.0
11 . O
12.0
12.4
20.0
A X
0.8
0.8
5 .O
2 .O
2.0
4.0
7.0
Tb ( O K )
<I90
146 -+ 5
132 +_ 5
134 + 2
132 + 1
125 + 2
93 ? 2
The measurement a t 8.0 pm l i e s well within a very s t rong methane band centered a t 7.7 pm. For the type of atmosphere discussed above, containing approximately equal proport ions o f hydrogen and methane, o p t i c a l depth uni ty a t 8.0 pm i s reached a t about the l o m 3 atm l eve l . This inference was based on labora tory measurements o f the 7.7 pm methane fundamental. Thus we a re l ed t o conclude t h a t t h e upper atmosphere i s q u i t e warm and t h a t a t l e a s t some o f t he radia- t i o n i n the 8 t o 13 micron region comes from t h e upper atmosphere. In addi- t i o n , t he apparent l oca l peak i n br ightness temperature near 12 pm may be due t o r ad ia t ion within a s t rong band of ethane, a s suggested by Danielson, e t a l . (1973) .
According t o Danielson's model, t h e remainder of t h e high br ightness tem- pera ture r ad ia t ion i n the 8 t o 13 micron region should be a t t r i b u t e d t o a warm upper atmosphere, with the opaci ty being supplied by a d i f fuse haze l aye r located throughout t h e atmosphere, which hascbeen photochemically generated. The haze i s no t o p t i c a l l y th i ck a t t hese wavelengths and i t s opacity i s decl in ing with increas ing wavelength. Thus, i n t h i s model t he re i s some contr ibut ion from the cool surface .
However, t h e remaining por t ions of t he 8 t o 13 micron region can equal ly well be understood within the context of a greenhouse model. According t o Fig- ure 2-26, t h e br ightness temperature near 12.5 pm should be about 115 '~ ; t h i s p red ic t ion i s cons is tent with t h e observations i f we allow f o r t h e r a t h e r s i ze - able unce r t a in t i e s i n the shape o f the f a r wings of t h e hydrogen ro t a t iona l l i n e s , which a re responsible f o r t he 12.5-micron opacity. These wings have been mea- sured only f o r Hz -t Hz, not f o r H2 + CH4. The l a t t e r i s by f a r t he more impor- t a n t f o r Titan. G i l l e t t l s 13-micron observation is incons i s t en t with Danielson's model. However, it may not be inconsis tent with some va r i an t of t h i s model.
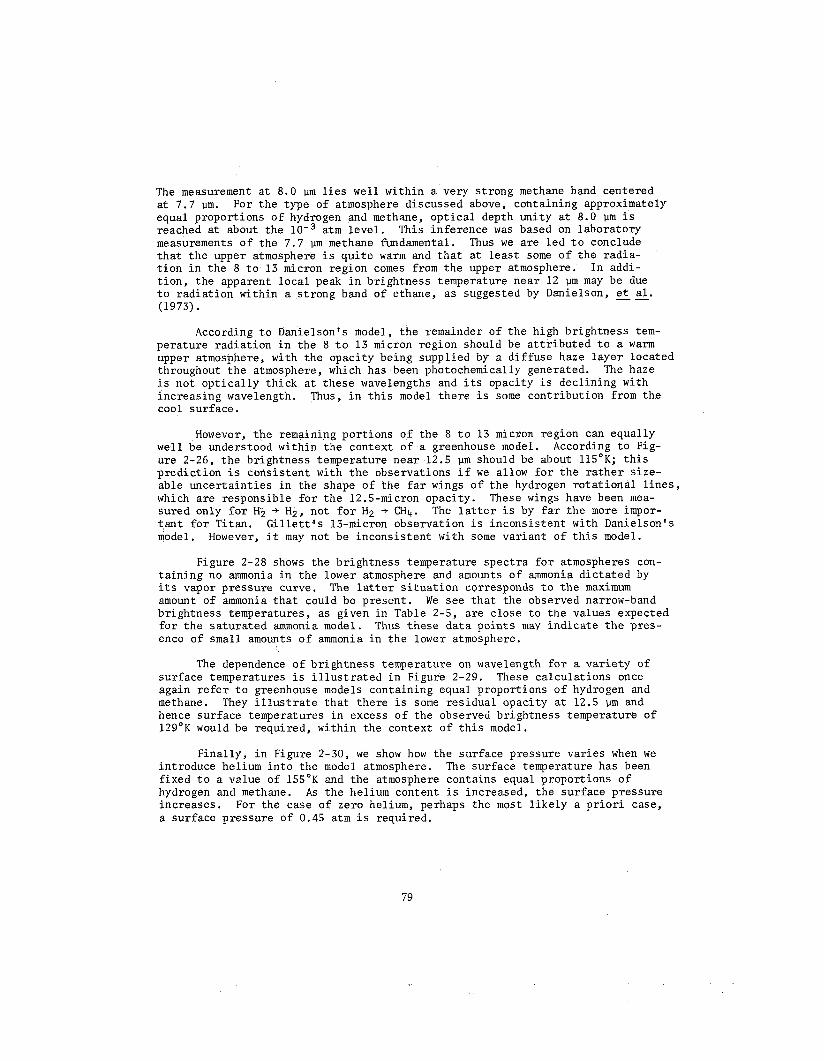
Figure 2-28 shows the br ightness temperature spec t r a f o r atmospheres con- t a i n i n g no ammonia i n the lower atmosphere and amounts o f ammonia d i c t a t e d by i t s vapor pressure curve. The l a t t e r s i t u a t i o n corresponds t o t h e maximum amount of ammonia t h a t could be present . We see t h a t t he observed narrow-band br ightness temperatures, as given i n Table 2-5, a r e c lose t o t h e values expected f o r t h e sa tu ra t ed ammonia model. Thus these d a t a po in t s may ind ica t e t h e pres- ence of small amounts o f ammonia i n the lower atmosphere.
The dependence of br ightness temperature on wavelength f o r a va r i e ty of surface temperatures i s i l l u s t r a t e d i n Figure 2-29. These ca lcula t ions once again r e f e r t o greenhouse models containing equal proport ions o f hydrogen and methane. They i l l u s t r a t e t h a t t he re i s some re s idua l opaci ty a t 12.5 pm and hence surface temperatures i n excess o f the observed br ightness temperature of 12g°K would be required, within the context of t h i s model.
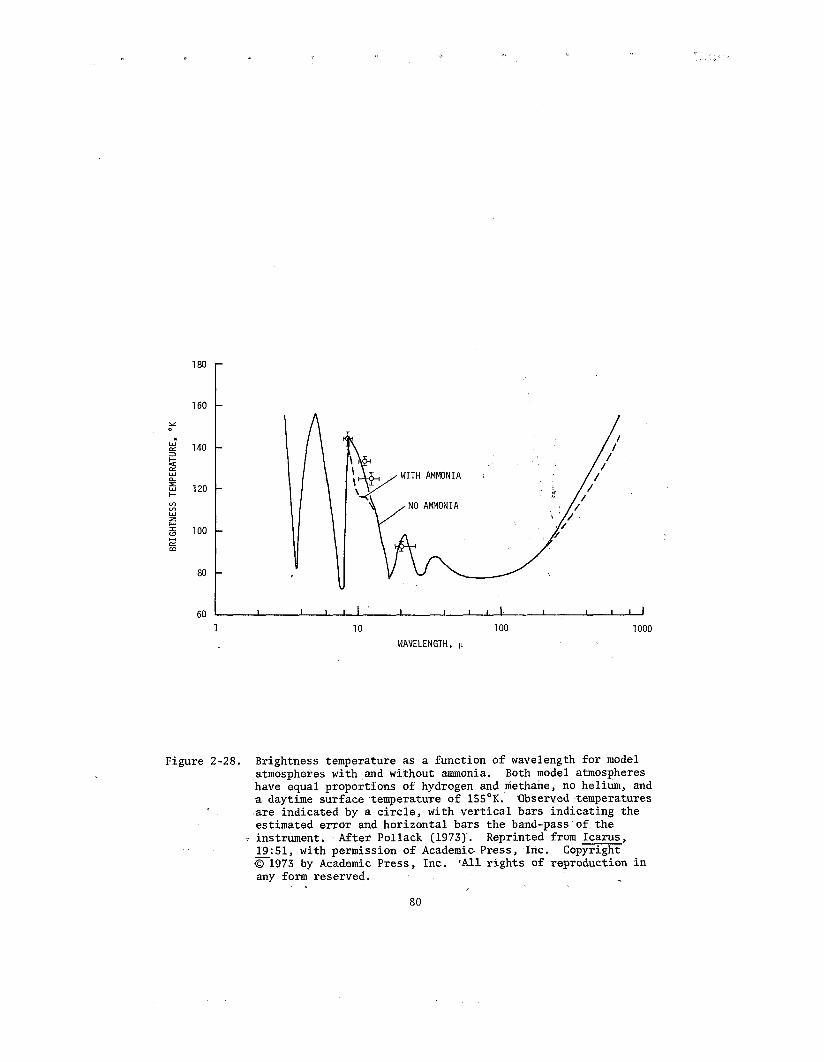
F inal ly , i n Figure 2-30, we show how the surface pressure va r i e s when we introduce helium i n t o the model atmosphere. The surface temperature has been f ixed t o a value of 1 5 5 ' ~ and the atmosphere contains equal proport ions o f hydrogen and methane. As t he helium content i s increased, t he surface pressure increases . For the case of zero helium, perhaps the most l i k e l y a p r i o r i case, a surface pressure of 0.45 atm i s required.
60 I I I I I ' I I I 1 1 I I I 1 1 1 10 100 1000
WAVELENGTH, p
Figure 2-28. Brightness temperature as a function of wavelength f o r model atmospheres with and without ammonia. Both model atmospheres have equal proportions of hydrogen and methane, no helium, and a daytime surface temperature of 155OK. Observed temperatures a re indicated by a c i r c l e , with v e r t i c a l bars indicat ing the estimated e r ro r and horizontal bars the band-pass of the instrument. After Pollack (1973). Reprinted from Icarus, 19:51, with permission of Academic Press, Inc. Copyright 5 1 9 7 3 by Academic Press, Inc. 'All r i g h t s of reproduction i n any form reserved.
80

rrl
I-'.
00
C w m
h) I h)
\O
cgcg
;$E
,$z'
r
ru
c~
cl
nn
8"
a
ww
o e
s o
w
Y
(D
WN
PO
(D
V) 1
r
.s
yo
$ (D
rt'
d rt
rn ao
cI.
I+E
F$i
V,
'dw
rP
.0
m m
m
YO
r
ra
m
o
cD
wm
1m
a
rt
Y'
S"
%
a
3P
.m
w
n(
~r
rr
t
& w
mw
O
Qo
w
g2
:*
Wr
."$
mg
o
gr
tc
rt
mm
(D
am
5
mn
sm
a
ca
el+
E
CG
S
. p.3
. $ ;I;f
$09,
OZ
>"a
I-'.
'd
9
-dr.
rn
om
wm
Y
Or
r(D
P,
00
0
J
(D
wr
r4
'dY
V
, Y
c(
(D
P0
w
o
oa
wn
s
v
wc
dw
+
no
b(D
Fa
Z
pl
wa
om
g
rS
??
BRIG
HTNE
SS T
EMPE
RATU
RE,
OK
Figure 2-30. Surface pressure as a function of the helium-to-hydrogen ratio for model atmospheres having equal proportions of methane and hydrogen and a surface temperature of 15S°K. After Pollack (1973). Reprinted from Icarus, 19:53, with permission of Academic Press, Inc. Copyright m 9 7 3 by Academic Press, InC. All rights of reproduction in any form reserved.
82
Future Observations
Above we have seen t h a t it i s not poss ib l e t o deduce a unique model o f the atmosphere of Titan from t h e present ly e x i s t i n g data. A t some of t h e wave- lengths i n the 8 t o 13 micron region, e.g. , 8.0 pm, t h e r ad ia t ion undoubtedly o r ig ina t e s from a warm upper atmosphere; however a t o the r wavelengths, e.g., 10, 11, 12.5, and 13 pm, t h e r ad ia t ion may o r ig ina t e e i t h e r from a warm upper atmosphere o r a warm lower atmosphere. The d i s t i n c t i o n between lower and upper atmosphere as used here i s d h a t t h e lower atmosphere is envisioned as o p t i c a l l y th i ck a t a l l important thermal wavelengths, i . e . , 15 pm < A < 200 pm, while t he reverse i s t r u e of t he upper atmosphere. Even should fu tu re observations i n the 8 t o 13 micron region show t h a t a l l t he r ad ia t ion i n t h i s region comes from a hot upper atmosphere, the p o s s i b i l i t y o f a hot lower atmosphere could not be dismissed.
Future spec t r a l observations of Titan a t wavelengths longward o f 15 pm can determine whether t h e lower atmosphere and surface have s i g n i f i c a n t l y h igher temperatures than the e f f e c t i v e temperatures. Radio observations permit a d i r e c t determination of t he surface temperature and a re discussed elsewhere i n t h i s re- po r t . Here we consider t he s ign i f i cance of fu tu re spec t r a l i n f r a r e d observations beyond 15 pm. As can be seen from Figures 2-24 and 2-26, greenhouse models pre- d i c t the presence of severa l s p e c t r a l f ea tu re s i n t h i s wavelength region. In p a r t i c u l a r , t h e r e should be comparatively sharp fea tures centered a t 17 and 28 pm due t o hydrogen pressure induced t r a n s i t i o n s and a broader f ea tu re centered close t o 50 pm due t o the sum of the methane pressure-induced t r a n s i t i o n s . Whether these f ea tu res show up as absorption o r emission fea tures depends on t h e exact tempera- t u r e s t r u c t u r e of the atmosphere. In t h i s regard, Figure 2-26 should no t be taken l i t e r a l l y . However, i f the greenhouse model i s co r rec t , t hese fea tures should be present . Groundbased measurements within the 20-micron region w i l l permit a search f o r p a r t of t h e s t r u c t u r e expected from the hydrogen t r a n s i t i o n s , while observa- t i ons from t h e C-141 a i r c r a f t w i l l permit a view of t he e n t i r e spec t r a l region o f i n t e r e s t .
Clouds
According t o Danielson's model, aerosols produced photochemically should be present throughout the e n t i r e atmosphere. In addi t ion , severa l types o f condensa- t i on clouds may a l so be present . The model atmosphere shown i n Figure 2-25 be- comes cold enough i n t h e upper p a r t of t he troposphere f o r methane t o condense out . This occurs nea r t he 5 x atm pressure level . However, whether such clouds w i l l indeed e x i s t i n t he atmosphere of Titan depends on the d e t a i l s of t h e s o l a r energy deposit ion p r o f i l e . The model atmosphere ca lcula ted i n Figure 2-25 was based upon the assumption t h a t a l l t he s o l a r energy is deposited a t t he sur- face. The exis tence of a warm upper atmosphere, as discussed above, may mean t h a t the tropopause i"s too warm t o permit methane condensation anywhere i n the atmos- phere. However, i t i s worth not ing t h a t s eve ra l independent p ieces o f evidence, discussed elsewhere i n t h i s r epor t , suggest t h e presence of clouds with a de f i - n i t e bottom, located nea r t he pressure l eve l s expected f o r t he methane clouds.
We have a l so seen i n t h i s discussion t h a t t he new 10 and 11 micron narrow- band temperatures may imply the.presence o f ammonia-in t h e lower atmosphere. A t the temperatures appropriate t o Titan ammonia i s severely l imi ted by its sa tura- t i on vapor pressure curve and, hence, ammonia clouds may be present i n t h e lower

atmosphere. The poss ib le presence of ammonia i n the lower atmosphere needs t o be fac tored i n t o considerations of p o t e n t i a l cons t r a in t s on t h e communication l ink between a Titan Probe and i t s Relay Bus.
So la r Energy Deposition
The above greenhouse ca lcula t ions have been performed assuming t h a t a l l t h e s o l a r energy deposit ion takes p lace a t t h e surface . It i s q u i t e legi t imate t o inqui re whether t hese r e s u l t s w i l l s i g n i f i c a n t l y be modified i f one allows f o r la rge amounts of s o l a r energy deposit ion within the atmosphere, because of absorption by both t h e near i n f r a r e d v ib ra t ion bands o f methane and those of t h e cloud aerosols . A somewhat analogous s i t u a t i o n e x i s t s f o r Venus, where a b r igh t cloud l aye r i n the upper troposphere absorbs some of t he inc ident sun- l i g h t and t h e atmosphere absorbs a s i g n i f i c a n t f r ac t ion of t h e sunl ight pene- t r a t i n g beneath the clouds. Yet t h e recent Venera-8 Probe has shown t h a t some sunl ight does reach t h e surface and i s probably responsible f o r t he high surface temperature i n the sense of a c l a s s i c a l greenhouse e f f e c t . This s i t u a t i o n is a l s o cons i s t en t with greenhouse ca l cu la t ions I have performed f o r Venus, which ind ica t e t h a t even large amounts o f s o l a r energy absorption within the atmos- phere do not s i g n i f i c a n t l y change t h e greenhouse e f f e c t . We conclude t h a t i f Titan has a massive enough atmosphere (say, a surface pressure g rea t e r than 0.1 atm), it w i l l have a s i g n i f i c a n t greenhouse e f f e c t .
Atmospheric Dynamics
Scal ing the equations o f motion, Leovy and Pollack (1973) have made a f i r s t es t imate of t h e atmospheric dynamics o f Titan. They considered both ba roc l in i c and a x i a l l y symmetric general c i r cu la t ion models and concluded t h a t the l a t t e r was much more probable. T i t a n ' s c i r cu la t ion may represent an inpor- t a n t intermediate case between the ba roc l in i c c i r cu la t ion typ ica l of mid-lat i tude regions on the Earth and Mars on the one hand and t h e symmetric c i r c u l a t i o n of Venus on the o the r hand. Ti tan is r o t a t i n g slowly enough t o have a symmetric c i r cu la t ion . Yet i n cont ras t t o Venus, which r o t a t e s much slower, c o r i o l i s e f f e c t s a r e probably q u i t e important f o r Ti tan . Conceivably by studying T i t an ' s c i r cu la t ion , as might be poss ib le with a multiprobe, second generation mission t o Titan, we might obtain important i n s i g h t s i n t o the c i r cu la t ion of t h e Ear th ' s equa to r i a l regions.
A second important aspect o f Leovy and Pollack's study is t h e i r es t imates of hor izonta l temperature gradients within T i t an ' s atmosphere and along i t s sur- face. Let us f i r s t consider t he atmosphere. The d iurnal va r i a t ion i s severe ly r e s t r i c t e d by simple considerations o f thermal i n e r t i a . Assuming t h a t the atmos- phere i s o p t i c a l l y th i ck a t a l l thermal wavelengths, t h a t t he surface pressure
. is 1 /3 of a bar , and t h a t t h e period of ro t a t ion equals t h e o r b i t a l period, they f ind a d iurnal temperature amplitude of 0.03'K. To f i r s t order t h i s r e s u l t w i l l s c a l e inverse ly as t h e surface pressure and so w i l l remain q u i t e small, even f o r the smal les t sur face pressure considered l i k e l y ( ~ 2 x lo-* atm). Equator t o pole temperature va r i a t ions a re l imi ted by the atmospheric meridional c i r cu la t ion . , F o r the same condit ions given above, Leovy and Pollack est imate a l a t i t u d i n a l tempera- t u r e va r i a t ion on the order of O.l°K. This va r i a t ion sca l e s approximately as t h e surface pressure t o the (-5/3) power. A s a r e s u l t , t h i s va r i a t ion could be i m - po r t an t a t the lowest poss ib le values of su r face pressure ( ~ 1 0 mb) .
We next t u rn t o Leovy and Pol lack ' s es t imates o f surface temperature va r i - a t ions . In t h e case o f a s t rong greenhouse e f f e c t , the atmospheric r ad ia t ion w i l l severe ly r e s t r i c t these temperature va r i a t ions . For example, with a mean surface temperature of 15O0K, t h e surface temperature amplitude i s l e s s than lS°K. In the case of Danielson's model, r ad ia t ion from t h e atmosphere a l so serves t o prevent extremely l a rge temperature va r i a t ions . However, the atmos- phere, which i n t h i s model r ad ia t e s e f f e c t i v e l y only on t h e Wien t a i l of t he blackbody function, may be l e s s e f f e c t i v e n e s r t he poles than nea r t he equator as a r e s u l t of the meridional cooling discussed above. Danielson rqsumed t h a t there was no meridional cooling.
I t i s not c l e a r t h a t Danielson's model i s e n t i r e l y cons is tent , el'en within the context o f h i s ca lcula t ions . According t o t h i s model, t h e amount of methane i n the atmosphere is cont ro l led by the temperature o f t he summer pole, which he f inds t o be 80°K. The corresponding abundance o f methane i s 2 km-A. However, as discussed above, t h e observed abundance of 2 km-A may be s i g n i f i c a n t l y l e s s than the t o t a l atmospheric content of methane, s ince most of t h e l i n e formation takes place nea r a d i s c r e t e cloud layer . Furthermore, Danielson assumes t h e dominant methane surface i c e i s pure methane, while Lewis suggests t h a t methane c l a t h r a t e i s more l i k e l y . The vapor pressure curve of methane c l a t h r a t e i s orders o f magnitude below t h a t o f s o l i d methane. Danielson's model would be inconsis tent with a surface containing methane c l a t h r a t e .
Conclusions
Titan has a warm upper atmosphere. Whether i t has a warm lower atmosphere and hot surface i s an open question a t present , which fu tu re radio and i n f r a r e d observations from the ground and from a i r c r a f t can help answer. This question i s important not only from a pure ly s c i e n t i f i c poin t of view, but a l so f o r assess- ing t h e v i a b i l i t y of a Titan Entry Probe. A s current en t ry probes would begin t o make measurements a t about t he 7 mb l eve l , t h e value of Ti tan ' s sur face pressure o r a t l e a s t a lower bound i s o f extreme importance.
Sagan: The ammonia curve i n Figure 2-28 i s f a r below an observed broad-band point . I s t h i s cons is tent with your suggestion of ammonia i n the lower atmos- phere?
Pollack: The new narrow-band po in t s a re f a r below t h i s broad-band point . This perhaps ind ica t e s t he presence of another emission l i n e , as suggested by Danielson and Caldwell.
Veverka: From the measured i n f r a r e d spec t r a , can you exclude the presence of la rge amounts o f helium?
Pollack: Unfortunately, no.

Danielson: Your greenhouse models requi re l a rge amounts o f methane, on the order of 40 km-A. With such gas amounts, t he re w i l l be a s i g n i f i c a n t amount of Rayleigh s c a t t e r i n g a t sho r t wavelengths and a l o t of absorption a t longer wavelengths by gaseous methane. In t h i s sense, i s your model cons is tent , t h a t i s , w i l l enough sunl ight reach t h e surface t o cause a greenhouse e f f e c t ?
Pollack: As I discussed above, i t i s even more d i f f i c u l t t o have a greenhouse work i n the case of Venus. Yet, t h e Venera-8 r e s u l t s imply t h a t it i s opera t ive f o r Venq. A greenhouse can work as long as a minimal amount of sunl ight reaches the surfgce. The most s e r ious cons t r a in t on a greenhouse o f Titan i s t h e require- ment t h a t t he atmosphere i s massive enough, t h a t i s , t h a t t h e surface pressure exceeds 0 .1 atm.
Danielson: The s i t u a t i o n f o r Ti tan may be even worse than f o r Venus i n view o f t h e low albedo o f he clouds.
Pollack: Not o p t i c a l depth the clouds- on
r e a l l y . I f t h e clouds have a low albedo because they have an not much above uni ty , then more l i g h t w i l l be t ransmit ted through Ti tan . Furthermore, t h e surface pressures I consider f o r Titan
a re order3 o f magnitude lower than f o r Venus. When Boese f in i shes h i s important labora tory study o f methane a t low temperatures, I hope t o cons t ruc t some green- house models f o r Titan t h a t allow f o r s o l a r energy deposit ion i n t h e atmosphere.
Veverka: In performing the c i r cu la t ion ca l cu la t ions , you made two assumptions t h a t a r e reasonable, but we a re no t su re they are t r u e . One i s t h a t Ti tan has a synchronous r o t a t i o n per iod and the o the r is t h a t i t s ro t a t ion pole l i e s per- pendicular t o the o r b i t a l plane.
Pollack: I would be very su rp r i sed i f Ti tan did not have a synchronous period, s ince we know t h a t o the r l e s s massive s a t e l l i t e s o f Saturn do.
Hunten: Also, t he Lewis models o f t h e i n t e r i o r of Ti tan imply t h a t - i t i s highly d i s s ipa t ive .
Danielson: In t h e case of a t ransparent atmosphere, can f r i c t i o n a l heat ing by winds a t the surface boundary help equal ize t h e surface temperatures?
Pollack: Based on my experience with Mars, I am very skep t i ca l t h a t t h i s would be important. I be l ieve t h e key f a c t o r i s r a d i a t i v e exchange between the atmos- phere and surface , which i s important f o r your model as well as t h e greenhouse mode 1.
Trafton: I f t he re i s a high a l t i t u d e cloud, then i t s bottom would have t o be located i n a zone of changing temperature.
Pollack: As you mentioned i n your t a l k , your observations appear t o imply a d i sc re t e cloud layer. My methane cloud would f i t t h a t requirement, and i t i s located i n a region where t h e temperature i s s t i l l noticeably decreasing i n my model atmospheres. I might mention t h a t it is not a t a l l c l e a r how one would get such a d i sc re t e cloud within the context of Danielson's model.
Hunten: Sagan's photochemically produced aerosols w i l l eventually c o l l e c t as a deposit of brown polymer on t h e surface . I t might be as much as a few k i lo - meters deep. This layer could prevent contact between gaseous methane i n the atmosphere and s o l i d methane c l a t h r a t e and hence v i t i a t e some of t h e above vapor pressure arguments.