Embed Size (px)
Citation preview
The Administration’s goal is to stabilize the housing market and provide security for homeowners. To meet these objectives in the context of a very challenging market, the Administration developed a broad approach implementing state and local housing agency initiatives, tax credits for homebuyers, neighborhood stabilization and community development programs, mortgage modifi cations and refi nancing, housing counseling, continued Federal Housing Administration (FHA) engagement, support for Fannie Mae and Freddie Mac and increased consumer protections. In addition, Federal Reserve and Treasury MBS purchase programs have helped to keep mortgage interest rates at record lows over the past year. More detail on the Administration’s efforts can be found in the Appendix.
December 2010 Scorecard on Administration’s Comprehensive Housing Initiative The President’s housing market recovery efforts began immediately after taking offi ce in February 2009. Data in the scorecard also show that the recovery in the housing market continues to remain fragile. While the recovery will take place over time, the Administration remains committed to its efforts to prevent avoidable foreclosures and stabilize the housing market. The December 2010 housing scorecard includes the following key indicators of market health and results of the Administration’s comprehensive response, as outlined above:
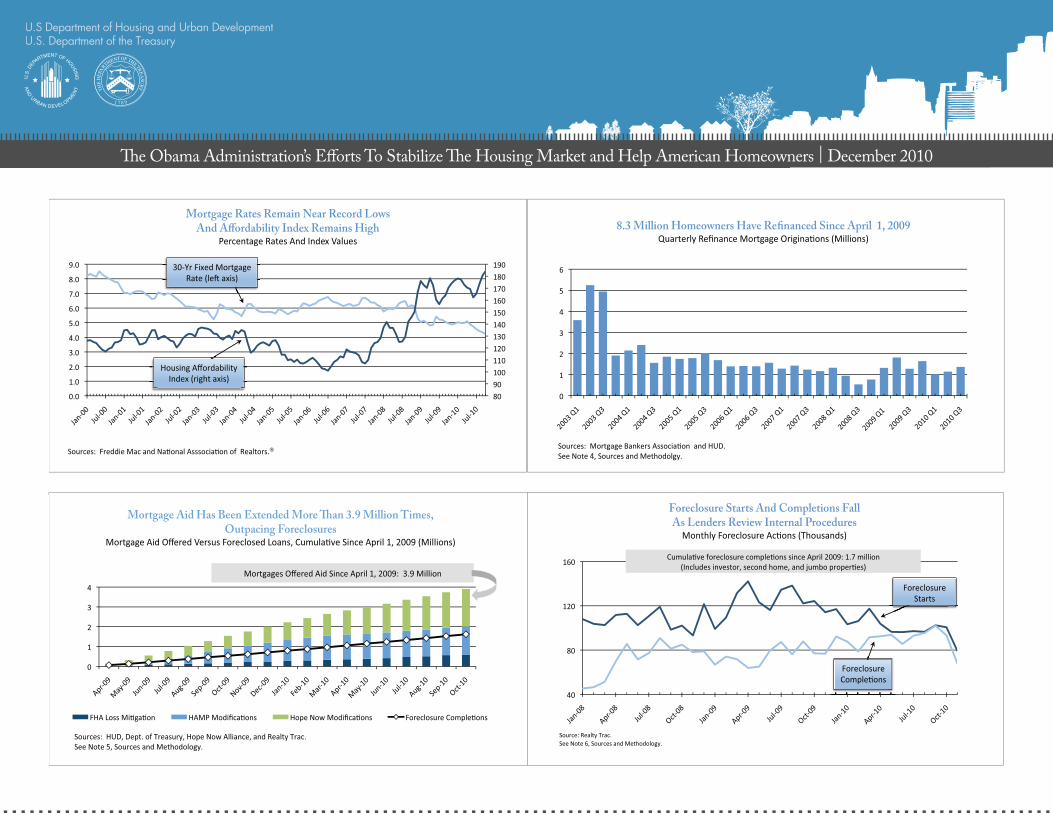
• Foreclosure starts and completions dropped significantly in November. As lenders review internal procedures related to foreclosure processing, many foreclosure actions have been
delayed leading to a 21 percent drop in foreclosure activity in November. While this is the biggest month over month decrease since 2005, the decline is likely to be temporary as lenders eventually revise and resubmit foreclosure paperwork in the coming months.
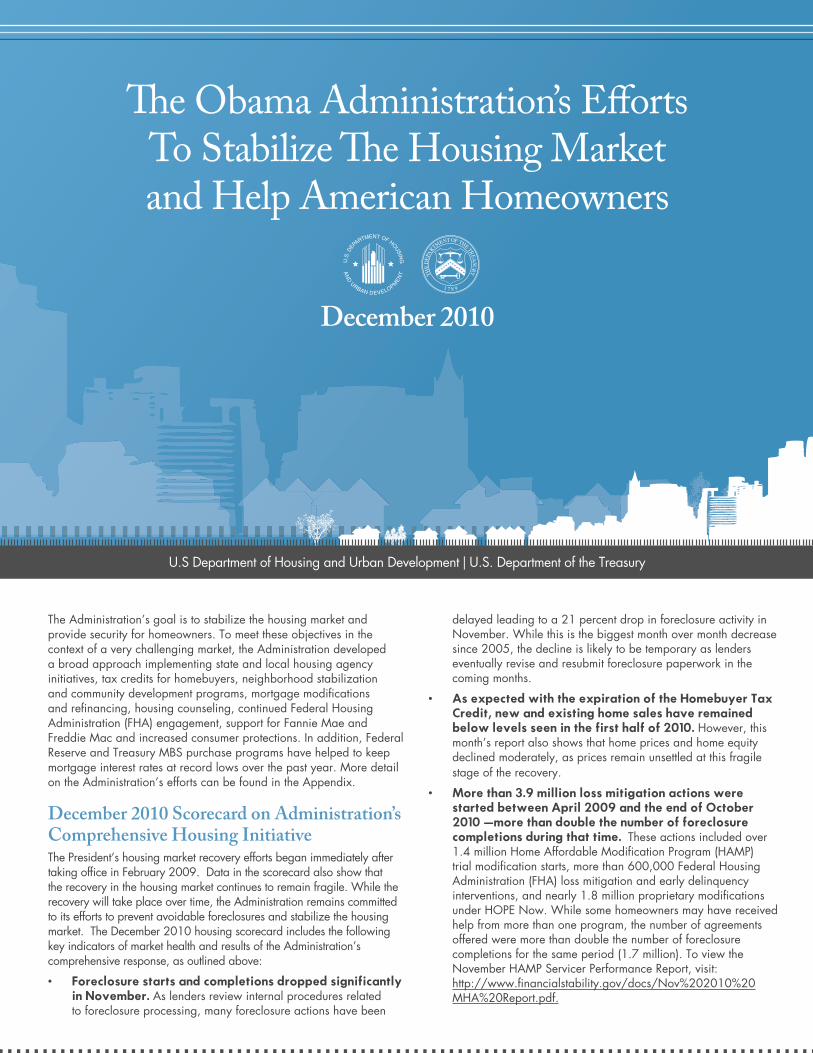
• As expected with the expiration of the Homebuyer Tax Credit, new and existing home sales have remained below levels seen in the first half of 2010. However, this month’s report also shows that home prices and home equity declined moderately, as prices remain unsettled at this fragile stage of the recovery.
• More than 3.9 million loss mitigation actions were started between April 2009 and the end of October 2010 —more than double the number of foreclosure completions during that time. These actions included over 1.4 million Home Affordable Modifi cation Program (HAMP) trial modifi cation starts, more than 600,000 Federal Housing Administration (FHA) loss mitigation and early delinquency interventions, and nearly 1.8 million proprietary modifi cations under HOPE Now. While some homeowners may have received help from more than one program, the number of agreements offered were more than double the number of foreclosure completions for the same period (1.7 million). To view the November HAMP Servicer Performance Report, visit: http://www.fi nancialstability.gov/docs/Nov%202010%20MHA%20Report.pdf.
U.S. Department of Housing and Urban Development | Office of Policy Development and Research
� e Obama Administration’s E� orts To Stabilize � e Housing Market and Help American Homeowners
December 2010
U.S Department of Housing and Urban Development | U.S. Department of the Treasury
U.S Department of H
ousing and Urban Development
U.S. Department of the Treasury
����
����
����
����
����
����
House Prices Unsettled During �is Fragile Stage of Recovery ��������������� ���� ������������������������
��� ����������� ������ ������� ������������������� ��������������
��������������� �������������������
��������������� �
��� �
��� ����������� ������ ������� ������������������� ��������������
��������������� �������������������
��������������� �
�����
��
���
���
���
���
����
����
��
����
����
����
����
Existing And New Home Sales ��������� �������� �����
�� ��� �������������
���������� ��� �������� ��������� ���������������� ��� ��� ���������
�������������������� ����������������
���������
� ���������� �����
��
��
��
��
Existing Homes On �e Market Below Peak, Number Of Units Held Off �e Market Remains High�
���������������� �� ������� ����������������� ������� ��� � �������������������� ��������� � ��������������
��������� ��� �������� �������� ������ ������������� ���
��������������
��� ����
������������ �
����
�������������
� ��������� �����
���
����
����
����
����
����
����
����� ����� ����� ����� ����� ����� ����� ����� ����� ����� �����
Expectations On House Prices Have Shifted Up From 2009�
����� ������������������������������������� ��������������
����������� �� �� ��������� ���� � ��������
������������������� ���������������
����� ����������
������
������������������
� �������
������������������
���������
U.S Department of Housing and Urban DevelopmentU.S. Department of the Treasury
� e Obama Administration’s E� orts To Stabilize � e Housing Market and Help American Homeowners | December 2010
U.S Department of H
ousing and Urban Development
U.S. Department of the Treasury
��
��
��
��
��
��
��
8.3 Million Homeowners Have Re�nanced Since April 1, 2009�
������������� � ������������� �� �������� ����
����������������� ������������ ��� ���� �
������������������� ����������
���
���
����
����
Foreclosure Starts And Completions Fall As Lenders Review Internal Procedures � ������������������ �������� ����
�������������������
������������������� ����������
�������������������������� ���� ����������������������� ��
�� �������� ���������� �������� �����������������
������������
�����������
�������������
�������
� �
� �
� �
�� �
� �
� �
�� �
�� �
�� �
�� �
�� �
�� �
� �
�� �
� �
� �
�� �
�� �
�� �
�� �
�� �
�� �
Mortgage Rates Remain Near Record Lows And A�ordability Index Remains High
����������������������������������
���������������������������������������������������������
�������������������
���������������
������������� ����
�����������������
��
��
��
��
��
Mortgage Aid Has Been Extended More �an 3.9 Million Times, Outpacing Foreclosures �
����������������������������������������������������� ��������������������������
���������������� ���������������� �������������������� ����������������������
������������������������������������������������������������������
����������� �����������������������
�������������������� ������������������������������
U.S Department of Housing and Urban DevelopmentU.S. Department of the Treasury
� e Obama Administration’s E� orts To Stabilize � e Housing Market and Help American Homeowners | December 2010
U.S Department of H
ousing and Urban Development
U.S. Department of the Treasury
��
��
���
���
���
���
�������� �������� �������� ��������
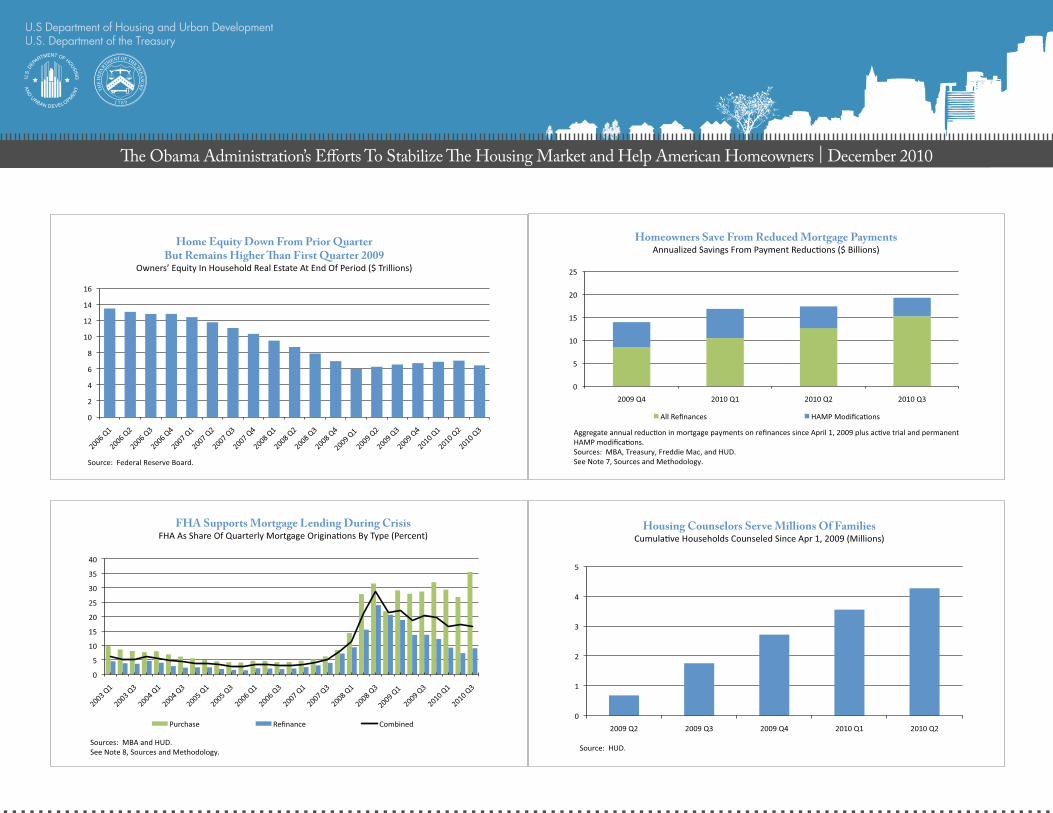
Homeowners Save From Reduced Mortgage Payments ����������� ���������������������������������������
������������� �������������
�����������������������������������������������������������������������������������������������������������
���������������
������������������������������������ ����
����������� ����������������������
��
��
��
��
��
��
�������� �������� �������� �������� ��������
Housing Counselors Serve Millions Of Families ���������� ����������������� ���������������������������
�������� ����
��
��
��
��
��
���
���
���
���
Home Equity Down From Prior Quarter But Remains Higher �an First Quarter 2009
����������������� �������������������������������������������������
�����������������������������
��
��
���
���
���
���
���
���
���
FHA Supports Mortgage Lending During Crisis� ���� �������������������������������������������������������
�������� ��������� ���������
��������������� ����
����������� ����������������������
U.S Department of Housing and Urban DevelopmentU.S. Department of the Treasury
� e Obama Administration’s E� orts To Stabilize � e Housing Market and Help American Homeowners | December 2010
U.S. Department of Housing and Urban Development | Office of Policy Development and Research� e Obama Administration’s E� orts To Stabilize � e Housing Market and Help American Homeowners | December 2010
U.S Department of Housing and Urban DevelopmentU.S. Department of the Treasury
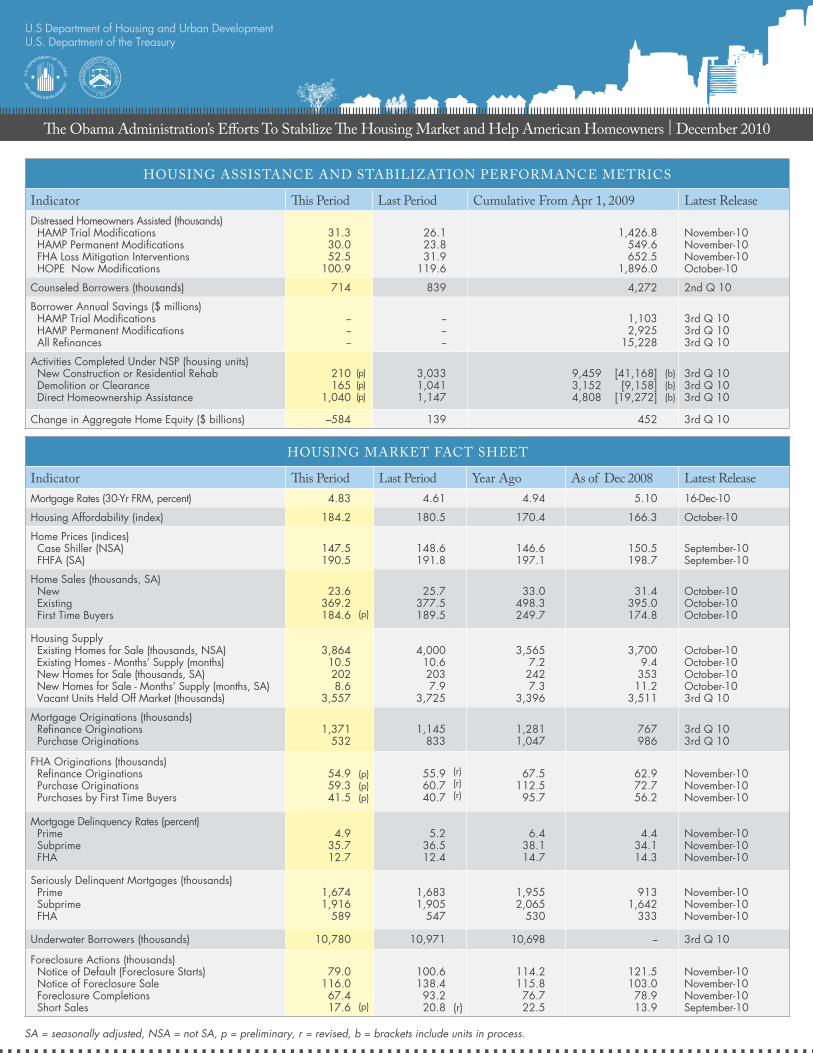
HOUSING MARKET FACT SHEET
Indicator � is Period Last Period Year Ago As of Dec 2008 Latest ReleaseMortgage Rates (30-Yr FRM, percent) 4.83 4.61 4.94 5.10 16-Dec-10
Housing Affordability (index) 184.2 180.5 170.4 166.3 October-10
Home Prices (indices) Case Shiller (NSA) FHFA (SA)
147.5190.5
148.6191.8
146.6197.1
150.5198.7
September-10September-10
Home Sales (thousands, SA) New Existing First Time Buyers
23.6369.2184.6 (p)
25.7377.5189.5
33.0498.3249.7
31.4395.0174.8
October-10October-10October-10
Housing Supply Existing Homes for Sale (thousands, NSA) Existing Homes - Months’ Supply (months) New Homes for Sale (thousands, SA) New Homes for Sale - Months’ Supply (months, SA) Vacant Units Held Off Market (thousands)
3,86410.52028.6
3,557
4,00010.62037.9
3,725
3,5657.22427.3
3,396
3,7009.435311.2
3,511
October-10October-10October-10October-103rd Q 10
Mortgage Originations (thousands) Refi nance Originations Purchase Originations
1,371532
1,145833
1,2811,047
767986
3rd Q 103rd Q 10
FHA Originations (thousands) Refi nance Originations Purchase Originations Purchases by First Time Buyers
54.959.341.5
(p)(p)(p)
55.960.740.7
(r)(r)(r)
67.5112.5
95.7
62.972.756.2
November-10November-10November-10
Mortgage Delinquency Rates (percent) Prime Subprime FHA
4.935.712.7
5.236.512.4
6.438.114.7
4.434.114.3
November-10November-10November-10
Seriously Delinquent Mortgages (thousands) Prime Subprime FHA
1,674 1,916
589
1,683 1,905
547
1,955 2,065
530
913 1,642
333
November-10November-10November-10
Underwater Borrowers (thousands) 10,780 10,971 10,698 -- 3rd Q 10
Foreclosure Actions (thousands) Notice of Default (Foreclosure Starts) Notice of Foreclosure Sale Foreclosure Completions Short Sales
79.0 116.0 67.4 17.6 (p)
100.6 138.4
93.2 20.8 (r)
114.2 115.8
76.7 22.5
121.5 103.0
78.9 13.9
November-10November-10November-10September-10
HOUSING ASSISTANCE AND STABILIZATION PERFORMANCE METRICS
Indicator � is Period Last Period Cumulative From Apr 1, 2009 Latest ReleaseDistressed Homeowners Assisted (thousands) HAMP Trial Modifi cations HAMP Permanent Modifi cations FHA Loss Mitigation Interventions HOPE Now Modifi cations
31.330.052.5
100.9
26.123.831.9
119.6
1,426.8549.6652.5
1,896.0
November-10November-10November-10October-10
Counseled Borrowers (thousands) 714 839 4,272 2nd Q 10
Borrower Annual Savings ($ millions) HAMP Trial Modifi cations HAMP Permanent Modifi cations All Refi nances
------
------
1,1032,925
15,228
3rd Q 103rd Q 103rd Q 10
Activities Completed Under NSP (housing units) New Construction or Residential Rehab Demolition or Clearance Direct Homeownership Assistance
210 165
1,040
(p)(p)(p)
3,0331,0411,147
9,459 [41,168]3,152 [9,158]4,808 [19,272]
(b) (b) (b)
3rd Q 103rd Q 103rd Q 10
Change in Aggregate Home Equity ($ billions) –584 139 452 3rd Q 10
SA = seasonally adjusted, NSA = not SA, p = preliminary, r = revised, b = brackets include units in process.
U.S. Department of Housing and Urban Development | Office of Policy Development and Research� e Obama Administration’s E� orts To Stabilize � e Housing Market and Help American Homeowners | December 2010
U.S Department of Housing and Urban DevelopmentU.S. Department of the Treasury
SOURCES AND METHODOLOGY
A. Items in TablesDescription Frequency Sources Notes on Methodology
Distressed Homeowners Assisted HAMP Trial Modifi cations HAMP Permanent Modifi cations FHA Loss Mitigation Interventions HOPE Now Modifi cations
MonthlyMonthlyMonthlyMonthly
TreasuryTreasuryHUDHope Now Alliance
As reported.As reported.All FHA loss mitigation and early delinquency interventions.All proprietary modifi cations completed.
Counseled Borrowers (thousands) Quarterly HUD Housing counseling activity reported by all HUD-approved housing counselors.
Borrower Annual Savings HAMP Trial Modifi cations HAMP Permanent Modifi cations All Refi nances
Quarterly
Quarterly
Quarterly
HUD, Treasury, and Freddie Mac
HUD and Treasury
HUD, and MBA
HUD estimate of annualized savings based on Treasury reported active HAMP trial modifi cations and Freddie Mac monthly savings estimates. HUD estimate of annualized savings based on Treasury reported active HAMP permanent modifi cations and median monthly savings estimates. Refi nance originations (see below) multiplied by HUD estimate of annualized savings per refi nance.
Completed Activities Under NSP (housing units) New Construction or Residential Rehab Demolition or Clearance Direct Homeownership Assistance
Quarterly
Quarterly
Quarterly
HUD
HUD
HUD
Housing units constructed/rehabilitated using Neighborhood Stabilization Program. Bracketed numbers include units in process, to be completed by 3/2013.Housing units demolished/cleared using Neighborhood Stabilization Program. Bracketed numbers as above.Completed downpayment assistance or non-amortizing second mortgages by grantee to make purchase of NSP unit affordable. Bracketed numbers as above.
Change in Aggregate Home Equity Quarterly Federal Reserve Board Difference in aggregate household owners’ equity in real estate as reported in the Federal Reserve Board’s Flow of Funds Accounts of the United States for stated time period.
Mortgage Rates (30-Yr FRM) Weekly Freddie Mac Primary Mortgage Market Survey, as reported for 30-Year fi xed rate mortgages (FRM).
Housing Affordability Monthly National Association of Realtors ® NAR’s composite housing affordability index as reported. A value of 100 means that a family with the median income has exactly enough income to qualify for a mortgage on a median-priced home. An index above 100 signifi es that family earning the median income has more than enough income to qualify.
Home Prices Case-Shiller (NSA)
FHFA (SA)
Monthly
Monthly
Standard and Poor’s
Federal Housing Finance Agency
Case-Shiller 20-metro composite index, January 2000 = 100. Standard and Poor’s recommends use of not seasonally adjusted index when making monthly comparisons.FHFA monthly (purchase-only) index for US, January 1991 = 100.
Home Sales (SA) New Existing
First Time Buyers
Monthly
Monthly
Monthly
HUD and Census Bureau
National Association of Realtors ®
NAR, Census Bureau, and HUD
Seasonally adjusted annual rates divided by 12. A newly constructed house is considered sold when either a sales contract has been signed or a deposit accepted, even if this occurs before construction has actually started. Seasonally adjusted annual rates divided by 12. Existing-home sales, which include single-family, townhomes, condominiums and co-ops, are based on transaction closings. This differs from the U.S. Census Bureau’s series on new single-family home sales, which are based on contracts or the acceptance of a deposit.Sum of seasonally adjusted new and existing home sales (above) multiplied by National Association of Realtors ® annual estimate of fi rst time buyer share of existing home sales.
Housing Supply Existing Homes for Sale (NSA) Existing Homes - Months’ Supply New Homes for Sale (SA) New Homes for Sale - Months’ Supply (SA) Vacant Units Held Off Market
MonthlyMonthlyMonthlyMonthlyQuarterly
National Association of Realtors ®National Association of Realtors ®HUD and Census BureauHUD and Census BureauCensus Bureau
As reported.As reported.As reported.As reported.As reported.
Mortgage Originations Refi nance Originations Purchase Originations
Quarterly
Quarterly
Mortgage Bankers Association and HUDMortgage Bankers Association and HUD
HUD estimate of refi nance originations based on MBA estimate of dollar volume of refi ance originations. HUD estimate of home purchase originations based on MBA estimate of dollar volume of home purchase originations.
FHA Originations Refi nance Originations Purchase Originations Purchases by First Time Buyers
MonthlyMonthlyMonthly
HUD HUDHUD
FHA originations reported as of date of loan closing. Estimate for current month scaled upward due to normal reporting lag and shown as preliminary.
Mortgage Delinquency Rates (NSA) Prime Subprime FHA
MonthlyMonthlyMonthly
LPS-McDash AnalyticsLPS-McDash AnalyticsHUD
Total mortgages past due (30+ days) but not in foreclosure, divided by mortgages actively serviced.Total mortgages past due (30+ days) but not in foreclosure, divided by mortgages actively serviced.Total FHA mortgages past due (30+ days) but not in foreclosure, divided by FHA’s insurance in force.
Seriously Delinquent Mortgages Prime Subprime FHA
MonthlyMonthlyMonthly
LPS-McDash, MBA, and HUDLPS-McDash, MBA, and HUDHUD
Mortgages 90+ days delinquent or in foreclosure, scaled up to market.Mortgages 90+ days delinquent or in foreclosure, scaled up to market.Mortgages 90+ days delinquent or in foreclosure.
Underwater Borrowers Quarterly First American CoreLogic As reported.
Foreclosure Actions Notice of Default (Foreclosure Starts) Notice of Foreclosure Sale Foreclosure Completions Short sales
Monthly
MonthlyMonthlyMonthly
Realty Trac
Realty TracRealty TracCore Logic
Reported counts of notice of default plus lis pendens. Some foreclosure starts may be omitted in states where the fi ling of a notice of default is optional.Notice of sale (auctions).Real Estate Owned (REO).Count of Short Sales for the month as reported (current month subject to revision).
U.S. Department of Housing and Urban Development | Office of Policy Development and Research� e Obama Administration’s E� orts To Stabilize � e Housing Market and Help American Homeowners | December 2010
U.S Department of Housing and Urban DevelopmentU.S. Department of the Treasury
SOURCES AND METHODOLOGY
B. Notes on Charts.
1. Monthly house price trends shown as changes in respective house price indices applied to a common base price set equal to the median price of an existing home sold in January 2003 as reported by the National Association of Realtors. Indices shown: S&P/Case Shiller 20-metro composite index (NSA), January 2000 = 100, and FHFA monthly (purchase-only) index for US (SA), January 1991 = 100.
2. S&P/Case-Shiller 20 metro composite index (NSA) as reported monthly. Futures index fi gures report forward expectations of the level of the S&P/Case Shiller index as of the date indicated, estimated from prices of futures contracts reported by Radar Logic.
3. Reported seasonally adjusted annual rates for new and existing home sales divided by 12.
4. HUD estimate of refi nance originations based on MBA estimate of dollar volume of refi nance originations.
5. Cumulative HAMP modifi cations started, FHA loss mitigation and early delinquency interventions, plus proprietary modifi cations completed as reported by Hope Now Alliance. Some homeowners may be counted in more than one category. Foreclosure completions are properties entering Real Estate Owned (REO) as reported by Realty Trac.
6. Foreclosure starts include notice of default and lis pendens, completions are properties entering REO. Both as reported by Realty Trac. See “Foreclosure Actions” above.
7. See “Borrower Annual Savings” above.
8. FHA market shares as FHA purchase and refi nance originations divided by HUD estimates of purchase and refi nance mortgage originations as noted in “Mortgage Originations” above.
U.S. Department of Housing and Urban Development | Office of Policy Development and Research� e Obama Administration’s E� orts To Stabilize � e Housing Market and Help American Homeowners | December 2010
U.S Department of Housing and Urban DevelopmentU.S. Department of the Treasury
The Administration has taken a broad set of actions to stabilize the housing market and help American homeowners. A year ago, stress in the fi nancial system had severely reduced the supply of mortgage credit, limiting the ability of Americans to buy homes or refi nance mortgages. Millions of responsible families who had made their monthly payments and had fulfi lled their obligations saw their property values fall. They also found themselves unable to refi nance at lower mortgage rates.
In February 2009, less than one month after taking offi ce, President Obama announced the Homeowner Affordability and Stability Plan. As part of this plan and through other housing initiatives, the Administration has taken the following actions to strengthen the housing market:
• Supported Fannie Mae and Freddie Mac to ensure continued access to affordable mortgage credit;
• The Federal Reserve and the U.S. Treasury purchased more than $1.4 trillion in agency mortgage backed securities through independent MBS purchase programs, helping to keep mortgage rates at historic lows;
• Launched a modifi cation initiative to help homeowners reduce mortgage payments to affordable levels and to prevent avoidable foreclosures;
• Launched a $23.5 billion Housing Finance Agencies Initiative to increase sustainable homeownership and rental resources;
• Supported the First Time Homebuyer Tax Credit, which has helped 2.5 million American families purchase homes;
• Provided more than $5 billion in support for affordable rental housing through low income housing tax credit programs and $6.92 billion in support for the Neighborhood Stabilization Program to restore neighborhoods hardest hit by the concentrated foreclosures;
• Created the $4.1 billion HFA Hardest Hit Fund for innovative foreclosure prevention programs in the nation’s hardest hit housing markets.
• Supported home purchase and refi nance activity through the FHA to provide access to affordable mortgage capital and help homeowners prevent foreclosures.
###
Appendix


![Relativistic Bohmian Mechanics - arXivDespite these problems, e orts have been made to generalize relativistic Bohmian mechanics and some of these e orts have been partially successful[[16],[18]-[22]]](https://img.pdfslide.us/doc/110x75/5e9f90eb2a56356c6243dda2/relativistic-bohmian-mechanics-arxiv-despite-these-problems-e-orts-have-been.jpg)