Embed Size (px)
Citation preview
1 23
Environmental Geochemistry andHealthOfficial Journal of the Society forEnvironmental Geochemistry andHealth ISSN 0269-4042Volume 34Number 3 Environ Geochem Health (2012)34:301-311DOI 10.1007/s10653-011-9422-2
Perfluorinated compounds in a coastalindustrial area of Tianjin, China
Tieyu Wang, Yonglong Lu, Chunli Chen,Jonathan E. Naile, Jong Seong Khim &John P. Giesy

1 23
Your article is protected by copyright and
all rights are held exclusively by Springer
Science+Business Media B.V.. This e-offprint
is for personal use only and shall not be self-
archived in electronic repositories. If you
wish to self-archive your work, please use the
accepted author’s version for posting to your
own website or your institution’s repository.
You may further deposit the accepted author’s
version on a funder’s repository at a funder’s
request, provided it is not made publicly
available until 12 months after publication.
ORIGINAL PAPER
Perfluorinated compounds in a coastal industrial areaof Tianjin, China
Tieyu Wang • Yonglong Lu • Chunli Chen •
Jonathan E. Naile • Jong Seong Khim •
John P. Giesy
Received: 15 March 2011 / Accepted: 19 August 2011 / Published online: 1 September 2011
� Springer Science+Business Media B.V. 2011
Abstract Perfluorinated compounds (PFC) in water,
sediment, soil, and biota from the coastal industrial
area of Tianjin, China, were measured to provide
baseline information and to determine possible sources
and potential risk to wildlife. Perfluorooctanesulfonate
(PFOS) was the predominant PFC with maximum
concentrations of 10 ng/L in water, and 4.3, 9.4, and
240 ng/g dw in sediment, soil, and fish, respectively.
Perfluorooctanoate (PFOA) concentration in water
ranged from 3.0 to 12 ng/L. Perfluoroundecanoate
(PFUnA) and Perfluorododecanoate (PFDoA) were
detected in solid matrices, respectively, at concentra-
tions of\LOQ to 1.2 ng/g dw and 0.27–0.81 ng/g dw
in sediments, and \LOQ to 1.0 ng/g dw and 0.26–
0.61 ng/g dw in soils. Concentrations of PFOS, PFUnA,
and PFDoA in sediment and soil from this industrial-
ized and urbanized area were greater than those
previously reported, while PFOS and PFOA in water
and biota were both less than reported threshold
concentrations for adverse effects in wildlife.
Keywords PFC � Water � Soil � Sediment �Biota � Risk
Introduction
Because of their environmental persistence, bioaccu-
mulation, global distribution, and toxicity (Conder
et al. 2008; Schuetze et al. 2010; Zushi et al. 2010),
concern about the presence of perfluorinated chem-
icals (PFC) has been increasing since they were first
reported to be widespread in the environment (Giesy
and Kannan 2001, 2002). PFC have been used in a
variety of applications such as surfactants and surface
protectors in carpets, leather, paper, food containers,
fire-fighting foams, floor polishes, and shampoos
(Kissa 2001). These compounds are introduced in the
environment during production and use in industries,
T. Wang � Y. Lu (&) � C. Chen
State Key Lab of Urban and Regional Ecology,
Research Center for Eco-Environmental Sciences,
Chinese Academy of Sciences, Beijing 100085, China
e-mail: [email protected]
J. E. Naile � J. P. Giesy
Toxicology Centre and Department of Veterinary
Biomedical Sciences, University of Saskatchewan,
Saskatoon, SK S7N5B3, Canada
J. S. Khim
Division of Environmental Science and Ecological
Engineering, Korea University, Seoul 136-713,
Republic of Korea
J. P. Giesy
Zoology Department, College of Science, King Saud
University, P. O. Box 2455, Riyadh 11451, Saudi Arabia
J. P. Giesy
Department of Zoology and Center for Integrative
Toxicology, Michigan State University, East Lansing,
MI 48824, USA
123
Environ Geochem Health (2012) 34:301–311
DOI 10.1007/s10653-011-9422-2
Author's personal copy
in products, runoff, accidental spills, or untreated
discharges (Melissa et al. 2003). PFC have been
detected in aquatic systems (Fujii et al. 2007; Rayne
and Forest 2009; Kim et al. 2011) and wildlife
(Houde et al. 2006; Fatihah et al. 2009; Fair et al.
2010). Perfluorooctanesulfonate (PFOS) is the termi-
nal degradation product of a number of poly or
perfluorinated precursors and is detected in environ-
mental and biological samples where it is also the
predominant PFC. PFOS was recently listed as a
‘‘persistent organic pollutant’’ under the Stockholm
Convention, but exemptions were made, which allow
continued production and use in China (Wang et al.
2009b). Restrictions on production of PFOS in other
countries have resulted in increased production and
use in China as well as overseas exports. Since 2000,
annual production of PFOS-containing chemicals in
China has increased each year (Bao et al. 2009).
Rapid industrial development during the past few
decades has transformed China into one of the
world’s largest economies, especially in the Bohai
Sea region; a semi-enclosed coastal water body
located on the northeast coast of China. The Tianjin
Binhai New Area (TBNA), situated in the lower part
of the Haihe River watershed and west of Bohai Bay,
is one of the most important industrial areas in the
North of China. Intensive economic development and
urbanization in this area have severely deteriorated
environmental quality, especially along the coast.
The TBNA is comprised of three different adminis-
trative regions, Tanggu, Hangu, and Dagang. Tanggu
and Hangu have been historically known for their
chemical industry with the Dagu Chemical Industrial
Park at Tanggu and the Hangu Chemical Industrial
Park at Hangu. The Dagang region has abundant
wetlands and oil resources, and the industries that
produce or process petroleum, petrochemicals, and
fine chemicals are developing.
Organochlorine pesticides, polycyclic aromatic
hydrocarbons, and metals are present in various
environmental media in the TBNA (Jiao et al. 2009;
Wang et al. 2009a; Shi et al. 2010). However, previous
studies have focused mainly on classic persistent toxic
substances (PTS), and little information is available
for emerging PTS such as PFC. Concentrations of PFC
in environmental matrices from the TBNA are scarce.
The present study was part of a larger program to
assess contamination in various environmental media
from marine environment and adjacent riverine and
estuarine areas of the Bohai Sea and Yellow Sea. The
objectives of the present study were to determine
concentrations, distribution, and fate of PFC in envi-
ronmental matrices and to identify potential sources
and thus provide information for future management
and remediation efforts in the Bohai Sea region.
Materials and methods
Standards and reagents
A mixture of 12 PFC (purity for each PFC [ 98%)
including PFOS, perfluorooctanoate (PFOA), perfluo-
robutane sulfonate (PFBS), perfluorohexane sulfonate
(PFHxS), perfluorodecane sulfonate (PFDS), perflu-
orobutanoate (PFBA), perfluorohexanoate (PFHxA),
perfluoroheptanoate (PFHpA), perfluorononanoate
(PFNA), perfluorodecanoate (PFDA), perfluorounde-
canoate (PFUnA), and perfluorododecanoate (PFDoA)
were obtained from Wellington Laboratories (Guelph,
ON, Canada). The internal standard consisted of PFOA
[1,2,3,4 13C] and PFOS [18O2] (purity for PFOA and
PFOS [ 98%, Wellington Laboratories). HPLC grade
methanol and ammonium acetate were purchased from
J.T. Baker (Phillipsburg, NJ, USA). Analytical grade
sodium thiosulfate was purchased from EMD Chem-
icals (Gibbstown, NJ, USA). Nano-pure water was
obtained from a Milli-Q Gradient A-10 (Millipore,
Bedford, MA, USA).
Study area and sample collection
TBNA (38�400–39�000N and 117�200–118�000E) is
located at the intersection of the Beijing–Tianjin–
Hebei economic zone and the center of the Bohai
Bay Rim city belt, in Eastern Tianjin, China. TBNA
lies in the warm temperate zone, with between
maritime and continental monsoon climate. Mean
annual precipitation is between 520 and 660 mm, and
the average annual temperature is 12�C. Of the three
districts in the TBNA, Tanggu is the most urbanized
and industrialized area followed by Hangu and
Dagang.
Samples consisting of 8 sets of waters, soils, and
sediments, totaling 24, as well as three species of
biota including 21 Crucian carp (Carassius auratus),
302 Environ Geochem Health (2012) 34:301–311
123
Author's personal copy
11 swimming crabs (Portunus trituberculatus), and
44 prawn (Penaeus semisulcatus) were collected
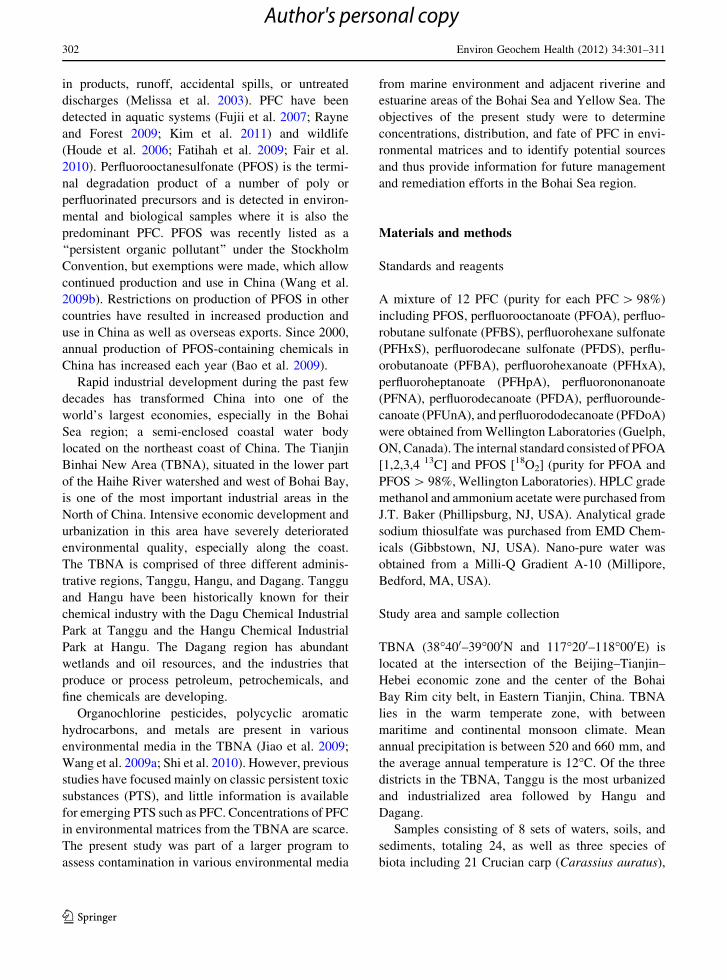
from Tianjin Bohai Bay during May of 2008 (Fig. 1).
Global positioning (GPS) was used to locate sam-
pling sites, and information on sampling sites was
summarized in Table l. One liter of surface water was
collected by dipping a clean, methanol-rinsed 1-L
polypropylene (PP) bottle just under the surface of
the water. Residual chlorine in water samples was
reduced by adding 200 lL of 200 mg sodium thio-
sulfate/mL. Surface (top 0–10 cm) soil and sediment
samples were collected by use of a clean, methanol-
rinsed stainless steel trowel, then freeze-dried,
homogenized, and passed through a 2.0-mm sieve
in laboratory prior to extraction. Biological samples
were collected by hand-catch or netting from coastal
tidal pools and along the shores of inland water
bodies. Fish were thawed and filleted (skin-on).
Composite samples from each sampling location
were made by combining fillets of several fish before
homogenization. Duplicate samples and field blanks
were collected daily and were analyzed along with
laboratory and procedural blanks. All samples were
Fig. 1 Map showing the sampling locations for water, sedi-
ment, soil, and biota samples collected along Tianjin coast,
China
Table 1 Sampling details including location description and type of samples collected in the present study
Sampling Sample details (# of samples)
Area Riverine Location Geological characteristics Water Sediment Soil Biologicala (# of indiv.)
Hangu Chaobai
River
TB1 Near to high-tech industrial park 1 1 1 3: carp (7), crab (5), and
prawn (21)
Yongding
River
TB2 Near to a reservoir 1 1 1
Yongding
River
TB3 Riverside, abandoned land 1 1 1
Tanggu Yongding
River
TB4 Coastal area, vicinity of oil plant 1 1 1 3: carp (9), crab (6), and
prawn (23)
Haihe River TB5 Sewage drainage, near chem-
industrial plant
1 1 1
Haihe River TB6 Coastal area, inside of harbor 1 1 1
Dagang Duliujian
River
TB7 Coastal area, near to garment
factories
1 1 1 1: carp (5)
Ziya River TB8 Coastal area, near to oil production
plant
1 1 1
No. of location 8 8 8 3
No. of samples 8 8 8 7 (76 individuals)
a Biological samples were collected from the middle of rivers in each area of Hangu, Tanggu, and Dagang, respectively (see precise
locations in Fig. 1, species name in Table 3)
Environ Geochem Health (2012) 34:301–311 303
123
Author's personal copy
stored on ice for transportation and frozen at -20�C
before treatment.
Extraction and cleanup
Water was extracted by solid-phase extraction (SPE)
with Oasis HLB cartridges (Waters Corp., Milford,
MA, 0.2 g, 6 cm3), as described previously (Naile
et al. 2010). Prior to extraction, samples were spiked
with 500 lL of 5 ng/mL internal standard (PFOS
[18O2] and PFOA [1,2,3,4 13C]). After precondition-
ing with 10 mL methanol and nano-pure water, the
cartridge was loaded with 500 mL sample at approx-
imately 1 drop per second. The cartridge was washed
with 5 mL of 40% methanol in water and allowed to
run dry and then eluted with 10 mL of methanol at
the same rate. Eluates were collected and then
reduced to 1 mL under a high purity gentle stream
of nitrogen gas.
Extraction of PFCs in soil and sediment was
accomplished by use of a method similar to that
described by Naile et al. (2010). In brief, 1.0 g of
sample was transferred to a 50-mL PP tube with
10 mL of a 1% acetic acid solution and spiked
with 500 lL of 5 ng/mL internal standard mixtures.
The sample was vortexed and placed in a heated
sonication bath for 15 min at 60�C and then centri-
fuged for 3 min, after which the acetic acid solution
was decanted into a new clean 50-mL PP tube. An
aliquant of 2.5 mL of a 90:10 (v/v) methanol and 1%
acetic acid mixture was added to the original vial,
vortex mixed again, and sonicated for 15 min. This
process was repeated once more, and a final 10 mL
acetic acid wash was preformed. All extracts were
combined in the second tube before being passed
through the SPE cartridge in a similar fashion as
described above in the water extraction procedure.
Animal tissues were extracted using a method
described previously (Naile et al. 2010) that com-
bines an alkaline digestion followed by SPE. Approx-
imately 1.0 g of homogenized tissue sample (dry
powder) was transferred to a 50-mL PP centrifuge
tube and spiked with 500 lL of 5 ng/mL internal
standard, and 30 mL of 0.01 N KOH/methanol was
added to the tube. The mixture was shaken at room
temperature for 16 h. After digestion, 5.0 mL of the
water–tissue mixture was transferred to a new PP
tube and then extracted using SPE cartridges as
previously stated above as water.
Quantitative analyses and quality control
Quantitative analyses were performed by a high-
performance liquid chromatography equipped with an
electrospray tandem mass spectrometer (HPLC–MS/
MS). Quantification was performed using the internal
standard method based on 18O2-PFOS and 13C4-
PFOA as the surrogate. Concentrations of all analytes
in all field and laboratory blanks were less than the
limit of quantification (LOQ), where the LOQ was
defined as 5 times the background signal of the
solvent blank. The MDL was defined as the amount
of chemical which could be detected in a given
amount of sample after the entire method was
preformed. Details of the analytical conditions,
quality assurance, and quality control measures have
been described elsewhere previously (Naile et al.
2010).
Results and discussion
PFC distribution in environmental matrices
and biota
Of the 12 examined analytes, seven were found in
water, sediment, and soil. PFC quantified included
PFOS, PFOA, PFHpA, PFNA, PFDA, PFUnA,
and PFDoA (Table 2). Of the 12 PFC investigated,
PFOS and PFOA consistently occurred at the greatest
concentrations. All water samples contained detect-
able concentrations of PFOS and PFOA, while
PFDoA and PFUnA were found to be ubiquitous
compounds in sediments and soils. As for biological
samples, PFOS was found to be predominant fol-
lowed by PFDA and PFUnA, and no other com-
pounds were detected (Table 3).
PFC in surface water
Concentrations of the sum PFC in surface waters
ranged from 4.4 to 25 ng/L, with the greatest
concentrations observed at location TB5. This loca-
tion, which was near a sewage effluent on the Haihe
River, exhibited the greatest concentrations of PFOS
and PFOA. The dominant compound of the perfluo-
rinated sulfonates (PFSAs) was PFOS with concen-
trations ranging from 0.10 to 10 ng/L. Perfluorinated
carboxylates (PFCAs) were dominated by PFOA with
304 Environ Geochem Health (2012) 34:301–311
123
Author's personal copy
concentrations ranging from 3.0 to 12 ng/L. In
general, PFOS and PFOA were the predominant
waterborne PFC accounting for about 77% of the
total PFC (Fig. 2). PFHpA, PFDA, and PFNA were
detected in approximately 70% of the samples
analyzed at concentrations greater than the respective
LOQ values. Concentrations of PFHpA, PFDA, and
PFNA ranged from \LOQ to 2.6 ng/L, \LOQ to
Table 2 Concentrations of PFC in waters, sediments, and soils from Tianjin coast
Items PFOS PFOA PFHpA PFNA PFDA PFUnA PFDoA PFC
Water (ng/L)
TB1 0.74 7.8 0.96 nda 0.22 nd nd 9.8
TB2 0.10 5.0 0.87 2.2 2.9 nd nd 11
TB3 2.4 5.1 0.61 nd 0.27 nd nd 8.4
TB4 3.3 6.6 nd nd 0.32 nd nd 11
TB5 10 12 0.63 1.6 nd nd nd 25
TB6 1.5 4.4 0.54 nd 0.28 nd nd 6.7
TB7 1.6 11 2.6 4.9 3.8 nd nd 24
TB8 0.29 3.0 nd nd 0.63 nd nd 4.4
Sediment (ng/g dw)
TB1 nd 1.5 nd nd 0.95 1.2 0.81 4.4
TB2 nd nd nd nd nd 0.56 0.42 1.5
TB3 0.94 nd nd nd nd 1.1 0.42 2.7
TB4 nd nd nd nd nd nd 0.42 1.5
TB5 4.3 0.81 nd 1.0 0.87 0.55 0.27 7.8
TB6 1.2 nd nd nd nd nd 0.52 1.9
TB7 0.53 nd nd nd 0.44 0.72 0.57 2.8
TB8 2.0 0.94 0.56 nd 2.3 nd 0.38 7.3
Soil (ng/g dw)
TB1 nd nd nd nd nd 0.94 0.26 1.3
TB2 nd nd 0.10 nd 0.84 nd 0.42 2.5
TB3 nd nd nd nd nd 1.0 0.46 2.0
TB4 4.7 0.63 nd nd 0.18 0.82 0.61 7.0
TB5 9.4 0.93 nd nd nd nd 0.26 11
TB6 nd nd nd nd nd 0.57 0.43 1.7
TB7 nd nd nd nd nd 0.54 0.47 1.3
TB8 nd nd 0.10 nd 0.29 0.70 0.39 2.1
a nd: Less than the limit of quantification
Table 3 Concentrations of PFC (ng/g dw) in biological samples from Tianjin coast (the values in bracket indicate the ranges)
Area Species PFOS PFDA PFUnA
Hangu Crucian carp: Carassius auratus 57 (50–65) 1.9 (1.1–2.8) nd
Swimming crab: Portunus trituberculatus 60 (38–82) 1.5 (1.3–1.8) nd
Prawn: Penaeus semisulcatus nd 0.26 (nd–0.42) nd
Tanggu Crucian carp: Carassius auratus 100 (59–240) 1.3 (nd–1.8) nd
Swimming crab: Portunus trituberculatus 11 (nd–18) 0.70 (nd–1.1) 1.6 (nd–2.1)
Prawn: Penaeus semisulcatus 2.8 (nd–4.2) nd nd
Dagang Crucian carp: Carassius auratus 34 (21–46) 1.7 (1.0–2.1) nd
Environ Geochem Health (2012) 34:301–311 305
123
Author's personal copy
3.8 ng/L, and \LOQ to 4.9 ng/L, respectively. The
greatest concentrations of PFHpA, PFDA, and PFNA
were all observed at location TB7, on the Duliujian
River in Dagang. This indicates that other PFC, in
addition to PFOS and PFOA, should be considered in
future monitoring and risk assessments.
PFC in sediments
Concentrations of PFC in sediments from TBNA were
generally less than their corresponding MDLs. Total
concentrations of PFC ranged from 1.5 to 7.8 ng/g dw
with a mean of 3.7 ng/g dw. PFDoA was detected in
all samples at concentrations ranging from 0.27 to
0.81 ng/g dw, with a mean of 0.48 ng/g dw. PFOS and
PFOA were observed in fewer samples with concen-
trations ranging from\LOQ to 4.3 ng/g dw and from
\LOQ to 1.5 ng/g dw, respectively. When both were
detected, concentrations of PFOS were generally
greater than those of PFOA. The greatest concentra-
tions of PFOS (4.3 ng/g dw) and corresponding
greater concentrations of PFOA (0.81 ng/g dw) were
observed in sediments from TB5, which was also an
area where some of the greatest waterborne concen-
trations were detected.
PFC in soils
Releases of PFC from various sources not only
contaminate water systems but also do soils. Also,
PFC can be released to the atmosphere and then
precipitated onto soils. PFOS and PFOA can easily
absorb onto sediment and sludge that can be depos-
ited on land (Sinclair and Kannan 2006; Skutlarek
et al. 2006). Thus, soils could be another sink for
PFC. Few studies have previously reported the
occurrence, distribution, sources, and risks of PFC
in soils (Higgins and Luthy 2006; Naile et al. 2010).
In the presented study, PFC concentrations in soils
were generally found to be less than their respective
LOQs. Only 2 sites, TB4 and TB5, exhibited detectable
concentrations of PFOS and PFOA. However, it should
be noted that PFDoA and PFUnA were detected in 100
and 75% of soils, respectively. This was similar to the
rate of detection of PFC in sediments. Total concen-
trations of PFC were in the range of 1.3–11 ng/g dw
with a mean of 3.5 ng/g dw. Concentrations of PFOS
and PFOA in soils ranged from\LOQ to 9.4 ng/g dw
and from\LOQ to 0.93 ng/g dw, while concentrations
of the other two routinely detected PFC, i.e., PFDoA
and PFUnA, were comparable each other with con-
centrations ranging from 0.26 to 0.61 ng/g dw and
\LOQ to 1.0 ng/g dw, respectively.
Concentrations of PFC were found to be within
the similar range between soils and sediments. The
greatest concentrations of total PFC (11 ng/g dw),
PFOS (9.4 ng/g dw), and PFOA (0.93 ng/g dw) in
soils were all observed at location TB5, which is also
the location where concentrations were greatest in
both water and sediment. The result indicated that
local sources of certain PFC near TB5 were evident.
In general, however, soils and sediments in TBNA
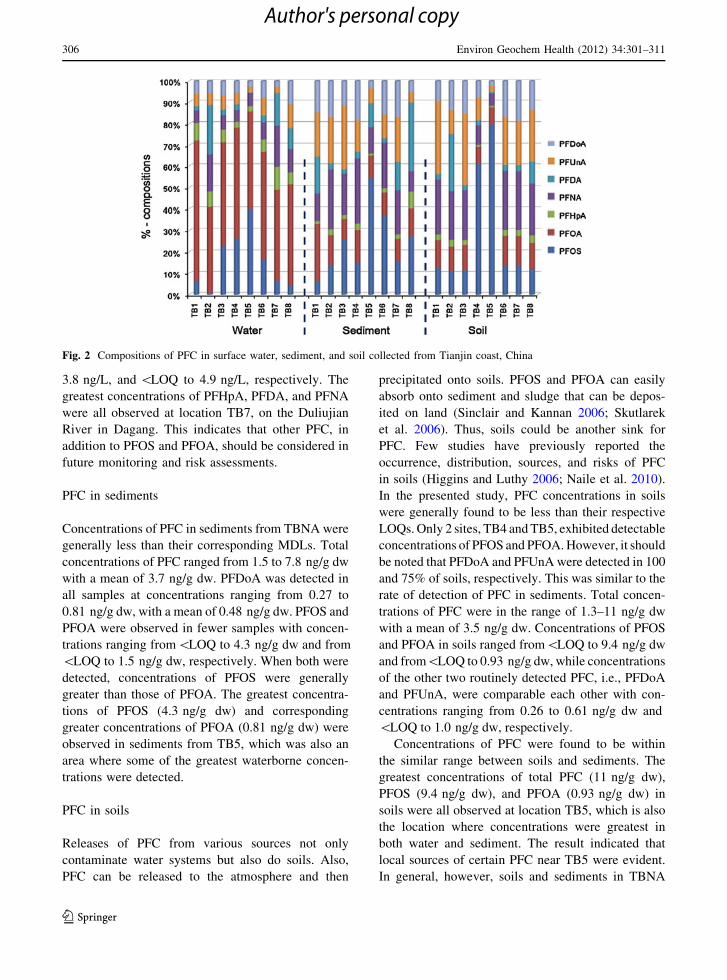
Fig. 2 Compositions of PFC in surface water, sediment, and soil collected from Tianjin coast, China
306 Environ Geochem Health (2012) 34:301–311
123
Author's personal copy
contain only small amounts of PFC. In terms of
matrix-dependent accumulation of PFC, the results
of the present study were similar to those observed
previously in South Korea (Naile et al. 2010).
PFC in biota
Concentrations of PFC in aquatic animals from the
TBNA are given (Table 3). Only three compounds,
namely PFOS, PFDA, and PFUnA, were detected
in biota. The result was somewhat different from that
of earlier study by Pan et al. (2010), where PFOA
was detected in biota from other areas of China.
Concentrations of PFOS in Crucian carp were 100,
57, and 34 ng/g dw in three subdistricts of TBNA
with a trend of decreasing concentrations of Tanggu [Hanggu [ Dagang. These concentrations were com-
parable to those previously reported in China and the
Netherlands (Gulkowska et al. 2006; Kwadijk et al.
2010), but generally less than those observed in South
Korea, Japan, Brazil, and Germany (Taniyasu et al.
2003; Quinete et al. 2009; Becker et al. 2010; Naile
et al. 2010). Concentrations of PFDA in Crucian carp
were not significantly different among districts with
1.9 ng/g dw at Hangu, 1.3 ng/g dw at Tanggu, and
1.7 ng/g dw at Dagang. Concentrations of PFOS in
swimming crab and prawn, respectively, were 60 ng/
g dw and\LOQ at Hangu and 11 and 2.8 ng/g dw at
Tanggu, while concentrations of PFDA, respectively,
were 1.5 and 0.26 ng/g dw at Hangu and 0.70 ng/g
dw and \LOQ at Tanggu. PFUnA was detected
only in prawn from Tanggu with a concentration of
1.6 ng/g dw.
Comparison to other coastal areas
When concentrations of PFC were compared to those
in other coastal industrial areas of China and the
world, concentrations of PFOS in waters from the
TBNA were comparable to or greater than those from
the Dalian coast, Hong Kong, Shanghai and Pearl
River Delta (Table 4) and less than those from the
Yangtze River Estuary and the Nanmen River in
Taiwan. Concentrations of PFOA were generally less
than those reported in previous studies (see references
in Table 4). Significantly greater concentrations of
PFOA were observed in waters from the Shanghai
coast in mainland China and the Nanmen River in
Taiwan. Greater concentrations of PFOS and PFOA
were frequently observed in the densely populated
Table 4 Global comparison of PFOS and PFOA concentrations (ng/L) in waters with other studies in coastal areas
Location Year PFOS PFOA Reference
China Tianjin coast 2008 (May) 0.10–10 3.0–12 Present study
Dalian coast 2006 (Oct) nd–2.3 0.17–38 Ju et al. (2008)
Shanghai 2005 (Jan) 0.62–14 22–260 So et al. (2007)
Yangze River estuary 2008 (Nov) 42–700 Na Pan and You (2010)
Pearl River Delta 2003 (Sep) 0.02–12 0.24–16 So et al. (2004)
Hong Kong 2003 (Jun) 0.09–3.1 0.73–5.5 So et al. (2004)
Nanmen River, Taiwan 2009 210–6,100 16–520 Lin et al. (2010)
Japan Tokyo Bay 2004–2006 0.78–17 2.7–63 Sakurai et al. (2010)
Oskas 2003 (Apr) 1.5–28 4.5–560 Saito et al. (2004)
Yodo River basin 2004–2005 0.40–120 4.2–2,600 Lein et al. (2008)
Kyoto 2005 (May) 7.9–110 5.1–10 Senthilkumar et al. (2007)
South Korea Korea coast 2008 (May) 4.1–450 3.0–69 Naile et al. (2010)
Gyeonggi Bay 2004 (Dec) 2.2–650 0.90–62 Rostkowski et al. (2006)
India Southern coast 2008 (Feb) 0.05–3.9 0.05–23 Yeung et al. (2009)
Thailand Chao Phraya River 2006–2007 0.70–18 0.70–64 Kunacheva et al. (2009)
Brazil Guanabara Bay 2008 (Aug) 0.40–0.92 0.70–3.3 Quinete et al. (2009)
Germany German bight 2007 (Aug) 0.69–4.0 2.7–7.8 Ahrens et al. (2009)
Poland Gdansk coast 2005 (May) nd–19 nd–1.1 Rostkowski et al. (2009)
Environ Geochem Health (2012) 34:301–311 307
123
Author's personal copy
and/or industrialized zones. Concentrations of PFOS
and PFOA observed in water in the present study
were less than those found in most coastal rivers of
Japan, South Korea, and Thailand, especially in Yodo
River basin in Japan and Gyeonggi Bay of Korea,
while greater than those from the Southern coast of
India, the Guanabara Bay of Brazil, German Bight in
Germany and Gdansk coast of Poland.
Concentrations of PFOS in sediments from TBNA
were similar to those from the Zhujiang River China
(\LOQ to 3.10 ng/g dw) (Bao et al. 2010), but
less than those from the Yangtze River Estuary,
China (72.9–536.7 ng/g dw), Nanman River, Taiwan
(\LOQ to 159 ng/g dw), and Kyoto River, Japan
(\LOQ to 11.0 ng/g dw) (Senthilkumar et al. 2007;
Lin et al. 2010; Pan and You 2010). The maximum
concentration of PFOS in sediments (4.3 ng/g dw)
observed in the present study was greater than
those reported from the Daliao River system, China
(0.37 ng/g dw) (Bao et al. 2009), the Huangpu River,
China (0.46 ng/g dw) (Bao et al. 2010), and the tidal
flat areas of the Ariake Sea, Japan (0.14 ng/g dw)
(Nakata et al. 2006). Concentrations of PFOA in
sediments of this watershed were slightly greater than
or comparable to those of the Daliao River system
(\LOQ to 0.17 ng/g dw), Huangpu River (0.20–0.64
ng/g dw), and Zhujiang River (0.09–0.29 ng/g dw),
China (Bao et al. 2009, 2010), whereas they were less
than those of the Kyoto River (\LOQ to 3.9 ng/g dw)
(Senthilkumar et al. 2007). Concentrations of PFOA
in the present study varied among locations. This
indicates that multiple sources across the estuarine
and coastal areas of the Tianjin Bohai Bay were
present.
Compositions and sources
Samples from the TBNA exhibited different patterns
of relative concentrations of 7 detectable PFC among
water, sediment, and soil (Fig. 2). PFOA was pre-
dominant PFC in water, with a composition of 45%
(TB7 and TB2) to 79% (TB1), followed by PFOS
(1–42%), PFDA (0.3–26%), and PFNA (0.1–20%).
Meanwhile, PFOS was the predominant PFC in
sediment and soil, as well as biota, contributing as
much as 62% (TB6) in sediment and 86% (TB5) in
soil. Greater contributions of PFUnA and PFDoA
were observed in sediment ranging from 5.7 to 41%
and 3.5 to 28%, and in soil ranging from 3–72 and
2–37%, respectively, while concentrations of PFDoA
and PFUnA were less than those of PFOS or PFOA.
This result indicates the existence of potential sources
of PFDoA and PFUnA in the study area.
The ratio of PFOS to PFOA has been applied to
identify potential sources of PFC (So et al. 2004).
The PFOS/PFOA ratios in the present study were
generally less than 1.0, with values ranging from 0.02
(TB2) to 0.87 (TB5) in water. Ratios calculated in our
study were generally consistent with previous find-
ings in Lake Michigan and the Tennessee River in
the United States, and coastal waters of China and
Korea (Hansen et al. 2002; So et al. 2004; Simcik and
Dorweiler 2005). However, the ratios were different
from those reported by Naile et al. (2010) and
Rostkowski et al. (2006), which were typically
greater than 1.0. Simcik and Dorweiler (2005)
described greater concentrations of PFHpA due to
atmospheric deposition to surface waters than from
other sources. Therefore, the ratio of PFHpA to
PFOA was used as a tracer of atmospheric deposition.
This ratio varied among locations with a range of
0.05 (TB5) to 0.24 (TB7) for all water samples, and
the ratio was less than 1.0, but ratios as great as 1.2
were observed in soil at location TB1. The TBNA has
been subjected to anthropogenic influences as a result
of rapid urbanization and industrialization. Thus, the
specific distribution and pattern of relative concen-
trations of PFC indicates an input from industrial
effluent as well as atmospheric deposition.
Relatively greater concentrations of individual
PFC, especially PFOS, in water, sediment, and soil
from location TB5 might have originated from
tributaries of the Haihe River because the watershed
of Haihe River contains a variety of industries,
including chemical and biochemical products manu-
facturing, and receives industrial and domestic
discharges mainly from Tianjing and Beijing, which
are urbanized areas of increasing industrial and
commercial activities.
Bioaccumulation and hazard assessment
A BCF defined as the concentration in fish divided
by the concentration in water was determined from
measured concentrations at each location. Concen-
trations of PFOS in Crucian carp from the Hangu,
Tanggu, and Dagang regions of the TBNA were used
to calculate a district-wide BCF. The mean BCF
308 Environ Geochem Health (2012) 34:301–311
123
Author's personal copy
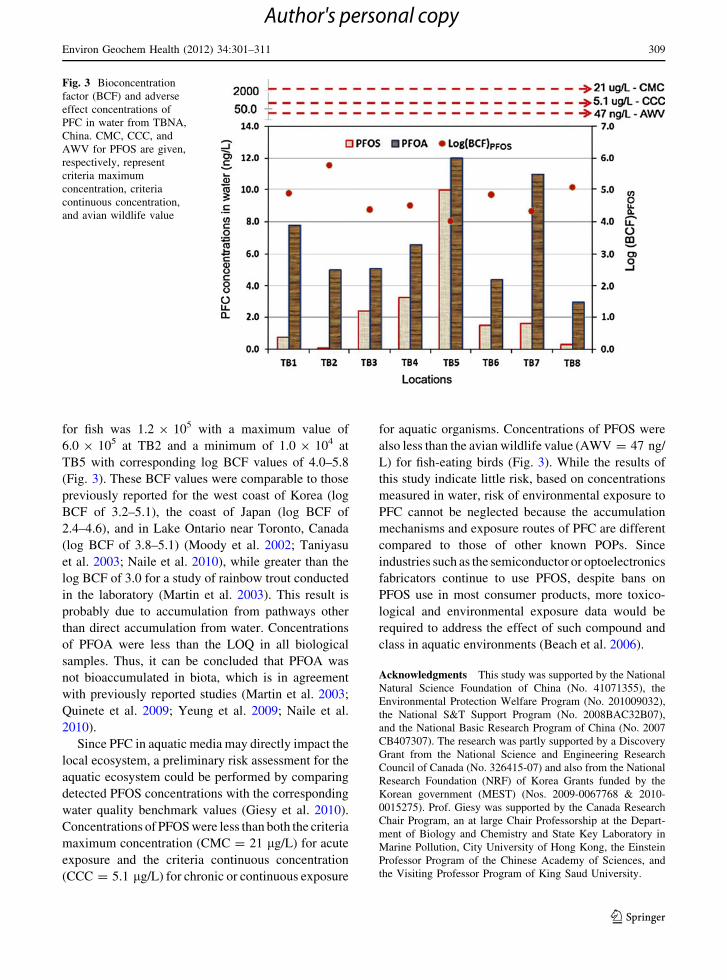
for fish was 1.2 9 105 with a maximum value of
6.0 9 105 at TB2 and a minimum of 1.0 9 104 at
TB5 with corresponding log BCF values of 4.0–5.8
(Fig. 3). These BCF values were comparable to those
previously reported for the west coast of Korea (log
BCF of 3.2–5.1), the coast of Japan (log BCF of
2.4–4.6), and in Lake Ontario near Toronto, Canada
(log BCF of 3.8–5.1) (Moody et al. 2002; Taniyasu
et al. 2003; Naile et al. 2010), while greater than the
log BCF of 3.0 for a study of rainbow trout conducted
in the laboratory (Martin et al. 2003). This result is
probably due to accumulation from pathways other
than direct accumulation from water. Concentrations
of PFOA were less than the LOQ in all biological
samples. Thus, it can be concluded that PFOA was
not bioaccumulated in biota, which is in agreement
with previously reported studies (Martin et al. 2003;
Quinete et al. 2009; Yeung et al. 2009; Naile et al.
2010).
Since PFC in aquatic media may directly impact the
local ecosystem, a preliminary risk assessment for the
aquatic ecosystem could be performed by comparing
detected PFOS concentrations with the corresponding
water quality benchmark values (Giesy et al. 2010).
Concentrations of PFOS were less than both the criteria
maximum concentration (CMC = 21 lg/L) for acute
exposure and the criteria continuous concentration
(CCC = 5.1 lg/L) for chronic or continuous exposure
for aquatic organisms. Concentrations of PFOS were
also less than the avian wildlife value (AWV = 47 ng/
L) for fish-eating birds (Fig. 3). While the results of
this study indicate little risk, based on concentrations
measured in water, risk of environmental exposure to
PFC cannot be neglected because the accumulation
mechanisms and exposure routes of PFC are different
compared to those of other known POPs. Since
industries such as the semiconductor or optoelectronics
fabricators continue to use PFOS, despite bans on
PFOS use in most consumer products, more toxico-
logical and environmental exposure data would be
required to address the effect of such compound and
class in aquatic environments (Beach et al. 2006).
Acknowledgments This study was supported by the National
Natural Science Foundation of China (No. 41071355), the
Environmental Protection Welfare Program (No. 201009032),
the National S&T Support Program (No. 2008BAC32B07),
and the National Basic Research Program of China (No. 2007
CB407307). The research was partly supported by a Discovery
Grant from the National Science and Engineering Research
Council of Canada (No. 326415-07) and also from the National
Research Foundation (NRF) of Korea Grants funded by the
Korean government (MEST) (Nos. 2009-0067768 & 2010-
0015275). Prof. Giesy was supported by the Canada Research
Chair Program, an at large Chair Professorship at the Depart-
ment of Biology and Chemistry and State Key Laboratory in
Marine Pollution, City University of Hong Kong, the Einstein
Professor Program of the Chinese Academy of Sciences, and
the Visiting Professor Program of King Saud University.
Fig. 3 Bioconcentration
factor (BCF) and adverse
effect concentrations of
PFC in water from TBNA,
China. CMC, CCC, and
AWV for PFOS are given,
respectively, represent
criteria maximum
concentration, criteria
continuous concentration,
and avian wildlife value
Environ Geochem Health (2012) 34:301–311 309
123
Author's personal copy
References
Ahrens, L., Felizeter, S., & Ebinghaus, R. (2009). Spatial
distribution of polyfluoroalkyl compounds in seawater of
the German Bight. Chemosphere, 76, 179–184.
Bao, J., Jin, Y. H., Liu, W., Ran, X. R., & Zhang, Z. X. (2009).
Perfluorinated compounds in sediments from the Daliao
River system of northeast China. Chemosphere, 77, 652–
657.
Bao, J., Liu, W., Liu, L., Jin, Y. H., Ran, X. R., & Zhang, Z. X.
(2010). Perfluorinated compounds in urban river sedi-
ments from Guangzhou and Shanghai of China. Chemo-sphere, 80, 123–130.
Beach, S. A., Newsted, J. L., Coady, K., & Giesy, J. P. (2006).
Ecotoxicological evaluation of perfluorooctane sulfonate
(PFOS). Reviews of Environmental Contamination andToxicology, 186, 133–174.
Becker, A. M., Gerstmann, S., & Frank, H. (2010). Perflu-
orooctanoic acid and perfluorooctane sulfonate in two fish
species collected from the roter main river, Bayreuth,
Germany. Bulletin of Environmental Contamination andToxicology, 84, 132–135.
Conder, J. M., Hoke, R. A., De Wolf, W., Russell, M. H., &
Buck, R. C. (2008). Are PFCAs bioaccumulative? a crit-
ical review and comparison with regulatory lipophilic
compounds. Environmental Science and Technology, 42,
995–1003.
Fair, P. A., Adams, J., Mitchum, G., Hulsey, T. C., Reif, J. S.,
Houde, M., et al. (2010). Contaminant blubber burdens in
Atlantic bottlenose dolphins (Tursiops truncatus) from
two southeastern US estuarine areas: Concentrations and
patterns of PCBs, pesticides, PBDEs, PFCs, and PAHs.
Science of the Total Environment, 408, 1577–1597.
Fatihah, S., Pramanik, B. K., & Shahrom, M. Z. (2009).
Contamination, bioaccumulation and toxic effects of
perfluorinated chemicals (PFCs) in the water environ-
ment: A review paper. Water Science and Technology, 60,
1533–1544.
Fujii, S., Polprasert, C., Tanaka, S., Lien, N. P. H., & Qiu, Y.
(2007). New POPs in the water environment: Distribution,
bioaccumulation and treatment of perfluorinated com-
pounds—A review paper. Journal of Water Supply:Research and Technology-AQUA, 56, 313–326.
Giesy, J. P., & Kannan, K. (2001). Global distribution of
perfluorooctane sulfonate in wildlife. EnvironmentalScience and Technology, 35, 1339–1342.
Giesy, J. P., & Kannan, K. (2002). Perfluorochemical surfac-
tants in the environment. Environmental Science andTechnology, 36, 146A–152A.
Giesy, J. P., Naile, J. E., Khim, J. S., Jones, P. D., & Newsted,
J. L. (2010). Aquatic toxicology of perfluorinated chem-
icals. Reviews of Environmental Contamination andToxicology, 202, 1–52.
Gulkowska, A., Jiang, Q. T., So, M. K., Taniyasu, S., Lam, P.
K. S., & Yamashita, N. (2006). Persistent perfluorinated
acids in seafood collected from two cities of China.
Environmental Science and Technology, 40, 3736–3741.
Hansen, K. J., Johnson, H. O., Eldridge, J. S., Butenhoff, J. L.,
& Dick, L. A. (2002). Quantitative characterization of
trace levels of PFOS and PFOA in the Tennessee River.
Environmental Science and Technology, 36, 1681–1685.
Higgins, C. P., & Luthy, R. G. (2006). Sorption of perfluori-
nated surfactants on sediments. Environmental Scienceand Technology, 40, 7251–7256.
Houde, M., Martin, J. W., Letcher, R. J., Solomon, K. R., &
Muir, D. C. G. (2006). Biological monitoring of poly-
fluoroalkyl substances: A review. Environmental Scienceand Technology, 40, 3463–3473.
Jiao, W., Lu, Y., Li, J., Han, J., Wang, T., Luo, W., et al.
(2009). Identification of sources of elevated concentra-
tions of polycyclic aromatic hydrocarbons in an industrial
area in Tianjin, China. Environmental Monitoring andAssessment, 158, 581–592.
Ju, X. D., Jin, Y. H., Sasaki, K., & Saito, N. (2008). Perfluo-
rinated surfactants in surface, subsurface water and
microlayer from Dalian Coastal waters in China. Envi-ronmental Science and Technology, 42, 3538–3542.
Kim, S. K., Kho, Y. L., Shoeib, M., Kim, K. S., Kim, K. R.,
Park, J. E., et al. (2011). Occurrence of perfluorooctanoate
and perfluorooctanesulfonate in the Korean water system:
Implication to water intake exposure. EnvironmentPollution, 159, 1167–1173.
Kissa, E. (2001). Fluorinated surfactants and repellents.
New York: Marcel Decker.
Kunacheva, C., Boontanon, S. K., Fujii, S., Tanaka, S.,
Musirat, C., Artsalee, C., et al. (2009). Contamination of
perfluorinated compounds (PFCs) in Chao Phraya River
and Bangpakong River, Thailand. Water Science andTechnology, 60, 975–982.
Kwadijk, C. J. A. F., Korytar, P., & Koelmans, A. A. (2010).
Distribution of perfluorinated compounds in aquatic sys-
tems in the Netherlands. Environmental Science andTechnology, 44, 3746–3751.
Lein, N. P. H., Fujii, S., Tanaka, S., Nozoe, M., & Tanaka,
H. (2008). Contamination of perfluorooctane sulfonate
(PFOS) and perfluorooctanoate (PFOA) in surface water
of the Yodo River basin (Japan). Desalination, 226,
338–347.
Lin, A. Y. C., Panchangam, S. C., & Ciou, P. S. (2010). High
levels of perfluorochemicals in Taiwan’s wastewater
treatment plants and downstream rivers pose great risk to
local aquatic ecosystems. Chemosphere, 80, 1167–1174.
Martin, J. W., Mabury, S. A., Solomon, K. R., & Muir, D. C.
(2003). Bioconcentration and tissue distribution of per-
fluorinated acids in rainbow trout (Oncorhynchus mykiss).
Environmental Toxicology and Chemistry, 22, 196–204.
Melissa, M. S., Douglas, F. B., & Jennifer, A. F. (2003).
Fluorinated alkyl surfactants. Environmental Engineeringand Science, 20, 487–501.
Moody, C. A., Martin, J. W., Kwan, W. C., Muir, D. C., & Mabury,
S. A. (2002). Monitoring perfluorinated surfactants in biota
and surface water samples following an accidental release of
fire-fighting foam into Etobicoke Creek. EnvironmentalScience and Technology, 36, 545–551.
Naile, J. E., Khim, J. S., Wang, T. Y., Chen, C. L., Luo, W.,
Kwon, B. O., et al. (2010). Perfluorinated compounds in
water, sediment, soil and biota from estuarine and coastal
areas of Korea. Environment Pollution, 158, 1237–1244.
310 Environ Geochem Health (2012) 34:301–311
123
Author's personal copy
Nakata, H., Kannan, K., Nasu, T., Cho, H. S., Sinclair, E., &
Takemura, A. (2006). Perfluorinated contaminants in
sediments and aquatic organisms collected from shallow
Water and tidal flat areas of the Ariake Sea, Japan:
Environmental fate of perfluorooctane sulfonate in aquatic
ecosystems. Environmental Science and Technology, 40,
4916–4921.
Pan, Y. Y., Shi, Y. L., Wang, Y. W., Cai, Y. Q., & Jiang, G. B.
(2010). Investigation of perfluorinated compounds (PFCs)
in mollusks from coastal waters in the Bohai Sea of China.
Journal of Environmental Monitoring, 12, 508–513.
Pan, G., & You, C. (2010). Sediment-water distribution of
perfluorooctane sulfonate (PFOS) in Yangtze River
Estuary. Environmental Pollution, 158, 1363–1367.
Quinete, N., Wu, Q., Zhang, T., Yun, S. H., Moreira, I., &
Kannan, K. (2009). Specific profiles of perfluorinated
compounds in surface and drinking waters and accumu-
lation in mussels, fish, and dolphins from southeastern
Brazil. Chemosphere, 77, 863–869.
Rayne, S., & Forest, K. (2009). Perfluoroalkyl sulfonic and
carboxylic acids: A critical review of physicochemical
properties, levels and patterns in waters and wastewaters,
and treatment methods. Journal of Environmental Scienceand Health, Part A, 44, 1145–1199.
Rostkowski, P., Taniyasu, S., Yamashita, N., Falandysz, J. J.,
Zegarowski, L., Chojnacka, A., et al. (2009). Survey of
perfluorinated compounds (PFCs) in surface waters of
Poland. Journal of Environmental Science and Health,Part A, 44, 1518–1527.
Rostkowski, P., Yamashita, N., So, I. M. K., Taniyasu, S.,
Lam, P. K. S., Falandysz, J., et al. (2006). Perfluorinated
compounds in streams of the Shihwa industrial zone and
Lake Shihwa, South Korea. Environmental Toxicologyand Chemistry, 25, 2374–2380.
Saito, N., Harada, K., Inoue, K., Sasaki, K., Yoshinaga, T., &
Koizumi, A. (2004). Perfluorooctanoate and Perfluorooc-
tane Sulfonate Concentrations in Surface Water in Japan.
Journal of Occupation and Health, 46, 49–59.
Sakurai, T., Serizawa, S., Isobe, T., Kobayashi, J., Kodama, K.,
Kume, G., et al. (2010). Spatial, phase, and temporal
distributions of Perfluorooctane sulfonate (PFOS) and
Perfluorooctanoate (PFOA) in Tokyo Bay, Japan. Envi-ronmental Science and Technology, 44, 4110–4115.
Schuetze, A., Heberer, T., Effkemann, S., & Juergensen, S.
(2010). Occurrence and assessment of perfluorinated
chemicals in wild fish from Northern Germany. Chemo-sphere, 78, 647–652.
Senthilkumar, K., Ohi, E., Sajwan, K., Takasuga, T., & Kan-
nan, K. (2007). Perfluorinated compounds in river water,
river sediment, market fish, and wildlife samples from
Japan. Bulletin of Environmental Contamination andToxicology, 79, 427–431.
Shi, R. G., Lv, J. A., Cai, Y. M., Liu, Y., Wang, Z. H., Feng, J.
M., et al. (2010). Levels, spatial distribution and possible
sources of heavy metals contamination of suburban soils
in Tianjin, China. Bulletin of Environmental Contamina-tion and Toxicology, 85, 287–290.
Simcik, M. F., & Dorweiler, K. J. (2005). Ratio of perfluoro-
chemical concentrations as a tracer of atmospheric
deposition to surface waters. Environmental Science andTechnology, 39, 8678–8683.
Sinclair, E., & Kannan, K. (2006). Mass loading and fate of
perfluoroalkyl surfactants in wastewater treatment plants.
Environmental Science and Technology, 40, 1408–1414.
Skutlarek, D., Exner, M., & Farber, H. (2006). Perfluorinated
surfactants in surface and drinking water. EnvironmentalScience and Pollution Research, 13, 299–307.
So, M. K., Miyake, Y., Yeung, W. Y., Ho, Y. M., Taniyasu, S.,
Rostkowski, P., et al. (2007). Perfluorinated compounds in
the Pearl River and Yangtze river of China. Chemosphere,68, 2085–2095.
So, M. K., Taniyasu, S., Yamashita, N., Giesy, J. P., Zheng, J.,
Fang, Z., et al. (2004). Perfluorinated compounds in
coastal waters of Hong Kong, South China, and Korea.
Environmental Science and Technology, 38, 4056–4063.
Taniyasu, S., Kannan, K., Horii, Y., Hanari, N., & Yamashita,
N. (2003). A survey of perfluorooctane sulfonate and
related perfluorinated organic compounds in water, fish,
birds, and humans from Japan. Environmental Scienceand Technology, 37, 2634–2639.
Wang, G., Lu, Y., Li, J., Wang, T., Han, J., Luo, W., et al.
(2009a). Regional differences and sources of organo-
chlorine pesticides in soils surrounding chemical indus-
trial parks. Environmental Monitoring and Assessment,152, 259–269.
Wang, T., Wang, Y. W., Liao, C. Y., Cai, Y. Q., & Jiang, G. B.
(2009b). Perspectives on the inclusion of Perfluorooctane
sulfonate into the stockholm convention on persistent
organic pollutants. Environmental Science and Technol-ogy, 43, 5171–5175.
Yeung, L. W. Y., Yamashita, N., Taniyasu, S., Lam, P. K. S.,
Sinha, R. K., Borole, D. V., et al. (2009). A survey of
perfluorinated compounds in surface water and biota
including dolphins from the Ganges River and in other
waterbodies in India. Chemosphere, 76, 55–62.
Zushi, Y., Tamada, M., Kanai, Y., & Masunaga, S. (2010).
Time trends of perfluorinated compounds from the sedi-
ment core of Tokyo Bay, Japan (1950 s–2004). Environ-mental Pollution, 158, 756–763.
Environ Geochem Health (2012) 34:301–311 311
123
Author's personal copy